INSTITUTIONAL EQUITY RESEARCH Page | 1 | PHILLIPCAPITAL INDIA RESEARCH Please see penultimate page for additional important disclosures. PhillipCapital (India) Private Limited. (“PHILLIPCAP”) is a foreign broker-dealer unregistered in the USA. PHILLIPCAP research is prepared by research analysts who are not registered in the USA. PHILLIPCAP research is distributed in the USA pursuant to Rule 15a-6 of the Securities Exchange Act of 1934 solely by Rosenblatt Securities Inc, an SEC registered and FINRA-member broker-dealer. Dabur India Ltd (DABUR IN) Defying all the odds INDIA | FMCG | Quarterly Update 19 July 2019 Top takeaways from 1QFY20 Dabur results were significantly ahead of consensus estimates, as it was able to navigate challenges of rural distress and liquidity related issues for trade channels, much better than its peers. Management highlighted its initiative of increased direct distribution reach, intensive focus on power brands (65-70% of revenue) and revamp of supply chain infrastructure led to such strong outperformance. Performance was broad-based across categories; however juices business continued to remain drag for fourth consecutive quarter. Recovery in International business (30% of sales) on back of strong growth in Turkey (41% CC), stabilization of Middle East business and increasing share of high margin Non-USA (c40% now) for Namaste basket further gave momentum. Ebitda growth (18.5% yoy) was far ahead of our expectations due to improved product mix (higher salience of Healthcare products), better geographical mix within International business and benefits of operating leverage kicking in Management sounded caution despite delivering c10% volume growth, as rural business (50% of sales) has started decelerating from June,2019 onwards owing to liquidity crunch, deficient rainfall and muted consumer sentiment. However, it reiterated its guidance of mid to high single digit volume growth and operating margin above 20% in FY20, which we believe is quite commendable in relative context given other CPG companies are struggling to achieve the same Segment takeaways Corrective action in place to revive Juices business: Given increased competition from milk based beverage manufacturers, Dabur has launched differentiated masala range (Mixed fruit and Aam Panna) and mixed berries variant. It plans to penetrate in rural areas using Rs 10 (Real Koolerz) range, as juice being more of urban oriented category. Oral care continues to smile: Market share gains (40bps), increasing preference towards natural products (15% growth in Dabur Red) led to double digit volume growth. Babool, which was struggling on account of launches made by competitors in access packs, has been relaunched on ayurvedic platform at disruptive price point (30/100 gm) Health supplements was an outlier - grew 20% on back of market share gains (c100bps) in glucose category. Glucose saw strong growth owing to trade related disruption for key competitor (Kraft Heinz sold to Zydus) and launch of Mango variant Hair care – Double digit growth across VAHO portfolio; however coconut oil disappointed due to increased competitive intensity from Marico. Almond hair oil grew handsomely due to 50% additional offer in Modern Trade New Power brands: Focus on Honitus (cough & cold) ; Pudin Hara (digestive) & Lal tail and will take other brand once each of the brand reach Rs 1 bn revenue potential Diversified portfolio makes it immune from any unknown: We believe Dabur’s diversified portfolio makes it fool-proof from any economic, regulatory and seasonality risks that other peers might have to tackle. Management under the guidance of Mr Mohit Malhotra is taking steps in right direction (Focus on power brands, NPD and increased distribution reach) to drive growth in long term. Reduction in competitive intensity from Patanjali further should support the cause. We maintain BUY with TP with of Rs 485 (45x Sept -21) vs 430 (40x Dec- 20 EPS). Key Risks to our call – 1) Discount-led competition by juice/ oral care players to gain market share and 2) any unfavorable factor could hurt growth of rural economy BUY (Maintain) CMP RS 421 TARGET RS 485 (15%) COMPANY DATA O/S SHARES (MN) : 1767 MARKET CAP (RSBN) : 744 MARKET CAP (USDBN) : 10.8 52 - WK HI/LO (RS) : 491/ 358 LIQUIDITY 3M (USDMN) : 14.9 PAR VALUE (RS) : 1 SHARE HOLDING PATTERN, % Jun 19 Mar 19 Dec 18 PROMOTERS : 67.9 67.9 67.9 FII / NRI : 18.3 18.2 18.2 FI / MF : 6.6 6.9 6.8 NON PRO : 1.8 1.7 1.8 PUBLIC & OTHERS : 5.4 5.4 5.4 KEY FINANCIALS Rs mn FY20E FY21E FY22E Net Sales 93,070 1,03,001 1,14,002 EBIDTA 19,331 21,949 24,713 Net Profit 15,562 17,903 20,181 EPS, Rs 8.8 10.1 11.4 PER, x 47.2 41.5 36.8 EV/EBIDTA, x 38.1 33.1 29.0 PBV, X 11.8 10.2 8.8 ROE, % 24.9 24.6 23.9 Debt/Equity (%) 13.1 11.4 9.8 Vishal Gutka, Research Analyst Preeyam Tolia, Research Associate (Rs mn) 1QFY20 1QFY19 Yoy % 4QFY19 qoq % PC yoy % Net Sales 22,733 20,807 9.3 21,282 6.8 6.2 EBITDA 4,576 3,861 18.5 4,572 0.1 5.4 PAT 3,831 3,292 16.4 4,458 (14.1) 2.6

Welcome message from author
This document is posted to help you gain knowledge. Please leave a comment to let me know what you think about it! Share it to your friends and learn new things together.
Transcript

INSTITUTIONAL EQUITY RESEARCH
Page | 1 | PHILLIPCAPITAL INDIA RESEARCH
Please see penultimate page for additional important disclosures. PhillipCapital (India) Private Limited. (“PHILLIPCAP”) is a foreign broker-dealer unregistered in the USA. PHILLIPCAP research is prepared by research analysts who are not registered in the USA. PHILLIPCAP research is distributed in the USA pursuant to Rule 15a-6 of the Securities Exchange Act of 1934 solely by Rosenblatt Securities Inc, an SEC registered and FINRA-member broker-dealer.
Dabur India Ltd (DABUR IN)
Defying all the odds
INDIA | FMCG | Quarterly Update
19 July 2019
Top takeaways from 1QFY20 Dabur results were significantly ahead of consensus estimates, as it was able to navigate
challenges of rural distress and liquidity related issues for trade channels, much better than its peers. Management highlighted its initiative of increased direct distribution reach, intensive focus on power brands (65-70% of revenue) and revamp of supply chain infrastructure led to such strong outperformance. Performance was broad-based across categories; however juices business continued to remain drag for fourth consecutive quarter. Recovery in International business (30% of sales) on back of strong growth in Turkey (41% CC), stabilization of Middle East business and increasing share of high margin Non-USA (c40% now) for Namaste basket further gave momentum.
Ebitda growth (18.5% yoy) was far ahead of our expectations due to improved product mix (higher salience of Healthcare products), better geographical mix within International business and benefits of operating leverage kicking in
Management sounded caution despite delivering c10% volume growth, as rural business (50% of sales) has started decelerating from June,2019 onwards owing to liquidity crunch, deficient rainfall and muted consumer sentiment. However, it reiterated its guidance of mid to high single digit volume growth and operating margin above 20% in FY20, which we believe is quite commendable in relative context given other CPG companies are struggling to achieve the same
Segment takeaways Corrective action in place to revive Juices business: Given increased competition from
milk based beverage manufacturers, Dabur has launched differentiated masala range (Mixed fruit and Aam Panna) and mixed berries variant. It plans to penetrate in rural areas using Rs 10 (Real Koolerz) range, as juice being more of urban oriented category.
Oral care continues to smile: Market share gains (40bps), increasing preference towards natural products (15% growth in Dabur Red) led to double digit volume growth. Babool, which was struggling on account of launches made by competitors in access packs, has been relaunched on ayurvedic platform at disruptive price point (30/100 gm)
Health supplements was an outlier - grew 20% on back of market share gains (c100bps) in glucose category. Glucose saw strong growth owing to trade related disruption for key competitor (Kraft Heinz sold to Zydus) and launch of Mango variant
Hair care – Double digit growth across VAHO portfolio; however coconut oil disappointed due to increased competitive intensity from Marico. Almond hair oil grew handsomely due to 50% additional offer in Modern Trade
New Power brands: Focus on Honitus (cough & cold) ; Pudin Hara (digestive) & Lal tail and will take other brand once each of the brand reach Rs 1 bn revenue potential
Diversified portfolio makes it immune from any unknown: We believe Dabur’s diversified portfolio makes it fool-proof from any economic, regulatory and seasonality risks that other peers might have to tackle. Management under the guidance of Mr Mohit Malhotra is taking steps in right direction (Focus on power brands, NPD and increased distribution reach) to drive growth in long term. Reduction in competitive intensity from Patanjali further should support the cause. We maintain BUY with TP with of Rs 485 (45x Sept -21) vs 430 (40x Dec-20 EPS). Key Risks to our call – 1) Discount-led competition by juice/ oral care players to gain market share and 2) any unfavorable factor could hurt growth of rural economy
BUY (Maintain) CMP RS 421 TARGET RS 485 (15%) COMPANY DATA
O/S SHARES (MN) : 1767
MARKET CAP (RSBN) : 744
MARKET CAP (USDBN) : 10.8
52 - WK HI/LO (RS) : 491/ 358
LIQUIDITY 3M (USDMN) : 14.9
PAR VALUE (RS) : 1
SHARE HOLDING PATTERN, %
Jun 19 Mar 19 Dec 18
PROMOTERS : 67.9 67.9 67.9
FII / NRI : 18.3 18.2 18.2
FI / MF : 6.6 6.9 6.8
NON PRO : 1.8 1.7 1.8
PUBLIC & OTHERS : 5.4 5.4 5.4
KEY FINANCIALS
Rs mn FY20E FY21E FY22E
Net Sales 93,070 1,03,001 1,14,002
EBIDTA 19,331 21,949 24,713
Net Profit 15,562 17,903 20,181
EPS, Rs 8.8 10.1 11.4
PER, x 47.2 41.5 36.8
EV/EBIDTA, x 38.1 33.1 29.0
PBV, X 11.8 10.2 8.8
ROE, % 24.9 24.6 23.9
Debt/Equity (%) 13.1 11.4 9.8
Vishal Gutka, Research Analyst Preeyam Tolia, Research Associate
(Rs mn) 1QFY20 1QFY19 Yoy %
4QFY19 qoq %
PC yoy %
Net Sales 22,733 20,807 9.3 21,282 6.8 6.2
EBITDA 4,576 3,861 18.5 4,572 0.1 5.4
PAT 3,831 3,292 16.4 4,458 (14.1) 2.6
Page | 2 | PHILLIPCAPITAL INDIA RESEARCH
DABUR INDIA LTD QUARTERLY UPDATE
Financial Snapshot
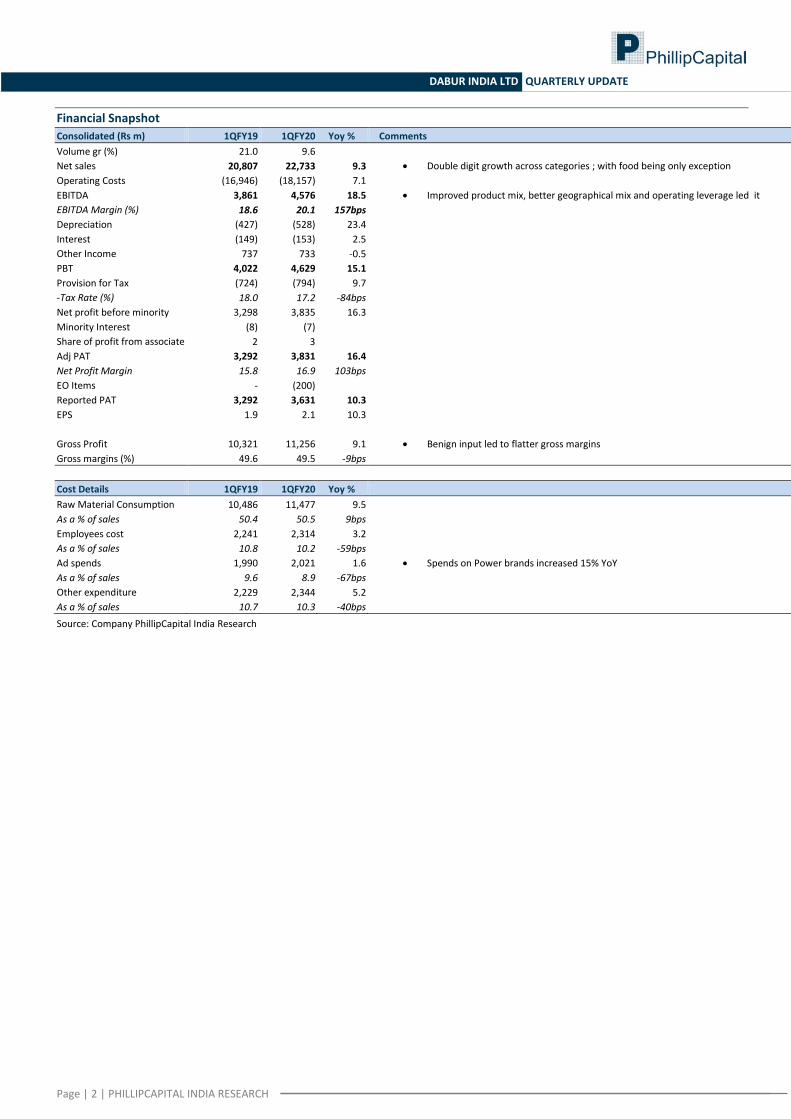
Consolidated (Rs m) 1QFY19 1QFY20 Yoy % Comments
Volume gr (%) 21.0 9.6
Net sales 20,807 22,733 9.3 Double digit growth across categories ; with food being only exception
Operating Costs (16,946) (18,157) 7.1
EBITDA 3,861 4,576 18.5 Improved product mix, better geographical mix and operating leverage led it
EBITDA Margin (%) 18.6 20.1 157bps
Depreciation (427) (528) 23.4
Interest (149) (153) 2.5
Other Income 737 733 -0.5
PBT 4,022 4,629 15.1
Provision for Tax (724) (794) 9.7
-Tax Rate (%) 18.0 17.2 -84bps
Net profit before minority 3,298 3,835 16.3
Minority Interest (8) (7)
Share of profit from associate 2 3
Adj PAT 3,292 3,831 16.4
Net Profit Margin 15.8 16.9 103bps
EO Items - (200)
Reported PAT 3,292 3,631 10.3
EPS 1.9 2.1 10.3
Gross Profit 10,321 11,256 9.1 Benign input led to flatter gross margins
Gross margins (%) 49.6 49.5 -9bps
Cost Details 1QFY19 1QFY20 Yoy %
Raw Material Consumption 10,486 11,477 9.5
As a % of sales 50.4 50.5 9bps
Employees cost 2,241 2,314 3.2
As a % of sales 10.8 10.2 -59bps
Ad spends 1,990 2,021 1.6 Spends on Power brands increased 15% YoY
As a % of sales 9.6 8.9 -67bps
Other expenditure 2,229 2,344 5.2
As a % of sales 10.7 10.3 -40bps
Source: Company PhillipCapital India Research
Page | 3 | PHILLIPCAPITAL INDIA RESEARCH
DABUR INDIA LTD QUARTERLY UPDATE
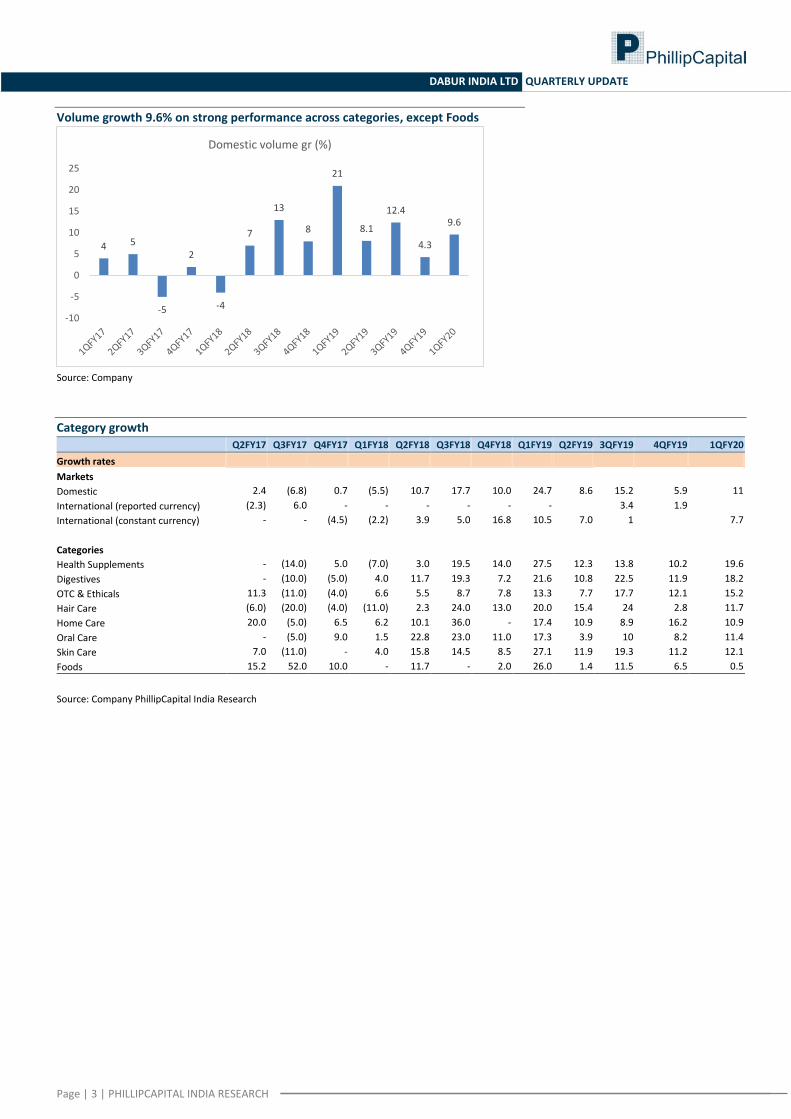
Volume growth 9.6% on strong performance across categories, except Foods
Source: Company
Category growth
Q2FY17 Q3FY17 Q4FY17 Q1FY18 Q2FY18 Q3FY18 Q4FY18 Q1FY19 Q2FY19 3QFY19 4QFY19 1QFY20
Growth rates
Markets
Domestic 2.4 (6.8) 0.7 (5.5) 10.7 17.7 10.0 24.7 8.6 15.2 5.9 11
International (reported currency) (2.3) 6.0 - - - - - - 3.4 1.9
International (constant currency) - - (4.5) (2.2) 3.9 5.0 16.8 10.5 7.0 1
7.7
Categories
Health Supplements - (14.0) 5.0 (7.0) 3.0 19.5 14.0 27.5 12.3 13.8 10.2 19.6
Digestives - (10.0) (5.0) 4.0 11.7 19.3 7.2 21.6 10.8 22.5 11.9 18.2
OTC & Ethicals 11.3 (11.0) (4.0) 6.6 5.5 8.7 7.8 13.3 7.7 17.7 12.1 15.2
Hair Care (6.0) (20.0) (4.0) (11.0) 2.3 24.0 13.0 20.0 15.4 24 2.8 11.7
Home Care 20.0 (5.0) 6.5 6.2 10.1 36.0 - 17.4 10.9 8.9 16.2 10.9
Oral Care - (5.0) 9.0 1.5 22.8 23.0 11.0 17.3 3.9 10 8.2 11.4
Skin Care 7.0 (11.0) - 4.0 15.8 14.5 8.5 27.1 11.9 19.3 11.2 12.1
Foods 15.2 52.0 10.0 - 11.7 - 2.0 26.0 1.4 11.5 6.5 0.5
Source: Company PhillipCapital India Research
4 5
-5
2
-4
7
13
8
21
8.1
12.4
4.3
9.6
-10
-5
0
5
10
15
20
25
Domestic volume gr (%)
Page | 4 | PHILLIPCAPITAL INDIA RESEARCH
DABUR INDIA LTD QUARTERLY UPDATE
Conference Call takeaways
Rural growth (up 13% yoy) continues to grow faster than urban growth, however its growth is tapering down as liquidity issues have started to surface. Despite weak rural growth outlook, management has highlighted that strategy for to drive penetration (through LUP) remains intact.
Wholesale channel (c.27%) is shrinking overall, particularly in urban and North Indian wholesale. However, trade wholesale is suffering and consumer wholesale has recovered and is growing at high single digit (8% now).
In order to reduce the dependence on wholesale channel, Dabur has stepped up its direct reach in Q1. Its direct reach stood at 1.14 million outlets (up 40,000 YoY) and plans to expand to 1.2 million outlets in FY20.
Further to strengthen its rural reach it added 4,000 villages in Q1 to 48,000 villages and plans to reach 55,000 villages in FY20.
North & west India are most impacted due to liquidity related challenges
RM basket is expected to remain benign in FY20.
Capex for FY20 stands at Rs 2.5-3.0 bn
Distributor consolidation – it plans to consolidate distributors in urban areas, as some of them face viability issue due to increased operating costs.
Domestic Business
Health care
Health Supplements grew segment by 19.6% yoy led by double digit growth in Glucose and on back of market share gains from Kraft Heinz.
Digestives grew 18% on back of strong performance of Hajmola tablets and Pudin Hara. Hajmola Chat Cola is gaining traction sequentially.
In Honey it has reduced promotions of extra 30% grammage to 20% and has also taken price hikes. Also in Ethicals, it has taken 6-7% price hikes in Q1.
Home and Personal care
Oral care grew by 11.4% yoy driven by market share gains (up 40 bps to 15.3%) and strong growth in Red Toothpaste (up 15% yoy).
It expects re-launch of Babool at Rs 30 in Q1 will helped regained the oral care growth. To further strengthen the Babool portfolio it plans to launch differentiated communication strategy based on Ayurveda proposition. Babool has been promoted as price warrior in order to compete with brands on the economy side
After successful re-launch Babool it will revive Meswak and plans to relaunch by end of H1FY20. It has also re-organized its team for the same
Current Oral care market stands at Rs 80bn growing at 5-6% annually, while naturals growing at CAGR 18% and contributes 25-30% of the overall Oral care market.
South India has been the stronghold for Dabur Red ; but recently it has intensified its efforts to garner market share in North India
Foods
Beverages growth tapered down to 1% yoy primarily on account of increased competition from prolonged winter, dairy companies and carbohydrate drink players (growing 10% yoy) as customers customer shift to more affordable option.
In order to stop down trading and protect market share (currently 56%), it launched Rs 10 SKU Real Koolerz Mango to drive affordability and rural penetration.
Page | 5 | PHILLIPCAPITAL INDIA RESEARCH
DABUR INDIA LTD QUARTERLY UPDATE
Food safety & standards (Labelling & Display) regulations, 2019 –70-75% of the foods and packaging industry will come under new law if it is implemented, in true order
Ethicals business
2100 personnel were added in Ethicals team. Doctor’s reach has increased from 27,000 to 40,000
Classical Ethicals (50% of portfolio) has been growing @ 10% on back of Medical Representative addition
Branded Ethicals (25% of portfolio) has seen growth of 35-40%.
Tonics growing @20-25% International business
International business seeing signs of stabilization in Q1. MENA (c.50%) was flat after negative growth in the past few years driven by trade schemes and consumer sentiments picking up.
To further strengthen the international business, management is focusing on stabilizing the business through consolidation and growing existing categories and does not plan to enter any new category in FY20.
Expects international margins to remain stable in FY20 & incremental gains will be invested behind new launches
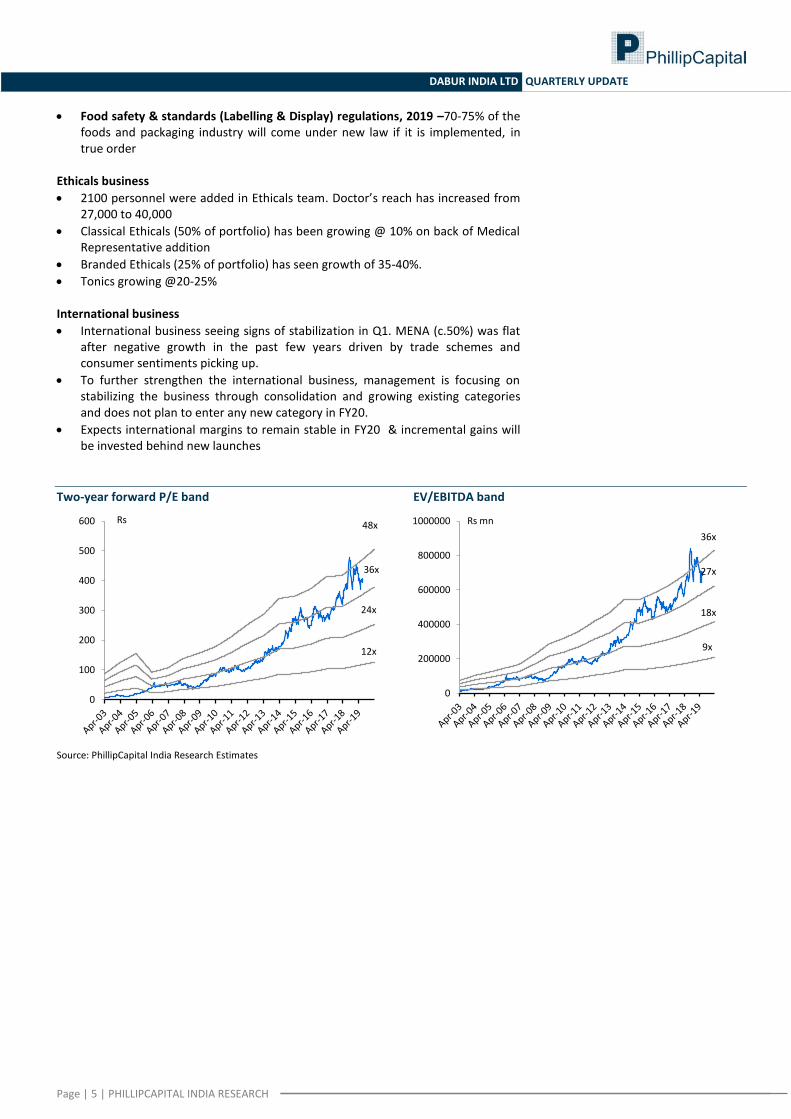
Two-year forward P/E band EV/EBITDA band
Source: PhillipCapital India Research Estimates
12x
24x
36x
48x
0
100
200
300
400
500
600 Rs
9x
18x
27x
36x
0
200000
400000
600000
800000
1000000 Rs mn

Page | 6 | PHILLIPCAPITAL INDIA RESEARCH
DABUR INDIA LTD QUARTERLY UPDATE
Financials
Income Statement Y/E Mar, Rs mn FY19E FY20E FY21E FY22E
Net sales 85,331 93,070 1,03,001 1,14,002
Growth, % 10.1 9.1 10.7 10.7
Other income 0 0 0 0
Total income -43,090 -46,538 -50,959 -56,054
Raw material expenses -9,379 -10,129 -11,142 -12,257
Other Operating expenses -15,466 -17,073 -18,951 -20,978
EBITDA (Core) 17,396 19,331 21,949 24,713
Growth, % 7.6 11.1 13.5 12.6
Margin, % 20.4 20.8 21.3 21.7
Depreciation -1,769 -2,266 -2,473 -2,679
EBIT 15,627 17,064 19,476 22,034
Growth, % 7.4 9.2 14.1 13.1
Margin, % 18.3 18.3 18.9 19.3
Interest paid -596 -620 -682 -750
Other income 2,962 3,258 3,584 3,942
Other Non-Operating Income -753 -200 0 0
Pre-tax profit 17,249 19,503 22,378 25,226
Tax provided -2,786 -3,941 -4,476 -5,045
Profit after tax 14,463 15,562 17,903 20,181
Net Profit 14,463 15,562 17,903 20,181
Growth, % 10.9 3.6 13.6 12.7
Net Profit (adjusted) 14,463 15,562 17,903 20,181
Unadj. shares (m) 1,766 1,766 1,766 1,766
Wtd avg shares (m) 1,766 1,766 1,766 1,766
Balance Sheet Y/E Mar, Rs mn FY19E FY20E FY21E FY22E
Cash & bank 1,526 8,923 17,477 28,450
Marketable securities at cost 7,134 7,134 7,134 7,134
Debtors 7,776 8,481 9,386 10,389
Inventory 12,858 14,024 15,521 17,178
Loans & advances 349 349 349 349
Total current assets 33,875 43,143 54,098 67,732
Investments 30,918 30,918 30,918 30,918
Gross fixed assets 32,958 35,708 38,458 41,208
Less: Depreciation -11,946 -14,212 -16,684 -19,363
Add: Capital WIP 415 415 415 415
Net fixed assets 21,427 21,911 22,188 22,260
Total assets 87,224 96,977 1,08,209 1,21,914
Current liabilities 25,773 27,181 28,989 30,991
Provision 565 565 565 565
Total current liabilities 26,338 27,746 29,554 31,556
Non-current liabilities 4,776 4,776 4,776 4,776
Total liabilities 31,114 32,523 34,330 36,333
Paid-up capital 1,762 1,762 1,762 1,762
Reserves & surplus 53,340 61,483 70,908 82,611
Shareholders’ equity 55,366 63,510 72,934 84,637
Total equity & liabilities 86,481 96,033 1,07,265 1,20,970
Source: Company, PhillipCapital India Research Estimates
Cash Flow Y/E Mar, Rs mn FY19E FY20E FY21E FY22E
Pre-tax profit 17,249 19,503 22,378 25,226 Depreciation 1,769 2,266 2,473 2,679 Chg in working capital 417 -463 -594 -658 Total tax paid -2,786 -3,941 -4,476 -5,045 Other operating activities 0 0 0 0 Cash flow from operating activities 16,648 17,366 19,781 22,202 Capital expenditure -2,500 -2,750 -2,750 -2,750 Chg in investments 0 0 0 0 Chg in marketable securities 0 0 0 0 Other investing activities 0 0 0 0 Cash flow from investing activities -2,490 -2,750 -2,750 -2,750 Free cash flow 14,158 14,616 17,031 19,452 Equity raised/(repaid) 0 0 0 0 Debt raised/(repaid) 0 0 0 0 Dividend (incl. tax) -5,829 -7,418 -8,478 -8,478 Other financing activities 0 0 0 0 Cash flow from financing activities -5,829 -7,418 -8,478 -8,478 Net chg in cash 8,329 7,197 8,553 10,974
Valuation Ratios
FY19E FY20E FY21E FY22E
Per Share data EPS (INR) 8.2 8.8 10.1 11.4
Growth, % 10.9 3.6 13.6 12.7 Book NAV/share (INR) 31.2 35.8 41.1 47.8 FDEPS (INR) 8.6 8.9 10.1 11.4 CEPS (INR) 10.0 10.3 11.5 12.9 CFPS (INR) 7.7 8.0 9.2 10.3 DPS (INR) 2.8 3.5 4.0 4.0 Return ratios
Return on assets (%) 17.3 17.6 18.1 18.2 Return on equity (%) 27.6 24.9 24.6 23.9 Return on capital employed (%) 24.4 25.0 25.3 24.9 Turnover ratios
Asset turnover (x) 3.4 3.6 3.8 4.1 Sales/Total assets (x) 1.0 1.0 1.0 1.0 Sales/Net FA (x) 4.1 4.3 4.7 5.1 Working capital/Sales (x) (0.0) (0.0) 0.0 0.0 Fixed capital/Sales (x) - - - - Working capital days (2.4) (0.4) 1.8 3.7 Liquidity ratios Current ratio (x) 1.3 1.6 1.9 2.2 Quick ratio (x) 0.8 1.1 1.3 1.6 Interest cover (x) 26.2 27.5 28.6 29.4 Dividend cover (x) Total debt/Equity (%) 15.0 13.1 11.4 9.8 Net debt/Equity (%) 12.3 (1.0) (12.6) (23.9) Valuation PER (x) 48.9 47.2 41.5 36.8 Price/Book (x) 13.5 11.8 10.2 8.8 Yield (%) EV/Net sales (x) 8.7 7.9 7.1 6.3 EV/EBITDA (x) 42.7 38.1 33.1 29.0 EV/EBIT (x) 47.6 43.1 37.3 32.5
Page | 7 | PHILLIPCAPITAL INDIA RESEARCH
DABUR INDIA LTD QUARTERLY UPDATE
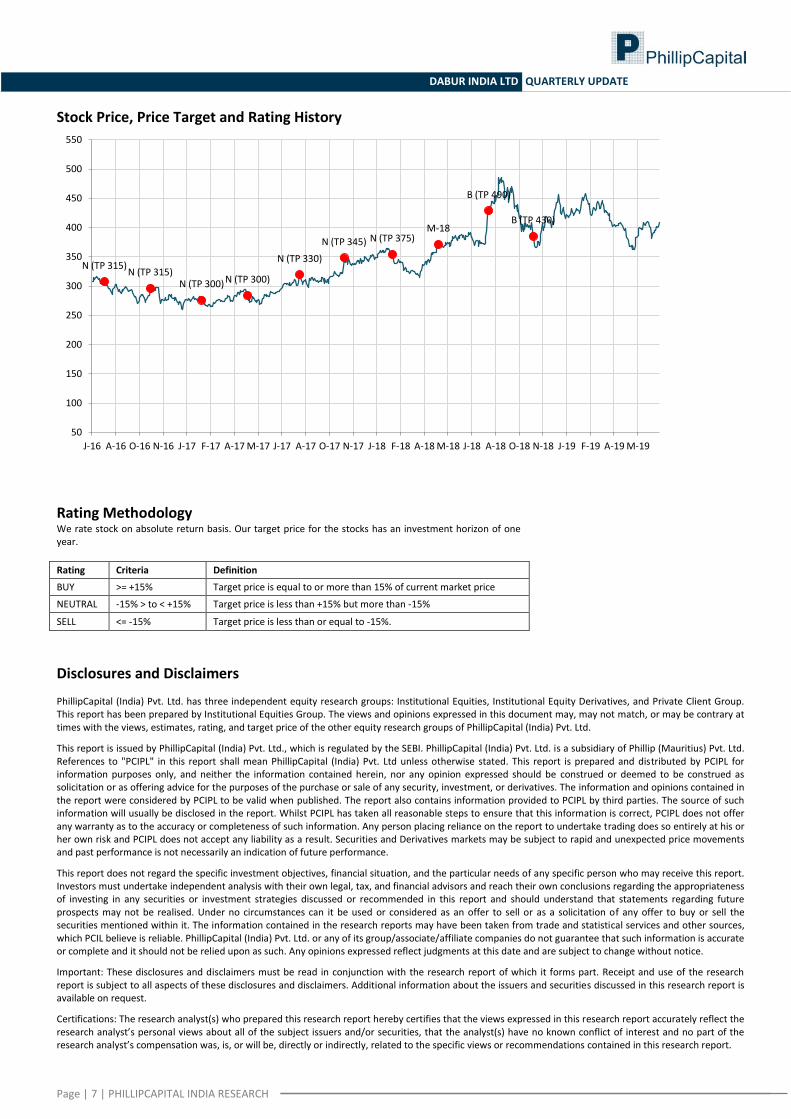
Stock Price, Price Target and Rating History
Rating Methodology We rate stock on absolute return basis. Our target price for the stocks has an investment horizon of one year.
Rating Criteria Definition
BUY >= +15% Target price is equal to or more than 15% of current market price
NEUTRAL -15% > to < +15% Target price is less than +15% but more than -15%
SELL <= -15% Target price is less than or equal to -15%.
Disclosures and Disclaimers PhillipCapital (India) Pvt. Ltd. has three independent equity research groups: Institutional Equities, Institutional Equity Derivatives, and Private Client Group. This report has been prepared by Institutional Equities Group. The views and opinions expressed in this document may, may not match, or may be contrary at times with the views, estimates, rating, and target price of the other equity research groups of PhillipCapital (India) Pvt. Ltd.
This report is issued by PhillipCapital (India) Pvt. Ltd., which is regulated by the SEBI. PhillipCapital (India) Pvt. Ltd. is a subsidiary of Phillip (Mauritius) Pvt. Ltd. References to "PCIPL" in this report shall mean PhillipCapital (India) Pvt. Ltd unless otherwise stated. This report is prepared and distributed by PCIPL for information purposes only, and neither the information contained herein, nor any opinion expressed should be construed or deemed to be construed as solicitation or as offering advice for the purposes of the purchase or sale of any security, investment, or derivatives. The information and opinions contained in the report were considered by PCIPL to be valid when published. The report also contains information provided to PCIPL by third parties. The source of such information will usually be disclosed in the report. Whilst PCIPL has taken all reasonable steps to ensure that this information is correct, PCIPL does not offer any warranty as to the accuracy or completeness of such information. Any person placing reliance on the report to undertake trading does so entirely at his or her own risk and PCIPL does not accept any liability as a result. Securities and Derivatives markets may be subject to rapid and unexpected price movements and past performance is not necessarily an indication of future performance.
This report does not regard the specific investment objectives, financial situation, and the particular needs of any specific person who may receive this report. Investors must undertake independent analysis with their own legal, tax, and financial advisors and reach their own conclusions regarding the appropriateness of investing in any securities or investment strategies discussed or recommended in this report and should understand that statements regarding future prospects may not be realised. Under no circumstances can it be used or considered as an offer to sell or as a solicitation of any offer to buy or sell the securities mentioned within it. The information contained in the research reports may have been taken from trade and statistical services and other sources, which PCIL believe is reliable. PhillipCapital (India) Pvt. Ltd. or any of its group/associate/affiliate companies do not guarantee that such information is accurate or complete and it should not be relied upon as such. Any opinions expressed reflect judgments at this date and are subject to change without notice.
Important: These disclosures and disclaimers must be read in conjunction with the research report of which it forms part. Receipt and use of the research report is subject to all aspects of these disclosures and disclaimers. Additional information about the issuers and securities discussed in this research report is available on request.
Certifications: The research analyst(s) who prepared this research report hereby certifies that the views expressed in this research report accurately reflect the research analyst’s personal views about all of the subject issuers and/or securities, that the analyst(s) have no known conflict of interest and no part of the research analyst’s compensation was, is, or will be, directly or indirectly, related to the specific views or recommendations contained in this research report.
N (TP 315) N (TP 315)
N (TP 300) N (TP 300)
N (TP 330)
N (TP 345) N (TP 375) M-18
B (TP 490)
B (TP 430)
50
100
150
200
250
300
350
400
450
500
550
J-16 A-16 O-16 N-16 J-17 F-17 A-17 M-17 J-17 A-17 O-17 N-17 J-18 F-18 A-18 M-18 J-18 A-18 O-18 N-18 J-19 F-19 A-19 M-19
Page | 8 | PHILLIPCAPITAL INDIA RESEARCH
DABUR INDIA LTD QUARTERLY UPDATE
Additional Disclosures of Interest: Unless specifically mentioned in Point No. 9 below: 1. The Research Analyst(s), PCIL, or its associates or relatives of the Research Analyst does not have any financial interest in the company(ies) covered in
this report. 2. The Research Analyst, PCIL or its associates or relatives of the Research Analyst affiliates collectively do not hold more than 1% of the securities of the
company (ies)covered in this report as of the end of the month immediately preceding the distribution of the research report. 3. The Research Analyst, his/her associate, his/her relative, and PCIL, do not have any other material conflict of interest at the time of publication of this
research report. 4. The Research Analyst, PCIL, and its associates have not received compensation for investment banking or merchant banking or brokerage services or for
any other products or services from the company(ies) covered in this report, in the past twelve months. 5. The Research Analyst, PCIL or its associates have not managed or co-managed in the previous twelve months, a private or public offering of securities for
the company (ies) covered in this report. 6. PCIL or its associates have not received compensation or other benefits from the company(ies) covered in this report or from any third party, in
connection with the research report. 7. The Research Analyst has not served as an Officer, Director, or employee of the company (ies) covered in the Research report. 8. The Research Analyst and PCIL has not been engaged in market making activity for the company(ies) covered in the Research report. 9. Details of PCIL, Research Analyst and its associates pertaining to the companies covered in the Research report:
Sr. no. Particulars Yes/No
1 Whether compensation has been received from the company(ies) covered in the Research report in the past 12 months for investment banking transaction by PCIL
No
2 Whether Research Analyst, PCIL or its associates or relatives of the Research Analyst affiliates collectively hold more than 1% of the company(ies) covered in the Research report
No
3 Whether compensation has been received by PCIL or its associates from the company(ies) covered in the Research report No
4 PCIL or its affiliates have managed or co-managed in the previous twelve months a private or public offering of securities for the company(ies) covered in the Research report
No
5 Research Analyst, his associate, PCIL or its associates have received compensation for investment banking or merchant banking or brokerage services or for any other products or services from the company(ies) covered in the Research report, in the last twelve months
No
Independence: PhillipCapital (India) Pvt. Ltd. has not had an investment banking relationship with, and has not received any compensation for investment banking services from, the subject issuers in the past twelve (12) months, and PhillipCapital (India) Pvt. Ltd does not anticipate receiving or intend to seek compensation for investment banking services from the subject issuers in the next three (3) months. PhillipCapital (India) Pvt. Ltd is not a market maker in the securities mentioned in this research report, although it, or its affiliates/employees, may have positions in, purchase or sell, or be materially interested in any of the securities covered in the report.
Suitability and Risks: This research report is for informational purposes only and is not tailored to the specific investment objectives, financial situation or particular requirements of any individual recipient hereof. Certain securities may give rise to substantial risks and may not be suitable for certain investors. Each investor must make its own determination as to the appropriateness of any securities referred to in this research report based upon the legal, tax and accounting considerations applicable to such investor and its own investment objectives or strategy, its financial situation and its investing experience. The value of any security may be positively or adversely affected by changes in foreign exchange or interest rates, as well as by other financial, economic, or political factors. Past performance is not necessarily indicative of future performance or results.
Sources, Completeness and Accuracy: The material herein is based upon information obtained from sources that PCIPL and the research analyst believe to be reliable, but neither PCIPL nor the research analyst represents or guarantees that the information contained herein is accurate or complete and it should not be relied upon as such. Opinions expressed herein are current opinions as of the date appearing on this material, and are subject to change without notice. Furthermore, PCIPL is under no obligation to update or keep the information current. Without limiting any of the foregoing, in no event shall PCIL, any of its affiliates/employees or any third party involved in, or related to computing or compiling the information have any liability for any damages of any kind including but not limited to any direct or consequential loss or damage, however arising, from the use of this document.
Copyright: The copyright in this research report belongs exclusively to PCIPL. All rights are reserved. Any unauthorised use or disclosure is prohibited. No reprinting or reproduction, in whole or in part, is permitted without the PCIPL’s prior consent, except that a recipient may reprint it for internal circulation only and only if it is reprinted in its entirety.
Caution: Risk of loss in trading/investment can be substantial and even more than the amount / margin given by you. Investment in securities market are subject to market risks, you are requested to read all the related documents carefully before investing. You should carefully consider whether trading/investment is appropriate for you in light of your experience, objectives, financial resources and other relevant circumstances. PhillipCapital and any of its employees, directors, associates, group entities, or affiliates shall not be liable for losses, if any, incurred by you. You are further cautioned that trading/investments in financial markets are subject to market risks and are advised to seek independent third party trading/investment advice outside PhillipCapital/group/associates/affiliates/directors/employees before and during your trading/investment. There is no guarantee/assurance as to returns or profits or capital protection or appreciation. PhillipCapital and any of its employees, directors, associates, and/or employees, directors, associates of PhillipCapital’s group entities or affiliates is not inducing you for trading/investing in the financial market(s). Trading/Investment decision is your sole responsibility. You must also read the Risk Disclosure Document and Do’s and Don’ts before investing.
Kindly note that past performance is not necessarily a guide to future performance.
For Detailed Disclaimer: Please visit our website www.phillipcapital.in IMPORTANT DISCLOSURES FOR U.S. PERSONS This research report is a product of PhillipCapital (India) Pvt. Ltd. which is the employer of the research analyst(s) who has prepared the research report. PhillipCapital (India) Pvt Ltd. is authorized to engage in securities activities in India. PHILLIPCAP is not a registered broker-dealer in the United States and, therefore, is not subject to U.S. rules regarding the preparation of research reports and the independence of research analysts. This research report is provided for distribution to “major U.S. institutional investors” in reliance on the exemption from registration provided by Rule 15a-6 of the U.S. Securities Exchange Act of 1934, as amended (the “Exchange Act”). If the recipient of this report is not a Major Institutional Investor as specified above, then it should not act upon this

Page | 9 | PHILLIPCAPITAL INDIA RESEARCH
DABUR INDIA LTD QUARTERLY UPDATE
report and return the same to the sender. Further, this report may not be copied, duplicated and/or transmitted onward to any U.S. person, which is not a Major Institutional Investor.
Any U.S. recipient of this research report wishing to effect any transaction to buy or sell securities or related financial instruments based on the information provided in this research report should do so only through Rosenblatt Securities Inc, 40 Wall Street 59th Floor, New York NY 10005, a registered broker dealer in the United States. Under no circumstances should any recipient of this research report effect any transaction to buy or sell securities or related financial instruments through PHILLIPCAP. Rosenblatt Securities Inc. accepts responsibility for the contents of this research report, subject to the terms set out below, to the extent that it is delivered to a U.S. person other than a major U.S. institutional investor.
The analyst whose name appears in this research report is not registered or qualified as a research analyst with the Financial Industry Regulatory Authority (“FINRA”) and may not be an associated person of Rosenblatt Securities Inc. and, therefore, may not be subject to applicable restrictions under FINRA Rules on communications with a subject company, public appearances and trading securities held by a research analyst account. Ownership and Material Conflicts of Interest Rosenblatt Securities Inc. or its affiliates does not ‘beneficially own,’ as determined in accordance with Section 13(d) of the Exchange Act, 1% or more of any of the equity securities mentioned in the report. Rosenblatt Securities Inc, its affiliates and/or their respective officers, directors or employees may have interests, or long or short positions, and may at any time make purchases or sales as a principal or agent of the securities referred to herein. Rosenblatt Securities Inc. is not aware of any material conflict of interest as of the date of this publication Compensation and Investment Banking Activities Rosenblatt Securities Inc. or any affiliate has not managed or co-managed a public offering of securities for the subject company in the past 12 months, nor received compensation for investment banking services from the subject company in the past 12 months, neither does it or any affiliate expect to receive, or intends to seek compensation for investment banking services from the subject company in the next 3 months. Additional Disclosures This research report is for distribution only under such circumstances as may be permitted by applicable law. This research report has no regard to the specific investment objectives, financial situation or particular needs of any specific recipient, even if sent only to a single recipient. This research report is not guaranteed to be a complete statement or summary of any securities, markets, reports or developments referred to in this research report. Neither PHILLIPCAP nor any of its directors, officers, employees or agents shall have any liability, however arising, for any error, inaccuracy or incompleteness of fact or opinion in this research report or lack of care in this research report’s preparation or publication, or any losses or damages which may arise from the use of this research report.
PHILLIPCAP may rely on information barriers, such as “Chinese Walls” to control the flow of information within the areas, units, divisions, groups, or affiliates of PHILLIPCAP.
Investing in any non-U.S. securities or related financial instruments (including ADRs) discussed in this research report may present certain risks. The securities of non-U.S. issuers may not be registered with, or be subject to the regulations of, the U.S. Securities and Exchange Commission. Information on such non-U.S. securities or related financial instruments may be limited. Foreign companies may not be subject to audit and reporting standards and regulatory requirements comparable to those in effect within the United States.
The value of any investment or income from any securities or related financial instruments discussed in this research report denominated in a currency other than U.S. dollars is subject to exchange rate fluctuations that may have a positive or adverse effect on the value of or income from such securities or related financial instruments.
Past performance is not necessarily a guide to future performance and no representation or warranty, express or implied, is made by PHILLIPCAP with respect to future performance. Income from investments may fluctuate. The price or value of the investments to which this research report relates, either directly or indirectly, may fall or rise against the interest of investors. Any recommendation or opinion contained in this research report may become outdated as a consequence of changes in the environment in which the issuer of the securities under analysis operates, in addition to changes in the estimates and forecasts, assumptions and valuation methodology used herein.
No part of the content of this research report may be copied, forwarded or duplicated in any form or by any means without the prior written consent of PHILLIPCAP and PHILLIPCAP accepts no liability whatsoever for the actions of third parties in this respect.
PhillipCapital (India) Pvt. Ltd. Registered office: 18th floor, Urmi Estate, Ganpatrao Kadam Marg, Lower Parel (West), Mumbai – 400013, India.
Related Documents