1 Inequality, Poverty, and Redistribution Chapter 18 Copyright © 2002 Addison Wesley CHAPTER CHECKLIST 1. Describe the inequality in income and wealth in the United States and explain why wealth inequality is greater than income inequality. 2. Explain how economic inequality arises. 3. Explain the effects of taxes, social security, and welfare programs on economic inequality. LECTURE TOPICS <Inequality in the United States <How Inequality Arises <Income Redistribution 18.1 INEQUALITY IN THE UNITED STATES We measure economic inequality by looking at the distributions of income and wealth. A household’s income is the amount that it receives in a given period. A household’s wealth is the value of the things it owns a point in time. Table 18.1 on the next slide shows the distributions of income and wealth in the United States in 1999.

Welcome message from author
This document is posted to help you gain knowledge. Please leave a comment to let me know what you think about it! Share it to your friends and learn new things together.
Transcript
1
Inequality, Poverty, and Redistribution
Chapter
18
Copyright © 2002 Addison Wesley
CHAPTER CHECKLIST
1. Describe the inequality in income and wealth in the United States and explain why wealth inequality is greater than income inequality.
2. Explain how economic inequality arises.
3. Explain the effects of taxes, social security, and welfare programs on economic inequality.
LECTURE TOPICS
< Inequality in the United States<How Inequality Arises
< Income Redistribution
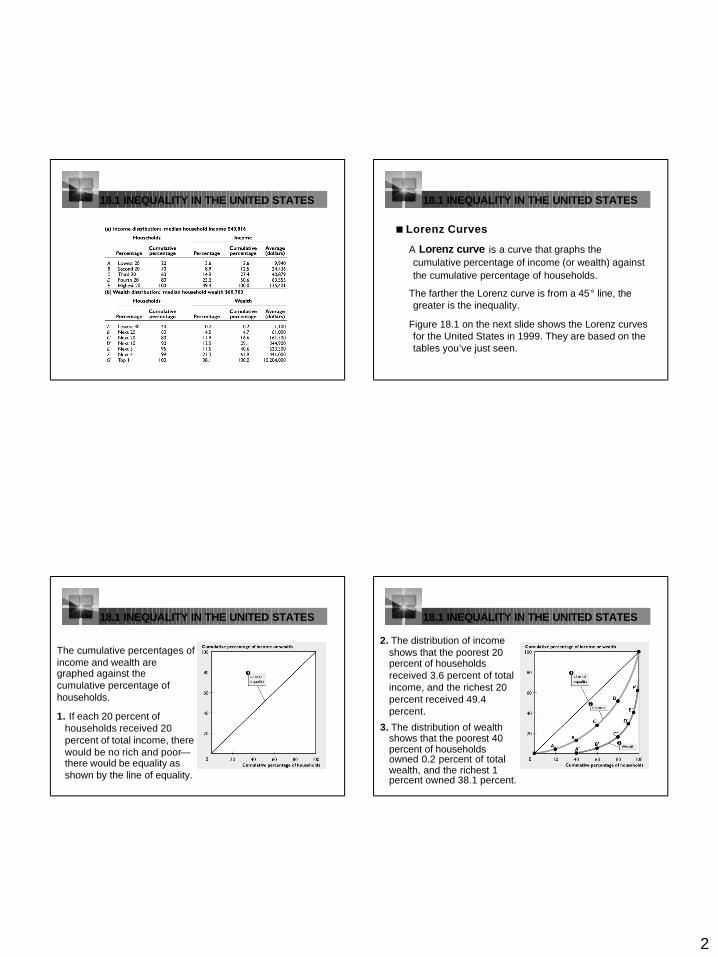
18.1 INEQUALITY IN THE UNITED STATES
We measure economic inequality by looking at the distributions of income and wealth.
A household’s income is the amount that it receives in a given period.
A household’s wealth is the value of the things it owns a point in time.
Table 18.1 on the next slide shows the distributions of income and wealth in the United States in 1999.
2
18.1 INEQUALITY IN THE UNITED STATES 18.1 INEQUALITY IN THE UNITED STATES
<Lorenz Curves
A Lorenz curve is a curve that graphs the cumulative percentage of income (or wealth) against the cumulative percentage of households.
The farther the Lorenz curve is from a 45° line, the greater is the inequality.
Figure 18.1 on the next slide shows the Lorenz curves for the United States in 1999. They are based on the tables you’ve just seen.
18.1 INEQUALITY IN THE UNITED STATES
The cumulative percentages of income and wealth are graphed against the cumulative percentage of households.
1. If each 20 percent of households received 20 percent of total income, there would be no rich and poor—there would be equality as shown by the line of equality.
18.1 INEQUALITY IN THE UNITED STATES
2. The distribution of income shows that the poorest 20 percent of households received 3.6 percent of total income, and the richest 20 percent received 49.4 percent.
3. The distribution of wealth shows that the poorest 40 percent of households owned 0.2 percent of total wealth, and the richest 1 percent owned 38.1 percent.
3
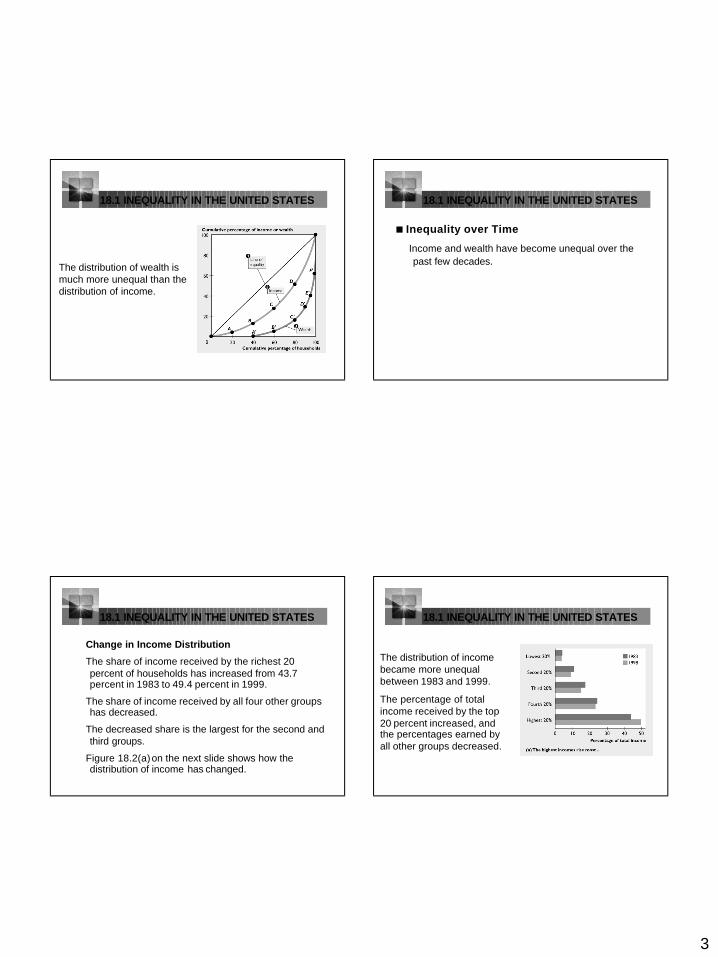
18.1 INEQUALITY IN THE UNITED STATES
The distribution of wealth is much more unequal than the distribution of income.
18.1 INEQUALITY IN THE UNITED STATES
< Inequality over Time
Income and wealth have become unequal over the past few decades.
18.1 INEQUALITY IN THE UNITED STATES
Change in Income Distribution
The share of income received by the richest 20 percent of households has increased from 43.7 percent in 1983 to 49.4 percent in 1999.
The share of income received by all four other groups has decreased.
The decreased share is the largest for the second and third groups.
Figure 18.2(a)on the next slide shows how the distribution of income has changed.
18.1 INEQUALITY IN THE UNITED STATES
The distribution of income became more unequal between 1983 and 1999.
The percentage of total income received by the top 20 percent increased, and the percentages earned by all other groups decreased.
4
18.1 INEQUALITY IN THE UNITED STATES
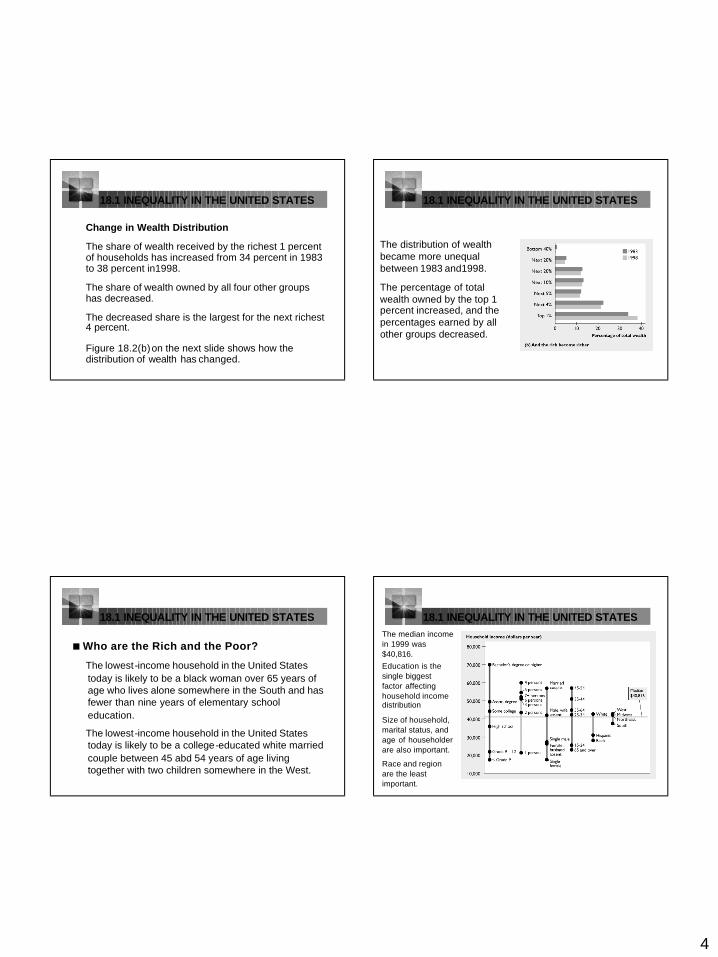
Change in Wealth Distribution
The share of wealth received by the richest 1 percent of households has increased from 34 percent in 1983 to 38 percent in1998.
The share of wealth owned by all four other groups has decreased.
The decreased share is the largest for the next richest 4 percent.
Figure 18.2(b)on the next slide shows how the distribution of wealth has changed.
18.1 INEQUALITY IN THE UNITED STATES
The distribution of wealth became more unequal between 1983 and1998.
The percentage of total wealth owned by the top 1 percent increased, and the percentages earned by all other groups decreased.
18.1 INEQUALITY IN THE UNITED STATES
<Who are the Rich and the Poor?
The lowest-income household in the United States today is likely to be a black woman over 65 years of age who lives alone somewhere in the South and has fewer than nine years of elementary school education.
The lowest-income household in the United States today is likely to be a college-educated white married couple between 45 abd 54 years of age living together with two children somewhere in the West.
18.1 INEQUALITY IN THE UNITED STATESThe median income in 1999 was $40,816.Education is the single biggest factor affecting household income distribution
Size of household, marital status, and age of householder are also important.
Race and region are the least important.
5
18.1 INEQUALITY IN THE UNITED STATES
<Poverty
Poverty is a state in which a household’s income is too low to be able to buy the quantities of food, shelter, and clothing that are deemed necessary.
In 1999, the poverty level for a four-person household was an income of $17,029.
In that year 32.3 million Americans lived below the poverty level.
Figure 18.4 on the next slide shows the changing poverty rate in the United States.
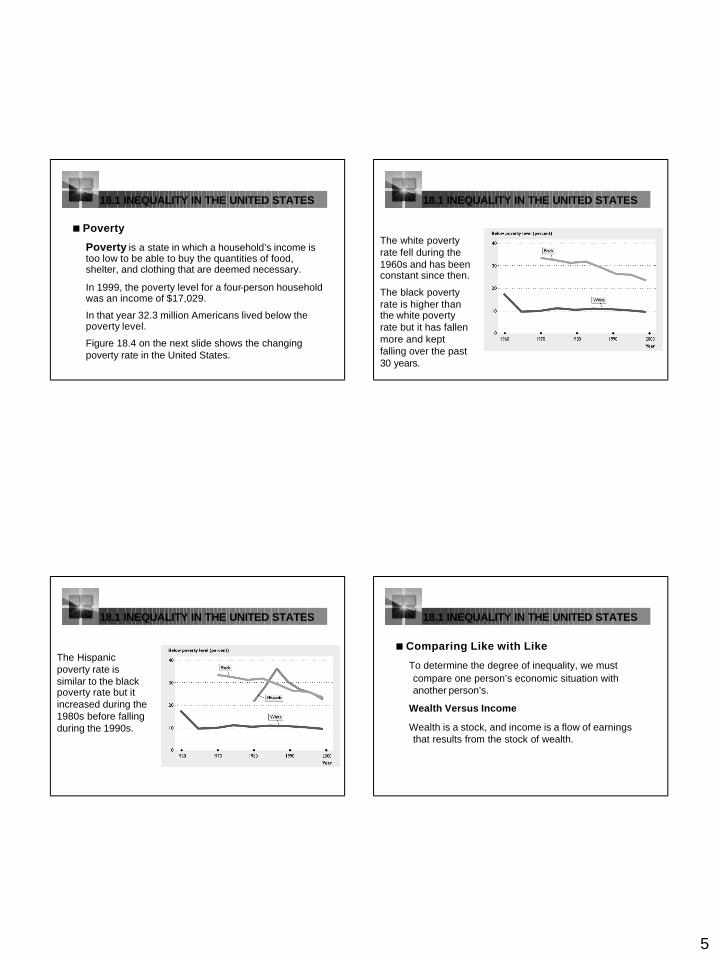
18.1 INEQUALITY IN THE UNITED STATES
The white poverty rate fell during the 1960s and has been constant since then.
The black poverty rate is higher than the white poverty rate but it has fallen more and kept falling over the past 30 years.
18.1 INEQUALITY IN THE UNITED STATES
The Hispanic poverty rate is similar to the black poverty rate but it increased during the 1980s before falling during the 1990s.
18.1 INEQUALITY IN THE UNITED STATES
<Comparing Like with Like
To determine the degree of inequality, we must compare one person’s economic situation with another person’s.
Wealth Versus Income
Wealth is a stock, and income is a flow of earnings that results from the stock of wealth.
6
18.1 INEQUALITY IN THE UNITED STATES
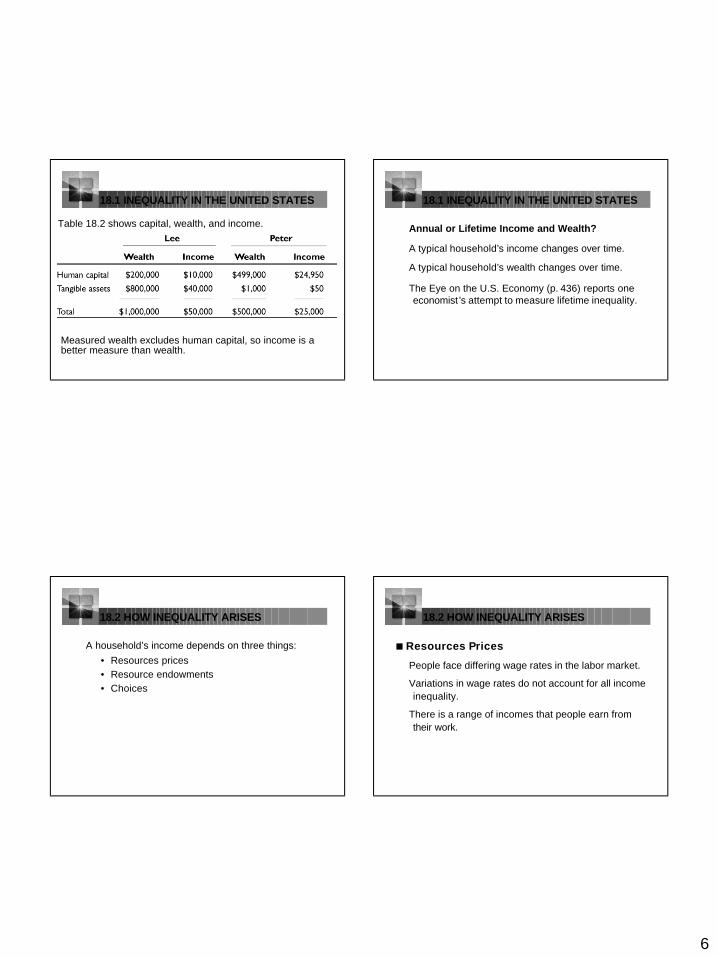
Table 18.2 shows capital, wealth, and income.
Measured wealth excludes human capital, so income is a better measure than wealth.
18.1 INEQUALITY IN THE UNITED STATES
Annual or Lifetime Income and Wealth?
A typical household’s income changes over time.
A typical household’s wealth changes over time.
The Eye on the U.S. Economy (p. 436) reports one economist ’s attempt to measure lifetime inequality.
18.2 HOW INEQUALITY ARISES
A household’s income depends on three things: • Resources prices• Resource endowments• Choices
18.2 HOW INEQUALITY ARISES
<Resources Prices
People face differing wage rates in the labor market.
Variations in wage rates do not account for all income inequality.
There is a range of incomes that people earn from their work.
7
18.2 HOW INEQUALITY ARISES
<Resources Endowments
The distribution of individual ability across individuals is a major source of inequality in income and wealth.
It is not the only source.
The distributions are skewed toward high incomes and look like the curve in Figure 18.5 on the next slide.
18.1 INEQUALITY IN THE UNITED STATES
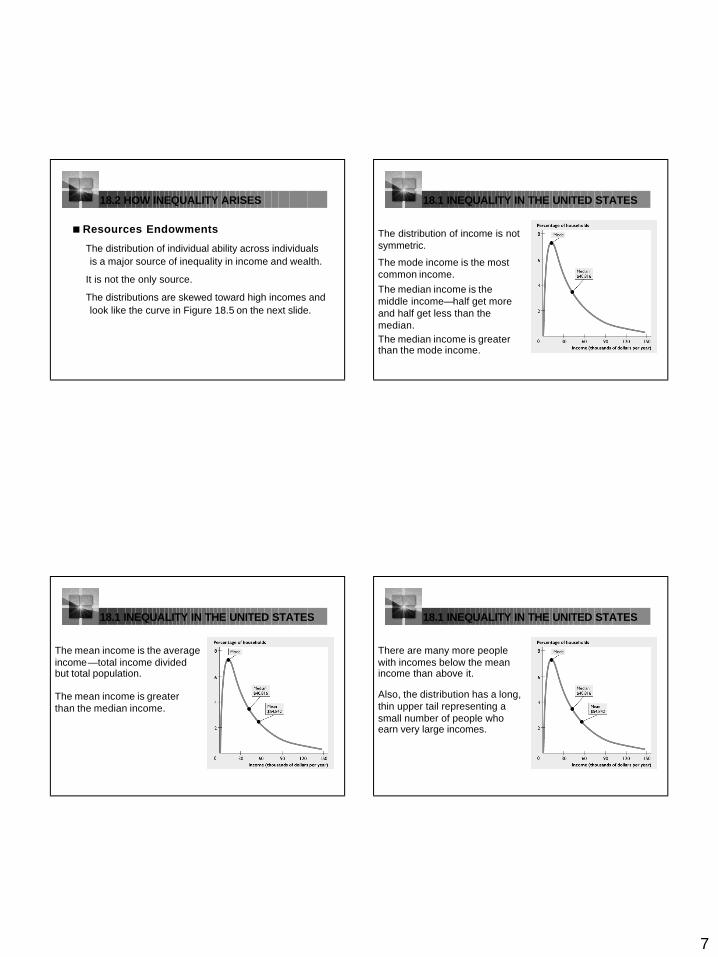
The distribution of income is not symmetric.
The mode income is the most common income.The median income is the middle income—half get more and half get less than the median.The median income is greater than the mode income.
18.1 INEQUALITY IN THE UNITED STATES
The mean income is the average income—total income divided but total population.
The mean income is greater than the median income.
18.1 INEQUALITY IN THE UNITED STATES
There are many more people with incomes below the mean income than above it.
Also, the distribution has a long, thin upper tail representing a small number of people who earn very large incomes.
8
18.2 HOW INEQUALITY ARISES
<Choices
The choices people make:• Exaggerate the differences among them.• Make the distribution of income more unequal
than the distribution of abilities.• Make the distribution of income skewed.
18.2 HOW INEQUALITY ARISES
Wages and the Supply of Labor
At a high enough wage rate, an individual labor supply bends backward.
Over a large range of wage rates, the quantity of labor that a person supplies increases as that person’s wage rate increases.
Because the quantity of labor increases as the wage rate increases, the distribution of income is more unequal than the distribution of hourly wages.
It is also skewed, as shown in Figure 18.5.
18.2 HOW INEQUALITY ARISES
Saving and Bequests
Bequest
• A gift from one generation to the next.
Two features of bequests make intergenerational transfers of wealth a source of increased inequality:
• Debts cannot be bequeathed.
• Mating is assortive.
18.2 HOW INEQUALITY ARISES
Debts Cannot Be Bequeathed
Debts cannot be forced onto other household members.
Because a zero inheritance is the smallets inheritance that anyone can receive, bequests can only add to future generations’ wealth and income potential.
Asortative Mating
The tendency for people to marry within their own socioeconomic class.
Wealth becomes more concentrated.
9
18.3 INCOME REDISTRIBUTION
< Income Taxes
Income taxes may be progressive, regressive, or propotional.
• A progressive tax– One that taxes income at an average rate that
increases with the level of income.
• A regressive tax– One that taxes income at an average rate that
decreases with the level of income.
• A proportional tax– One that taxes income at a constant rate, regardless of
income.
18.3 INCOME REDISTRIBUTION
< Income Maintenance Programs
Social Security
A public insurance program.• OASDHI
– Old age, Survivors, Disability, and Health Insurance
• Medicare– Provides hospital and health insurance for the elderly
and disabled.
18.3 INCOME REDISTRIBUTION
Unemployment Compensation
To provide an income to unemployed workers.
A tax is paid based on the income of each covered worker.
Each worker receives a benefit when he or she becomes unemployed.
18.3 INCOME REDISTRIBUTION
Welfare Programs
1. To provide incomes for people to help the neediest elderly, disabled, and blind people.
2. Temporary Assistance for Needy Families (TANF) program, designed to help households that have inadequate income.
3. Food Stamp program, designed to help the poorest households obtain a basic diet.
4. Medicaid, designed to cover the costs of medical care for households receiving help under the SSI and TANF programs.
10
18.3 INCOME REDISTRIBUTION
< Subsidized Services
Services provided by the government at prices far below the cost of production. The most important of these are:
• Education• Health care
18.3 INCOME REDISTRIBUTION
< The Scale of Income Redistribution
Market income is the income a houshold earns in factor markets before tax and excluding transfers from the government.
Money income is market income plus money benefits paid by the government.
We can measure the scale of income redistribution by calculating the percentage of market income paid in taxes minus the percentage received in benefits at each income level .
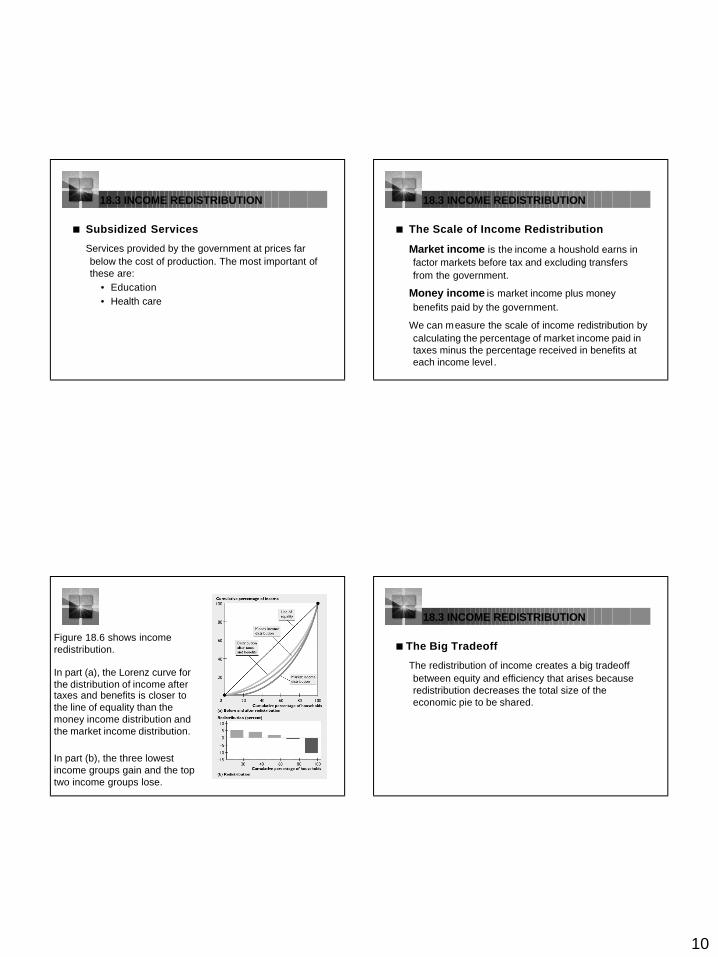
Figure 18.6 shows income redistribution.
In part (a), the Lorenz curve for the distribution of income after taxes and benefits is closer to the line of equality than the money income distribution and the market income distribution.
In part (b), the three lowest income groups gain and the top two income groups lose.
18.3 INCOME REDISTRIBUTION
<The Big Tradeoff
The redistribution of income creates a big tradeoff between equity and efficiency that arises because redistribution decreases the total size of the economic pie to be shared.
11
18.3 INCOME REDISTRIBUTION
<A Major Welfare Challenge
Passed in 1996, the Personal Responsibility and Work Opportunities Reconciliation Act created the Tempory Assistance for Needy Families (TANF) program.
18.3 INCOME REDISTRIBUTION
<Negative Income Tax
A negative income tax is a tax and redistribution scheme that provides every household with a guaranteed minimum annual income and taxes all market income at a fixed marginal tax rate.
A negative income tax removes the welfare trap and gives greater encouragement to low-income households to seek more employment, even at a low wage.
Figure 18.7 on the next slide shows this outcome.
18.3 INCOME REDISTRIBUTION
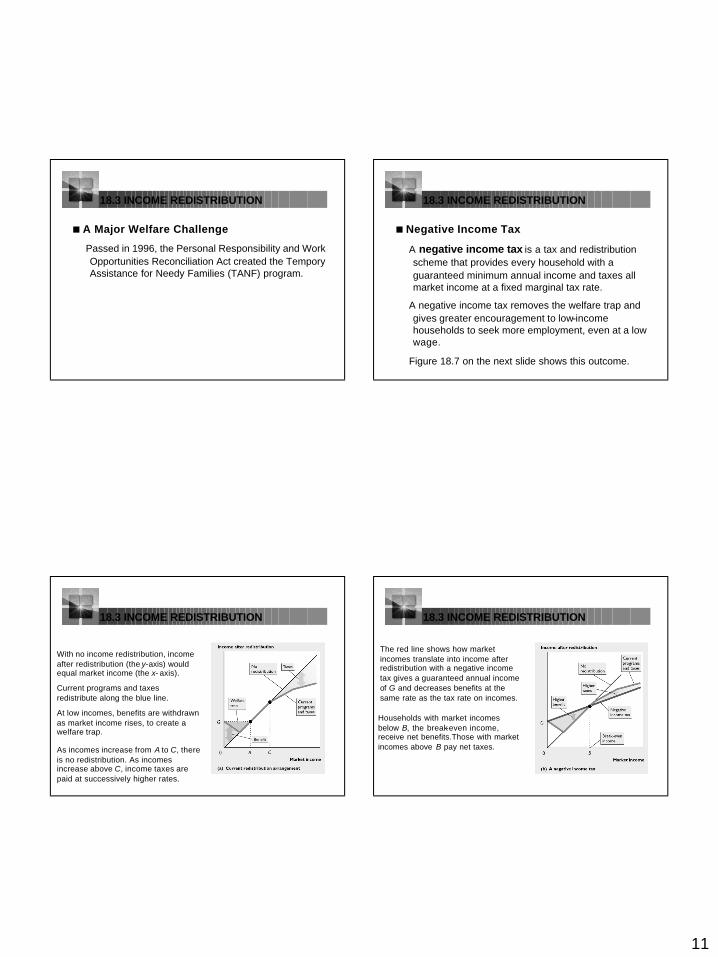
With no income redistribution, income after redistribution (the y-axis) would equal market income (the x- axis).
Current programs and taxes redistribute along the blue line.
As incomes increase from A to C, there is no redistribution. As incomes increase above C, income taxes are paid at successively higher rates.
At low incomes, benefits are withdrawn as market income rises, to create a welfare trap.
18.3 INCOME REDISTRIBUTION
The red line shows how market incomes translate into income after redistribution with a negative income tax gives a guaranteed annual income of G and decreases benefits at the same rate as the tax rate on incomes.
Households with market incomes below B, the break-even income, receive net benefits.Those with market incomes above B pay net taxes.
12
The EndChapter
18
Copyright © 2002 Addison Wesley
Related Documents