DECEMBER INDUSTRY CLIMATE SURVEY REPORT

Welcome message from author
This document is posted to help you gain knowledge. Please leave a comment to let me know what you think about it! Share it to your friends and learn new things together.
Transcript
DECEMBER
INDUSTRY CLIMATE SURVEY REPORT
Structural Building Components Association December 2017 Industry Climate Survey
Copyright © 2017 SBCA
Page 2 of 10
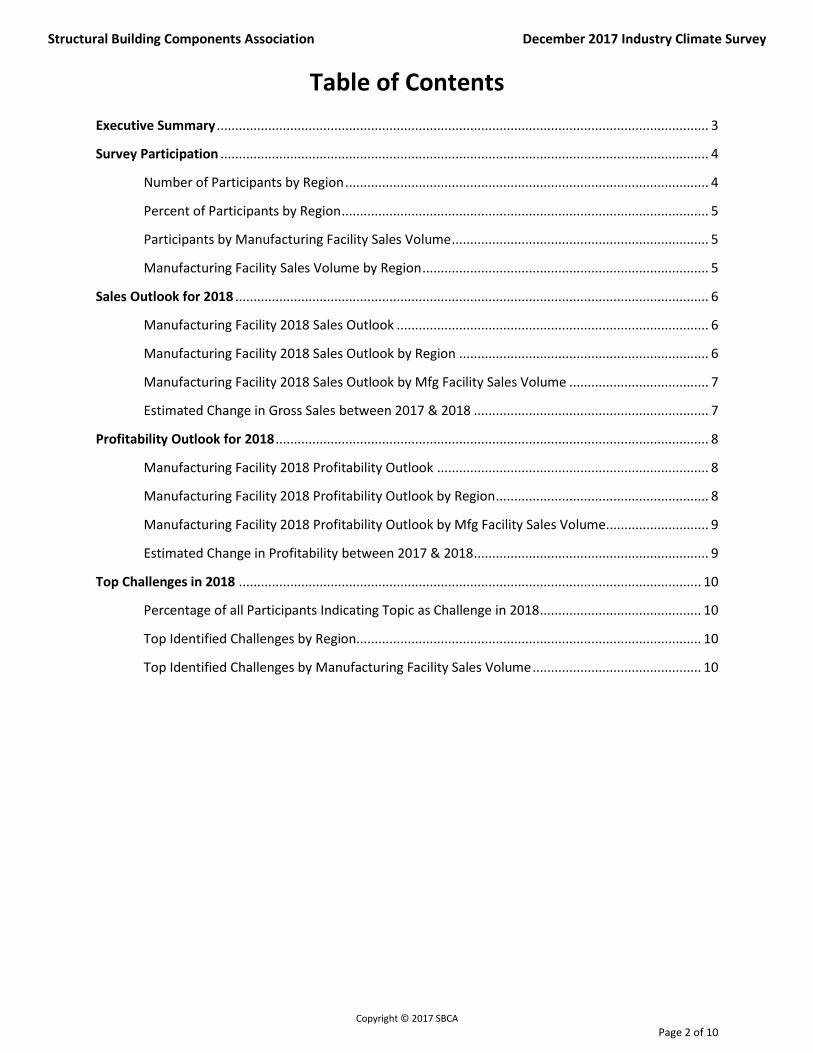
Table of Contents
Executive Summary ...................................................................................................................................... 3
Survey Participation ..................................................................................................................................... 4
Number of Participants by Region ................................................................................................... 4
Percent of Participants by Region .................................................................................................... 5
Participants by Manufacturing Facility Sales Volume ...................................................................... 5
Manufacturing Facility Sales Volume by Region .............................................................................. 5
Sales Outlook for 2018 ................................................................................................................................. 6
Manufacturing Facility 2018 Sales Outlook ..................................................................................... 6
Manufacturing Facility 2018 Sales Outlook by Region .................................................................... 6
Manufacturing Facility 2018 Sales Outlook by Mfg Facility Sales Volume ...................................... 7
Estimated Change in Gross Sales between 2017 & 2018 ................................................................ 7
Profitability Outlook for 2018 ...................................................................................................................... 8
Manufacturing Facility 2018 Profitability Outlook .......................................................................... 8
Manufacturing Facility 2018 Profitability Outlook by Region .......................................................... 8
Manufacturing Facility 2018 Profitability Outlook by Mfg Facility Sales Volume............................ 9
Estimated Change in Profitability between 2017 & 2018 ................................................................ 9
Top Challenges in 2018 .............................................................................................................................. 10
Percentage of all Participants Indicating Topic as Challenge in 2018 ............................................ 10
Top Identified Challenges by Region.............................................................................................. 10
Top Identified Challenges by Manufacturing Facility Sales Volume .............................................. 10
Structural Building Components Association December 2017 Industry Climate Survey
Copyright © 2017 SBCA
Page 3 of 10
Executive Summary
SBCA is pleased to provide a Business Climate Survey for 2018. In November of 2017, SBCA sent out an
online questionnaire to all component manufacturing member locations. In all, 129 locations provided
at least partially useable responses. Responses showed that the majority of members are optimistic
about the coming year, while the largest concern across the country was production labor availability.
Going forward, SBCA will conduct surveys regularly, focusing on different aspects of business operations,
including financial, wages/benefits, operations and industry trends. Watch for a Financial Performance
Survey in early January. Survey questions will be simplified from the past in order to allow for as much
participation as possible from SBCA members.
Thank you to subcommittee members Jeff Taake (Mead Lumber Co.), Jeff Smith (Trussway), John
Herring (A-1 Roof Trusses) and Dave Green (Carolina Structural Systems) for their time and efforts on
the SBCA surveys conducted in 2017.
We look forward to continual improvement and increased participation in the years to come.
Structural Building Components Association December 2017 Industry Climate Survey
Copyright © 2017 SBCA
Page 4 of 10
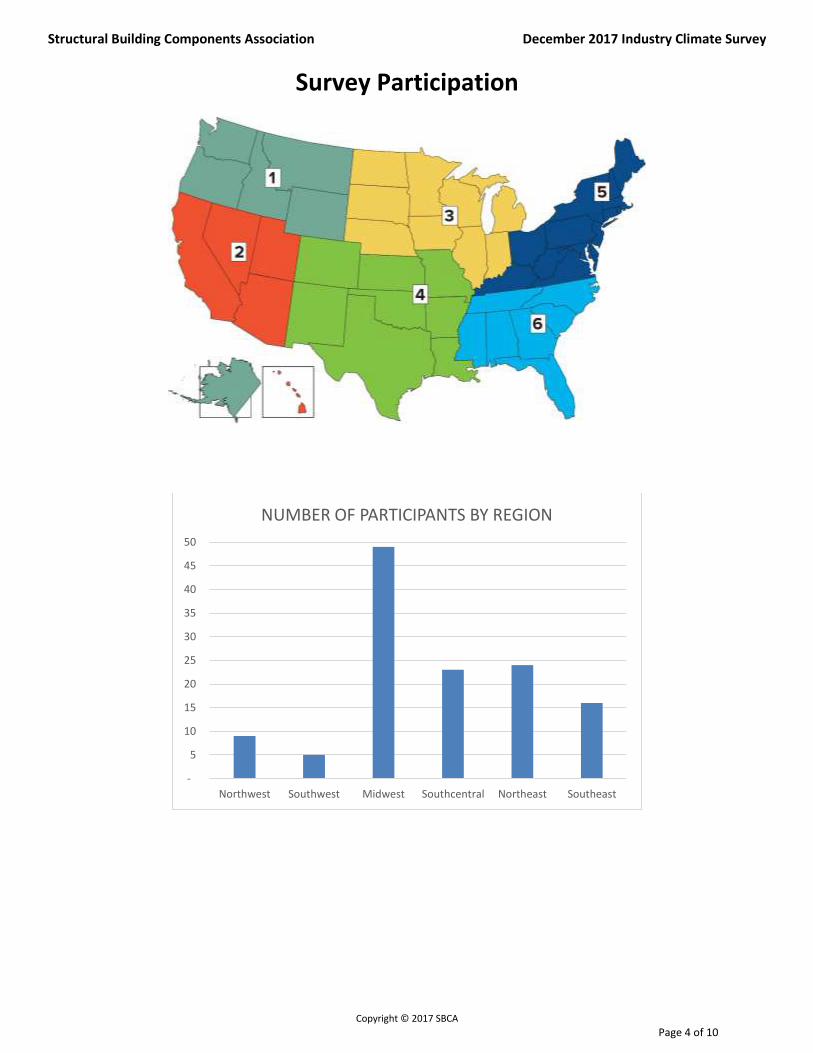
Survey Participation
-
5
10
15
20
25
30
35
40
45
50
Northwest Southwest Midwest Southcentral Northeast Southeast
NUMBER OF PARTICIPANTS BY REGION
Structural Building Components Association December 2017 Industry Climate Survey
Copyright © 2017 SBCA
Page 5 of 10
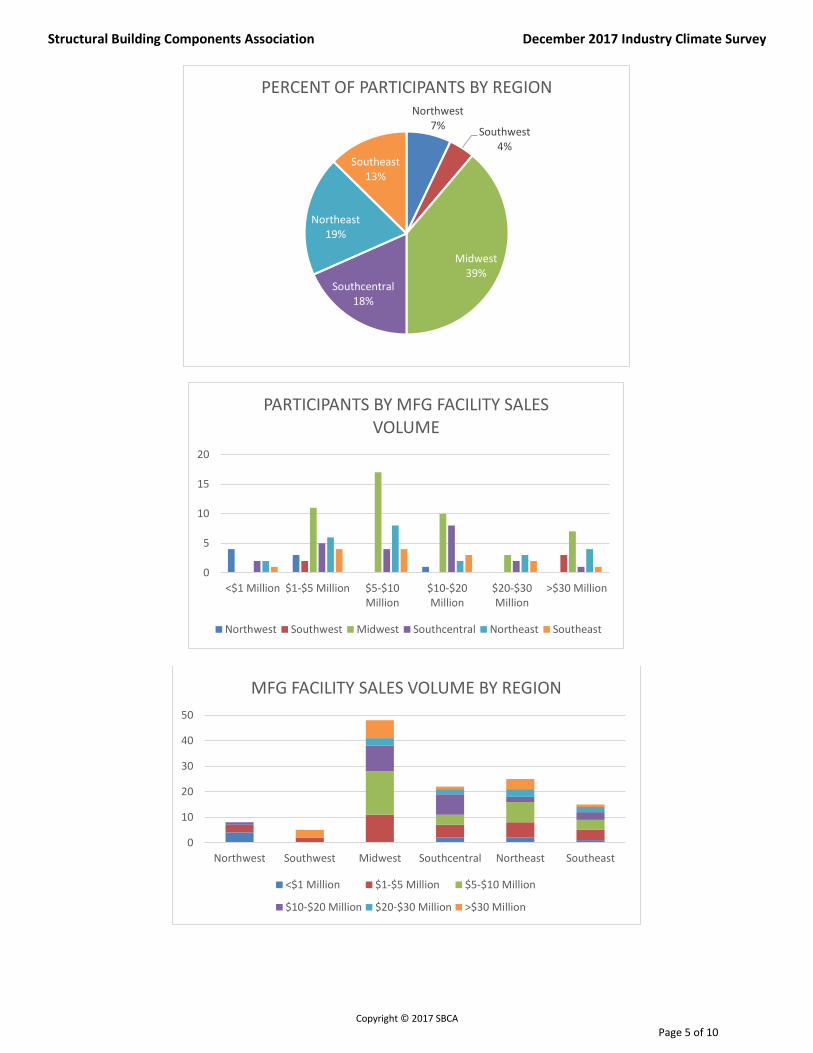
Northwest7%
Southwest4%
Midwest39%
Southcentral18%
Northeast19%
Southeast13%
PERCENT OF PARTICIPANTS BY REGION
0
5
10
15
20
<$1 Million $1-$5 Million $5-$10Million
$10-$20Million
$20-$30Million
>$30 Million
PARTICIPANTS BY MFG FACILITY SALES VOLUME
Northwest Southwest Midwest Southcentral Northeast Southeast
0
10
20
30
40
50
Northwest Southwest Midwest Southcentral Northeast Southeast
MFG FACILITY SALES VOLUME BY REGION
<$1 Million $1-$5 Million $5-$10 Million
$10-$20 Million $20-$30 Million >$30 Million
Structural Building Components Association December 2017 Industry Climate Survey
Copyright © 2017 SBCA
Page 6 of 10
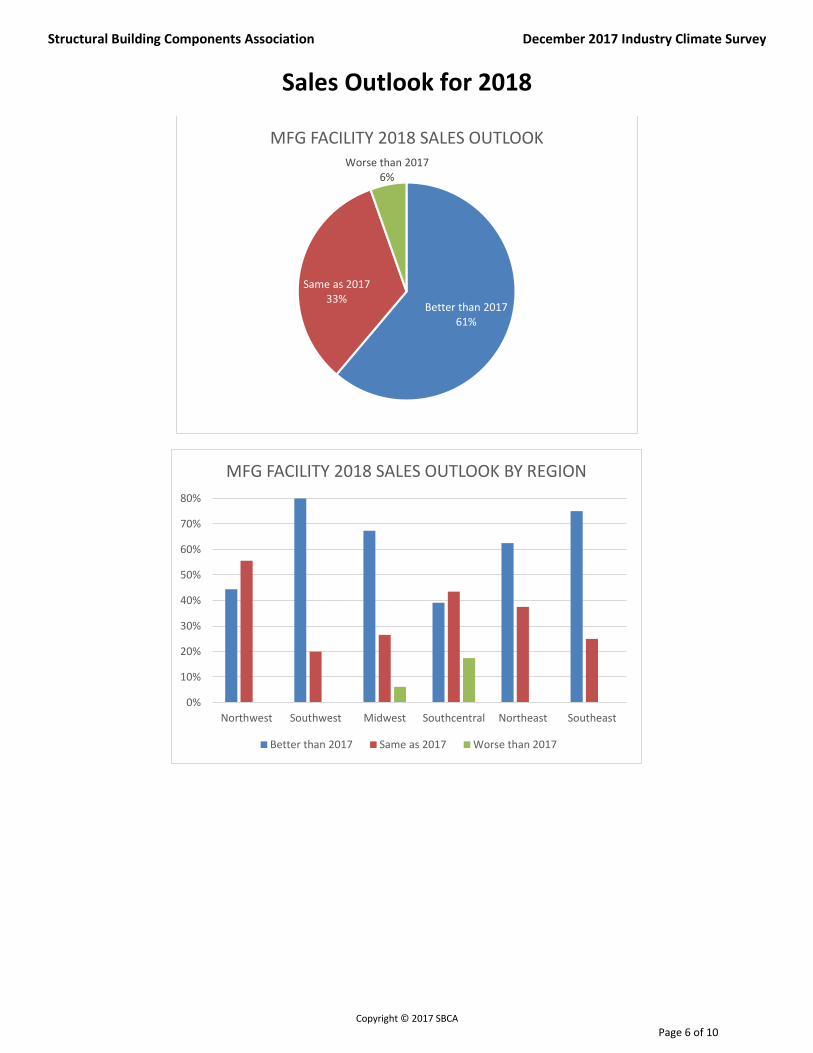
Sales Outlook for 2018
Better than 201761%
Same as 201733%
Worse than 20176%
MFG FACILITY 2018 SALES OUTLOOK
0%
10%
20%
30%
40%
50%
60%
70%
80%
Northwest Southwest Midwest Southcentral Northeast Southeast
MFG FACILITY 2018 SALES OUTLOOK BY REGION
Better than 2017 Same as 2017 Worse than 2017
Structural Building Components Association December 2017 Industry Climate Survey
Copyright © 2017 SBCA
Page 7 of 10
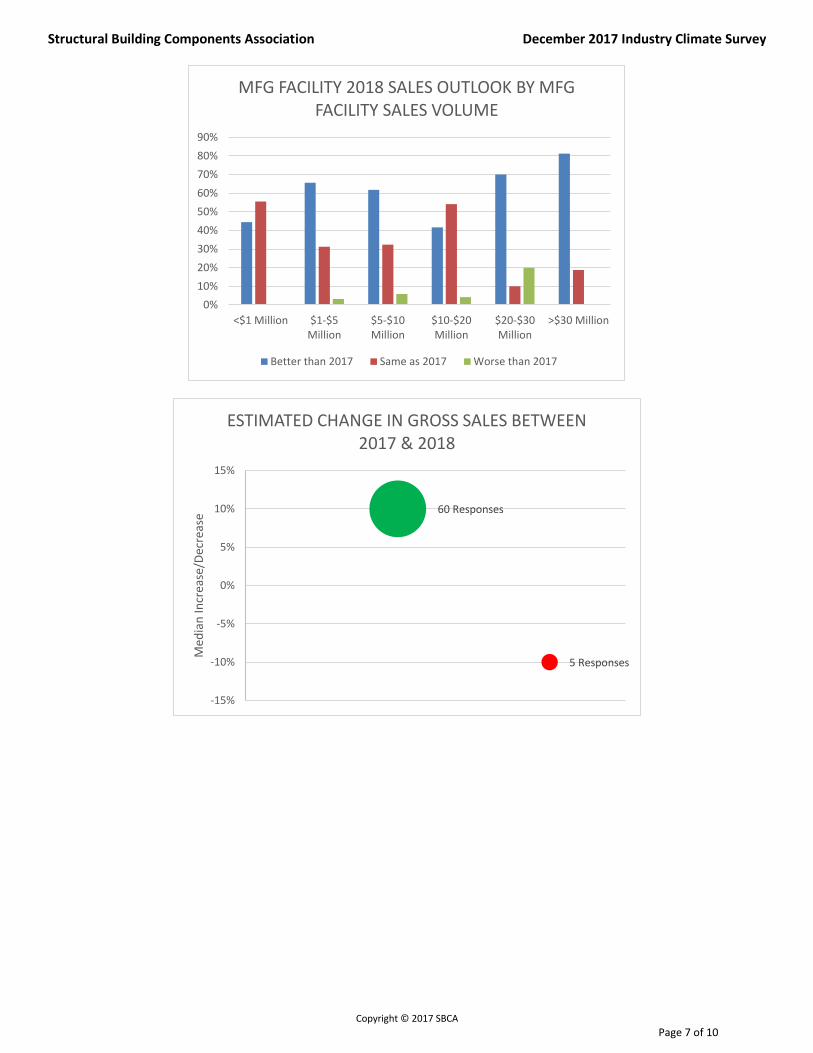
0%
10%
20%
30%
40%
50%
60%
70%
80%
90%
<$1 Million $1-$5Million
$5-$10Million
$10-$20Million
$20-$30Million
>$30 Million
MFG FACILITY 2018 SALES OUTLOOK BY MFG FACILITY SALES VOLUME
Better than 2017 Same as 2017 Worse than 2017
60 Responses
5 Responses
-15%
-10%
-5%
0%
5%
10%
15%
Med
ian
Incr
ease
/Dec
reas
e
ESTIMATED CHANGE IN GROSS SALES BETWEEN 2017 & 2018
Structural Building Components Association December 2017 Industry Climate Survey
Copyright © 2017 SBCA
Page 8 of 10
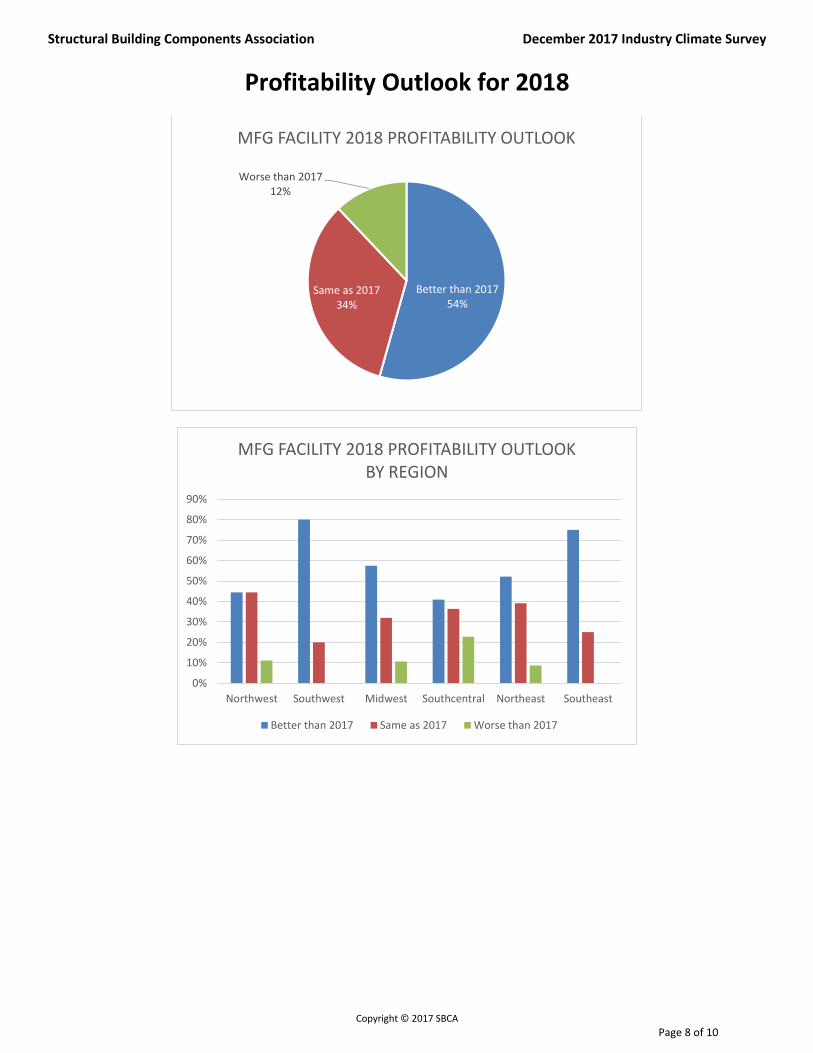
Profitability Outlook for 2018
Better than 201754%
Same as 201734%
Worse than 201712%
MFG FACILITY 2018 PROFITABILITY OUTLOOK
0%
10%
20%
30%
40%
50%
60%
70%
80%
90%
Northwest Southwest Midwest Southcentral Northeast Southeast
MFG FACILITY 2018 PROFITABILITY OUTLOOK BY REGION
Better than 2017 Same as 2017 Worse than 2017
Structural Building Components Association December 2017 Industry Climate Survey
Copyright © 2017 SBCA
Page 9 of 10
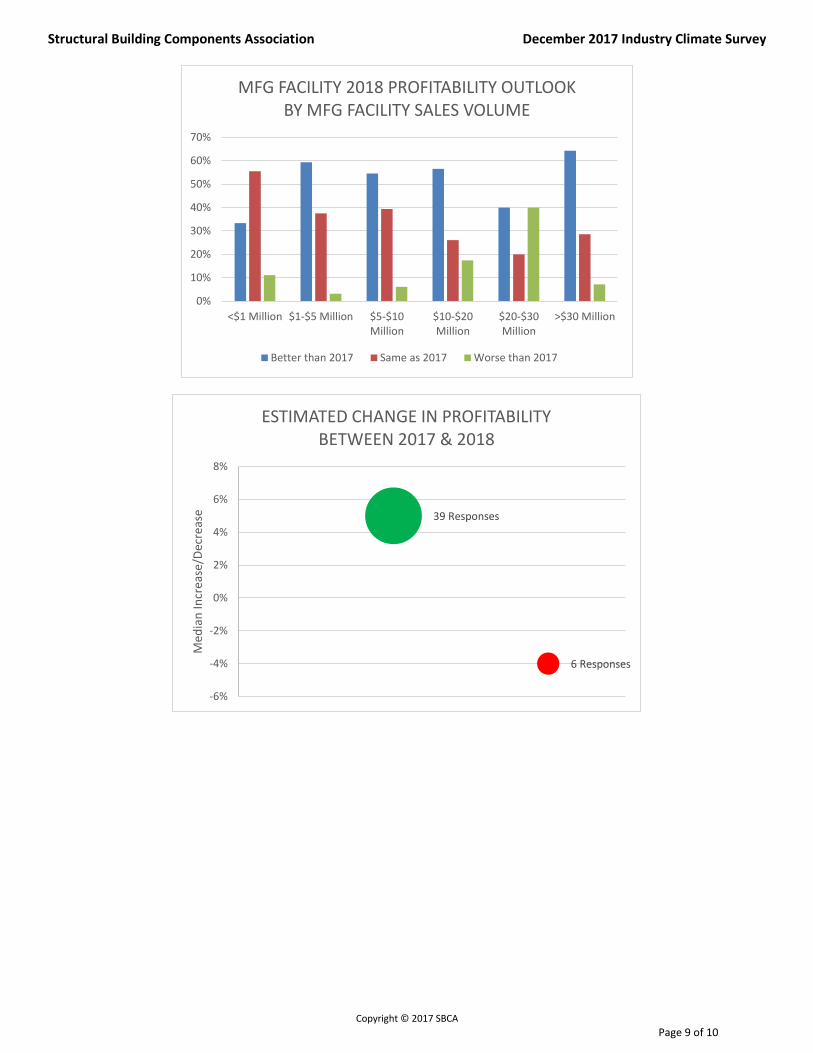
0%
10%
20%
30%
40%
50%
60%
70%
<$1 Million $1-$5 Million $5-$10Million
$10-$20Million
$20-$30Million
>$30 Million
MFG FACILITY 2018 PROFITABILITY OUTLOOK BY MFG FACILITY SALES VOLUME
Better than 2017 Same as 2017 Worse than 2017
39 Responses
6 Responses
-6%
-4%
-2%
0%
2%
4%
6%
8%
Med
ian
Incr
ease
/Dec
reas
e
ESTIMATED CHANGE IN PROFITABILITY BETWEEN 2017 & 2018
Structural Building Components Association December 2017 Industry Climate Survey
Copyright © 2017 SBCA
Page 10 of 10
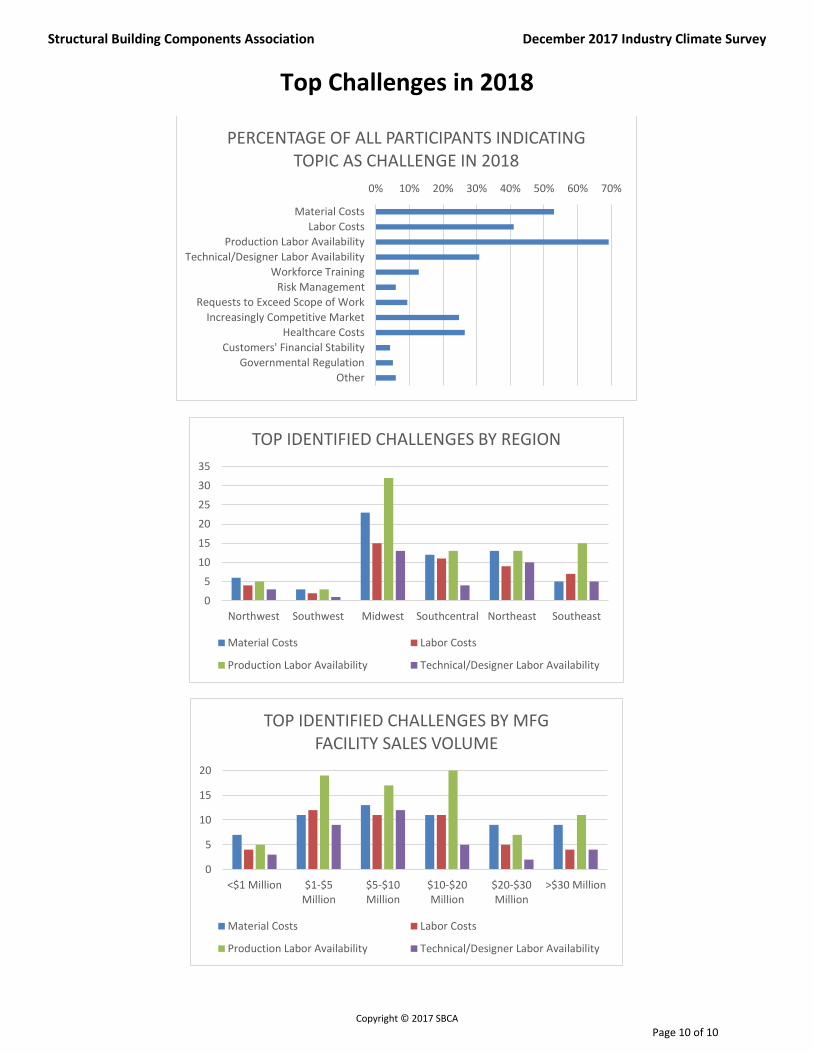
Top Challenges in 2018
0% 10% 20% 30% 40% 50% 60% 70%
Material Costs
Labor Costs
Production Labor Availability
Technical/Designer Labor Availability
Workforce Training
Risk Management
Requests to Exceed Scope of Work
Increasingly Competitive Market
Healthcare Costs
Customers' Financial Stability
Governmental Regulation
Other
PERCENTAGE OF ALL PARTICIPANTS INDICATING TOPIC AS CHALLENGE IN 2018
0
5
10
15
20
25
30
35
Northwest Southwest Midwest Southcentral Northeast Southeast
TOP IDENTIFIED CHALLENGES BY REGION
Material Costs Labor Costs
Production Labor Availability Technical/Designer Labor Availability
0
5
10
15
20
<$1 Million $1-$5Million
$5-$10Million
$10-$20Million
$20-$30Million
>$30 Million
TOP IDENTIFIED CHALLENGES BY MFG FACILITY SALES VOLUME
Material Costs Labor Costs
Production Labor Availability Technical/Designer Labor Availability
Related Documents