India’s FDI opportunity Through an investor's lens - a survey report September 2021

Welcome message from author
This document is posted to help you gain knowledge. Please leave a comment to let me know what you think about it! Share it to your friends and learn new things together.
Transcript

India’s FDI opportunity
i
India’s FDI opportunity Through an investor's lens - a survey reportSeptember 2021
India’s FDI opportunityIndia’s FDI opportunity
ii
Table of contents
Preface 01
Section 1: Introduction—FDI and India’s US$5 trillion ambition 02
Section 2: Investor perception of India: A survey 07
Section 3: Recommendations 16
Conclusion 27
Connect with us 27
India’s FDI opportunity
01
India’s FDI opportunity
iv
Preface
Recent FDI inflows have been a silver lining and have provided necessary optimism, despite the COVID-19 disruption to the economy. In FY2020-21, FDI inflows (including equity, re-invested earnings, and capital) amounted to a record US$81.72 billion, 10 percent higher than the previous financial year.
While India remains a favoured foreign direct investment (FDI) destination, the country must enact more reforms to ensure FDI flows not only continue but also play a meaningful role in attaining the US$5 trillion economy target. The country must continue to enact reforms and initiatives that drive improvement, building confidence in and enhancing the competitiveness of India’s economy. While these inflows were driven primarily by the services sector, a more proportionate contribution to gross capital formation and the increase in exports can be achieved through greater FDI in manufacturing. Average FDI from FY15 to FY21 in manufacturing was US$8.6 billion compared to about US$25 billion for services. Our analysis shows that India will require at least US$8 trillion of cumulative gross capital formation to grow into a US$5 trillion economy, assuming we are on the fastest growth track. Based on past trends, our research suggests India needs approximately US$400 billion of foreign capital cumulatively over the next six years.
Attracting FDI in capital-intensive sectors is key to the country’s gross capital formation and establishing its position as a global trade partner. To attract investment to India, investor perceptions must be understood. Deloitte recently surveyed 1,200 multinational business leaders to understand just that.
With this report, we hope to provide insights into the findings and create a conversation on the role FDI can play in accelerating India’s passage towards a US$5 trillion economy.
Map not to scale
India’s FDI opportunity
02
4%$24 B
Section 1: Introduction—FDI and India’s US$5 trillion ambition
FY 2011-12
FY 2012-13
FY 2013-14
FY 2014-15
FY 2015-16
FY 2016-17
FY 2017-18
FY 2018-19
FY 2019-20
FY 2020-21
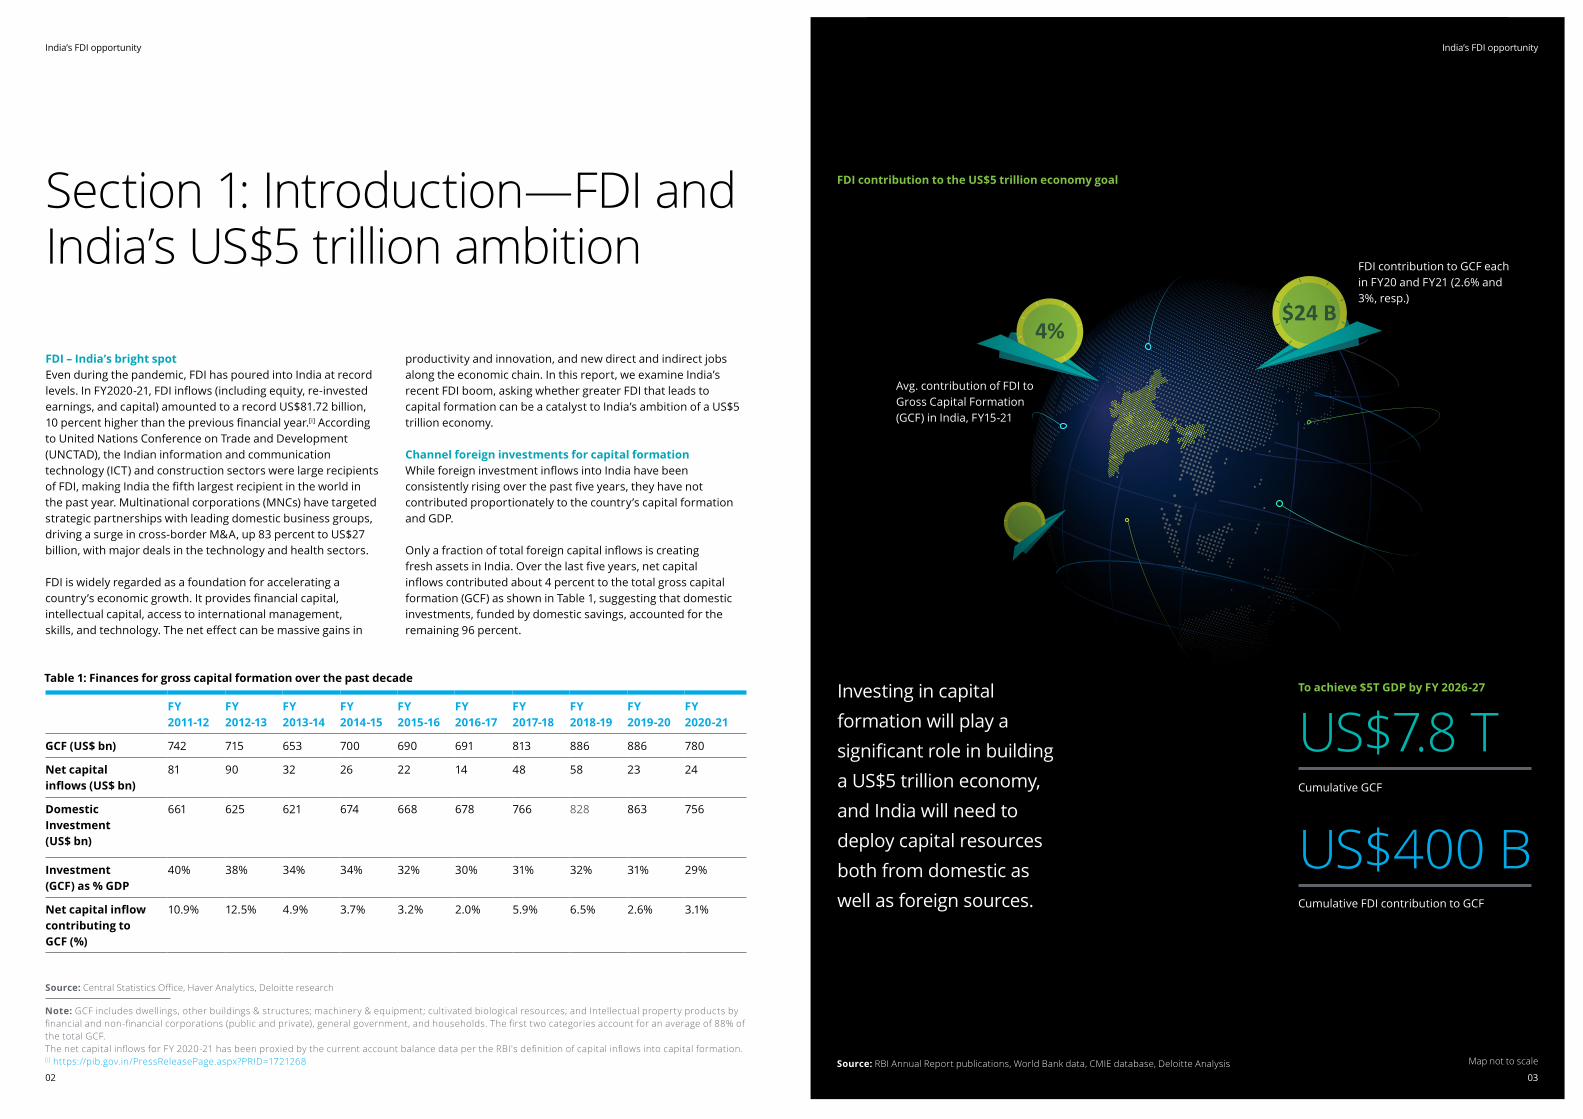
GCF (US$ bn) 742 715 653 700 690 691 813 886 886 780
Net capital inflows (US$ bn)
81 90 32 26 22 14 48 58 23 24
Domestic Investment (US$ bn)
661 625 621 674 668 678 766 828 863 756
Investment (GCF) as % GDP
40% 38% 34% 34% 32% 30% 31% 32% 31% 29%
Net capital inflow contributing to GCF (%)
10.9% 12.5% 4.9% 3.7% 3.2% 2.0% 5.9% 6.5% 2.6% 3.1%
FDI – India’s bright spotEven during the pandemic, FDI has poured into India at record levels. In FY2020-21, FDI inflows (including equity, re-invested earnings, and capital) amounted to a record US$81.72 billion, 10 percent higher than the previous financial year.[i] According to United Nations Conference on Trade and Development (UNCTAD), the Indian information and communication technology (ICT) and construction sectors were large recipients of FDI, making India the fifth largest recipient in the world in the past year. Multinational corporations (MNCs) have targeted strategic partnerships with leading domestic business groups, driving a surge in cross-border M&A, up 83 percent to US$27 billion, with major deals in the technology and health sectors.
FDI is widely regarded as a foundation for accelerating a country’s economic growth. It provides financial capital, intellectual capital, access to international management, skills, and technology. The net effect can be massive gains in
productivity and innovation, and new direct and indirect jobs along the economic chain. In this report, we examine India’s recent FDI boom, asking whether greater FDI that leads to capital formation can be a catalyst to India’s ambition of a US$5 trillion economy.
Channel foreign investments for capital formationWhile foreign investment inflows into India have been consistently rising over the past five years, they have not contributed proportionately to the country’s capital formation and GDP.
Only a fraction of total foreign capital inflows is creating fresh assets in India. Over the last five years, net capital inflows contributed about 4 percent to the total gross capital formation (GCF) as shown in Table 1, suggesting that domestic investments, funded by domestic savings, accounted for the remaining 96 percent.
Source: Central Statistics Office, Haver Analytics, Deloitte research
Source: RBI Annual Report publications, World Bank data, CMIE database, Deloitte Analysis
Note: GCF includes dwellings, other buildings & structures; machinery & equipment; cultivated biological resources; and Intellectual property products by financial and non-financial corporations (public and private), general government, and households. The first two categories account for an average of 88% of the total GCF. The net capital inflows for FY 2020-21 has been proxied by the current account balance data per the RBI's definition of capital inflows into capital formation.[i] https://pib.gov.in/PressReleasePage.aspx?PRID=1721268
Table 1: Finances for gross capital formation over the past decade
03
India’s FDI opportunity
Map not to scale
FDI contribution to the US$5 trillion economy goal
Avg. contribution of FDI to Gross Capital Formation (GCF) in India, FY15-21
FDI contribution to GCF each in FY20 and FY21 (2.6% and 3%, resp.)
Investing in capital formation will play a significant role in building a US$5 trillion economy, and India will need to deploy capital resources both from domestic as well as foreign sources.
To achieve $5T GDP by FY 2026-27
US$7.8 TCumulative GCF
US$400 BCumulative FDI contribution to GCF
India’s FDI opportunity
04
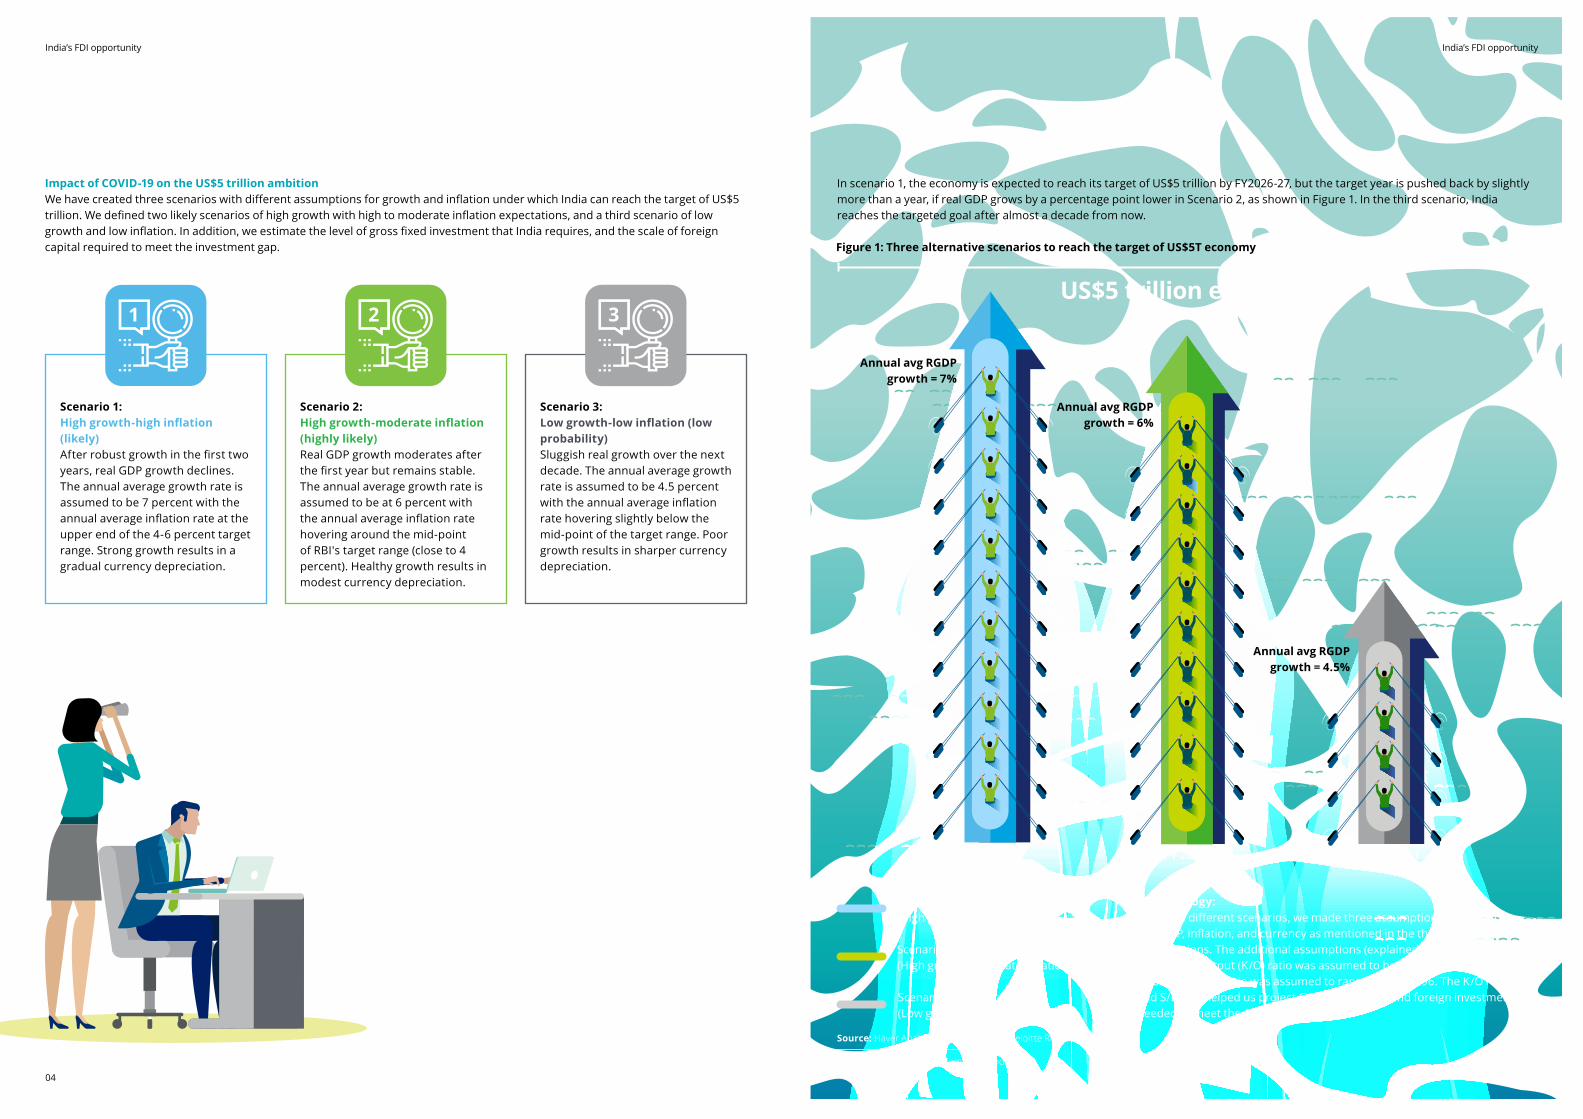
Impact of COVID-19 on the US$5 trillion ambitionWe have created three scenarios with different assumptions for growth and inflation under which India can reach the target of US$5 trillion. We defined two likely scenarios of high growth with high to moderate inflation expectations, and a third scenario of low growth and low inflation. In addition, we estimate the level of gross fixed investment that India requires, and the scale of foreign capital required to meet the investment gap.
Scenario 1:High growth-high inflation (likely)After robust growth in the first two years, real GDP growth declines. The annual average growth rate is assumed to be 7 percent with the annual average inflation rate at the upper end of the 4-6 percent target range. Strong growth results in a gradual currency depreciation.
Scenario 2:High growth-moderate inflation (highly likely)Real GDP growth moderates after the first year but remains stable. The annual average growth rate is assumed to be at 6 percent with the annual average inflation rate hovering around the mid-point of RBI's target range (close to 4 percent). Healthy growth results in modest currency depreciation.
Scenario 3:Low growth-low inflation (low probability)Sluggish real growth over the next decade. The annual average growth rate is assumed to be 4.5 percent with the annual average inflation rate hovering slightly below the mid-point of the target range. Poor growth results in sharper currency depreciation.
In scenario 1, the economy is expected to reach its target of US$5 trillion by FY2026-27, but the target year is pushed back by slightly more than a year, if real GDP grows by a percentage point lower in Scenario 2, as shown in Figure 1. In the third scenario, India reaches the targeted goal after almost a decade from now.
Methodology:For three different scenarios, we made three assumptions related to real GDP, inflation, and currency as mentioned in the three scenarios specifications. The additional assumptions (explained in the text) are: The capital-output (K/O) ratio was assumed to be 0.33 and the savings-investment (S/I) ratio was assumed to range around 0.96. The K/O ratio and S/I ratio helped us project GCF investments and foreign investments needed to meet the GCF investment.
Figure 1: Three alternative scenarios to reach the target of US$5T economy
Scenario 1 - Likely(High growth-high inflation)
Scenario 2 - Hilghly likely(High growth-moderate inflation)
Scenario 3 - Low probability (Low growth-low inflation)
Annual avg RGDP growth = 7%
Annual avg RGDP growth = 4.5%
Annual avg RGDP growth = 6%
FY 2028-29FY 2026-27 FY 2030-31
US$5 trillion economy1 2 3
05
India’s FDI opportunity
Source: Haver Analytics, calculations by Deloitte Research
Note: RGDP - Real gross domestic product
India’s FDI opportunity
07
India’s FDI opportunity
06
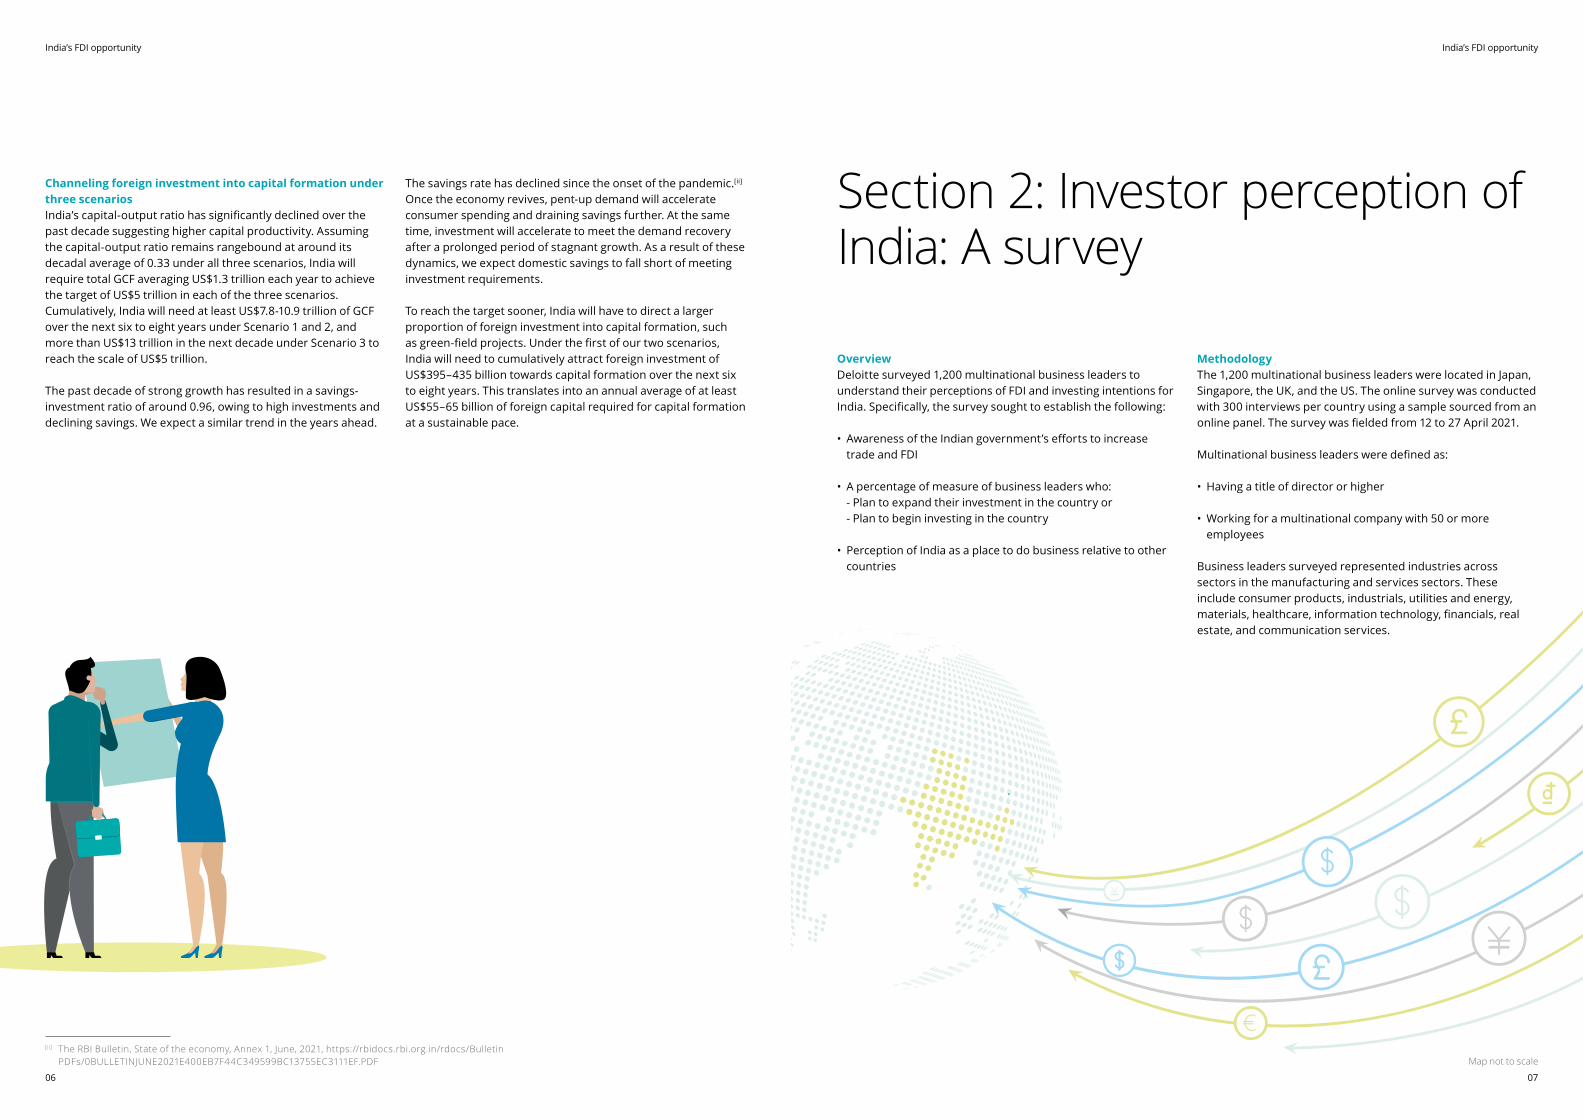
Channeling foreign investment into capital formation under three scenarios India’s capital-output ratio has significantly declined over the past decade suggesting higher capital productivity. Assuming the capital-output ratio remains rangebound at around its decadal average of 0.33 under all three scenarios, India will require total GCF averaging US$1.3 trillion each year to achieve the target of US$5 trillion in each of the three scenarios. Cumulatively, India will need at least US$7.8-10.9 trillion of GCF over the next six to eight years under Scenario 1 and 2, and more than US$13 trillion in the next decade under Scenario 3 to reach the scale of US$5 trillion.
The past decade of strong growth has resulted in a savings-investment ratio of around 0.96, owing to high investments and declining savings. We expect a similar trend in the years ahead.
The savings rate has declined since the onset of the pandemic.[ii] Once the economy revives, pent-up demand will accelerate consumer spending and draining savings further. At the same time, investment will accelerate to meet the demand recovery after a prolonged period of stagnant growth. As a result of these dynamics, we expect domestic savings to fall short of meeting investment requirements.
To reach the target sooner, India will have to direct a larger proportion of foreign investment into capital formation, such as green-field projects. Under the first of our two scenarios, India will need to cumulatively attract foreign investment of US$395–435 billion towards capital formation over the next six to eight years. This translates into an annual average of at least US$55–65 billion of foreign capital required for capital formation at a sustainable pace.
Section 2: Investor perception of India: A survey
OverviewDeloitte surveyed 1,200 multinational business leaders to understand their perceptions of FDI and investing intentions for India. Specifically, the survey sought to establish the following:
• Awareness of the Indian government’s efforts to increase trade and FDI
• A percentage of measure of business leaders who: - Plan to expand their investment in the country or - Plan to begin investing in the country
• Perception of India as a place to do business relative to other countries
MethodologyThe 1,200 multinational business leaders were located in Japan, Singapore, the UK, and the US. The online survey was conducted with 300 interviews per country using a sample sourced from an online panel. The survey was fielded from 12 to 27 April 2021.
Multinational business leaders were defined as:
• Having a title of director or higher
• Working for a multinational company with 50 or more employees
Business leaders surveyed represented industries across sectors in the manufacturing and services sectors. These include consumer products, industrials, utilities and energy, materials, healthcare, information technology, financials, real estate, and communication services.
[ii] The RBI Bulletin, State of the economy, Annex 1, June, 2021, https://rbidocs.rbi.org.in/rdocs/Bulletin PDFs/0BULLETINJUNE2021E400EB7F44C349599BC13755EC3111EF.PDF Map not to scale
India’s FDI opportunity
08
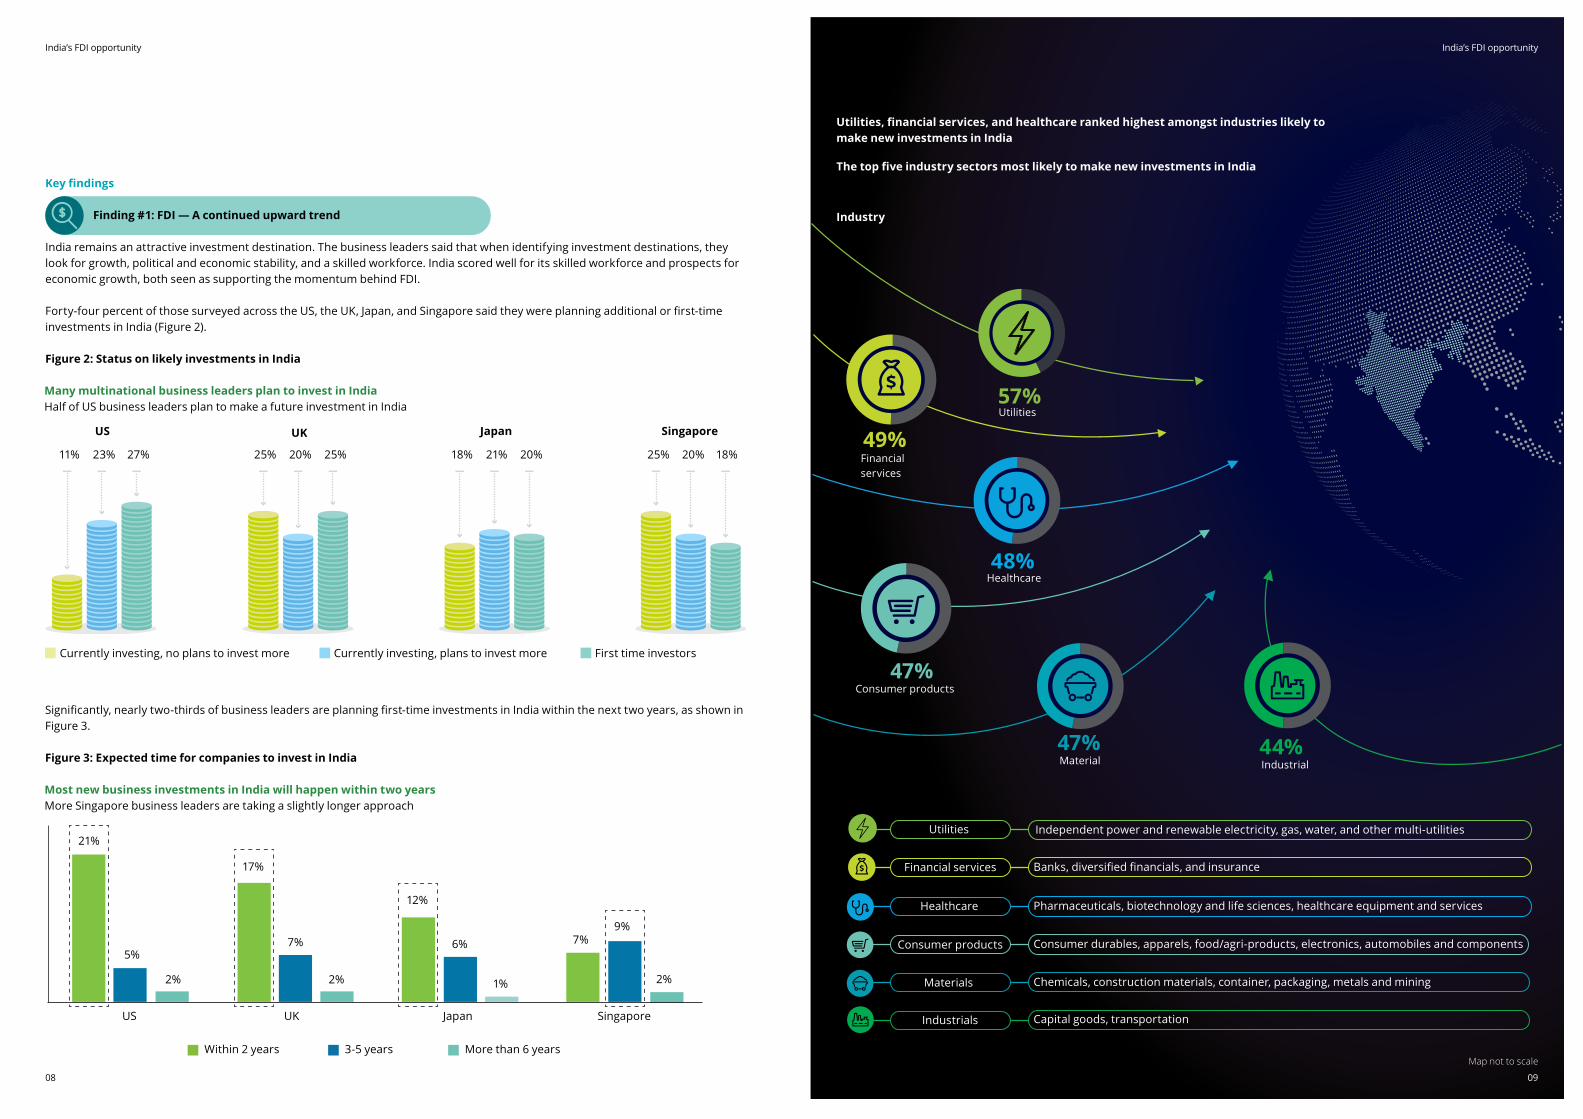
Many multinational business leaders plan to invest in IndiaHalf of US business leaders plan to make a future investment in India
Key findings
Finding #1: FDI — A continued upward trend
India remains an attractive investment destination. The business leaders said that when identifying investment destinations, they look for growth, political and economic stability, and a skilled workforce. India scored well for its skilled workforce and prospects for economic growth, both seen as supporting the momentum behind FDI. Forty-four percent of those surveyed across the US, the UK, Japan, and Singapore said they were planning additional or first-time investments in India (Figure 2).
Figure 2: Status on likely investments in India
US UK Japan Singapore
Within 2 years 3-5 years More than 6 years
Most new business investments in India will happen within two yearsMore Singapore business leaders are taking a slightly longer approach
5%7% 6%
2% 2% 1%
21%
17%
12%
7%9%
2%
Significantly, nearly two-thirds of business leaders are planning first-time investments in India within the next two years, as shown in Figure 3.
Figure 3: Expected time for companies to invest in India
Currently investing, no plans to invest more Currently investing, plans to invest more First time investors
US
11% 25% 18% 25%23% 20% 21% 20%27% 25% 20% 18%
UK SingaporeJapan
The top five industry sectors most likely to make new investments in India
Utilities, financial services, and healthcare ranked highest amongst industries likely to make new investments in India
Industry
Banks, diversified financials, and insurance
Pharmaceuticals, biotechnology and life sciences, healthcare equipment and services
Consumer durables, apparels, food/agri-products, electronics, automobiles and components
Chemicals, construction materials, container, packaging, metals and mining
Capital goods, transportation
Utilities
Financialservices
Healthcare
57%
49%
48%
Consumer products
Material
47%
47%Industrial44%
Utilities
Financial services
Healthcare
Consumer products
Independent power and renewable electricity, gas, water, and other multi-utilities
Materials
Industrials
09
India’s FDI opportunity
Map not to scale

India’s FDI opportunity
11
India’s FDI opportunity
10
Japanese business leaders more interested in India's domestic marketDecision to invest in India by business leaders from the other countries are more evenly divided, with the domestic market having a slight edge over using India as an export hub.
IT (43 percent) and communication services (41 percent) come in marginally below the top five sectors in which investors are most likely to make new investments. Real estate, at 34 percent, was the least popular.
Business leaders from utilities and energy sectors, 35 percent and 27 percent, respectively, along with consumer products at 26 percent and industrials at 25 percent are first-time investors.
Although there is significant crossover, more business leaders, especially those from Japan, are investing in India for access to the home market rather than using India as an export hub. A similar pattern was noticed across industry sectors. This is shown in Figure 4.
Figure 4: Key driver of investing in India
While India remains attractive amongst foreign investors, its perception amongst potential investors needs to be managed and improved.
Overall, India is perceived to be a more challenging environment for MNCs to conduct business, as compared to countries such as China and Vietnam, as shown in Figure 5. More than 50 percent of business leaders, with over 70 percent from Singapore, believe that doing business in India is a challenge.
Figure 5: Perceptions of conducting business in India
Percentage of business leaders who found doing business in India challenging
US - 52%
Japan - 56%
UK - 59%
Singapore - 70%
Conducting business score (Not challenging – challenging ratings)
Finding #2 — Perception a challenge
JapanUK
Singapore
US
Export HubDomestic Market Both
India’s FDI opportunity
13
India’s FDI opportunity
12
Not Challenging (0-5 rating) Challenging (6-10 rating)
Doing Business Score(Not challenging-challenging ratings)
Real Estate (N-36)
Industrials (N-181)
Utilities(N-51)
Information technology
(N-386)
Healthcare(N-100)
Materials(N-167)
Energy(N-95)
Consumer products(N-270)
Financials(N-210)
Communicationservices
(N-71)
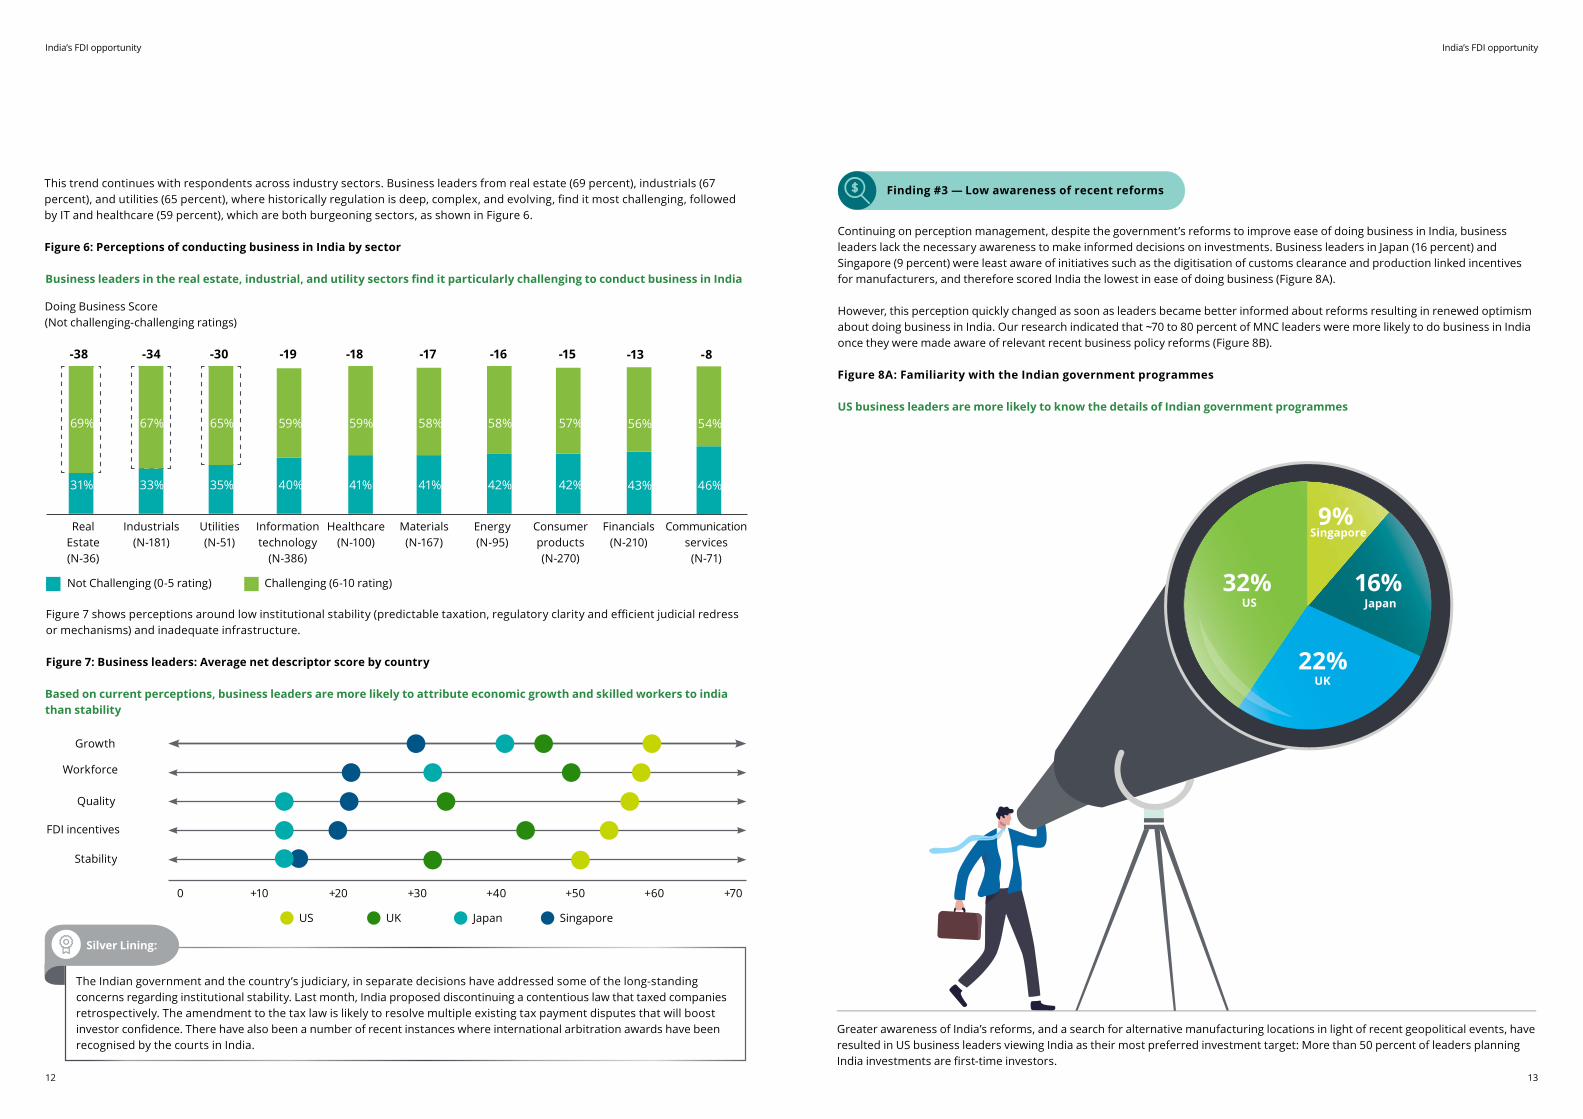
Business leaders in the real estate, industrial, and utility sectors find it particularly challenging to conduct business in India
-38
69%
31%
-34
67%
33%
-30
65%
35%
-19
59%
40%
-18
59%
41%
-17
58%
41%
-16
58%
42%
-15
57%
42%
-13
56%
43%
-8
54%
46%
Based on current perceptions, business leaders are more likely to attribute economic growth and skilled workers to india than stability
Growth
Workforce
Quality
FDI incentives
Stability
US UK Japan Singapore
0 +10 +20 +30 +40 +50 +60 +70
The Indian government and the country’s judiciary, in separate decisions have addressed some of the long-standing concerns regarding institutional stability. Last month, India proposed discontinuing a contentious law that taxed companies retrospectively. The amendment to the tax law is likely to resolve multiple existing tax payment disputes that will boost investor confidence. There have also been a number of recent instances where international arbitration awards have been recognised by the courts in India.
Silver Lining:
Figure 7 shows perceptions around low institutional stability (predictable taxation, regulatory clarity and efficient judicial redress or mechanisms) and inadequate infrastructure.
Figure 7: Business leaders: Average net descriptor score by country
US business leaders are more likely to know the details of Indian government programmes
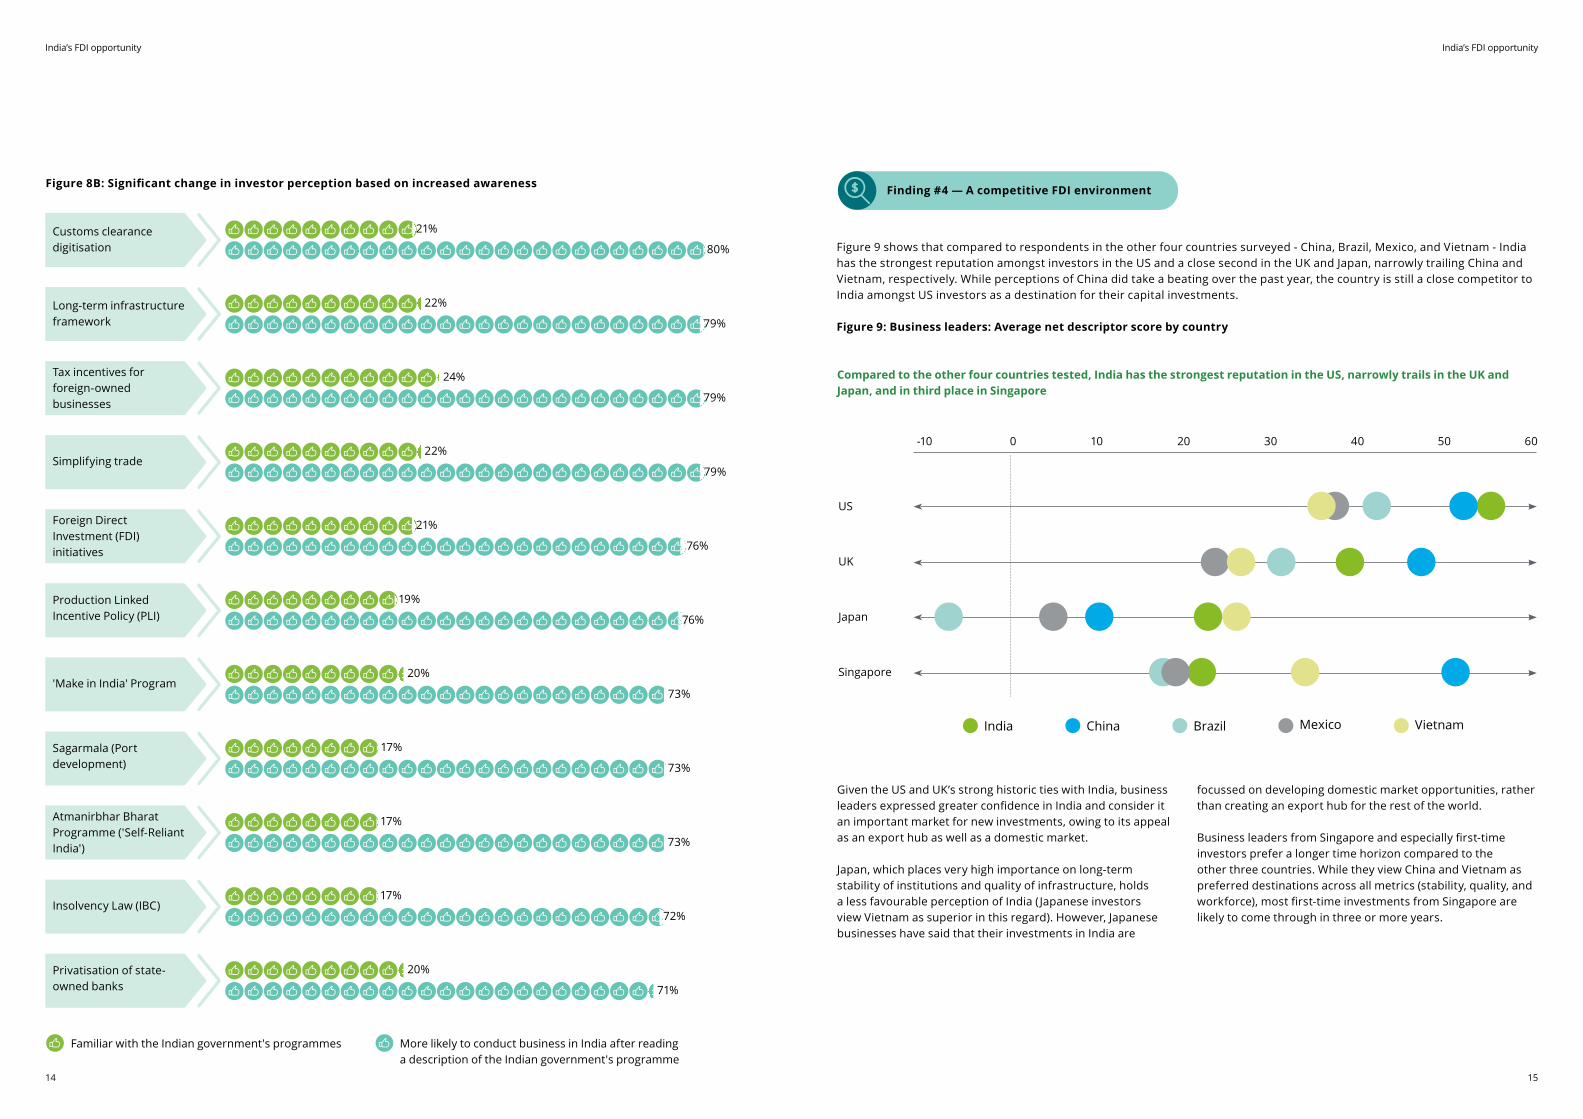
Continuing on perception management, despite the government’s reforms to improve ease of doing business in India, business leaders lack the necessary awareness to make informed decisions on investments. Business leaders in Japan (16 percent) and Singapore (9 percent) were least aware of initiatives such as the digitisation of customs clearance and production linked incentives for manufacturers, and therefore scored India the lowest in ease of doing business (Figure 8A). However, this perception quickly changed as soon as leaders became better informed about reforms resulting in renewed optimism about doing business in India. Our research indicated that ~70 to 80 percent of MNC leaders were more likely to do business in India once they were made aware of relevant recent business policy reforms (Figure 8B).
Figure 8A: Familiarity with the Indian government programmes
32%US
UK
Japan
Singapore
22%
16%
9%
Finding #3 — Low awareness of recent reforms
Greater awareness of India’s reforms, and a search for alternative manufacturing locations in light of recent geopolitical events, have resulted in US business leaders viewing India as their most preferred investment target: More than 50 percent of leaders planning India investments are first-time investors.
This trend continues with respondents across industry sectors. Business leaders from real estate (69 percent), industrials (67 percent), and utilities (65 percent), where historically regulation is deep, complex, and evolving, find it most challenging, followed by IT and healthcare (59 percent), which are both burgeoning sectors, as shown in Figure 6.
Figure 6: Perceptions of conducting business in India by sector
India’s FDI opportunity
15
India’s FDI opportunity
14
Familiar with the Indian government's programmes More likely to conduct business in India after reading a description of the Indian government's programme
Compared to the other four countries tested, India has the strongest reputation in the US, narrowly trails in the UK and Japan, and in third place in Singapore
Figure 8B: Significant change in investor perception based on increased awareness
India China Brazil Mexico Vietnam
-10 0 10 20 30 40 50 60
US
UK
Japan
Singapore
Figure 9 shows that compared to respondents in the other four countries surveyed - China, Brazil, Mexico, and Vietnam - India has the strongest reputation amongst investors in the US and a close second in the UK and Japan, narrowly trailing China and Vietnam, respectively. While perceptions of China did take a beating over the past year, the country is still a close competitor to India amongst US investors as a destination for their capital investments.
Figure 9: Business leaders: Average net descriptor score by country
Given the US and UK’s strong historic ties with India, business leaders expressed greater confidence in India and consider it an important market for new investments, owing to its appeal as an export hub as well as a domestic market.
Japan, which places very high importance on long-term stability of institutions and quality of infrastructure, holds a less favourable perception of India ( Japanese investors view Vietnam as superior in this regard). However, Japanese businesses have said that their investments in India are
focussed on developing domestic market opportunities, rather than creating an export hub for the rest of the world.
Business leaders from Singapore and especially first-time investors prefer a longer time horizon compared to the other three countries. While they view China and Vietnam as preferred destinations across all metrics (stability, quality, and workforce), most first-time investments from Singapore are likely to come through in three or more years.
Finding #4 — A competitive FDI environment
Long-term infrastructure framework
22%
79%
Tax incentives for foreign-owned businesses
24%
79%
Customs clearance digitisation 80%
21%
Simplifying trade22%
79%
Foreign Direct Investment (FDI) initiatives
21%
76%
Production Linked Incentive Policy (PLI)
19%
76%
'Make in India' Program20%
73%
Sagarmala (Port development) 73%
17%
Atmanirbhar Bharat Programme ('Self-Reliant India')
17%
73%
Insolvency Law (IBC)17%
72%
Privatisation of state-owned banks
20%
71%
India’s FDI opportunity
17
India’s FDI opportunity
16
Section 3: Recommendations
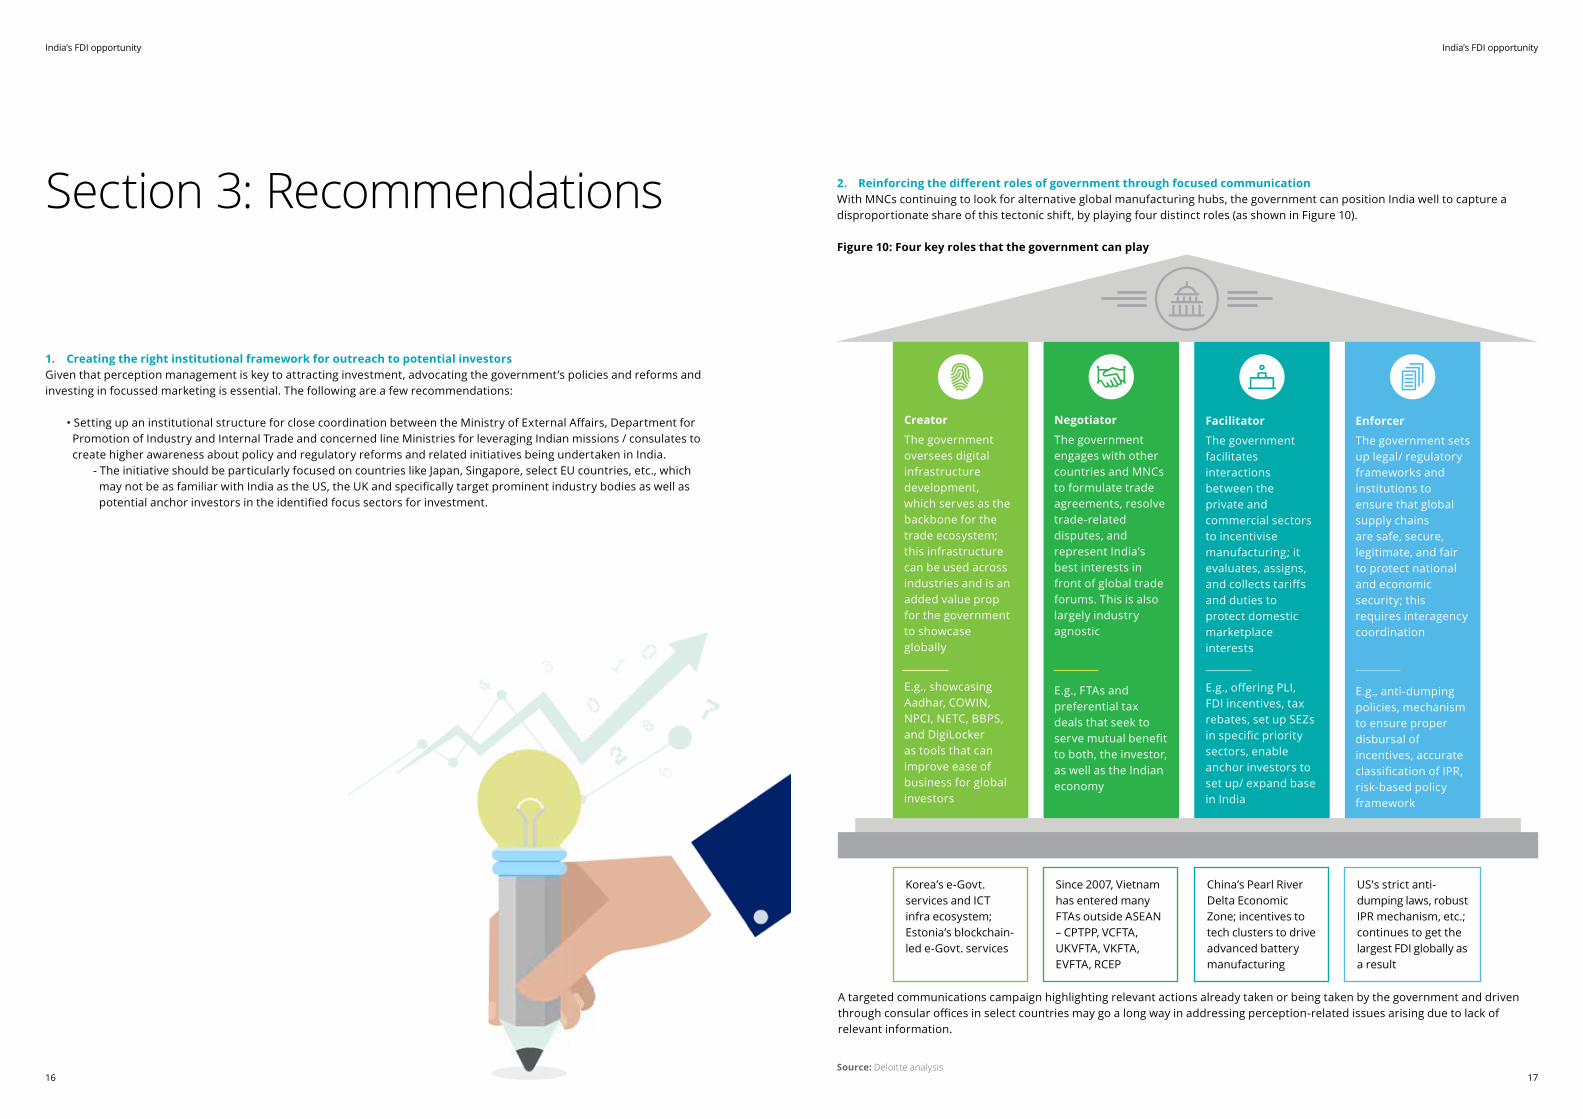
1. Creating the right institutional framework for outreach to potential investors Given that perception management is key to attracting investment, advocating the government’s policies and reforms and investing in focussed marketing is essential. The following are a few recommendations: • Setting up an institutional structure for close coordination between the Ministry of External Affairs, Department for Promotion of Industry and Internal Trade and concerned line Ministries for leveraging Indian missions / consulates to create higher awareness about policy and regulatory reforms and related initiatives being undertaken in India. - The initiative should be particularly focused on countries like Japan, Singapore, select EU countries, etc., which may not be as familiar with India as the US, the UK and specifically target prominent industry bodies as well as potential anchor investors in the identified focus sectors for investment.
Korea’s e-Govt. services and ICT infra ecosystem; Estonia’s blockchain-led e-Govt. services
China’s Pearl River Delta Economic Zone; incentives to tech clusters to drive advanced battery manufacturing
Since 2007, Vietnam has entered many FTAs outside ASEAN – CPTPP, VCFTA, UKVFTA, VKFTA, EVFTA, RCEP
US's strict anti-dumping laws, robust IPR mechanism, etc.; continues to get the largest FDI globally as a result
Creator
The government oversees digital infrastructure development, which serves as the backbone for the trade ecosystem; this infrastructure can be used across industries and is an added value prop for the government to showcase globally
E.g., showcasing Aadhar, COWIN, NPCI, NETC, BBPS, and DigiLocker as tools that can improve ease of business for global investors
Negotiator
The government engages with other countries and MNCs to formulate trade agreements, resolve trade-related disputes, and represent India’s best interests in front of global trade forums. This is also largely industry agnostic
E.g., FTAs and preferential tax deals that seek to serve mutual benefit to both, the investor, as well as the Indian economy
Facilitator
The government facilitates interactions between the private and commercial sectors to incentivise manufacturing; it evaluates, assigns, and collects tariffs and duties to protect domestic marketplace interests
E.g., offering PLI, FDI incentives, tax rebates, set up SEZs in specific priority sectors, enable anchor investors to set up/ expand base in India
Enforcer
The government sets up legal/ regulatory frameworks and institutions to ensure that global supply chains are safe, secure, legitimate, and fair to protect national and economic security; this requires interagency coordination
E.g., anti-dumping policies, mechanism to ensure proper disbursal of incentives, accurate classification of IPR, risk-based policy framework
2. Reinforcing the different roles of government through focused communication With MNCs continuing to look for alternative global manufacturing hubs, the government can position India well to capture a disproportionate share of this tectonic shift, by playing four distinct roles (as shown in Figure 10).
Figure 10: Four key roles that the government can play
A targeted communications campaign highlighting relevant actions already taken or being taken by the government and driven through consular offices in select countries may go a long way in addressing perception-related issues arising due to lack of relevant information.
Source: Deloitte analysis
India’s FDI opportunityIndia’s FDI opportunity
18
Services
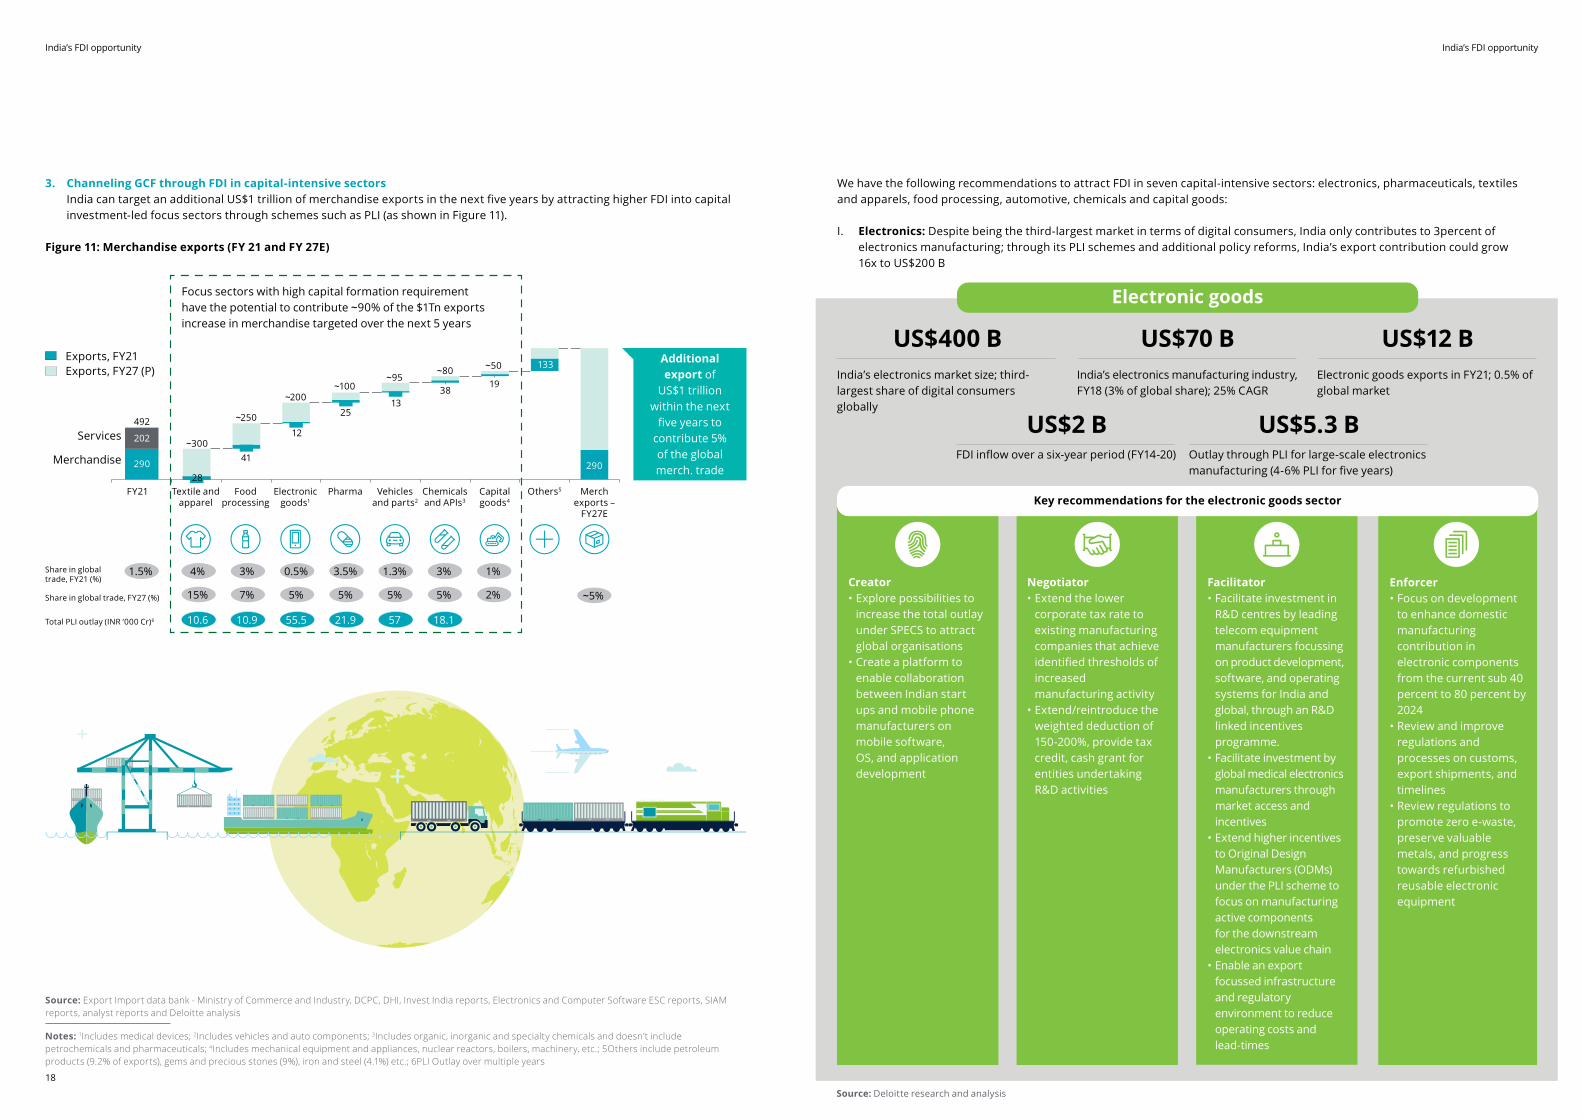
Focus sectors with high capital formation requirement have the potential to contribute ~90% of the $1Tn exports increase in merchandise targeted over the next 5 years
Exports, FY21Exports, FY27 (P)
Merchandise
FY21 Textile and apparel
Food processing
~300
~250
~200~100
~95~80 ~50
1938
1325
12
41
Electronic goods1
Pharma Vehicles and parts2
Chemicals and APIs3
Capital goods4
Others5 Merch exports –
FY27E
Share in global trade, FY21 (%)
Share in global trade, FY27 (%)
Total PLI outlay (INR ‘000 Cr)6
1.5% 4% 3% 0.5% 1.3%
~5%
3% 1%3.5%
10.6 10.9 55.5 57 18.121.9
15% 7% 5% 5% 5% 2%5%
Additional export of
US$1 trillion within the next
five years to contribute 5% of the global merch. trade
28290
202
492
133
290
3. Channeling GCF through FDI in capital-intensive sectors India can target an additional US$1 trillion of merchandise exports in the next five years by attracting higher FDI into capital investment-led focus sectors through schemes such as PLI (as shown in Figure 11).
Figure 11: Merchandise exports (FY 21 and FY 27E)
Electronic goods
Source: Deloitte research and analysis
FDI inflow over a six-year period (FY14-20)
US$2 BOutlay through PLI for large-scale electronics manufacturing (4-6% PLI for five years)
US$5.3 B
India’s electronics market size; third-largest share of digital consumers globally
US$400 BIndia’s electronics manufacturing industry, FY18 (3% of global share); 25% CAGR
US$70 BElectronic goods exports in FY21; 0.5% of global market
US$12 B
Creator• Explore possibilities to increase the total outlay under SPECS to attract global organisations• Create a platform to enable collaboration between Indian start ups and mobile phone manufacturers on mobile software, OS, and application development
Negotiator• Extend the lower corporate tax rate to existing manufacturing companies that achieve identified thresholds of increased manufacturing activity• Extend/reintroduce the weighted deduction of 150-200%, provide tax credit, cash grant for entities undertaking R&D activities
Facilitator• Facilitate investment in R&D centres by leading telecom equipment manufacturers focussing on product development, software, and operating systems for India and global, through an R&D linked incentives programme.• Facilitate investment by global medical electronics manufacturers through market access and incentives • Extend higher incentives to Original Design Manufacturers (ODMs) under the PLI scheme to focus on manufacturing active components for the downstream electronics value chain• Enable an export focussed infrastructure and regulatory environment to reduce operating costs and lead-times
Enforcer• Focus on development to enhance domestic manufacturing contribution in electronic components from the current sub 40 percent to 80 percent by 2024• Review and improve regulations and processes on customs, export shipments, and timelines• Review regulations to promote zero e-waste, preserve valuable metals, and progress towards refurbished reusable electronic equipment
Key recommendations for the electronic goods sector
We have the following recommendations to attract FDI in seven capital-intensive sectors: electronics, pharmaceuticals, textiles and apparels, food processing, automotive, chemicals and capital goods:
I. Electronics: Despite being the third-largest market in terms of digital consumers, India only contributes to 3percent of electronics manufacturing; through its PLI schemes and additional policy reforms, India’s export contribution could grow 16x to US$200 B
Source: Export Import data bank - Ministry of Commerce and Industry, DCPC, DHI, Invest India reports, Electronics and Computer Software ESC reports, SIAM reports, analyst reports and Deloitte analysis
Notes: 1Includes medical devices; 2Includes vehicles and auto components; 3Includes organic, inorganic and specialty chemicals and doesn’t include petrochemicals and pharmaceuticals; 4Includes mechanical equipment and appliances, nuclear reactors, boilers, machinery, etc.; 5Others include petroleum products (9.2% of exports), gems and precious stones (9%), iron and steel (4.1%) etc.; 6PLI Outlay over multiple years
India’s FDI opportunity
21
India’s FDI opportunity
20
Source: Deloitte research and analysis
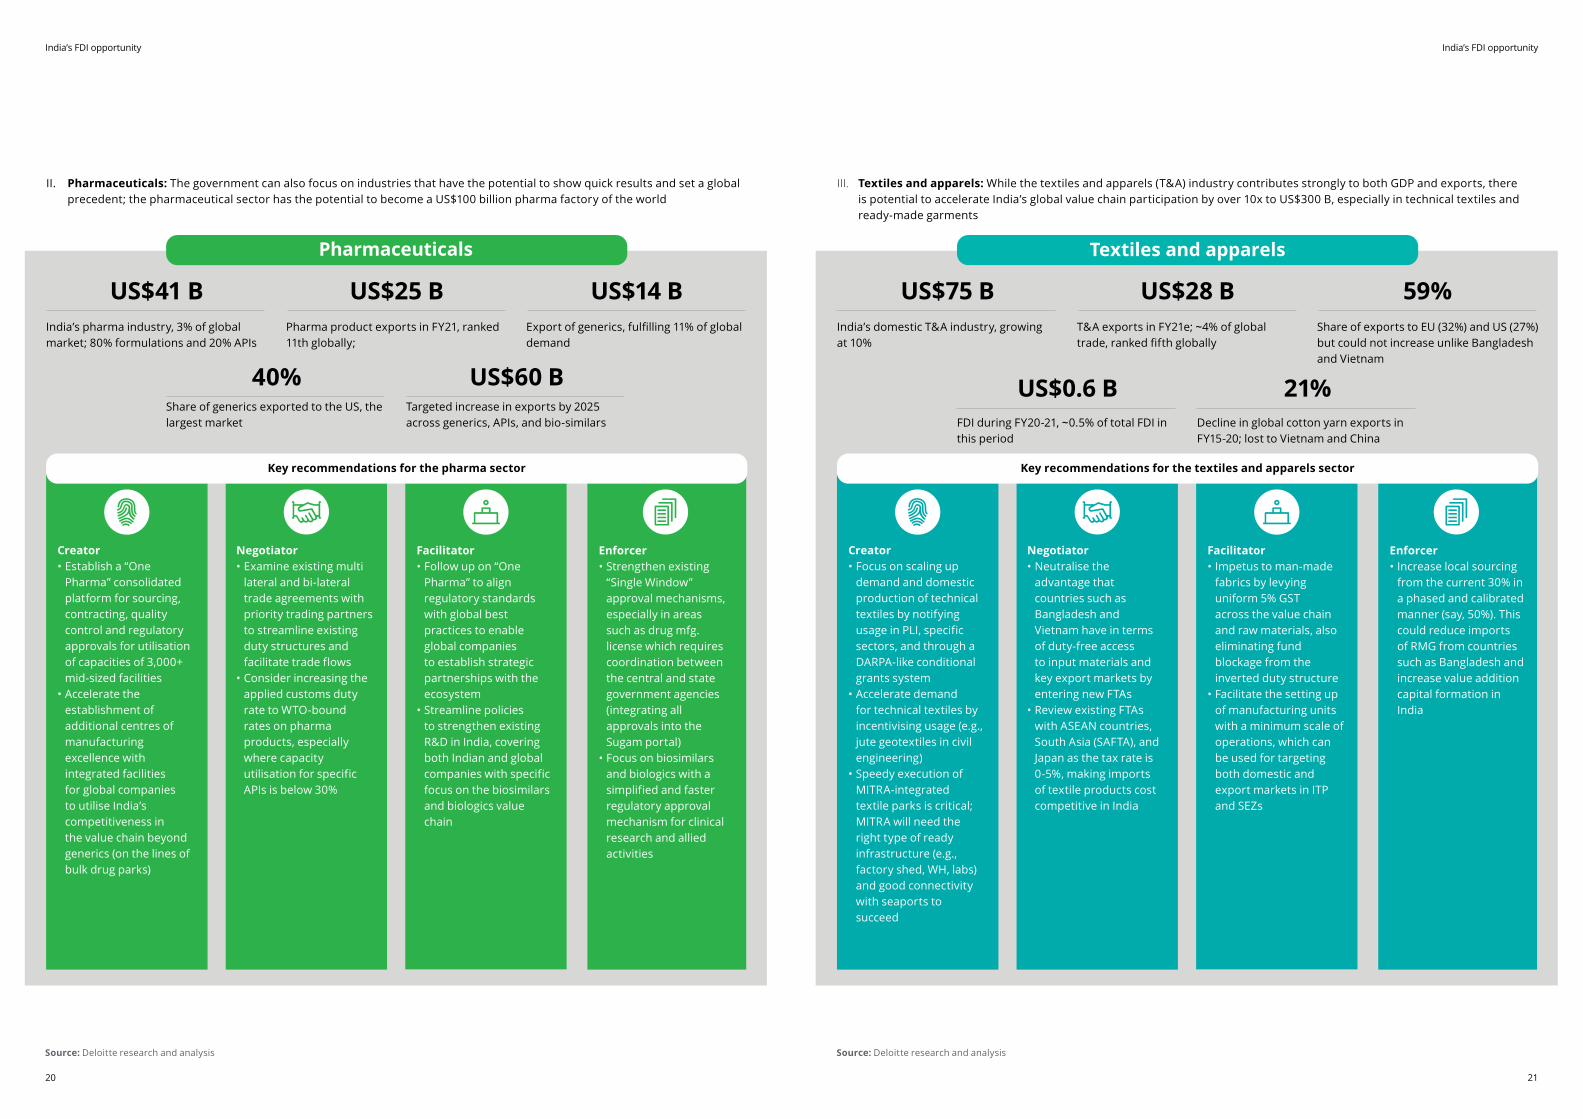
Pharmaceuticals
Share of generics exported to the US, the largest market
40%Targeted increase in exports by 2025 across generics, APIs, and bio-similars
US$60 B
India’s pharma industry, 3% of global market; 80% formulations and 20% APIs
US$41 BPharma product exports in FY21, ranked 11th globally;
US$25 BExport of generics, fulfilling 11% of global demand
US$14 B
Creator• Establish a “One Pharma” consolidated platform for sourcing, contracting, quality control and regulatory approvals for utilisation of capacities of 3,000+ mid-sized facilities• Accelerate the establishment of additional centres of manufacturing excellence with integrated facilities for global companies to utilise India’s competitiveness in the value chain beyond generics (on the lines of bulk drug parks)
Negotiator• Examine existing multi lateral and bi-lateral trade agreements with priority trading partners to streamline existing duty structures and facilitate trade flows• Consider increasing the applied customs duty rate to WTO-bound rates on pharma products, especially where capacity utilisation for specific APIs is below 30%
Facilitator• Follow up on “One Pharma” to align regulatory standards with global best practices to enable global companies to establish strategic partnerships with the ecosystem• Streamline policies to strengthen existing R&D in India, covering both Indian and global companies with specific focus on the biosimilars and biologics value chain
Enforcer• Strengthen existing “Single Window” approval mechanisms, especially in areas such as drug mfg. license which requires coordination between the central and state government agencies (integrating all approvals into the Sugam portal) • Focus on biosimilars and biologics with a simplified and faster regulatory approval mechanism for clinical research and allied activities
Key recommendations for the pharma sector
II. Pharmaceuticals: The government can also focus on industries that have the potential to show quick results and set a global precedent; the pharmaceutical sector has the potential to become a US$100 billion pharma factory of the world
Textiles and apparels
Source: Deloitte research and analysis
FDI during FY20-21, ~0.5% of total FDI in this period
US$0.6 BDecline in global cotton yarn exports in FY15-20; lost to Vietnam and China
21%
India’s domestic T&A industry, growing at 10%
US$75 BT&A exports in FY21e; ~4% of global trade, ranked fifth globally
US$28 BShare of exports to EU (32%) and US (27%) but could not increase unlike Bangladesh and Vietnam
59%
Creator• Focus on scaling up demand and domestic production of technical textiles by notifying usage in PLI, specific sectors, and through a DARPA-like conditional grants system• Accelerate demand for technical textiles by incentivising usage (e.g., jute geotextiles in civil engineering)• Speedy execution of MITRA-integrated textile parks is critical; MITRA will need the right type of ready infrastructure (e.g., factory shed, WH, labs) and good connectivity with seaports to succeed
Negotiator• Neutralise the advantage that countries such as Bangladesh and Vietnam have in terms of duty-free access to input materials and key export markets by entering new FTAs• Review existing FTAs with ASEAN countries, South Asia (SAFTA), and Japan as the tax rate is 0-5%, making imports of textile products cost competitive in India
Facilitator• Impetus to man-made fabrics by levying uniform 5% GST across the value chain and raw materials, also eliminating fund blockage from the inverted duty structure• Facilitate the setting up of manufacturing units with a minimum scale of operations, which can be used for targeting both domestic and export markets in ITP and SEZs
Enforcer• Increase local sourcing from the current 30% in a phased and calibrated manner (say, 50%). This could reduce imports of RMG from countries such as Bangladesh and increase value addition capital formation in India
Key recommendations for the textiles and apparels sector
III. Textiles and apparels: While the textiles and apparels (T&A) industry contributes strongly to both GDP and exports, there is potential to accelerate India’s global value chain participation by over 10x to US$300 B, especially in technical textiles and ready-made garments
India’s FDI opportunity
23
India’s FDI opportunity
22
Source: Deloitte research and analysis Source: Deloitte research and analysis
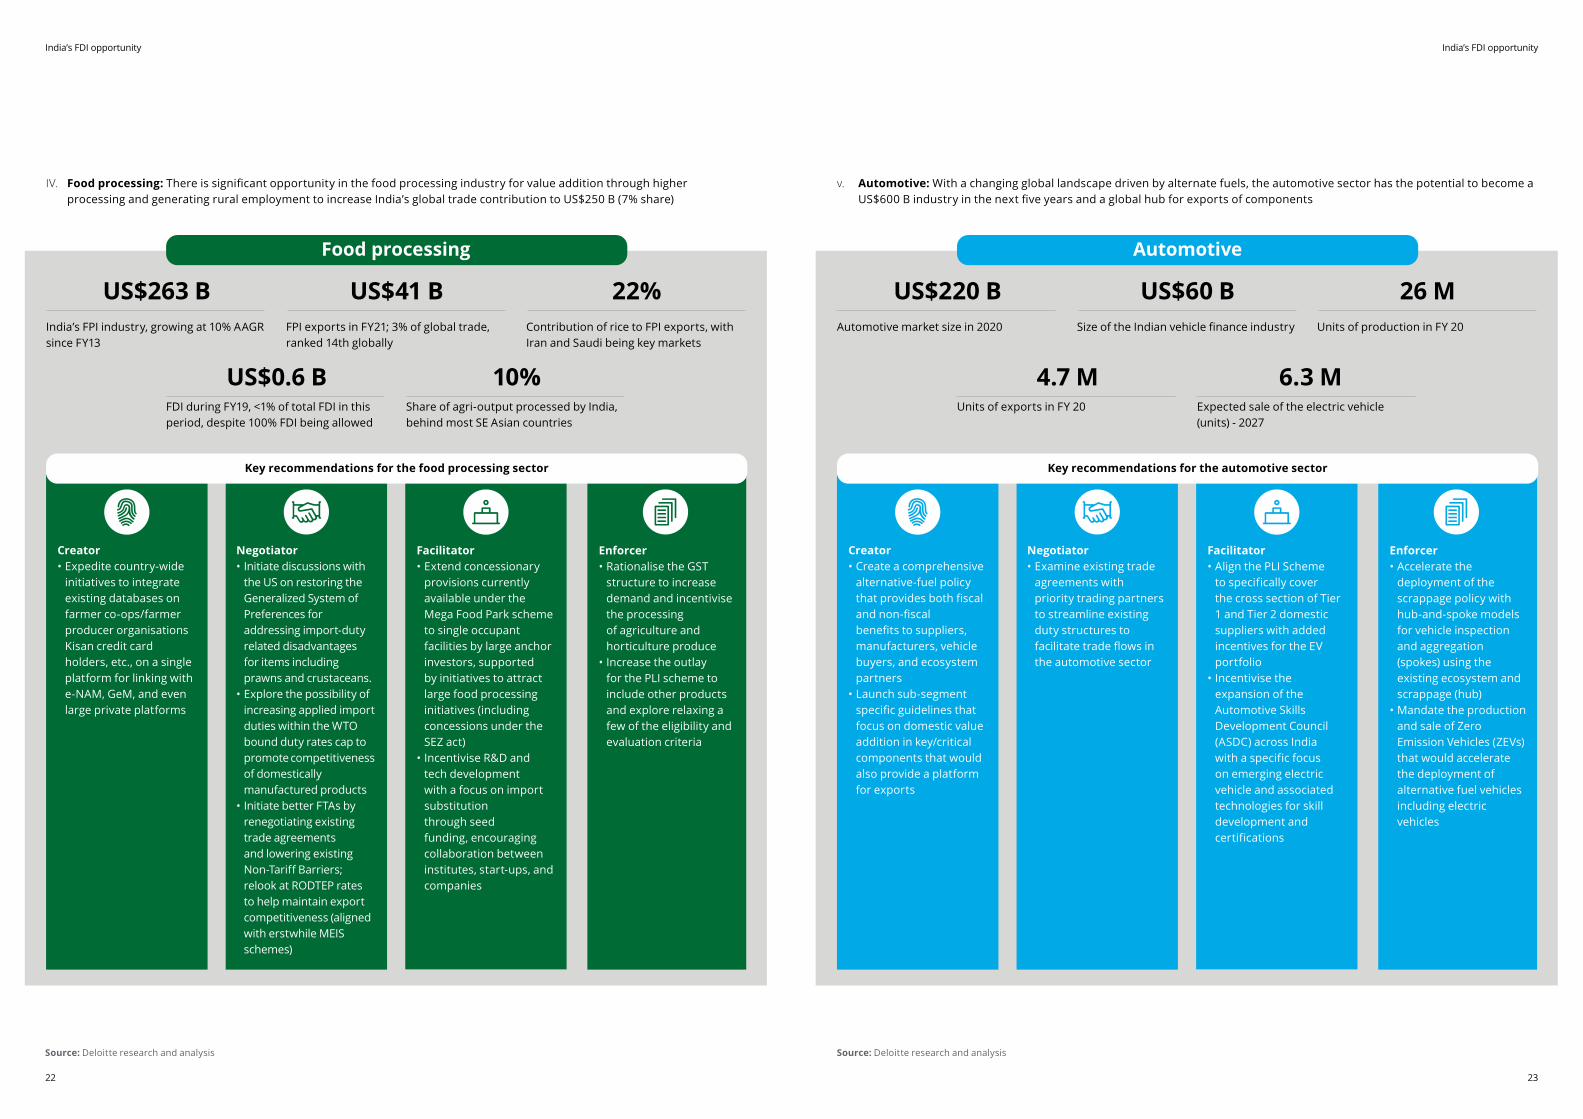
Food processing
FDI during FY19, <1% of total FDI in this period, despite 100% FDI being allowed
US$0.6 BShare of agri-output processed by India, behind most SE Asian countries
10%
India’s FPI industry, growing at 10% AAGR since FY13
US$263 BFPI exports in FY21; 3% of global trade, ranked 14th globally
US$41 BContribution of rice to FPI exports, with Iran and Saudi being key markets
22%
IV. Food processing: There is significant opportunity in the food processing industry for value addition through higher processing and generating rural employment to increase India’s global trade contribution to US$250 B (7% share)
Creator• Expedite country-wide initiatives to integrate existing databases on farmer co-ops/farmer producer organisations Kisan credit card holders, etc., on a single platform for linking with e-NAM, GeM, and even large private platforms
Negotiator• Initiate discussions with the US on restoring the Generalized System of Preferences for addressing import-duty related disadvantages for items including prawns and crustaceans. • Explore the possibility of increasing applied import duties within the WTO bound duty rates cap to promote competitiveness of domestically manufactured products• Initiate better FTAs by renegotiating existing trade agreements and lowering existing Non-Tariff Barriers; relook at RODTEP rates to help maintain export competitiveness (aligned with erstwhile MEIS schemes)
Facilitator• Extend concessionary provisions currently available under the Mega Food Park scheme to single occupant facilities by large anchor investors, supported by initiatives to attract large food processing initiatives (including concessions under the SEZ act)• Incentivise R&D and tech development with a focus on import substitution through seed funding, encouraging collaboration between institutes, start-ups, and companies
Enforcer• Rationalise the GST structure to increase demand and incentivise the processing of agriculture and horticulture produce• Increase the outlay for the PLI scheme to include other products and explore relaxing a few of the eligibility and evaluation criteria
Key recommendations for the food processing sector
Automotive
Units of exports in FY 20
4.7 MExpected sale of the electric vehicle (units) - 2027
6.3 M
Automotive market size in 2020
US$220 BSize of the Indian vehicle finance industry
US$60 BUnits of production in FY 20
26 M
Creator• Create a comprehensive alternative-fuel policy that provides both fiscal and non-fiscal benefits to suppliers, manufacturers, vehicle buyers, and ecosystem partners • Launch sub-segment specific guidelines that focus on domestic value addition in key/critical components that would also provide a platform for exports
Negotiator• Examine existing trade agreements with priority trading partners to streamline existing duty structures to facilitate trade flows in the automotive sector
Facilitator• Align the PLI Scheme to specifically cover the cross section of Tier 1 and Tier 2 domestic suppliers with added incentives for the EV portfolio• Incentivise the expansion of the Automotive Skills Development Council (ASDC) across India with a specific focus on emerging electric vehicle and associated technologies for skill development and certifications
Enforcer• Accelerate the deployment of the scrappage policy with hub-and-spoke models for vehicle inspection and aggregation (spokes) using the existing ecosystem and scrappage (hub) • Mandate the production and sale of Zero Emission Vehicles (ZEVs) that would accelerate the deployment of alternative fuel vehicles including electric vehicles
Key recommendations for the automotive sector
v. Automotive: With a changing global landscape driven by alternate fuels, the automotive sector has the potential to become a US$600 B industry in the next five years and a global hub for exports of components
India’s FDI opportunity
25
India’s FDI opportunity
24
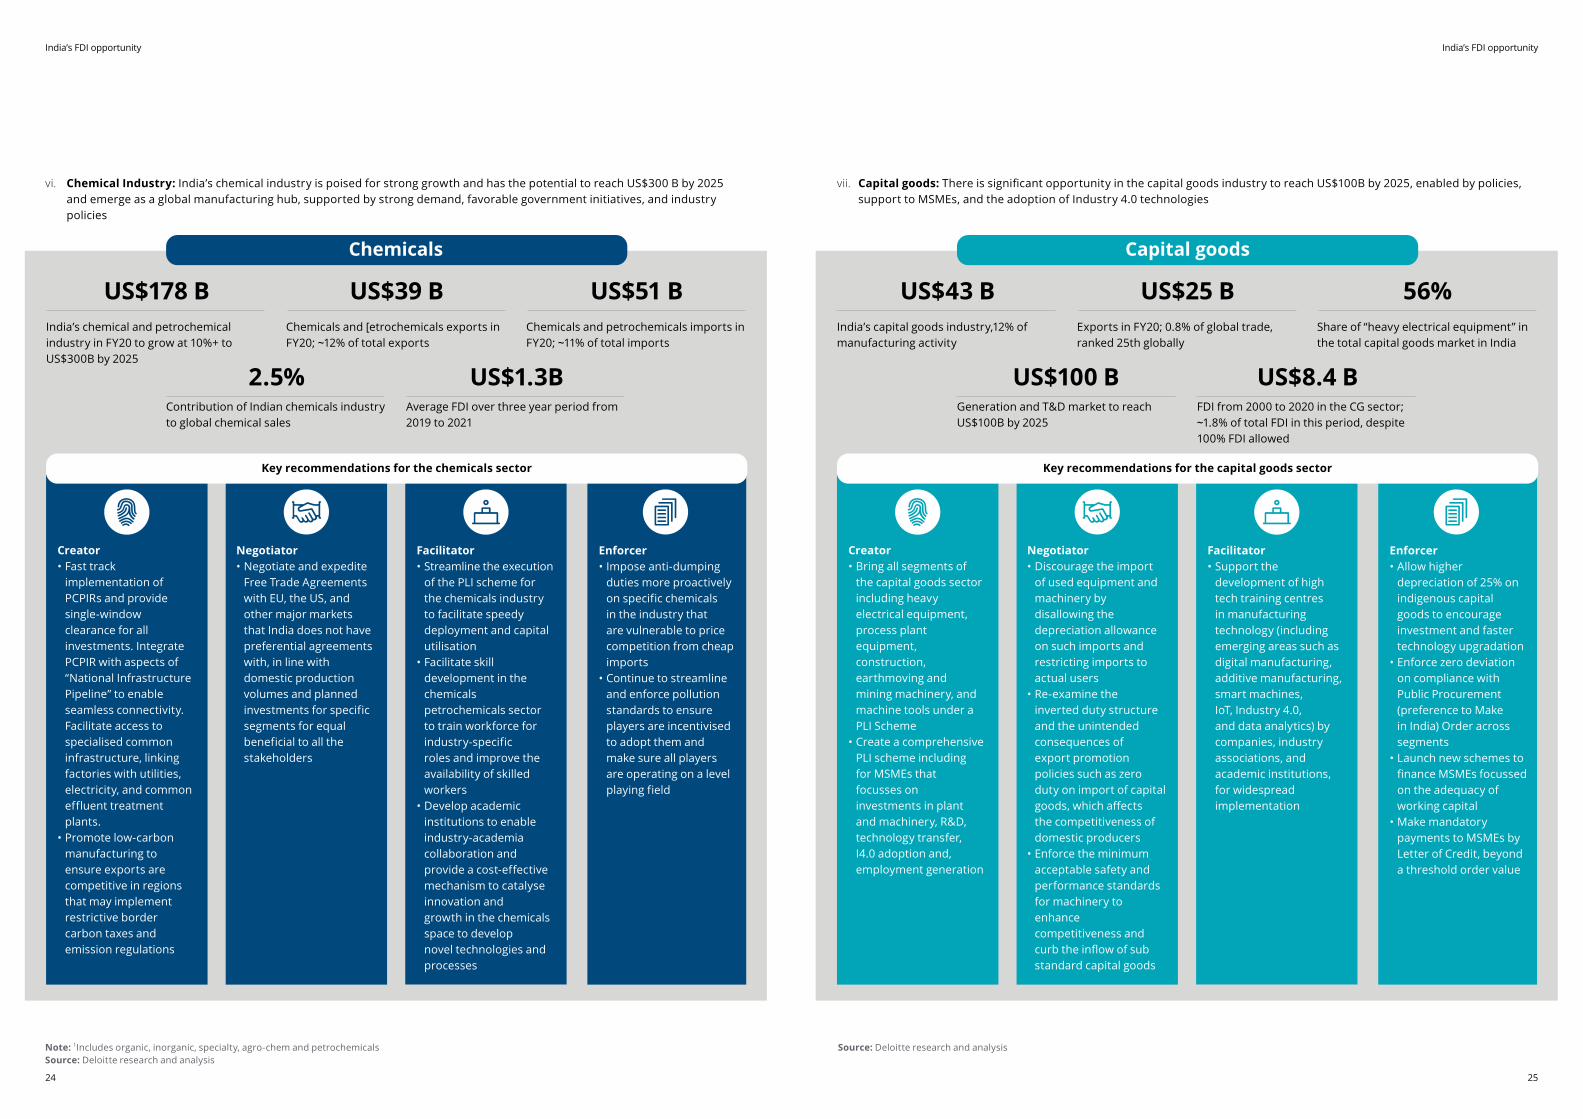
Chemicals
Contribution of Indian chemicals industry to global chemical sales
2.5%Average FDI over three year period from 2019 to 2021
US$1.3B
India’s chemical and petrochemical industry in FY20 to grow at 10%+ to US$300B by 2025
US$178 BChemicals and [etrochemicals exports in FY20; ~12% of total exports
US$39 BChemicals and petrochemicals imports in FY20; ~11% of total imports
US$51 B
Creator• Fast track implementation of PCPIRs and provide single-window clearance for all investments. Integrate PCPIR with aspects of “National Infrastructure Pipeline” to enable seamless connectivity. Facilitate access to specialised common infrastructure, linking factories with utilities, electricity, and common effluent treatment plants.• Promote low-carbon manufacturing to ensure exports are competitive in regions that may implement restrictive border carbon taxes and emission regulations
Negotiator• Negotiate and expedite Free Trade Agreements with EU, the US, and other major markets that India does not have preferential agreements with, in line with domestic production volumes and planned investments for specific segments for equal beneficial to all the stakeholders
Facilitator• Streamline the execution of the PLI scheme for the chemicals industry to facilitate speedy deployment and capital utilisation• Facilitate skill development in the chemicals petrochemicals sector to train workforce for industry-specific roles and improve the availability of skilled workers• Develop academic institutions to enable industry-academia collaboration and provide a cost-effective mechanism to catalyse innovation and growth in the chemicals space to develop novel technologies and processes
Enforcer• Impose anti-dumping duties more proactively on specific chemicals in the industry that are vulnerable to price competition from cheap imports• Continue to streamline and enforce pollution standards to ensure players are incentivised to adopt them and make sure all players are operating on a level playing field
Key recommendations for the chemicals sector
vi. Chemical Industry: India’s chemical industry is poised for strong growth and has the potential to reach US$300 B by 2025 and emerge as a global manufacturing hub, supported by strong demand, favorable government initiatives, and industry policies
Capital goods
Generation and T&D market to reach US$100B by 2025
US$100 BFDI from 2000 to 2020 in the CG sector; ~1.8% of total FDI in this period, despite 100% FDI allowed
US$8.4 B
India’s capital goods industry,12% of manufacturing activity
US$43 BExports in FY20; 0.8% of global trade, ranked 25th globally
US$25 BShare of “heavy electrical equipment” in the total capital goods market in India
56%
Creator• Bring all segments of the capital goods sector including heavy electrical equipment, process plant equipment, construction, earthmoving and mining machinery, and machine tools under a PLI Scheme • Create a comprehensive PLI scheme including for MSMEs that focusses on investments in plant and machinery, R&D, technology transfer, I4.0 adoption and, employment generation
Negotiator• Discourage the import of used equipment and machinery by disallowing the depreciation allowance on such imports and restricting imports to actual users• Re-examine the inverted duty structure and the unintended consequences of export promotion policies such as zero duty on import of capital goods, which affects the competitiveness of domestic producers• Enforce the minimum acceptable safety and performance standards for machinery to enhance competitiveness and curb the inflow of sub standard capital goods
Facilitator• Support the development of high tech training centres in manufacturing technology (including emerging areas such as digital manufacturing, additive manufacturing, smart machines, IoT, Industry 4.0, and data analytics) by companies, industry associations, and academic institutions, for widespread implementation
Enforcer• Allow higher depreciation of 25% on indigenous capital goods to encourage investment and faster technology upgradation• Enforce zero deviation on compliance with Public Procurement (preference to Make in India) Order across segments • Launch new schemes to finance MSMEs focussed on the adequacy of working capital• Make mandatory payments to MSMEs by Letter of Credit, beyond a threshold order value
Key recommendations for the capital goods sector
vii. Capital goods: There is significant opportunity in the capital goods industry to reach US$100B by 2025, enabled by policies, support to MSMEs, and the adoption of Industry 4.0 technologies
Note: 1Includes organic, inorganic, specialty, agro-chem and petrochemicalsSource: Deloitte research and analysis
Source: Deloitte research and analysis
India’s FDI opportunity
27
India’s FDI opportunity
26
[iii] NASSCOM, 2019, Ibid[iv] Rumki Majumdar. 2020. Finding New Frontiers: The Challenges of Early-Stage Indian Entrepreneurs in Accessing Finance in an Evolving Startup Ecosystem. Entrepreneurial Finance in Emerging Markets, Springer Link, pp 193-211 https://link.springer.com/chapter/10.1007/978-3-030-46220-8_13
4. Attracting and diversifying FDI to create larger opportunities
The creation of high-yielding assets and greater capital productivity will spur India’s long-term GDP growth. Attracting FDI enables access to technology and integration with global supply chains and networks. All these create a virtuous circle of larger opportunities, higher asset creation, and improved capital productivity leading to a multiplier effect on income and jobs.
However, India also needs to diversify its sources of foreign capital. Currently, the US and the UK are the most enthusiastic investors in India. Diversifying India’s source of FDI will aid in broad-based networking, accessing varied technology and resources, as well as mitigating geopolitical risks.
5. Nudge FDI to boost the start-up ecosystem Start-ups are creating new markets: they are agile, risk takers; they innovate and understand scale. Start-ups created 60,000 direct jobs and between 130,000 and 180,000 indirect jobs.[iii] They have fanned economic activity in Tier 2 and 3 cities.
Start-ups have been pivotal in e-commerce, fin-tech, food-tech, health-tech, and ed-tech, all digital platforms that have delivered new or ensured continuing services through lockdowns.
Despite their strong recent visibility, most Indian start-ups fail within the first five years. The main reason is debutant entrepreneurs’ struggle to attract seed capital and even monetize ideas.[iv] The government is working towards strengthening the start-up eco-systems for nurturing innovation and creative ideas. The government enabled INR 960 crore of funding to Start-ups benefitting over 4000 start-ups through various schemes. It has also allocated INR 828 Cr sanctioned funds for infrastructure. These measures are in addition to several other supports such as credit guarantees, tax exemptions, amongst others.
That said, India can also use FDI as a means and ways to establish bilateral cooperation with countries that have brought India closer to global investors and use the network to help start-ups tap funds globally, as well as aid in deepening investment and trade ties. While venture capitalists, angel investors, and private equity funds play an important role, the government can target global sources for such funds to supplement domestic funding sources and even bring in expertise and ideas. Israel, France, and Singapore, among others, have been active in supporting start-ups and building out ecosystems of finance and ideas in the country. India could leverage, their culture of entrepreneurship and innovation to buttress India’s start-up growth.
Conclusion
Connect with us
Contributors
To grow into a US$5 trillion economy by FY27, India needs to attract FDI in capital-intensive sectors that add to the country’s gross capital formation; this is particularly important considering India’s declining domestic savings. India’s competitive advantage such as a large and growing domestic market and skilled technical workforce, makes it an unmatched magnet for investors. It is already clear, though, that start-ups, combining innovation and scale, will play a progressively important on India’s journey to a US$5 trillion economy. The government must showcase to the world India’s dazzling potential as an attractive manufacturing destination while also aspiring for a greater share of global investments and trade flows.
S. Anjani KumarPartner,Deloitte Touche Tohmatsu India [email protected] Arindam GuhaPartner,Deloitte Touche Tohmatsu India [email protected]
Dr. Rumki MajumdarRohit VarierAvinash NayakRonak Nagori
Bimal K. ModiPartner,Deloitte Touche Tohmatsu India [email protected] Jehil ThakkarPartner,Deloitte Touche Tohmatsu India [email protected]

India’s FDI opportunity
28
Deloitte refers to one or more of Deloitte Touche Tohmatsu Limited, a UK private company limited by guarantee (“DTTL”), its network of member firms, and their related entities. DTTL and each of its member firms are legally separate and independent entities. DTTL (also referred to as “Deloitte Global”) does not provide services to clients. Please see www.deloitte.com/about for a more detailed description of DTTL and its member firms.
This material is prepared by Deloitte Touche Tohmatsu India LLP (DTTILLP). This material (including any information contained in it) is intended to provide general information on a particular subject(s) and is not an exhaustive treatment of such subject(s) or a substitute to obtaining professional services or advice. This material may contain information sourced from publicly available information or other third party sources. DTTILLP does not independently verify any such sources and is not responsible for any loss whatsoever caused due to reliance placed on information sourced from such sources. None of DTTILLP, Deloitte Touche Tohmatsu Limited, its member firms, or their related entities (collectively, the “Deloitte Network”) is, by means of this material, rendering any kind of investment, legal or other professional advice or services. You should seek specific advice of the relevant professional(s) for these kind of services. This material or information is not intended to be relied upon as the sole basis for any decision which may affect you or your business. Before making any decision or taking any action that might affect your personal finances or business, you should consult a qualified professional adviser.
No entity in the Deloitte Network shall be responsible for any loss whatsoever sustained by any person or entity by reason of access to, use of or reliance on, this material. By using this material or any information contained in it, the user accepts this entire notice and terms of use.
©2021 Deloitte Touche Tohmatsu India LLP. Member of Deloitte Touche Tohmatsu Limited
Related Documents