imagine all the people Indians CITY OF BOSTON Martin J. Walsh Mayor 2016 Indians in Boston “imagine all the people” is a series of publicaons pro- duced by the Boston Redevelopment Authority for the Mayor’s Office of Immigrant Advancement. The series provides a comprehensive profile of Boston’s diverse immigrant communies and their numerous contribu- ons to the city’s social, cultural and economic land- scape. It is part of an ongoing effort to celebrate immi- grants and gain insight into how they shape our city. Photos: South Asia Arts Council

Welcome message from author
This document is posted to help you gain knowledge. Please leave a comment to let me know what you think about it! Share it to your friends and learn new things together.
Transcript

imagine
all the
people In
dian
s
CITY OF BOSTON
Martin J. Walsh
Mayor 2016
Indians in Boston
“imagine all the people” is a series of publications pro-
duced by the Boston Redevelopment Authority for the
Mayor’s Office of Immigrant Advancement. The series
provides a comprehensive profile of Boston’s diverse
immigrant communities and their numerous contribu-
tions to the city’s social, cultural and economic land-
scape. It is part of an ongoing effort to celebrate immi-
grants and gain insight into how they shape our city.
Photos: South Asia Arts Council

2
Source: U.S. Census Bureau, 2014 American Community Survey, PUMS, BRA Research Division
Share of Foreign-Born Indian Population by State
Of the 58,6105 foreign-born Indians residing in Massachusetts, approxi-mately 3,8316 reside in Boston. India is the 9th largest country of origin among Boston’s foreign-born population. Overall, foreign-born Indians in Boston constitute 2.2 percent of the city’s total foreign-born residents.
Boston’s foreign-born Indians are scattered throughout the city, but their largest concentrations are in Dorchester (15 percent), Fenway (11 per-cent), Brighton (10 percent), and the South End (10 percent).7
Migrants from India comprise the third largest foreign-born population in the United States today. Migration from India to the United States dates to the early 19th century when mainly unskilled agricultural workers arrived in Cali-fornia.1 The 1924 National Origins Act curtailed Indian migration, as well as that of many other populations. After implementation of the 1965 Immigra-tion and Nationality Act that prioritized migration based on migrants' skills and family reunification, the number of Indian professionals and students in the United States significantly increased. Unlike earlier Indian migrants, those ar-riving after 1965 were more likely to be younger, come from urban areas, and have higher educational attainment and strong English language skills. Today, Indian nationals receive the majority of H-1B visas for temporary employment in the United States.2
The United States, Canada and the United Kingdom are the leading destina-tions of Indian migration.3 Massachusetts is 13th in its share of the foreign-born Indian population with 3 percent of the almost 2.2 million Indians in the United States.4 States with larger Indian populations are California (20 per-cent), New Jersey (11 percent), Texas (10 percent), and New York (7 percent).

3
Approximately
91% of adult
foreign-born
Indians in Boston
have at least a
Bachelor’s
degree.
Educational Attainment for the Population
25 Years and Older
The U.S. Census Bureau’s ACS Public Use Microdata Sample (PUMS) allows for the detailed socio-economic analysis of specific populations. For smaller populations like foreign-born Indians in Boston, a 5-year sample is required to limit variation due to sampling error. The analysis that follows uses 2009-2013 ACS PUMS data.
Unlike many other foreign-born populations in Boston, the majority of Indi-ans in the city are men— 57 percent of foreign-born Indians are male com-pared to 48 percent of all foreign born. Approximately 42 percent of foreign-born Indians are married and 2 percent are widowed, separated, or divorced. They are a younger population compared to other foreign-born. Slightly less than 67 percent of all foreign-born Indians are between the ages of 20 and 34, and their median age is 27 years. The median age of all foreign born in Boston is 40 years. A greater share of foreign-born Indians in Boston entered the United States after 2000 (58 percent) compared to all foreign born (43 percent). The majority of foreign-born Indians (72 percent) are not natural-ized U.S. citizens.
Foreign-born Indians stand out for their higher levels of educational attain-ment. Approximately 91 percent of foreign-born Indians have completed at least a Bachelor’s degree, compared with 29 percent of the entire foreign born population and 52 percent of the native born. With respect to advanced degrees, 51 percent of foreign-born Indians living in Boston hold a graduate or professional degree, compared with 14 percent of all foreign born and 22 percent of the native born. In addition, 32 percent of the population 21 years or older is enrolled in a graduate or professional school beyond a Bachelor’s degree.
U.S. Census Bureau, 2009-2013 American Community Survey, PUMS, BRA Research Division Analysis

4
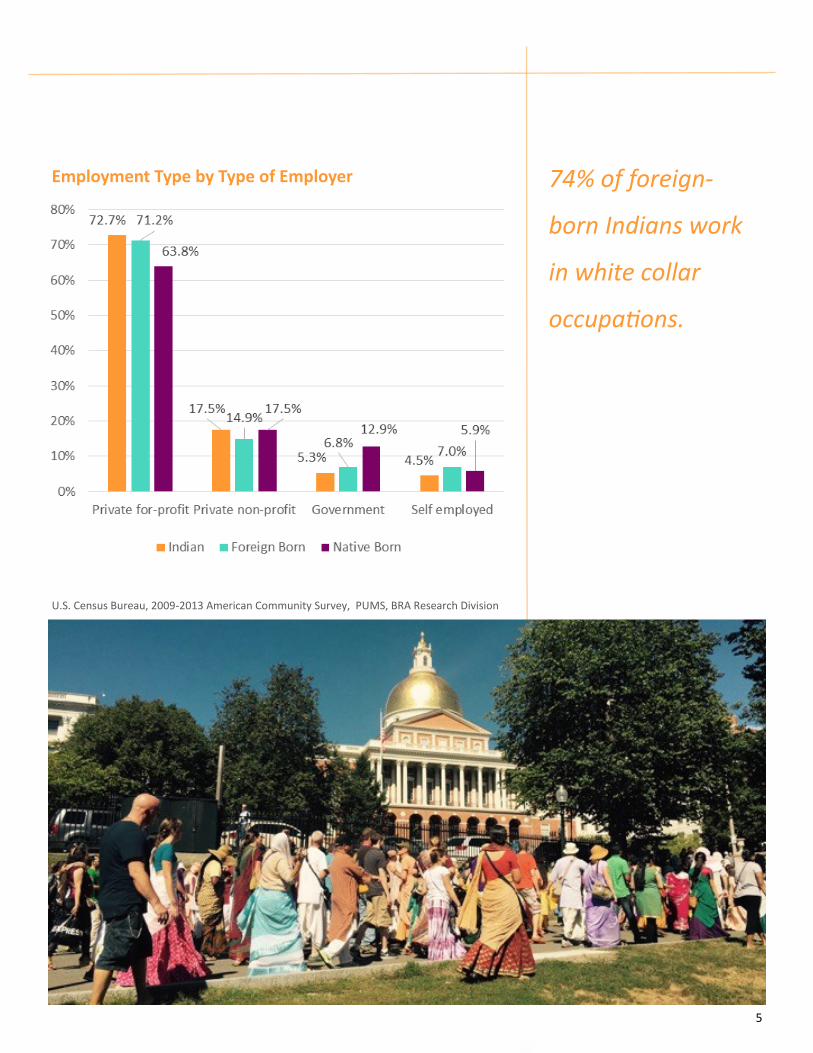
The labor force participation rate of Indians8 is 71 percent compared to 68 percent for all foreign born and 69 percent for the native-born population. With their high levels of educational attainment, the vast majority (74 per-cent) of foreign-born Indians living in Boston are employed in what are considered white-collar occupations.9 The most common occupations are postsecondary teachers, physicians and surgeons, and management ana-lysts. This occupational distribution differs from both the native born and other foreign born who predominately work in service occupations.
The majority (73 percent) of foreign-born Indian workers (excluding unpaid family workers), work for a private for-profit company, 18 percent work for a private non-profit organization, and 5 percent work in the public sector. A smaller share of foreign-born Indians are self-employed (4.5 percent) than the native born and all foreign born.
Occupations by Nativity
U.S. Census Bureau, 2009-2013 American Community Survey, PUMS, BRA Research Division Analysis
Labor Force Participation
5
74% of foreign-
born Indians work
in white collar
occupations.
Employment Type by Type of Employer
U.S. Census Bureau, 2009-2013 American Community Survey, PUMS, BRA Research Division

6
Gender
Marital Status
Source: U.S. Census Bureau, 2009-2013 American Community Survey, PUMS, BRA Research Division Analysis
Imagine all the people: Indians
Age

7
Medical Uninsurance
Housing Tenure*
Housing Costs*
*Housing data are based on the nativity of the house holder.

8
9
Collectively,
foreign-born
Indians
contributed
close to $82
million to the
regional
economy in
2014.
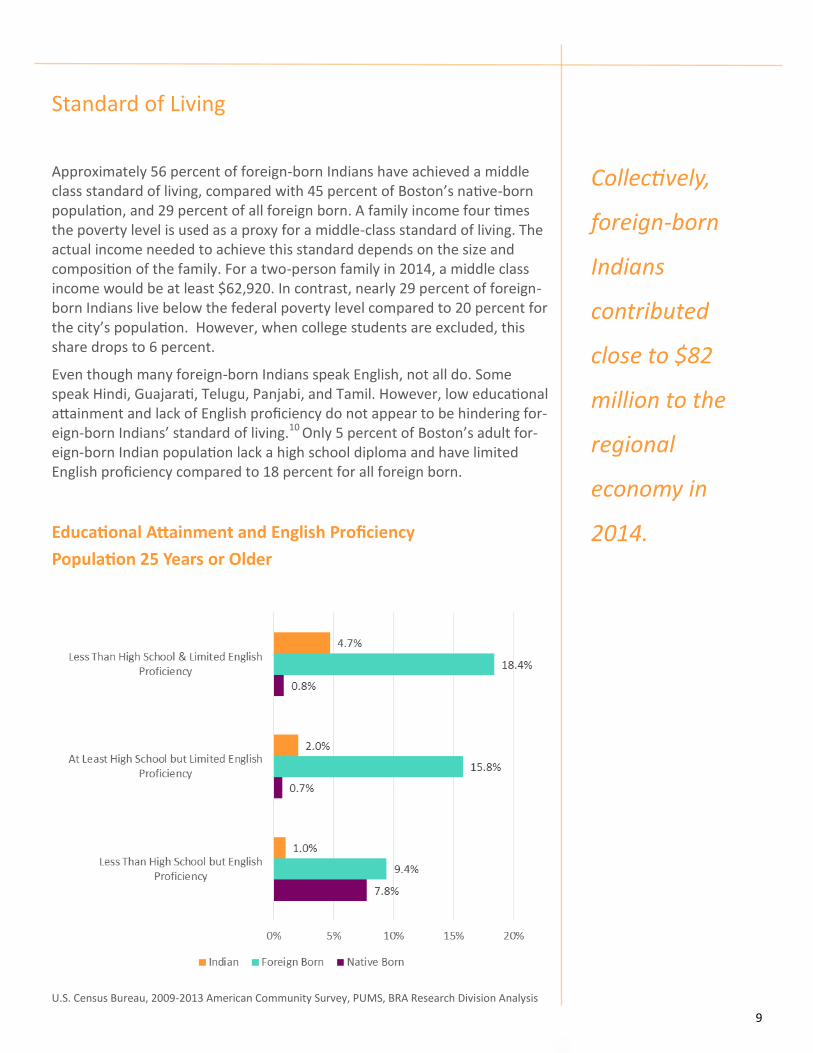
Approximately 56 percent of foreign-born Indians have achieved a middle class standard of living, compared with 45 percent of Boston’s native-born population, and 29 percent of all foreign born. A family income four times the poverty level is used as a proxy for a middle-class standard of living. The actual income needed to achieve this standard depends on the size and composition of the family. For a two-person family in 2014, a middle class income would be at least $62,920. In contrast, nearly 29 percent of foreign-born Indians live below the federal poverty level compared to 20 percent for the city’s population. However, when college students are excluded, this share drops to 6 percent.
Even though many foreign-born Indians speak English, not all do. Some speak Hindi, Guajarati, Telugu, Panjabi, and Tamil. However, low educational attainment and lack of English proficiency do not appear to be hindering for-eign-born Indians’ standard of living.10 Only 5 percent of Boston’s adult for-eign-born Indian population lack a high school diploma and have limited English proficiency compared to 18 percent for all foreign born.
Educational Attainment and English Proficiency
Population 25 Years or Older
Standard of Living
U.S. Census Bureau, 2009-2013 American Community Survey, PUMS, BRA Research Division Analysis

10
Economic Impact
Foreign-born Indians contribute to the local economy through their labor and consumer spending. The total value of their economic contributions was estimated using a Regional Economic Model (REMI) that calculated the value of goods and services consumed on each dollar spent. Foreign-born Indians in Boston generated total expenditures of nearly $138 million in 2014.11 These annual expenditures contributed slightly less than $82 million to the regional product and generated $3.6 million in state and local taxes.12 In to-tal, these expenditures supported 597 jobs in the Massachusetts economy.13
Conclusion
Foreign-born Indians actively contribute to the economic, cultural, and civic life of the city. Compared to other foreign-born populations in Boston, a greater share of their population are men and are much younger in age. They stand out for their greater levels of educational attainment and work in white collar occupations. Even with their higher levels of educational attainment, many are enrolled in graduate and professional school schools. Because foreign-born Indians rely on H-1B visas at higher rates than other populations, changes in their residency are directly related to U.S. immigra-tion policy.
Indian Restaurant in Kenmore Square

11
1Zong, J. and Batalova, J., Indian Immigrants in the United States. Migration Poli-cy Institute 2015. 2Indian Diaspora in the United States. Migration Policy Institute 2014. 3Naujoks, D., Emigration, Immigration, and Diaspora Relations in India. Migration Policy Institute 2009. 4American Factfinder website Table B05006 reports 2,205,912 Indians residing in the United States with a margin of error of +/- 40,446 in 2014. The 2,181,604 foreign-born Indians used in this analysis are estimated from U.S. Census Bureau Public Use Microdata Sample data. Both estimates contain a margin of error due to sampling methodology. For more information on American Fact Finder please see: http://factfinder.census.gov/home/saff/main.html?_lang=en. 5American Factfinder website Table B05006 reports 57,930 Indians in Massachu-setts with a margin of error of +/- 4,078 in 2014. U.S. Census Bureau Public Use Microdata Sample data estimates 58,610 Indians. Both estimates contain a mar-gin of error due to sampling methodology. Lower survey response rates due to documentation issues may result in an undercount of the population. 6American Factfinder website Table B05006 reports 3,617 Indians in Boston with a margin of error of +/- 1,300 in 2014. The 2014 U.S. Census Bureau Public Use Microdata Sample data estimates 3,831 foreign-born Indians for Boston. Both estimates contain a margin of error due to sampling methodology. 72009-2013 American Community Survey, American Factfinder, BRA Research Analysis. 8Defined as the share of the working-age population that is either currently em-ployed or seeking work. U.S. Department of Labor, Bureau of Labor Statistics. (2016).
9For a smaller population like foreign-born Indians in Boston, occupations fall into three broad categories. White collar includes managerial & professional, health care, education, and arts, design entertainment, sports & media occupa-tions. Service includes service, sales, office & administrative support, community & social service occupations. Blue collar includes construction, farming, fishing, and forestry, and production occupations. Military specific occupations and long-term unemployed are excluded from the analysis. 10The Limited English Proficient includes immigrant adults who do not speak Eng-lish at all or who do not speak it well.
11 BRA Research Division Analysis, 2014, Regional Economic Model, Inc., REMI calculations.
12BRA Research Division Analysis, 2014, Regional Economic Model, Inc., REMI calculations. 13BRA Research Division Analysis, 2014, Regional Economic Model, Inc., REMI calculations.

12
Produced by the BRA Research Division
Alvaro Lima, Director of Research
Jonathan Lee– Deputy Director
Christina Kim – Research Manager
Phillip Granberry – Senior Researcher/Demographer
Matthew Resseger – Senior Researcher/Economist
Kevin Kang – Research Associate
Kevin Wandrei – Research Assistant
Interns:
Michael Bratsis
Cyan O’Garro
Jingwan Wang
Map by BRA Digital Cartography & GIS Alla Ziskin
Brian P. Golden, Director
Related Documents