Review of Income and Wealth Series 35, Number 2, June 1989 INCOME DISTRIBUTION AND REDISTRIBUTION: A MICRODATA ANALYSIS FOR SEVEN COUNTRIES Frice Waterhouse, London Technical Director, CEPS, Luxembourg Principal Consultant, Logica SA, Luxembourg This paper reports the detailed results of a comparison of the distribution and redistribution of income in seven countries using the Luxembourg Income Study (LIS) database. Use of LIS facilitates comparisons of inequality in respect to similarly-defined variables, permits methodological alternatives to be used, and allows the countries to be compared on aspects of income ranking and policy equity in ways not otherwise possible. The results indicate a pattern of inequality in which Sweden is the most equal, followed by Norway, the U.K. and Canada, while among the less equal countries Israel is generally more equal than Germany-or the USA., whose relative inequality depends on the measure chosen. Use of the LIS database also allows a more detailed explanation of these results, noting, for example, the role of cash benefits in increasing equality in Sweden and the U.K., and in aiding the bottom quintile in Germany; and the important part played by self-employment income in contributing to the high top quintile shares in Germany and Israel, and in rendering the Norwegian distribution less equal than that of its Scandinavian neighbour. The wealth of the database, however, means that methodological issues need to be treated both more explicitly and more carefully than is possible with more restrictive data. To interpret the data also requires a considerable degree of knowledge about the institutional features of tax and social provisions in each country, so that an income microdatabase could usefully be completed by one focused on the details of such provisions. Most comparisons of the distribution and redistribution of income across countries have had to rely on using published data, a procedure which has a range of readily apparent weaknesses. Such data are presented in groups which may vary from country to country, and may differ from the groupings which might be desired by any particular researcher. Their choice of income concept Note 1: Helpful comments on earlier drafts of this paper were received from Sheldon Danziger, Stephen Jenkins, Gail Oja and Edward Wolff, from LIS colleagues, and during presentations at the Institute for Research on Poverty, Madison, Wisconsin, and the Dept. of Economics, New York University. Note 2: O'Higgins is a Managing Consultant with Price Waterhouse, London, seconded to the Social Affairs Division of the OECD, Paris, during 1987/1988. Much of his work on LIS was carried out while he was a Reader in Social Policy at the University of Bath, England, and during periods as a Visiting Scholar in the Dept. of Sociology, Harvard University and as a Visiting Fellow in the Social Justice Project at the Australian National University, Canberra. Neither current nor past employers or hosts bear any responsibility for any views expressed here.

Welcome message from author
This document is posted to help you gain knowledge. Please leave a comment to let me know what you think about it! Share it to your friends and learn new things together.
Transcript

Review of Income and Wealth Series 35, Number 2, June 1989
INCOME DISTRIBUTION AND REDISTRIBUTION:
A MICRODATA ANALYSIS FOR SEVEN COUNTRIES
Frice Waterhouse, London
Technical Director, CEPS, Luxembourg
Principal Consultant, Logica SA, Luxembourg
This paper reports the detailed results of a comparison of the distribution and redistribution of income in seven countries using the Luxembourg Income Study (LIS) database. Use of LIS facilitates comparisons of inequality in respect to similarly-defined variables, permits methodological alternatives to be used, and allows the countries to be compared on aspects of income ranking and policy equity in ways not otherwise possible.
The results indicate a pattern of inequality in which Sweden is the most equal, followed by Norway, the U.K. and Canada, while among the less equal countries Israel is generally more equal than Germany-or the USA., whose relative inequality depends on the measure chosen. Use of the LIS database also allows a more detailed explanation of these results, noting, for example, the role of cash benefits in increasing equality in Sweden and the U.K., and in aiding the bottom quintile in Germany; and the important part played by self-employment income in contributing to the high top quintile shares in Germany and Israel, and in rendering the Norwegian distribution less equal than that of its Scandinavian neighbour.
The wealth of the database, however, means that methodological issues need to be treated both more explicitly and more carefully than is possible with more restrictive data. To interpret the data also requires a considerable degree of knowledge about the institutional features of tax and social provisions in each country, so that an income microdatabase could usefully be completed by one focused on the details of such provisions.
Most comparisons of the distribution and redistribution of income across countries have had to rely on using published data, a procedure which has a range of readily apparent weaknesses. Such data are presented in groups which may vary from country to country, and may differ from the groupings which might be desired by any particular researcher. Their choice of income concept
Note 1 : Helpful comments on earlier drafts of this paper were received from Sheldon Danziger, Stephen Jenkins, Gail Oja and Edward Wolff, from LIS colleagues, and during presentations at the Institute for Research on Poverty, Madison, Wisconsin, and the Dept. of Economics, New York University.
Note 2: O'Higgins is a Managing Consultant with Price Waterhouse, London, seconded to the Social Affairs Division of the OECD, Paris, during 1987/1988. Much of his work on LIS was carried out while he was a Reader in Social Policy at the University of Bath, England, and during periods as a Visiting Scholar in the Dept. of Sociology, Harvard University and as a Visiting Fellow in the Social Justice Project at the Australian National University, Canberra. Neither current nor past employers or hosts bear any responsibility for any views expressed here.
and of income unit may be similarly variable and unsuitable, and the issues of how to rank incomes and how to weight both income and the income unit are rarely mentioned. The restrictions imposed by pre-structured data both distort empirical comparisons and render almost futile (and, therefore, often neglected) any methodological discussion. At best, methodological issues tend to be raised as apologetic caveats rather than in the context of analytical choices.
The effects of these weaknesses may be illustrated by outlining some of the limitations imposed by available data on the much-quoted OECD study carried out by Sawyer (1976). According .to his account, Sawyer had to derive pre-tax data for Canada, Germany and Sweden by adding the average amount of tax paid within income classes to post-tax data. Similarly he had to derive post-tax data for France, Japan, the United Kingdom and the United States by deducting average tax payments from pre-tax data procedures in which, as he acknowledges, "inequality tends to be underestimated since households have not been (re)ranked by the derived income concept" (1976, p. 12). This procedure also means that the income variation within income classes is not captured in summary measures of inequality.
Furthermore, in his data for some countries (such as Norway), certain taxes deducted at source (e.g. employee social security contributions) were not included in the pre-tax income concept, so that the data actually represented an intermedi- ate income stage between the pre- and post-tax concepts. In addition, "many of the estimates are subject to . . . error arising from interpolation" (1976, p. 12) since the published data had to be rearranged, for example, from fixed-interval income classes, in order to be presented in the common form of decile shares.
Finally, it may be noted that while Sawyer attempts to take account of the impact of differences in household size and composition on the distribution of economic welfare, his transformations are apparently based on adjustments within pre-structured income classes' and, although he comments on the impact of such transformations on the identity of the people in the various deciles, no informa- tion, apart from a slight Swedish example, is actually given on the identities of those in the various deciles after such transformations-presumably because the data could not be reordered to permit this.
More recently, as microdata have become available, some international comparisons have involved individual researchers in different countries trying to derive comparable concepts from their own microdata sets. On the basis of such separately gathered data, joint analyses have been carried out (see, for example, Smolensky, Pommerehne and Dalrymple, 1979; Ruggles and O'Higgins, 1981 and O'Higgins and Ruggles, 1981).
The Luxembourg Income Study (LIS) moves beyond either of these approaches by gathering sets of microdata for different countries, and reorganizing these data so that they conform to certain common standards, concepts and structures. This does not, of course, mean that every item in every tape is rendered comparable; it does mean that if LIS variable X exists on the tape for country A, it should be comparable to variable X on any other country tape. While it is not possible to create a complete set of common variables, each represented on
'This is not explicitly stated in Sawyer's paper, but is strongly suggested by the method in which other adjustments were made.

every tape, it is possible to ensure that such basic items as gross income, factor income and cash income, or per capita, equivalent or unadjusted income, are defined to common standards.
This paper reports the detailed results of a comparison of the distribution and redistribution and income in seven countries using the LIS database. As the authors demonstrate in later parts of the paper, the use of consistently-organized microdata allows comparisons of inequality in respect to similarly-defined vari- ables, permits methodological alternatives to be used to indicate data sensitivity to such alternatives, and allows the countries to be compared on aspects of income ranking and policy equity in ways in which would not otherwise be possible.
LIS DATASETS
The seven datasets included in this study differ in sample size and source, and both the samples and the database organization are described and discussed in detail in Smeeding, O'Higgins and Rainwater, (forthcoming), chapter 1. In brief, the datasets are the Canadian Survey of Consumer Finances, 1981 (sample size 37,900), the U.S.A. Current Population Survey, 1979 (65,000), the U.K. Family Expenditure Survey, 1979 (6,900), the German Transfer Survey, 1981 (2,800), the Swedish Income Distribution and Level of Living Survey, 1981 (9,600), the Norwegian Tax Files, 1979 (10,400) and the Israeli Family Expen- diture Survey, 1979 (2,300).
The data are thus drawn from a mixture of income, expenditure and administrative surveys, but all except the German and Israeli were intended to be comprehensive studies of the household population. The German data exclude families headed by a foreigner (thus excluding 8 percent of the population), whilst the Israeli data cover just over 90 percent of the household population, the major exclusions being rural households and inhabitants of kibbutzim. With the exception of the U.K. data, the survey results are weighted to adjust for differential non-response within the sample.
The countries differ, however, in how they define and categorize income units. Broadly speaking, three types of income unit may be used: the household, the family and the individual. (The U.S. practice of using families and unrelated individuals is a subset of the second of these.) The samples in this database originally used either families or households-but those which used only house- holds (Germany and Israel) did not permit the deconstruction of these households into their family subcomponents or subunits. Furthermore, definitions of what constituted a family differed from country to country, reflecting not so much different statistical conventions as conventions which followed the different social and cultural customs of each country. For example, in Sweden households consist either of individual adults or couples (with or without children); an adult child living with his or her parents constitutes a separate income unit and several adults sharing a living unit constitute several income units. The Swedish data therefore contain no multi-adult units (other than couples), unlike other countries.
This meant that, in principle, to focus on either the household or the family as a basic unit of analysis would be to use concepts whose meaning varied from
109
country to country. However, in practice, Canada, the U.S.A. and the U.K. have comparable family units, and the other countries either have similar concepts (Sweden and Norway), or use a household concept which produces relatively few multi-family units (Germany and Israel). In the analyses which follow, the term family therefore refers to this variably defined income unit. For many purposes, however, the individual is both a more comparable and, as argued below, a more appropriate focus of analysis, particularly when measuring income shares. The empirical analyses thus use the "family" as the unit whose pooled income is being measured, but tend to use the individual as the core variable when measuring and describing the distribution.
Two particular data issues should be mentioned. Prior to public use release, the Canadian datatape had been adapted by the removal, for confidentiality reasons, of a small number of high income or otherwise special units. This exclusion means that the results may slightly understate the degree of income inequality in Canada. Secondly, the German datatape had an unusually large proportion of units with zero or negative incomes-2.7 percent, compared to a range of 0 percent to 1.2 percent in the other countries in this study. Most of the results reported here (including the quintile share analysis) accepted these data at face value; the only "correction" attempted gives alternative values to the Gini coefficient calculated with all the zero or negative income households excluded.
METHODOLOGICAL ISSUES IN THE LIS ANALYSES OF INCOME DISTRIBUTION
As argued earlier, issues of methodology often bear little relation to issues of data analysis in international income distribution studies because the available data simply do not allow presentational choices based on methodological prefer- ences. In this case, however, not only was such choice possible, it was essential in order to organize the mass of data presented by the availability of seven relatively consistent microdata sets. Although the tapes were rendered consistent, it had been done in a way which left methodological decisions to the individual researcher. This variety led to what Stark has termed an international learning process:
"We came across many different concepts, locations of data, methods of collection etc. These created quite a long period of learning and familiarization. . .. Whilst standardization of the precise meaning of concepts would be very valuable it is to be hoped that this would not lead to the restriction in the variety of concepts. An "international learning process" undoubtedly encompasses the benefits of compre- hending income distributions beyond the normal presentation available in any one country" (1977, p. 2).
The major methodological issues may be summarized as relating to the measures of income, the unit value of the income, the weighting of the units in measuring inequality and the method by which income units were ranked in order to create an income hierarchy prior to measuring inequality. Each will be discussed in turn.

The Measure of Income
The analysis in this paper focuses on two primary measures of income-gross income and net cash income. Gross income is close to the U.S. concept of total money income, and to Sawyer's (1976) concept of pre-tax income. It includes all income from employment and self-employment, property income, occupa- tional pensions, state and private cash transfers, as well as other cash incomes. The sum of employment, self-employment and property incomes is labelled factor income, and market income is factor income plus occupational pensions. Net cash income is gross income less direct taxes (both income taxes and employee social insurance levies), and is similar to Sawyer's post-tax income concept.
Many previous inequality analyses, particularly those with a focus on income redistribution, have chosen a concept of "original" or pre-transfer income as the primary income concept, and then used this as a base or counterfactual against which to measure the redistributive impact of transfers or taxes. While measures of pre-transfer income are relevant to those whose immediate policy concern is to examine how and from whom transfer payments could be financed, their use as a counterfactual appears to assume that in the absence of government tax and transfer programmes, the income distribution would be as represented by the "original" or market distribution.
Plainly this is not the case, particularly when some of the government programmes (e.g. pensions) have existed for so long that individuals have taken them into account when planning and anticipating their future income needs. In addition, since some of the "market" income may be mandated by government legislation (e.g. sickness absence payments in Germany, some pension provision in the United Kingdom), the distinction is inaccurate even as a static separation of the transfer and pre-transfer elements of gross income. Since different countries have chosen different balances of governmental direct transfers, in-kind provision, mandating and regulation in their social programmes, such a distinction could be especially inaccurate in a comparative study. Furthermore, government pro- grammes themselves affect the distribution of factor income, even in a static analysis, through the incomes which they pay to service providers, such as doctors and teachers, rendering the pre-transfer measure even less appropriate as a counterfactual.*
The use of gross income as the first main income concept avoids these difficulties by allowing prior elements of income to be examined in terms either of their own distribution or of their contributions to gross income in different parts of the distribution, without making any assumptions about what the distribu- tion might otherwise have been.
The use of net cash income is slightly more problematical. Whilst the counterfactual problem is less significant (though not totally absent-the shape of the gross distribution may be affected by the pre-existing structure of taxation),
'1t would be interesting to separate the factor income received from government programmes in order to examine the factor beneficiaries of social and other public provision. Even this, however, would not capture the benefits of public spending to private sector sub-contractors, nor the cases where private sector providers are paid by individuals who are subsequently reimbursed, in whole or in part, from public funds.

governments may and do alter the balance between direct and indirect taxes in their revenue-raising. Some differences between countries in these results may therefore reflect such policy choices, since the LIS analyses do not at this stage take any account of indirect taxes. However, comparisons of the distribution of gross incomes are affected by the different balances between employer and employee social insurance contributions and payroll taxes in different countries (since gross income only includes employee contributions), whereas net cash incomes are not affected by this policy choice. The balance between direct and indirect taxes may, therefore, affect the explanation of the net cash data, but not their accuracy as measures of the distribution of "spendable" income in the different countries. In other words, whilst comparisons of gross and net cash income are only limited and qualified measures of the impact of taxation, the net cash measure clearly portrays an important stage in the process of income distribution.
The Unit Value of the Income
The units in which people live, and the income of which is therefore measured, differ in size and composition. This gives rise, as Atkinson notes, to two important questions:
"First, how should we adjust measured income to obtain a comparable, or "equivalent," indicator of welfare? Second, how should we weight income units of different sizes when making judgements about overall dispersion?'(l983, p. 48).
Whilst per capita income is sometimes used to adjust measured income, a measure of equivalent income-the standard of living available to each member of the unit, assuming income pooling-better represents the level of economic welfare which each unit's measured income allows it. This raises the question of determining the equivalence factor-the relationship between measured income and standard of living-for units of varying sizes and compositions. Two related questions are salient here:
1. What equivalence scale is appropriate for each data set? 2. Should a common scale be used across the seven countries? In principle, the answer to the second question is "no7': the relationship
between income level, unit size and composition, and levels of economic welfare is prima facie likely to differ from country to country (and over time in any one country). However, to use a different scale for each country would be to invite the response that any inter-country differences emerging in the consequent results simply reflected these equivalence scale differences. It was therefore decided to use a common scale for this analysis. This in turn meant that even if there were agreement on the scale appropriate to a particular data set (which in the current state of the literature is not the case), no such single scale would be fully appropriate for all these countries.
The chosen scale was therefore pitched between the two poles of making no adjustment for increments in household size and of measuring income per capita. It allocated a value of 0.50 to the first individual in any unit, a value of

0.25 for each individual from the second to the ninth (so that a 9-person unit had an equivalence factor of 2.5), and a value of 3.0 to all units with 10 or more members. Each unit's equivalent income was then calculated by dividing its measured income by the appropriate equivalence factor. (For sensitivity analyses of the effects of using a range of scales, see Buhman, Rainwater, Schmaus and Smeeding, forthcoming).
The empirical results present data on both equivalent and unadjusted measured income so that the impact of this procedure can be examined.
The Weighting of Income Units
Since income units are of different sizes, it is not obvious that they should be counted equally when measuring income inequality or dispersion, although this has been the conventional practice. As Danziger and Taussig point out:
"The pooling of income by family members, however, does not mean that each family unit should be given equal weight in the construction of the size distribution. In fact, conventional size distributions that weight each family equally violate the requirements for individualistic social welfare functions because they implicitly weight the welfare of an individual inversely to the size of the unit in which he or she lives," (1979, p. 366).
In considering this issue, Atkinson suggests that by combining the questions of how to value unit income and how to weight the units, nine different inequality- measuring procedures emerge:
"Suppose that the income of a family (or household) is Y and that the family has n members. Then we could treat the family as 1 unit with income Y, . . . . or as 1 unit with income ( Yl n), or with income ( Yl n*), where n* is the "equivalent" number of adults. On the other hand, we could treat the family as n units, each with income Y, or each with income (Yln*). Finally, we could treat the family as n* units, with again three possible measures of income."(1983, p. 52).
Danziger and Taussig (1979) demonstrated that the choice among the poss- ible procedures is important for the image of inequality which emerges from the data, both cross-sectionally and over time. Which should be used?
Of the 9 possibilities in Atkinson's example, there seems little point in considering the final three-those treating the family as n* units-since this appears to suggest that the importance of an individual's economic welfare is a function of the equivalence scale value of the unit in which he or she resides, and thus is subject to a version of the weakness which Danziger and Taussig's criticism identifies in conventional data. Equivalent adults do not exist, unlike families or individuals, although a family or individual may have an equivalent income. If the family is to be treated as one unit, measuring the distribution of Yln, or of Yln* (each a variation on individual income), tells one something about the economic differences between families, but begs the question of the

number of people affected by those difference^.^ If the family is treated as n units, there is no real basis for assuming that each has an income of Y, since this
4
measures neither the income nor the standard of living available to each of them.4 This would appear to leave three formulations-family income among
families, per capita income among persons and equivalent income among per- sons-but despite its complexity and apparent comprehensiveness, Atkinson's formulation requires one further element if it is fully to represent the choice of measures available in assessing income dispersion-the method whereby income units are rank ~ r d e r e d . ~
The Rank Order of Income Units
In Atkinson's formulation, the 9 possible procedures represent the result of a 3 by 3 matrix, with 3 options for unit weight (1, n and n*) and 3 for income measure ( y , y ln , y ln*) . Once the rank ordering issue is separately identified the matrix expands to 3 x 3 x 3, with 3 options for each of weight, measure and rank ordering ( y , y ln , ~ l n * ) . ~ For example, returning to the 9-procedure example used by Atkinson, the additional role of the rank order of units may be illustrated with the cases where the family is treated as n units, with income being either Y or Y / n . One formulation would presumably rank the units by Y, a second by Y / n; but a third procedure could rank the units by Y while measuring, effectively, Y / n when calculating inequality.
This third formulation measures the share of total income going to each quintile of persons in the distribution, the persons being ranked by their family income. This would be equivalent to regarding the bottom 20 percent of the distribution as those 20 percent of persons living in the units with the lowest incomes. If economic status is commonly perceived in terms of family income, which is the rank ordering implicit in conventional measures of income inequality, then this formulation is at least as appropriate as the measure of the distribution of family income among family units, which is the most commonly used measure of income inequality.
The inclusion of rank order as a specific additional aspect to be considered in approaching the measurement of income inequality does not in practice lead to the replacement of Atkinson's 3 x 3 matrix of procedures with an even more complex 3 x 3 x 3 matrix: just as some of the apparent possibilities in the 3 x 3 formulation have no real claim to being used, so the choice of rank order will
' 0 3 ~ i g g i n s (1985a) argues and empirically demonstrates that for the United Kingdom the details of inequality are, in practice, little different whether measured by equivalent income per family or equivalent income per individual. Whilst the argument may be generalized to most conventional patterns of income distribution, little differences within one dataset may be more significant across seven sets, and, since equivalent income per person is conceptually superior, it is preferable to use it where possible.
4This would be less true in measuring the distribution of wealth, since the control or power, as distinct from consumption possibilities, which wealth conveys is not reduced if it benefits several individuals.
'This element is usually ignored. Even Danziger and Taussig's sensitive treatment of this issue (1979, especially pp. 369-370), does not separate the income ranking question from the measuring and weighting issues.
6Thanks are due to Brigitte Buhman for correcting an error in an earlier draft discussion of this topic.
often follow logically from the other choices made. This is most clearly so in the case of measuring the inequality of equivalent income: since equivalent income is intended as a measure of the standard of living available to each individual, it is most appropriately used when each individual is weighted equally ( n units), with an income valued at Yln*, and ranked by Yln*. But while the choices may often be aligned, the conceptual difference can be important, as the example in the previous paragraph suggests.'
The discussion therefore suggests the use of three measures of income inequality: the measure of equivalent income just outlined and two measures of unadjusted income-the distribution of family income among families, and its distribution among persons ranked by family income. The first of these two unadjusted measures allows comparability with previous studies, both among and within countries, whilst the second is an equally valid measure of the inequality of unadjusted income and services as a useful corrective to the first. Since there is no unique truth in these data, it would be inappropriate, however tempting, to argue that the truth may lie in between these two measures.
A further issue of methodology emerges when the question of the rank of order of income units is considered. It concerns the level or stage of income from which the rank order should be established-if indeed it should remain fixed through the various stages of analysis. One effect of successive additions to income (e.g. from cash transfers) or of taxes may be to change the rank order of income units, regardless of any of the adjustments discussed in the previous pasragraph. The dimensions of measured inequality may therefore differ with the measure or stage of income which is used to establish the rank order. This means that empirical analysis can either rerank the data at each stage of income, or can establish one income stage as the primary ranking stage. Rather than choosing one or other of these procedures, however, it may be argued that each is appropriate for different purposes.
If the intention is to examine and compare the degrees of dispersion in any two distributions, then reranked distributions are preferable: the inequality of the distribution of, for example, net income is most accurately portrayed when the units are ranked by net income, and the use of other rank orders will misrepresent the inequality of net income. If, however, the intention is to examine the effect of particular policies or income sources on the income share of a specific group or quantile (such as the lowest quintile of pre-transfer income), or to examine the socio-economic, demographic or income characteristics of specific groups or parts of the distribution, then a predetermined rank order may be required. In the former case, the choice of this rank order will be a function of the purpose or focus of the policy evaluation, but for any examination of the characteristics of particular parts of the distribution gross income seems the best income stage by which to rank units. This is partly because of the counterfactual weaknesses of other income measures, as discussed earlier, but also because gross
'The separate importance of the ranking issue also emerges when the income concept whercby relative economic status is measured differs from that used in examining the components of the income distribution. For example, one might measure the distribution of unadjusted income among people ranked by equivalent income in order to investigate which changes in actual incomes would most help those at the bottom of the distribution of equivalent income.

income is the closest to being a measure of comprehensive income, and, as such, is the most appropriate choice for a determinate ranking concept.
Since use of the LIS database allows both reranking and determinate ranking, the empirical analyses presented in this paper therefore generally rerank data when measuring inequality, but use data ranked by gross income for other aspects of analysis, such as examining the characteristics of the different parts of the distribution. The effects of reranking, both by using equivalence scales and by using different income concepts are also examined.
LIS EMPIRICAL ANALYSES OF INCOME DISTRIBUTION
In Table 1 we provide information on the relative importance of the income sources, taxes and benefits in each country, as represented in the relevant survey.'
The data show wages and salaries accounting for approximately three- quarters of gross income in Canada and the United States, and less than two-thirds in Israel, Sweden and Germany, with Norway and the United Kingdom in between
TABLE 1
THE RELATIVE IMPORTANCE OF THE INCOME SOURCES, TAXES AND BENEFITS I N EACH COUNTRY
Average Value of Variable as a Percentage of Average Gross Income
Variable Canada U.S.A U.K. Germany Sweden Norway Israel
Wages and salaries Self-employment income Property income
Factor income
Occupational pensions
Market incomes
Child benefits Means-tested benefits Other cash benefits
Total cash benefits
Private transfers Other cash income
Gross income
Income tax Payroll tax (employees)
Net cash income -
Note 1: The zero figure for occupational pensions in Sweden is a creation of the data-collection process, since such pensions do exist there but are treated as part of pensions in the cash transfer section of the data.
Note 2: The zero figure for payroll taxes in Canada is a result of their absence from the Canadian datatape; such taxes do exist there, varying in rates from province to province, but they are not included in the results in this paper.
'For a discussion of the relationship between survey data and the national accounts picture of the income and fiscal structure of a country, and such evidence as is available in respect of the LIS sample countries, see Smeeding, O'Higgins and Rainwater (1988), chapter 1.

at about 70 percent. For Germany and Israel this low figure is balanced by very high levels of self-employment income-amounting to one-sixth of gross income in each, or more than twice as much as anywhere else except Norway. Earned income therefore accounts for more than 80 percent of gross income everywhere except the United Kingdom (76.5 percent) and Sweden (68.2 percent), the two countries with the lowest shares of self-employment income.
Unusually high levels of property income in Canada and the United States, and above-average levels in Israel, help push these countries towards 90 percent in the share of gross income accounted for by factor income, with the United Kingdom and Germany at approximately 80 percent, and Sweden only just over 70 percent. When occupational or job-derived pensions are included to arrive at market income, Canada, the United States and Israel all reach more than 90 percent.
At this point, the data seem to divide the countries into three groups: 1. Canada, the United States and Israel, with a very large role for market
income, and transfers accounting for less than 10 percent of gross income; 2. Sweden, with a much smaller role for market income, and transfers worth
over 30 percent of gross income; and 3. The more mixed group, Norway, Germany and the United Kingdom,
where transfers amount to between 15 percent and 20 percent of gross income.
The major element of cash benefits, other cash benefits, not surprisingly follows this pattern. What may be a little more unexpected is the large role of income-conditioned or means-tested benefits in Sweden. At 4.4 percent of gross income, they are more than twice the proportion in the United Kingdom, the country where they are next most important and where cash benefits as a whole are also second only to Sweden in relative importance. However, the relative role of means-tested cash benefits within the income support system-their share of total transfers-is similar in Sweden, the United Kingdom, the United States and Canada.
After those transfer data, it is not surprising that Sweden also has the highest tax take, with income tax alone averaging 28.5 percent of gross income. While Israel's income tax is a little less onerous (at 23.4 percent), a heavier reliance on employee social insurance contributions brings its total direct tax take to very near the Swedish 30 percent level. Norway and Germany take about a quarter, and the United States 20 percent, while Canada and the United Kingdom take around one-sixth.9
The sum of cash benefits and direct taxes as a proportion of gross income is a simple indication of the magnitude of the amount of income on which government transfer and tax policies may directly impact, and therefore of the total scope which a government currently has for changing the degree of inequality in the distribution of net cash as compared to market income. Here again Sweden stands apart: its "impact potential" is almost 60, or twice the U.S. figure. Germany, Norway and Israel are the higher of the in-between group, at about 40, while Canada and the United Kingdom are around 35.
What effects, if any, do these ranges of differences have?
he figure for Canada is affected by the absence of any data on payroll taxes in the Canadian tape.

Comparative Income Inequality
Table 2 contains data on the distribution of gross and net cash income to quintiles of families, and of gross and net equivalent income to quintiles of persons, with Gini coefficients provided for each distribution.
The distribution of gross and net income among families is deficient as a measure of the distribution of economic welfare, but represents a conventional
TABLE 2
THE DISTRIBUTION OF INCOME IN SEVEN COUNTRIES
Quintile Shares (Percent) of Income
Variable Canada U.S.A. U.K. Germany Sweden Norway Israel
Lowest quintile Second quintile Third quintile Fourth quintile Top quintile
Gini coefficient (%) Revised German Gini
Lowest quintile Second quintile Third quintile Fourth quintile Top quintile
Gini coefficient Revised German Gini
Lowest quintile Second quintile Third quintile Fourth quintile Top quintile
Gini coefficient (%) Revised German Gini
Lowest quintile Second quintile Third quintile Fourth quintile Top quintile
Gini coefficient Revised German Gini
Distribution of Family Gross Income among Quintiles of Families 4.6 3.8 4.9 4.4 6.6 4.9 4.5
11.0 9.8 10.9 10.2 12.3 11.4 10.5 17.7 16.6 18.2 15.9 17.2 18.4 16.5 25.3 25.3 25.3 22.6 25.0 25.5 24.9 41.4 44.5 40.8 46.9 38.9 39.8 43.6
Distribution of Family Net Income among Quintiles of Families 5.3 4.5 5.8 5.0 8.0 6.3 6.0
11.8 11.2 11.5 11.5 13.2 12.8 12.1 18.1 17.7 18.2 15.9 17.4 18.9 17.9 24.6 25.6 25.0 21.8 24.5 25.3 24.5 39.7 41.0 39.5 45.8 36.9 36.7 39.5
Distribution of Family Equivalent Gross Income among Quintiles of Persons
6.7 5.1 7.9 7.2 9.4 8.1 6.1 12.6 11.4 13.0 12.1 14.6 13.6 10.3 17.5 17.1 17.9 16.0 18.5 17.9 15.9 24.0 24.2 23.7 21.3 23.3 23.4 23.7 39.2 42.1 37.5 43.4 34.3 37.0 44.0
Distribution of Family Equivalent Net Income among Quintiles of Persons 7.6 6.1 9.0 7.5 10.6 9.9 7.5
13.3 12.8 13.5 12.7 16.1 14.8 11.7 17.9 18.1 18.0 16.1 19.1 18.4 16.8 23.8 24.4 23.4 20.7 23.1 22.9 23.7 37.4 38.6 36.1 43.0 31.1 34.1 40.3
Note 1: The top half of the table weights each family unit equally, whilst the bottom half weights each individual equally; income units are ranked by family gross income in the top part, by family net income in the second part, by gross equivalent income in the third part and by net equivalent income in the bottom part.
Note 2: The German data are affected by a relatively large number of zero and negative incomes in the sample; the revised Gini excludes income units with such incomes.
presentation of income inequality data, and allows these results to be compared to Sawyer's, since these gross and net concepts are similar to his pre- and post-tax income concepts. When the distribution of gross income among families is examined, the countries divide into three groups:
1. Those with the highest degree of inequality: the United States, Germany and Israel;
2. A less unequal group consisting of Canada, the United Kingdom and Norway; and
3. Sweden, which seems significantly more equal. Sweden has the lowest Gini coefficient, almost 3 percentage points lower
than the next smallest (Norway), and 10 points below the highest, Germany. It has the largest bottom quintile share, 6.6 percent, (more than a third higher than Norway, and three-quarters as large again as in the United States), the largest second quintile share and the lowest income share in the top quintile, 38.9 percent-though this is closer to the top quintile in other countries.
The central group of countries, Norway, the United Kingdom and Canada, are clearly less equal than Sweden, but more equal than the remaining three, Israel, the United States and Germany, on the three criteria which are obvious in the table-the Gini coefficient, and the bottom and top quintile shares. Within this group, Norway has the lowest Gini coefficient and the lowest top quintile share, and a bottom quintile share higher than in Canada and equal to that in the United Kingdom. In turn, the United Kingdom has both a lower Gini and a lower top quintile share than Canada.
Within the group of least equal countries, the rankings are not so clearly defined. Even with a Gini coefficient revised downwards by the exclusion of the high number of zero and negative incomes, Germany still has a higher Gini than the United States, which in turn is higher than Israel, and the same rank order describes the income shares of the top quintiles. In the bottom quintile, however, the United States has a significantly lower share than either Israel or Germany, both of whom register bottom quintile shares closer to those of the middle group of countries.
Using these three measures (Gini, and bottom and top quintile shares), therefore, the data on the distribution of gross incomes among families suggest an almost totally determined rank ordering of inequality: Sweden as the most equal, followed by Norway, the United Kingdom, Canada and Israel, with the United States and Germany ranking as most unequal on different measures.1°
How do these numbers and these rankings compare to those emerging from Sawyer's study, which included all these countries except Israel? Since the data relate to a period about 10 years later than Sawyer's, it is not possible to say that any differences solely reflect the more refined procedures used here-the "real" distributions in the various countries may have changed also-but the contrast is none the less of interest in "updating" the impression generated by Sawyer's data.
'O~he major effects of using other summary measures are obvious from the raw data-the more weight given to the interests of the bottom quintile, the greater the extent to which Germany will be less unequal than the United States.

The main differences in ranking relate to the United Kingdom and to Germany. In Sawyer's analysis the United Kingdom appeared to be as equal as Sweden, and clearly more so than Norway, whilst the LIS data suggest it is significantly less equal than Sweden, and a little less so than ~ o r w a ~ . " Sawyer's data also showed Germany to be more equal than the United States on a range of summary measures, and to have a relatively higher bottom quintile income share +>an the LIS data show, but they also showed Germany to have the highest top quintile share of any of the six countries, which is consistent with the picture emerging here.12 Canada's relative position is the same in both sets of data, but in respect of the actual quintile shares, it appears to be a little more equal in the LIS data, as is also the case with Sweden, while the United Kingdom seems more unequal. The data for the United States, Norway and Germany (apart from its bottom quintile) are very similar in both studies.
When the gross and net income data in Table 2 are compared, the countries divide into two rather disparate groups. Direct taxes seem to have relatively large effects on inequality in two of the already more equal countries, Norway and Sweden, and two of the least equal, Israel and the United States, whilst they have smaller effects in Canada, the United Kingdom and ~ e r m a n ~ . ' ~ After direct taxes are taken into account, the income share of the bottom quintile rises by around one and a half percentage points in Sweden, Norway and Israel-a rise of one-fifth in Sweden, over a quarter in Norway and one-third in Israel. In the other four countries the increases are between a half and one percentage point, relative increases of approximately one-sixth.
Direct taxes also bring about large reductions in the top quintile share in Israel and Norway, reductions of four and three percentage points respectively, with a two point drop in Sweden, but they also have a large effect in the United States, where the top quintile's share falls by three and a half points. In the other three countries the decreases are between one and two points. The changes in the Gini follow the top quintile shares, with a drop of almost six points in Israel, over four points in Norway and the United States, and a little under four points in Sweden; the falls are between two and two and a half points in Canada, the United Kingdom and Germany. Direct taxes therefore reduced relative inequality, on the Gini measure, by more than 10 percent in Israel, Norway, Sweden and the United States.
If the net income data are now used not to examine the impact of taxation by comparison with the gross distribution, but to look at the picture of net income inequality, a somewhat different pattern and a different rank order emerge from that generated by the gross income distribution. Norway now moves closer to the Swedish image of a distinctively egalitarian society, creating a Scandinavian
"The explanation might of course be that Sweden and Norway have become more equal since the early 1970s. However, the available data indicate that while this appears to have been the case in Sweden (Aberg, Selen and Tham, 1985), the Norwegian distribution remained unchanged over the relevant time period (Ringen, 1982). Our thanks are due to Stein Ringen for this information.
I2The difference in bottom quintile shares is partly explained by the German zero incomes which were discussed in the early part of the text.
13While the authors look only at taxes in this discussion, it should be noted that the distributional effects of taxes can properly be examined only by also examining the distributional impact of the manner in which they are spent.
pair of most equal countries. Israel leaves the group of least equal countries, and becomes the most equal of the middle group, with the United Kingdom and Canada following (in that order). Germany and the United States continue to make up the least equal group, with Germany having a higher Gini and a larger top quintile share-but also a larger bottom quintile share.
When the net income data are contrasted with Sawyer's post-tax data, the contrasts are generally similar to those described above in respect of the pre-tax data: the United Kingdom appears less equal, the Canadian data now suggest more equality and the Norwegian data are relatively unchanged. Two differences do stand out, however.
First, the LIS data show a larger equalizing tax impact in the United States: the shares of the second and third quintiles increase by more and that of the top quintile falls by significantly more than in Sawyer's data.14 Secondly, whereas the gross income data showed higher shares in the bottom two quintiles in Sweden and a lower top quintile share than Sawyer's pre-tax data, the net income data show a higher bottom quintile share-but at the expense of the middle quintile. If the difference between Sawyer's and the LIS data actually reflects changes over time in the Swedish distribution, these results would imply that the decline in the gross income share of the top quintile has not been accompanied by any drop in their net income position, whilst the stability of the gross income share of the middle quintile conceals a drop in their net position.
The Distribution of Equivalent Income
How well do these conventional measures, shares and rankings reflect the patterns of the distribution of economic welfare which the lower part of Table 2, focusing on the distribution of equivalent income among persons, seeks to measure?
The effect on relative income shares of transforming the data to equivalent income is varied across countries.15 In Norway, Germany and the United King- dom, the gross income shares of the bottom quintiles rise by almost two-thirds, although those of the top quintiles are less affected. In each case the Gini coefficients drop by almost seven percentage points, a drop of almost a quarter in measured inequality. In Sweden, the bottom quintile gains by a similar absolute amount (almost three percentage points), and although its greater unadjusted share makes this a smaller relative gain, the effect of using equivalent income produces a larger fall (both absolutely and relatively) in the share of the top quintile in Sweden than in any other country. Its Gini coefficient therefore falls by eight points, so that it too has a drop of a quarter in measured inequality when gross income is transformed by the use of equivalence scales.
I41t should be remembered that these U S A . data relate to a period when the "bracket creep" caused by fiscal drag had left unusually large numbers of Americans facing higher marginal tax rates. Subsequent (and consequent?) cuts in the federal income tax will have changed this picture, and the enactment of legislation introducing bracket indexation reduces the likelihood of its reappearance.
I 5 ~ l t h o u g h the discussion is in terms of the effects of the equivalencing transformation, it should be noted that the data also change the ranking and weighting concepts, since they are based on quintiles of persons. The effects of moving to a quintile of persons measure with adjusted income are shown in Table 3.
In Canada, the United States and Israel the effects on the bottom quintile are less marked, and again there are only slight falls in quintile shares at the top of the distribution in Canada and the United States. In Israel, the top quintile actually has a larger share of both gross and net equivalent income than of the corresponding unadjusted concepts, and its Gini coefficient is only slightly lower on the equivalent than the conventional data.
The equivalencing transformation generally has the same effects on countries at the net as at the gross income levels, but since these data are the best available measure of the inequality of economic welfare in each of these countries, they merit a brief summary. The most notable aspect of the data is the strikingly low degree of inequality in Sweden: the Gini coefficient for the distribution of equivalent net income is only 20.5, and the quintile shares of 10.6 percent at the bottom and 31.3 percent at the top are unusually close. In Norway, the second most equal country on these measures, the bottom quintile has just under 10 percent of net income, whilst in the United Kingdom it has 9 percent. The average equivalent income of the top quintile therefore exceeds that of the bottom by less than a factor of three in Sweden, rising to three and a half in Norway, four in the United Kingdom, five in Canada, five and a half in Israel, almost six in Germany, and more than six in the United States.
The equivalent income data therefore repeat the rank ordering of inequality suggested by the unadjusted gross income data, though with clearer gaps between the cardinal positions of some of the countries. Sweden is clearly most equal, followed by Norway, the United Kingdom and Canada. Thereafter, the order depends on the measure used: while Israel seems marginally more equal than Germany at the equivalent net income stage, the United States has the lowest bottom quintile shares, but also has lower top quintile shares than either Germany or Israel, and thus a lower net income Gini coefficient.16
The two adjustments to the gross income data in Table 2-allowing for taxes and transforming for equivalent income-produce different effects in different countries. Sweden and Norway become even more equal as a result of both changes, taxes have a significant effect on the Israeli and the U.S. data, whilst equivalencing has a major impact on the German and the U.K. data. Only in Canada does neither have major effects, although their joint effect is important. Such divergences bedevil conventional attempts at comparative inequality analy- sis, but illustrate a major advantage of the LIS database-that it allows these various measures to be specified and tested, and their different effects examined.
Sources of Inequality
In order to explore the proximate reasons and explanations for the patterns of inequality in each country, this section examines the role of a range of income
''since the Israeli data exclude rural inhabitants, it seems likely that even this relatively high level of inequality understates the true degree of inequality in Israel. While this may seem surprising in view of the egalitarian image projected by Israel, it is consistent with Kuznets' arguments that countries at earlier stages of economic development will experience higher levels of inequality. The data in Table 4 suggest that the proximate causes of this greater inequality are the lower relative importance of cash benefits and the greater role and more unequal distribution of self-employment income.
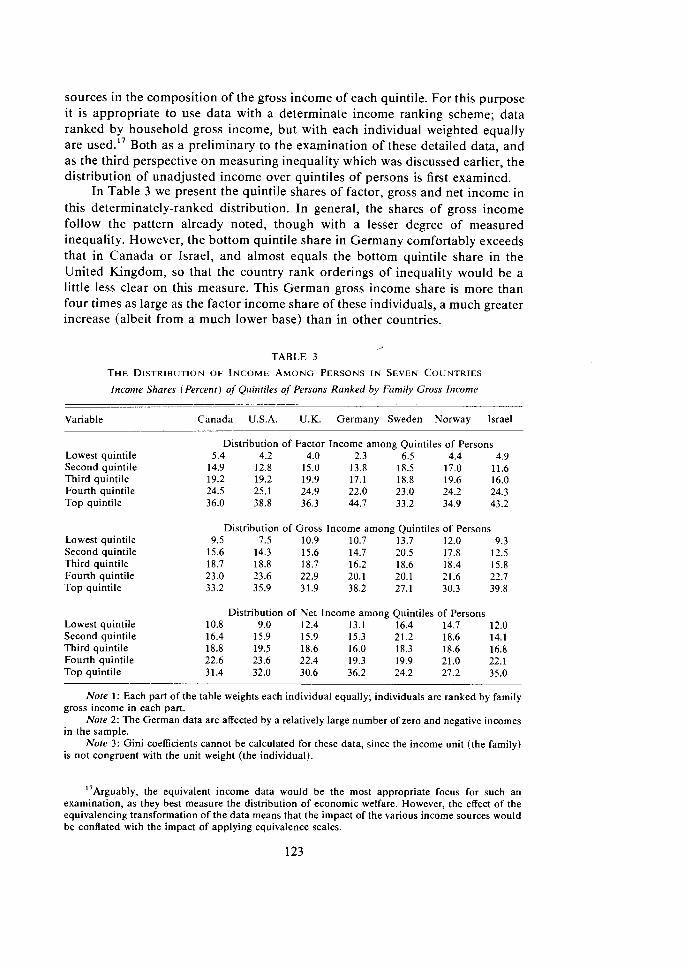
sources in the composition of the gross income of each quintile. For this purpose it is appropriate to use data with a determinate income ranking scheme; data ranked by household gross income, but with each individual weighted equally are used." Both as a preliminary to the examination of these detailed data, and as the third perspective on measuring inequality which was discussed earlier, the distribution of unadjusted income over quintiles of persons is first examined.
In Table 3 we present the quintile shares of factor, gross and net income in this determinately-ranked distribution. In general, the shares of gross income follow the pattern already noted, though with a lesser degree of measured inequality. However, the bottom quintile share in Germany comfortably exceeds that in Canada or Israel, and almost equals the bottom quintile share in the United Kingdom, so that the country rank orderings of inequality would be a little less clear on this measure. This German gross income share is more than four times as large as the factor income share of these individuals, a much greater increase (albeit from a much lower base) than in other countries.
TABLE 3
THE DISTRIBUTION OF INCOME AMONG PERSONS I N SEVEN COUNTRIES
Income Shares (Percent) of Quintiles of Persons Ranked by Family Gross Income
Variable Canada U.S.A. U.K. Germany Sweden Norway Israel
Lowest quintile Second quintile Third quintile Fourth quintile Top quintile
Lowest quintile Second quintile Third quintile Fourth quintile Top quintile
Lowest quintile Second quintile Third quintile Fourth quintile Top quintile
Distribution of Factor Income among Quintiles of Persons 5.4 4.2 4.0 2.3 6.5 4.4 4.9
14.9 12.8 15.0 13.8 18.5 17.0 11.6 19.2 19.2 19.9 17.1 18.8 19.6 16.0 24.5 25.1 24.9 22.0 23.0 24.2 24.3 36.0 38.8 36.3 44.7 33.2 34.9 43.2
Distribution of Gross Income among Quintiles of Persons 9.5 7.5 10.9 10.7 13.7 12.0 9.3
15.6 14.3 15.6 14.7 20.5 17.8 12.5 18.7 18.8 18.7 16.2 18.6 18.4 15.8 23.0 23.6 22.9 20.1 20.1 21.6 22.7 33.2 35.9 31.9 38.2 27.1 30.3 39.8
Distribution of Net Income among Quintiles of Persons 10.8 9.0 12.4 13.1 16.4 14.7 12.0 16.4 15.9 15.9 15.3 21.2 18.6 14.1 18.8 19.5 18.6 16.0 18.3 18.6 16.8 22.6 23.6 22.4 19.3 19.9 21.0 22.1 31.4 32.0 30.6 36.2 24.2 27.2 35.0
Note 1: Each part of the table weights each individual equally; individuals are ranked by family gross income in each part.
Note 2: The German data are affected by a relatively large number of zero and negative incomes in the sample.
Note 3: Gini coefficients cannot be calculated for these data, since the income unit (the family) is not congruent with the unit weight (the individual).
I7~rguably , the equivalent income data would be the most appropriate focus for such an examination, as they best measure the distribution of economic welfare. However, the effect of the equivalencing transformation of the data means that the impact of the various income sources would be conflated with the impact of applying equivalence scales.
In the countries where gross income is most equally distributed, Sweden, Norway and the United Kingdom, the gross income share is more than double the factor share of the bottom quintile, whereas in the United States, Canada and Israel, the factor income share is more than half of the gross share. In fact, as the data show, the Canadians and Israeli bottom quintile factor shares are greater than those in Norway or the United Kingdom, and the United States factor share is also greater than that in the United Kingdom. This highlights the importance of transfer incomes in distinguishing the more from the less equal countries (a topic which is explored fully in the discussion of Table 4 below).
The distribution of gross income in Sweden, as represented in Table 3, also highlights an unusual statistical consequence of Sweden's family structures and relative egalitarianism-that family gross incomes increase less rapidly than family size in the middle of distribution. While it is a characteristic of income distribution data that family size and family income are positively correlated, the average value of the latter usually increases faster. This is not the case in Sweden, with the result that the income share of the middle quintile of persons is lower than that of the second quintile.
In Table 3 we also show a relatively greater than previously noted degree of equality in the shares of net income among non-reranked persons: only in the United States is the bottom quintile share under 10 percent, and only in Germany and Israel is the top quintile share significantly above 30 percent. The Swedish data are, however, the most notable in this part of the table: they show a ratio of less than 1.5: 1 in the shares of the top and bottom quintiles-24.2 percent compared to 16.4 percent-and they also show that the effect of taxes further increases the reversal of the relative average position of quintiles, with the second quintile now having a larger share of net income than either the third or the fourth. Whilst this result would vanish if the data were reranked by net income, it focuses attention on the extent to which the Swedish tax system causes income status switching. (In Table 6 we return to this issue.)
In Table 4 we break down gross income by both source and quintile in order to examine the composition of each quintile share, relative both to other quintiles in the same country and to similar quintiles in other countries. Each data item in the table indicates the percentage of total gross income which goes to each quintile in a particular form or type of income.
When the first quintile in each country is examined, an immediate difference is the proportion of gross income going to each in the form of wages and salaries. The Israeli and U.S. figures of approximately 3 percent are exceeded only by Sweden and Canada, and are significantly greater than those for the United Kingdom or Germany. Although each of self-employment income, property income and occupational pensions are quite small at this stage, when they are added to wages and salaries (to form "market income"), Canada and Israel emerge as the only two countries where more than 5 percent of gross income goes to the bottom quintile in the form of market income.
It is, however, the share of total gross income going to the bottom quintile as cash benefits which best predicts and determines the overall degree of inequality. With the exception of the German data, the bottom quintile cash benefit share correlates with the overall judgements on inequality made earlier
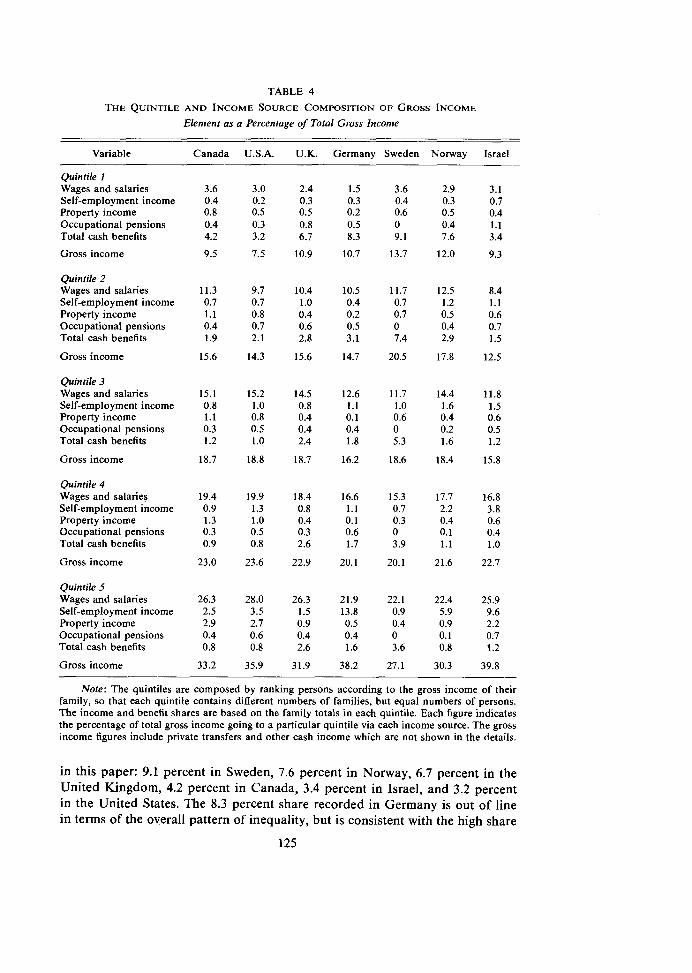
TABLE 4
THE QUINTILE AND INCOME SOURCE COMPOSITION OF GROSS INCOME
Element as a Percentage of Total Gross Income
Variable Canada U.S.A. U.K. Germany Sweden
Quintile 1 Wages and salaries Self-employment income Property income Occupational pensions Total cash benefits
Gross income
Quintile 2 Wages and salaries Self-employment income Property income Occupational pensions Total cash benefits
Gross income
Quintile 3 Wages and salaries Self-employment income Property income Occupational pensions Total cash benefits
Gross income
Quintile 4 Wages and salaries Self-employment income Property income Occupational pensions Total cash benefits
Gross income
Quintile 5 Wages and salaries Self-employment income Property income Occupational pensions Total cash benefits
Gross income
Norway
2.9 0.3 0.5 0.4 7.6
12.0
12.5 1.2 0.5 0.4 2.9
17.8
14.4 1.6 0.4 0.2 1.6
18.4
17.7 2.2 0.4 0.1 1.1
21.6
22.4 5.9 0.9 0.1 0.8
30.3
Israel
3.1 0.7 0.4 1.1 3.4
9.3
8.4 1.1 0.6 0.7 1.5
12.5
11.8 1.5 0.6 0.5 1.2
15.8
16.8 3.8 0.6 0.4 1 .o
22.7
25.9 9.6 2.2 0.7 1.2
39.8
Note: The quintiles are composed by ranking persons according to the gross income of their family, so that each quintile contains different numbers of families, but equal numbers of persons. The income and benefit shares are based on the family totals in each quintile. Each figure indicates the percentage of total gross income going to a particular quintile via each income source. The gross income figures include private transfers and other cash income which are not shown in the details.
in this paper: 9.1 percent in Sweden, 7.6 percent in Norway, 6.7 percent in the United Kingdom, 4.2 percent in Canada, 3.4 percent in Israel, and 3.2 percent in the United States. The 8.3 percent share recorded in Germany is out of line in terms of the overall pattern of inequality, but is consistent with the high share
125

of gross income going to the bottom quintile in that country. As noted earlier, the source of the high degree of total inequality in Germany is at the top rather than the bottom of the income distribution.
The main determinant of the quintile shares, and of the rank order of countries, in the three middle quintiles is wage and salary income; other sources of income explain deviations from this pattern, rather than create patterns of their own. In the second and third quintiles, the rank order of gross shares follows that of wages and salaries, except that the higher amounts of cash benefit income in Sweden and the United Kingdom give them larger gross shares than would have been predicted from the wage and salary data. In the fourth quintile, cash benefits no longer have such an effect (although they remain larger in Sweden and the United Kingdom than elsewhere), and the only reordering from the wage and salary pattern is caused by the relatively large amount of self-employment income in Israel.
The shares of the top quintiles, and thus an important aspect of total inequality, cannot, however, be understood by examining wages and salaries. The two countries with the largest top quintile shares of gross income, Germany and Israel, have relatively low top quintile wage and salary shares-Germany, in fact, has the lowest of these seven countries-but they have exceptionally high self-employment income shares. Almost 14 percent of total gross income in Germany, and almost 10 percent in Israel, is self-employment income which goes to the top quintile. In Table 1 it was noted that self-employment income was unusually large in these two countries, but these data show the massive extent to which, particularly in Germany, this income goes to the top quintile.
It can now be seen that the high degree of income inequality in Germany (which was also evident for the top quintile in Sawyer's study) is due to the large and very unequal role of self-employment income there. This also explains a part of the greater inequality in Israel. It also contributes to the extent to which the Norwegian distribution is less equal than the Swedish: self-employment income is both three times more important in Norway, and almost 90 percent of it goes to the top quintile, compared to less than a quarter in Sweden.
The analyses thus far have focused on measuring the degree of income inequality in various end-state or static situations, and the contributors to those states of inequality. The next sections of the paper examine a different aspect of income distribution-the extent to which the rank order of individuals, their economic status, changes under different definitions or measures of the distri- bution.
Equivalence Scales and Rank Order
The earlier analyses showed that the use of equivalent income generally reduces the degree of measured inequality, and has a greater effect on the measurement of inequality at the bottom of the income distribution than at the top. However, it is important to note that those data had been reranked once transformed into equivalent form; the apparent change in inequality would have been greater with data where the rank order was unchanged. This indicates that the argument for using equivalence scales is not just that their use tells one more about the true dimensions of economic inequality, but that it provides a more

accurate picture of the composition and characteristics of the various parts of the income distribution. This conclusion is consistent with Sawyer's conclusion in respect of using per capita income:
"Although the change observed in moving from a household distribution to a per capita distribution does not yield drastic changes in the decile shares, it does have a substantial impact on the identity of the people in the various deciles."(1976, p. 18).
Since perceptions of which groups in society are low or high income, and of the distributive impact and effectiveness of tax and transfer programmes are more likely to be based on unadjusted than r ,quivalent data, the differences in these rank orderings may be of considerable importance for the evaluation of policy.'' In order to investigate the degree of rank order change caused by the use of equivalence scales, Table 5 shows the percentage of persons who are in different deciles of the distributions of family gross income (among quintiles of persons) and of equivalent gross income. It indicates a very high degree of movement-only one quarter of individuals are in the same decline on both measures. The percentage who move three or more deciles varies from 11.8 percent in the United States to a very high 29.2 percent in Sweden.
TABLE 5
THE EFFECT OF INCOME EQUIVALENCING ON THE RANK ORDER OF PERSONS IN THE
INCOME DISTRIBU~ ION
Percentage of Persons in Different Deciles of the Distributions of Gross Income and of Equivalent Gross Income
Variable Canada U.S.A U.K. Germany Sweden Norway Israel
Up 3 or more deciles 8.7 6.6 9.2 8.9 13.6 12.9 8.6 Up 2 deciles 9.1 11.0 8.1 11.6 10.1 7.0 9.2 Up 1 decile 15.2 15.8 16.5 12.4 17.7 14.1 15.6 In same decile 26.9 28.9 26.2 28.4 20.5 22.2 31.3 Down 1 decile 22.9 21.6 23.8 19.2 11.7 23.2 17.6 Down 2 deciles 11.5 10.8 10.4 11.2 10.9 11.6 9.5 Down 3 or more deciles 5.8 5.2 5.7 8.4 15.6 9.0 8.2
Note: The data show the percentage of persons whose gross income decile changes when one moves from a measure of family income to one of equivalent family income.
Further Data on Stayers-Those Whose Decile Remains Unchanged Percentage who stay in: Decile 1 62.7 66.1 65.5 71.7 63.3 60.0 52.9 Deciles 3 to 8 16.6 18.3 15.0 16.7 10.6 10.3 22.9 Decile 10 53.0 55.8 50.7 54.6 47.7 52.6 63.4
Percentage of stayers in: Deciles 1 and 10 43.0 42.2 44.3 44.4 54.0 50.7 37.1 Deciles 1, 2, 9, and 10 63.0 62.1 65.6 64.7 69.0 72.2 56.1
Note: As the data demonstrate, fewer people experience rises than falls-in each country about one-third rise whilst around two-fifths fall-but there are a greater number of large rises (which in a sense "make space" for the greater number of smaller falls).
he arguments underlying these assertions are set out, with examples, in O'Higgins (1985b).
The lower half of the table looks at "stayers" in terms of their original location. A small majority of those originally in deciles 1 and 10 remain in those deciles, but in the middle of the distribution only one-sixth of households do so-and this figure drops as low as 10 percent in Norway and Sweden. Therefore, while the poor tend to be poor on either measure (and the rich rich), there is considerable movement in the middle income groups in all the countries. Policy arguments, proposals or analyses which discuss distributional impacts in terms of "raw" income data may therefore have very different, and perhaps perverse, effects on the distribution of economic welfare. An awareness of these rank order shifts suggest a need for considerable care in designing and targeting policies which affect the distribution of income.
Equity and Rank Order
As noted earlier, changes in the rank order of an income distribution due to the addition of transfer income or the removal of taxes can be important for determining the importance of a particular choice of a primary ranking concept. They are also important for examining the policy issue about the choice available to a government as to whether its interventions are intended to "shuffle" the income distribution-that is, to change rank order-or simply to "compress" it-that is to narrow the extent of inequality without changing the rank order of individual income units. This is the issue to which Plotnick refers as "horizontal equity." "A horizontally equitable distribution is one that preserves the initial rank order of the units." (1984, p. 4).
Plotnick sets forth the view that rank preservation is an important aspect of redistribution policy and analysis, going so far as to argue that:
"The degree to which differences in initial well-being should be narrowed is debatable, but once this is resolved, what social purpose would be promoted by reversing ranks during the transformation? None-if the economic game is regarded as a fair process. . . . Unless the socially optimal distribution is one of full equality, those earning more initial well-being should surely have greater final well-being than those earning less. What logic could justify otherwise? Thus, any reversals incidental to the redistributive process would seem to lower social welfare." (1984, pp. 4-5).
One need not accept the fairness or appropriateness of any particular initial rank ordering to accept that the issue of rank order changes is an important aspect of the process of income distribution and redistribution, and one unduly neglected in empirical research. But how should well-being be defined and measured in examining rank order changes? Whilst social policy equity can be more properly judged in relation to changes in equivalent income rank orderings, popular perceptions of tax and transfer equity are more likely to be based on actual income. Similarly, if rank preservation is justified on the basis of the "economic game" being (or been seen as) a "fair process," then actual incomes are the relevant measure. In these analyses, incomes are therefore examined unadjusted by equivalence factors.
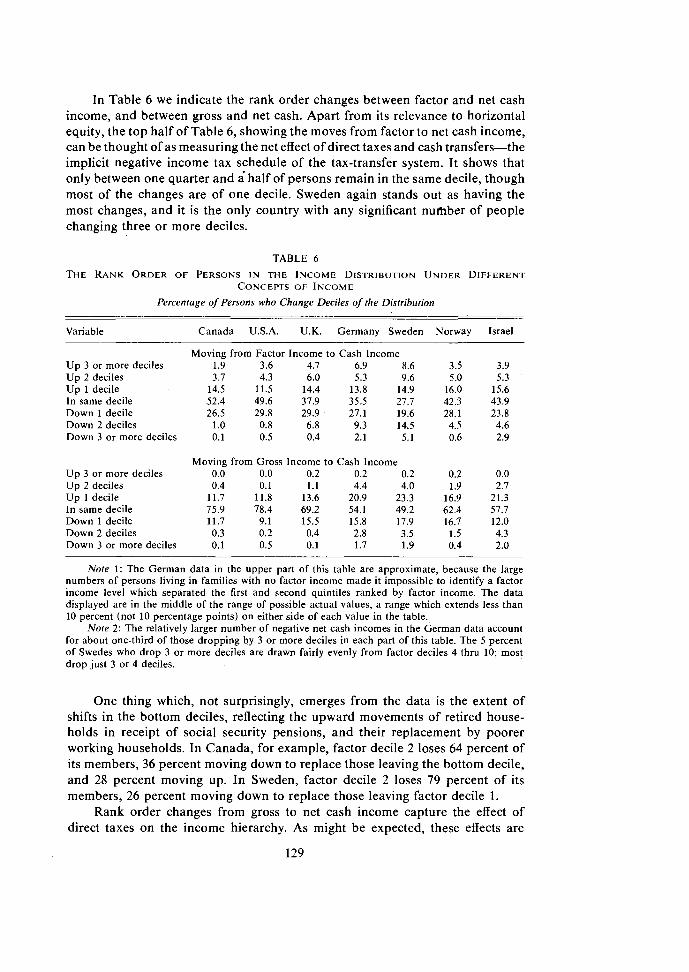
In Table 6 we indicate the rank order changes between factor and net cash income, and between gross and net cash. Apart from its relevance to horizontal equity, the top half of Table 6, showing the moves from factor to net cash income, can be thought of as measuring the net effect of direct taxes and cash transfers-the implicit negative income tax schedule of the tax-transfer system. It shows that only between one quarter and a'half of persons remain in the same decile, though most of the changes are of one decile. Sweden again stands out as having the most changes, and it is the only country with any significant number of people changing three or more deciles.
TABLE 6
T H E RANK ORDER OF PERSONS I N THE INCOME DISTRIBUTION UNDER DIFFERENT CONCEPTS OF INCOME
Percentage of Persons who Change Deciles of the Distribution
Variable Canada U.S.A. U.K. Germany Sweden Norway Israel
Up 3 or more deciles Up 2 deciles Up 1 decile In same decile Down 1 decile Down 2 deciles Down 3 or more deciles
Up 3 or more deciles Up 2 deciles Up 1 decile In same decile Down 1 decile Down 2 deciles Down 3 or more deciles
Moving from Factor lncome to Cash lncome 1.9 3.6 4.7 6.9 8.6 3.7 4.3 6.0 5.3 9.6
14.5 11.5 14.4 13.8 14.9 52.4 49.6 37.9 35.5 27.7 26.5 29.8 29.9 27.1 19.6
1 .O 0.8 6.8 9.3 14.5 0.1 0.5 0.4 2.1 5.1
Moving from Gross Income to Cash Income 0.0 0.0 0.2 0.2 0.2 0.4 0.1 1.1 4.4 4.0
11.7 11.8 13.6 20.9 23.3 75.9 78.4 69.2 54.1 49.2 11.7 9.1 15.5 15.8 17.9 0.3 0.2 0.4 2.8 3.5 0.1 0.5 0.1 1.7 1.9
Note 1: The German data in the upper part of this table are approximate, because the large numbers of persons living in families with no factor income made it impossible to identify a factor income level which separated the first and second quintiles ranked by factor income. The data displayed are in the middle of the range of possible actual values, a range which extends less than 10 percent (not 10 percentage points) on either side of each value in the table.
Note 2: The relatively larger number of negative net cash incomes in the German data account for about one-third of those dropping by 3 or more deciles in each part of this table. The 5 percent of Swedes who drop 3 or more deciles are drawn fairly evenly from factor deciles 4 thru 10; most drop just 3 or 4 deciles.
One thing which, not surprisingly, emerges from the data is the extent of shifts in the bottom deciles, reflecting the upward movements of retired house- holds in receipt of social security pensions, and their replacement by poorer working households. In Canada, for example, factor decile 2 loses 64 percent of its members, 36 percent moving down to replace those leaving the bottom decile, and 28 percent moving up. In Sweden, factor decile 2 loses 79 percent of its members, 26 percent moving down to replace those leaving factor decile 1.
Rank order changes from gross to net cash income capture the effect of direct taxes on the income hierarchy. As might be expected, these effects are

smaller-direct taxes tend to compress rather than to shuffle the distribution. Between 50 percent and 75 percent of individuals remain in the same decile, with least change in the United States and Canada and, again, most in Sweden. Stayers are never less than 60 percent of any decile in Canada and, as elsewhere, moves are mainly in the middle deciles. Stayers are never below 70 percent in the United States, but almost all (99.8 percent) of those dropping 3 or more deciles drop from decile 10-i.e. almost 5 percent of that decile's membership drop 3 or more deciles, and about 1 percent go to the bottom decile. In the United Kingdom and Norway, stayers never drop below 50 percent in 6 deciles, and Israel is similar. In Sweden, stayers fall to as low as 36 percent, and are below 50 percent in 7 deciles. Even in Sweden, however, most changes are of one decile and only 2 percent of households move more than three deciles.
Although the majority of the changes identified here are of only one decile, the fact that the rank order of between a quarter and one half of individuals is affected to this extent is surprising and merits further investigation. It may, for example, be the case that the changes are related to the deliberate effects of policies on families of different compositions, particularly since the data in Table 6 relate to unadjusted rather than to equivalent i n ~ o m e . ' ~
The overall impression given by the data suggests that Sweden not only has relatively high tax and transfer shares in family income, and higher levels of inequality-reducing redistribution, but also alters the relative positions of a greater proportion of its population during that process of redistribution. It is, therefore, very successful on measures of vertical equity, but fares less well on the narrow interpretations of horizontal equity.
In concluding this paper it seems appropriate to comment both on what the exercise has shown about comparative income distribution and on its implications for the use of a comparative microdata set like the LIS database.
The income distribution results largely speak for themselves by now. They allow one with a considerable degree of confidence to note an overall pattern in the inequality of income and economic welfare, with a rank order in which Sweden is the most equal, followed by Norway, the United Kingdom and Canada, while among the less equal countries Israel is generally more equal than either Germany or the United States, whose relative inequality depends on the measure which is chosen.
The LIS database also allows a more detailed explanation of these results, noting, for example, the role of cash benefits in increasing equality in Sweden and the United Kingdom, and in aiding the bottom quintile in Germany; and the important part played by self-employment income in contributing to the high
I9Some of the movement may also be a function of the use of a relative measure such as deciles, since a small number of large shifts may induce a large number of consequential small "shakedown" shifts in order to keep the numbers in each decile equal. This may be especially important in relation to the larger number of shifts in the Swedish data, since in a relatively more equal (and hence, dense) distribution the number of such consequential shifts will necessarily be greater. This feature of the use of rank orders led Plotnick to argue that "a measure that examines differences in [actual and rank-preserving] well-being . . . is probably superior to one based on rank differences." (1984, p. 5).
top quintile shares (and thus to the greater inequality) in Germany and Israel, and in rendering the Norwegian distribution less equal than that of its Scan- dinavian neighbour. They also point up the unusually high frequency of rank order changes in the economic status of individuals in the Swedish tax and transfer process. In so doing, the results demonstrate the most important point about the database-its actual value for empirical analysis.
The wealth of the database leads us to emphasize two points which, whilst generally true about comparative research, acquire a more visible importance with good data. First, the database means that methodological issues need to be treated both more explicitly and more carefully; the range of approaches to the data is considerable, and provide an unusual array of choice for a researcher. Secondly, use of the data raise a wide range of questions whose proper interpreta- tion requires the availability of a considerable degree of knowledge and awareness of the institutional features of the various countries. This indicates that it is important to complement an income microdatabase by access to a database focused on aspects of social structure and institutional provision.
Aberg, Y.., Selen, J., and Tham, H., Economic Resources, in Erikson, R. and Aberg, R. (eds.) Welfare in Transition, Oxford, Clarendon Press, 1985.
Atkinson, A,, The Economics of Inequality (2nd edition), Oxford, Clarendon Press, 1983. Buhman, B., Rainwater, L., Schmaus, G., and Smeeding, T., Equivalence Scales, Well-Being,
Inequality and Poverty: Sensitivity Estimates Using the Luxembourg Income Study (LIS) Database, Review of Income and Wealth, forthcoming.
Danziger, S. and Taussig, M., The Income Unit and the Anatomy of Income Distribution, Review of Income and Wealth, 25 (4), 365-375, 1979.
O'Higgins, M., Inequality, Redistribution and Recession: The British Experience, 1976-1982, Journal of Social Policy, 14 (3), 1985a.
O'Higgins, M., Welfare, Redistribution and Inequality: Disillusion, Illusion and Reality, in Bean. P., Ferris, J., and Whynes, D. (eds.), In Defence of Welfare, London, Tavistock, 1985b.
O'Higgins, M. and Ruggles, P., The Distribution of Public Expenditures and Taxes Among Households in the United Kingdom, Review of Income and Wealth, 27 (3), 298-326, 1981.
Plotnik R., A Comparison of Measures of Horizontal Inequity using Alternative Measures of Well-Being, Discussion Paper 752-784, Institute for Research on Poverty, Madison, Wisconsin, 1984.
Ringen, S., Inntekt og forbruk i Norge, 1950-1980, Ministry of Consumer Affairs, Oslo, 1982. Ruggles, P. and O'Higgins M., The Distribution of Public Expenditure among Households in the
United States, Review of Income and Wealth, 27 (2), 1981. Sawyer, M., Income Distribution in O E C D Countries, OECD, Paris, 1976. Smeeding, T., O'Higgins M., and Rainwater, L., Poverty, Inequality and Income Distribution in
Comparative Perspective: The Luxembourg Income Study (LIS) , Harvester-Wheatsheaf, Hemel Hempstead, England, forthcoming.
Smolensky, E., Pommerehne, W., and Dalrymple, R., Postfisc Income Inequality: A comparison of the United States and West Germany, in Moroney, J. R. (ed.), Income Inequality: Trends and International Comparisons, Lexington Books Lexington, Mass., 1979.
Stark T., The Distribution of Income In Eight Countries, Background Paper No. 4, Royal Commission on the Distribution of Wealth, HMSO London, 1977.
Related Documents