Michael H. Salazar 1 , P. Bruce Duncan 2 , Sandra M. Salazar 3 , and Keith A. Rose 2 IN-SITU BIOASSAYS USING TRANSPLANTED MUSSELS: II. ASSESSING CONTAMINATED SEDIMENT AT A SUPERFUND SITE IN PUGET SOUND REFERENCE: Salazar, M. H., Duncan, P. B., Salazar, S. M., and Rose, K. A., "In-Situ Bioassays using Transplanted Mussels: II. Assessing Contaminated Sediment at a Superfund Site in Puget Sound," Environmental Toxicology and Risk Assessment - Third Symposium, ASTM STP 1218, Jane S. Hughes, Gregory R. Biddinger, and Eugene Mones, Eds., American Society for Testing and Materials, Philadelphia, 1995, pp. 242-263. ABSTRACT: In a pilot study for the U.S. EPA, bioaccumulation and growth in mussels (Mytilus trossulus) were used to assess the bioavailability of contaminants and potentially adverse bioeffects in water overlying contaminated sediments. Caged juvenile and adult mussels were transplanted to 12 locations around a Superfund Site (Harbor Island), and a reference site (Carr Inlet) in Puget Sound, Washington. The exposure period was 82 days and animals were held 1 meter from the bottom. Accumulation of contaminants in adult mussel tissues was used to help identify the extent and magnitude of contamination in the overlying water. Reduced growth in juvenile mussels was used as an indicator of adverse bioeffects. Sites were ranked for these potentially adverse biological impacts. Juvenile mussel growth rates combined with toxicity-normalized sediment chemistry and toxicity- normalized tissue chemistry, provided a first-order approximation of potential biological effects associated with chemicals of concern in sediment and mussel tissues. Mussels from Harbor Island accumulated higher concentrations of contaminants and had significantly lower growth rates than the reference site mussels. Some differences were detected among the Harbor Island sites. Mussels from one site were much more contaminated than the others and, based on extremely low growth rates, exhibited the greatest potential for adverse biological effects. TBT and copper were the contaminants of greatest concern in both tissues and sediments; lead and zinc were an additional concern in sediments. A statistically significant inverse relationship was found between growth rate, toxicity-normalized tissue accumulation, and toxicity-normalized sediment contamination. Based on our results, we recommend the following integrated approach for evaluating contaminated sediments: (1) conduct in-situ bioassays, (2) estimate bioaccumulation in addition to bioeffects, and (3) evaluate water overlying the sediments. KEYWORDS: mussel transplants, sediments, bioaccumulation, growth, Superfund, contamination, in-situ bioassay 1 NOAA Bioeffects Branch, 7600 Sand Point Way NE, Seattle, WA, 98115 2 U.S. EPA, Region 10, 1200 - 6th Ave, Seattle, WA, 98101 3 EVS Consultants, 200 West Mercer St., Suite 403, Seattle, WA, 98119 242

Welcome message from author
This document is posted to help you gain knowledge. Please leave a comment to let me know what you think about it! Share it to your friends and learn new things together.
Transcript
Michael H. Salazar1, P. Bruce Duncan2, Sandra M. Salazar3, andKeith A. Rose2
IN-SITU BIOASSAYS USING TRANSPLANTED MUSSELS: II. ASSESSINGCONTAMINATED SEDIMENT AT A SUPERFUND SITE IN PUGET SOUND
REFERENCE: Salazar, M. H., Duncan, P. B., Salazar, S. M., and Rose, K. A., "In-Situ Bioassays using Transplanted Mussels: II.Assessing Contaminated Sediment at a Superfund Site in Puget Sound,"Environmental Toxicology and Risk Assessment - Third Symposium, ASTM STP1218, Jane S. Hughes, Gregory R. Biddinger, and Eugene Mones, Eds.,American Society for Testing and Materials, Philadelphia, 1995, pp. 242-263.
ABSTRACT: In a pilot study for the U.S. EPA, bioaccumulation and growthin mussels (Mytilus trossulus) were used to assess the bioavailabilityof contaminants and potentially adverse bioeffects in water overlyingcontaminated sediments. Caged juvenile and adult mussels weretransplanted to 12 locations around a Superfund Site (Harbor Island),and a reference site (Carr Inlet) in Puget Sound, Washington. Theexposure period was 82 days and animals were held 1 meter from thebottom. Accumulation of contaminants in adult mussel tissues was usedto help identify the extent and magnitude of contamination in theoverlying water. Reduced growth in juvenile mussels was used as anindicator of adverse bioeffects. Sites were ranked for thesepotentially adverse biological impacts. Juvenile mussel growth ratescombined with toxicity-normalized sediment chemistry and toxicity-normalized tissue chemistry, provided a first-order approximation ofpotential biological effects associated with chemicals of concern insediment and mussel tissues. Mussels from Harbor Island accumulatedhigher concentrations of contaminants and had significantly lower growthrates than the reference site mussels. Some differences were detectedamong the Harbor Island sites. Mussels from one site were much morecontaminated than the others and, based on extremely low growth rates,exhibited the greatest potential for adverse biological effects. TBTand copper were the contaminants of greatest concern in both tissues andsediments; lead and zinc were an additional concern in sediments. Astatistically significant inverse relationship was found between growthrate, toxicity-normalized tissue accumulation, and toxicity-normalizedsediment contamination. Based on our results, we recommend thefollowing integrated approach for evaluating contaminated sediments: (1)conduct in-situ bioassays, (2) estimate bioaccumulation in addition tobioeffects, and (3) evaluate water overlying the sediments.
KEYWORDS: mussel transplants, sediments, bioaccumulation, growth,Superfund, contamination, in-situ bioassay
1NOAA Bioeffects Branch, 7600 Sand Point Way NE, Seattle, WA, 981152U.S. EPA, Region 10, 1200 - 6th Ave, Seattle, WA, 981013EVS Consultants, 200 West Mercer St., Suite 403, Seattle, WA, 98119
242
SALAZAR ET AL ON TRANSPLANTED MUSSELS: II 243
INTRODUCTION
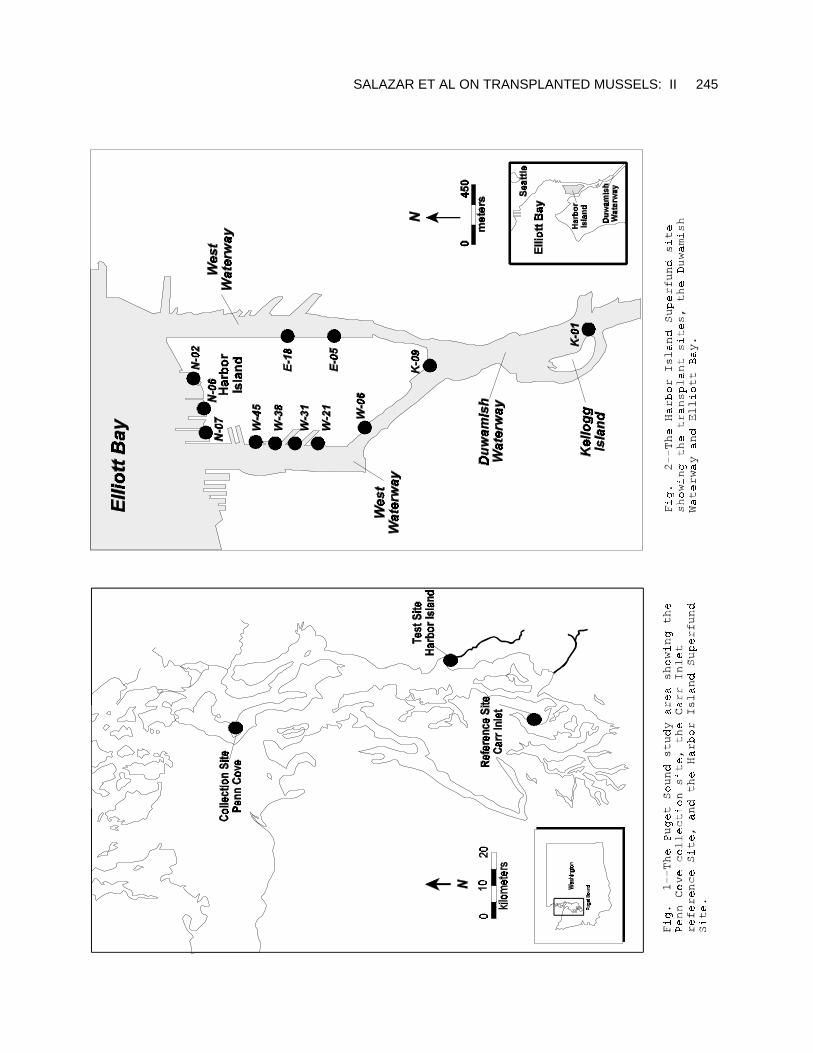
Harbor Island is a 400-acre industrial island which was added tothe Superfund National Priority List in 1983. It is located at themouth of the Duwamish River and adjacent to Elliott Bay, in Seattle,Washington (Fig. 1). The Island was constructed with dredged sedimentsfrom the Duwamish River at the turn of the century. In 1982, the U.S.Environmental Protection Agency (EPA) completed a preliminary assessmentto identify sources of industrial contaminants and the potential forhuman exposure. Potential sources of industrial contaminants included asecondary lead smelter, shipyards, metal recycling operations,foundries, a metal plating facility, ship and railroad cargo operations,and petroleum bulk fuel storage and transfer operations (Weston 1993).
Many studies have shown high concentrations of contaminants inboth sediments and biota from the Harbor Island area, as well asassociated adverse biological effects. Long and Chapman (1985) reportthat, among urban waterways in Puget Sound, the concentrations of metalsand organic compounds were among the highest in the Duwamish Waterway. Adverse effects in sediment bioassays have been reported for amphipods,worms, and fish (Chapman et al. 1985). The Elliott Bay Action Program(EBAP) used sediment chemistry, laboratory bioassays, effects on benthicinfauna, bioaccumulation potential, and persistence in the environmentto assess contaminated sediment. This EBAP study identified PAHs, PCBs,and trace elements as the contaminants of concern (PTI and Tetra Tech1988). There is strong evidence that contaminants in sediment areaccumulated by, and are affecting fish in this area. For example,relative to other contaminated Puget Sound sites, the concentrations ofPCBs in English sole and chlorinated hydrocarbons in juvenile Chinooksalmon, have been among the highest in the vicinity of the DuwamishWaterway (Malins et al. 1987; McCain et al. 1990; Varanasi et al. 1993). Tissue accumulations at similar sediment concentrations have beenassociated with reduced immunocompetence and reproduction (Varanasi etal. 1993). The highest incidences of fin erosion and liver lesions havebeen repeatedly found in bottom-dwelling fish collected from theDuwamish River (Malins et al. 1987; Stein et al. 1992; Varanasi et al.1992).
In 1992, EPA completed a Phase II Remedial Investigation (RI) forHarbor Island which included sampling sediments at 119 locations andanalyzing them for priority pollutants. The objective of that study wasto define the areas of sediment contamination which exceed the State ofWashington sediment management standards (SMS) (Washington StateDepartment of Ecology 1991) and identify those areas that requireremediation. The SMS are based on the Apparent Effects Threshold (AET)concept that identifies sediment contaminant concentrations above whichstatistically significant biological effects are expected to occur inmarine organisms (Barrick et al. 1989). This approach was developedusing Puget Sound data. As in the EBAP study, the Phase IIinvestigation concluded that sediments in a large number of areas aroundHarbor Island contained elevated concentrations of several contaminants. In contract to the EBAP data, cadmium concentrations frequently exceededthe state management standard. Tributyltin (TBT) contamination waswidespread and usually exceeded reference area concentrations (Weston1993), but TBT was not measured as part of EBAP.
As part of the Phase II Remedial Investigation, caged musselswere transplanted around Harbor Island to assess the potential forbioaccumulation and adverse biological effects. The value of biologicaltesting in assessing contamination is well known and bioaccumulationstudies using transplanted bivalves can demonstrate the extent to whichchemicals have migrated into food webs (Lee et al. 1993). Laboratorybioassays have been used to identify toxic sediments at Superfund sitesin Puget Sound (Chapman and Long 1983; Pastorok and Becker 1990). Theimportance of laboratory bioassays and integrated approaches have been
244 ENVIRONMENTAL TOXICOLOGY AND RISK ASSESSMENT: THIRD VOLUME
emphasized in the Sediment Quality Triad, which includes sedimentchemistry, laboratory bioassays, and benthic community assemblages (Longand Chapman 1985). The use of in-situ bioassays is gaining wideracceptance as a potentially powerful tool because it combines thecontrol of laboratory studies with the realism of field evaluations(Salazar and Salazar this volume), and the evaluation of sediments mustultimately be based on an ability to predict or measure biologicaleffects at specific sites (Long and Chapman 1985; U.S. EPA 1992).
Our primary objective was to evaluate the utility of transplantedmussels in augmenting standard approaches to ranking contaminatedsediments for regulatory purposes. In this paper we propose holisticassessments by combining mussel growth rates with estimates of potentialsediment and tissue toxicity; thereby expanding sediment evaluations toinclude the overlying water. We also answer the following: 1) Didmussels accumulate the contaminants of concern associated with thesediments?; 2) Did the stations differ with respect to bioaccumulationand growth in mussels?, 3) Was there a relationship between sedimentcontamination, bioaccumulation, and mussel growth?, and 4) Which sitesand which contaminants are of most concern?
EXPERIMENTAL METHODS
Mussel Deployment & Retrieval
Juvenile and adult mussels (Mytilus trossulus) were collected fromthe Penn Cove Mussel Farm, Coupeville, Washington (Fig. 1). Musselswere separated from the grow-out lines by carefully cutting the byssalthreads. Since previous studies have shown that excessive handling canreduce mussel survival and growth rate, extreme care was taken to avoidinjury that could stress the test animals (Salazar and Salazar thisvolume). Adult mussels in the 50 to 60 mm length size range wereselected with sizing bars (i.e., a sorting device with two sets of fixedbars, the interval between representing the lower and upper acceptablesize limits). This approach does not provide individual measurements. One hundred (100) adult mussels were selected at random and then placedinto each of 33 bags of flexible vexar mesh tubing (Norplex Industries,Auburn, WA) approximately 1.5 m long. To control crowding and allowequal exposure of all individuals, each bag was subdivided into 10clumps of 10 mussels each by constricting the mesh with plastic cableties. Ample slack was provided within each clump to allow sufficientspace for valve opening and growth during the test.
Juvenile mussels (24 to 30 mm length) were also selected bylength, but individuals were measured with vernier calipers to thenearest 0.1 mm. In addition to recording length data, whole-animal wet-weight measurements (nearest 0.01 gm) were made for each juvenilemussel. Eighteen (18) juvenile mussels were placed into each of 24cages. Cages were made of rigid plastic mesh cutlery trays (20 x 30 x4.5 cm; Hutzler Manufacturing, Canaan, CT) modified to provide 18separate compartments. We placed one individual per compartment to facilitate tracking survival and growth of individuals during the study. To ensure an equivalent distribution of juveniles among cages, the T0 weight and length data were subjected to statistical analyses before deployment. No significant differences were found(" = 0.05). On a per-cage basis, mean whole-animal wet weights ranged from 1.46 to 1.61 g (overall range of individuals: 1.05 to 2.28 g), and mean length from 26.3 to 26.7 mm (overall range 23.9 to 29.7 mm).
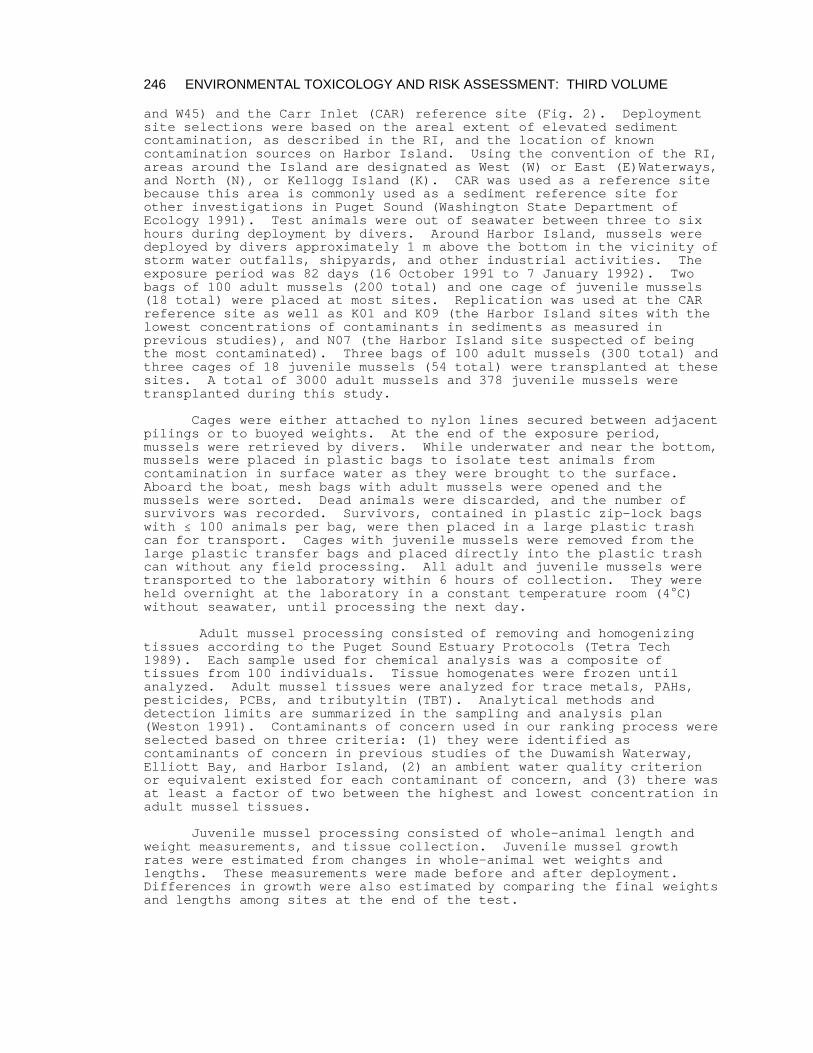
After distribution to their respective cages, all adults andjuveniles were tied to a pier and suspended in Penn Cove overnight. After this 12-hour holding period, animals were put into ice chestswithout seawater and transported to the 13 test sites: 12 sites aroundHarbor Island (E05, E18, K01, K09, N02, N06, N07, W06, W21, W31, W38,
SALAZAR ET AL ON TRANSPLANTED MUSSELS: II 245
246 ENVIRONMENTAL TOXICOLOGY AND RISK ASSESSMENT: THIRD VOLUME
and W45) and the Carr Inlet (CAR) reference site (Fig. 2). Deploymentsite selections were based on the areal extent of elevated sedimentcontamination, as described in the RI, and the location of knowncontamination sources on Harbor Island. Using the convention of the RI,areas around the Island are designated as West (W) or East (E)Waterways,and North (N), or Kellogg Island (K). CAR was used as a reference sitebecause this area is commonly used as a sediment reference site forother investigations in Puget Sound (Washington State Department ofEcology 1991). Test animals were out of seawater between three to sixhours during deployment by divers. Around Harbor Island, mussels weredeployed by divers approximately 1 m above the bottom in the vicinity ofstorm water outfalls, shipyards, and other industrial activities. Theexposure period was 82 days (16 October 1991 to 7 January 1992). Twobags of 100 adult mussels (200 total) and one cage of juvenile mussels(18 total) were placed at most sites. Replication was used at the CARreference site as well as K01 and K09 (the Harbor Island sites with thelowest concentrations of contaminants in sediments as measured inprevious studies), and N07 (the Harbor Island site suspected of beingthe most contaminated). Three bags of 100 adult mussels (300 total) andthree cages of 18 juvenile mussels (54 total) were transplanted at thesesites. A total of 3000 adult mussels and 378 juvenile mussels weretransplanted during this study.
Cages were either attached to nylon lines secured between adjacent pilings or to buoyed weights. At the end of the exposure period, mussels were retrieved by divers. While underwater and near the bottom, mussels were placed in plastic bags to isolate test animals from contamination in surface water as they were brought to the surface. Aboard the boat, mesh bags with adult mussels were opened and the mussels were sorted. Dead animals were discarded, and the number of survivors was recorded. Survivors, contained in plastic zip-lock bags with # 100 animals per bag, were then placed in a large plastic trash can for transport. Cages with juvenile mussels were removed from the large plastic transfer bags and placed directly into the plastic trash can without any field processing. All adult and juvenile mussels were transported to the laboratory within 6 hours of collection. They were held overnight at the laboratory in a constant temperature room (4EC) without seawater, until processing the next day.
Adult mussel processing consisted of removing and homogenizingtissues according to the Puget Sound Estuary Protocols (Tetra Tech1989). Each sample used for chemical analysis was a composite oftissues from 100 individuals. Tissue homogenates were frozen untilanalyzed. Adult mussel tissues were analyzed for trace metals, PAHs,pesticides, PCBs, and tributyltin (TBT). Analytical methods anddetection limits are summarized in the sampling and analysis plan(Weston 1991). Contaminants of concern used in our ranking process wereselected based on three criteria: (1) they were identified ascontaminants of concern in previous studies of the Duwamish Waterway,Elliott Bay, and Harbor Island, (2) an ambient water quality criterionor equivalent existed for each contaminant of concern, and (3) there wasat least a factor of two between the highest and lowest concentration inadult mussel tissues.
Juvenile mussel processing consisted of whole-animal length andweight measurements, and tissue collection. Juvenile mussel growthrates were estimated from changes in whole-animal wet weights andlengths. These measurements were made before and after deployment. Differences in growth were also estimated by comparing the final weightsand lengths among sites at the end of the test.
SALAZAR ET AL ON TRANSPLANTED MUSSELS: II 247
RI & EBAP Sediment Data
To provide the best estimate of sediment contamination at eachmussel deployment site, we calculated the mean concentration ofcontaminants using data for sampling stations located within a 150-mradius of each mussel deployment site. Both RI and EBAP (PTI and TetraTech 1988) sediment chemistry data were used in these calculations. Weselected the same suite of contaminants that met our selection criteriafor tissue contaminants of concern. Three to ten sediment samplingstations from either the EBAP or RI data sets fell within the 150-mradius for each mussel station. These means were used in normalization,ranking, and statistical analyses. Details regarding sediment sampling,handling, and analytical techniques are provided in Weston (1991, 1993).
Potential problems have recently been identified for the RIsediment data including: changes in detection limits among samples, lowrecovery of chemicals in some spiked samples, and the presence of highcontaminant concentrations in the blanks. The cadmium and TBT datapresented in the RI were inexplicably higher than previously reportedvalues. This is particularly important because in many areas aroundHarbor Island the cleanup rankings are being driven by both cadmium andTBT. Although the concentration of cadmium in sediment was reported asan order of magnitude higher relative to previous studies, the tissuecadmium concentrations did not vary enough to meet our selectioncriteria, so we did not use cadmium in the rankings. We used TBT in therankings because concentrations were elevated in both sediment andtissue.
Toxicity Normalization & Statistical Analysis
Growth in juvenile mussels (mg/wk/mussel) and bioaccumulation inadult mussel tissues (from the present study) were combined withpreviously collected sediment chemistry data and used in apreponderance-of-evidence approach to rank contaminated sites. Juvenilemussel growth rates, as estimated by increases in weight (mg/wk) wereranked from 1 (low) to 13 (high). We used growth rate based on weightrather than growth rate based on length, final weights, or final lengthsbecause weight-growth measurements have been more informative inprevious studies (Salazar and Salazar this volume). For replicatedstations, significant differences in growth among stations weredetermined with an Analysis of Variance (ANOVA) and Duncan's NewMultiple Range Test (Zar 1974; STATISTICA, StatSoft Inc., Tulsa, OK,1991).
The tissue chemistry data from adult mussels were toxicity-normalized and ranked. To normalize the data, the concentrations ofcontaminants in tissues were divided by their respective Chronic AmbientWater Quality Criteria (AWQC) (U.S. EPA, 1986) to estimate relativepotential toxicity. We chose these criteria because: (1) there are notissue-based toxicity criteria, (2) concentrations of contaminants inmussel tissues have been related to water concentrations (Salazar andSalazar this volume), (3) there is a relationship between tissueconcentrations and bioeffects in mussels (Salazar and Salazar thisvolume), and (4) there is some support for this procedure (Cook et al.1992). In the tissue residue approach, maximum allowable tissueconcentrations (MATCs) are estimated by multiplying chronic waterquality criteria by bioconcentration factors (Cook et al. 1992),recognizing these MATCs may underestimate or overestimate measuredtissue concentrations that elicit adverse effects (McKim and Schmieder,1991; McCarty, 1991). Since there is no AWQC for TBT, we used theproposed State of California criterion (Water Resources Control Board1991). Ensuing quotients for metals (arsenic, copper, lead, silver, andzinc), total PAHs (TPAHs = sum of Acenaphthylene, Ancenaphthene,Anthracene, Benzo(a)anthracene, Benzo(a)pyrene, Benzo(b)fluoranthene,Benzo(g,h,i)perylene, Benzo(k)fluoranthene, Chrysene, Fluoranthene,
248 ENVIRONMENTAL TOXICOLOGY AND RISK ASSESSMENT: THIRD VOLUME
Fluorene, Ideno(1,2,3-cd)pyrene, Phenanthrene, and Pyrene), PCBs (sum ofsix congeners), and TBT were summed for each station. Stations werethen ranked from lowest (1) to highest (13) using the summed quotientsof these tissue contamination units. A tissue contamination unit >1suggests potential adverse effects.
Relative sediment toxicity was estimated by dividing the meancontaminant concentrations at each station by their respective EffectsRange - Median (ERM) concentration (Long and Morgan 1991; Long andMacDonald 1992). These ERM guidelines were developed using three basicmethods to evaluate data gathered in a variety of geographic areas: equilibrium partitioning, sediment bioassays, and synoptic chemical andbiological data from field surveys. The ERM is the concentrationapproximately midway in the range of reported values associated withbiological effects. Since there was no published ERM for TBT, we usedthe Puget Sound Dredged Disposal Analysis (PSDDA 1989) screeningguideline which is similar to that suggested by MacDonald (personalcommunication). We normalized the data because contamination is not abioeffect and rankings based on absolute concentrations do not accountfor potential sediment toxicity. A potential sediment toxicitycontamination unit > 1 indicates possible adverse effects. Potentialsediment toxicity units for metals (arsenic, chromium, copper, lead,mercury, and zinc), total PAHs, total PCBs, and TBT were summed for eachstation and ranked from lowest (1) to highest (13).
Overall comparisons among stations based on sediment chemistry,tissue chemistry, and growth were made using ranks, scatterplots, andregression analyses. An overall rank was calculated for each station bysumming the individual ranks for sediment chemistry, tissue chemistry,and growth. The relationship between growth, sediment toxicity, andtissue toxicity was examined using a three-dimensional scatterplot. Thesediment data were log-transformed to spread out the data points alongthat axis. Various models of growth, as a function of potentialsediment and tissue toxicity, were evaluated to determine whichtransformations would provide (1) improved normality and linearity,(2) the highest r2 (greatest overall significance), and (3) significantindependent contributions by toxicity-normalized sediment and tissuedata. A multiple linear regression was performed and residuals weretested for normality and outliers. The correlation coefficient relatingnormalized tissue and sediment data was calculated (STATISTICA, StatSoftInc., Tulsa, OK, 1991).
RESULTS
Sediment Chemistry
The concentrations of almost all contaminants were significantlyhigher in sediments around Harbor Island than in sediments from the CarrInlet reference site (Table 1). The biggest differences occurred withTBT and lead where the most contaminated sites had concentrations thatwere factors of 920 and 230 above reference. Several of the least-contaminated Harbor Island sites were similar to CAR with respect tosediment contamination. The potential for toxicity associated withthese contaminated sediments is shown in Table 2, where Station N07 hasthe highest ranking using ERM-normalized data. Station N07 had thegreatest exceedances of the ERM for more contaminants than any otherstation and exhibited the greatest separation between both the otherHarbor Island sites and the reference site. The ranking process wasdriven primarily by TBT. Other contaminants also contributed topotential sediment toxicity. PCBs, for example, were highest in theEast Waterway stations (E05 and E18).

SALAZAR ET AL ON TRANSPLANTED MUSSELS: II 249
Table 1--Contaminant concentrations (mg/kg) in sediments from HarborIsland and the Reference Site in Carr Inlet (CAR). Also shown arehighest and lowest Harbor Island values relative to CAR and the ERM usedto create normalized concentrations in Table 2.
As Cr Cu Pb Hg Zn TPAH PCBs TBT CAR 2.4 40 18 1.3 0.035 42 3.9 0.033 0.02 E05 12 56 127 77 0.844 159 16 0.655 1.42 E18 12 76 119 96 0.442 187 9 0.638 1.16 K01 8 44 142 22 0.134 107 8 0.178 0.18 K09 10 81 85 34 0.128 117 11 0.296 0.21 N02 11 51 66 31 0.213 127 50 0.177 0.40 N06 23 92 275 88 0.679 280 28 0.094 5.21 N07 57 55 965 297 1.950 592 37 0.503 18.41 W06 9 47 90 60 0.331 121 8 0.148 0.62 W21 16 84 166 86 0.538 222 19 0.168 2.01 W31 22 84 276 261 0.582 362 20 0.209 3.37 W38 23 93 221 221 0.739 299 15 0.292 0.38 W45 24 89 228 194 0.888 281 15 0.280 1.07
High CAR
24 2 53 230 56 14 13 20 920
Low CAR
3 1 4 17 4 3 2 3 9
ERM 85 145 390 110 1.3 270 35 0.4 0.03
Table 2--ERM-normalized contaminant concentrations in sediments from Harbor Island and the Reference Site in Carr Inlet (CAR). TPAH and PCBs as in Table 1. R = overall rank;3NC = sum of normalized concentrations.
As Cr Cu Pb Hg Zn TPAH PCBs TBT 33NC R CAR 0.03 0.28 0.05 0.01 0.03 0.16 0.11 0.08 0.67 1 1 K01 0.10 0.30 0.36 0.20 0.10 0.40 0.23 0.45 6 8 2 K09 0.12 0.56 0.22 0.31 0.10 0.43 0.32 0.74 7 10 3 N02 0.13 0.35 0.17 0.28 0.16 0.47 1.42 0.44 13 17 4 W38 0.27 0.64 0.57 2.01 0.57 1.11 0.43 0.73 13 19 5 W06 0.10 0.32 0.23 0.54 0.25 0.45 0.23 0.37 21 23 6 W45 0.29 0.61 0.59 1.76 0.68 1.04 0.43 0.70 36 42 7 E18 0.15 0.52 0.30 0.87 0.34 0.69 0.26 1.60 39 43 8 E05 0.14 0.39 0.32 0.70 0.65 0.59 0.45 1.64 47 52 9 W21 0.19 0.58 0.42 1.35 0.41 0.82 0.53 0.42 67 72 10 W31 0.26 0.58 0.71 2.37 0.45 1.34 0.57 0.52 112 119 11 N06 0.26 0.63 0.70 0.80 0.52 1.04 0.80 0.24 174 179 12 N07 0.67 0.38 2.48 2.70 1.50 2.19 1.05 1.26 614 626 13
250 ENVIRONMENTAL TOXICOLOGY AND RISK ASSESSMENT: THIRD VOLUME
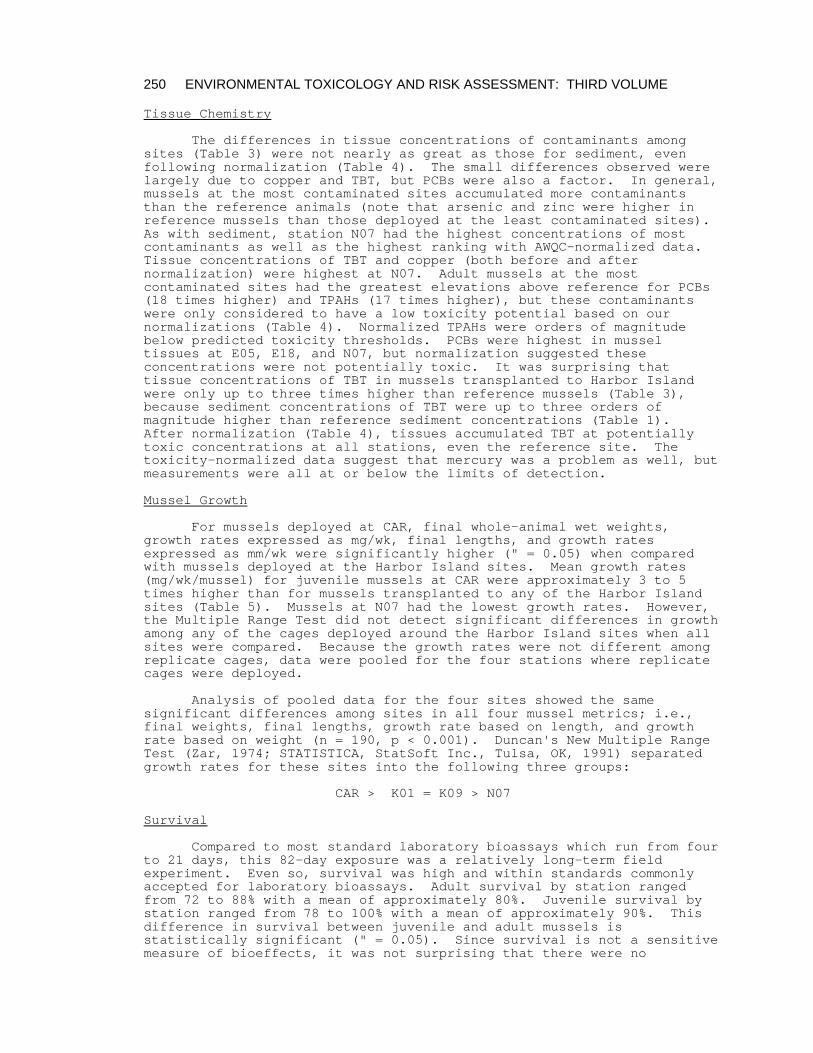
Tissue Chemistry
The differences in tissue concentrations of contaminants amongsites (Table 3) were not nearly as great as those for sediment, evenfollowing normalization (Table 4). The small differences observed werelargely due to copper and TBT, but PCBs were also a factor. In general,mussels at the most contaminated sites accumulated more contaminantsthan the reference animals (note that arsenic and zinc were higher inreference mussels than those deployed at the least contaminated sites). As with sediment, station N07 had the highest concentrations of mostcontaminants as well as the highest ranking with AWQC-normalized data. Tissue concentrations of TBT and copper (both before and afternormalization) were highest at N07. Adult mussels at the mostcontaminated sites had the greatest elevations above reference for PCBs(18 times higher) and TPAHs (17 times higher), but these contaminantswere only considered to have a low toxicity potential based on ournormalizations (Table 4). Normalized TPAHs were orders of magnitudebelow predicted toxicity thresholds. PCBs were highest in musseltissues at E05, E18, and N07, but normalization suggested theseconcentrations were not potentially toxic. It was surprising thattissue concentrations of TBT in mussels transplanted to Harbor Islandwere only up to three times higher than reference mussels (Table 3),because sediment concentrations of TBT were up to three orders ofmagnitude higher than reference sediment concentrations (Table 1). After normalization (Table 4), tissues accumulated TBT at potentiallytoxic concentrations at all stations, even the reference site. Thetoxicity-normalized data suggest that mercury was a problem as well, butmeasurements were all at or below the limits of detection.
Mussel Growth
For mussels deployed at CAR, final whole-animal wet weights, growth rates expressed as mg/wk, final lengths, and growth rates expressed as mm/wk were significantly higher (" = 0.05) when compared with mussels deployed at the Harbor Island sites. Mean growth rates (mg/wk/mussel) for juvenile mussels at CAR were approximately 3 to 5 times higher than for mussels transplanted to any of the Harbor Island sites (Table 5). Mussels at N07 had the lowest growth rates. However, the Multiple Range Test did not detect significant differences in growth among any of the cages deployed around the Harbor Island sites when all sites were compared. Because the growth rates were not different among replicate cages, data were pooled for the four stations where replicate cages were deployed.
Analysis of pooled data for the four sites showed the samesignificant differences among sites in all four mussel metrics; i.e.,final weights, final lengths, growth rate based on length, and growthrate based on weight (n = 190, p < 0.001). Duncan's New Multiple RangeTest (Zar, 1974; STATISTICA, StatSoft Inc., Tulsa, OK, 1991) separatedgrowth rates for these sites into the following three groups:
CAR > K01 = K09 > N07
Survival
Compared to most standard laboratory bioassays which run from four to 21 days, this 82-day exposure was a relatively long-term field experiment. Even so, survival was high and within standards commonly accepted for laboratory bioassays. Adult survival by station ranged from 72 to 88% with a mean of approximately 80%. Juvenile survival by station ranged from 78 to 100% with a mean of approximately 90%. This difference in survival between juvenile and adult mussels is statistically significant (" = 0.05). Since survival is not a sensitive measure of bioeffects, it was not surprising that there were no
SALAZAR ET AL ON TRANSPLANTED MUSSELS: II 251
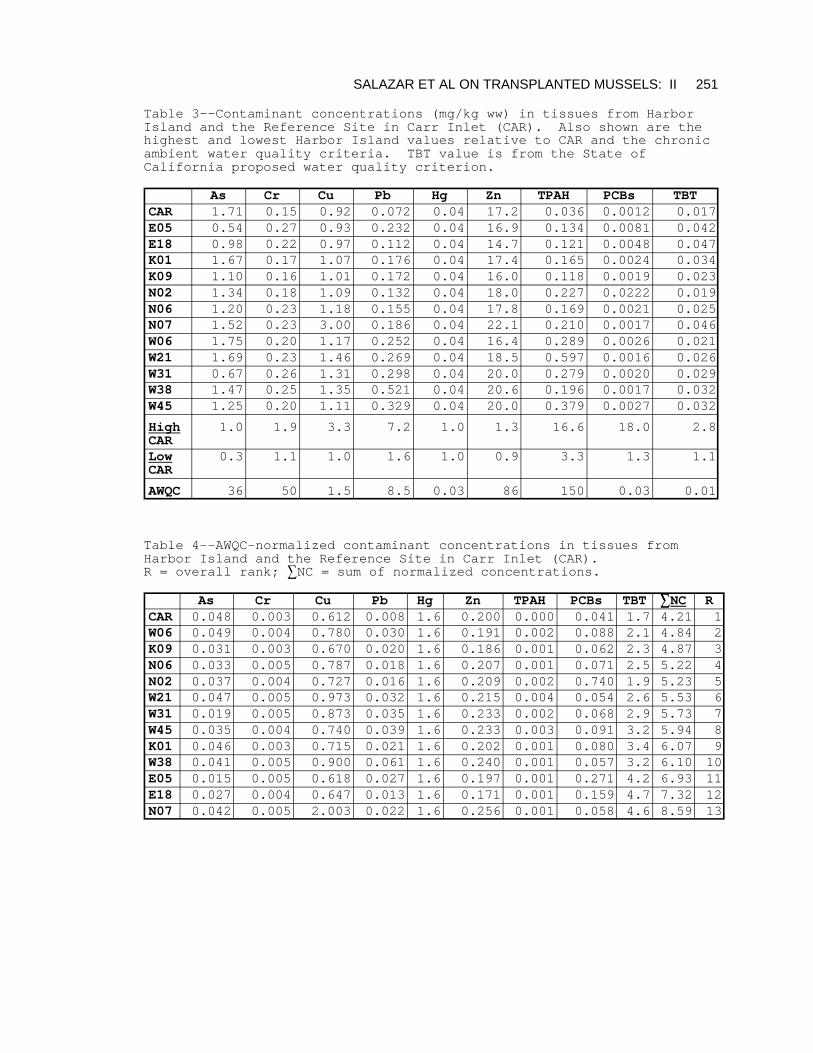
Table 3--Contaminant concentrations (mg/kg ww) in tissues from HarborIsland and the Reference Site in Carr Inlet (CAR). Also shown are thehighest and lowest Harbor Island values relative to CAR and the chronicambient water quality criteria. TBT value is from the State ofCalifornia proposed water quality criterion.
As Cr Cu Pb Hg Zn TPAH PCBs TBT CAR 1.71 0.15 0.92 0.072 0.04 17.2 0.036 0.0012 0.017 E05 0.54 0.27 0.93 0.232 0.04 16.9 0.134 0.0081 0.042 E18 0.98 0.22 0.97 0.112 0.04 14.7 0.121 0.0048 0.047 K01 1.67 0.17 1.07 0.176 0.04 17.4 0.165 0.0024 0.034 K09 1.10 0.16 1.01 0.172 0.04 16.0 0.118 0.0019 0.023 N02 1.34 0.18 1.09 0.132 0.04 18.0 0.227 0.0222 0.019 N06 1.20 0.23 1.18 0.155 0.04 17.8 0.169 0.0021 0.025 N07 1.52 0.23 3.00 0.186 0.04 22.1 0.210 0.0017 0.046 W06 1.75 0.20 1.17 0.252 0.04 16.4 0.289 0.0026 0.021 W21 1.69 0.23 1.46 0.269 0.04 18.5 0.597 0.0016 0.026 W31 0.67 0.26 1.31 0.298 0.04 20.0 0.279 0.0020 0.029 W38 1.47 0.25 1.35 0.521 0.04 20.6 0.196 0.0017 0.032 W45 1.25 0.20 1.11 0.329 0.04 20.0 0.379 0.0027 0.032
High CAR
1.0 1.9 3.3 7.2 1.0 1.3 16.6 18.0 2.8
Low CAR
0.3 1.1 1.0 1.6 1.0 0.9 3.3 1.3 1.1
AWQC 36 50 1.5 8.5 0.03 86 150 0.03 0.01
Table 4--AWQC-normalized contaminant concentrations in tissues fromHarbor Island and the Reference Site in Carr Inlet (CAR). R = overall rank; 3NC = sum of normalized concentrations.
As Cr Cu Pb Hg Zn TPAH PCBs TBT 33NC R CAR 0.048 0.003 0.612 0.008 1.6 0.200 0.000 0.041 1.7 4.21 1 W06 0.049 0.004 0.780 0.030 1.6 0.191 0.002 0.088 2.1 4.84 2 K09 0.031 0.003 0.670 0.020 1.6 0.186 0.001 0.062 2.3 4.87 3 N06 0.033 0.005 0.787 0.018 1.6 0.207 0.001 0.071 2.5 5.22 4 N02 0.037 0.004 0.727 0.016 1.6 0.209 0.002 0.740 1.9 5.23 5 W21 0.047 0.005 0.973 0.032 1.6 0.215 0.004 0.054 2.6 5.53 6 W31 0.019 0.005 0.873 0.035 1.6 0.233 0.002 0.068 2.9 5.73 7 W45 0.035 0.004 0.740 0.039 1.6 0.233 0.003 0.091 3.2 5.94 8 K01 0.046 0.003 0.715 0.021 1.6 0.202 0.001 0.080 3.4 6.07 9 W38 0.041 0.005 0.900 0.061 1.6 0.240 0.001 0.057 3.2 6.10 10 E05 0.015 0.005 0.618 0.027 1.6 0.197 0.001 0.271 4.2 6.93 11 E18 0.027 0.004 0.647 0.013 1.6 0.171 0.001 0.159 4.7 7.32 12 N07 0.042 0.005 2.003 0.022 1.6 0.256 0.001 0.058 4.6 8.59 13
252 ENVIRONMENTAL TOXICOLOGY AND RISK ASSESSMENT: THIRD VOLUME
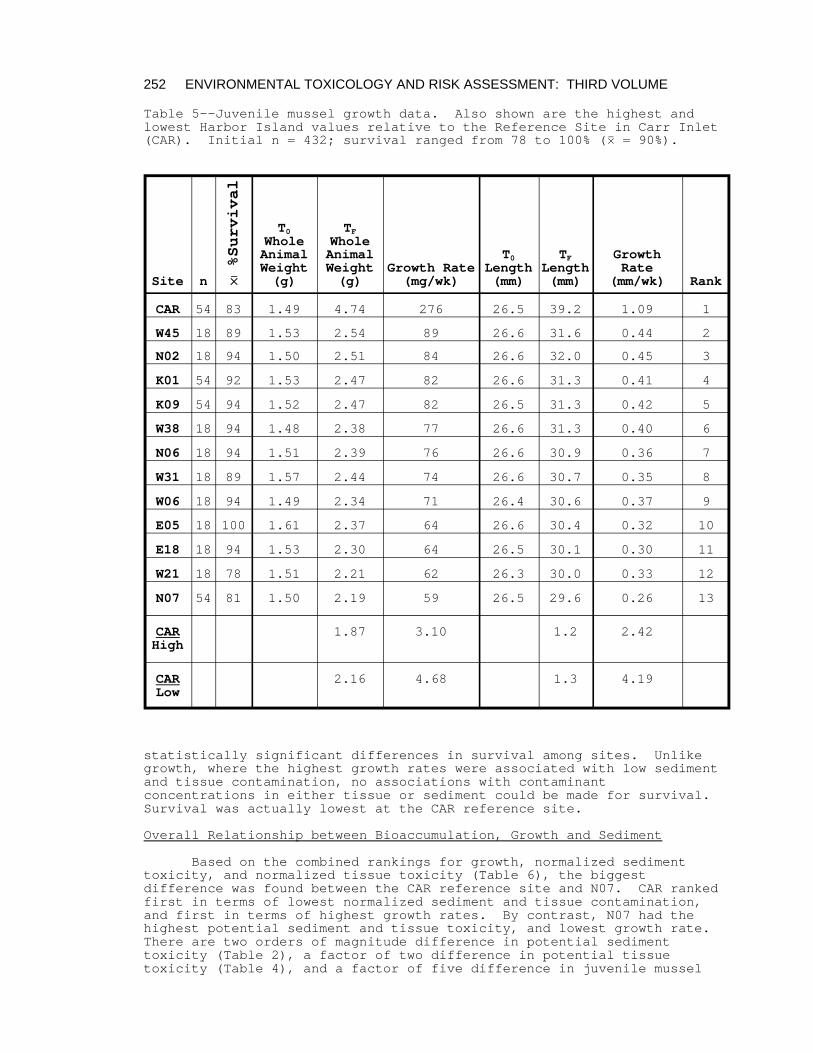
Table 5--Juvenile mussel growth data. Also shown are the highest and lowest Harbor Island values relative to the Reference Site in Carr Inlet (CAR). Initial n = 432; survival ranged from 78 to 100% (0 = 90%).
Site n
%Survival
00
T0 Whole Animal Weight (g)
TF Whole Animal Weight (g)
Growth Rate (mg/wk)
T0 Length (mm)
TF Length (mm)
Growth Rate
(mm/wk) Rank
CAR 54 83 1.49 4.74 276 26.5 39.2 1.09 1
W45 18 89 1.53 2.54 89 26.6 31.6 0.44 2
N02 18 94 1.50 2.51 84 26.6 32.0 0.45 3
K01 54 92 1.53 2.47 82 26.6 31.3 0.41 4
K09 54 94 1.52 2.47 82 26.5 31.3 0.42 5
W38 18 94 1.48 2.38 77 26.6 31.3 0.40 6
N06 18 94 1.51 2.39 76 26.6 30.9 0.36 7
W31 18 89 1.57 2.44 74 26.6 30.7 0.35 8
W06 18 94 1.49 2.34 71 26.4 30.6 0.37 9
E05 18 100 1.61 2.37 64 26.6 30.4 0.32 10
E18 18 94 1.53 2.30 64 26.5 30.1 0.30 11
W21 18 78 1.51 2.21 62 26.3 30.0 0.33 12
N07 54 81 1.50 2.19 59 26.5 29.6 0.26 13
CAR High
1.87 3.10 1.2 2.42
CAR Low
2.16 4.68 1.3 4.19
statistically significant differences in survival among sites. Unlikegrowth, where the highest growth rates were associated with low sedimentand tissue contamination, no associations with contaminantconcentrations in either tissue or sediment could be made for survival. Survival was actually lowest at the CAR reference site.
Overall Relationship between Bioaccumulation, Growth and Sediment
Based on the combined rankings for growth, normalized sedimenttoxicity, and normalized tissue toxicity (Table 6), the biggestdifference was found between the CAR reference site and N07. CAR rankedfirst in terms of lowest normalized sediment and tissue contamination,and first in terms of highest growth rates. By contrast, N07 had thehighest potential sediment and tissue toxicity, and lowest growth rate. There are two orders of magnitude difference in potential sedimenttoxicity (Table 2), a factor of two difference in potential tissuetoxicity (Table 4), and a factor of five difference in juvenile mussel
SALAZAR ET AL ON TRANSPLANTED MUSSELS: II 253
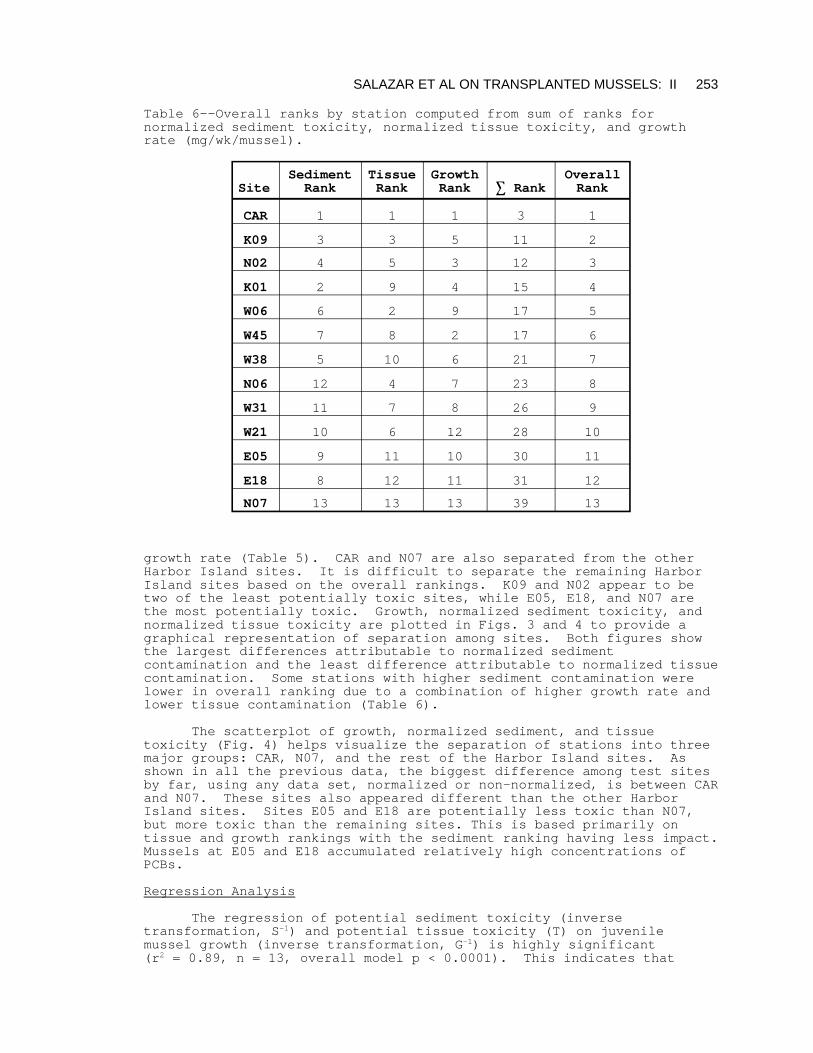
Table 6--Overall ranks by station computed from sum of ranks fornormalized sediment toxicity, normalized tissue toxicity, and growthrate (mg/wk/mussel).
Site Sediment Rank
Tissue Rank
Growth Rank 33 Rank
Overall Rank
CAR 1 1 1 3 1
K09 3 3 5 11 2
N02 4 5 3 12 3
K01 2 9 4 15 4
W06 6 2 9 17 5
W45 7 8 2 17 6
W38 5 10 6 21 7
N06 12 4 7 23 8
W31 11 7 8 26 9
W21 10 6 12 28 10
E05 9 11 10 30 11
E18 8 12 11 31 12
N07 13 13 13 39 13
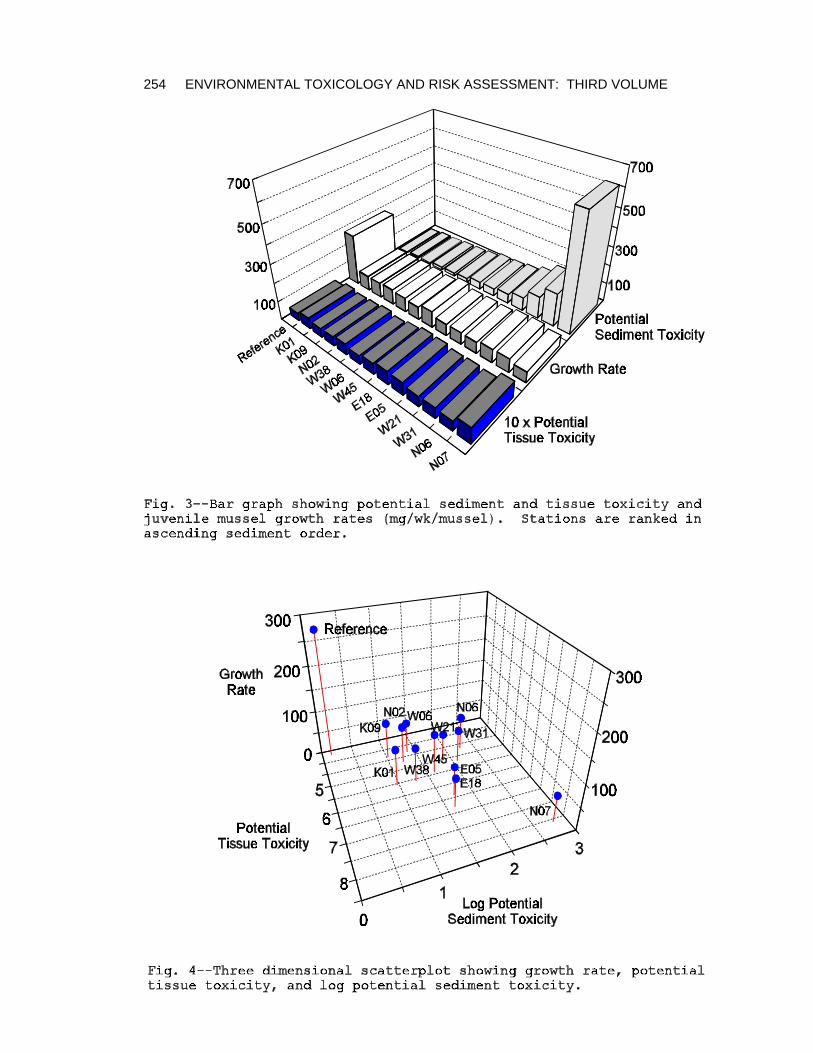
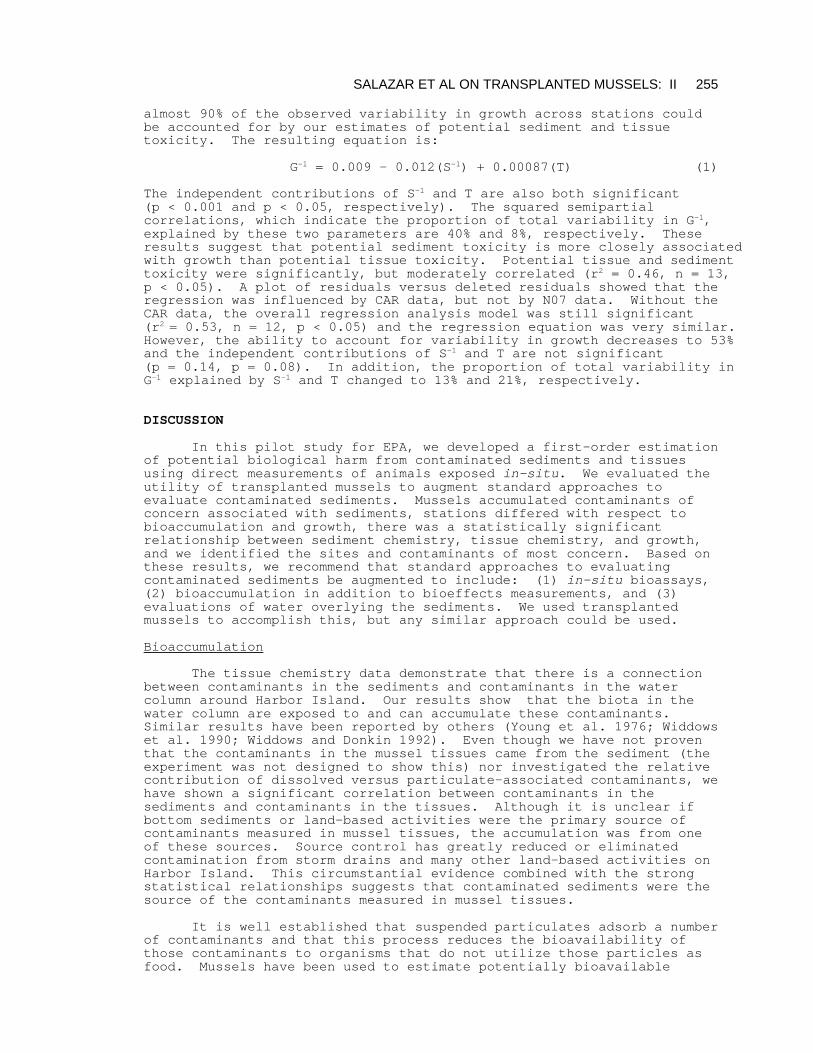
growth rate (Table 5). CAR and N07 are also separated from the otherHarbor Island sites. It is difficult to separate the remaining HarborIsland sites based on the overall rankings. K09 and N02 appear to betwo of the least potentially toxic sites, while E05, E18, and N07 arethe most potentially toxic. Growth, normalized sediment toxicity, andnormalized tissue toxicity are plotted in Figs. 3 and 4 to provide agraphical representation of separation among sites. Both figures showthe largest differences attributable to normalized sedimentcontamination and the least difference attributable to normalized tissuecontamination. Some stations with higher sediment contamination werelower in overall ranking due to a combination of higher growth rate andlower tissue contamination (Table 6).
The scatterplot of growth, normalized sediment, and tissuetoxicity (Fig. 4) helps visualize the separation of stations into threemajor groups: CAR, N07, and the rest of the Harbor Island sites. Asshown in all the previous data, the biggest difference among test sitesby far, using any data set, normalized or non-normalized, is between CARand N07. These sites also appeared different than the other HarborIsland sites. Sites E05 and E18 are potentially less toxic than N07,but more toxic than the remaining sites. This is based primarily ontissue and growth rankings with the sediment ranking having less impact. Mussels at E05 and E18 accumulated relatively high concentrations ofPCBs.
Regression Analysis
The regression of potential sediment toxicity (inversetransformation, S-1) and potential tissue toxicity (T) on juvenilemussel growth (inverse transformation, G-1) is highly significant (r2 = 0.89, n = 13, overall model p < 0.0001). This indicates that
254 ENVIRONMENTAL TOXICOLOGY AND RISK ASSESSMENT: THIRD VOLUME
SALAZAR ET AL ON TRANSPLANTED MUSSELS: II 255
almost 90% of the observed variability in growth across stations couldbe accounted for by our estimates of potential sediment and tissuetoxicity. The resulting equation is:
G-1 = 0.009 - 0.012(S-1) + 0.00087(T) (1)
G
The independent contributions of S-1 and T are also both significant (p < 0.001 and p < 0.05, respectively). The squared semipartialcorrelations, which indicate the proportion of total variability in G-1,explained by these two parameters are 40% and 8%, respectively. Theseresults suggest that potential sediment toxicity is more closely associatedwith growth than potential tissue toxicity. Potential tissue and sedimenttoxicity were significantly, but moderately correlated (r2 = 0.46, n = 13, p < 0.05). A plot of residuals versus deleted residuals showed that theregression was influenced by CAR data, but not by N07 data. Without theCAR data, the overall regression analysis model was still significant (r2 = 0.53, n = 12, p < 0.05) and the regression equation was very similar. However, the ability to account for variability in growth decreases to 53%and the independent contributions of S-1 and T are not significant (p = 0.14, p = 0.08). In addition, the proportion of total variability in-1 explained by S-1 and T changed to 13% and 21%, respectively.
DISCUSSION
In this pilot study for EPA, we developed a first-order estimationof potential biological harm from contaminated sediments and tissuesusing direct measurements of animals exposed in-situ. We evaluated theutility of transplanted mussels to augment standard approaches toevaluate contaminated sediments. Mussels accumulated contaminants ofconcern associated with sediments, stations differed with respect tobioaccumulation and growth, there was a statistically significantrelationship between sediment chemistry, tissue chemistry, and growth,and we identified the sites and contaminants of most concern. Based onthese results, we recommend that standard approaches to evaluatingcontaminated sediments be augmented to include: (1) in-situ bioassays,(2) bioaccumulation in addition to bioeffects measurements, and (3)evaluations of water overlying the sediments. We used transplantedmussels to accomplish this, but any similar approach could be used.
Bioaccumulation
The tissue chemistry data demonstrate that there is a connectionbetween contaminants in the sediments and contaminants in the watercolumn around Harbor Island. Our results show that the biota in thewater column are exposed to and can accumulate these contaminants. Similar results have been reported by others (Young et al. 1976; Widdowset al. 1990; Widdows and Donkin 1992). Even though we have not proventhat the contaminants in the mussel tissues came from the sediment (theexperiment was not designed to show this) nor investigated the relativecontribution of dissolved versus particulate-associated contaminants, wehave shown a significant correlation between contaminants in thesediments and contaminants in the tissues. Although it is unclear ifbottom sediments or land-based activities were the primary source ofcontaminants measured in mussel tissues, the accumulation was from oneof these sources. Source control has greatly reduced or eliminatedcontamination from storm drains and many other land-based activities onHarbor Island. This circumstantial evidence combined with the strongstatistical relationships suggests that contaminated sediments were thesource of the contaminants measured in mussel tissues.
It is well established that suspended particulates adsorb a numberof contaminants and that this process reduces the bioavailability ofthose contaminants to organisms that do not utilize those particles asfood. Mussels have been used to estimate potentially bioavailable
256 ENVIRONMENTAL TOXICOLOGY AND RISK ASSESSMENT: THIRD VOLUME
contaminants because of their ability to filter seawater for dissolved,phytoplankton-associated, and sediment-sorbed contamination (Hermsen etal. 1994; Ekelund et al. 1987; Widdows and Donkin 1992; Salazar 1986). One of the reasons that many of these sediment-sorbed contaminants areavailable to mussels is that mussels are able to utilize the organiccoatings on these particles as food (Kiorboe et al. 1981). The presenceof suspended sediments in laboratory bioassays has been shown to enhancethe bioaccumulation of TBT (Waldock and Thain 1983; Laughlin et al.1986) and other chemicals (Hermsen et al. 1994; Ekelund et al. 1987).
Because the mussels in our study were not depurated after fieldexposure and retrieval, bioaccumulation may have been overestimated. Previous investigators have shown that the mussel gut can containsignificant amounts of sediment-sorbed contaminants (Lobel et al. 1991;Metcalfe-Smith et al. 1992; Robinson et al. 1993). It is not clear towhat extent this may have biased our results, but the limited dataavailable suggests that this may not be a problem for all of thecontaminants measured in our study. Furthermore, even if thecontaminants were not bioavailable and had not been incorporated intomussel tissues, the transplanted animals served as effectiveaccumulators of contaminated, suspended sediment. Unless thecontaminants were adsorbed on particles to be rejected as pseudofeces,these accumulated contaminants could be available. Nevertheless, thesignificant correlation between growth and tissue accumulation suggeststhat the contaminants were available to mussels and that thismeasurement may be more appropriate for predicting bioeffects thanmeasuring contaminants in sediment.
Growth
We used juvenile mussel growth as an indicator of water columneffects associated with contaminated sediments. As in previous studies,our results (Table 5) show that growth is a more sensitive indicator ofbiological effects than survival and that growth based on increase inweight is more discriminating than growth based on increase in length(Salazar and Salazar this volume). For the replicated sites, juvenilemussel growth could discriminate bioeffects between the control site andsome contaminated sites around Harbor Island (Table 2). This suggeststhat increased replication could help discriminate differences amongother Harbor Island sites.
It is possible that growth rates around Harbor Island could besignificantly lower than those in Carr Inlet because of differences inthe natural physical and chemical factors that affect mussel growthrates such as temperature, salinity, current speed, etc. Similarly,factors such as sediment grain size, diet, and pre-exposure conditionscan affect the results of laboratory bioassays. However, despite theinfluence of other factors that could affect growth, we are convincedthat contaminants played a major role in affecting growth since thehighest growth rates were associated with the lowest toxicity-normalizedsediment and tissue contamination, and vice versa. In addition, aftercontrolling for sediment toxicity, higher growth rates weresignificantly (p < 0.05) associated with lower concentrations ofcontaminants (Equation 1).
Since mussel growth is such an important component of thisassessment procedure and there are so many natural factors affectinggrowth, these factors should be more thoroughly evaluated in futurestudies. To evaluate site-specific effects, in situ measurements ofappropriate natural factors should be included. To help explain theeffects of these factors on growth, laboratory bioassays controllingthese factors should also be included.
SALAZAR ET AL ON TRANSPLANTED MUSSELS: II 257
Normalizing and Combining Sediment and Tissue Concentrations
There are inherent problems in any scheme used to estimate thecombined potential toxicity attributable to a suite of contaminants. Despite this limitation, we have demonstrated the utility of producing asingle estimate of potential tissue or sediment toxicity for comparisonwith mussel growth rates. The extent to which this approach may havebiased the results is unknown, because the toxicity of our selectedcontaminants may not be additive. We attempted to weight contaminantson the basis of available and biologically relevant factors. Becausethe ERMs include sediment chemistry, community effects, laboratorybioassays, and equilibrium partitioning, they are one of the mostintegrative guidelines that can be used to normalize sedimentconcentrations. Further, the ERM is only the 50th percentile (median)effects level and as such provides a midpoint estimate of the potentialfor toxicity. We did not feel it was reasonable to use elevations abovereference to rank tissue chemistry data (as previously reported in theremedial investigation [Weston 1993]) because the concentration ofseveral contaminants in tissues from our reference site sometimesexceeded those from the Harbor Island site. Without relating theseexceedances to biological effects, one could develop erroneous concernsabout the contaminants that might reasonably be associated with varioussites. Moving the basis for evaluating effects of contaminants fromelevation-above-reference values to toxicity-based values should improvesediment quality assessments. Shifting from estimating toxicity withestablished criteria to actual site-specific bioeffects measured in-situshould provide the necessary field validation for laboratory bioassays.
We agree with previous investigators in suggesting that morecarefully designed studies are needed to relate bioaccumulation andtoxicity (Cook et al. 1992; McKim and Schmieder 1991). Dose-responserelationships for TBT, copper, and zinc based on field exposures ofmussels in San Diego Bay (Salazar and Salazar this volume) suggest thatthe concentrations of these contaminants accumulated in adult mussels atthe most contaminated sites around Harbor Island were not high enough toadversely affect mussel growth rates. This suggests that: (1) Dividingby the AWQC may have been reasonable to rank potential tissue toxicity,but dose-response data provide the best indicators; (2) It is importantto develop these relationships from measuring dose and response in thesame species and the same individuals (we used adults forbioaccumulation and juveniles for growth in this Puget Sound study); and(3) There are differences between juveniles and adults inbioaccumulation, growth, survival, and dose-response that should beconsidered in any assessment of this type (Salazar and Salazar thisvolume; data from this EPA pilot study not presented). A betternormalization might be achieved by using a bioconcentration factor,along with a mussel-specific water quality criterion, to estimatemaximum allowable tissue concentrations (MATC). Dividing the musseltissue concentrations by this MATC could more closely approximate tissuetoxicity.
Site-Specific Differences
Important information can be gained from our results thatregulators could use in prioritizing cleanup. The highest sedimentcontamination, tissue contamination, and the lowest mussel growth rateswere all found at N07 and justify a ranking of highest concern. Otherwork supports this conclusion. Previous studies have demonstrated highsediment toxicity around Harbor Island and near N07 in particular. Forexample, N07 is the only site where four different evaluation criteriawere not met (i.e., less than 50% of reference abundance forpolychaetes, crustaceans, and molluscs, and failure of the amphipodbioassays [Weston 1993]). In two separate laboratory bioassay studieswith Neanthes arenaceodentata lasting 63 and 108 days, juvenile growthand reproductive success were significantly reduced in exposures to
258 ENVIRONMENTAL TOXICOLOGY AND RISK ASSESSMENT: THIRD VOLUME
sediment from site N07 when compared to a Carr Inlet Control (Johns andGinn 1990; Johns et al. 1991).
Improving Assessment Tools
This EPA pilot study conducted in Puget Sound has demonstrated howmussel transplants can supplement the chemical analysis of sediments toprioritize contaminated sites and emphasize the importance ofbiologically-based criteria. The concept that direct measurements ofbioavailability and bioeffects provide information beyond routineanalysis of contaminated sediments has been repeatedly emphasized byothers. For example, the U.S. Army Corps of Engineers added abioeffects component to their regulatory program in 1977 when theyincluded a requirement for laboratory bioassays of dredge material fordisposal (U.S. EPA 1990). This approach was improved with thedevelopment of a Sediment Quality Triad for the evaluation ofcontaminated sediments that combined bulk sediment chemistry, laboratorybioassays and assessment of benthic community structure (Chapman et al.1985). Recently, the State of Washington adopted a regulatory programbased on the Apparent Effects Threshold which combines bulk sedimentchemistry with effects from laboratory bioassays and benthic effectsmeasurements (Washington State Department of Ecology 1991; Barrick etal. 1988, 1989). The approach proposed here and tested in this pilotproject can be used to supplement these other approaches.
We have shown how replication at some of the sites increased thediscriminating power of the approach in detecting differences amongsites. With replication, we were able to detect a statisticallysignificant difference in juvenile mussel growth where sites were onlyseparated by 23 mg/wk (K01=K09 > N07; see Table 5). Further, anystatistically significant difference in growth could have effects at thepopulation level (Bayne et al. 1985). Just as we have shown howincreased replication can improve the ability to detect differencesamong sites based on growth, additional transplants at various depthsand horizontal distances from suspected sources can identify and locatesources on a finer scale. Because the mussel transplant approachprovides a great deal of experimental control, it could be used moreintensively around Harbor Island to clarify pathways and exposure routesof contaminants. By transplanting mussels at various depths anddistances from suspected sources (sediments, outfalls or landfills) thelocation of sources can be more clearly identified. This gradientapproach, used in San Diego Bay showed that ship hulls rather thansediment were the primary of copper and TBT in the water column. Thedetails of this approach are provided in a companion article in thisvolume (Salazar and Salazar) and elsewhere (Salazar and Salazar 1991,1994).
Assessments of water overlying contaminated sediments have beenconducted previously. Several other studies have transplanted bivalvesnear contaminated sediment and made various measurements, such asbioaccumulation and bioeffects (Widdows and Donkin 1992; Roesijadi etal. 1984). For example, in addition to the San Diego Bay studymentioned above, results from mussels transplants in the southernCalifornia Bight demonstrated that DDT in bottom sediment was the sourceof DDT in mussel tissues (Young et al. 1976). In Bermuda, TBT and PAHsin sediment were shown to accumulate in mussel tissues and causereductions in scope for growth (Widdows et al. 1990). We believe, oursis the first study to use synoptic measurements of bioaccumulation andbioeffects in transplanted mussels to assess contaminated sediments inPuget Sound or at any EPA Superfund site.
SALAZAR ET AL ON TRANSPLANTED MUSSELS: II 259
CONCLUSIONS
By using transplanted mussels, we demonstrated that combiningmussel growth, tissue chemistry, and sediment chemistry was effective indifferentiating areas of contamination and potential bioeffects. Ourlimited synoptic measurements of mussel growth rates and tissuechemistry could only distinguish between the most contaminated and theleast contaminated sites. However, we were able to show an associationbetween toxicity-normalized tissue and sediment concentrations. Therewas a statistically significant relationship between mussel growth andboth tissue and sediment chemistry, and mussels accumulated many of thecontaminants measured in sediments.
Our original purpose was to determine the utility of measuringbioaccumulation and growth in transplanted mussels as a supplement tostandard approaches used to evaluate contaminated sediments. When weattempted to rank the sediment and tissue concentrations, we weredissatisfied with approaches such as elevations above reference, so wenormalized for toxicity. The normalization and ranking system presentedhere should be regarded as preliminary. We encourage continuing effortsto develop a method for normalizing based on toxicity.
More importantly, our results could be used as part of anecological risk assessment. Assessments of sediment toxicity couldbenefit greatly from (1) using in-situ bioassays, (2) evaluatingoverlying water, and (3) measuring bioaccumulation and bioeffects. Inthe context of environmental toxicology and risk assessment, we believethat the sediment compartment should be viewed as a dynamic, interactivesystem. As such, sediments should be evaluated for potentialbioaccumulation and bioeffects in the ecosystem. We have provided oneapproach that could be used for such an holistic assessment.
ACKNOWLEDGMENTS
We thank Duane Karna and the EPA-Region 10 divers fortransplanting the mussels, Gary Rosenthal and the EVS benthic sortingteam for extracting the mussel tissues, Joe Cummins and the EPA-Region10 chemists for analyzing the mussel tissues, and Kimberly Galimanis forcreating Figures 1 and 2. We also thank Peter Chapman, Bob Dexter,Ed Long, and four anonymous reviewers, particularly Reviewer #2, fortheir comments on the manuscript. We thank Chris Mebane for continuoussupport and encouragement in all phases of the work (including musselshucking until midnight).
REFERENCES
Barrick, R., S. Becker, L. Brown, H. Beller, and R. Pastorok, 1988,Sediment quality values refinement: 1988 update and evaluation ofPuget Sound AET. Volume 1. Final Report, Prepared for Tetra TechInc. and U.S. Environmental Protection Agency, Region 10. PTIEnvironmental Services, Bellevue, WA. 74 pp + appendices.
Barrick, R., H. Beller, S. Becker, and T. Ginn, 1989, "Use of theapparent effects threshold approach (AET) in classifyingcontaminated sediments," In: Contaminated Marine Sediments -Assessment and Remediation, Committee on Contaminated MarineSediments, Marine Board, National Academy Press, pp. 64-77.
260 ENVIRONMENTAL TOXICOLOGY AND RISK ASSESSMENT: THIRD VOLUME
Bayne, B. L., D. A. Brown, K. Burns, D. R. Dixon, A. Ivanovici, D. R.Livingstone, D. M. Lowe, N. M. Moore, A. R. D. Stebbing, and J.Widdows, 1985, "The Effects of Stress and Pollution on MarineAnimals," Praeger Special Studies, Praeger Scientific, New York. 384 pages.
Chapman, P.M., R.N. Dexter, R.M. Kocan, and E.R. Long, 1985, "Anoverview of biological effects testing in Puget Sound, Washington:Methods, results, and implications," ASTM Special TechnicalPublication 854, ASTM, Philadelphia, 1985.
Chapman, P. M. and E. R. Long, 1983, "The use of bioassays as part of acomprehensive approach to marine pollution assessment," MarinePollution Bulletin, Vol. 14, No. 3, pp. 81-84.
Cook, P. M., A. R. Carlson, and H. Lee II, 1992, "Chapter 7: TissueResidue Approach," In: Sediment Classification MethodsCompendium, EPA 823-R-006, United States Environmental ProtectionAgency, Office of Water.
Ekelund, R., A. Granmo, M. Berggren, L. Renberg and C. Wahlberg, 1987, "Influence of suspended solids on bioavailability ofhexachlorobenezene and lindane to the deposit-feeding marinebivalve Abra nitida Mueller," Bulletin of EnvironmentalContamination and Toxicology, Vol. 38, No. 3, pp. 500-508.
Hermsen, W., I. Sims, and M. Crane, 1994, "The bioavailability andtoxicity to Mytilus edulis L. of two organochlorine pesticidesadsorbed to suspended solids," Marine Environmental Research,Vol. 38, pp. 61-69.
Johns, D. M. and T. C. Ginn, 1990, Development of a Neanthes sedimentbioassay for use in Puget Sound, PTI Environmental ServicesTechnical Report. Prepared for U.S. Environmental ProtectionAgency, Seattle, Washington.
Johns, D. M., T. C. Ginn, and R. Ciammaichella, 1991, Neanthes long-termexposure experiment: Further evaluation of the relationshipbetween juvenile growth and reproductive stress, PTI EnvironmentalServices Technical Report. Prepared for U. S. EnvironmentalProtection Agency, Seattle, Washington.
Kiorboe, T., F. Mohlenberg and O. Nohr, 1981, "Effect of suspendedbottom material on growth and energetics in Mytilus edulis,"Marine Biology, Vol. 61, pp. 283-288.
Laughlin, R. B., Jr., W. French, and H. E. Guard, 1986, "Accumulationof bis(tributyltin) oxide by the marine mussel Mytilus edulis,"Environmental Science and Technology, Vol 20, pp. 884-890.
Lee, C.R., J.W. Simmers, D.L. Brandon, and B.L. Folsom, Jr., 1993, "Theimportance of biological testing in the assessment of metalcontamination and site remediation: a case study," EnvironmentalToxicology and Risk Assessment: 2nd Volume, ASTM STP 1173, JosephW. Gorsuch, F. James Dwyer, C.G. Ingersoll, and T.W. La Point,Eds., American Society for Testing and Materials, Philadelphia,1993.
Lobel, P. B., S. P. Belkhode, S. E. Jackson, and H. P. Longerich, 1991, "Sediment in the intertidal tract: A potentially serious sourceof error in aquatic biological monitoring programs," MarineEnvironmental Research, Vol. 31, pp. 163-174.
SALAZAR ET AL ON TRANSPLANTED MUSSELS: II 261
Long, E. R. and P. M. Chapman, 1985, "A sediment quality triad: Measures of sediment contamination, toxicity and infaunalcommunity composition in Puget Sound," Marine Pollution Bulletin,Vol. 16, No. 10, pp. 405-415.
Long, E. R. and D. D. MacDonald, 1992, "Chapter 14: National status andtrends program approach," In: Sediment Classification MethodsCompendium, EPA 823-R-006, United States Environmental ProtectionAgency, Office of Water.
Long, E. R. and L. G. Morgan, 1991, The potential for biological effectsof sediment-sorbed contaminants tested in the National Status andTrends Program, NOAA Technical Memorandum NOS OMA 52.
Malins, D. C., B. B. McCain, M. S. Myers, D. W. Brown, M. M. Krahn, W.T. Roubal, M. H. Schiewe, J. T. Landahl, and S.-L. Chan, 1987,"Field and laboratory studies of the etiology of liver neoplasmsin marine fish from Puget Sound," Environmental HealthPerspectives, Vol. 71, pp. 5-16.
McCain, B. B., D. C. Malins, M. M. Krahn, D. W. Brown, W. D. Gronlund,L. K. Moore, and S-L. Chan, 1990, "Uptake of aromatic andchlorinated hydrocarbons by juvenile Chinook salmon (Oncorhynchustshawytscha) in an urban estuary," Archives of EnvironmentalContamination and Toxicology, Vol. 19, pp. 10-16.
McCarty, L.S, 1991, "Toxicant Body Residues: Implications for AquaticBioassays with Some Organic Chemicals," Aquatic Toxicology andRisk Assessment: Fourteenth Volume, ASTM STP 1124, M.A. Mayes andM.G. Barron, Eds., American Society for Testing and Materials,Philadelphia.
McKim, J. M. and P. K. Schmieder, 1991, "Bioaccumulation: does itreflect toxicity?" In: R. Nagel and R. Loskill (Eds.),Bioaccumulation in Aquatic Systems: Contributions to theAssessment. Proceedings, International Workshop, Berlin. 1990. VCG Publishers, New York. pp. 161-188.
Metcalfe-Smith, J. L., J. C. Merriman, and S. P. Batchelor, 1992,"Relationships between concentrations of metals in sediment andtwo species of freshwater mussels in the Ottawa River," WaterPollution Research Journal of Canada, Vol. 27, No. 4, pp. 845-869.
Pastorok, R.A., and D.S. Becker, 1990, "Comparative Sensitivity ofSediment Toxicity Bioassays at Three Superfund Sites in PugetSound," Aquatic Toxicology and Risk Assessment: Thirteenth Volume,ASTM STP 1096, W. G. Landis and W. H. van der Schalie, Eds.,American Society for Testing and Materials, Philadelphia, 1990,pp. 123-139.
PTI and Tetra Tech 1988, Elliott Bay Action Program: Analysis of ToxicProblem Areas, Prepared for U.S. Environmental Protection Agency,Region 10.
Puget Sound Dredged Disposal Analysis (PSDDA), 1989, Management PlanReport — Unconfined Open-water Disposal of Dredged Material, PhaseII (North and South Puget Sound), U.S. Army Corps of EngineersSeattle District, Washington State Department of NaturalResources, U.S. EPA Region 10, Washington State Department ofEcology.
262 ENVIRONMENTAL TOXICOLOGY AND RISK ASSESSMENT: THIRD VOLUME
Robinson, W. E., D. K. Ryan, and G. T. Wallace, 1993, "Gut contents: Asignificant contaminant of Mytilus edulis whole body metalconcentrations," Archives of Environmental Contamination andToxicology, Vol. 25, pp. 415-421.
Roesijadi, G., J. S. Young, A. S. Drum, and J. M. Gurtisen, 1984,"Behavior of trace metals in Mytilus edulis during a reciprocaltransplant field experiment," Marine Ecological Progress Series,Vol. 18, pp. 155-170.
Salazar, M. H., 1986, "Environmental significance and interpretation oforganotin bioassays," In: Proceedings, Oceans 1986 Conference,Washington D. C., 23-25 Sept 1986, Organotin Symposium, Vol. 4,pp. 1240-1245.
Salazar, M. H. and S. M. Salazar, 1991, "Assessing site-specific effectsof TBT contamination with mussel growth rates," MarineEnvironmental Research, Vol. 32, pp. 131-150.
Salazar, M. H. and S. M. Salazar, 1994, "Mussels as bioindicators:effects of tributyltin on survival, bioaccumulation and growthunder natural conditions", In: M. A. Champ and P. F. Seligman(Eds.), Tributyltin: Environmental Fate and Effects. Elsevier.
Stein, J. E., T. K. Collier, W. L. Reichert, E. Casillas, T. Hom, and U.Varanasi, 1992, "Bioindicators of contaminant exposure andsublethal effects: studies with benthic fish in Puget Sound,Washington," Environmental Toxicology and Chemistry, Vol. 11, pp.701-714.
Tetra Tech, 1989, Recommended protocols for measuring metals in PugetSound water, sediment, and tissue samples, Prepared for U.S.Environmental Protection Agency, Region X, Seattle, Washington. December 1989.
U.S. EPA, 1986, Quality Criteria for Water, U.S. EnvironmentalProtection Agency. EPA/440/5-86-001.
U.S. EPA, 1992, Sediment Classification Methods Compendium, U.S. EPA823-R-006, United States Environmental Protection Agency, Officeof Water.
U.S. EPA/US Army Corps of Engineers, 1990, Draft Ecological Evaluationof Proposed Discharge of Dredged Material into Ocean Waters, U.S.EPA, Office of Marine and Estuarine Protection, EPA-503-8-90/002.
Varanasi, U., E. Casillas, M. R. Arkoosh, T. Hom, D. A. Misitano, D. W.Brown, S-L. Chan, T. K. Collier, B. B. McCain, and J. E. Stein,1993, Contaminant exposure and associated biological effects injuvenile Chinook salmon (Oncorhynchus tshawytscha) from urban andnonurban estuaries of Puget Sound, NOAA Technical MemorandumNMFS-NWFSC-8, U.S. Department of Commerce, National Oceanic andAtmospheric Administration, National Marine Fisheries Service. 112 pp.
Varanasi, U., J. E. Stein, L. L. Johnson, T. K. Collier, E. Casillas,and M. S. Myers, 1992, "Evaluation of bioindicators of contaminantexposure and effects in coastal ecosystems," In: D. H. McKenzie,D. E. Hyatt, and V. J. McDonald, Ecological Indicators, Vol. 1,Proceedings, International Symposium, Fort Lauderdale, Florida,October 16-19, 1990.
SALAZAR ET AL ON TRANSPLANTED MUSSELS: II 263
Waldock, M. J. and J. E. Thain, 1983, "Shell thickening in Crassostreagigas: organotin antifouling or sediment induced?" MarinePollution Bulletin, Vol. 14, No. 11, pp. 411-415.
Washington State Department of Ecology, 1991, Sediment ManagementStandards, Chapter 173-204, WAC.
Water Resources Control Board, California Inland Surface Waters Plan,1991, Water Quality Control Plan for Inland Surface Waters ofCalifornia, State of California. Water Resources Control Board. 91-13 WQ.
Weston R. F., Inc., 1991, Harbor Island Sampling and Analysis ProjectPlan, Seattle, Washington.
Weston R. F., Inc., 1993, Remedial Investigation Report Harbor Island,Part 2 - Sediment, Prepared for U.S. Environmental ProtectionAgency, Region X, Seattle, Washington. Contract No. 68-W9-0046. May 1993.
Widdows, J., Burns, K. A., Menon, N. R., Page, D. S., and Soria, S.,1990, "Measurement of Physiological Energetics (Scope of Growth)and Chemical Contaminants in Mussels (Arca zebra) TransplantedAlong a Contamination Gradient in Bermuda," Journal ofExperimental Marine Biology and Ecology, Vol. 138, pp. 99-117.
Widdows, J. and P. Donkin, 1992, "Mussels and environmentalcontaminants: bioaccumulation and physiological aspects," In: E.Gosling (Ed.), The Mussel Mytilus: Ecology, Physiology, Geneticsand Culture. Elsevier Science Publishers B.V., Amsterdam. pp.383-424.
Young, D. R., T. C. Heesen, and D. J. McDermott, 1976, "An offshorebiomonitoring system for chlorinated hydrocarbons," MarinePollution Bulletin, Vol. 7, No. 8, pp. 156-160.
Zar, J. H., Biostatistical Analysis, Prentice-Hall, Englewood Cliffs. 620 pp., 1974.
Related Documents