Imaging of the retinal nerve fibre layer with spectral domain optical coherence tomography for glaucoma diagnosis Kyung Rim Sung 1 , Jong S Kim 2 , Gadi Wollstein 2 , Lindsey Folio 2 , Michael S Kook 1 , and Joel S Schuman 2 1 Department of Ophthalmology, Asan Medical Center, University of Ulsan, College of Medicine, Seoul, Korea 2 Department of Ophthalmology, UPMC Eye Center, Eye and Ear Institute, Ophthalmology and Visual Science Research Center, University of Pittsburgh School of Medicine, Pittsburgh, Pennsylvania, USA Abstract Optical coherence tomography (OCT) techniques have been applied to develop a new generation of the technology, called spectral domain (SD) or Fourier domain (FD) OCT. The commercially available SD-OCT technology offers benefits over the conventional time domain (TD) OCT such as a scanning speed up to 200 times faster and higher axial resolution (3 to 6 μm). Overall, SD- OCT offers improved performance in terms of reproducibility. SD-OCT has a level of discriminating capability, between healthy and perimetric glaucoma eyes similar to that obtained with TD-OCT. Furthermore, the capabilities and features of SD-OCT are rapidly evolving, mainly due to three-dimensional imaging and image rendering. More sophisticated approaches for macular and optic disc assessment are expected to be employed in clinical practice. Analysis software should be further refined for interpretation of SD-OCT images in order to enhance the sensitivity and specificity of glaucoma diagnostics. Most importantly for SD-OCT is determination of its ability to diagnostic structural glaucomatous progression. Considering the recent launch time of the commercially available SD-OCT and slow progressing characteristic of glaucoma, we must wait for longitudinal SD-OCT data, with a long enough follow-up, to become available. INTRODUCTION Optical coherence tomography (OCT) has undoubtedly and significantly improved the diagnostic paradigm for retinal and glaucoma clinical care. In glaucoma, the retinal nerve fibre layer (RNFL) thickness measured by OCT enables an objective and quantitative assessment of glaucomatous structural loss. Standard automated perimetry combined with optic nerve head (ONH) examination remains the gold standard for glaucoma diagnosis. However, non-contact and non-invasive OCT RNFL thickness measurements and diagnostic classifications such as ‘within normal limits,’ ‘borderline,’ and ‘outside normal limits’ derived from a normative database allow ophthalmologists to assess structural aspects of glaucomatous damage more efficiently. Numerous studies have shown the glaucoma Correspondence to: Dr Kyung Rim Sung, Department of Ophthalmology, University of Ulsan, College of Medicine, Asan Medical Center, 388-1 Pungnap-2-dong, Songpagu, Seoul, Korea 138-736; [email protected]. Competing interests JSS receives royalties for intellectual property licensed by Massachusetts Institute of Technology to Carl Zeiss Meditec. JSS and GW receive royalties for intellectual property licensed by the University of Pittsburgh to Bioptigen. Provenance and peer review Not commissioned; externally peer reviewed. NIH Public Access Author Manuscript Br J Ophthalmol. Author manuscript; available in PMC 2012 August 17. Published in final edited form as: Br J Ophthalmol. 2011 July ; 95(7): 909–914. doi:10.1136/bjo.2010.186924. NIH-PA Author Manuscript NIH-PA Author Manuscript NIH-PA Author Manuscript

Welcome message from author
This document is posted to help you gain knowledge. Please leave a comment to let me know what you think about it! Share it to your friends and learn new things together.
Transcript
Imaging of the retinal nerve fibre layer with spectral domainoptical coherence tomography for glaucoma diagnosis
Kyung Rim Sung1, Jong S Kim2, Gadi Wollstein2, Lindsey Folio2, Michael S Kook1, andJoel S Schuman2
1Department of Ophthalmology, Asan Medical Center, University of Ulsan, College of Medicine,Seoul, Korea2Department of Ophthalmology, UPMC Eye Center, Eye and Ear Institute, Ophthalmology andVisual Science Research Center, University of Pittsburgh School of Medicine, Pittsburgh,Pennsylvania, USA
AbstractOptical coherence tomography (OCT) techniques have been applied to develop a new generationof the technology, called spectral domain (SD) or Fourier domain (FD) OCT. The commerciallyavailable SD-OCT technology offers benefits over the conventional time domain (TD) OCT suchas a scanning speed up to 200 times faster and higher axial resolution (3 to 6 μm). Overall, SD-OCT offers improved performance in terms of reproducibility. SD-OCT has a level ofdiscriminating capability, between healthy and perimetric glaucoma eyes similar to that obtainedwith TD-OCT. Furthermore, the capabilities and features of SD-OCT are rapidly evolving, mainlydue to three-dimensional imaging and image rendering. More sophisticated approaches formacular and optic disc assessment are expected to be employed in clinical practice. Analysissoftware should be further refined for interpretation of SD-OCT images in order to enhance thesensitivity and specificity of glaucoma diagnostics. Most importantly for SD-OCT isdetermination of its ability to diagnostic structural glaucomatous progression. Considering therecent launch time of the commercially available SD-OCT and slow progressing characteristic ofglaucoma, we must wait for longitudinal SD-OCT data, with a long enough follow-up, to becomeavailable.
INTRODUCTIONOptical coherence tomography (OCT) has undoubtedly and significantly improved thediagnostic paradigm for retinal and glaucoma clinical care. In glaucoma, the retinal nervefibre layer (RNFL) thickness measured by OCT enables an objective and quantitativeassessment of glaucomatous structural loss. Standard automated perimetry combined withoptic nerve head (ONH) examination remains the gold standard for glaucoma diagnosis.However, non-contact and non-invasive OCT RNFL thickness measurements and diagnosticclassifications such as ‘within normal limits,’ ‘borderline,’ and ‘outside normal limits’derived from a normative database allow ophthalmologists to assess structural aspects ofglaucomatous damage more efficiently. Numerous studies have shown the glaucoma
Correspondence to: Dr Kyung Rim Sung, Department of Ophthalmology, University of Ulsan, College of Medicine, Asan MedicalCenter, 388-1 Pungnap-2-dong, Songpagu, Seoul, Korea 138-736; [email protected].
Competing interests JSS receives royalties for intellectual property licensed by Massachusetts Institute of Technology to Carl ZeissMeditec. JSS and GW receive royalties for intellectual property licensed by the University of Pittsburgh to Bioptigen.
Provenance and peer review Not commissioned; externally peer reviewed.
NIH Public AccessAuthor ManuscriptBr J Ophthalmol. Author manuscript; available in PMC 2012 August 17.
Published in final edited form as:Br J Ophthalmol. 2011 July ; 95(7): 909–914. doi:10.1136/bjo.2010.186924.
NIH
-PA Author Manuscript
NIH
-PA Author Manuscript
NIH
-PA Author Manuscript
diagnostic capability of time domain (TD) OCT (Stratus OCT, Carl Zeiss Meditec, Dublin,California).1–11
OCT techniques have been applied to develop a new generation of the technology withoutstanding performance relative to the conventional TD-OCT system, called spectraldomain (SD) or Fourier domain (FD) OCT.12, 13 The most obviously improved feature ofSD-OCT technology compared with TD-OCT is scanning speeds up to 200 times faster.Employing a fast scanning speed with an OCT device is relatively more important than otherimaging modalities because the human eye moves very fast involuntarily. Therefore, a fasterscan speed allows the acquisition of data sets with less motion artefact. In addition, thehigher sampling density of SD-OCT three-dimensional (D) cube data with a faster scanspeed allows us to visualise pathophysiological features of the retina.14–16 Anotheradvantage of SD-OCT over TD-OCT is the improved axial resolution. Currently, SD-OCThas two to three times better axial resolution (3 to 6 μm) than TD-OCT (10 μm).
Needless to say, what glaucoma specialists as well as general ophthalmologists expect fromthe state-of-the-art SD-OCT technology is the enhancement of capabilities in glaucomadiagnoses and glaucoma progression detection. The purpose of this manuscript was toreview recently published articles regarding the assessment of commercially available SD-OCT devices for glaucoma diagnosis.
Principle of SD OCTThe basic principles of SD-OCT have been well described.17 Briefly, TD-OCT detects theecho time delay between the reference arm and the sample arm and the intensity of the backreflection. To achieve this, the reference arm of TD-OCT moves back and forth to obtain theecho time delay, which limits the maximal scanning speed. Alternatively, the referencemirror in SD-OCT remains fixed because the echo time delay is replaced by thesimultaneous detection of frequency changes. In other words, instead of a moving referencemirror like that used in TD-OCT, the mirror remains stationary, and the interference patternis split by a grating into its frequency components. All of these components aresimultaneously detected by a charge-coupled device. Depth information in the retinal layerof each frequency component is obtained after a Fourier transform of the each receivedsignal. This approach enables the fast scanning time of SD-OCT. The axial resolution of anOCT image is dependent on the coherent length of the light source, which is inverselyproportional to the bandwidth of the light source. For the purpose of an improvement inaxial resolution, broad-bandwidth light sources are employed in SD-OCT systems. Thisenables SD-OCT to achieve a resolution (3–6 μm) two to three times higher than that ofcommercially available TD-OCT (10 μm). Like TD-OCT, the main glaucoma diagnosisprotocol in SD-OCT is peripapillary RNFL thickness assessment.
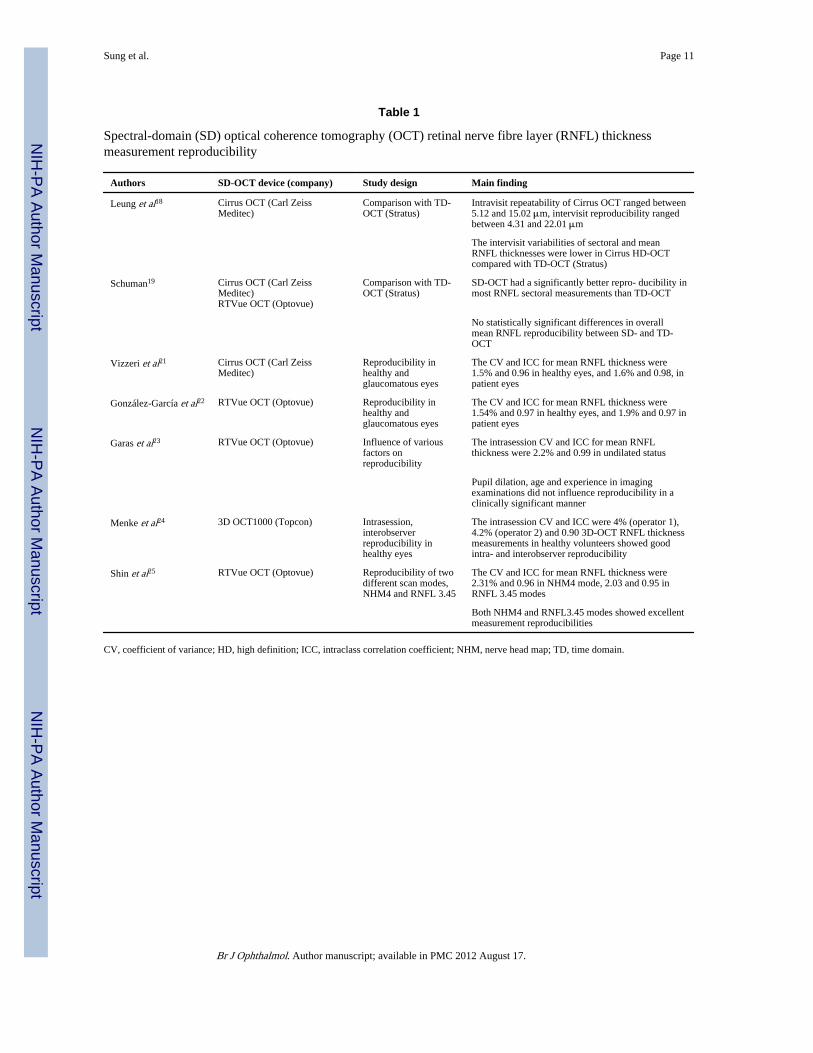
REPRODUCIBILITYMeasurement reproducibility is an important requirement for clinical utility of a diagnosticdevice. Several studies evaluated the reproducibility of RNFL thickness measurement fromvarious SD-OCT devices, and those results are summarised in table 1.18–25 Leung et al andSchuman each compared the reproducibility of SD-OCT and TD-OCT.18, 19 Both studyresults indicated that measurement variability of sectoral RNFL thicknesses weresignificantly lower in SD-OCT compared with TD-OCT.18, 19 Kim et al compared thereproducibility of TD-OCT with SD-OCT using an experimental methodology.20 In thisstudy, the 3D SD-OCT cube scan (200×200 A scans) was analysed in two ways. The ONHcentre was defined on each image separately, and the ONH centre was defined on one image(ie, scan at the first visit) and exported to other images (ie, scans in different time points)after scan registration. After defining the ONH centre, a 3.4 mm diameter virtual circular
Sung et al. Page 2
Br J Ophthalmol. Author manuscript; available in PMC 2012 August 17.
NIH
-PA Author Manuscript
NIH
-PA Author Manuscript
NIH
-PA Author Manuscript
OCT B-mode image was obtained from the 3D SD-OCT cube scan to mimic theconventional TD-OCT circumpapillary scan. Their results indicated that the reproducibilityof RNFL thickness measurements from the 3D SD-OCT cube data showed significantlybetter results in both methods than TD-OCT. Vizzeri et al and González-García et al showedexcellent and similar reproducibility levels that can be obtained by different SD devices(Cirrus and RTVue OCT).21, 22 Two data-acquisition modes, direct circular scanning likeTD-OCTand resampling the data of interest from a 3D dataset are possible with SD-OCT.Shin et al tested RNFL thickness measurement reproducibility by two different techniques(NHM4 (resampling) vs RNFL 3.45 (direct circular scanning)) of the RTVue OCT andreported that both modes showed excellent measurement reproducibility.25
According to the above results, the commercialised SD-OCT devices by variousmanufacturers showed good RNFL measurement reproducibility and generally werereported to be better than or comparable with those obtained with TD-OCT. Sectoral RNFLmeasurements showed a higher variability than overall mean RNFL thicknessmeasurements.26 Sectoral measurements are more easily affected by inconsistent samplingcircle placement or other confounding factors. The results suggesting SD-OCT can achievebetter levels of reproducibility than TD-OCT, especially in sectoral measurement, are veryencouraging. Glaucomatous structural damage usually starts as a localised defect; therefore,reproducible measurement of sectoral change is crucial for structural progression detection.Better reproducibility of sectoral RNFL thickness measurement in SD-OCT compared withTD OCT might be explained by the improved scan resolution and data-registrationtechnology of SD-OCT.
STRUCTURE AND FUNCTION RELATIONSHIPSince glaucoma is defined as a structural change in optic disc and RNFL with accompanyingfunctional decay manifested by visual field (VF), the correlation of glaucomatous damage(structural loss) detected by SD-OCT with functional loss assessed with a VF test needs tobe evaluated. Horn et al evaluated the correlation between local glaucomatous VF defects(functional loss) and RNFL thinning (structural damage) measured with SD-OCT andcompared those results with scanning laser polarimetry (SLP; GD×VCC).27 They found SD-OCT to be useful for determining the functional–structural relationship in peripapillaryareas, where the association between perimetric defects and corresponding RNFL loss isstronger for SD OCT than for the present SLP. Similarly, Leung et al studied the structure–function relationship between SD-OCT and TD-OCT using mean RNFL thicknesses and VFmean deviations (MDs) fitted with the second-order regression equation.18 They showedthat there was no significant difference in the strength of structure–function associationbetween SD-OCT (coefficient of determination (R2) = 0.580) and TD-OCT (R2 = 0.623; p =0.918). Further research regarding the structure–function relationship using variouscommercialised SD-OCT devices is warranted.
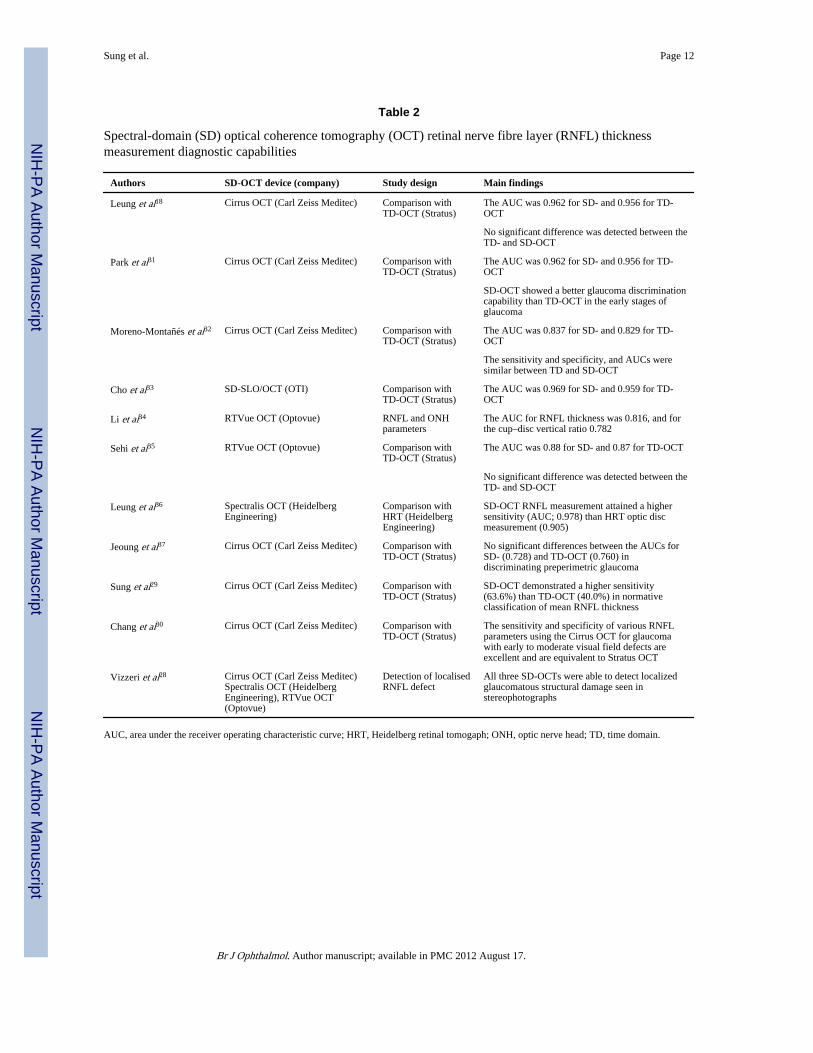
GLAUCOMA DIAGNOSTIC CAPABILITY OF SD-OCTA considerable number of studies regarding the glaucoma diagnostic capability of SD-OCTRNFL measurements have been published (table 2).18, 28–37 Most of the studies comparedthe diagnostic capability of SD-OCT RNFL measurements with those of TD-OCT.18, 29–33, 35, 37 Several publications have investigated the diagnostic capability of SD-OCT RNFL thickness measurements using an area-under-the-receiver-operating-characteristic curve (AUC) for discrimination between healthy and glaucomatouseyes.18, 31–37 It is difficult to compare the AUC values directly among different studies,since AUC values can vary according to the glaucoma participant’s stage of disease, and thedisease characteristics of the subjects. However, all SD-OCT devices tested showed a good
Sung et al. Page 3
Br J Ophthalmol. Author manuscript; available in PMC 2012 August 17.
NIH
-PA Author Manuscript
NIH
-PA Author Manuscript
NIH
-PA Author Manuscript
glaucoma diagnostic capability. Additionally, most of the studies consistently showed nostatistically significant differences in glaucoma diagnostic capability between SD-OCT andTD-OCT.18, 31–33, 35, 37 Categorical classification of RNFL thickness measurements usingterms such as ‘outside normal limits,’ ‘borderline,’ or ‘within normal limits,’ based on acomparison with a normative database, is another advantage helping clinicians to assess thestructural status of glaucoma objectively and conveniently. Sung et al found that SD-OCTdemonstrated a higher sensitivity than TD-OCT in an abnormal classification of meanRNFL thickness from glaucomatous eyes as defined by the VF test.29 The authorshypothesised that the higher sensitivity of SD-OCT may be due to the higher scan resolutionand more accurate data registration from the improved technology. They suggest that theracial distribution of the SD-OCT normative database may also add to the differencebetween the technologies. For example, 20% of the total population included in the CirrusOCT normative database were Asian, while a relatively small number of Asian individuals(3%) were included in the TD-OCT normative database.38 Moreover, Chang et al reportedthat the sensitivity and specificity of SD-OCT for classification of abnormal RNFLthickness for glaucoma detection were equivalent to those of TD-OCT.30 Jeoung et alcompared the diagnostic ability of SD-OCT and TD-OCT to detect localised RNFL defectsin patients with normal standard automated perimetry (preperimetric glaucoma) and foundthat there was no statistically significant difference between the AUCs for the bestparameters from both iterations of OCTs.37
Summarising the previously described studies regarding glaucoma diagnostic capability ofSD-OCT, various SD-OCTs showed a similar level of glaucoma discriminating abilitycompared with TD-OCT. These results can be explained by several speculations. First, mostof the current diagnostic studies are designed to evaluate whether or not RNFLmeasurements can identify perimetrically defined glaucoma. Glaucomatous structuraldamage is known to precede perimetrically assessed functional deficit.39–41 Thus, most ofthe glaucomatous patients enrolled in studies already had considerable structural damage.Therefore, the superiority of one imaging device compared with another will be difficult toevaluate in structurally advanced cases. Obviously, if we intended to see diagnosticsensitivity of newly introduced SD-OCT, we should evaluate patients with preperimetricstages of glaucoma. However, there is no gold standard by which to define suchpreperimetric stages. Thus, there are some limitations in those studies comparing glaucomadiagnostic capability determined by VF. Second, although, SD-OCT employed newtechnology for data acquisition, most of the peripapillary RNFL data are analysed in thesame location as TD-OCT, usually a concentric peripapillary circle with a diameter of 3.4mm. This similar measurement location is familiar to most OCT users and makes it easy tocompare SD-OCT data with TD-OCT data. However, this similarity of the scan locationmay contribute to a similar level of diagnostic capability; in other words, it may be difficultfor SD-OCT to outperform TD-OCT if the measurements are limited by this similarlocation. Jeoung et al showed a focal RNFL defect in SD-OCT deviation map which was notdetected by a Stratus OCT peripapillary circle with a diameter of 3.4 mm.37 Thus, one cansay that SD-OCT would enhance the diagnostic capability of glaucoma not by conventionalperipapillary circular measurement with a diameter of 3.4 mm but by an RNFL thicknessmap from a 3D volumetric data set.
Comparison of glaucoma diagnostic capability between SD-OCT and other imaging devicesis another valuable research area. The potential for multiple imaging devices to reportsimilar findings can allow more confident glaucoma diagnostic decisions. Leung et alevaluated and compared the diagnostic capability of Spectralis OCT and Heidelberg RetinalTomograph, and reported that Spectralis OCT RNFL measurements attained a highersensitivity than the Heidelberg Retinal Tomograph optic disc measurements at a comparable
Sung et al. Page 4
Br J Ophthalmol. Author manuscript; available in PMC 2012 August 17.
NIH
-PA Author Manuscript
NIH
-PA Author Manuscript
NIH
-PA Author Manuscript
level of specificity.36 More studies addressing this topic are expected to be reported inforthcoming reports.
AGREEMENT OF TD-OCT AND SD-OCT IN RNFL THICKNESSMEASUREMENT
Since glaucoma is a life-long disease for most patients, the structural and functionalassessment of the patient should be traced longitudinally. Considering the rapiddevelopment of OCT technology and software, it seems that there will be many improveddevices introduced during the lifetime of a given patient. Therefore, the comparabilitybetween different iterations of a device should be studied. Many researchers haveinvestigated the agreement of various SD-OCTs with TD-OCT RNFLmeasurements.21, 22, 29, 33, 42 All study results consistently showed that there was a goodcorrelation between SD-OCT and TD-OCT RNFL measurements; however, systematic andstatistically significant differences were reported between two iterations of thedevice.21, 22, 29, 33, 42 Among SD-OCTs, Cirrus OCT tended to have thinner RNFL than TD-OCT, 21, 29, 42 whereas RTVue and SD-SLO/OCT tended to have a thicker RNFL than TD-OCT.22, 33 However, both devices tended to have thicker RNFL measurements than TD-OCT in eyes with a very thin RNFL.
Overall, RNFL measurements by various SD-OCTs were well correlated with thoseobtained by TD-OCT. However, most of the precise RNFL thickness measurements by SD-OCTs differ significantly from those of TD-OCT. This may suggest that RNFLmeasurements between SD-and TD-OCT are not interchangeable, and there is a constantbias between two measurements. There was one report by Kim et al that intended to create arobust technique to make TD-OCT circular scan RNFL thickness measurements comparablewith those obtained with 3D SD-OCT volumes.43 Briefly, each eye was scanned multipletimes with different scanning circles, and one 3D SD-OCT cube scan was obtained at thesame visit. The matching location of the TD-OCT scanning circle was automaticallydetected within the corresponding 3D SD-OCT scan. The authors reported that scan locationmatching may bridge the gap in RNFL thickness measurements between TD-OCT circularscan data and 3D SD-OCT scan data, providing follow-up comparability across the twogenerations of OCTs. Therefore, conversion of TD-OCT data to SD-OCT data might bepossible in the future, using either statistical modelling or image-processing techniques, toensure that huge amounts of previously acquired TD-OCT data are not discarded. However,current research outcomes suggest that there should be caution when an individualundergoes a longitudinal follow-up with different OCTs, since data from TD- and SD-OCTare not clearly interchangeable.
MACULAR ASSESSMENT FOR GLAUCOMAPrevious reports have suggested that macular thickness assessment could be a valuablesurrogate measure in the evaluation of glaucomatous structural change, because suchdamage occurs in retinal ganglion cells (RGCs), which are multilayered and most dense inthe macular region.3, 44–46 Total macular thickness may reduce the sensitivity of glaucoma.Thus, Ishikawa et al calculated the macular inner retinal layer (MIRL) thickness which wasassumed to be more specific in glaucomatous damage by their own segmentation algorithmand showed a comparable glaucoma diagnostic capability of MIRL measurement toperipapillary RNFL measurement by use of TD-OCT. Instead of total macular thickness,SD-OCT can provide the ganglion cell layer thickness segmented from the total macularthickness with the help of improved resolution and the 3D cube scan. Using RTVue OCT,Tan et al measured macular retinal thickness and ganglion cell complex (GCC) thickness,defined as the combination of retinal nerve fibre, ganglion cell and inner plexiform layers.47
Sung et al. Page 5
Br J Ophthalmol. Author manuscript; available in PMC 2012 August 17.
NIH
-PA Author Manuscript
NIH
-PA Author Manuscript
NIH
-PA Author Manuscript
Here, they showed that the mean SD-OCT GCC had a significantly (p=0.02) higherdiagnostic power (AUC=0.90) than macular retinal (AUC=0.85 for both SD-OCT and TD-OCT) in differentiating between perimetric glaucoma and normal eyes. They also reportedthat the diagnostic powers of the best GCC parameters were statistically equal to that of theTD-OCT RNFL mean. Seong et al compared the glaucoma discrimination ability of theMIRL thickness with that of peripapillary retinal nerve fibre layer (pRNFL) thicknessmeasured by SD-OCT (RTVue OCT).48 Here, they showed that the mean MIRL thicknesshad a strong correlation with pRNFL thickness, and MIRL thickness showed a glaucomadiscrimination ability comparable with pRNFL thickness in early VF defect. In eyes withadvanced or peripheral VF defect, pRNFL measurement showed a better glaucomadiagnostic ability than did MIRL measurement. The current study results suggest that GCCthickness assessed by SD-OCT has a comparable diagnostic capability with that of pRNFLthickness.47, 48 It will be interesting to see what role macular GCC thickness will play inglaucoma diagnosis in the future.
RESEARCH APPROACH TOWARD OPTIC NERVE HEAD ANALYSISTraditionally, glaucomatous structural damage was defined as typical glaucomatous opticneuropathy, which included neuroretinal rim thinning and deepening of the optic disc cup.However, an optic disc analysis in TD-OCT was used less frequently than RNFL analysis inclinical practice. Several investigations were performed to enhance the utility of optic discinformation in SD-OCT.49–51 Strouthidis et al compared serial ONH histology withinterpolated B-scans generated from 3D Spectralis OCT data.49 They suggested thatvolumetric SD-OCT imaging of the ONH was capable of generating interpolated B-scans,which accurately matched serial histological sections. Chen correlated quantitative SD-OCTparameters with disc photography and VFs, and demonstrated an SD-OCT reference plane139 μm above the retinal pigment epithelium yielded cup–disc.50 Abràmoff et al developedan algorithm to determine the cup and rim in close-to-isotropic SD-OCT images of the ONHand showed that its performance for determining the cup and rim from SD-OCT images issimilar to that of planimetry by glaucoma experts.51 Further refined SD-OCT optic discanalysis might augment the diagnostic capability of RNFL analysis.
GLAUCOMATOUS PROGRESSION DETECTIONProgression detection remains the most challenging aspect of glaucoma management. Only afew studies regarding the glaucoma progression detection capability of OCT were reportedat the time of writing this review.52–54 Such problems may stem from the innate nature ofthe disease. Glaucoma progresses slowly, and the extent of progressive change is generallysmall, so the ability of detection of minute changes is essential in identifying progression. Inorder to identify changes in repetitive scans, the difference in the measured parameter has toexceed the inherent variability of the device. Therefore, the results of improvedmeasurement reproducibility of SD-OCT compared with TD-OCT are very encouraging interms of glaucoma progression detection. Improved reproducibility of SD-OCT RNFLmeasurements may enhance the ability to detect glaucomatous changes over time byenabling the detection of smaller changes than those required by TD-OCT. A higher scansampling density and subsequent accurate data registration between measurements may playan important role for glaucoma progression detection. Considering the recent launch of thecommercially available SD-OCT and the slowly progressive character of glaucoma, we mustwait for longitudinal SD-OCT data with a long enough follow-up to become available.
IN THE FUTURESD-OCT imaging technology is rapidly evolving. New technologies such as swept sourceOCT,55 SD-OCT integrated with adaptive optics56 and polarisation-sensitive SD-OCT57 are
Sung et al. Page 6
Br J Ophthalmol. Author manuscript; available in PMC 2012 August 17.
NIH
-PA Author Manuscript
NIH
-PA Author Manuscript
NIH
-PA Author Manuscript
currently under development. We hope to gain a better understanding of the structural statusof glaucoma through future use of state-of-the-art technologies.
CONCLUSIONOCT employing SD technology is commercially available and in widespread clinical use.Unlike the dominance of a single brand in TD-OCT, multiple companies are producing SD-OCTs with different technical features. Unfortunately, clinical study outcomes regardingglaucoma diagnostic capability have concentrated on only two or three SD-OCTs at the timeof writing this manuscript. SD-OCT performed better in terms of reproducibility but did notoutperform TD-OCT for discriminating perimetrically proven glaucomatous from healthyeyes, possible reasons for which were explored above. Furthermore, SD-OCT is rapidlyevolving, and unprecedented new features are becoming feasible with the help of 3Drendering. More sophisticated approaches for macular and optic disc evaluation are beingdeveloped. It is probable that SD-OCT will continue to integrate more accurate andattractive diagnostic strategies which are not currently available. There is also a need foranalysis software to be further refined and tuned for interpretation of SD-OCT images toenhance glaucoma diagnostic capability. We need to take full advantage of the 3D dataavailable with SD-OCT and go beyond TD-OCT’s circum-papillary RNFL analysis. Finally,the most important issue for SD-OCT diagnostic ability is whether it can detectglaucomatous structural progression. Considering the recent launch time of commerciallyavailable SD-OCT and the slow progression characteristics of glaucoma, we may need towait some time before this capability can be evaluated.
AcknowledgmentsFunding GW receives research funding from Optovue and Carl Zeiss Meditec.
References1. Burgansky-Eliash Z, Wollstein G, Chu T, et al. Optical coherence tomography machine learning
classifiers for glaucoma detection: a preliminary study. Invest Ophthalmol Vis Sci. 2005; 46:4147–52. [PubMed: 16249492]
2. Huang ML, Chen HY. Development and comparison of automated classifiers for glaucomadiagnosis using Stratus optical coherence tomography. Invest Ophthalmol Vis Sci. 2005; 46:4121–9. [PubMed: 16249489]
3. Leung CK, Chan WM, Yung WH, et al. Comparison of macular and peripapillary measurements forthe detection of glaucoma: an optical coherence tomography study. Ophthalmology. 2005; 112:391–400. [PubMed: 15745764]
4. Medeiros FA, Zangwill LM, Bowd C, et al. Evaluation of retinal nerve fiber layer, optic nerve head,and macular thickness measurements for glaucoma detection using optical coherence tomography.Am J Ophthalmol. 2005; 139:44–55. [PubMed: 15652827]
5. Sihota R, Sony P, Gupta V, et al. Comparing glaucomatous optic neuropathy in primary open angleand chronic primary angle closure glaucoma eyes by optical coherence tomography. OphthalmicPhysiol Opt. 2005; 25:408–15. [PubMed: 16101946]
6. Kanamori A, Nagai-Kusuhara A, Escaño MF, et al. Comparison of confocal scanning laserophthalmoscopy, scanning laser polarimetry and optical coherence tomography to discriminateocular hypertension and glaucoma at an early stage. Graefes Arch Clin Exp Ophthalmol. 2006;244:58–68. [PubMed: 16044326]
7. Lalezary M, Medeiros FA, Weinreb RN, et al. Baseline optical coherence tomography predicts thedevelopment of glaucomatous change in glaucoma suspects. Am J Ophthalmol. 2006; 142:576–82.[PubMed: 17011848]
Sung et al. Page 7
Br J Ophthalmol. Author manuscript; available in PMC 2012 August 17.
NIH
-PA Author Manuscript
NIH
-PA Author Manuscript
NIH
-PA Author Manuscript
8. Manassakorn A, Nouri-Mahdavi K, Caprioli J, et al. Comparison of retinal nerve fiber layerthickness and optic disk algorithms with optical coherence tomography to detect glaucoma. Am JOphthalmol. 2006; 141:105–15. [PubMed: 16386983]
9. Naithani P, Sihota R, Sony P, et al. Evaluation of optical coherence tomography and heidelbergretinal tomography parameters in detecting early and moderate glaucoma. Invest Ophthalmol VisSci. 2007; 48:3138–45. [PubMed: 17591883]
10. Parikh RS, Parikh S, Sekhar GC, et al. Diagnostic capability of optical coherence tomography(Stratus OCT 3) in early glaucoma. Ophthalmology. 2007; 114:2238–43. [PubMed: 17561260]
11. Nouri-Mahdavi K, Nikkhou K, Hoffman DC, et al. Detection of early glaucoma with opticalcoherence tomography (StratusOCT). J Glaucoma. 2008; 17:183–8. [PubMed: 18414102]
12. Wojtkowski M, Bajraszewski T, Gorczyńska I, et al. Ophthalmic imaging by spectral opticalcoherence tomography. Am J Ophthalmol. 2004; 138:412–19. [PubMed: 15364223]
13. Chen TC, Cense B, Pierce MC, et al. Spectral domain optical coherence tomography: ultra-highspeed, ultra-high resolution ophthalmic imaging. Arch Ophthalmol. 2005; 123:1715–20. [PubMed:16344444]
14. de Boer JF, Cense B, Park BH, et al. Improved signal-to-noise ratio in spectral-domain comparedwith time-domain optical coherence tomography. Opt Lett. 2003; 28:2067–9. [PubMed:14587817]
15. Nassif N, Cense B, Park BH, et al. In vivo human retinal imaging by ultrahigh-speed spectraldomain optical coherence tomography. Opt Lett. 2004; 29:480–2. [PubMed: 15005199]
16. Wojtkowski M, Srinivasan V, Fujimoto JG, et al. Three-dimensional retinal imaging with high-speed ultrahigh-resolution optical coherence tomography. Ophthalmology. 2005; 112:1734–46.[PubMed: 16140383]
17. Drexler W, Fujimoto JG. State-of-the-art retinal optical coherence tomography. Prog Retin EyeRes. 2008; 27:45–88. [PubMed: 18036865]
18. Leung CK, Cheung CY, Weinreb RN, et al. Retinal nerve fiber layer imaging with spectral-domainoptical coherence tomography: a variability and diagnostic performance study. Ophthalmology.2009; 116:1257–63. [PubMed: 19464061]
19. Schuman JS. Spectral domain optical coherence tomography for glaucoma (an AOS thesis). TransAm Ophthalmol Soc. 2008; 106:426–58. [PubMed: 19277249]
20. Kim JS, Ishikawa H, Sung KR, et al. Retinal nerve fibre layer thickness measurementreproducibility improved with spectral domain optical coherence tomography. Br J Ophthalmol.2009; 93:1057–63. [PubMed: 19429591]
21. Vizzeri G, Weinreb RN, Gonzalez-Garcia AO, et al. Agreement between spectral-domain andtime-domain OCT for measuring RNFL thickness. Br J Ophthalmol. 2009; 93:775–81. [PubMed:19304586]
22. González-García AO, Vizzeri G, Bowd C, et al. Reproducibility of RTVue retinal nerve fiber layerthickness and optic disc measurements and agreement with Stratus optical coherence tomographymeasurements. Am J Ophthalmol. 2009; 147:1067–74. [PubMed: 19268891]
23. Garas A, Vargha P, Holló G. Reproducibility of retinal nerve fiber layer and macular thicknessmeasurement with the RTVue-100 optical coherence tomograph. Ophthalmology. 2010; 117:738–46. [PubMed: 20079538]
24. Menke MN, Knecht P, Sturm V, et al. Reproducibility of nerve fiber layer thickness measurementsusing 3D Fourier-domain OCT. Invest Ophthalmol Vis Sci. 2008; 49:5386–91. [PubMed:18676630]
25. Shin CJ, Sung KR, Um TW, et al. Comparison of retinal nerve fiber layer thickness measurementscalculated by the Optic Nerve Head Map (NHM4) and RNFL 3. 45 modes of spectral-domainoptical coherence tomography (OCT) (RTVue-100). Br J Ophthalmol. 2010; 94:763–7. [PubMed:20508052]
26. Paunescu LA, Schuman JS, Price LL, et al. Reproducibility of nerve fiber thickness, macularthickness, and optic nerve head measurements using StratusOCT. Invest Ophthalmol Vis Sci.2004; 45:1716–24. [PubMed: 15161831]
Sung et al. Page 8
Br J Ophthalmol. Author manuscript; available in PMC 2012 August 17.
NIH
-PA Author Manuscript
NIH
-PA Author Manuscript
NIH
-PA Author Manuscript
27. Horn FK, Mardin CY, Laemmer R, et al. Correlation between local glaucomatous visual fielddefects and loss of nerve fiber layer thickness measured with polarimetry and spectral domainOCT. Invest Ophthalmol Vis Sci. 2009; 50:1971–7. [PubMed: 19151389]
28. Vizzeri G, Balasubramanian M, Bowd C, et al. Spectral domain-optical coherence tomography todetect localized retinal nerve fiber layer defects in glaucomatous eyes. Opt Express. 2009;17:4004–18. [PubMed: 19259242]
29. Sung KR, Kim DY, Park SB, et al. Comparison of retinal nerve fiber layer thickness measured byCirrus HD and Stratus optical coherence tomography. Ophthalmology. 2009; 116:1264–70.[PubMed: 19427696]
30. Chang RT, Knight OJ, Feuer WJ, et al. Sensitivity and specificity of time-domain versus spectral-domain optical coherence tomography in diagnosing early to moderate glaucoma. Ophthalmology.2009; 116:2294–9. [PubMed: 19800694]
31. Park SB, Sung KR, Kang SY, et al. Comparison of glaucoma diagnostic capabilities of Cirrus HDand Stratus optical coherence tomography. Arch Ophthalmol. 2009; 127:1603–9. [PubMed:20008715]
32. Moreno-Montañés J, Olmo N, Alvarez A, et al. Cirrus high-definition optical coherencetomography compared with Stratus optical coherence tomography in glaucoma diagnosis. InvestOphthalmol Vis Sci. 2010; 51:335–43. [PubMed: 19737881]
33. Cho JW, Sung KR, Hong JT, et al. Detection of glaucoma by spectral domain-scanning laserophthalmoscopy/optical coherence tomography (SD-SLO/OCT) and time domain opticalcoherence tomography. J Glaucoma. 2011; 20:15–20. [PubMed: 20436370]
34. Li S, Wang X, Li S, et al. Evaluation of optic nerve head and retinal nerve fiber layer in early andadvance glaucoma using frequency-domain optical coherence tomography. Graefes Arch Clin ExpOphthalmol. 2010; 248:429–34. [PubMed: 19937335]
35. Sehi M, Grewal DS, Sheets CW, et al. Diagnostic ability of Fourier-domain vs time-domain opticalcoherence tomography for glaucoma detection. Am J Ophthalmol. 2009; 148:597–605. [PubMed:19589493]
36. Leung CK, Ye C, Weinreb RN, et al. Retinal nerve fiber layer imaging with spectral-domainoptical coherence tomography a study on diagnostic agreement with Heidelberg retinal tomograph.Ophthalmology. 2010; 117:267–74. [PubMed: 19969364]
37. Jeoung JW, Park KH. Comparison of Cirrus OCT and Stratus OCT on the ability to detectlocalized retinal nerve fiber layer defects in preperimetric glaucoma. Invest Ophthalmol Vis Sci.2010; 51:938–45. [PubMed: 19797208]
38. Budenz DL, Anderson DR, Varma R, et al. Determinants of normal retinal nerve fiber layerthickness measured by Stratus OCT. Ophthalmology. 2007; 114:1046–52. [PubMed: 17210181]
39. Quigley HA, Katz J, Derick RJ, et al. An evaluation of optic disc and nerve fiber layerexaminations in monitoring progression of early glaucoma damage. Ophthalmology. 1992; 99:19–28. [PubMed: 1741133]
40. Sommer A, Katz J, Quigley HA, et al. Clinically detectable nerve fiber atrophy precedes the onsetof glaucomatous field loss. Arch Ophthalmol. 1991; 109:77–83. [PubMed: 1987954]
41. Zeyen TG, Caprioli J. Progression of disc and field damage in early glaucoma. Arch Ophthalmol.1993; 111:62–5. [PubMed: 8424726]
42. Knight OJ, Chang RT, Feuer WJ, et al. Comparison of retinal nerve fiber layer measurementsusing time domain and spectral domain optical coherent tomography. Ophthalmology. 2009;116:1271–7. [PubMed: 19395086]
43. Kim JS, Ishikawa H, Gabriele ML, et al. Retinal nerve fiber layer thickness measurementcomparability between time domain optical coherence tomography (OCT) and spectral domainOCT. Invest Ophthalmol Vis Sci. 2010; 51:896–902. [PubMed: 19737886]
44. Ojima T, Tanabe T, Hangai M, et al. Measurement of retinal nerve fiber layer thickness andmacular volume for glaucoma detection using optical coherence tomography. Jpn J Ophthalmol.2007; 51:197–203. [PubMed: 17554482]
45. Tan O, Li G, Lu AT, et al. Mapping of macular substructures with optical coherence tomographyfor glaucoma diagnosis. Ophthalmology. 2008; 115:949–56. [PubMed: 17981334]
Sung et al. Page 9
Br J Ophthalmol. Author manuscript; available in PMC 2012 August 17.
NIH
-PA Author Manuscript
NIH
-PA Author Manuscript
NIH
-PA Author Manuscript
46. Ishikawa H, Stein DM, Wollstein G, et al. Macular segmentation with optical coherencetomography. Invest Ophthalmol Vis Sci. 2005; 46:2012–17. [PubMed: 15914617]
47. Tan O, Chopra V, Lu AT, et al. Detection of macular ganglion cell loss in glaucoma by Fourier-domain optical coherence tomography. Ophthalmology. 2009; 116:2305–14. [PubMed: 19744726]
48. Seong M, Sung KR, Choi EH, et al. Macular and peripapillary retinal nerve fiber layermeasurements by spectral domain optical coherence tomography in normal-tension glaucoma.Invest Ophthalmol Vis Sci. 2010; 51:1446–52. [PubMed: 19834029]
49. Strouthidis NG, Grimm J, Williams GA, et al. A comparison of optic nerve head morphologyviewed by spectral domain optical coherence tomography and by serial histology. InvestOphthalmol Vis Sci. 2010; 51:1464–74. [PubMed: 19875649]
50. Chen TC. Spectral domain optical coherence tomography in glaucoma: qualitative and quantitativeanalysis of the optic nerve head and retinal nerve fiber layer (an AOS thesis). Trans AmOphthalmol Soc. 2009; 107:254–81. [PubMed: 20126502]
51. Abramoff MD, Lee K, Niemeijer M, et al. Automated segmentation of the cup and rim fromspectral domain OCT of the optic nerve head. Invest Ophthalmol Vis Sci. 2009; 50:5778–84.[PubMed: 19608531]
52. Medeiros FA, Zangwill LM, Alencar LM, et al. Detection of glaucoma progression with stratusOCT retinal nerve fiber layer, optic nerve head, and macular thickness measurements. InvestOphthalmol Vis Sci. 2009; 50:5741–8. [PubMed: 19815731]
53. Leung CK, Cheung CY, Weinreb RN, et al. Evaluation of retinal nerve fiber layer progression inglaucoma: a study on optical coherence tomography guided progression analysis. InvestOphthalmol Vis Sci. 2010; 51:217–22. [PubMed: 19684001]
54. Wollstein G, Schuman JS, Price LL, et al. Optical coherence tomography longitudinal evaluationof retinal nerve fiber layer thickness in glaucoma. Arch Ophthalmol. 2005; 123:464–70. Erratumin: Arch Ophthalmol 2005, 123: 1206. [PubMed: 15824218]
55. Srinivasan VJ, Adler DC, Chen Y, et al. Ultrahigh-speed optical coherence tomography for three-dimensional and en face imaging of the retina and optic nerve head. Invest Ophthalmol Vis Sci.2008; 49:5103–10. [PubMed: 18658089]
56. Cense B, Koperda E, Brown JM, et al. Volumetric retinal imaging with ultrahigh-resolutionspectral-domain optical coherence tomography and adaptive optics using two broadband lightsources. Opt Express. 2009; 17:4095–111. [PubMed: 19259249]
57. Götzinger E, Pircher M, Baumann B, et al. Retinal nerve fiber layer birefringence evaluated withpolarization sensitive spectral domain OCT and scanning laser polarimetry: a comparison. JBiophotonics. 2008; 1:129–39. [PubMed: 19343644]
Sung et al. Page 10
Br J Ophthalmol. Author manuscript; available in PMC 2012 August 17.
NIH
-PA Author Manuscript
NIH
-PA Author Manuscript
NIH
-PA Author Manuscript
NIH
-PA Author Manuscript
NIH
-PA Author Manuscript
NIH
-PA Author Manuscript
Sung et al. Page 11
Table 1
Spectral-domain (SD) optical coherence tomography (OCT) retinal nerve fibre layer (RNFL) thicknessmeasurement reproducibility
Authors SD-OCT device (company) Study design Main finding
Leung et al18 Cirrus OCT (Carl ZeissMeditec)
Comparison with TD-OCT (Stratus)
Intravisit repeatability of Cirrus OCT ranged between5.12 and 15.02 μm, intervisit reproducibility rangedbetween 4.31 and 22.01 μm
The intervisit variabilities of sectoral and meanRNFL thicknesses were lower in Cirrus HD-OCTcompared with TD-OCT (Stratus)
Schuman19 Cirrus OCT (Carl ZeissMeditec)RTVue OCT (Optovue)
Comparison with TD-OCT (Stratus)
SD-OCT had a significantly better repro- ducibility inmost RNFL sectoral measurements than TD-OCT
No statistically significant differences in overallmean RNFL reproducibility between SD- and TD-OCT
Vizzeri et al21 Cirrus OCT (Carl ZeissMeditec)
Reproducibility inhealthy andglaucomatous eyes
The CV and ICC for mean RNFL thickness were1.5% and 0.96 in healthy eyes, and 1.6% and 0.98, inpatient eyes
González-García et al22 RTVue OCT (Optovue) Reproducibility inhealthy andglaucomatous eyes
The CV and ICC for mean RNFL thickness were1.54% and 0.97 in healthy eyes, and 1.9% and 0.97 inpatient eyes
Garas et al23 RTVue OCT (Optovue) Influence of variousfactors onreproducibility
The intrasession CV and ICC for mean RNFLthickness were 2.2% and 0.99 in undilated status
Pupil dilation, age and experience in imagingexaminations did not influence reproducibility in aclinically significant manner
Menke et al24 3D OCT1000 (Topcon) Intrasession,interobserverreproducibility inhealthy eyes
The intrasession CV and ICC were 4% (operator 1),4.2% (operator 2) and 0.90 3D-OCT RNFL thicknessmeasurements in healthy volunteers showed goodintra- and interobserver reproducibility
Shin et al25 RTVue OCT (Optovue) Reproducibility of twodifferent scan modes,NHM4 and RNFL 3.45
The CV and ICC for mean RNFL thickness were2.31% and 0.96 in NHM4 mode, 2.03 and 0.95 inRNFL 3.45 modes
Both NHM4 and RNFL3.45 modes showed excellentmeasurement reproducibilities
CV, coefficient of variance; HD, high definition; ICC, intraclass correlation coefficient; NHM, nerve head map; TD, time domain.
Br J Ophthalmol. Author manuscript; available in PMC 2012 August 17.
NIH
-PA Author Manuscript
NIH
-PA Author Manuscript
NIH
-PA Author Manuscript
Sung et al. Page 12
Table 2
Spectral-domain (SD) optical coherence tomography (OCT) retinal nerve fibre layer (RNFL) thicknessmeasurement diagnostic capabilities
Authors SD-OCT device (company) Study design Main findings
Leung et al18 Cirrus OCT (Carl Zeiss Meditec) Comparison withTD-OCT (Stratus)
The AUC was 0.962 for SD- and 0.956 for TD-OCT
No significant difference was detected between theTD- and SD-OCT
Park et al31 Cirrus OCT (Carl Zeiss Meditec) Comparison withTD-OCT (Stratus)
The AUC was 0.962 for SD- and 0.956 for TD-OCT
SD-OCT showed a better glaucoma discriminationcapability than TD-OCT in the early stages ofglaucoma
Moreno-Montañés et al32 Cirrus OCT (Carl Zeiss Meditec) Comparison withTD-OCT (Stratus)
The AUC was 0.837 for SD- and 0.829 for TD-OCT
The sensitivity and specificity, and AUCs weresimilar between TD and SD-OCT
Cho et al33 SD-SLO/OCT (OTI) Comparison withTD-OCT (Stratus)
The AUC was 0.969 for SD- and 0.959 for TD-OCT
Li et al34 RTVue OCT (Optovue) RNFL and ONHparameters
The AUC for RNFL thickness was 0.816, and forthe cup–disc vertical ratio 0.782
Sehi et al35 RTVue OCT (Optovue) Comparison withTD-OCT (Stratus)
The AUC was 0.88 for SD- and 0.87 for TD-OCT
No significant difference was detected between theTD- and SD-OCT
Leung et al36 Spectralis OCT (HeidelbergEngineering)
Comparison withHRT (HeidelbergEngineering)
SD-OCT RNFL measurement attained a highersensitivity (AUC; 0.978) than HRT optic discmeasurement (0.905)
Jeoung et al37 Cirrus OCT (Carl Zeiss Meditec) Comparison withTD-OCT (Stratus)
No significant differences between the AUCs forSD- (0.728) and TD-OCT (0.760) indiscriminating preperimetric glaucoma
Sung et al29 Cirrus OCT (Carl Zeiss Meditec) Comparison withTD-OCT (Stratus)
SD-OCT demonstrated a higher sensitivity(63.6%) than TD-OCT (40.0%) in normativeclassification of mean RNFL thickness
Chang et al30 Cirrus OCT (Carl Zeiss Meditec) Comparison withTD-OCT (Stratus)
The sensitivity and specificity of various RNFLparameters using the Cirrus OCT for glaucomawith early to moderate visual field defects areexcellent and are equivalent to Stratus OCT
Vizzeri et al28 Cirrus OCT (Carl Zeiss Meditec)Spectralis OCT (HeidelbergEngineering), RTVue OCT(Optovue)
Detection of localisedRNFL defect
All three SD-OCTs were able to detect localizedglaucomatous structural damage seen instereophotographs
AUC, area under the receiver operating characteristic curve; HRT, Heidelberg retinal tomogaph; ONH, optic nerve head; TD, time domain.
Br J Ophthalmol. Author manuscript; available in PMC 2012 August 17.
Related Documents