IHS ECONOMICS Southwest Regional Manufacturers Association Manufacturing Sector Profile August 2016 ihs.com IHS CONSULTING REPORT Economic Strategy Solutions Brendan O’Neil Managing Director, Consulting Phil Hopkins Director, Consulting Elizabeth Redman Cleveland Senior Consultant Vardan Genanyan Research Economist Julie Gressley Research Economist PREPARED ESPECIALLY FOR:

Welcome message from author
This document is posted to help you gain knowledge. Please leave a comment to let me know what you think about it! Share it to your friends and learn new things together.
Transcript

IHS ECONOMICS
Southwest Regional Manufacturers Association Manufacturing Sector Profile August 2016 ihs.com
IHS CONSULTING REPORT
Economic Strategy Solutions
Brendan O’Neil
Managing Director, Consulting
Phil Hopkins
Director, Consulting
Elizabeth Redman Cleveland
Senior Consultant
Vardan Genanyan
Research Economist
Julie Gressley Research Economist
PREPARED ESPECIALLY FOR:
IHS ECONOMICS | Southwest Regional Manufacturers Association | Manufacturing Sector Profile
IHSTM ECONOMICS
COPYRIGHT NOTICE AND DISCLAIMER © 2016 IHS. For internal use of IHS clients only.
No portion of this report may be reproduced, reused, or otherwise distributed in any form without prior written consent, with the exception of any internal client distribution as may be permitted in the license agreement between client and IHS. Content reproduced or redistributed with IHS permission must display IHS legal notices and attributions of authorship. The information contained herein is from sources considered reliable, but its accuracy and completeness are not warranted, nor are the opinions and analyses that are based upon it, and to the extent permitted by law, IHS shall not be liable for any errors or omissions or any loss, damage, or expense incurred by reliance on information or any statement contained herein. In particular, please note that no representation or warranty is given as to the achievement or reasonableness of, and no reliance should be placed on, any projections, forecasts, estimates, or assumptions, and, due to various risks and uncertainties, actual events and results may differ materially from forecasts and statements of belief noted herein. This report is not to be construed as legal or financial advice, and use of or reliance on any information in this publication is entirely at client’s own risk. IHS and the IHS logo are trademarks of IHS.
© 2016 IHS 2 August 2016
Contents
Introduction 3
Strategic Summary 4
What is the situation today? 4 What are our advantages? 5 Where should we be concerned? 6 Where should we focus our efforts? 6 Characteristics of the regional economy 8
Population 8 Unemployment rate 8 Labor force 8 Economic structure 9 Structure diversity 9 Characteristics of the manufacturing sector 10
Industry growth 10 Durables and nondurables 11 Output and productivity 13 Establishment size 15 Structure diversity 16 Advanced manufacturing 16 Risk rating by industry sector 18
Shift-share analysis 20
Wages in manufacturing occupations 22
Transferability of the Southwest Florida labor
force’s core competencies 23
Appendix A: Results of the shift-share analysis 26
Appendix B: Knowledge, skills, and abilities (KSA)
analysis methodology and applications 27

IHS ECONOMICS | Southwest Regional Manufacturers Association | Manufacturing Sector Profile
© 2016 IHS 3 August 2016
Southwest Regional Manufacturers Association Manufacturing Sector Profile
Introduction
As part of its mission, FloridaMakes is working to provide Florida’s regional manufacturers associations (RMAs) with
actionable information that will help support and increase the economic competitiveness of small- and medium-size
manufacturers located in their service areas. Small and medium manufacturers are defined as companies having 500 or
fewer workers at a single establishment with small manufacturers defined as those firms that have 50 or fewer
employees. FloridaMakes has retained IHS to prepare an economic profile of the Southwest Florida economy, with a
focus on the characteristics of the
manufacturing sector. IHS defines the
manufacturing sector as consisting of
establishments assigned to North
American Industry Classification
System (NAICS) codes 31, 32, and 33.
The Southwest Florida region
comprises eight counties: Charlotte,
Collier, DeSoto, Glades, Hardee,
Hendry, Highlands, and Lee.1 The
largest city in the regional economy,
Cape Coral, is situated within Lee
County, a part of the Cape Coral-Fort
Myers, Florida, metropolitan statistical
area (MSA). Meanwhile, Charlotte
County is in the Punta Gorda, Florida,
MSA; Collier County is in the Naples-
Marco Island, Florida, MSA;
Highlands County is in the Sebring,
Florida, MSA; DeSoto County is in the
Arcadia, Florida, micropolitan
statistical area (micro); Hardee County
is in the Wauchula, Florida micro;
Hendry County is in the Clewiston,
Florida micro; and Glades County is in
the South Florida nonmetropolitan
area.
In the following sections, findings of potential interest to policymakers are presented in bold.
1 While data for this study are presented for the eight-county study area, they are available by county upon client request.

IHS ECONOMICS | Southwest Regional Manufacturers Association | Manufacturing Sector Profile
© 2016 IHS 4 August 2016
Strategic Summary
What is the situation today?
• The 2015 population of the Southwest RMA service area was more than 1.4 million people, or 7.2 percent of the
state of Florida. With a 4.4 percent unemployment rate in April 2016, the labor market in the Southwest
region was tighter in April 2016 than at the national and state levels, despite having been slightly weaker than
the state or national levels on average since 2011.
• Private, services-providing (PSP) sectors constitute 70 percent of employment in the Southwest region, with
the retail trade, accommodation and food services, and health care and social assistance sectors providing the
greatest number of jobs. Just more than 16 percent of regional jobs are in goods-producing sectors (agriculture,
mining, construction, and manufacturing), and 14 percent of jobs are in government.
• The manufacturing sector consists of 10,785 jobs, 2.2 percent of the region’s total employment, which is
significantly less than the US and Florida shares of 8.5 percent and 4.1 percent, respectively.
• The miscellaneous, nonmetallic mineral, machinery, and transportation equipment manufacturing sectors
offered more than 1,000 jobs each in 2015 and together account for almost half (49.1 percent) of regional
employment.
• The vast majority (94.2 percent) of the Southwest region’s manufacturers employ fewer than 50 workers,
and more than three-quarters (77.6 percent) are “very small” employers (with fewer than 10 employees
each). Manufacturing subsectors with large numbers of very small employers include support activities—printing,
fabricated metal products, furniture and related products, and miscellaneous.
• The region’s median annual wage levels in major occupations required by manufacturers (except for those in
sales and related occupations) are lower than those in Florida and the country overall, with production workers
IHS ECONOMICS | Southwest Regional Manufacturers Association | Manufacturing Sector Profile
© 2016 IHS 5 August 2016
typically earning approximately 11 percent less than their national counterparts and architects and engineers
earning almost 23 percent less.
What are our advantages?
• Nine of Southwest Florida’s three-digit North American Industry Classification System (NAICS)
manufacturing subsectors experienced positive employment, output, and growth during the 15-year period
from 2000 to 2015. The largest of these include miscellaneous, transportation equipment, and electrical
equipment and appliance manufacturing.
• Although still a relatively small employer in the region (providing just more than 150 jobs), the beverage
and tobacco products manufacturing sector far surpassed all other sectors in terms of employment growth
with an 18.6 percent compound annual growth rate (CAGR) since 2000 (when the sector only employed 12
people). The 5.6 percent CAGR of the transportation equipment manufacturing industry (which employs
more than 1,000 people in the region) is also noteworthy.
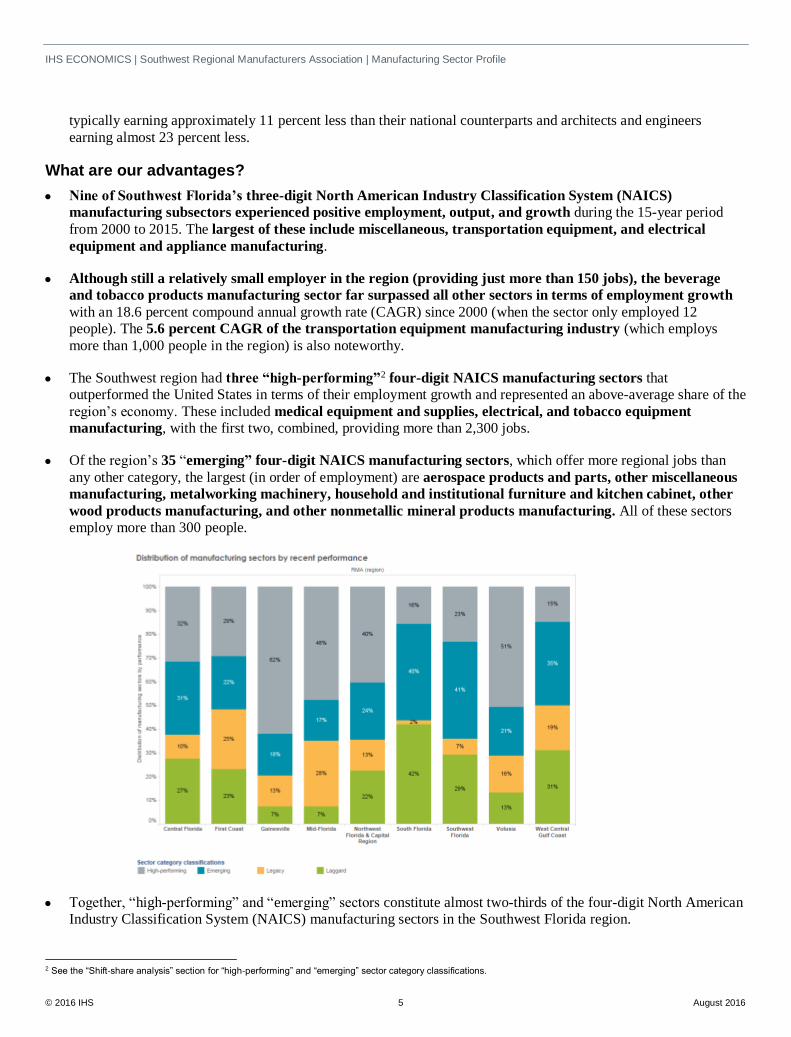
• The Southwest region had three “high-performing”2 four-digit NAICS manufacturing sectors that
outperformed the United States in terms of their employment growth and represented an above-average share of the
region’s economy. These included medical equipment and supplies, electrical, and tobacco equipment
manufacturing, with the first two, combined, providing more than 2,300 jobs.
• Of the region’s 35 “emerging” four-digit NAICS manufacturing sectors, which offer more regional jobs than
any other category, the largest (in order of employment) are aerospace products and parts, other miscellaneous
manufacturing, metalworking machinery, household and institutional furniture and kitchen cabinet, other
wood products manufacturing, and other nonmetallic mineral products manufacturing. All of these sectors
employ more than 300 people.
• Together, “high-performing” and “emerging” sectors constitute almost two-thirds of the four-digit North American
Industry Classification System (NAICS) manufacturing sectors in the Southwest Florida region.
2 See the “Shift-share analysis” section for “high-performing” and “emerging” sector category classifications.
IHS ECONOMICS | Southwest Regional Manufacturers Association | Manufacturing Sector Profile
© 2016 IHS 6 August 2016
• The Southwest Florida region has more than half (53 percent) of its manufacturing industry employment in
advanced manufacturing.3 It is in these sectors we should expect the greatest innovation to occur (i.e., have higher
patent rates), and they have higher growth rates in productivity, require more highly skilled workers, and pay
higher wages than other manufacturing sectors.
• Approximately 78.1 percent of the Southwest Florida region’s manufacturing employment in 2015 was in
the durable4 sectors, a significantly greater share of manufacturing jobs than in Florida overall, where durable
manufacturing accounted for 67.9 percent of manufacturing employment. Compared with nondurable
manufacturing sectors, durable manufacturers typically require a greater share of skilled workers, have
higher levels of productivity, and pay higher wages.
• Aside from miscellaneous manufacturing (for which risk ratings are not available), the region’s top-three
manufacturing sectors (by 2015 employment) all had an IHS World Industry Service composite risk score5
below the US manufacturing industry average.
• Outside of sales and related occupations, the Southwest region has a competitive advantage nationally in terms
of labor costs, especially for architects and engineers, who are especially important to the advanced manufacturing
sectors.
Where should we be concerned?
• Constituting only a small percentage of employment in Southwest Florida, the region’s manufacturing sector
diversity is significantly lower than the manufacturing diversity of the state of Florida overall.
• The Southwest Florida labor force is not particularly well-equipped to meet the educational requirements of
the manufacturing industry, apart from apparel manufacturing. Instead, the Southwest Florida labor force is well-
suited to fill jobs in industries that support the needs of retirees, government agencies, and military bases, such as
occupations required by restaurants, hotels, and construction firms.
• The majority of the region’s manufacturing subsectors experienced significant job losses between 2000 and
2015. A few of the most notable include:
o Textile mills lost nearly 90 percent of their workforce; textile product mills shrank 29 percent; and apparel
manufacturing was left with only 27 workers in 2015 (from 92 in 2000). o Food manufacturing almost halved its workforce size from 1,833 to 968. o Nonmetallic mineral and fabricated metal products manufacturers each lost more than 550 jobs. o Plastic and rubber products manufacturing experienced a rate of decline of 9.2 percent annually. o Paper manufacturing witnessed a workforce reduction of almost 70 percent.
Where should we focus our efforts?
• Given the size of the Southwest region’s manufacturers, sector development strategies should focus on adopting
best practices that are relevant for small or very small manufacturing enterprises.
• Policies and strategies directed at the advanced manufacturing sector will have to concentrate on increasing the
skill levels of the region’s manufacturing labor force. Manufacturing industries for which the local labor force is
at least as well-equipped, if not better equipped, than the national labor force to fulfill industry job requirements
include kitchen cabinet and countertop manufacturing, sawmills, footwear manufacturing, food manufacturing, and
furniture manufacturing, among others. The region may find feasible opportunities for workforce development to
contribute to manufacturing industry development within these manufacturing sectors.
3 See definition in “Advanced Manufacturing” section. 4 Durables, or hard goods, are defined as those that are not totally consumed during their immediate or first use. 5 See the definition in the “Risk rating by industry sector” section.

IHS ECONOMICS | Southwest Regional Manufacturers Association | Manufacturing Sector Profile
© 2016 IHS 7 August 2016
• Economic and workforce development practitioners in the Southwest Florida region might also explore how
commodity demand from the region’s food service industry or commodity supply from the region’s
agriculture industry might be parlayed into manufacturing sector opportunities, e.g., contribute to the growth
of the food and beverage manufacturing sector.
• Explore what is driving the higher-than-average “profitability and pricing,” “growth,” and “supply” risks6
respectively threatening three of the region’s largest manufacturing sectors (nonmetallic minerals,
machinery, and transportation equipment) to determine if there is a role local policymakers or economic
development practitioners can play in mitigating these risks.
• Given the limited resources available to support regional economic development and manufacturing sector growth,
the region should decide whether to prioritize sectors that currently provide the greatest opportunities for
employment in the region (e.g., nonmetallic minerals, machinery, transportation equipment, and miscellaneous
manufacturing), the nine sectors that have witnessed positive employment, output, and productivity growth in recent years (which exclude nonmetallic minerals and machinery manufacturing), or those that are high
performing compared with their nationwide peers in terms of employment growth and industry concentration
(medical equipment and supplies, electrical equipment, and tobacco manufacturing).7
• For targeted manufacturing industry recruitment, the region’s national competitive advantage in terms of
manufacturing labor costs (apart from sales and related occupations) should not go without mention.
6 See the “Risk rating by industry sector” section for definitions of these risk categories. 7 See the “Shift-share analysis” section for sector category classifications.
IHS ECONOMICS | Southwest Regional Manufacturers Association | Manufacturing Sector Profile
© 2016 IHS 8 August 2016
Characteristics of the regional economy
Population
IHS estimates the 2015 population in the Southwest Florida region was 1,454,382 people, or 7.2 percent of the state of
Florida. The population density was 163 persons per square mile, 44 percent of the Florida density of 369.5 persons per
square mile.
Unemployment rate
In April 2016, the region’s unemployment rate (not seasonally adjusted and based on workers’ place of residence rather
than on workplace location), was 4.4 percent, below both the US and Florida rates of 4.7 percent and 4.5 percent,
respectively, that month. The April 2016 unemployment rate was six-tenths of a percentage point lower than in April
2015. Since 2011, the average annual unemployment rate in the Southwest Florida region has been two-fifths of
a percentage point higher than the statewide rate and seven-tenths of a percentage point higher than the
national unemployment rate. Despite historically higher unemployment rates, the region’s 11.8 percent year-on-year
decrease in its unemployment rate far exceeded the national unemployment rate decline of 6.9 percent during the same
period.
Labor force
In April 2016, the region’s unemployment rate (not seasonally adjusted and based on workers’ place of residence rather
than on workplace location), was 4.4 percent, below both the US and Florida rates of 4.7 percent and 4.5 percent,
respectively, that month. The April 2016 unemployment rate was six-tenths of a percentage point lower than in April
2015. Since 2011, the average annual unemployment rate in the Southwest Florida region has been two-fifths of a
percentage point higher than the statewide rate and seven-tenths of a percentage point higher than the national
unemployment rate. Despite historically higher unemployment rates, the region’s 11.8 percent year-on-year decrease in
its unemployment rate far exceeded the national unemployment rate decline of 6.9 percent during the same period.
The key finding from the labor force analysis is the labor market in the Southwest Florida region is slightly
tighter than at either the state or US level. The tighter-than-average labor market could eventually result in
rising wage rates and potentially bring on shortages of skilled workers, especially for skilled manufacturing
occupations.
IHS ECONOMICS | Southwest Regional Manufacturers Association | Manufacturing Sector Profile
© 2016 IHS 9 August 2016
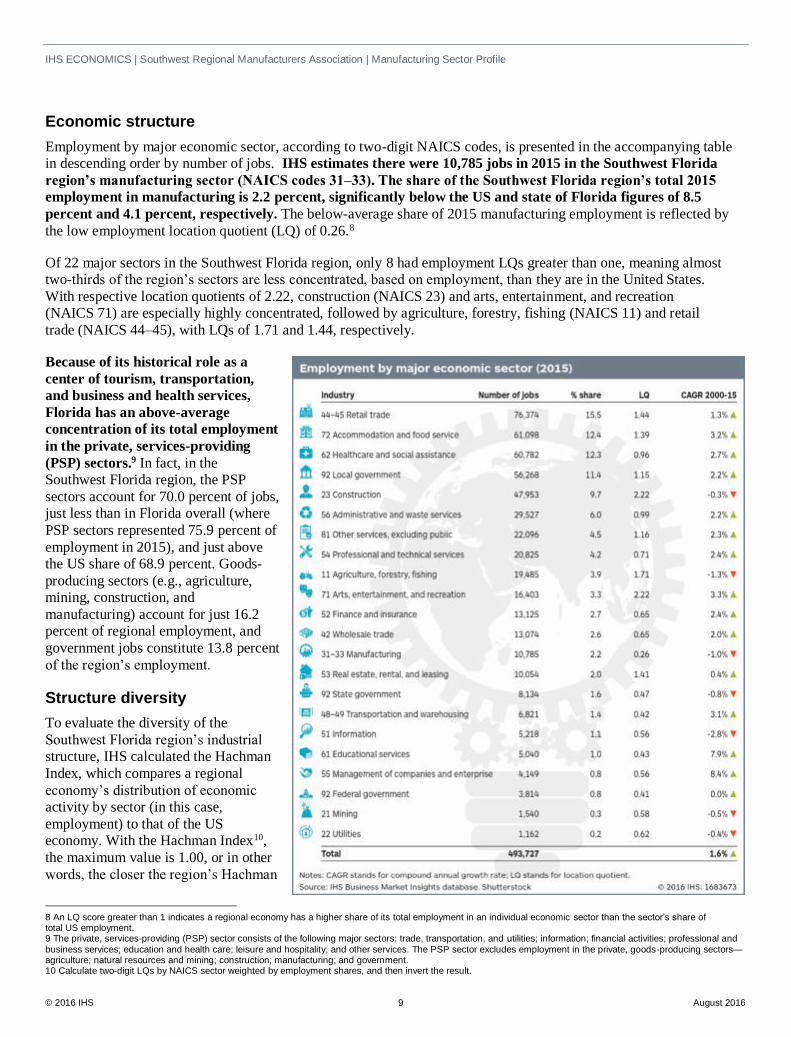
Economic structure
Employment by major economic sector, according to two-digit NAICS codes, is presented in the accompanying table
in descending order by number of jobs. IHS estimates there were 10,785 jobs in 2015 in the Southwest Florida
region’s manufacturing sector (NAICS codes 31–33). The share of the Southwest Florida region’s total 2015
employment in manufacturing is 2.2 percent, significantly below the US and state of Florida figures of 8.5
percent and 4.1 percent, respectively. The below-average share of 2015 manufacturing employment is reflected by
the low employment location quotient (LQ) of 0.26.8
Of 22 major sectors in the Southwest Florida region, only 8 had employment LQs greater than one, meaning almost
two-thirds of the region’s sectors are less concentrated, based on employment, than they are in the United States.
With respective location quotients of 2.22, construction (NAICS 23) and arts, entertainment, and recreation
(NAICS 71) are especially highly concentrated, followed by agriculture, forestry, fishing (NAICS 11) and retail
trade (NAICS 44–45), with LQs of 1.71 and 1.44, respectively.
Because of its historical role as a
center of tourism, transportation,
and business and health services,
Florida has an above-average
concentration of its total employment
in the private, services-providing
(PSP) sectors.9 In fact, in the
Southwest Florida region, the PSP
sectors account for 70.0 percent of jobs,
just less than in Florida overall (where
PSP sectors represented 75.9 percent of
employment in 2015), and just above
the US share of 68.9 percent. Goods-
producing sectors (e.g., agriculture,
mining, construction, and
manufacturing) account for just 16.2
percent of regional employment, and
government jobs constitute 13.8 percent
of the region’s employment.
Structure diversity
To evaluate the diversity of the
Southwest Florida region’s industrial
structure, IHS calculated the Hachman
Index, which compares a regional
economy’s distribution of economic
activity by sector (in this case,
employment) to that of the US
economy. With the Hachman Index10,
the maximum value is 1.00, or in other
words, the closer the region’s Hachman
8 An LQ score greater than 1 indicates a regional economy has a higher share of its total employment in an individual economic sector than the sector’s share of total US employment. 9 The private, services-providing (PSP) sector consists of the following major sectors: trade, transportation, and utilities; information; financial activities; professional and
business services; education and health care; leisure and hospitality; and other services. The PSP sector excludes employment in the private, goods-producing sectors—agriculture; natural resources and mining; construction; manufacturing; and government. 10 Calculate two-digit LQs by NAICS sector weighted by employment shares, and then invert the result.
IHS ECONOMICS | Southwest Regional Manufacturers Association | Manufacturing Sector Profile
© 2016 IHS 10 August 2016
Index value is to 1.00, the more similar that region’s economic structure is to the US economy.
For the Southwest Florida region, the Hachman Index was 0.862, indicating the region’s economy is much less
diverse than the Florida economy overall, which has a Hachman Index of 0.941. Since regional economies,
especially smaller ones, are usually less diverse than larger state economies or the United States overall, this disparity
is to be expected.
Characteristics of the manufacturing sector
To provide a more accurate picture of
the Southwest Florida region’s overall
manufacturing industry, the following
sections provide data on manufacturing
subsectors’ growth, structure, diversity,
and risk ratings. We conclude with a
shift-share analysis to get a more
detailed perspective on regional
manufacturing sector performance in
2015.
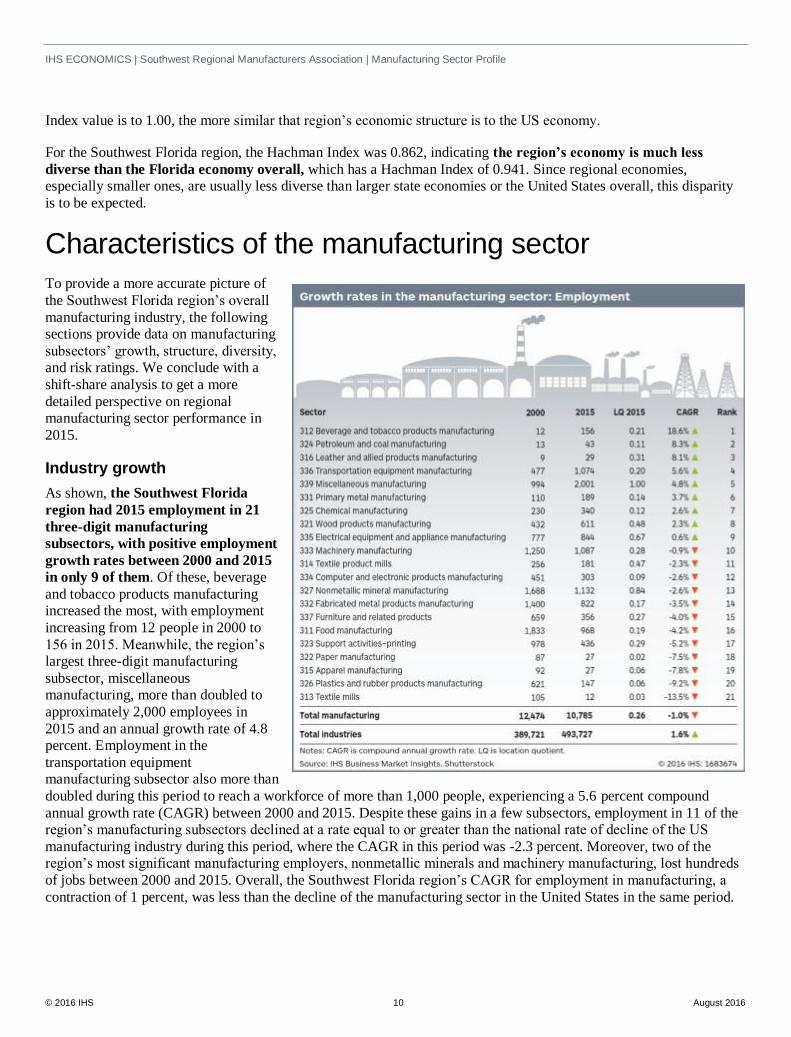
Industry growth
As shown, the Southwest Florida
region had 2015 employment in 21
three-digit manufacturing
subsectors, with positive employment
growth rates between 2000 and 2015
in only 9 of them. Of these, beverage
and tobacco products manufacturing
increased the most, with employment
increasing from 12 people in 2000 to
156 in 2015. Meanwhile, the region’s
largest three-digit manufacturing
subsector, miscellaneous
manufacturing, more than doubled to
approximately 2,000 employees in
2015 and an annual growth rate of 4.8
percent. Employment in the
transportation equipment
manufacturing subsector also more than
doubled during this period to reach a workforce of more than 1,000 people, experiencing a 5.6 percent compound
annual growth rate (CAGR) between 2000 and 2015. Despite these gains in a few subsectors, employment in 11 of the
region’s manufacturing subsectors declined at a rate equal to or greater than the national rate of decline of the US
manufacturing industry during this period, where the CAGR in this period was -2.3 percent. Moreover, two of the
region’s most significant manufacturing employers, nonmetallic minerals and machinery manufacturing, lost hundreds
of jobs between 2000 and 2015. Overall, the Southwest Florida region’s CAGR for employment in manufacturing, a
contraction of 1 percent, was less than the decline of the manufacturing sector in the United States in the same period.

IHS ECONOMICS | Southwest Regional Manufacturers Association | Manufacturing Sector Profile
© 2016 IHS 11 August 2016
Durables and nondurables
Additional insight into a region’s manufacturing sector can be obtained by analyzing the durable and nondurable
sectors. Durables, or hard goods, are defined as those that are not totally consumed during their immediate or first use
(i.e., used over an extended period of time, usually with a useful life of at least three years, and thus do not have to be
purchased often). By contrast, nondurables, or soft or consumable goods, are immediately and totally consumed when
initially used, have a useful life of less than three years, and need to be purchased frequently. The following charts
present the employment trends in the Southwest Florida region for the individual three-digit NAICS code
manufacturing subsectors that make up the durable and nondurable sectors. Each chart presents the CAGR in
employment between 2000 and 2015 on the x axis, the 2015 employment LQ on the y axis, and the size of each bubble
presents that sector’s total employment in 2015. Each chart provides a visual representation of the performance of the
individual subsectors and the structure of the manufacturing economy. Approximately 78.1 percent and 21.9 percent of
the Southwest Florida region’s manufacturing employment in 2015 was in the durable and nondurable sectors,
respectively, with the Southwest Florida region’s durable manufacturing sector constituting a significantly
greater share of manufacturing jobs than in Florida overall, where durable manufacturing accounted for 67.9
percent of manufacturing employment.
Because of differences in the goods made and the production processes used, the durable and nondurable
manufacturing sectors also differ from each other in terms of the mix of skilled workers required, level of wages
paid, and productivity, all of which will determine appropriate economic and workforce development strategies.
IHS analyzed detailed occupational employment and wage data for 2015 by four-digit manufacturing subsector for the
United States, identifying the following differences between the durable and nondurable sectors:
• Durable sectors require higher
shares of skilled workers. About
19.4 percent of the jobs, by detailed
occupation, required a Bachelor’s
degree or higher to obtain an entry-
level position, compared with only
12.4 percent in the nondurable
sectors. Similarly, 26.0 percent of
durable jobs required some type of
postsecondary education, compared
with only 18.8 percent for the
nondurable sector.
• By contrast, 58.2 percent of durable
sector jobs required a high school
diploma or equivalent for an entry-
level position, compared with 60.9
percent for the nondurables.
Interestingly, 1.1 percent of the
nondurable jobs require an advanced degree for an entry-level position, compared with only 0.5 percent in the
durable sectors, because of the high share of STEM occupations required by the chemicals sector, especially in
pharmaceuticals because of its high level of research and development spending.
• Durable jobs pay higher annual wages. The average annual US wage in the durable sectors in 2015, based on a
detailed analysis of occupations required, was $49,387 compared with $44,194 in the nondurable sectors.

IHS ECONOMICS | Southwest Regional Manufacturers Association | Manufacturing Sector Profile
© 2016 IHS 12 August 2016
• Nondurable sectors have higher
shares of their employment in
traditional “blue-collar”
occupations and lower shares
in STEM occupations.
The nondurables had 63.3 percent of
their total employment in production,
transportation, and material handling
occupations in 2015 compared with
only 57.4 percent for durables. By
contrast, durable sectors had 12.2
percent of their total employment in
three high-skill, high-education
STEM occupations: architecture and
engineering; computer and math; and
life, physical, and social sciences,
well above the 5.2 percent share for
the nondurables.
• Durable sectors are slightly more
labor intensive, creating 2.7 direct
jobs per $1 million in output
compared with 1.6 in the nondurable
sectors; the latter figure is low
because of the high level of output per employee in the petroleum refining and chemical manufacturing subsectors; if
they are excluded, the nondurable figure rises to 2.5 jobs per $1 million in output.
The difference between the durable and nondurable sectors indicates expanding the durable sector will require
greater efforts to develop the supply of highly skilled workers in the local labor force. However, the generally
lower entry-level education and training requirements for the nondurables, excluding chemicals, indicate these sectors
have a greater potential to employ less-skilled workers, thus providing more opportunities for them to begin careers.
The first chart, durable manufacturing sector trends, shows the composition and performance of Southwest Florida’s
durable sector between 2000 and 2015. The positive employment growth rates of many durable sectors that had
average or below-average employment concentration in the region show that despite notable comparative advantages in
these sectors, the region has made significant headway, increasing the number of potentially high-paying
manufacturing jobs. The second chart presents the composition and performance of the nondurable sectors. Although
the beverage and tobacco manufacturing sector is not highly concentrated and employs only 156 people its high growth
is notable, and the sector might be of interest to economic developers. At the same time, they might want to better
understand the reason behind the significant job losses in recent years in the food manufacturing sector, the largest of
the region’s nondurable sectors.
If an RMA wants to increase employment in the traditional, “blue-collar” manufacturing occupations, then
expansion of the durable sectors (i.e., more direct jobs per $1 million of output as noted above), and some
nondurables (e.g., textiles, apparel, leather, wood, printing) should be promoted. Similarly, if the economic
development objective is to attract higher-paying jobs in the STEM occupations that are often associated with
nonproduction facilities such as research and development (R&D) centers, then policies and programs should be
directed at the durable sectors, and some nondurables such as petroleum refining and chemicals. In adopting
the latter strategy, complementary STEM programs to increase skills of the workforce will also have to be
implemented.

IHS ECONOMICS | Southwest Regional Manufacturers Association | Manufacturing Sector Profile
© 2016 IHS 13 August 2016
Output and productivity
In addition to employment, it is helpful
to consider output by sector and
productivity (output per worker), to get
a better sense of an individual
manufacturing subsector’s contribution
to a regional economy. For example, a
capital-intensive (i.e., high levels and
values of structures and equipment per
worker) sector such as petroleum
refining, chemicals, or primary metals
may not employ a lot of workers (i.e.,
have high levels of output per worker),
but could generate substantial increases
in regional economic activity through
either their backward linkages (i.e., they
purchase large amounts of inputs from
suppliers located in the region) or
through their forward linkages (i.e., the
products they make are in turn
purchased by other firms in the region
who use them as inputs in making other
types of goods or services). In other
words, when evaluating the
manufacturing sector’s regional
economic health, it is important to
note that, based on changes in
productivity, employment growth
rates may differ significantly from
output growth rates. For example, in the Southwest Florida region, while only 9 manufacturing subsectors had a
positive CAGR for employment between 2000 and 2015, 16 had a positive CAGR for output. The most notable output
gains were in the beverage and tobacco products, petroleum and coal, leather and allied products, and transportation
equipment manufacturing subsectors.
Of the 16 manufacturing sectors with positive growth in output during this period, all also demonstrated growth in
productivity (inflation-adjusted output per worker), with transportation equipment manufacturing leading the pack with
a CAGR in productivity of 4.7 percent. In fact, all nine Southwest Florida region manufacturing subsectors that
experienced positive employment growth rates during the 15-year period also experienced positive growth in
output and productivity. These include:
• Beverage and tobacco products manufacturing
• Petroleum and coal manufacturing
• Leather and allied products manufacturing
• Transportation equipment manufacturing
• Miscellaneous manufacturing
• Primary metal manufacturing
• Chemical manufacturing
• Wood products manufacturing
• Electrical equipment and appliance manufacturing
IHS ECONOMICS | Southwest Florida Regional Manufacturers Association | Manufacturing Sector Profile
© 2016 IHS 14 August 2016
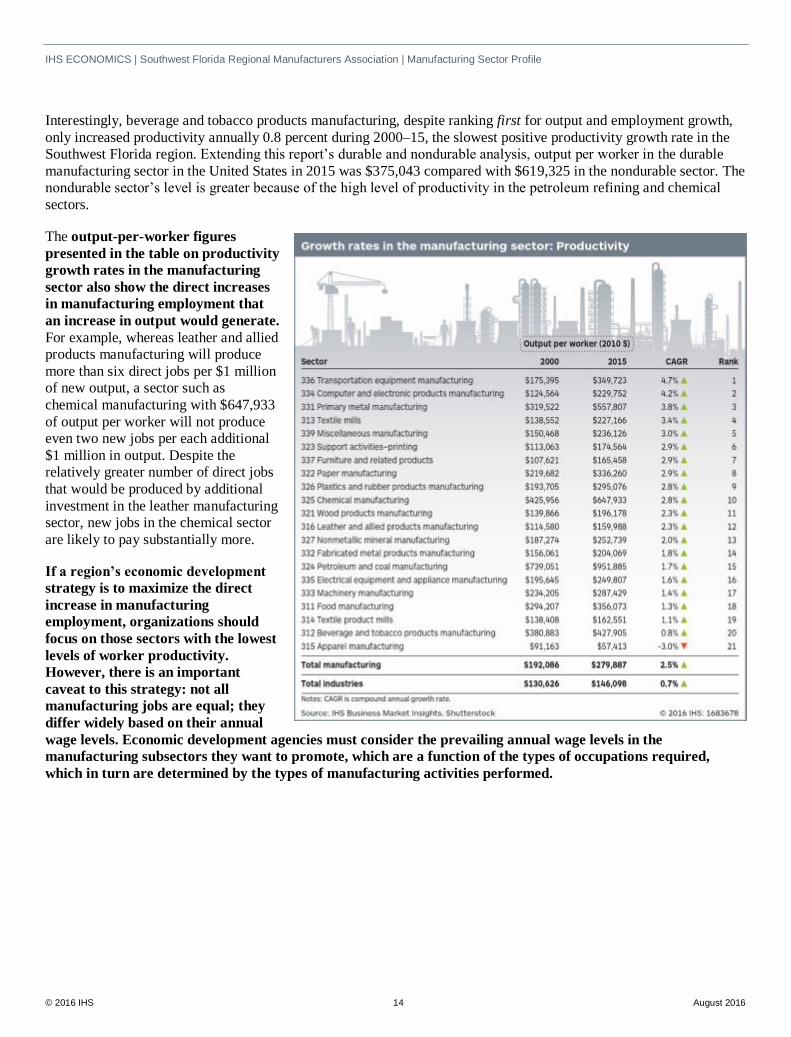
Interestingly, beverage and tobacco products manufacturing, despite ranking first for output and employment growth,
only increased productivity annually 0.8 percent during 2000–15, the slowest positive productivity growth rate in the
Southwest Florida region. Extending this report’s durable and nondurable analysis, output per worker in the durable
manufacturing sector in the United States in 2015 was $375,043 compared with $619,325 in the nondurable sector. The
nondurable sector’s level is greater because of the high level of productivity in the petroleum refining and chemical
sectors.
The output-per-worker figures
presented in the table on productivity
growth rates in the manufacturing
sector also show the direct increases
in manufacturing employment that
an increase in output would generate.
For example, whereas leather and allied
products manufacturing will produce
more than six direct jobs per $1 million
of new output, a sector such as
chemical manufacturing with $647,933
of output per worker will not produce
even two new jobs per each additional
$1 million in output. Despite the
relatively greater number of direct jobs
that would be produced by additional
investment in the leather manufacturing
sector, new jobs in the chemical sector
are likely to pay substantially more.
If a region’s economic development
strategy is to maximize the direct
increase in manufacturing
employment, organizations should
focus on those sectors with the lowest
levels of worker productivity.
However, there is an important
caveat to this strategy: not all
manufacturing jobs are equal; they
differ widely based on their annual
wage levels. Economic development agencies must consider the prevailing annual wage levels in the
manufacturing subsectors they want to promote, which are a function of the types of occupations required,
which in turn are determined by the types of manufacturing activities performed.
IHS ECONOMICS | Southwest Regional Manufacturers Association | Manufacturing Sector Profile
© 2016 IHS 15 August 2016
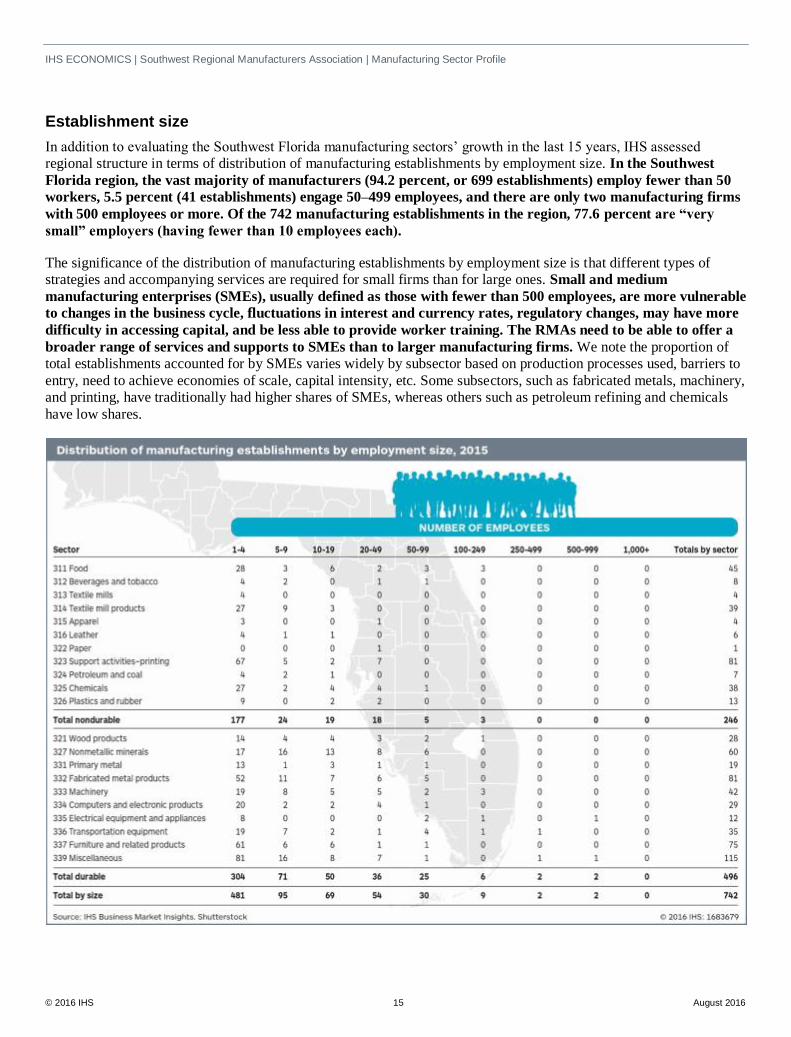
Establishment size
In addition to evaluating the Southwest Florida manufacturing sectors’ growth in the last 15 years, IHS assessed
regional structure in terms of distribution of manufacturing establishments by employment size. In the Southwest
Florida region, the vast majority of manufacturers (94.2 percent, or 699 establishments) employ fewer than 50
workers, 5.5 percent (41 establishments) engage 50–499 employees, and there are only two manufacturing firms
with 500 employees or more. Of the 742 manufacturing establishments in the region, 77.6 percent are “very
small” employers (having fewer than 10 employees each).
The significance of the distribution of manufacturing establishments by employment size is that different types of
strategies and accompanying services are required for small firms than for large ones. Small and medium
manufacturing enterprises (SMEs), usually defined as those with fewer than 500 employees, are more vulnerable
to changes in the business cycle, fluctuations in interest and currency rates, regulatory changes, may have more
difficulty in accessing capital, and be less able to provide worker training. The RMAs need to be able to offer a
broader range of services and supports to SMEs than to larger manufacturing firms. We note the proportion of
total establishments accounted for by SMEs varies widely by subsector based on production processes used, barriers to
entry, need to achieve economies of scale, capital intensity, etc. Some subsectors, such as fabricated metals, machinery,
and printing, have traditionally had higher shares of SMEs, whereas others such as petroleum refining and chemicals
have low shares.

IHS ECONOMICS | Southwest Regional Manufacturers Association | Manufacturing Sector Profile
© 2016 IHS 16 August 2016
Structure diversity
To evaluate the diversity of the region’s manufacturing sector, we again used the Hachman Index11 based on four-digit
NAICS employment, with LQs based on employment in the manufacturing sectors, not total employment. For the
eight counties included in the Southwest Florida region, the Hachman Index of 0.266 shows the region’s
manufacturing sector diversity is significantly lower than the manufacturing diversity of the state of Florida,
which has a Hachman Index of 0.701.
Advanced manufacturing
With 5,718 people employed in the advanced manufacturing sectors, as defined either by researchers from the
US Bureau of Labor Statistics (BLS) or the Brookings Institution12 think tank, the Southwest Florida region has
more than half (53 percent) of its manufacturing industry employment in advanced manufacturing. This share is
above the US share of 46.8 percent and the statewide share of 49.7 percent. It is in these sectors we should expect the
greatest innovation to occur (i.e., have higher patent rates), and they have higher growth rates in productivity,
require more highly skilled workers, and pay higher wages than other manufacturing sectors.
The criteria applied in the two studies we used to identify advanced manufacturing:
• High levels of spending for R&D, including high intensity (i.e., above-average shares of R&D spending as a
percentage of sales) and high levels per worker
• The share of employment in the STEM occupations
The BLS study also considered industries that use advanced manufacturing processes and that produced high-
technology goods. The Brookings and BLS studies identified advanced and high-tech NAICS sectors at the four-digit
level across the entire economy; for the purposes of this profile, we considered only the individual sectors that were
part of the manufacturing sector.
Similar to the discussion for the durable and nondurable sectors, there are also differences between the advanced
manufacturing subsectors and the entire manufacturing sector. Our analysis of detailed occupational employment and
wage data for 2015 by four-digit manufacturing subsector for the United States found the following differences:
• Advanced sectors require higher shares of skilled workers: About 24.9 percent of the jobs required a Bachelor’s
degree or higher to obtain an entry-level position, compared with only 16.9 percent for the entire manufacturing
sector. Similarly, 32.7 percent of advanced manufacturing jobs required some type of post-secondary education,
compared with only 23.5 percent for all of manufacturing. In contrast, 53.9 percent of advanced sector jobs required a
high school diploma or equivalent for an entry-level position, compared with 59.2 percent for total manufacturing.
• Advanced manufacturing jobs pay higher annual wages. The average annual US wage in advanced manufacturing
sectors in 2015, based on a detailed analysis of occupations required, was $52,635 compared with $47,505 across the
entire manufacturing sector.
• Advanced manufacturing requires fewer workers in traditional blue-collar occupations and more in STEM
occupations. Advanced manufacturing had 50.8 percent of its total employment in production, transportation, and
material handling occupations in 2015 compared with 59.5 percent for the entire manufacturing sector. Similarly,
16.9 percent of advanced manufacturing employment was in three high-skill, high-education occupations:
11 See Footnote 10 regarding the Hachman Index calculation. 12 The definition of advanced manufacturing subsectors comes from two sources: 1) Daniel E. Hecker, “High-technology employment: A NAICS-based update,” Monthly Labor Review, July 2005. (Hecker is an economist in the Office of Occupational Statistics and Employment Projections, US Bureau of Labor Statistics) and 2) Muro, M., Jonathan Rothwell, et al. “America’s Advanced Industries: What They Are, Where They Are and Why They Matter, ” Brookings Advanced Industries
Project, February 2015. Both studies identified high-tech and advanced sectors across the entire economy at the four-digit NAICS level; we defined advanced manufacturing to consist of all the manufacturing subsectors that were identified in either study. The result was that 37 of the 86 four-digit NAICS manufacturing subsectors were defined as advanced manufacturing subsectors.

IHS ECONOMICS | Southwest Regional Manufacturers Association | Manufacturing Sector Profile
© 2016 IHS 17 August 2016
architecture and engineering; computer and math; and life, physical, and social sciences versus 9.7 percent in all of
manufacturing.
• Productivity in advanced manufacturing is high. In 2015 output per worker in the US advanced manufacturing
sector was $422,751 compared with $325,000 for all of manufacturing.
The key finding is that policies and strategies directed at the advanced manufacturing sector will have to
concentrate on increasing the skill levels of the region’s manufacturing labor force. The training will have to be
provided by a range of organizations, including local universities and community colleges, workforce development
boards, secondary career and technical education (CTE) schools, the Southwest RMA, labor union apprentice
programs, and manufacturing companies themselves. IHS cautions that regions cannot be competitive in all advanced
manufacturing sectors, so economic development policies should be designed for and targeted at those advanced
manufacturing sectors where clear competitive advantages exist.
IHS ECONOMICS | Southwest Regional Manufacturers Association | Manufacturing Sector Profile
© 2016 IHS 18 August 2016
Risk rating by industry sector
IHS World Industry Service Sector Risk Ratings for each manufacturing sector in the United States use a proprietary
methodology that calculates 40 individual risk factors for industrial sectors for most major industrialized countries
including the United States. We consider the following major types of risk faced by firms in industrial sectors:
• Composite sector risk: A weighted average of 40 different risk components distributed among five major risk
categories; 1) growth, 2) price and profitability, 3) supply, 4) industry structure, and 5) economic and commerce risk
• Growth risk: Evaluates, for real revenue and nominal sales, the rate and volatility of growth in the sector and detects
the presence of turning points and shifts in sales patterns
• Profitability and pricing risk: Evaluates the sector's ability to pass on cost increases, its historical and forecast
profits, and cash-flow growth and volatility, as well as operating efficiency
• Supply risk: Evaluates risk accruing to capital usage, depreciation, and changes in productive capacity
• Industry-structure risk: Evaluates the sector's exposure that results from competitive and structural characteristics
(These include factors such as barriers to entry and exit.)
• Economic and commerce risk: Evaluates the size of the cycle in the sector and sensitivity of output demand to
interest rates and incorporates the specific macroeconomic risks related to currency, legal, financial, and tax
initiatives
The IHS risk ratings provide a broad perspective on the current and future risks in the industry sectors that state and
local economic development organizations may consider assisting in terms of strategy development, technical
assistance, workforce development, or the provision of economic development incentives such as loans, grants, and tax
credits or deductions. The risk ratings are presented for International Standard Industrial Classification (ISIC) codes,
which correspond closely with three-digit NAICS codes, and risk scores range between one (least risk) and 10 (highest
risk). In our April 2016 release, the minimum (e.g., low risk) and maximum (e.g., high risk) composite risk scores for
the US manufacturing sectors were 5.0 and 8.1, compared with 6.9 for the entire manufacturing sector. The ranges of
scores in the five subcategories are wider than for the composite risk, especially for the growth, profitability and
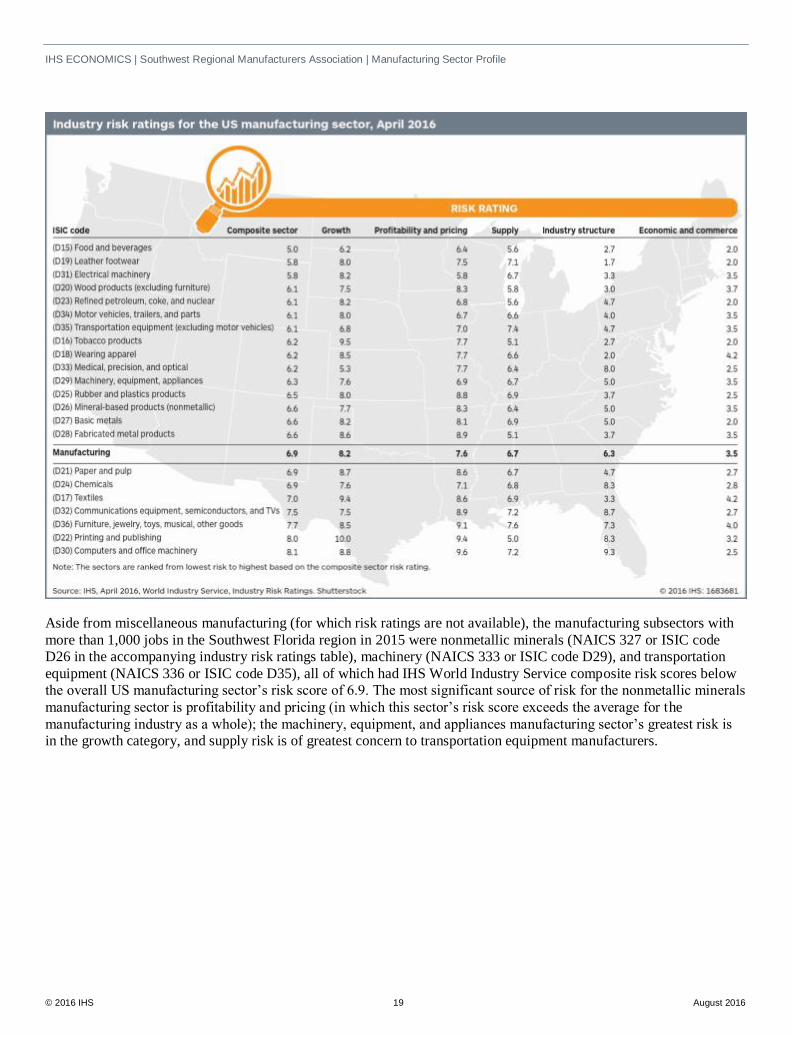
pricing, and supply risk categories. The accompanying table presents the IHS industry risk ratings for the US
manufacturing sector from April 2016, listed in ascending order of composite risk (i.e., low scores indicate lower levels
of risk, and vice versa).
IHS industry risk scores can assist state and local agencies in devising economic development strategies targeted
at individual manufacturing subsectors. The appropriate way to use the industry risk rating is to first identify a
specific subsector of interest in the table, then read across its row to identify the different types and levels of
risks the sector is facing. Informed policies can be developed then based on the potential risks. As some of the risks
faced by an individual sector, such as pricing and profitability or industry structure, may not be able to be reduced
through state or regional policies, economic development practitioners need to consider the risk factors facing an
industry and their ability to lessen those risks when developing strategies for, or allocating scarce resources to,
individual manufacturing sectors or companies.
IHS ECONOMICS | Southwest Regional Manufacturers Association | Manufacturing Sector Profile
© 2016 IHS 19 August 2016
Aside from miscellaneous manufacturing (for which risk ratings are not available), the manufacturing subsectors with
more than 1,000 jobs in the Southwest Florida region in 2015 were nonmetallic minerals (NAICS 327 or ISIC code
D26 in the accompanying industry risk ratings table), machinery (NAICS 333 or ISIC code D29), and transportation
equipment (NAICS 336 or ISIC code D35), all of which had IHS World Industry Service composite risk scores below
the overall US manufacturing sector’s risk score of 6.9. The most significant source of risk for the nonmetallic minerals
manufacturing sector is profitability and pricing (in which this sector’s risk score exceeds the average for the
manufacturing industry as a whole); the machinery, equipment, and appliances manufacturing sector’s greatest risk is
in the growth category, and supply risk is of greatest concern to transportation equipment manufacturers.

IHS ECONOMICS | Southwest Regional Manufacturers Association | Manufacturing Sector Profile
© 2016 IHS 20 August 2016
Shift-share analysis
Finally, to examine the performance of the four-digit manufacturing subsectors based on changes in employment
between 2000 and 2015, IHS conducted a shift-share analysis of the manufacturing subsectors in the regional study
area.13
Shift-share analysis is an analytical technique used to decompose changes in a variable, such as employment or
income, which occurred in a regional economy during a historical period. It compares the performance of an individual
economic sector over time within the regional economy of interest to that same sector’s performance in a larger
reference economy, usually the United States, in the same time period. Shift-share analysis is based on the theory that
an individual sector’s performance in a regional economy over time is due to four effects:
• National: The share of growth in the larger reference economy that was captured by the region
• Industry mix: The shares of high-growth and low-growth sectors in the region and how they changed over time
• Competitive: The extent to which an individual economic sector in the region outperformed or underperformed the
same sector at the level of the reference economy over the analysis period (The United States is the reference
economy for the shift-share analysis presented in this profile.)
• Allocation: The extent to which a region has above-average shares of economic activity in those sectors where it has
a competitive advantage
Stated another way, shift-share analysis enables an analyst to determine how much of the change in a variable, such as
employment, in an individual economic sector over time was due to growth in the US economy and how much was
attributable to characteristics of the regional economy, such as competitive advantages or disadvantages, and the
distribution of economic activity into competitive and noncompetitive sectors.
Employment is the variable most often used in a shift-share analysis because it is the most widely available, the most
current, and is published at the detailed NAICS level. For this study, using employment data at the four-digit NAICS
code level (86 manufacturing subsectors) from the IHS Business Market Insights database, we classify each sector that
has more than 50 employees into one of four types based on its performance.
• Type A (“High Performing”): The sector’s 2015 employment LQ is greater than 1.0, and its employment CAGR
during the analysis period was greater than the sector’s employment CAGR for the United States in the same period.
• Type B (“Emerging”): The sector’s
2015 LQ is less than 1.0, but its
employment CAGR was greater than
the sector’s employment CAGR for
the United States during the same
period.
• Type C (“Legacy”): The sector’s
2015 LQ is greater than 1.0, but its
employment CAGR was less than the
sector’s employment CAGR for the United States in the same period.
13 See Appendix A for full results of shift-share analysis.
IHS ECONOMICS | Southwest Regional Manufacturers Association | Manufacturing Sector Profile
© 2016 IHS 21 August 2016
• Type D (“Laggard”): The sector’s 2015 LQ is less than 1.0 and its employment CAGR during the analysis period
was less than the sector’s employment CAGR for the United States during the same period.
In the Southwest Florida region, there were three high-performing manufacturing sectors classified as A that
outperformed the same sector in the United States and represented an above-average share of the region’s economy
(i.e., had employment LQs above 1.0). All three also had positive annual employment growth rates in the past 15 years:
• Medical equipment and supplies manufacturing (5.8 percent CAGR)
• Electrical equipment manufacturing (0.7 percent CAGR)
• Tobacco manufacturing (18.6 percent CAGR)
The three high-performing sectors currently account for less than one-quarter (23.2 percent) of total
manufacturing employment in the Southwest Florida region. Meanwhile, the region has 35 emerging or growth
sectors, classified as B sectors, which are doing relatively well in terms of employment growth, but do not yet account
for a large share of regional economic activity. These B sectors represent 40.4 percent of regional manufacturing
employment, meaning state and local economic development organizations such as FloridaMakes have a
significant opportunity to support growth sectors in the Southwest Florida region by researching these
companies’ competitiveness drivers and designing programs or policies that capitalize on areas of strength
and/or minimize growth barriers. A few of the notable B sectors that provide 300 or more jobs in the region include:
• Aerospace products and parts manufacturing
• Other miscellaneous manufacturing
• Metalworking machinery manufacturing
• Household and institutional furniture and kitchen cabinet manufacturing
• Other wood products manufacturing
• Other nonmetallic mineral products manufacturing
For the traditionally important legacy industries in which the region still has above-average shares of economic
activity, but, for a variety of reasons, are underperforming their peers at the US level (the C sectors), we note only one:
lime and gypsum products manufacturing. This sector, while an extremely large part of the region’s economy relative
to the same sector’s contribution to the national economy (as shown by the LQ of 14.12), only composes 6.6 percent of
the region’s employment.
Finally, we find 20 D sectors that are the lowest-performing in terms of relative importance to the regional economy (as
compared with the nation as a whole) and with slower growth than the sector had at the US level during the analysis
period. Given that these sectors represent 29 percent of the region’s employment—with nine of them employing more
than 100 people each—to keep manufacturing jobs in the region, attention should be paid to better understanding why
these sectors have experienced such challenges in recent years.
The results of the shift-share analysis can be used for developing strategies in the following manner:
• Analyze the economic sectors classified as either A or B, as they are the highest performers, to identify the
competitive advantages in the region that drive their performance. The B sectors should receive special attention
because, while they currently account for below-average shares of economic activity, this is where growth
opportunities are likely to be found. The economic development objective is to turn B sectors into A sectors.
IHS ECONOMICS | Southwest Regional Manufacturers Association | Manufacturing Sector Profile
© 2016 IHS 22 August 2016
• Identify the names of individual firms in each A and B sector and analyze them to determine why they are
high performers. It is essential to determine the extent to which their high performances are due to:
1) firm-level factors such as excellent management, efficient operations, competitive prices, superior product
quality, etc.
2) regional competitive advantages such as lower cost of doing business; high quality of labor; proximity to
markets, suppliers, or both; lower tax rates; excellent transportation networks; favorable regulatory
environment; etc.
• Analyze the C sectors and identify the factors that affect their competitiveness; they constitute traditional centers
of manufacturing activity so helping them remain profitable also maintains manufacturing employment.
• Identify clusters of subsectors with similar needs that also interact with each other through buying and selling
relationships.
• Identify those regional competitive advantages that apply across all the manufacturing subsectors and those that
are uniquely important to a few specialized subsectors.
• Identify those regional competitive advantages where local actions can make a difference (i.e., increasing the
supply of skilled workers needed by the advanced manufacturing sectors).
• Begin to develop strategies and programs that maintain and enhance regional competitive advantage in the targeted
sectors.
Based on our experience in other studies, it is always valuable to have economic development professionals with
detailed knowledge of the regional economy review the list of the subsectors assigned to each of the four shift-share
types. Ideally, the distribution of subsectors by type should generally confirm their understanding of the region’s
economic composition (i.e., the subsectors they expect to be classified as A or B sectors actually appear there).
Wages in manufacturing occupations
IHS estimated total annual wage payments for an individual company in selected manufacturing sectors using the US
distribution of detailed occupational employment by four-digit NAICS code. Our analysis used 2015 annual wage
rates, as published by the BLS for the Cape Coral-Fort Myers, Naples-Immokalee-Marco Island, Punta Gorda, and
Sebring MSAs, because they are representative of labor market conditions in the Southwest Florida region. The
purpose of the analysis was to compare the total annual wage cost for a manufacturing company located in the
Southwest Florida region to the cost if it paid average annual US wages for the same occupational mix, keeping total
employment the same.
A review of the major occupational categories involved in Florida’s manufacturing sector statewide shows 57.8
percent of all production workers in Florida are employed in the manufacturing sector, followed by 23.3 percent
of all architects and engineers. As such, these are two of the most significant categories for evaluating manufacturing
occupation wages in the Southwest Florida region. As shown by the following table on manufacturing employment and
wage levels in 2015, someone in either of these two occupations in the Southwest Florida region makes less than the
average person in that occupation statewide or nationally, with architects and engineers earning almost one-quarter less
annually than their peers in the same profession across the United States and production workers earning more than 10 percent less. These lower wages mean the Southwest Florida region has a competitive advantage nationally in
terms of labor costs in all manufacturing occupations apart from sales, where wages in that occupation (not only
in manufacturing sectors) are roughly the same.

IHS ECONOMICS | Southwest Regional Manufacturers Association | Manufacturing Sector Profile
© 2016 IHS 23 August 2016
Additional analysis showed the total annual wage costs for all manufacturing sectors in the Southwest Florida
region range between 10.4 percent and 23.0 percent lower than the annual manufacturing industry wage bill in
the United States, with the difference varying by manufacturing subsector, location within the Southwest Florida
region, and occupation type. For example, while architects and engineers in manufacturing occupations in the Cape
Coral-Fort Myers MSA earn just more than one-quarter less than their national counterparts, production workers in
manufacturing sectors in the Naples-Immokalee-Marco Island MSA earn only 8.9 percent less in wages annually than
those in the same occupations nationally. Meanwhile, in just the Naples-Immokalee-Marco Island MSA, the total wage
bill for transportation equipment manufacturing (NAICS 336900) is only 8.7 percent below the wage bill for that sector
nationally, whereas total labor costs for basic chemical manufacturers (NAICS 325100) are more than 19.0 percent
below their national levels for this sector.
If increasing per capita incomes is an objective, one implication of these findings is that the region should
encourage growth in manufacturing subsectors and occupations that either pay higher wages or at least offer
local salaries that are closer to the national levels. However, if the desired goal is increasing the number of
manufacturing jobs in the region, attracting manufacturing employers whose national competitive advantage is
derived from being a low-cost producer may be an effective strategy.
Transferability of the Southwest Florida labor force’s core competencies
Understanding the core competencies of a region’s labor force, and the transferability of these competencies between
industries, is an important aspect of any workforce development policy that aims to fill skill gaps and guide a region to
become a high-skill, high-wage economy. Measures of the knowledge, skills, and abilities (KSA) as well as educational
attainment can be used to estimate the core competencies of a region’s labor force, as well as to evaluate the fit of a
region’s core competencies in relation to a particular industry’s skill requirements.
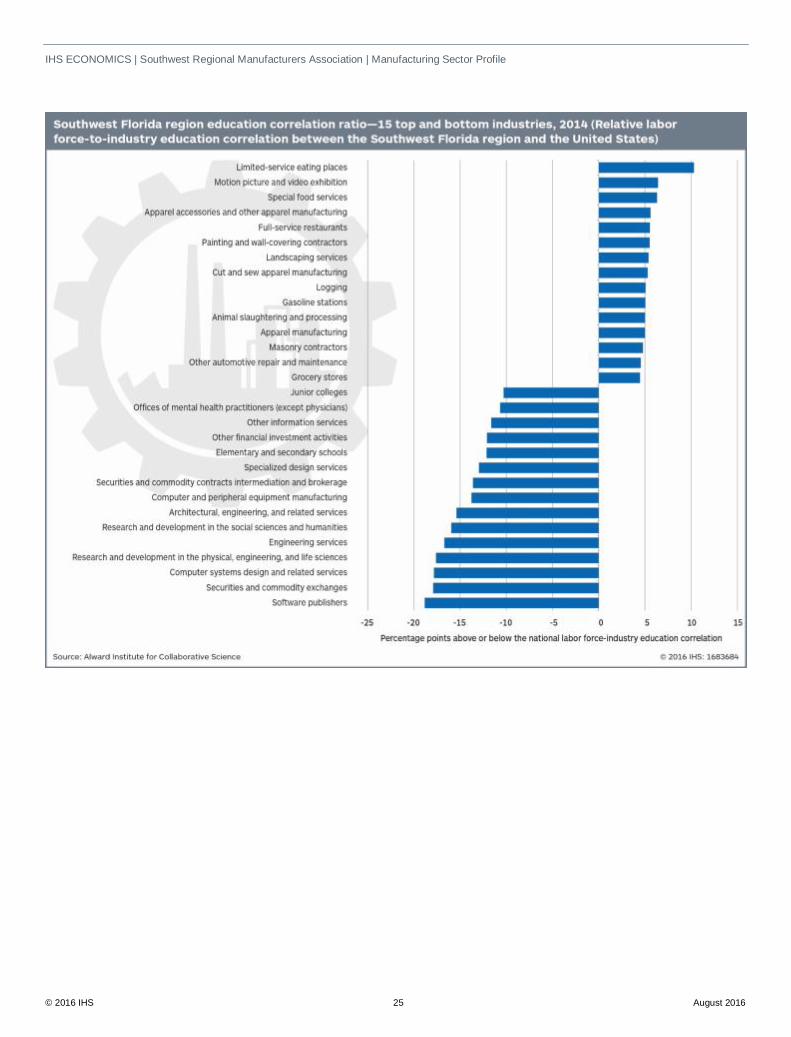
For example, the accompanying chart illustrates a relative correlation index between the education competencies
demanded by a selected set of industries and the education competencies supplied by the labor force in the Southwest
Florida region (defined as Charlotte, Collier, DeSoto, Glades, Hardee, Hendry, Highlands, and Lee counties). The
comparison is made between the core competencies supplied by the labor force in Southwest Florida and the core
competencies supplied by the US labor force more generally. Industries with a positive correlation index represent

IHS ECONOMICS | Southwest Regional Manufacturers Association | Manufacturing Sector Profile
© 2016 IHS 24 August 2016
sectors for which the regional labor force is better suited to meet the industry’s education requirement relative to the
national labor force. Industries with a negative correlation index represent sectors for which the regional labor force is
less well-suited to meet the industry’s education requirements relative to the national labor force. Likewise, industries
with a correlation index near zero are sectors for which the regional labor force is equally well-suited to meet the
industry’s education requirement relative to the national labor force. Thus, the full set of industry–labor force
correlation indices (available upon request) can be used as a tool within the context of a larger industry/workforce
development strategy to better understand the transferability of a region’s core competencies between a variety of
prospective industries.
For the top set of industries given in the chart (sectors with the most positive correlation index), economic development
planning may be relatively straightforward because the labor force already has the education required to fill jobs in
those sectors. On the other hand, for the bottom set of industries in the chart (sectors with the most negative correlation
index), workforce training, relocation incentives, or targeted educational programming may be required before the
region’s labor force becomes competitive. (See Appendix B for more examples of practical applications of the
knowledge, skills, and abilities analysis.)
According to the correlation indices in the top half of the chart on the following page, the Southwest Florida labor
force is well-suited to fill jobs in industries that support the needs of retirees, government agencies, and military
bases, such as those types of occupations required by restaurants, hotels, and construction firms. With respect to
manufacturing occupations, the local labor force also appears well-suited to meet the educational requirements
of a variety of types of apparel manufacturers. Since firms within the Southwest Florida region have tended to
concentrate in these industries over time, it is not surprising the region’s labor force has also concentrated around the
core competencies required by these industries. On the other hand, the bottom half of this chart shows the Southwest
Florida labor force is less well-suited to fill jobs in high tech, research and development, and professional service
industries, including software publishing, computer equipment manufacturing, financial investment activities,
architecture, engineering, and other specialized design or research and development services. These are
underrepresented industries that do not constitute a significant share of this region’s current industry mix. While not
shown in the chart, there may still be other manufacturing industries for which the local labor force is at least as
well-equipped, if not better equipped, than the national labor force to fulfill industry job requirements (e.g.,
kitchen cabinet and countertop manufacturing, sawmills, footwear manufacturing, food manufacturing,
furniture manufacturing, etc.). It is within these manufacturing sectors the region may find feasible
opportunities for workforce development to contribute to manufacturing industry development.
For example, economic and workforce development practitioners in the Southwest Florida region might explore
how commodity demand from the region’s food service industry or commodity supply from the region’s
agriculture industry might be parlayed into manufacturing sector opportunities, e.g., contribute to the growth
of food and beverage manufacturing.
IHS ECONOMICS | Southwest Regional Manufacturers Association | Manufacturing Sector Profile
© 2016 IHS 25 August 2016
IHS ECONOMICS | Southwest Regional Manufacturers Association | Manufacturing Sector Profile
© 2016 IHS 26 August 2016
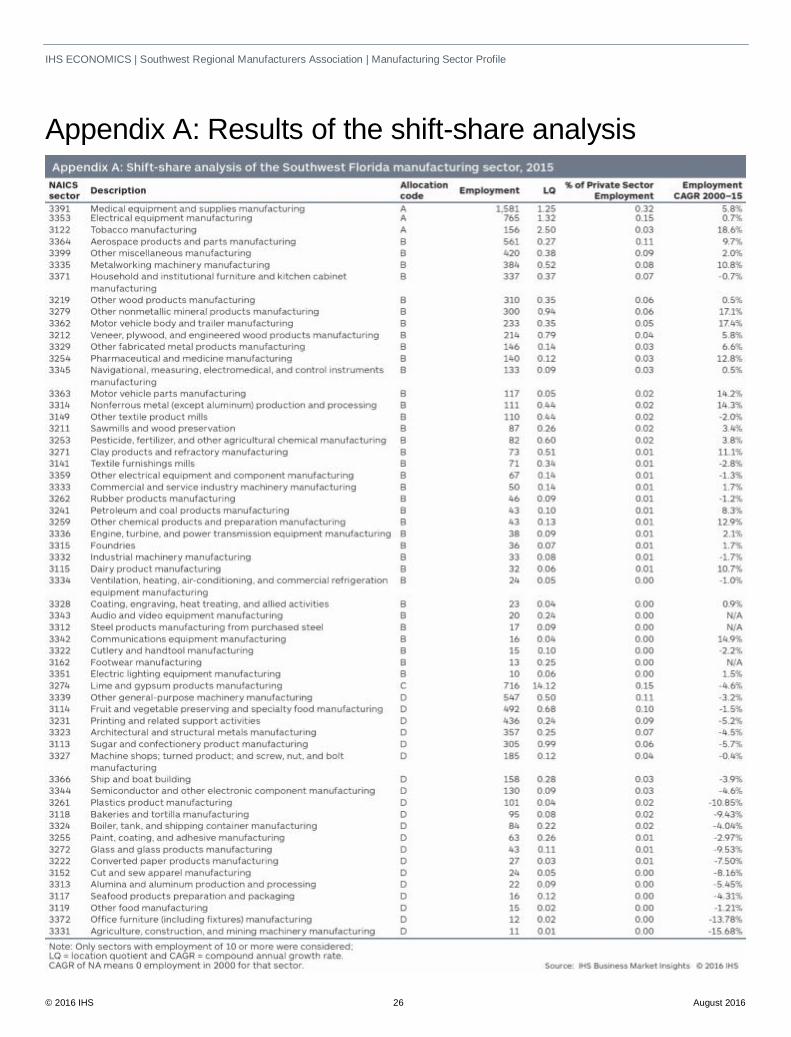
Appendix A: Results of the shift-share analysis

IHS ECONOMICS | Southwest Regional Manufacturers Association | Manufacturing Sector Profile
© 2016 IHS 27 August 2016
Appendix B: Knowledge, skills, and abilities (KSA) analysis methodology and applications
To facilitate industry-labor force matching, researchers at the Alward Institute for Collaborative Science have mapped
occupations from IMPLAN’s industry employment onto BLS occupational categories and O*NET’s determined sets of
KSAs. In addition, they have also linked occupations to their necessary formal education and informal on-the-job
training and work experience needed to acquire these KSAs. From here, the Alward Institute has developed data
models that can:
• estimate the core competencies for the total array of occupations employed in a region and
• link these core competencies to region-specific levels of employment and wages.
For example, if there are 1,000 jobs in a region, then there will be 1,000 occupational equivalents each for knowledge,
skills, and abilities with associated average wage and employment levels. The weighted average of the KSA
occupational equivalents make up a region’s core competencies. These occupational equivalents and associated core
competencies vary based on the region’s history and industrial mix.
As an example of how KSA analysis can be applied: if a county government is looking to attract a new wind turbine
manufacturing plant to the area, it might be beneficial not only to estimate the impact of that plant on the local
economy, but also to understand the types of jobs and competencies that will be required to run the plant. This type of
analysis can be accomplished by bridging between a sector’s occupational staffing pattern and regional measures of
knowledge, skills, and abilities to illuminate the set of core competencies likely to be required by a given industry.
Alternatively, a correlation analysis can be used to identify which industries best fit the existing core competencies
within a regional labor market. If significant skill gaps are identified, the local government can then be proactive in
establishing workforce training and education. This type of analysis is crucial not only in helping economic developers
target a range of industries, but also in helping workforce developers identify training and educational programming
that can help fill skill gaps in the labor force. Such informed public policy can help guide an economy from a low-skill,
low-wage commodity-based economy to a high-skill, high-wage niche-based economy.

IHS Customer Care:
Americas: +1 800 IHS CARE (+1 800 447 2273)
Europe, Middle East, and Africa: +44 (0) 1344 328 300
Asia and the Pacific Rim: +604 291 3600
Related Documents