Geology Wellsite and Opérations Oxford Brookes University _ , Geology 6 Chapter 6 The Description of Samples and Shows Summary This section outlines a systematic approach to the descriptions of cuttings, sidewall core samples, core samples and associated hydrocarbon shows at the wellsite. Date: October 2001 6.1 Author Version: 2.01 Sample and Show Description TJH J

Welcome message from author
This document is posted to help you gain knowledge. Please leave a comment to let me know what you think about it! Share it to your friends and learn new things together.
Transcript
Geology Wellsite and Opérations Oxford Brookes University _ , Geology
6
Chapter 6
The Description of Samples and Shows
Summary
This section outlines a systematic approach to the descriptions of cuttings, sidewall core samples, core samples and associated hydrocarbon shows at the wellsite.
Date: October 2001 6.1 Author Version: 2.01 Sample and Show Description TJH
J
Geology Wellsite and Opérations Oxford Brookes University _ . r
Geology
6.0 Sample and Show Description
One of the most important rôles of the wellsite geologist is the physical description of cuttings, cores and sidewall cores plus an évaluation of any associated shows. The description of rocks and rock types is something that ail geologists are trained to do and should be second nature.
However, describing a pièce of rock, whether it be a cutting, core chip or whatever can be very subjective. The emphasis of this section is to promote a systematic and methodical approach to descriptions that will minimise the potential variations caused by subjectivity. The guidelines presented throughout this section are there for you to follow.
This section provides: •
• The correct equipment required for proper description of samples • An overview of sampling and processing that will be st ensure the most représentative
• Brief guidelines for the systematic description and testing of samples of various rock types:
* clastics * carbonates * evaporites * organic material
• The description and analysis of shows • Spécial requirements for cores and sidewall cores
The wellsite geologist must always strive to make the best possible description and évaluation of both samples and shows.
Date: October 2001 6.2 Author Version: 2.01 Sample and Show Description TJH
Geology Oxford Brookes University
Wellsite and Opérations Geology
6.1 Equipment for Sample Description
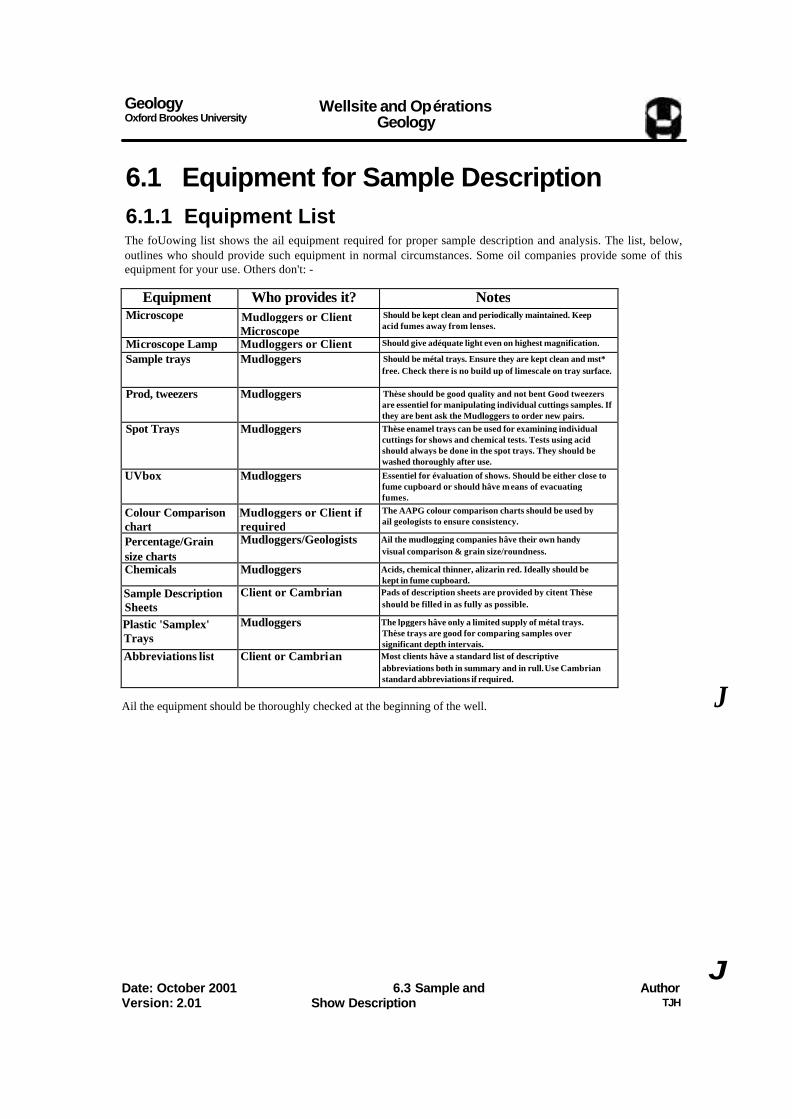
6.1.1 Equipment List The foUowing list shows the ail equipment required for proper sample description and analysis. The list, below, outlines who should provide such equipment in normal circumstances. Some oil companies provide some of this equipment for your use. Others don't: -
Equipment Who provides it? Notes Microscope Mudloggers or Client
Microscope Should be kept clean and periodically maintained. Keep acid fumes away from lenses.
Microscope Lamp Mudloggers or Client Should give adéquate light even on highest magnification. Sample trays Mudloggers Should be métal trays. Ensure they are kept clean and mst*
free. Check there is no build up of limescale on tray surface.
Prod, tweezers Mudloggers Thèse should be good quality and not bent Good tweezers are essentiel for manipulating individual cuttings samples. If they are bent ask the Mudloggers to order new pairs.
Spot Trays Mudloggers Thèse enamel trays can be used for examining individual cuttings for shows and chemical tests. Tests using acid should always be done in the spot trays. They should be washed thoroughly after use.
UVbox Mudloggers Essentiel for évaluation of shows. Should be either close to fume cupboard or should hâve means of evacuating fumes.
Colour Comparison chart
Mudloggers or Client if required
The AAPG colour comparison charts should be used by ail geologists to ensure consistency.
Percentage/Grain size charts
Mudloggers/Geologists Ail the mudlogging companies hâve their own handy visual comparison & grain size/roundness.
Chemicals Mudloggers Acids, chemical thinner, alizarin red. Ideally should be kept in fume cupboard.
Sample Description Sheets
Client or Cambrian Pads of description sheets are provided by citent Thèse should be filled in as fully as possible.
Plastic 'Samplex' Trays
Mudloggers The lpggers hâve only a limited supply of métal trays. Thèse trays are good for comparing samples over significant depth intervais.
Abbreviations list Client or Cambrian Most clients hâve a standard list of descriptive abbreviations both in summary and in rull. Use Cambrian standard abbreviations if required.
Ail the equipment should be thoroughly checked at the beginning of the well. J
Date: October 2001 Version: 2.01
6.3 Sample and Show Description
Author TJH
J
Geology Oxford Brookes University
Wellsite and Opérations Geology
6.1.2 Equipment and Location
Location The descriptive equipment is noimally ail located in the mudlogging unit. The wellsite geologist should be assigned a client area that should be sufGciently large to cany out the descriptive tasks in comforL Proper seating should be provided and the area should be well lit
If any of the equipment are broken or damaged then they should be replaced as soon as possible.
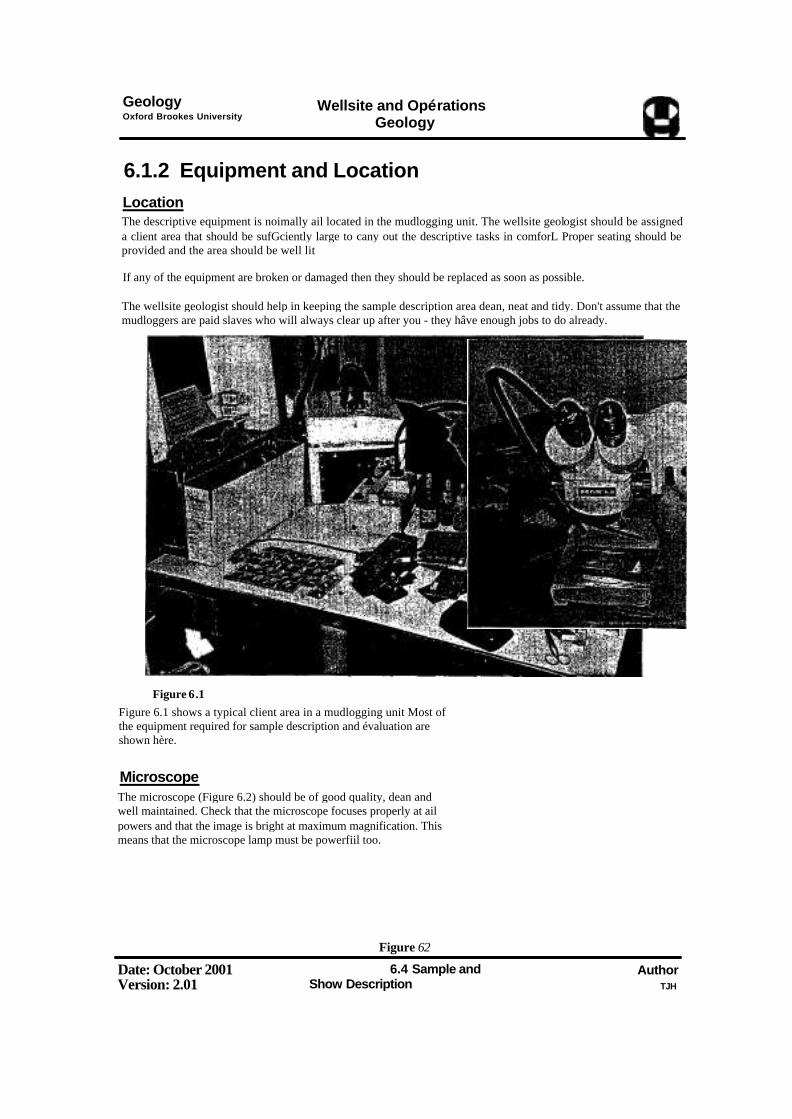
The wellsite geologist should help in keeping the sample description area dean, neat and tidy. Don't assume that the mudloggers are paid slaves who will always clear up after you - they hâve enough jobs to do already.
Figure 6.1 Figure 6.1 shows a typical client area in a mudlogging unit Most of the equipment required for sample description and évaluation are shown hère.
Microscope The microscope (Figure 6.2) should be of good quality, dean and well maintained. Check that the microscope focuses properly at ail powers and that the image is bright at maximum magnification. This means that the microscope lamp must be powerfiil too.
Figure 62
Date: October 2001 Version: 2.01
6.4 Sample and Show Description
Author TJH
Geôlogy Oxford Brookes University
Wellsite and Opérations Geology
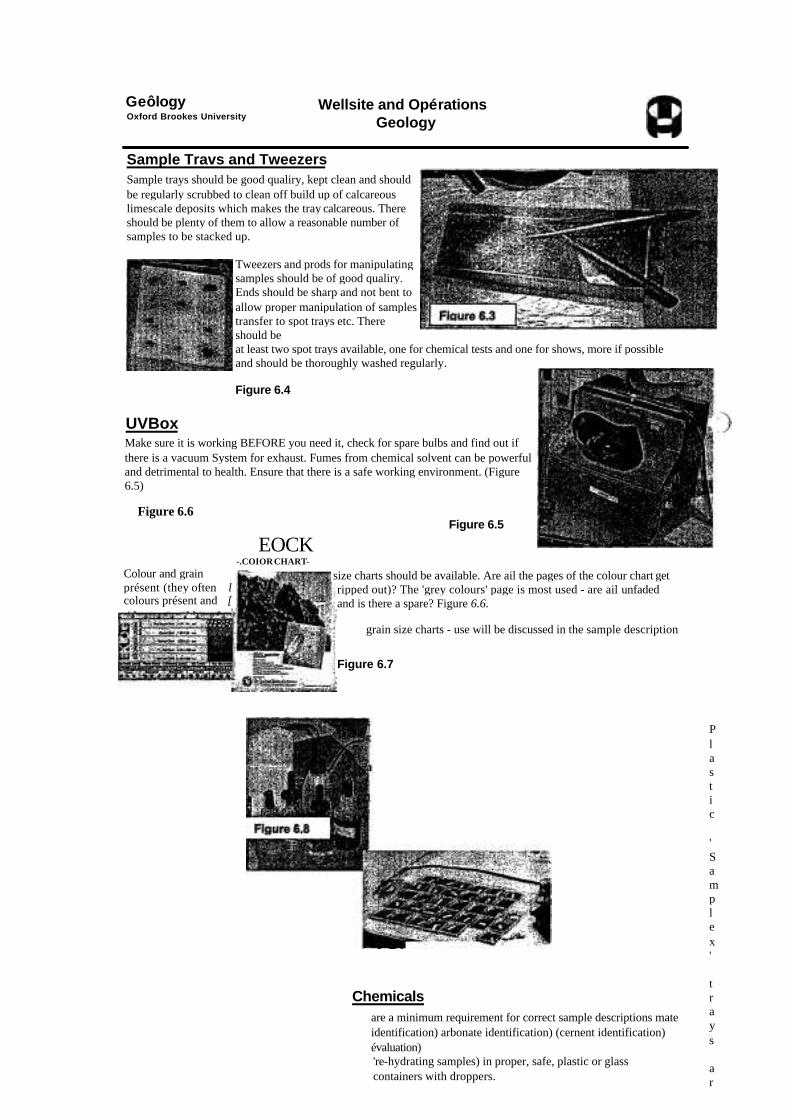
Sample Travs and Tweezers Sample trays should be good qualiry, kept clean and should be regularly scrubbed to clean off build up of calcareous limescale deposits which makes the tray calcareous. There should be plenty of them to allow a reasonable number of samples to be stacked up.
Tweezers and prods for manipulating samples should be of good qualiry. Ends should be sharp and not bent to allow proper manipulation of samples transfer to spot trays etc. There should be at least two spot trays available, one for chemical tests and one for shows, more if possible and should be thoroughly washed regularly.
Figure 6.4
UVBox Make sure it is working BEFORE you need it, check for spare bulbs and find out if there is a vacuum System for exhaust. Fumes from chemical solvent can be powerful and detrimental to health. Ensure that there is a safe working environment. (Figure 6.5)
Figure 6.6 Figure 6.5
EOCK -.COIOR CHART-
size charts should be available. Are ail the pages of the colour chart get ripped out)? The 'grey colours' page is most used - are ail unfaded and is there a spare? Figure 6.6.
grain size charts - use will be discussed in the sample description
Figure 6.7
Chemicals
are a minimum requirement for correct sample descriptions mate identification) arbonate identification) (cernent identification) évaluation) 're-hydrating samples) in proper, safe, plastic or glass containers with droppers.
Plastic 'Samplex' trays ar
Colour and grain présent (they often l colours présent and [

e good for keeping a evaluating subtle changes over large intervais, sample trays to be freed up. Figure 6.9 trays.
Figure 6.9
6.5 Sample and Show Description
J
J
Date: October 2001 Version: 2.01
Author TJH

Geology Oxford Brookes University
Wellsite and Opérations Geology
6.1.3 Wellsite Lithology Description Sheets
An example of a wellsite lithology description sheet is presented below in Figure 6.10. Ail the relevant sections need to be completed as it will provide one of the best databases of descriptions for the well and will ofien be looked at after the well or possibly distributed to partners.
Guidelines for Wellsite Lithologv Description sheet completion
• Do keep the sheets neat and tidy. Use pencil so mistakes can be rubbed out • Do write legibly. There's not much point doing the description if nobody else can read it • Do number each sheet and put the date on. This makes life much easier when the pages
need to be archived. • Do look at ail samples and, as a minimum, estimate the percentage lithologies and note
gases and ROPs. • If a sample is not caught, for whatever reason, then note on the description sheet why
and which samples are missing. For example lost circulation etc. • Do make comprehensive notes on the Description Sheets. Note any drilling problems or
events such as trips. • Make a spécial note of contaminants and note their rough percentage. Métal shavings,
for instance, are they increasing? • Do note any gas peaks on the sheets and note trip and connection gases if they occur.
The lithology description sheets are fairly generic. They can be modifîed if required. However, please use client sheets if they are provided using the guidelines as outlined above.
WELU MB
Dftti falvof Pmi 1
HnHon MchOw Cir
a •M gn M
} M su
t CtfU
Ut Dol C t f e fe i •h a
PMCliplHM
Figure 6.10
Date: October 2001 Version: 2.01
6.6 Sample and Show Description
Author T3H
Geology Wéllsite and Opérations Oxford Brookes Umversity _ . r
Geology
6.2 Représentative Samples
'Even the best sample descriptions are pointless if the samples are not représentative'
6.2.1 Overview
There are a number of ways in which the wéllsite geologist can ensure that the samples collected and which are described are représentative of the interval drilled.
• Check that the lag is correct. See Chapter 3 for instructions on checking the lag. • Occasionally check how the mudloggers or sample catchers are catching the samples • Continuously review sample processing to ensure accuracy and consistency. • Check that bags and dry samples are being fîlled and boxed correctly
The following subsections describe the steps to ensure the most représentative sample.
6.2.2 Types of Sample )
There are two main types of sample:
Interval for main! Sample Sample, which is représentative of an interval drilled, and which are caught routinely for the whole well. Sample intervais vary but generally:
• 10m or 30ft on tophole or intervais of lesser interest • 3m, lOft over intervais of interest, possible hydrocarbon sources and réservoir intervais • Smaller intervais may be required for spécial studies, e.g. high resolution palaeontology studies • Larger intervais can be caught on top-hole, e.g. 50 ft • Interval samples may be dispensed with over tophole intervais on production and platform wells.
Sampling programs are planned by the opérations geologist in coopération with license geologists and must fit in with corporate and governmental régulations. Most governments will require that samples are caught on ail exploration and appraisal wells and that there is full well coverage. They will also regulate about sample intervais.
In nearly ail cases a number of samples from each interval are taken in bags, tins etc for shipping from the wéllsite. Thèse samples will be split and sent to the operator, partners and government for future analysis. Samples are also ; ) brought to the mudlogging unit in the sieves for processing; see section 6.2.9, and description.
Snot Sample Spot samples are taken at the request of the wéllsite geologist, drilling supervisor or engineer or, in rare cases, on the mudlogger's own initiative. As interval samples are taken relatively infrequently it is sometimes bénéficiai to look at samples from a spécifie lagged depth - representing a very short interval. The sample is taken directly from the shaker screens and processed through the sieves for description purposes only. No bagged or tinned samples are taken. Examples when spot samples might be taken:
• Bottoms up from positive or négative drilling breaks • To identify reasons for gas peaks • When looking for core, casing points or total depth • Commonly while coring
Spot samples are a very useful tool for spécifie lithology identification. Spot samples should not be taken too frequently as the mudloggers complain about the workload, and should not interfère with interval sample collection.
Date: October 2001 6.7 Atithor Version: 2.01 Sample and Show Description TJH
Geology Oxford Brookes University
Wellsite and Opérations Geology
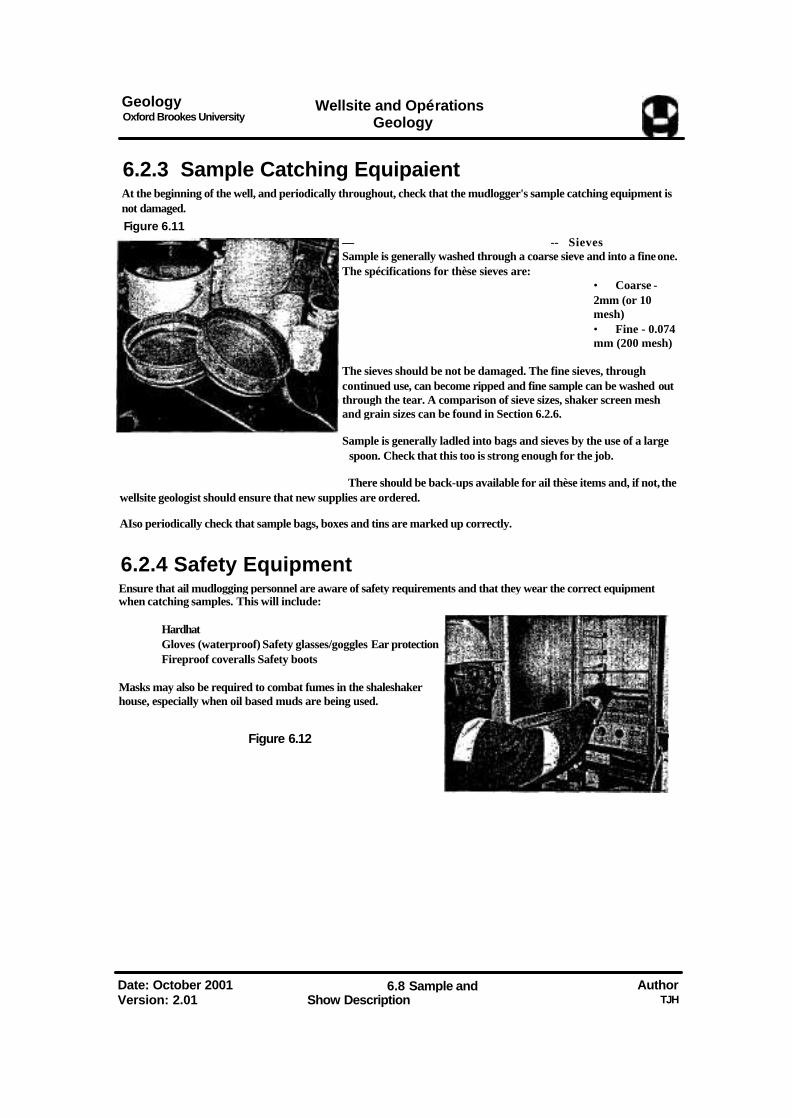
6.2.3 Sample Catching Equipaient At the beginning of the well, and periodically throughout, check that the mudlogger's sample catching equipment is not damaged. Figure 6.11
— -- Sieves Sample is generally washed through a coarse sieve and into a fine one. The spécifications for thèse sieves are:
• Coarse - 2mm (or 10 mesh) • Fine - 0.074 mm (200 mesh)
The sieves should be not be damaged. The fine sieves, through continued use, can become ripped and fine sample can be washed out through the tear. A comparison of sieve sizes, shaker screen mesh and grain sizes can be found in Section 6.2.6.
Sample is generally ladled into bags and sieves by the use of a large spoon. Check that this too is strong enough for the job.
There should be back-ups available for ail thèse items and, if not, the wellsite geologist should ensure that new supplies are ordered.
AIso periodically check that sample bags, boxes and tins are marked up correctly.
6.2.4 Safety Equipment
Ensure that ail mudlogging personnel are aware of safety requirements and that they wear the correct equipment when catching samples. This will include:
Hardhat Gloves (waterproof) Safety glasses/goggles Ear protection Fireproof coveralls Safety boots
Masks may also be required to combat fumes in the shaleshaker house, especially when oil based muds are being used.
Figure 6.12
Date: October 2001 Version: 2.01
6.8 Sample and Show Description
Author TJH
Geology Oxford Brookes University
Wellsite and Opérations Geology
6.2.5 The Shaleshaker
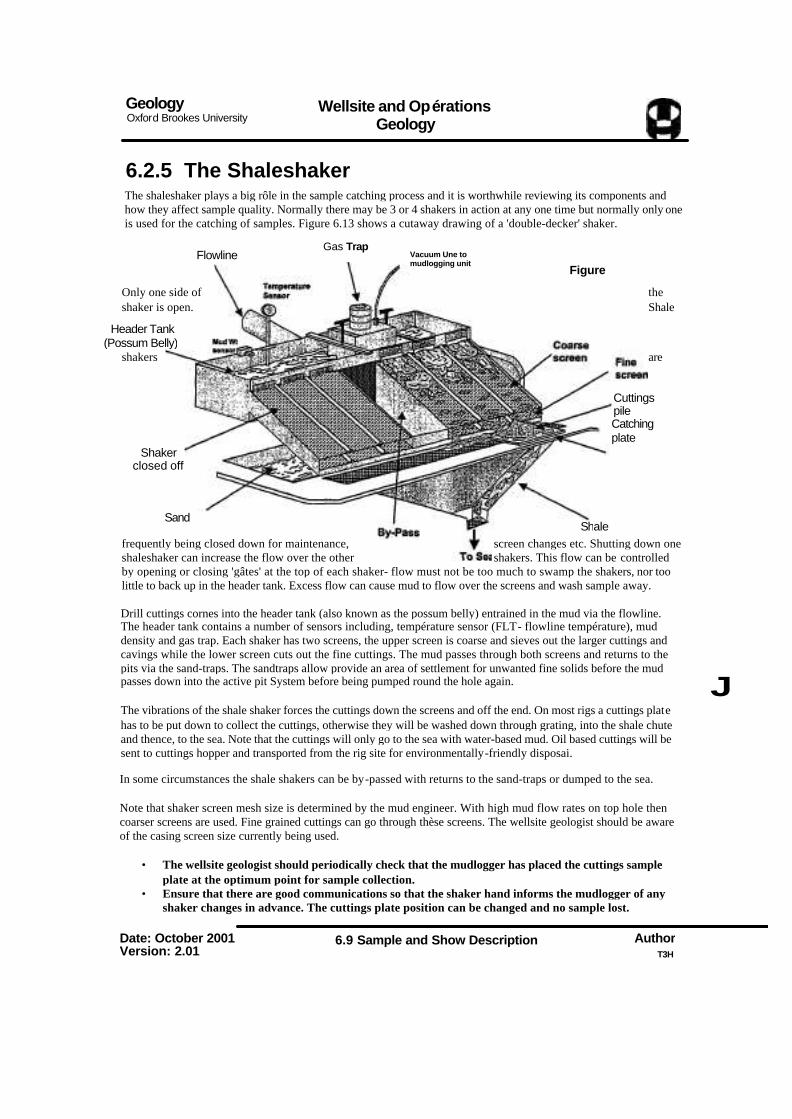
The shaleshaker plays a big rôle in the sample catching process and it is worthwhile reviewing its components and how they affect sample quality. Normally there may be 3 or 4 shakers in action at any one time but normally only one is used for the catching of samples. Figure 6.13 shows a cutaway drawing of a 'double-decker' shaker.
Flowline Gas Trap
Vacuum Une to mudlogging unit
Only one side of the shaker is open. Shale
shakers are
frequently being closed down for maintenance, screen changes etc. Shutting down one shaleshaker can increase the flow over the other shakers. This flow can be controlled by opening or closing 'gâtes' at the top of each shaker- flow must not be too much to swamp the shakers, nor too little to back up in the header tank. Excess flow can cause mud to flow over the screens and wash sample away.
Drill cuttings cornes into the header tank (also known as the possum belly) entrained in the mud via the flowline. The header tank contains a number of sensors including, température sensor (FLT- flowline température), mud density and gas trap. Each shaker has two screens, the upper screen is coarse and sieves out the larger cuttings and cavings while the lower screen cuts out the fine cuttings. The mud passes through both screens and returns to the pits via the sand-traps. The sandtraps allow provide an area of settlement for unwanted fine solids before the mud passes down into the active pit System before being pumped round the hole again.
The vibrations of the shale shaker forces the cuttings down the screens and off the end. On most rigs a cuttings plate has to be put down to collect the cuttings, otherwise they will be washed down through grating, into the shale chute and thence, to the sea. Note that the cuttings will only go to the sea with water-based mud. Oil based cuttings will be sent to cuttings hopper and transported from the rig site for environmentally-friendly disposai.
In some circumstances the shale shakers can be by-passed with returns to the sand-traps or dumped to the sea.
Note that shaker screen mesh size is determined by the mud engineer. With high mud flow rates on top hole then coarser screens are used. Fine grained cuttings can go through thèse screens. The wellsite geologist should be aware of the casing screen size currently being used.
• The wellsite geologist should periodically check that the mudlogger has placed the cuttings sample plate at the optimum point for sample collection.
• Ensure that there are good communications so that the shaker hand informs the mudlogger of any shaker changes in advance. The cuttings plate position can be changed and no sample lost.
6.9 Sample and Show Description
J
Figure 6.13
Header Tank (Possum Belly)
Cuttings pile Catching plate
Shaker closed off
Sand Traps Shale
chute
Date: October 2001 Version: 2.01
Author T3H
Geology Oxford Brookes Universrty
Wellsite and Opérations Geology
6.2.6 Sïeves, Shaker Screens and Sampie Grain Sîze
Standard US Slave Mesh
Slzes
4—
10-
20—
Largorthe 30— rnosh SIXB
theflMr 40 ----- tho Mlv« 50—
60- 80----
120-
Wentworth Size Class
BOULDER
COBBLE
PEBBLE
GRANULE
S AND
VC
Size mm
Standard Shaleshaker Mesh Slzes
-10x10 "12x12 -14x14 -16x16 -18x18 - 20x20 nwshslze -8x20 theflnerthe
-30x40.40x36,40x40 -50x40 -50x50 -60x60 -60x40 -70x30.80x80 -100x100
-200x200
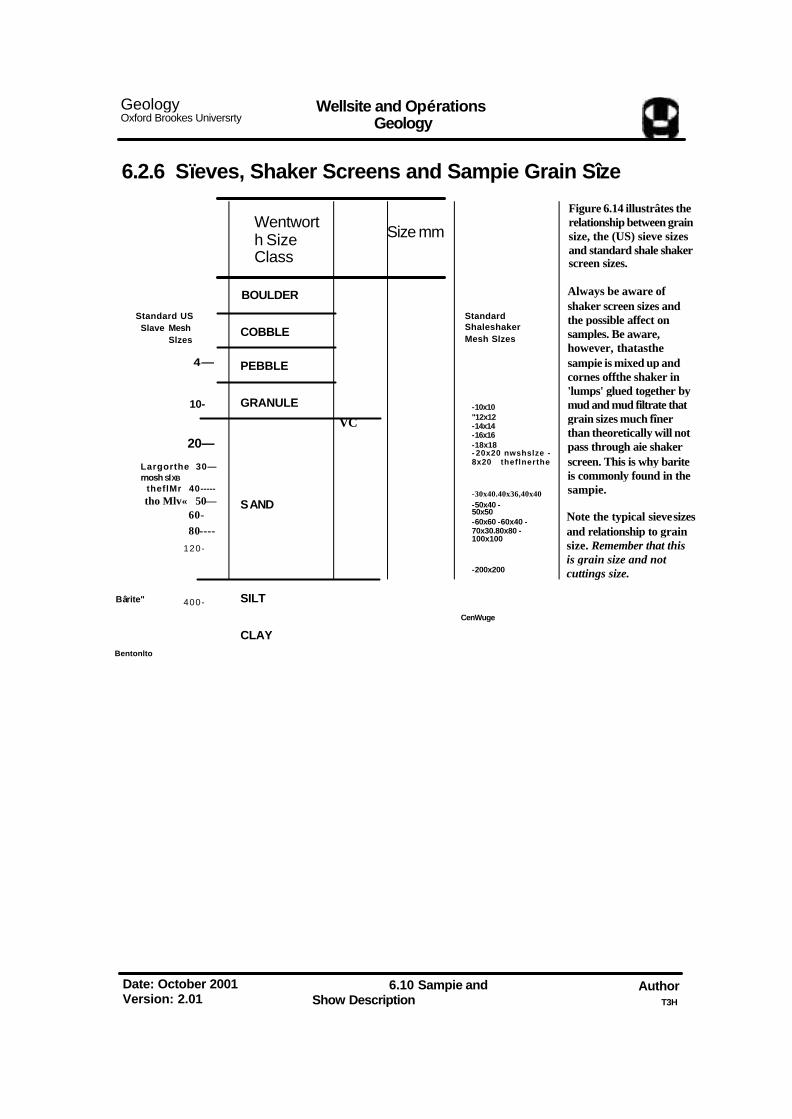
Figure 6.14 illustrâtes the relationship between grain size, the (US) sieve sizes and standard shale shaker screen sizes.
Always be aware of shaker screen sizes and the possible affect on samples. Be aware, however, thatasthe sampie is mixed up and cornes offthe shaker in 'lumps' glued together by mud and mud filtrate that grain sizes much fîner than theoretically will not pass through aie shaker screen. This is why barite is commonly found in the sampie.
Note the typical sieve sizes and relationship to grain size. Remember that this is grain size and not cuttings size.
Bârite" 400- SILT CenWuge
CLAY Bentonlto
Date: October 2001 Version: 2.01
6.10 Sampie and Show Description
Author T3H
Geology Oxford Brookes University
Wellsîte and Opérations Geology
6.2.7 Interval Sample Catching Quality
Assuming that that lag has been checked regularly by carbide bomb or similar metbod the next step in ensuring a représentative sample is to make sure that the sample is caught correctiy by the mudioggers. It is a wise précaution to explain to each mudlogger exactly bow you want the samples caught. But what is the right way?
First, let us review how an interval __________________________________________________
surface and highlight some of the ways in which a sample can be caught badly.
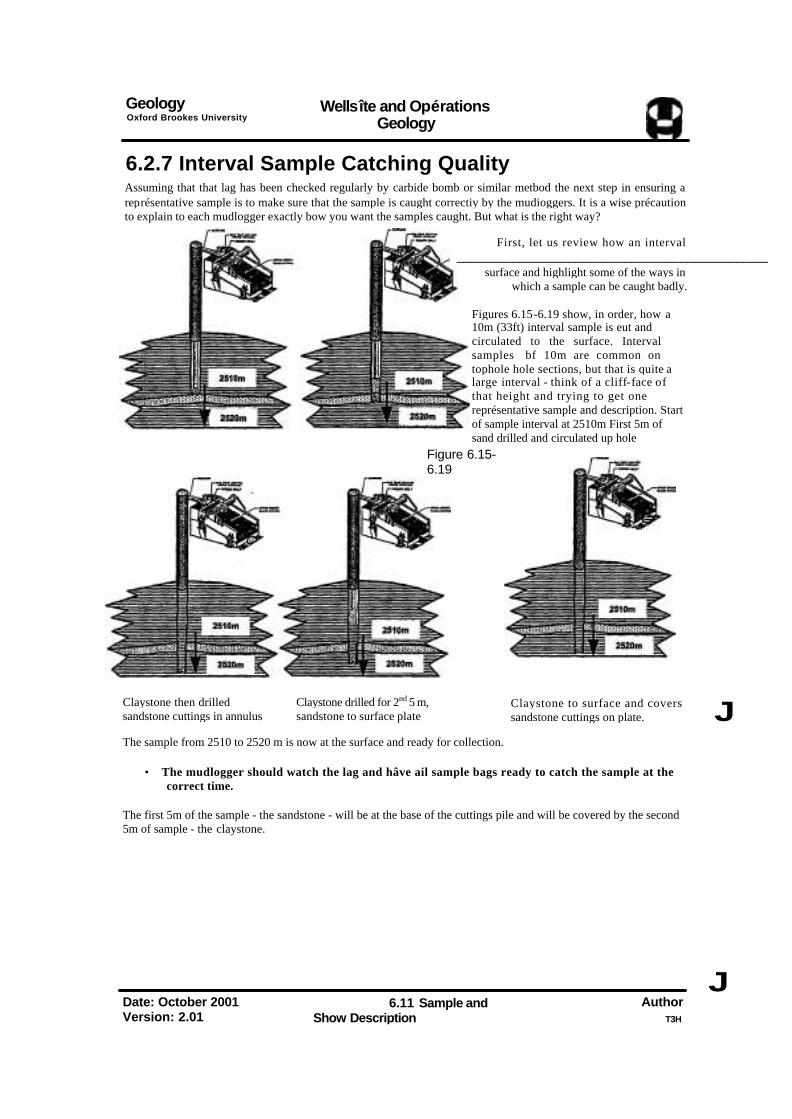
Figures 6.15-6.19 show, in order, how a 10m (33ft) interval sample is eut and circulated to the surface. Interval samples bf 10m are common on tophole hole sections, but that is quite a large interval - think of a cliff-face of that height and trying to get one représentative sample and description. Start of sample interval at 2510m First 5m of sand drilled and circulated up hole
Figure 6.15-6.19
Claystone then drilled sandstone cuttings in annulus
Claystone drilled for 2nd 5 m, sandstone to surface plate
Claystone to surface and covers sandstone cuttings on plate. J
The sample from 2510 to 2520 m is now at the surface and ready for collection.
• The mudlogger should watch the lag and hâve ail sample bags ready to catch the sample at the correct time.
The first 5m of the sample - the sandstone - will be at the base of the cuttings pile and will be covered by the second 5m of sample - the claystone.
J Date: October 2001 Version: 2.01
6.11 Sample and Show Description
Author T3H
Geology Oxford Brookes University
Wellsite and Opérations Geology
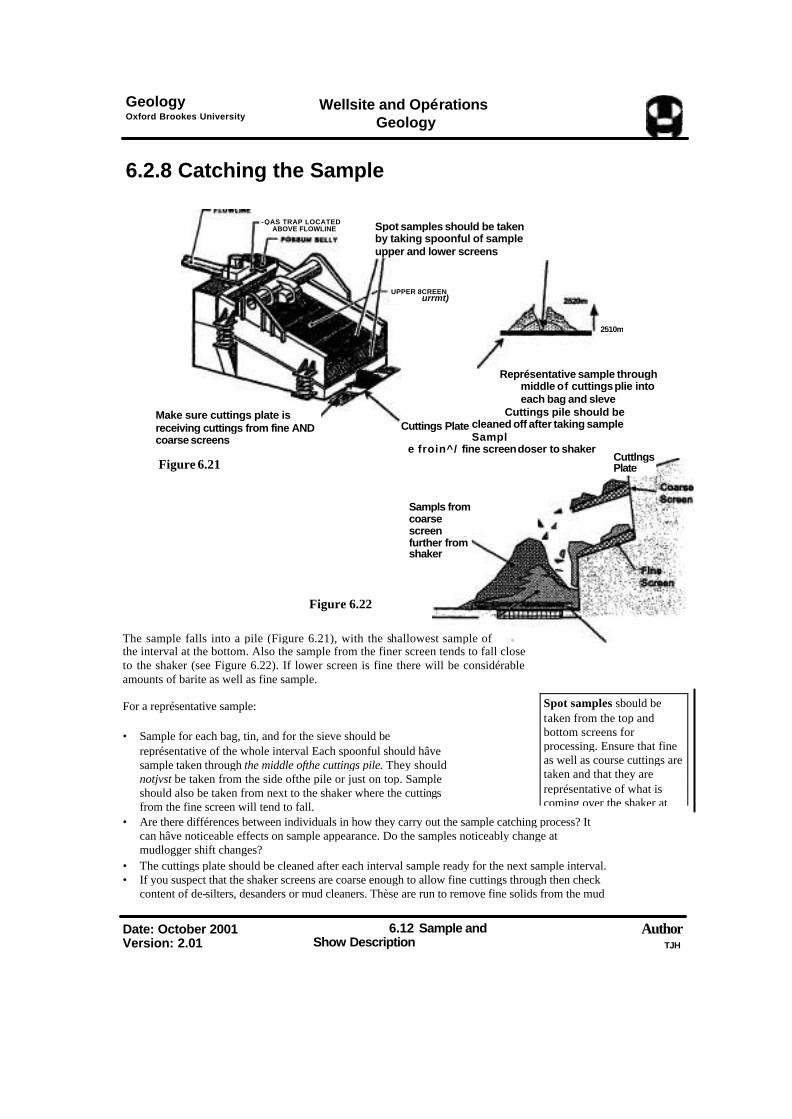
6.2.8 Catching the Sample
Make sure cuttings plate is receiving cuttings from fine AND coarse screens
Figure 6.21
Figure 6.22
Représentative sample through middle of cuttings plie into each bag and sleve
Cuttings pile should be cleaned off after taking sample Sampl
e froin^/ fine screen doser to shaker
The sample falls into a pile (Figure 6.21), with the shallowest sample of the interval at the bottom. Also the sample from the finer screen tends to fall close to the shaker (see Figure 6.22). If lower screen is fine there will be considérable amounts of barite as well as fine sample.
For a représentative sample:
• Sample for each bag, tin, and for the sieve should be représentative of the whole interval Each spoonful should hâve sample taken through the middle ofthe cuttings pile. They should notjvst be taken from the side ofthe pile or just on top. Sample should also be taken from next to the shaker where the cuttings from the fine screen will tend to fall.
• Are there différences between individuals in how they carry out the sample catching process? It can hâve noticeable effects on sample appearance. Do the samples noticeably change at mudlogger shift changes?
• The cuttings plate should be cleaned after each interval sample ready for the next sample interval. • If you suspect that the shaker screens are coarse enough to allow fine cuttings through then check
content of de-silters, desanders or mud cleaners. Thèse are run to remove fine solids from the mud
Date: October 2001 Version: 2.01
6.12 Sample and Show Description
Author TJH
-QAS TRAP LOCATED ABOVE FLOWLINE Spot samples should be taken
by taking spoonful of sample upper and lower screens
UPPER 8CREEN urrmt)
Cuttings Plate
2510m
Sampls from coarse screen further from shaker
Cuttlngs Plate
Spot samples sbould be taken from the top and bottom screens for processing. Ensure that fine as well as course cuttings are taken and that they are représentative of what is coming over the shaker at

Geology Wellsite and Opérations Oxford Brookes University _ ,
Geology
system and fine sand may be apparent in samples taken from outflow which cannot be seen in shaker derived samples. However, barite will heavily contaminate thèse samples. • Is the lag correct? Do samples tie in with drilling breaks or LWD responses? A lag check should be performed at least once a day.
The wellsite geologist should regularly check how the mudloggers or sample catchers are catohing the samples to ensure consistency. Is the sample représentative?
Date: October 2001 6.13 Author Version: 2.01 Sample and Show Description TJH
Geology Oxford Brookes University
Wellsite and Opérations Geology
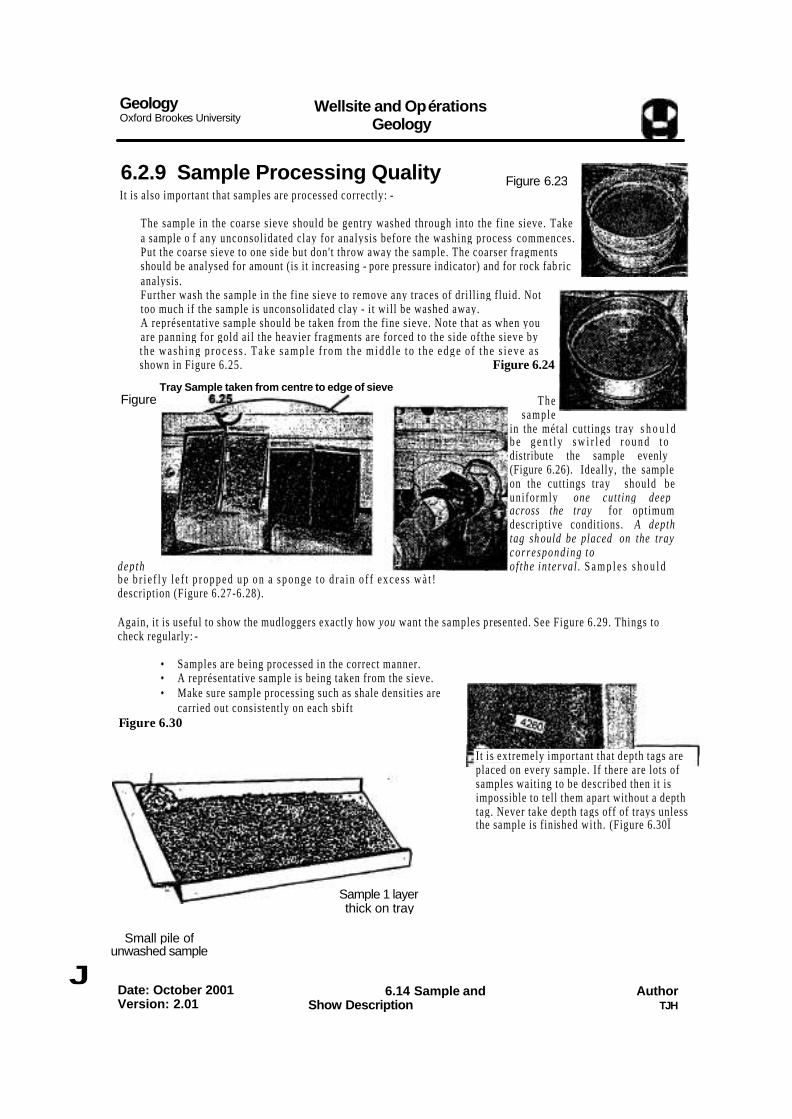
6.2.9 Sample Processing Quality
It is also important that samples are processed correctly: -
The sample in the coarse sieve should be gentry washed through into the fine sieve. Take a sample o f any unconsolidated clay for analysis before the washing process commences. Put the coarse sieve to one side but don't throw away the sample. The coarser fragments should be analysed for amount (is it increasing - pore pressure indicator) and for rock fab ric analysis. Further wash the sample in the fine sieve to remove any traces of dri l l ing fluid. Not too much if the sample is unconsolidated clay - i t will be washed away. A représentative sample should be taken from the fine sieve. Note that as when you are panning for gold ai l the heavier fragments are forced to the side ofthe sieve by t h e w a s h i n g p r o c e s s . T a k e s a m p l e f r o m t h e m i d d l e t o t h e e d g e o f t h e s i e v e a s shown in Figure 6.25. Figure 6.24
Tray Sample taken from centre to edge of sieve The
sample in the métal cutt ings tray s h o u l d b e g e n t l y s w i r l e d r o u n d t o distribute the sample evenly (Figure 6.26). Ideally, the sample on the cuttings tray should be uniformly one cutt ing deep across the tray for optimum descriptive conditions. A depth tag sh ould be placed on the tray corresponding to
dep th o f the in terva l . S a m p l e s s h o u l d b e b r i e f l y l e f t p r o p p e d u p o n a s p o n g e t o d r a i n o f f e x c e s s w à t ! description (Figure 6.27-6.28).
Again, it is useful to show the mudloggers exactly how you want the samples presented. See Figure 6.29. Things to check regularly: -
• Samples are being processed in the correct manner. • A représentative sample is being taken from the sieve. • Make sure sample processing such as shale densities are
carried out consistently on each sbift Figure 6.30
Small pile of unwashed sample
J Date: October 2001 Version: 2.01
6.14 Sample and Show Description
Author TJH
Figure 6.23
Figure
It is extremely important that depth tags are placed on every sample. If there are lots of samples waiting to be described then it is impossible to tell them apart without a depth tag. Never take depth tags off of trays unless the sample is finished with. (Figure 6.30Ï
Sample 1 layer thick on tray
Geology Oxford Brookes University
Wellsite and Opérations Geology
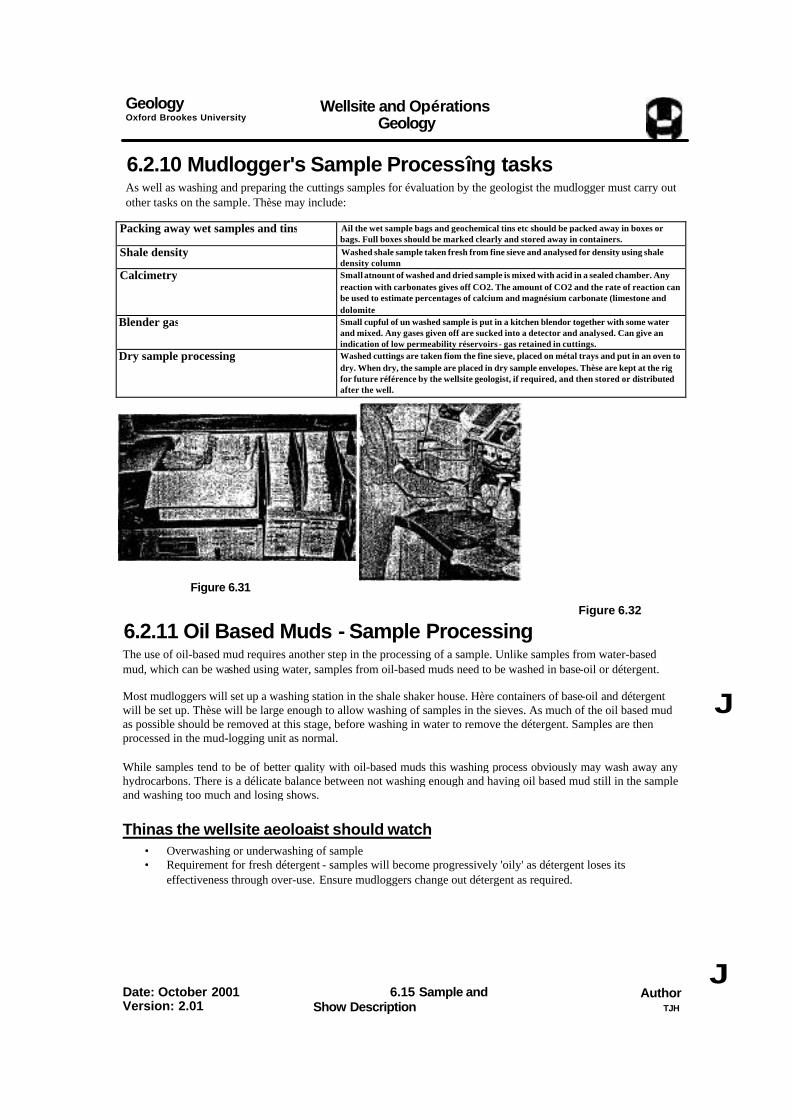
6.2.10 Mudlogger's Sample Processîng tasks
As well as washing and preparing the cuttings samples for évaluation by the geologist the mudlogger must carry out other tasks on the sample. Thèse may include:
Packing away wet samples and tins Ail the wet sample bags and geochemical tins etc should be packed away in boxes or bags. Full boxes should be marked clearly and stored away in containers.
Shale density Washed shale sample taken fresh from fine sieve and analysed for density using shale density column
Calcimetry Small atnount of washed and dried sample is mixed with acid in a sealed chamber. Any reaction with carbonates gives off CO2. The amount of CO2 and the rate of reaction can be used to estimate percentages of calcium and magnésium carbonate (limestone and dolomite
Blender gas Small cupful of un washed sample is put in a kitchen blendor together with some water and mixed. Any gases given off are sucked into a detector and analysed. Can give an indication of low permeability réservoirs - gas retained in cuttings.
Dry sample processing Washed cuttings are taken fiom the fine sieve, placed on métal trays and put in an oven to dry. When dry, the sample are placed in dry sample envelopes. Thèse are kept at the rig for future référence by the wellsite geologist, if required, and then stored or distributed after the well.
Figure 6.31
Figure 6.32
6.2.11 Oil Based Muds - Sample Processing
The use of oil-based mud requires another step in the processing of a sample. Unlike samples from water-based mud, which can be washed using water, samples from oil-based muds need to be washed in base-oil or détergent.
Most mudloggers will set up a washing station in the shale shaker house. Hère containers of base-oil and détergent will be set up. Thèse will be large enough to allow washing of samples in the sieves. As much of the oil based mud as possible should be removed at this stage, before washing in water to remove the détergent. Samples are then processed in the mud-logging unit as normal.
While samples tend to be of better quality with oil-based muds this washing process obviously may wash away any hydrocarbons. There is a délicate balance between not washing enough and having oil based mud still in the sample and washing too much and losing shows.
Thinas the wellsite aeoloaist should watch
• Overwashing or underwashing of sample • Requirement for fresh détergent - samples will become progressively 'oily' as détergent loses its
effectiveness through over-use. Ensure mudloggers change out détergent as required.
J
Date: October 2001 Version: 2.01
6.15 Sample and Show Description
Author TJH
J
Geology Oxford Brookes University
Wellsite and Opérations Geology
SAFETY
• Oil based mud can give off fumes when hot Make sure mudloggers wear appropriate safety equipment including breathing masks.
• Dry samples will give off fumes wbile being dried in sample oven. Ensure that fumes are exhausted from unit
• Make sure mudloggers keep unit clear of oil based mud. It is commonly dragged in on boots and coveralls and many mudlogging units set up 'clean zones' where personnel must remove boots or wear plastic overshoes.
6.2.12 Other useful tips
Unconsolidated, soft and sticky Formation
It is highly likely that soft clays will be easily washed away. Over zealous sample washing can completely wash away soft clays. Cet the Mudloggers to put a small pile of unwasbed sample on the tray in thèse circumstances (See Figure 6.29).
Washing consistency Ensure samples are washed to same amount and that drilling mud is washed away. This especially applies to oil and glycol based mud. Insufficient washing can cause grains to hâve a coating around, or stain on, the grain that makes analysis difficulL The colour is masked and it prevents the cutting reacting with acid properly.
Cavings Uthology évaluation
Always check the coarse sieve from time to tinte to check for cavings. Large cuttings found hère are also useful as they give better dues to rock fabric and allow you to make better descriptions. Provenance of large cuttings/cavings is, however, ofien questionable, so be careful with thèse.
Cavings monitoring Ensure amounts, type and size of cavings are monitored closely. When cavings are présent or suspected, this tact should be noted on the worksheet and may indicate an underlying formation pressureorboreho leinstabililyproblenLForexançle,drillmgmaliniestonesuccessicmwhilst experiencing cavings fromoveriyingshales,tbepercentages may be 90% shale, 10% limestone. Thèse would be recorded with die added note: 'shale ail cavings'
Sample backlogs Never let a backlog of samples accumulate, not only is it difficult to catch up but the Mudloggers get short of métal trays. Use Samplex trays (see below) to keep samples for review purposes if available. It is possible to eut the bottom off of polystyrène or cardboard cups to use as temporary storage after samples hâve been described. Always describe samples on the métal trays.
Keeping samples moist Cuttings samples are coDected wet fiom die shale shaker. Samples should be described whilststillwet and should not be left to dry out or re-hydrated with water. Put samples in plastic bags, or at least cover them up, if it is to be sometime before they are described. However, the texture of certain formation types can be seen more clearly when dry, so occasionally keep a portion of sample forlater.dry
Mud additives Get the Mudlogger to bave représentative samples ofall potentiel mud additives that may beusedintne well. If you think mère is contamination fiom drilling flirid additives then dwck with your référence set Remember, thèse may change somewhat after being subjected to the pressures and températures of circulation.
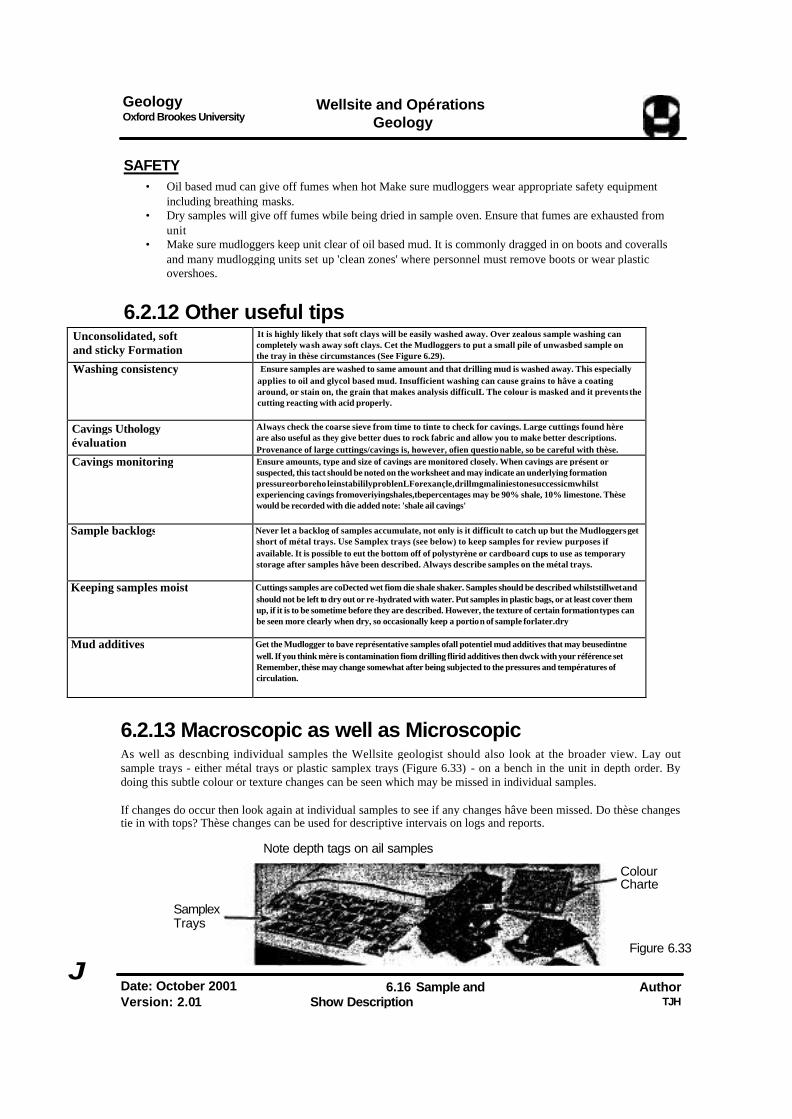
6.2.13 Macroscopic as well as Microscopic
As well as descnbing individual samples the Wellsite geologist should also look at the broader view. Lay out sample trays - either métal trays or plastic samplex trays (Figure 6.33) - on a bench in the unit in depth order. By doing this subtle colour or texture changes can be seen which may be missed in individual samples.
If changes do occur then look again at individual samples to see if any changes hâve been missed. Do thèse changes tie in with tops? Thèse changes can be used for descriptive intervais on logs and reports.
Note depth tags on ail samples
J Date: October 2001 Version: 2.01
6.16 Sample and Show Description
Figure 6.33
Author TJH
Colour Charte
Samplex Trays

Geology Wellsite and Opérations Oxford Brookes Universrty _ . Geology
6.2.14 Description Consistency
Discuss the samples with your opposite number and mudloggers during the shift-change handover. Discuss lithology types, colours, features etc. Ensure that there are smooth transitions between shifts and no major lithology changes at sbift changes (although it can happen)
Date: October 2001 6.17 Author Version: 2.01 Sample and Show Description TIH
J
Geology Oxford Brookes University
Wellsite and Opérations Geology
6.3 Systematic Sample Description
This section describes how samples should be described systematically. It is recommended that you establish a methodical routine to describe samples so that each is described consistently and to the same standard each time.
As a minimum please try to follow the checklists presented hère. They are meant to ensure that ail relevant aspects of the samples are described and help to assure quality.
6.3.1 Sample Description Overview
'Samples' include cuttings samples created from the action of the bit, core chip samples, sidewall core samples and, occasionally, samples taken from junk baskets, stock to drill collais and hole openers etc.
Ail samples should be examined for :-
• Lithology and accessory minerais, microfaunal content • Texture and fabric
• Porosity and permeability • Hydrocarbon type and content
Essentially, ail of thèse samples can be described in the same way although rock fabric and texture is more di£Scult in small cuttings. Whilst we advocate a systematic examination technique you should never limit your descriptions to those aspects described hère if you feel that there are other relevant aspects. Always note down any unusual features which may be useful for identification purposes later.
If there are micropalaeo or geochemical personnel making examinations of samples at the wellsite then make use of their résulte in your descriptions. Never ignore any source of information or data about the samples.
The fîrst part of this chapter deals with the description and testing of samples. The second part of the section is devoted to show évaluation and description.
The description of samples is split into four main catégories:*
• Gênerai descriptive séquence • Clastics • Carbonates • Evaporites
Figure 6.34
Date: October 2001 Version: 2.01
6.18 Sample and Show Description
Author T3H
Geology Oxford Brookes University
Wellsite and Opérations Geology
6.3.2 Gênerai Séquence of Description
The séquence of description of cuttings samples should follow the saine standard routine:-
1. Look al the sample tray without the microscope. Are the various lithotypes easily distinguishable? Ensure there is sufficient sample on the tray and that it is a maximum of one layer thick.
2. Put the sample tray in the UV box, is there any fluorescence? Is this natural minerai fluorescence or is there a possible show?
3. Put the sample tray under the microscope at low magnification and look round the tray. As the sample tray is p rocessed the various lithotypes are aggregated by the washing action.
4. A visual détermination of the relative percentages of the various lithologie components should be made and entered on the Wellsite Description Sheet Don't be afraid to go back and change thèse percentages when you hâve described the lithotypes as it is sometimes better to gauge percentages after the descriptions and the sample has dried a bit
5. Methodically describe the samples as per the guidelines laid out below.
6. Perform lithotype tests as required.
7. Check and describe shows as per guidelines later in this section.
8. FUI in as much information as possible on the Wellsite Description Sheet
9. Review percentages again.
10. Do samples fit in with changes in ROP or LWD curves?
11. See how sample fits in to overall séquence of samples.
6.3.3 Estîmating Percentages
This becomes easier with expérience. The main things to remember are: -
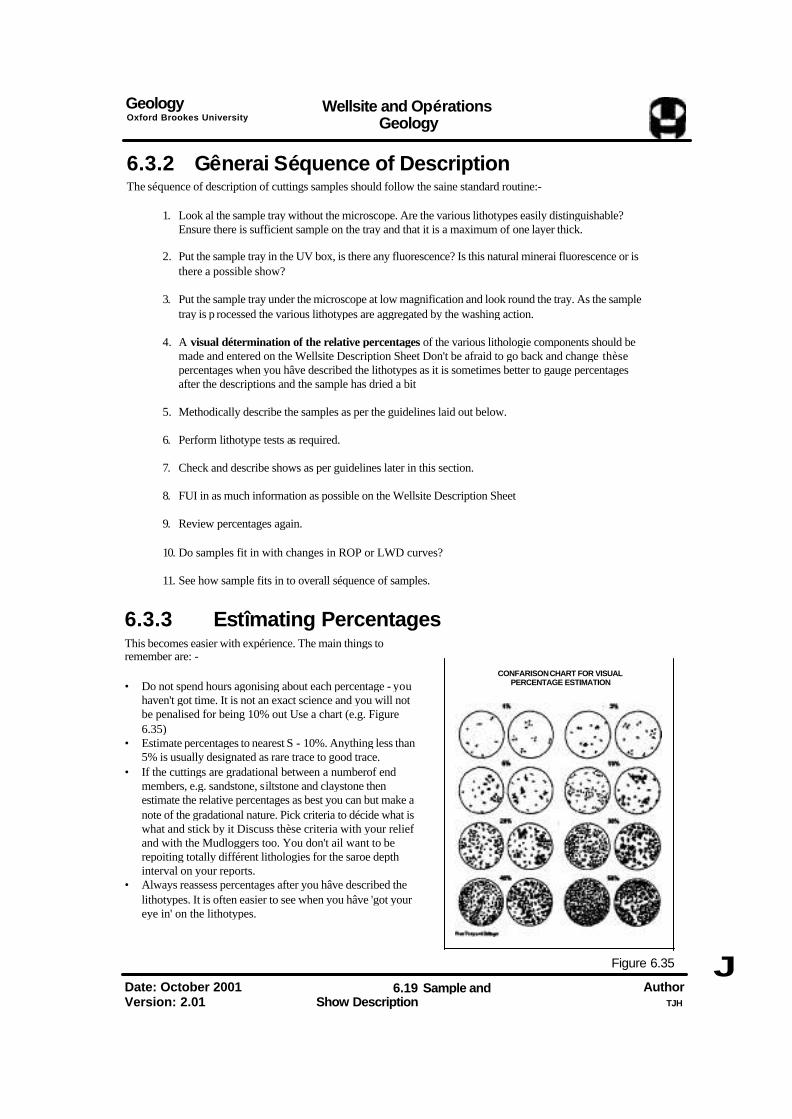
• Do not spend hours agonising about each percentage - you haven't got time. It is not an exact science and you will not be penalised for being 10% out Use a chart (e.g. Figure 6.35)
• Estimate percentages to nearest S - 10%. Anything less than 5% is usually designated as rare trace to good trace.
• If the cuttings are gradational between a numberof end members, e.g. sandstone, siltstone and claystone then estimate the relative percentages as best you can but make a note of the gradational nature. Pick criteria to décide what is what and stick by it Discuss thèse criteria with your relief and with the Mudloggers too. You don't ail want to be repoiting totally différent lithologies for the saroe depth interval on your reports.
• Always reassess percentages after you hâve described the lithotypes. It is often easier to see when you hâve 'got your eye in' on the lithotypes.
CONFARISON CHART FOR VISUAL PERCENTAGE ESTIMATION
Figure 6.35 J
Date: October 2001 Version: 2.01
6.19 Sample and Show Description
Author TJH
Geology Oxford Brookes University
Wellsite and Opérations Geology
6.4 Description of Clastic Rocks
6.4.1 Overview Clastic rocks are those built up of pre-existing rock types produced by the processes of weathering and érosion. They are normally transported to their place of déposition and may be subsequently subject to cémentation and slight chemical changes. Typical sedimentological analysis of clastic rocks based on mineralogy and thin section work is not possible at me wellsite due to constraints of time and equipment. A classification System based on size and texture, however, has evolved over the years and is pretty much standard for ail companies.
Description of cuttings samples is very différent to that of thin sections. We are looking at small chips of rock under relatively moderate magnification with little rock texture visible. It takes a while to become proficient at cuttings descriptions but it is time well spenL Good cuttings descriptions can yield much information regarding porosity, permeability, texture, environment of déposition, shows - indirectry and directly..
The following methodical scheme can be followed when describing samples. It is a generic version. If the company you are working for has mère own scheme then use theirs as a préférence.
Descriptions are generally made on the Wellsite Description sheets using abbreviations. This saves time and space. However, it is not compulsory to use abbreviations. If you feel it is easier to use full words men please do. However, do not use your own abbreviations as other people may not be able to understand them. Either use standard abbreviations or full words. Abbreviations should generally be used on the Wellsite Lithology Log but not on reports and the Final Composite Log. Again this will dépend on client préférence.
It is possible to write descriptions direct into a computer but can be more time-consuming and the cuttings area can be wet and adjacent to chemicals. Not tiie best environment for computers.
Standard Abbreviations can be found in the Appendix of this manual.
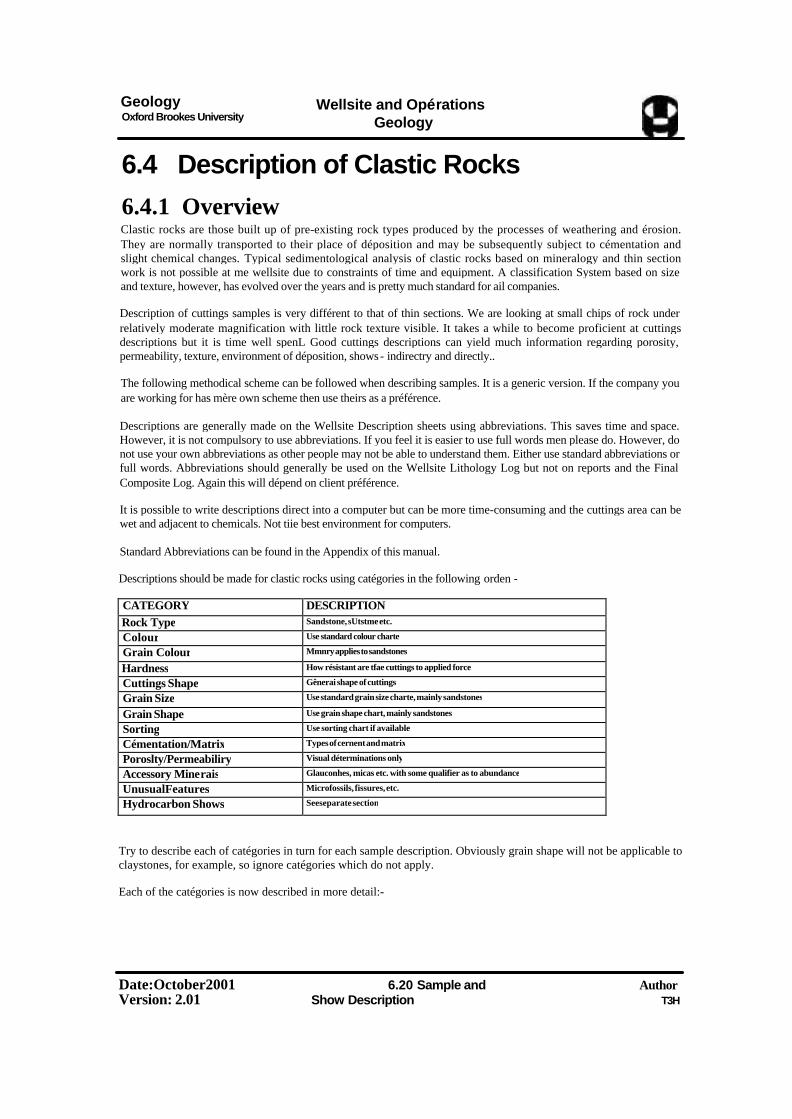
Descriptions should be made for clastic rocks using catégories in the following orden -
CATEGORY DESCRIPTION Rock Type Sandstone, sUtstme etc. Colour Use standard colour charte Grain Colour Mmnry applies to sandstones Hardness How résistant are tfae cuttings to applied force Cuttings Shape Gênerai shape of cuttings Grain Size Use standard grain size charte, mainly sandstones Grain Shape Use grain shape chart, mainly sandstones Sorting Use sorting chart if available Cémentation/Matrix Types of cernent and matrix Poroslty/Permeabiliry Visual déterminations only Accessory Minerais Glauconhes, micas etc. with some qualifier as to abundance UnusualFeatures Microfossils, fissures, etc. Hydrocarbon Shows Seeseparate section
Try to describe each of catégories in turn for each sample description. Obviously grain shape will not be applicable to claystones, for example, so ignore catégories which do not apply.
Each of the catégories is now described in more detail:-
Date:October2001 Version: 2.01
6.20 Sample and Show Description
Author T3H
Geology Oxford Brookes University
Wellsite and Opérations Geology
6.4.2 Rock Type
The type of rock or lithotype you are looking at is usually fairly readily identifiable at a glance to any reasonably trained geologist. A quick look at the grain size and a dab of acid is usually sufficient to make a fairly confident identification of most rock types. Sometimes it may not be quite so easy: -
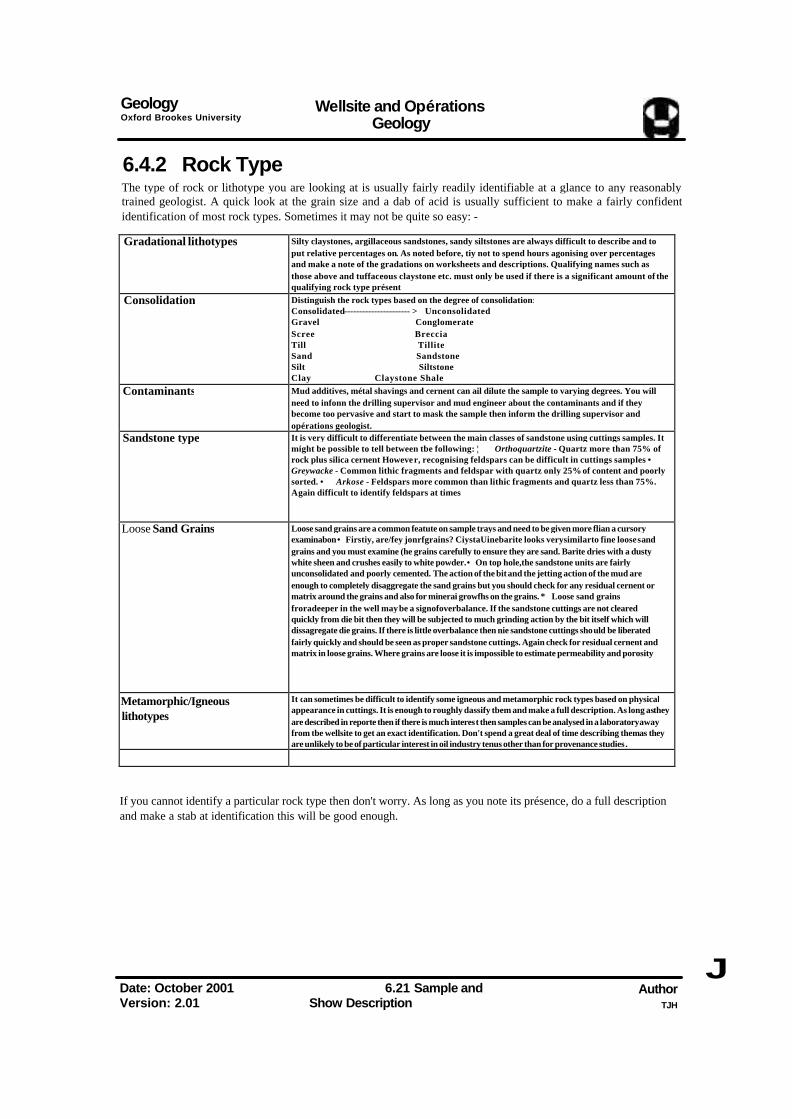
Gradational lithotypes Silty claystones, argillaceous sandstones, sandy siltstones are always difficult to describe and to put relative percentages on. As noted before, tiy not to spend hours agonising over percentages and make a note of the gradations on worksheets and descriptions. Qualifying names such as those above and tuffaceous claystone etc. must only be used if there is a significant amount of the qualifying rock type présent
Consolidation Distinguish the rock types based on the degree of consolidation: Consolidated---------------------- > Unconsolidated Gravel Conglomerate Scree Breccia Till Tillite Sand Sandstone Silt Siltstone Clay Claystone Shale
Contaminants Mud additives, métal shavings and cernent can ail dilute the sample to varying degrees. You will need to infonn the drilling supervisor and mud engineer about the contaminants and if they become too pervasive and start to mask the sample then inform the drilling supervisor and opérations geologist.
Sandstone type It is very difficult to differentiate between the main classes of sandstone using cuttings samples. It might be possible to tell between tbe following: ¦ Orthoquartzite - Quartz more than 75% of rock plus silica cernent However, recognising feldspars can be difficult in cuttings samples • Greywacke - Common lithic fragments and feldspar with quartz only 25% of content and poorly sorted. • Arkose - Feldspars more common than lithic fragments and quartz less than 75%. Again difficult to identify feldspars at times
Loose Sand Grains Loose sand grains are a common featute on sample trays and need to be given more flian a cursory examinabon • Firstiy, are/fey jonrfgrains? CiystaUinebarite looks verysimilarto fine loose sand grains and you must examine (he grains carefully to ensure they are sand. Barite dries with a dusty white sheen and crushes easily to white powder. • On top hole,the sandstone units are fairly unconsolidated and poorly cemented. The action of the bit and the jetting action of the mud are enough to completely disaggregate the sand grains but you should check for any residual cernent or matrix around the grains and also for minerai growfhs on the grains. * Loose sand grains froradeeper in the well may be a signofoverbalance. If the sandstone cuttings are not cleared quickly from die bit then they will be subjected to much grinding action by the bit itself which will dissagregate die grains. If there is little overbalance then nie sandstone cuttings should be liberated fairly quickly and should be seen as proper sandstone cuttings. Again check for residual cernent and matrix in loose grains. Where grains are loose it is impossible to estimate permeability and porosity
Metamorphic/Igneous lithotypes
It can sometimes be difficult to identify some igneous and metamorphic rock types based on physical appearance in cuttings. It is enough to roughly dassify tbem and make a full description. As long as they are described in reporte then if there is much interest then samples can be analysed in a laboratory away from tbe wellsite to get an exact identification. Don't spend a great deal of time describing them as they are unlikely to be of particular interest in oil industry tenus other than for provenance studies.
If you cannot identify a particular rock type then don't worry. As long as you note its présence, do a full description and make a stab at identification this will be good enough.
J Date: October 2001 Version: 2.01
6.21 Sample and Show Description
Author TJH
Geology Oxford Brookes University
Wellsite and Opérations Geology
6.4.3 Colour
Colour is very subjective. Each individual has their own idea of colour and it is a pointless exercise to argue over relative shades. To make this category more objective it is strongly recommended that ail members of tfae wellsite crew use a standard Rock Colour Chart such as that produced by tfae Geological Society of America (Figure 6.36). It consists of a small booklet where each page consists of small oblongs of différent hues of the same colour. Each colour has a name and a number
• Grip a small représentative pièce of wet cutting with tweezers. You will need at least a moderately sized pièce.
• Put the colour chart , with me page of the a pproximate colour visible, under the microscope.
• Compare tfae cutting with each hue in turn until you get tfae closest match
Most operators prefer tfae colour to be written down whilst otfaers may require tfae colour code. Figure 6.36
It is recommended tha t the colour is described when the cutt ing is wet as it will be much lighter when dry. Also tfae power of the microscope lamp and t fae amount of magnifîcation you use can affect the hue of the colour. Try to make colour comparison using the same lamp power and magnifîcation if possible. If a lithotype is vari -coloured then descr ibe i t as being so, give a dominant colour and t ry to es t imate the percentages of each colour . Does one colour remain dominant or does it change with depth?
Are the colours variable? There are various terms that can be used?
Mottled Mott Varieeated Vgated Streaked Strkd Spedded Spkld Varicoloured vcol Spotted spttd
Colour can also be used as simple diagnostic tool to aid in minerai and environmental détermination.
Colour Minerai Indications Environmental Indications Red - O r a n g e bon Ferriooxydised state indicative of oxygenated environments, cg. déserts and river
Systems. TneTertiary 'La* Formation' (Robertsons)above the BaWerFonnation, parts offlie Upper Cretaceous Itodby Formation and Pcnrdan Kupferscheifer
Lightgreen Iron Ferous reduced state indicative of reducing environment Greens and purple réduction spots are found in parts of Tertiary, Triassic etc.
BrightGreen Glauconite, Chlorite , and Chamosite
Glauconite is common i n many horizons and is thought, in many cases to be a product offishtaeces. It is common on lower marine shelf euvuoiuuenls. Chlorite and chamoshe (an oxy-chlorite) may be found in sédiments derivedfiom nearby metemorphic sources or in deeper wells as products of diagenesis.
Blue Tufiàceous Blue colouration is common in Balder Formation which is of volcanic origin D a r k g r e y-brown black -olive black
Carbonaceous material Anoxie environments, usually marine in nature. This allows préservation oforganic material and disseminated iron sulphide is commonly associatcd The Kimmeridge Clay/Draupne Formation of the North Sea is characteristicaUy a brown black-olive black colour and is one of me best hydrocarbon source rocks in the world.
Yellow - ochre Limonite Limonite covers a range of hydrated iron oxides and iron hydroxides. It is a weathering product of ail iron containing minerais.
Brown Oil Check for shows!
Sandstones and coarser When describing sandstones and pebbles you will need to describe not only the colour of tfae constituent grains and clasts, but also their transparent, translucent or opaque nature. This will help in minerai identification. Also note any surface discoloration of the grains or if there are any coloured inclusions. See also later in S ubsection on grain shape and surface features.
Date: October 2001 Version: 2.01
6.22 Sample and Show Description
Author
ROCK ------COLOR CHART-
Geology Oxford Brookes University
Wellsite and Opérations Geology
6.4.4 Hardness and Fracture
This category is intended to reflect the degree of induration, cémentation and compaction of the lithology and how the sample fractures. The common adjectives used to descnbe hardness include:
Loose lse Grains disaggregate when the sample dry. Not used on clay/shale rocks.
Friable fii Loose grains can be separated by pressure fiom the fingers. Fïnn Grains can be separated with a probe. Hard hd Grains difiîcult to defach, pressure results in cuttings
breaking grains. Veryhard vhd Individual grains cannot be detached and cuttings break
through grains.
For clay based lithologies, the following terms can be used:
Verysoft (solnble)
vsft Can be dispersed by water/drilling mud.
Soft sft No shape or strength, very easily deformed. Sttcky stky Sticks to fingers and sample probe. Plastic plas Easily moulded and retains shape, difficult to wash through sieve. Firm frni Definite shape and structure, penetrated and broken by probe. Hard hd Sharp angular edges, not easily broken by probe. Variously
subdivided as moderately to very hard. To détermine hardness you will need to crush a number of grains using a probe or tweezers to get a représentative hardness for each lithotype. If there is a range of values then make a note of Ibis. Is there some reason for hardness ranges? Does the hardness vary with colour or calcareous content?
Further terms are ofien applied to clay-based lithologies which descnbe the solubiliry to water of the claystone. This is especially so when dealing with soft tophole clays. Various terms are used, soluble hydrateable, hygroturgid etc. and they ail mean pretty much the same - the lithology disintegrates when exposed to water.
It is recommended that when dealing with soft, soluble lithologies that -
• You occasionally check how the sample is being washed by the mudlogger. Is much of the claystone fraction being washed away?
• Get the mudlogger to put a small pile of unwashed sample on the sample tray. This allows a direct comparison between the washed and unwashed sample.
• Try to make estimâtes of percentages based on unwashed sample rather than washed sample in thèse circumstances. The non-soluble fraction may be considerably enhanced by the washing process.
When testing for hardness the fracture or 'break' of the cutting can described. The break may be described using the following terms: -
O
Crumbly crmly Easily ciushed into constituent parts BritUe brit Breaks into small pièces when fractures Conchoidal conch Curved fracture planes such as those seen in flint Hackly hkly Inegular break with no preferred fracture orientation Splintery splty Very hard and splinters into sharp pièces when broken
or may be described using terms defined in the next section on cuttings shape.
Date: October 2001 Version: 2,01
6.23 Sample and Show Description
Author TJH
Geology Oxford Brookes University
Wellsite and Opérations Geology
6.4.5 Cuttings Shape
Basic Cuttinas Shape
This category is largely used to describe die cuttings shape of day based lithologies but can be applied to other lithologies and the fracture or 'break9 of ail lithologies (see above). It does not refer to constituent grains of cuttings, which are described later. Cuttings shape and size are strongly influenced by rock type, bit type and the degree of overbalance (see below). If the well is close to balance , hold down force is low and cuttings are freely liberated. They tend to be bigger and 'fresher' looking when seen at oie surface. If the cuttings get too big then the circulation System will not be able to carry them quickly up die hole. They will tend to become abraded by constant impacts with other cuttings and the borehole wall.
If there is a high overbalance men cuttings are not freely liberated and they are much smaller. They may be rolled round on bottom and will hâve a more rounded and less 'fresh' appearance. Influences on bit shape are discussed below
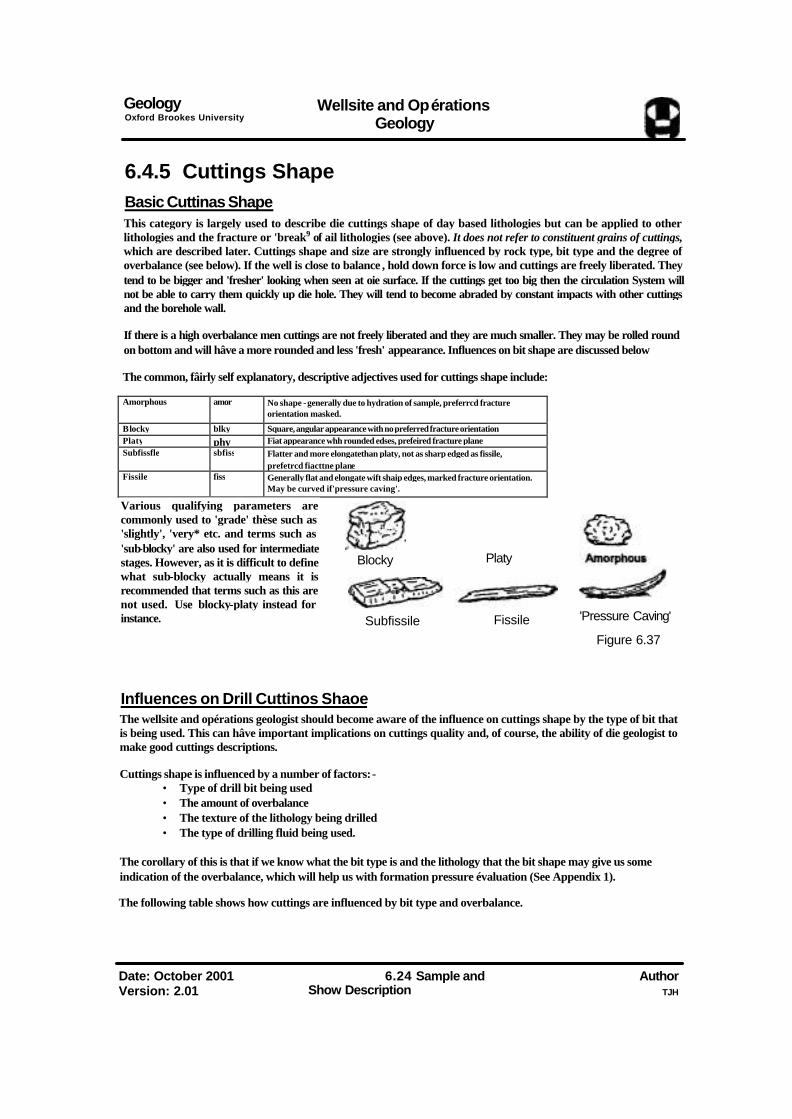
The common, fâirly self explanatory, descriptive adjectives used for cuttings shape include:
Amorphous amor No shape - generally due to hydration of sample, preferrcd fracture orientation masked.
Blocky blky Square, angular appearance with no preferred fracture orientation Platy phy Fiat appearance whh rounded edses, prefeired fracture plane Subfissfle sbfiss Flatter and more elongatethan platy, not as sharp edged as fissile,
prefetrcd fiacttne plane Fissile fiss Generally flat and elongate wift shaip edges, marked fracture orientation.
May be curved if'pressure caving'. Various qualifying parameters are commonly used to 'grade' thèse such as 'slightly', 'very* etc. and terms such as 'sub-blocky' are also used for intermediate stages. However, as it is difficult to define what sub-blocky actually means it is recommended that terms such as this are not used. Use blocky-platy instead for instance.
Blocky
Subfissile
Platy
Fissile
'Pressure Caving'
Figure 6.37
Influences on Drill Cuttinos Shaoe The wellsite and opérations geologist should become aware of the influence on cuttings shape by the type of bit that is being used. This can hâve important implications on cuttings quality and, of course, the ability of die geologist to make good cuttings descriptions.
Cuttings shape is influenced by a number of factors: - • Type of drill bit being used • The amount of overbalance • The texture of the lithology being drilled • The type of drilling fluid being used.
The corollary of this is that if we know what the bit type is and the lithology that the bit shape may give us some indication of the overbalance, which will help us with formation pressure évaluation (See Appendix 1).
The following table shows how cuttings are influenced by bit type and overbalance.
Date: October 2001 Version: 2.01
6.24 Sample and Show Description
Author TJH
Geology Oxford Brookes University
Wellsite and Opérations Geology
Type of bit No overbalance Slight overbalance High overbalance
Tri-cone milltooth and insert bits
Brittle failure. Cuttings shoot out and aie easily carried away
Transitional failure. Chips are sluggishly removed. Optimised jet impact force will help clear cuttings.
Pseudoplastic failure. Original rock fabric is lost and texture disrupted.
Diamond Bit Only used in hard formations.
Shear to brittle failure leading to small cuttings where original rock fabric is retained or disrupted
Shear to brittle failure leading to small cuttmgs where original rock fabric is retained or disrupted by shears
Pseudoplastic failure. Original rock fabric lost and in some circumstances the heat generated at the bit 'métamorphoses' the sample. . This results in bumt and vitrified sample whicb are useless for évaluation.
PDCBits Produces characteristic PDC «platelets'
Large ridged or stepped cuttings. Each step separated by a shear fracture.
Large ridged or stepped cuttmgs. Each step separated by a shear fracture. Original rock fabric poorly preserved.
Smooth or very slightly ridged cuttings caused by pseudoplastic failure. Rock fabric almost totally lost
PDC Platelets
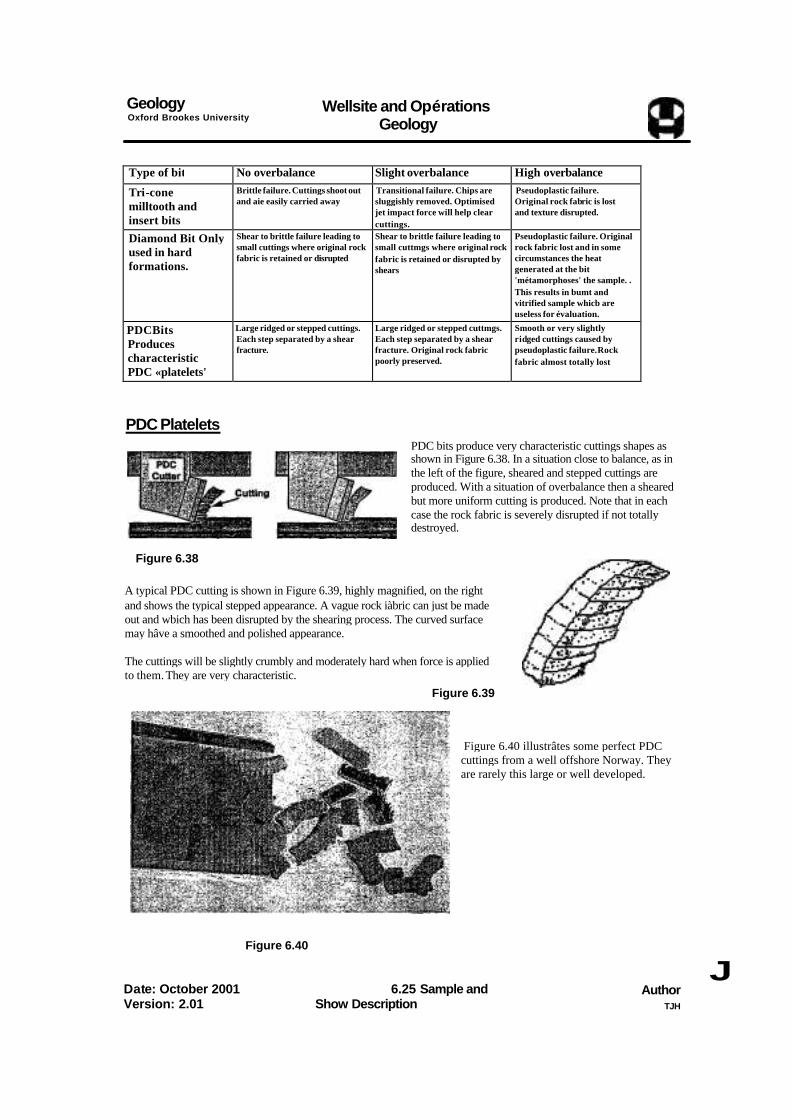
PDC bits produce very characteristic cuttings shapes as shown in Figure 6.38. In a situation close to balance, as in the left of the figure, sheared and stepped cuttings are produced. With a situation of overbalance then a sheared but more uniform cutting is produced. Note that in each case the rock fabric is severely disrupted if not totally destroyed.
Figure 6.38
A typical PDC cutting is shown in Figure 6.39, highly magnified, on the right and shows the typical stepped appearance. A vague rock iàbric can just be made out and wbich has been disrupted by the shearing process. The curved surface may hâve a smoothed and polished appearance.
The cuttings will be slightly crumbly and moderately hard when force is applied to them. They are very characteristic.
Figure 6.39
Figure 6.40 illustrâtes some perfect PDC cuttings from a well offshore Norway. They are rarely this large or well developed.
Figure 6.40
Date: October 2001 Version: 2.01
6.25 Sample and Show Description
Author TJH
J
Geology , Wellsite and Opérations Oxford Brookes Unrversity _, . r
Geology
Pseudoolastic failure
Pseudoplastic failure can lead to the production of the following bit generated textures:-
• Rock or Bit Flour: Usually soft and lighter colored than normal' cuttings. It is soft, amorphous, pasty and is slightly hydrated by the mud in water based drilling fluids.
• Loose sand grains: For cemented and consolidated sandstones the original sandstone matrix is ground out and the sand grains are liberated. The original sandstone texture is destroyed. Unconsolidated sandstones can be totally disrupted by jetting (force of mud through bit jets) and will resuit in loose sand grains in samples.
• Clasts: Clasts from conglomérâtes and breccias may be released by bit action that destroys the matrix. Large clasts will be too large for transportation and will be broken up. Small pebbles may be transported up the annulus.
The geologist should pay some attention to cuttings shape and quality as well as describing the lithological features. The nature of the cuttings can be used as a pore pressure indicator.
Bit Metamorphism of cuttinos
This can be seen when a diamond bit is used in combination with a turbine rotating at high RPMs. This combination is used by the drillers in an effort to drill through long séquences of hard formation in a short a time as possible. However, the bit becomes very hot and with high weights on bit the cuttings take on a 'burnt', 'crispy' and metamorphosed appearance, rendering them almost unrecognisable. Sometimes it is impossible to describe the cuttings and even basic rock identification is difficult Running this bit and turbine combination is not recommended when lookmg for core or casing points.
Date: October 2001 6.26 Author Version: 2.01 Sample and Show Description TJH
Geology Oxford Brookes University
Wellsite and Opérations Geology
6.4.6 Grain Size.
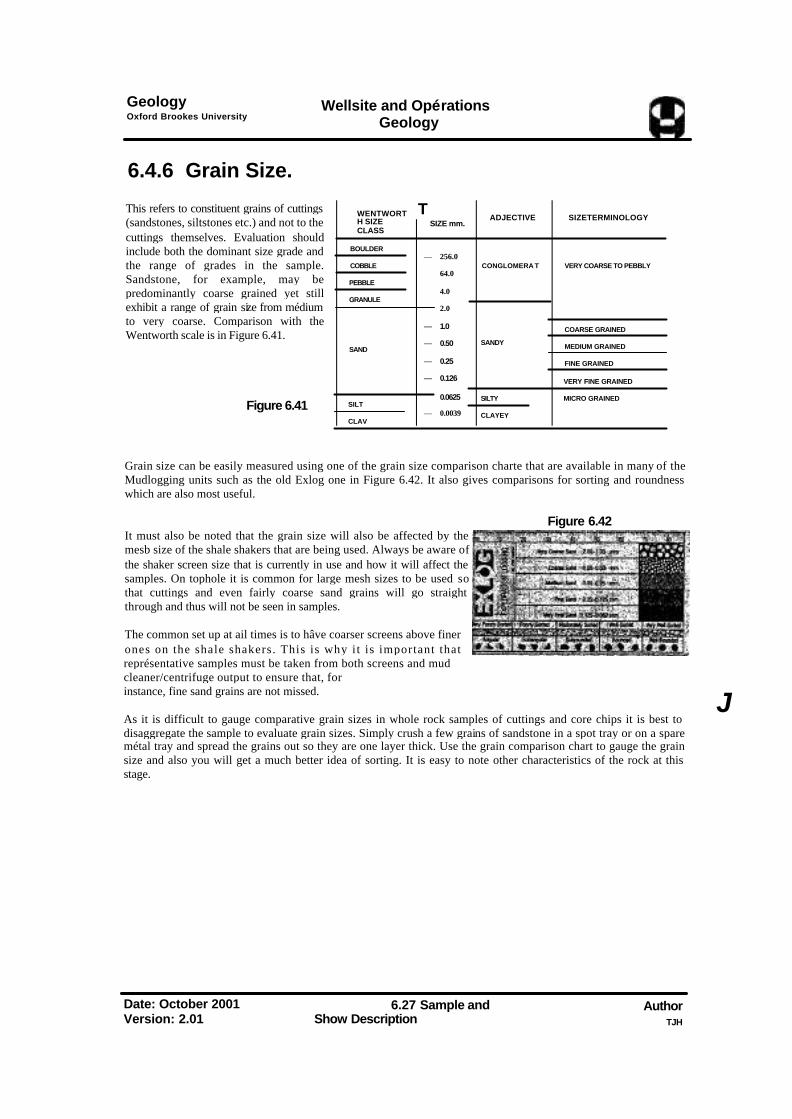
This refers to constituent grains of cuttings (sandstones, siltstones etc.) and not to the cuttings themselves. Evaluation should include both the dominant size grade and the range of grades in the sample. Sandstone, for example, may be predominantly coarse grained yet still exhibit a range of grain size from médium to very coarse. Comparison with the Wentworth scale is in Figure 6.41.
Figure 6.41
WENTWORTH SIZE CLASS
BOULDER COBBLE PEBBLE GRANULE
SAND
SILT CLAV
SIZE mm.
— 256.0
64.0
4.0
2.0
— 1.0
— 0.50
— 0.25
— 0.126
0.0625
— 0.0039
ADJECTIVE
CONGLOMERA T
SANDY
SILTY CLAYEY
SIZETERMINOLOGY
VERY COARSE TO PEBBLY
COARSE GRAINED MEDIUM GRAINED FINE GRAINED VERY FINE GRAINED MICRO GRAINED
Grain size can be easily measured using one of the grain size comparison charte that are available in many of the Mudlogging units such as the old Exlog one in Figure 6.42. It also gives comparisons for sorting and roundness which are also most useful.
Figure 6.42 It must also be noted that the grain size will also be affected by the mesb size of the shale shakers that are being used. Always be aware of the shaker screen size that is currently in use and how it will affect the samples. On tophole it is common for large mesh sizes to be used so that cuttings and even fairly coarse sand grains will go straight through and thus will not be seen in samples.
The common set up at ail times is to hâve coarser screens above finer ones on the shale shakers. This is why i t is important that représentative samples must be taken from both screens and mud cleaner/centrifuge output to ensure that, for instance, fine sand grains are not missed.
As it is difficult to gauge comparative grain sizes in whole rock samples of cuttings and core chips it is best to disaggregate the sample to evaluate grain sizes. Simply crush a few grains of sandstone in a spot tray or on a spare métal tray and spread the grains out so they are one layer thick. Use the grain comparison chart to gauge the grain size and also you will get a much better idea of sorting. It is easy to note other characteristics of the rock at this stage.
J
Date: October 2001 Version: 2.01
6.27 Sample and Show Description
Author TJH
T
Geology Oxford Brookes University
Wellsite and Opérations Geology
6.4.7 Grain Shape and surface features
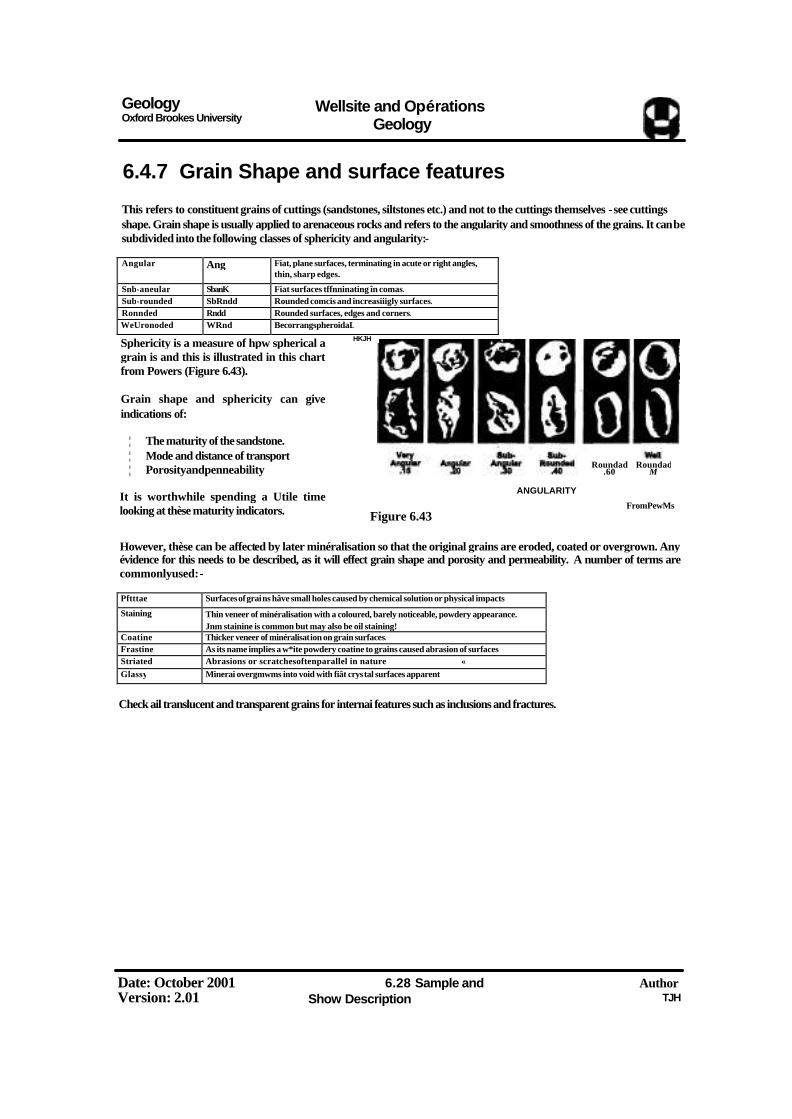
This refers to constituent grains of cuttings (sandstones, siltstones etc.) and not to the cuttings themselves - see cuttings shape. Grain shape is usually applied to arenaceous rocks and refers to the angularity and smoothness of the grains. It can be subdivided into the following classes of sphericity and angularity:-
Angular Ang Fiat, plane surfaces, terminating in acute or right angles, thin, sharp edges.
Snb-aneular SbanK Fiat surfaces tffnninating în comas. Sub-rounded SbRndd Rounded comcis and increasiiigly surfaces. Ronnded Rndd Rounded surfaces, edges and corners. WeUronoded WRnd BecorrangspheroidaL Sphericity is a measure of hpw spherical a grain is and this is illustrated in this chart from Powers (Figure 6.43).
Grain shape and sphericity can give indications of:
¦ The maturity of the sandstone. ¦ Mode and distance of transport ¦ Porosityandpenneability
It is worthwhile spending a Utile time looking at thèse maturity indicators.
HKJH
Figure 6.43
ANGULARITY FromPewMs
However, thèse can be affected by later minéralisation so that the original grains are eroded, coated or overgrown. Any évidence for this needs to be described, as it will effect grain shape and porosity and permeability. A number of terms are commonlyused:-
Pftttae Surfaces of grains hâve small holes caused by chemical solution or physical impacts. Staining Thin veneer of minéralisation with a coloured, barely noticeable, powdery appearance.
Jnm stainine is common but may also be oil staining! Coatine Thicker veneer of minéralisation on grain surfaces. Frastine As its name implies a w*ite powdery coatine to grains caused abrasion of surfaces. Striated Abrasions or scratchesoftenparallel in nature « Glassy Minerai overgmwms into void with fiât crystal surfaces apparent
Check ail translucent and transparent grains for internai features such as inclusions and fractures.
Date: October 2001 Version: 2.01
6.28 Sample and Show Description
Author TJH
Roundad Roundad .60 M
Geology Oxford Brookes University
Wellsite and Opérations Geology
6.4.8 Sorting
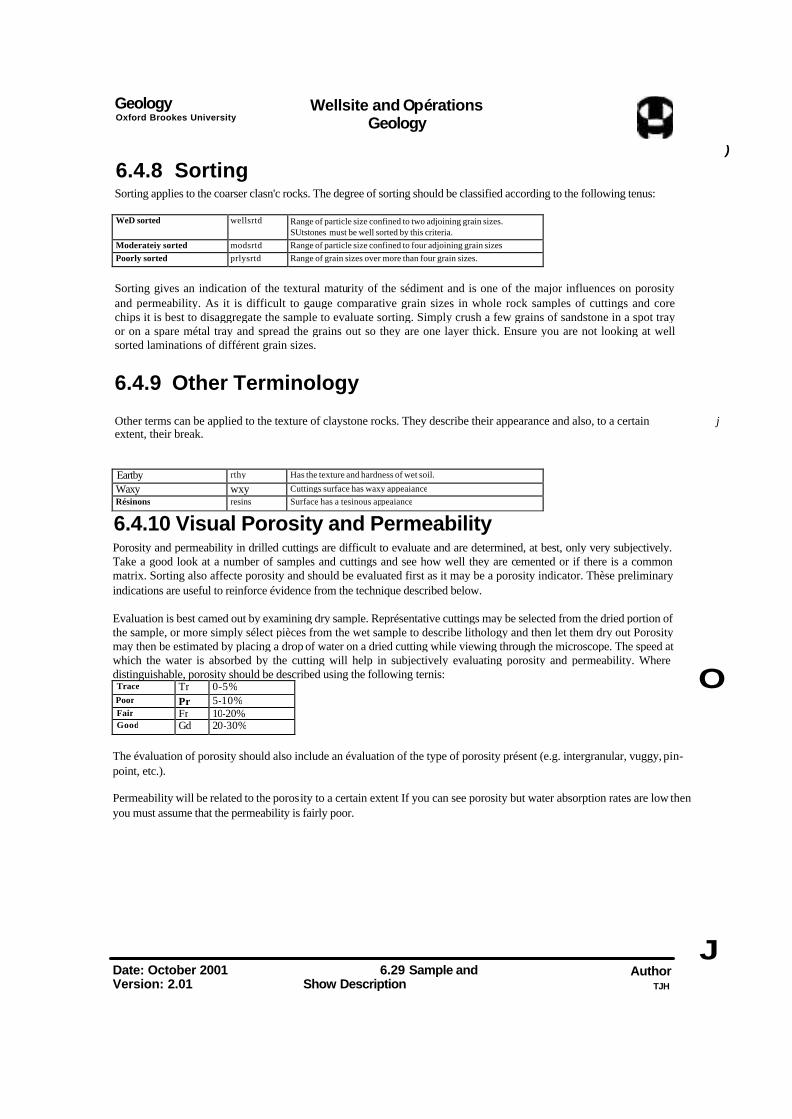
Sorting applies to the coarser clasn'c rocks. The degree of sorting should be classified according to the following tenus:
)
WeD sorted wellsrtd Range of particle size confined to two adjoining grain sizes. SUtstones must be well sorted by this criteria.
Moderateiy sorted modsrtd Range of particle size confined to four adjoining grain sizes. Poorly sorted prlysrtd Range of grain sizes over more than four grain sizes.
Sorting gives an indication of the textural maturity of the sédiment and is one of the major influences on porosity and permeability. As it is difficult to gauge comparative grain sizes in whole rock samples of cuttings and core chips it is best to disaggregate the sample to evaluate sorting. Simply crush a few grains of sandstone in a spot tray or on a spare métal tray and spread the grains out so they are one layer thick. Ensure you are not looking at well sorted laminations of différent grain sizes.
6.4.9 Other Terminology
Other terms can be applied to the texture of claystone rocks. They describe their appearance and also, to a certain j extent, their break.
Eartby rthy Has the texture and hardness of wet soil. Waxy wxy Cuttings surface has waxy appeaiance Résinons resins Surface has a tesinous appeaiance
6.4.10 Visual Porosity and Permeability
Porosity and permeability in drilled cuttings are difficult to evaluate and are determined, at best, only very subjectively. Take a good look at a number of samples and cuttings and see how well they are cemented or if there is a common matrix. Sorting also affecte porosity and should be evaluated first as it may be a porosity indicator. Thèse preliminary indications are useful to reinforce évidence from the technique described below.
Evaluation is best camed out by examining dry sample. Représentative cuttings may be selected from the dried portion of the sample, or more simply sélect pièces from the wet sample to describe lithology and then let them dry out Porosity may then be estimated by placing a drop of water on a dried cutting while viewing through the microscope. The speed at which the water is absorbed by the cutting will help in subjectively evaluating porosity and permeability. Where distinguishable, porosity should be described using the following ternis: Trace Tr 0-5% Poor Pr 5-10% Fair Fr 10-20% Good Gd 20-30%
O
The évaluation of porosity should also include an évaluation of the type of porosity présent (e.g. intergranular, vuggy, pin-point, etc.).
Permeability will be related to the porosity to a certain extent If you can see porosity but water absorption rates are low then you must assume that the permeability is fairly poor.
J Date: October 2001 Version: 2.01
6.29 Sample and Show Description
Author TJH
Geology Oxford Brookes University
Wellsite and Opérations Geology
6.5 Description of Carbonate Rocks
6.5.1 Introduction
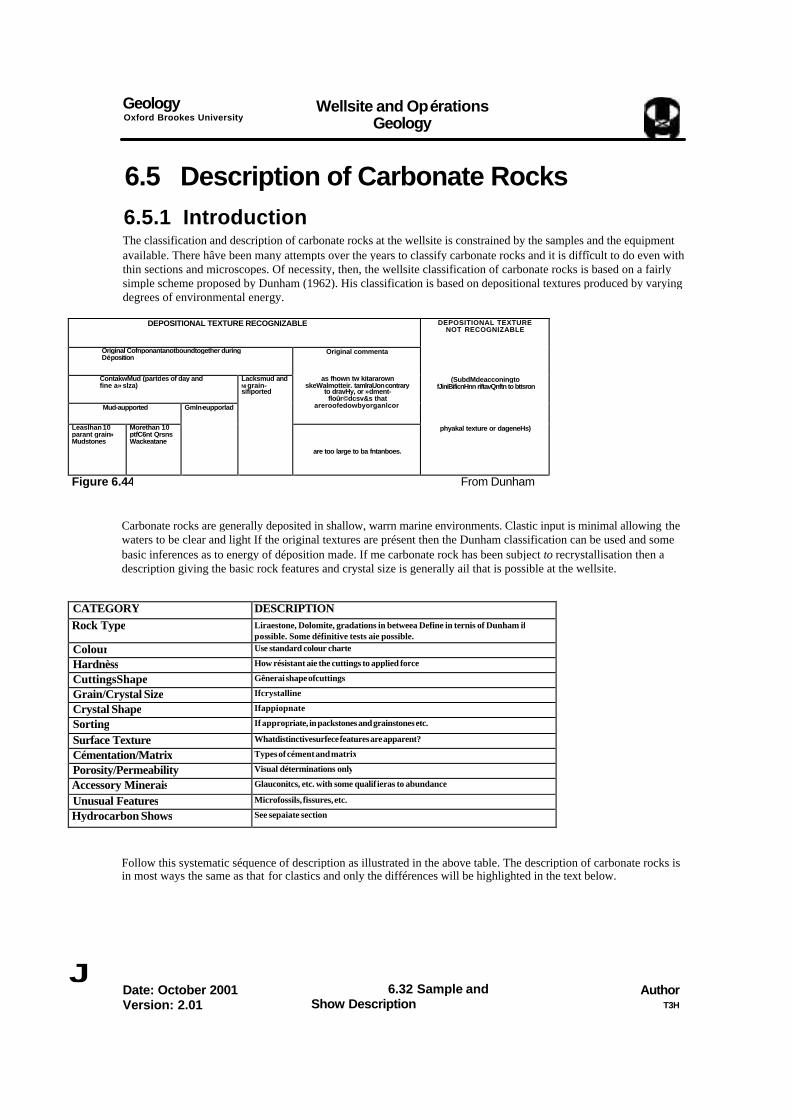
The classification and description of carbonate rocks at the wellsite is constrained by the samples and the equipment available. There hâve been many attempts over the years to classify carbonate rocks and it is diffîcult to do even with thin sections and microscopes. Of necessity, then, the wellsite classification of carbonate rocks is based on a fairly simple scheme proposed by Dunham (1962). His classification is based on depositional textures produced by varying degrees of environmental energy.
DEPOSITIONAL TEXTURE RECOGNIZABLE DEPOSITIONAL TEXTURE NOT RECOGNIZABLE
Original Cofnponantanotboundtogether during Déposition Original commenta
ContakwMud (partdes of day and fine a» slza) Lacksmud and
NI grain-sifiported
as fhown tw kitararown skeWalmotteir. tamlraUon contrary
to dravHy, or »dment-floûr©dcsv&s that
areroofedowbyorganlcor
(SubdMdeacconingto fJiniBificnHnn riftavQnftn to bttsron
Mud-aupported Gmln-eupporlad
Leaslhan 10 parant grain» Mudstones
Morethan 10 ptfC6nt Qrsns Wackeatane
are too large to ba fntanboes.
phyakal texture or dageneHs)
Figure 6.44 From Dunham
Carbonate rocks are generally deposited in shallow, warrn marine environments. Clastic input is minimal allowing the waters to be clear and light If the original textures are présent then the Dunham classification can be used and some basic inferences as to energy of déposition made. If me carbonate rock has been subject to recrystallisation then a description giving the basic rock features and crystal size is generally ail that is possible at the wellsite.
CATEGORY DESCRIPTION Rock Type Liraestone, Dolomite, gradations in betweea Define in ternis of Dunham if
possible. Some définitive tests aie possible. Colour Use standard colour charte Hardnèss How résistant aie the cuttings to applied force CuttingsShape Gênerai shape ofcuttings Grain/Crystal Size Ifcrystalline Crystal Shape Ifappiopnate Sorting If appropriate, in packstones and grainstones etc. Surface Texture Whatdistinctivesurfece features are apparent? Cémentation/Matrix Types of cément and matrix Porosity/Permeability Visual déterminations only Accessory Minerais Glauconitcs, etc. with some qualif ieras to abundance Unusual Features Microfossils, fissures, etc. Hydrocarbon Shows See sepaiate section
Follow this systematic séquence of description as illustrated in the above table. The description of carbonate rocks is in most ways the same as that for clastics and only the différences will be highlighted in the text below.
J Date: October 2001 Version: 2.01
6.32 Sample and Show Description
Author T3H
Geology Oxford Brookes University
Wellsite and Opérations Geology
6.5.2 Rock Type
The main carbonate rock forming minerais are calcite, aragonite and dolomite. Calcite, iron and magnésium are commonly substituted to produce a whole range of rock types of which limestone (predominantly CaCo3) and Dolomite (CaMg(CO3)2) are by far the most common. The foUowing table shows a guideline for basic nomenclature based on calcium percentages (as opposed to magnésium):-
Percentage Calcium Rock Name 0-50% Magnesite 50-60% Dolomite 60-75% Calcareous Dolomite 75-90% Dolomitic Limestone 90-100% Limestone
Détermination of carbonate rock type at the wellsite usually consists of working out via simple tests what the rock is and then fitting it in to the Dunham classification. If crystalline, the rock should be described in terms of its crystal size.
The Mudloggers usually hâve a calcimeter - a specialised apparatus to measure total carbonate content of samples. This can give relative abundances of limestone and dolomite and may help to make a basic classification of the carbonate. Whilst it does not provide a définitive évaluation it is certainly more objective than dropping cuttings in acid. There are a number of tests described below that allow more spécifie déterminations of rock character to be made.
Whilst Iimestones and dolomites are the commonest rock types there are several other 'subtypes' that are commonly used.
Figure 6.45
Chalk Very fine grained, predominantly white limestone made up of the skeletons of a planktonic algae called coccolithospheres. Chalk is very widespread in the Cretaceous but many Iimestones can be said to hâve a 'chalky' texture and it is a readily identifiable rock type.
Mari This is a fine grained calcareous mudstone. There are various définitions of mari and it is recommended that the term is not used with either calcareous claystone or argillaceous limestone being used instead. Even hère it is often difScult to pick between thèse two tenns as they are just gradational members of the same séries.
Ideally when put in dilute hydrochloric acid a calcareous claystone cutting will retain its integrity whilst an argillaceous limestone cutting will not, leaving a clayey residue in the spot tray.
Arenaceous Limestones
Differentiate sandy limestone and calcareous sandstone in the same way as argillaceous limestones. Drop cuttings in dilute hydrochloric acid and see if they disaggregate.
J Date: October 2001 Version: 2.01
6.33 Sample and Show Description
Author TJH
-Uimtww"
"^^^ "Dolomite" J
Pressure Sensor
Geology Wellsite and Opérations Oxford Brookes Universtty _ . Geology
6.5.3 Other Catégories
Colour Colours can be very subtle and variegated in carbonates and requires the use of colour charts.
Grain Size
Grain size détermination may be difficult with carbonates especially if recrystallisation has taken place. It may be that a description of crystal size or a mixture of crystal and grains may be required.
Sortinq Again may be difficult as grain types may be so variable and recrystallisation may hâve occurred.
Surface Texture
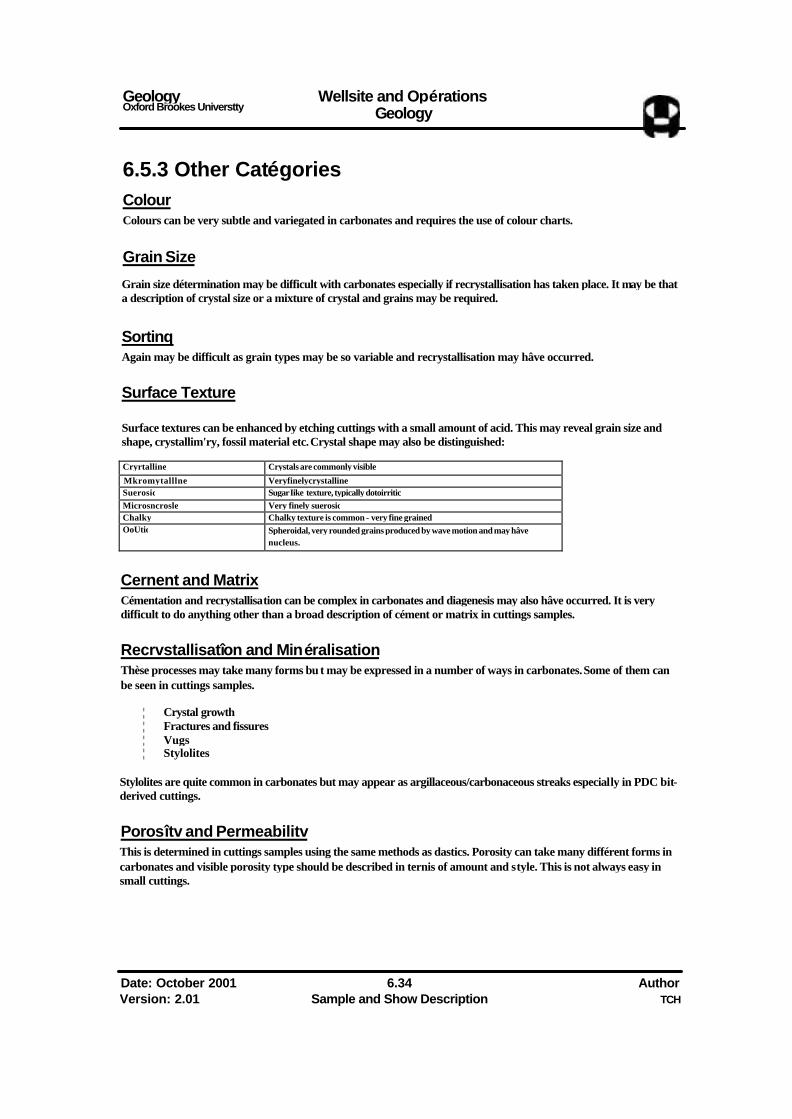
Surface textures can be enhanced by etching cuttings with a small amount of acid. This may reveal grain size and shape, crystallim'ry, fossil material etc. Crystal shape may also be distinguished:
Cryrtalline Crystals are commonly visible Mkromytalllne Veryfinelycrystalline Suerosic Sugar Iike texture, typically dotoirritic Microsncrosle Very finely suerosic Chalky Chalky texture is common - very fine grained OoUtic Spheroidal, very rounded grains produced by wave motion and may hâve
nucleus.
Cernent and Matrix Cémentation and recrystallisation can be complex in carbonates and diagenesis may also hâve occurred. It is very difficult to do anything other than a broad description of cément or matrix in cuttings samples.
Recrvstallisatîon and Minéralisation Thèse processes may take many forms bu t may be expressed in a number of ways in carbonates. Some of them can be seen in cuttings samples.
¦ Crystal growth ¦ Fractures and fissures ¦ Vugs ¦ Stylolites
Stylolites are quite common in carbonates but may appear as argillaceous/carbonaceous streaks especially in PDC bit-derived cuttings.
Porosîtv and Permeabilitv This is determined in cuttings samples using the same methods as dastics. Porosity can take many différent forms in carbonates and visible porosity type should be described in ternis of amount and style. This is not always easy in small cuttings.
Date: October 2001 6.34 Author Version: 2.01 Sample and Show Description TCH
Geology Oxford Brookes University
Wellsite and Opérations Geology
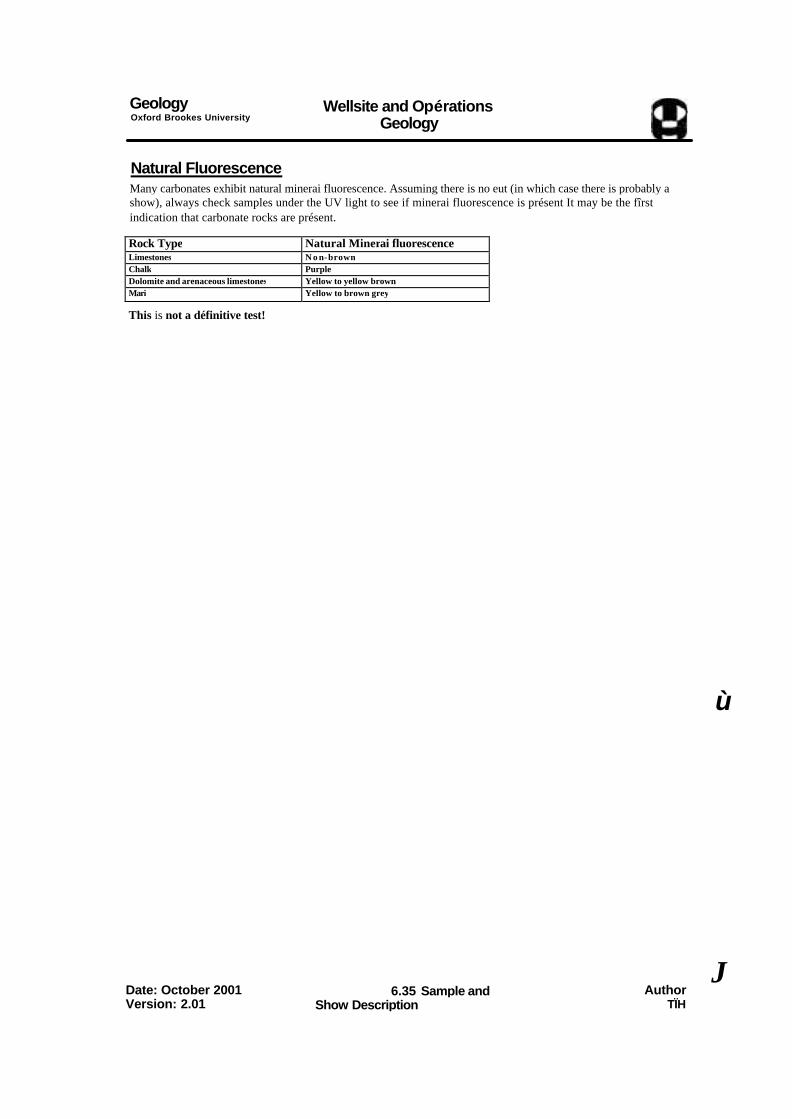
Natural Fluorescence Many carbonates exhibit natural minerai fluorescence. Assuming there is no eut (in which case there is probably a show), always check samples under the UV light to see if minerai fluorescence is présent It may be the fîrst indication that carbonate rocks are présent.
Rock Type Natural Minerai fluorescence Limestones N o n-brown Chalk Purple Dolomite and arenaceous limestones Yellow to yellow brown Mari Yellow to brown grey
This is not a définitive test!
ù
Date: October 2001 Version: 2.01
6.35 Sample and Show Description
Author TÏH
J
Geology Oxford Brookes University
Wellsite and Opérations Geology
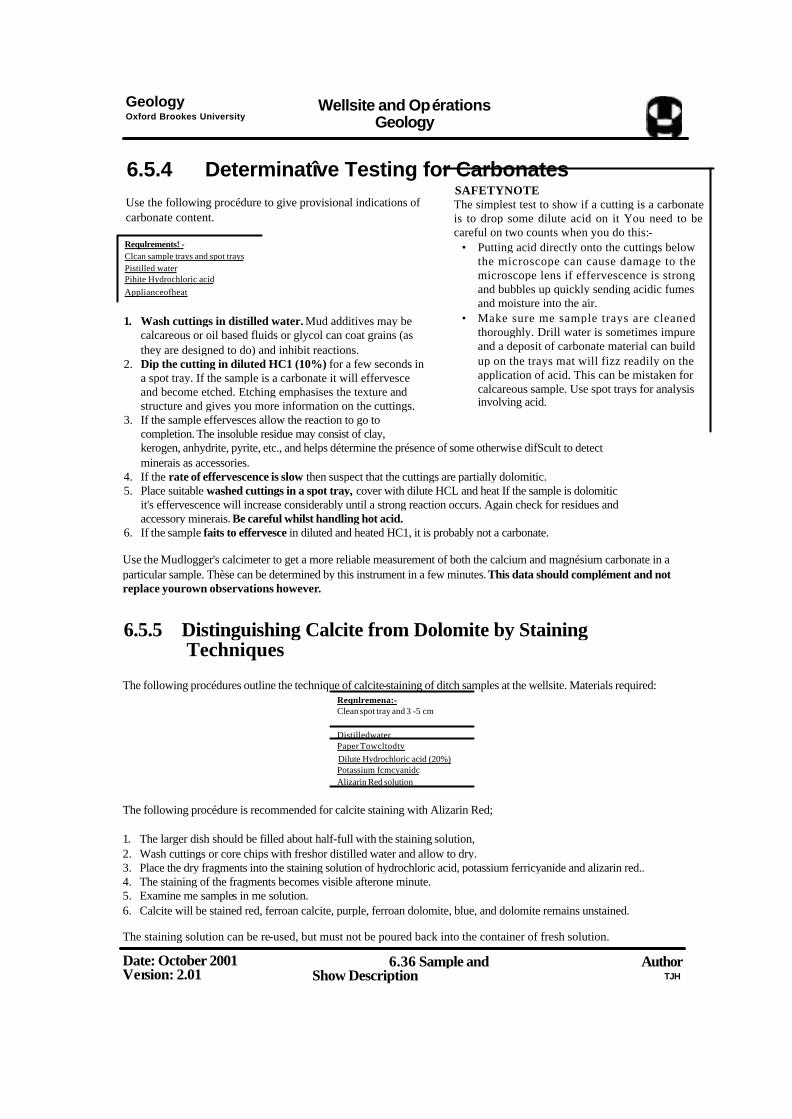
6.5.4 Determinatîve Testing for Carbonates
Use the following procédure to give provisional indications of carbonate content.
Requlrements! - Clcan sample trays and spot trays Pistilled water Pihite Hydrochloric acid Applianceofheat
1. Wash cuttings in distilled water. Mud additives may be calcareous or oil based fluids or glycol can coat grains (as they are designed to do) and inhibit reactions.
2. Dip the cutting in diluted HC1 (10%) for a few seconds in a spot tray. If the sample is a carbonate it will effervesce and become etched. Etching emphasises the texture and structure and gives you more information on the cuttings.
3. If the sample effervesces allow the reaction to go to completion. The insoluble residue may consist of clay, kerogen, anhydrite, pyrite, etc., and helps détermine the présence of some otherwise difScult to detect minerais as accessories.
4. If the rate of effervescence is slow then suspect that the cuttings are partially dolomitic. 5. Place suitable washed cuttings in a spot tray, cover with dilute HCL and heat If the sample is dolomitic
it's effervescence will increase considerably until a strong reaction occurs. Again check for residues and accessory minerais. Be careful whilst handling hot acid.
6. If the sample faits to effervesce in diluted and heated HC1, it is probably not a carbonate.
Use the Mudlogger's calcimeter to get a more reliable measurement of both the calcium and magnésium carbonate in a particular sample. Thèse can be determined by this instrument in a few minutes. This data should complément and not replace yourown observations however.
6.5.5 Distinguishing Calcite from Dolomite by Staining Techniques
The following procédures outline the technique of calcite-staining of ditch samples at the wellsite. Materials required: Reqnlremena:- Clean spot tray and 3 -5 cm
Distilledwater Paper Towcltodtv Dilute Hydrochloric acid (20%) Potassium fcmcyanidc Alizarin Red solution
The following procédure is recommended for calcite staining with Alizarin Red;
1. The larger dish should be filled about half-full with the staining solution, 2. Wash cuttings or core chips with freshor distilled water and allow to dry. 3. Place the dry fragments into the staining solution of hydrochloric acid, potassium ferricyanide and alizarin red.. 4. The staining of the fragments becomes visible afterone minute. 5. Examine me samples in me solution. 6. Calcite will be stained red, ferroan calcite, purple, ferroan dolomite, blue, and dolomite remains unstained.
The staining solution can be re-used, but must not be poured back into the container of fresh solution.
Date: October 2001 Version: 2.01
6.36 Sample and Show Description
Author TJH
SAFETYNOTE The simplest test to show if a cutting is a carbonate is to drop some dilute acid on it You need to be careful on two counts when you do this:-
• Putting acid directly onto the cuttings below the microscope can cause damage to the microscope lens if effervescence is strong and bubbles up quickly sending acidic fumes and moisture into the air.
• Make sure me sample trays are cleaned thoroughly. Drill water is sometimes impure and a deposit of carbonate material can build up on the trays mat will fizz readily on the application of acid. This can be mistaken for calcareous sample. Use spot trays for analysis involving acid.
Geology Oxford Brookes University
Wellsite and Opérations Geology
6.6 Description of Chemical Rocks
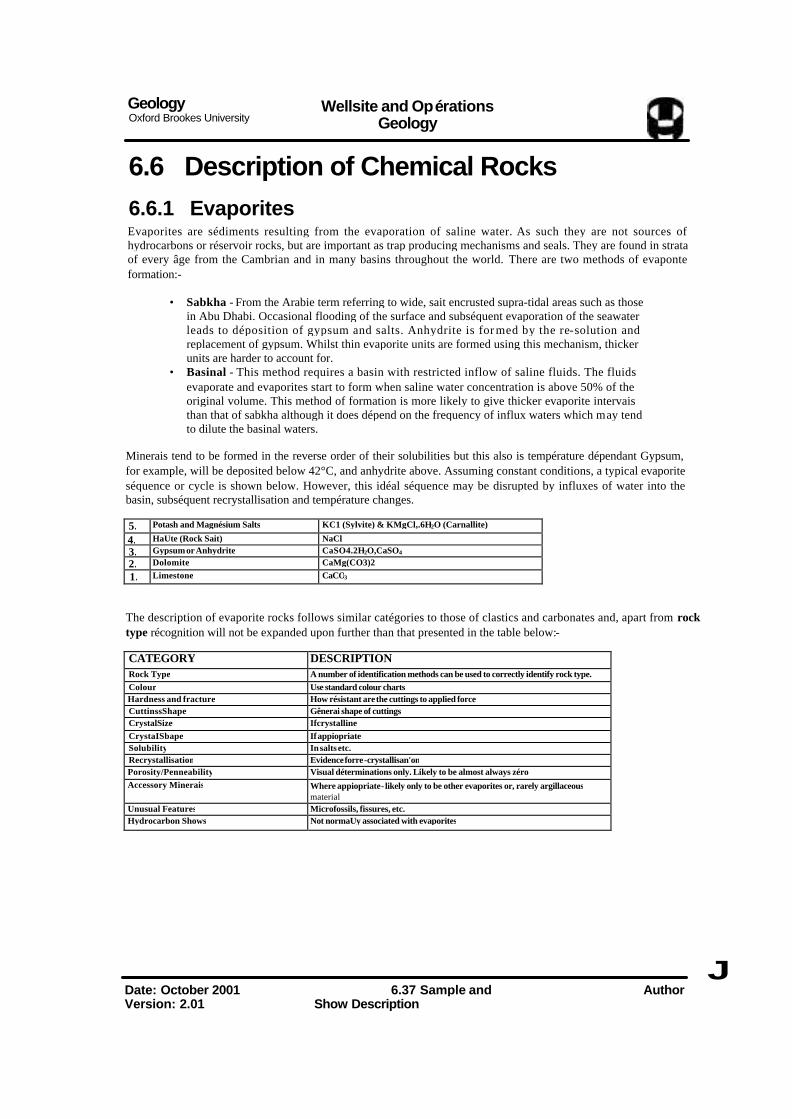
6.6.1 Evaporites
Evaporites are sédiments resulting from the evaporation of saline water. As such they are not sources of hydrocarbons or réservoir rocks, but are important as trap producing mechanisms and seals. They are found in strata of every âge from the Cambrian and in many basins throughout the world. There are two methods of evaponte formation:-
• Sabkha - From the Arabie term referring to wide, sait encrusted supra-tidal areas such as those in Abu Dhabi. Occasional flooding of the surface and subséquent evaporation of the seawater leads to déposition of gypsum and salts. Anhydrite is for med by the re-solution and replacement of gypsum. Whilst thin evaporite units are formed using this mechanism, thicker units are harder to account for.
• Basinal - This method requires a basin with restricted inflow of saline fluids. The fluids evaporate and evaporites start to form when saline water concentration is above 50% of the original volume. This method of formation is more likely to give thicker evaporite intervais than that of sabkha although it does dépend on the frequency of influx waters which may tend to dilute the basinal waters.
Minerais tend to be formed in the reverse order of their solubilities but this also is température dépendant Gypsum, for example, will be deposited below 42°C, and anhydrite above. Assuming constant conditions, a typical evaporite séquence or cycle is shown below. However, this idéal séquence may be disrupted by influxes of water into the basin, subséquent recrystallisation and température changes.
5. Potash and Magnésium Salts KC1 (Sylvite) & KMgCl,.6H2O (Carnallite) 4. HaUte (Rock Sait) NaCl 3. Gypsum or Anhydrite CaSO4.2H2O,CaSO4 2. Dolomite CaMg(CO3)2 1. Limestone CaCO3
The description of evaporite rocks follows similar catégories to those of clastics and carbonates and, apart from rock type récognition will not be expanded upon further than that presented in the table below:-
CATEGORY DESCRIPTION Rock Type A number of identification methods can be used to correctly identify rock type. Colour Use standard colour charts Hardness and fracture How résistant are the cuttings to applied force CuttinssShape Gênerai shape of cuttings CrystalSize Ifcrystalline CrystaISbape If appiopriate Solubility In salts etc. Recrystallisation Evidence forre-crystallisan'on Porosity/Penneability Visual déterminations only. Likely to be almost always zéro. Accessory Minerais Where appiopriate - likely only to be other evaporites or, rarely argillaceous
material Unusual Features Microfossils, fissures, etc. Hydrocarbon Shows Not normaUy associated with evaporites
J Date: October 2001 Version: 2.01
6.37 Sample and Show Description
Author
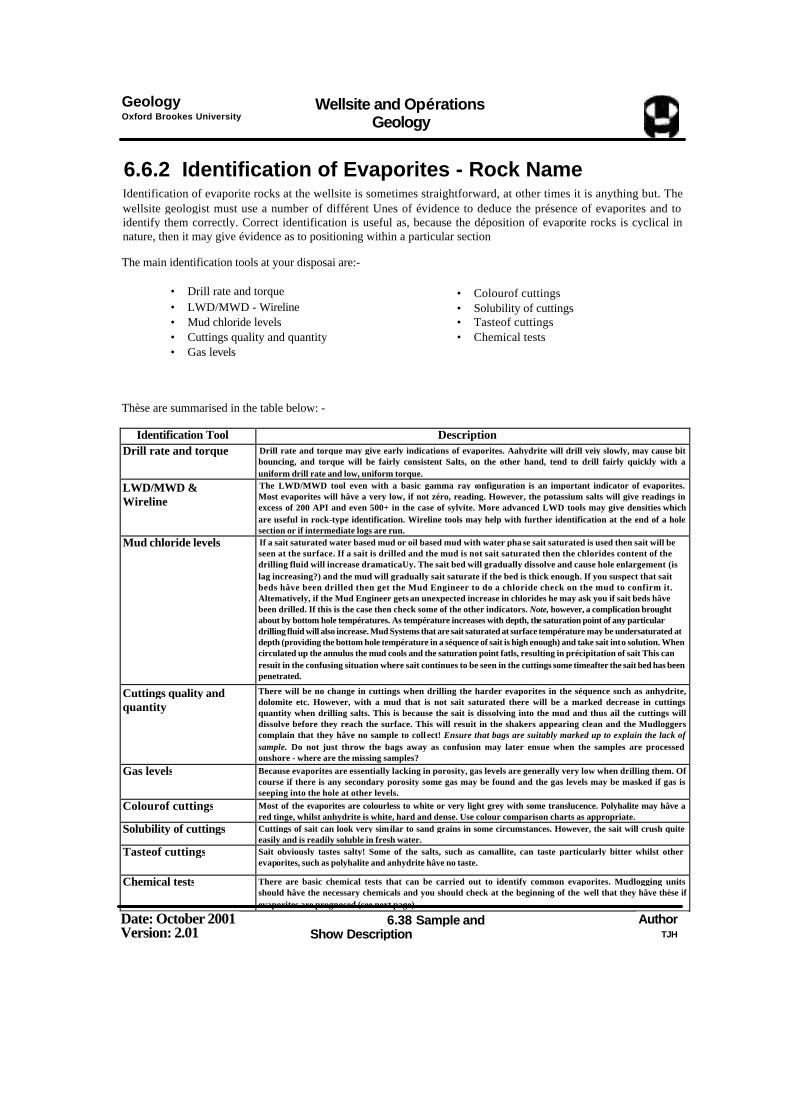
Geology Oxford Brookes University
Wellsite and Opérations Geology
6.6.2 Identification of Evaporites - Rock Name
Identification of evaporite rocks at the wellsite is sometimes straightforward, at other times it is anything but. The wellsite geologist must use a number of différent Unes of évidence to deduce the présence of evaporites and to identify them correctly. Correct identification is useful as, because the déposition of evaporite rocks is cyclical in nature, then it may give évidence as to positioning within a particular section
The main identification tools at your disposai are:-
• Drill rate and torque • LWD/MWD - Wireline • Mud chloride levels • Cuttings quality and quantity • Gas levels
• Colourof cuttings • Solubility of cuttings • Tasteof cuttings • Chemical tests
Thèse are summarised in the table below: -
Identification Tool Description Drill rate and torque Drill rate and torque may give early indications of evaporites. Aahydrite will drill veiy slowly, may cause bit
bouncing, and torque will be fairly consistent Salts, on the other hand, tend to drill fairly quickly with a uniform drill rate and low, uniform torque.
LWD/MWD & Wireline
The LWD/MWD tool even with a basic gamma ray configuration is an important indicator of evaporites. Most evaporites will hâve a very low, if not zéro, reading. However, the potassium salts will give readings in excess of 200 API and even 500+ in the case of sylvite. More advanced LWD tools may give densities which are useful in rock-type identification. Wireline tools may help with further identification at the end of a hole section or if intermediate logs are run.
Mud chloride levels If a sait saturated water based mud or oil based mud with water phase sait saturated is used then sait will be seen at the surface. If a sait is drilled and the mud is not sait saturated then the chlorides content of the drilling fluid will increase dramaticaUy. The sait bed will gradually dissolve and cause hole enlargement (is lag increasing?) and the mud will gradually sait saturate if the bed is thick enough. If you suspect that sait beds hâve been drilled then get the Mud Engineer to do a chloride check on the mud to confirm it. Altematively, if the Mud Engineer gets an unexpected increase in chlorides he may ask you if sait beds hâve been drilled. If this is the case then check some of the other indicators. Note, however, a complication brought about by bottom hole températures. As température increases with depth, the saturation point of any particular drilling fluid will also increase. Mud Systems that are sait saturated at surface température may be undersaturated at depth (providing the bottom hole température in a séquence of sait is high enough) and take sait into solution. When circulated up the annulus the mud cools and the saturation point fatls, resulting in précipitation of sait This can resuit in the confusing situation where sait continues to be seen in the cuttings some timeafter the sait bed has been penetrated.
Cuttings quality and quantity
There will be no change in cuttings when drilling the harder evaporites in the séquence such as anhydrite, dolomite etc. However, with a mud that is not sait saturated there will be a marked decrease in cuttings quantity when drilling salts. This is because the sait is dissolving into the mud and thus ail the cuttings will dissolve before they reach the surface. This will resuit in the shakers appearing clean and the Mudloggers complain that they hâve no sample to coll ect! Ensure that bags are suitably marked up to explain the lack of sample. Do not just throw the bags away as confusion may later ensue when the samples are processed onshore - where are the missing samples?
Gas levels Because evaporites are essentially lacking in porosity, gas levels are generally very low when drilling them. Of course if there is any secondary porosity some gas may be found and the gas levels may be masked if gas is seeping into the hole at other levels.
Colourof cuttings Most of the evaporites are colourless to white or very light grey with some translucence. Polyhalite may hâve a red tinge, whilst anhydrite is white, hard and dense. Use colour comparison charts as appropriate.
Solubility of cuttings Cuttings of sait can look very similar to sand grains in some circumstances. However, the sait will crush quite easily and is readily soluble in fresh water.
Tasteof cuttings Sait obviously tastes salty! Some of the salts, such as camallite, can taste particularly bitter whilst other evaporites, such as polyhalite and anhydrite hâve no taste.
Chemical tests There are basic chemical tests that can be carried out to identify common evaporites. Mudlogging units should hâve the necessary chemicals and you should check at the beginning of the well that they hâve thèse if evaporites are prognosed (see next page).
Date: October 2001 Version: 2.01
6.38 Sample and Show Description
Author TJH
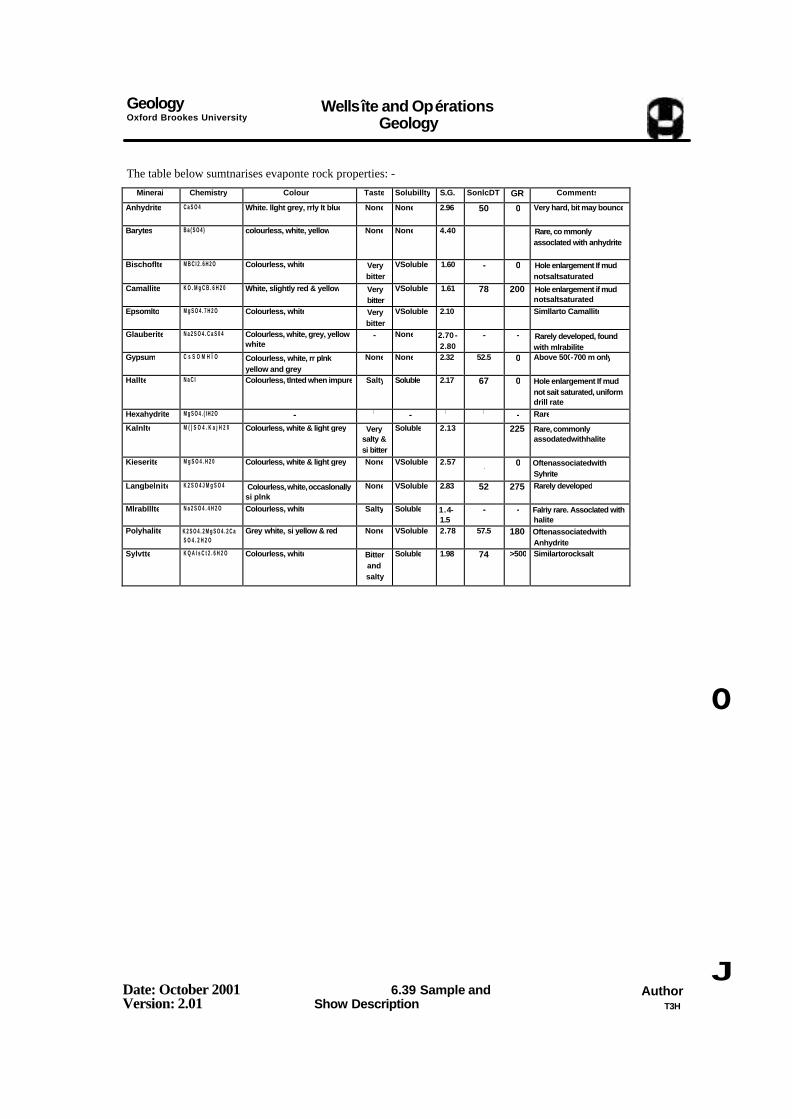
Geology Oxford Brookes University
Wellsîte and Opérations Geology
The table below sumtnarises evaponte rock properties: -
Minerai Chemistry Colour Taste Solubillty S.G. SonlcDT GR Comments Anhydrite C a S O 4 White. llght grey, rrly It blue None None 2.96 50 0 Very hard, bit may bounce
Barytes B a ( S O 4 ) colourless, white, yellow None None 4.40 Rare, co mmonly assoclated with anhydrite
Bischoflte M B C I 2 . 6 H 2 O Colourless, white Very bitter
VSoluble 1.60 - 0 Hole enlargement If mud notsaltsaturated
Camallite K O . M g C B . 6 H 2 0 White, slightly red & yellow Very bitter
VSoluble 1.61 78 200 Hole enlargement if mud notsaltsaturated
Epsomlto M g S O 4 . 7 H 2 O Colourless, white Very bitter
VSoluble 2.10 Simllarto Camallite
Glauberite N a 2 S O 4 . C a S 0 4 Colourless, white, grey, yellow white
- None 2.70 -2.80
- - Rarely developed, found with mlrabilite
Gypsum C s S O M H Î O Colourless, white, rr plnk yellow and grey
None None 2.32 52.5 0 Above 500-700 m only
Hallte N a C I Colourless, tlnted when impure Salty Soluble 2.17 67 0 Hole enlargement If mud not sait saturated, uniform drill rate
Hexahydrite M g S O 4 . ( I H 2 O - ¦ - ¦ ¦ - Rare Kalnlte M ( | S O 4 . K a j H 2 0 Colourless, white & light grey Very
salty & si bitter
Soluble 2.13 225 Rare, commonly assodatedwithhalite
Kieserite M g S O 4 . H 2 0 Colourless, white & light grey None VSoluble 2.57 - 0 Oftenassociatedwith
Syhrite Langbelnite K 2 S O 4 J M g S O 4 Colourless, white, occaslonally
si plnk None VSoluble 2.83 52 275 Rarely developed
Mlrablllte N a 2 S O 4 . 4 H 2 O Colourless, white Salty Soluble 1.4-1.5
- - Falriy rare. Assoclated with halite
Polyhalite K 2 S O 4 . 2 M g S O 4 . 2 C a S O 4 . 2 H 2 O
Grey white, si yellow & red None VSoluble 2.78 57.5 180 Oftenassociatedwith Anhydrite
Sylvtte K Q A I s C t 2 . 6 H 2 O Colourless, white Bitter and salty
Soluble 1.98 74 >500 Similartorocksalt
o
Date: October 2001 Version: 2.01
6.39 Sample and Show Description
Author T3H
J
Geology Oxford Brookes University
Wellsite and Opérations Geology
6.6.3 Barium Chloride Test for Anhydrite and Gypsum
Requirements:- aean test tube Distilled water Dilute Hydrochloric acid FilterPaper Barium Chloride
The présence of either anhy drite and gypsum can be confirmed by the following test:
1. Pick out several good cuttings from the sample and place them in a test tube.
2. Fill the test tube with distilled water and wash the grains thoroughiy by shaking the test tube vigorously.
3. Pour offthe water and then repeat the washing séquence again.
4. Add dilute hydrochloric acid.
5. Shake the test tube vigorously.
6. Filter the solution
7. Add two drops of barium chloride.
8. The présence of calcium sulphate (indicative of anhydrite or gypsum) will be confirmed by t he appearance of a pearly white discoloration of the fluid.
6.6.4 Evaporation Test for Anhydrite and Gypsum
Requirements:- Clean evaporatmg dish Distilled water Dilute Hydrochloric acid SmaUheater
The présence of either anhydrite and gypsum can be confirmed by the following test:-
1. Wash a small quantity of cuttings in distilled water.
2. Dissolve the cuttings in dilute hydrocbloric acid in an evaporating dish.
3. Put the dish on a small heater or other warm surface.
4. If calcium sulphate is présent a small rim of acicular crystals will develop.
Date: October 2001 Version: 2.01
6.40 Sample and Show Description
Author TJH

Geology Oxford Brookes University
Wellsite and Opérations Geology
6.6.5 Chert
Cherts are very hard chemicaliy derived rocks and can impact on drilling opérations. Chert is, cryptocrystalline, very hard and very brittle, with conchoidal fracture and, typically, large sharp cuttings. The colour of chert is indicative of its depositional environment:
Diatomaceous and radiolarlan chert Black to grey - argillaceous Spiculiferous chert Light to médium grey brown and green.
If chert is found in sample the wellsite geologist should inform the drilling supervisor straight away. Chert can dramatically reduce the life of ail types of bit as it is so abrasive.
Date: October 2001 Version: 2.01
6.41 Sample and Show Description
Author T3H
J
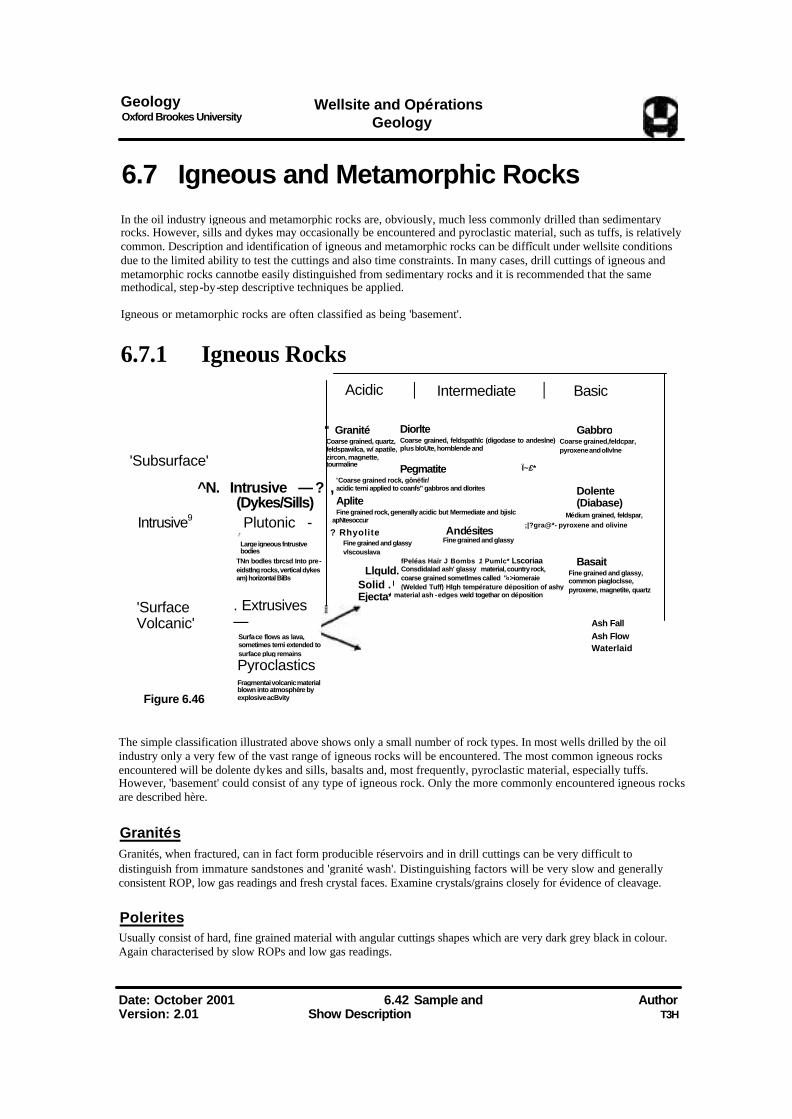
Geology Oxford Brookes University
Wellsite and Opérations Geology
6.7 Igneous and Metamorphic Rocks
In the oil industry igneous and metamorphic rocks are, obviously, much less commonly drilled than sedimentary rocks. However, sills and dykes may occasionally be encountered and pyroclastic material, such as tuffs, is relatively common. Description and identification of igneous and metamorphic rocks can be diffîcult under wellsite conditions due to the limited ability to test the cuttings and also time constraints. In many cases, drill cuttings of igneous and metamorphic rocks cannotbe easily distinguished from sedimentary rocks and it is recommended that the same methodical, step-by-step descriptive techniques be applied.
Igneous or metamorphic rocks are often classified as being 'basement'.
6.7.1 Igneous Rocks
Acidic Intermediate Basic
'Subsurface'
Intrusive9
'Surface Volcanic'
Figure 6.46
Plutonic - r Large igneous fntrustve bodies
TNn bodles tbrcsd Into pre-eidstlng rocks, vertical dykes am) horizontal BiBs
. Extrusives —
Surface flows as lava, sometimes terni extended to surface plug remains Pyroclastics Fragmentai volcanic material blown into atmosphère by explosive acBvity
Diorlte Coarse grained, feldspathlc (digodase to andeslne) plus bloUte, hornblende and
Pegmatite 'Coarse grained rock, gônëfir/ acidic terni applied to coanfs" gabbros and dlorites Aplite Fine grained rock, generally acidic but Mermediate and bjislc
apNtesoccur ? Rhyolite
Fine grained and glassy vlscouslava
fPeléas Haïr J Bombs 1 Pumlc* Lscoriaa Consdidalad ash' glassy material, country rock, coarse grained sometlmes called "«>iomeraie (Welded Tuff) Hlgh température déposition of ashy
material ash - edges weld togethar on déposition
The simple classification illustrated above shows only a small number of rock types. In most wells drilled by the oil industry only a very few of the vast range of igneous rocks will be encountered. The most common igneous rocks encountered will be dolente dykes and sills, basalts and, most frequently, pyroclastic material, especially tuffs. However, 'basement' could consist of any type of igneous rock. Only the more commonly encountered igneous rocks are described hère.
Granités
Granités, when fractured, can in fact form producible réservoirs and in drill cuttings can be very difficult to distinguish from immature sandstones and 'granité wash'. Distinguishing factors will be very slow and generally consistent ROP, low gas readings and fresh crystal faces. Examine crystals/grains closely for évidence of cleavage.
Polerites Usually consist of hard, fine grained material with angular cuttings shapes which are very dark grey black in colour. Again characterised by slow ROPs and low gas readings.
Date: October 2001 Version: 2.01
6.42 Sample and Show Description
Author T3H
" Granité Coarse grained, quartz, feldspawilca, w/ apatile, zircon, magnette, tourmaline
Gabbro Coarse grained,feldcpar, pyroxene and ollvlne
^N. Intrusive — ? , (Dykes/Sills)
Dolente (Diabase)
Médium grained, feldspar, ;|?gra@*- pyroxene and olivine
Basait Fine grained and glassy, common piagloclsse, pyroxene, magnetite, quartz
Ash Fall Ash Flow Waterlaid
Ï~£*
Andésites Fine grained and glassy
Llquld. Ejecta Solid .
Ejecta*
Geology Wellsite and Opérations Oxford Brookes University —, ¦
Geology
Tuffs Tuffs consist of consolidated ash derived from volcanoes by explosive force and may bave been deposited as ash falls, in aerial flows or laid down in water. Essentially they are clastic deposits and the descriptive séquence for clastics should be followed. They can be aerially extensive and being the resuit of relatively short -lived phenomena can form good 'marker horizons' for corrélation. Tuffs generally consist of volcanic glass, lava, crystals, fragments of 'country rock* but are often altered by subséquent déposition and diagenesis. The rocks tend to de-vitrify and become silica cemented and bentonite is a common breakdown product.
Thus, tuffs can be very variable in colour and grain size. They are commonly described as grey through blue grey and green grey, speckled black and white with glassy shards and globules. Grain size can vary from very fine through to coarse. More often than not they hâve been deposited and re-worked with sands and clays and tuffaceous sandstones and claystones may be encountered depending on the environment of déposition.
6.7.2 Metamorphic Rocks
Again metamorphic rocks are not normally encountered in oil industry wells as the conditions for their formation are not conducive for the présence of hydrocarbons. Metamorphic rocks form due to a combination of heat and pressure and can be subdivided into two main catégories
Contact Metamorphism Local metamorphism caused by proximity to a spécifie source of heat or pressure, e.g. intrusion or thrust fault zone etc.
Régional Metamorphism Régional scale event caused by major tectonism such as subduction zone
Contact metamorphism will occur around intrusions. Look out for minéralisation of sedimentary rocks.
Régional metamorphism (Greenschist faciès) starts at températures of 350 to 500°F (176 to 260 °C). It will affect rock texture and causes a green colouration caused by appearance of chlorite, epidote and actinolite.
Date: October 2001 6.43 Author Version: 2.01 Sample and Show Description TJH
J
J
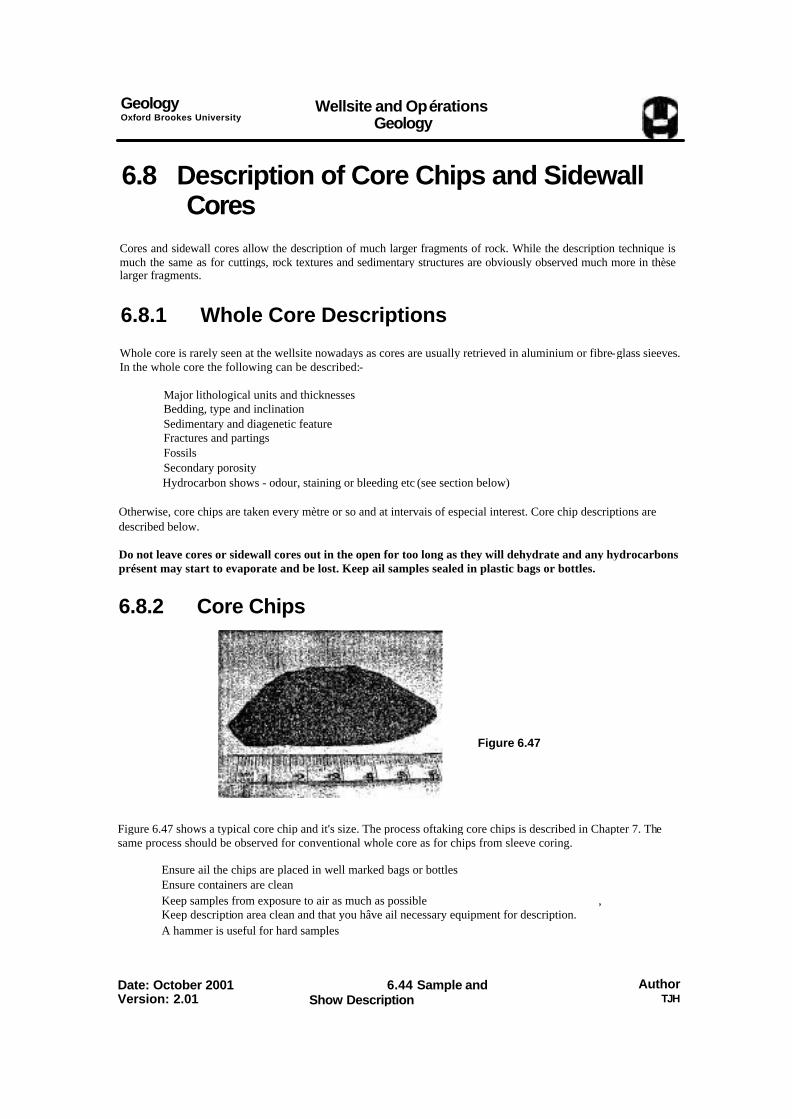
Geology Oxford Brookes University
Wellsite and Opérations Geology
6.8 Description of Core Chips and Sidewall Cores
Cores and sidewall cores allow the description of much larger fragments of rock. While the description technique is much the same as for cuttings, rock textures and sedimentary structures are obviously observed much more in thèse larger fragments.
6.8.1 Whole Core Descriptions
Whole core is rarely seen at the wellsite nowadays as cores are usually retrieved in aluminium or fibre-glass sieeves. In the whole core the following can be described:-
Major lithological units and thicknesses Bedding, type and inclination Sedimentary and diagenetic feature Fractures and partings Fossils Secondary porosity Hydrocarbon shows - odour, staining or bleeding etc (see section below)
Otherwise, core chips are taken every mètre or so and at intervais of especial interest. Core chip descriptions are described below.
Do not leave cores or sidewall cores out in the open for too long as they will dehydrate and any hydrocarbons présent may start to evaporate and be lost. Keep ail samples sealed in plastic bags or bottles.
6.8.2 Core Chips
Figure 6.47
Figure 6.47 shows a typical core chip and it's size. The process oftaking core chips is described in Chapter 7. The same process should be observed for conventional whole core as for chips from sleeve coring.
Ensure ail the chips are placed in well marked bags or bottles Ensure containers are clean Keep samples from exposure to air as much as possible , Keep description area clean and that you hâve ail necessary equipment for description. A hammer is useful for hard samples
Date: October 2001 Version: 2.01
6.44 Sample and Show Description
Author TJH
Geology Wellsite and Opérations Oxford Brookes University _ .
Geology
Ouïck-look Description During coring opérations time is generally short and office based personnel are keen to fmd out the results of coring. The opérations geologist will be constantly being asked 'what does the core look like?' etc. and, in turn, will be calling the wellsite geologist. To alleviate this pressure it is useful to carry out a 'quick-look' review of the core samples and to write a short report on the essentials of the sample. A full description will take many hours if done correctly but the quick-look report will contain the essentials only:
• Lithotype, i.e. Sandstone, Limestone. • Grain size (if pertinent) • Permeability/porosity estimate (visual only) • Fluorescence (quick eut évaluation if time)
This information should be treated as prelùninary and should be emphasised on any transmission. The detailed description may reveal subtle shows or porosity and pertneability that cannot be seen on any 'quick-look'.
NOTE: Quickly replace ail core chips in bags to stop them de-hydrating. If necessary put chips into new, clean well-marked bags. This is especially so when oil-based mud is used as the bags get covered in OBM and the markings rub off. It also helps to minimise contamination of the samples.
Detailed Description A detailed description, especially when there are shows, can take some time. For a 30 m core with lm core chip samples the total description time may be 4 hours or so. Before starting the main description:
• Ensure ail the trays, spot trays, prods and tweezers are clean and you hâve ail the necessary equipment and plentiful supply of chemicals
• You might need a hammer for hard core chips • Make sure the description area is clear and you hâve plenty of room to spread out.
When carrying out the main description view the whole core chip and break off a small représentative chip for microscope work.
Look at the core chip as a whole: • Are there any structures or sedimentary fabric visible, • Bioturbation, cross-lamination, fossils, rootlets etc? • Annotate your core description sheet, with diagrams if required. N • Break off a pièce of the core chip for descriptive proposes, _) • Keep the rest wrapped up in the bagso that it does not de-hydrate.
Place the chip on a métal sample tray. • Make a note of any gross features observable under low and then high magnification. • Systematically describe each sample looking at each property in turn. • Try not to use 'As Above', is the sample really the same?
Porosity and Permeability Porosity and permeability are also slightly easier to evaluate with whole rock samples. Put a spot of distilled water on a flat surface of the sample and see how long it takes to sink in. If it is fast then permeability and porosity are very good, if slow then, at least, permeability is poor. Remember, however, this is not a définitive test.
Shows Take a small pièce of sample and place on a spot tray. Put under UV light and check for shows. Carefully describe àll aspects of shows as described later in this chapter. Remember to describe the amount degree and colour of oil staining, fluorescence and eut for each chip. In the case of patchy show development more than one solvent eut analysis may be required for each core chip. It is sometimes bénéficiai to methodically place show samples in order on spot tray so that the variations in shows through the core can be assessed. x
Date: October 2001 6.45 Author Version: 2.01 Sample and Show Description TJH
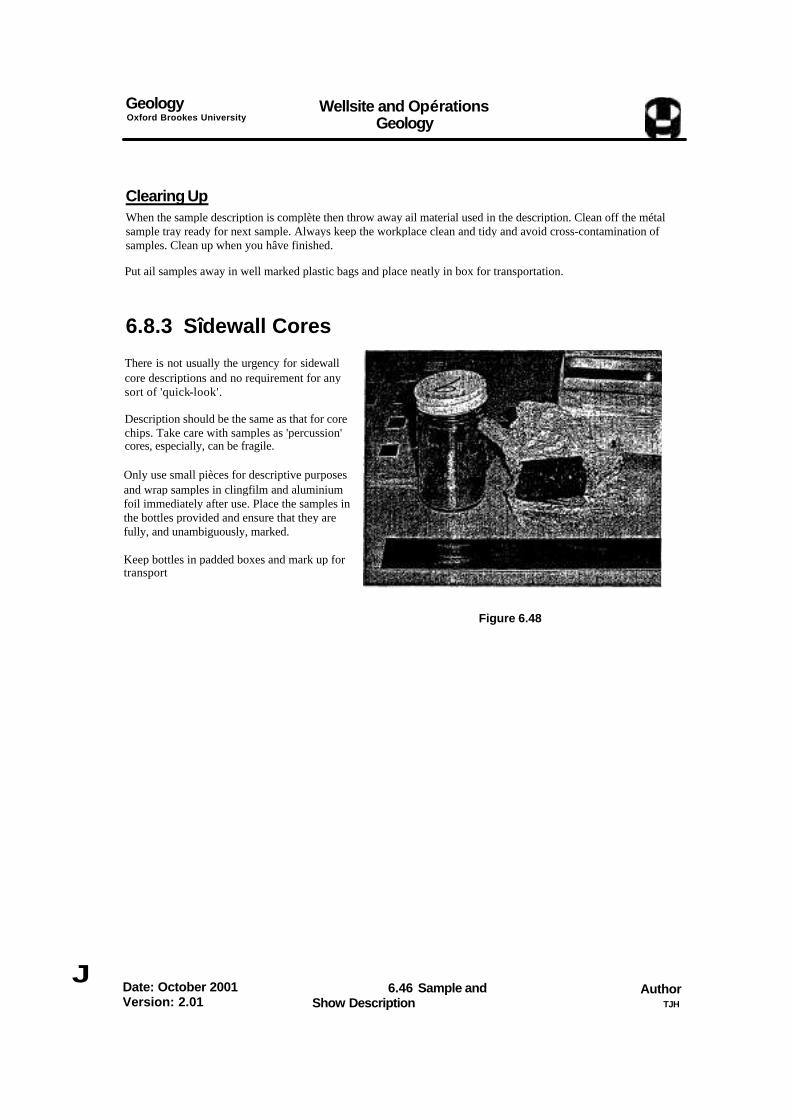
Geology Oxford Brookes University
Wellsite and Opérations Geology
Clearing Up
When the sample description is complète then throw away ail material used in the description. Clean off the métal sample tray ready for next sample. Always keep the workplace clean and tidy and avoid cross-contamination of samples. Clean up when you hâve finished.
Put ail samples away in well marked plastic bags and place neatly in box for transportation.
6.8.3 Sîdewall Cores
There is not usually the urgency for sidewall core descriptions and no requirement for any sort of 'quick-look'.
Description should be the same as that for core chips. Take care with samples as 'percussion' cores, especially, can be fragile.
Only use small pièces for descriptive purposes and wrap samples in clingfilm and aluminium foil immediately after use. Place the samples in the bottles provided and ensure that they are fully, and unambiguously, marked.
Keep bottles in padded boxes and mark up for transport
Figure 6.48
J Date: October 2001 Version: 2.01
6.46 Sample and Show Description
Author TJH
Geology Oxford Brookes University
Wellsite and Opérations Geology
6.9 The Description of Oil and Gas Shows
One ofthe most important duties ofthe wellsite geologist is to systematically examine ail samples for hydrocarbon shows. This following subsections:-
• Define a show • Give an overview of factors which influence shows • Describe gas shows and how to evaluate them • Describe oil shows and how to evaluate them
6.9.1 What is a Show?
Définition
A 'show' may be defined as the présence of hydrocarbons, as liquid or gas, in the cuttings or drilling fluid returned to the surface. A proper show means 'significant' amounts of hydrocarbon and not just a few ppm of Cl. Defining 'significant' is not easy as it will vary from well to well. Expérience will teach you what is significant and thèse subsections try to give some background information on this.
Factors which Influence a Show: A number of factors are known to influence a show:-
Factor Description Rock Properties The type and magnitude ofthe porosity and permeability greatly influence the magnitude or amount of any show.
Highly porous and perméable rocks are rapidly and often completely flushed by the mud filtrate so there may be a large show in the mud stream, detected by oil in the pits, while the cuttings will hâve very little residual oil and only a poor show. Imperméable rocks tend to retain their formation fluids throughout the drilling process so there will be a small show in the mud stream but a comparatively better show in the ditch samples. Vuggy or fracture porosity bas a very high penneability coupled with a very simple pore geometry. This type of rock may be flushed almost entirely of its contained fluids the instant it is penetrated so that the shows will be quite small, even for good producing intervais.
Type of Hydrocarbon In gênerai, heavy oil will be flushed léss easily tha n light oils or gas. The in-situ réservoir conditions will govem the gas-in-mud and oil-in-mud concentration. Solution of large amounts of gas in oil will resuit in shrinkage ofthe oil, diminishing the amount that will enter the mud. Dry gas and distillate réservoirs are difficult to evaluate because ofthe lack of oil in either the mud or the cuttings. For thèse, a chromatographic analysis ofthe mud gas is very useful. An oil réservoir is easier to detect because the cuttings provide direct évidence.
Drilling Rate The magnitude ofthe show in the drilling mud will be directly propoitional to the rate of pénétration because this rate governs the rate at which hydrocarbons are added to the mud stream. A rapid pénétration rate reduces the rime the formation is subjected to the differential pressure that may exist between the mud and formation fluids, thereby diminisbing the flushing effect
Density and Viscosity ofthe Drilling Fluid
The greater the density ofthe drilling fluid, the greater will be the pressure differential existing between the mud and die formation fluid pressure, resulting in increased flushing action. Jet drilling bits also increase the flushing action. If the mud is too light, there will be a tendency for the formation up the hole to bleed gas into the mud and pro vide an undesirable background of gas. When the mud has a high viscosity, the release ofthe gas from the mud at surface is inhibited. If the mud is not de-gassed efficiently, the gas détecter will show a large and persistent background reading that may obscure a genuine show. If the gas in the mud continues to build up, the gas détecter may eventually become saturated and thus not be able to loganyjiew shows.
Depthof the Well A deep well is usually associated with high pressure differentials and slow drilling rates, both of which will reduce the magnitude of any shows. In deep wells the hole size is usually smaller so that less rock is pulverised per meter of pénétration. Circulation rimes are longer in deep wells, resulting in greater chances for mixing and dilution of hydrocarbons in the cuttings.
Miscellaneous Drilling Conditions
Occasionally the geologist will encounter an anomalous show, i.e. one that just does not seem valid. For gas shows, suspect the addition of some chemicals or diesel oil to the mud. Some additives used in the mud may cause it to foam.
J
Date: October 2001 Version: 2.01
6.47 Sample and Show Description
Author TJH
J
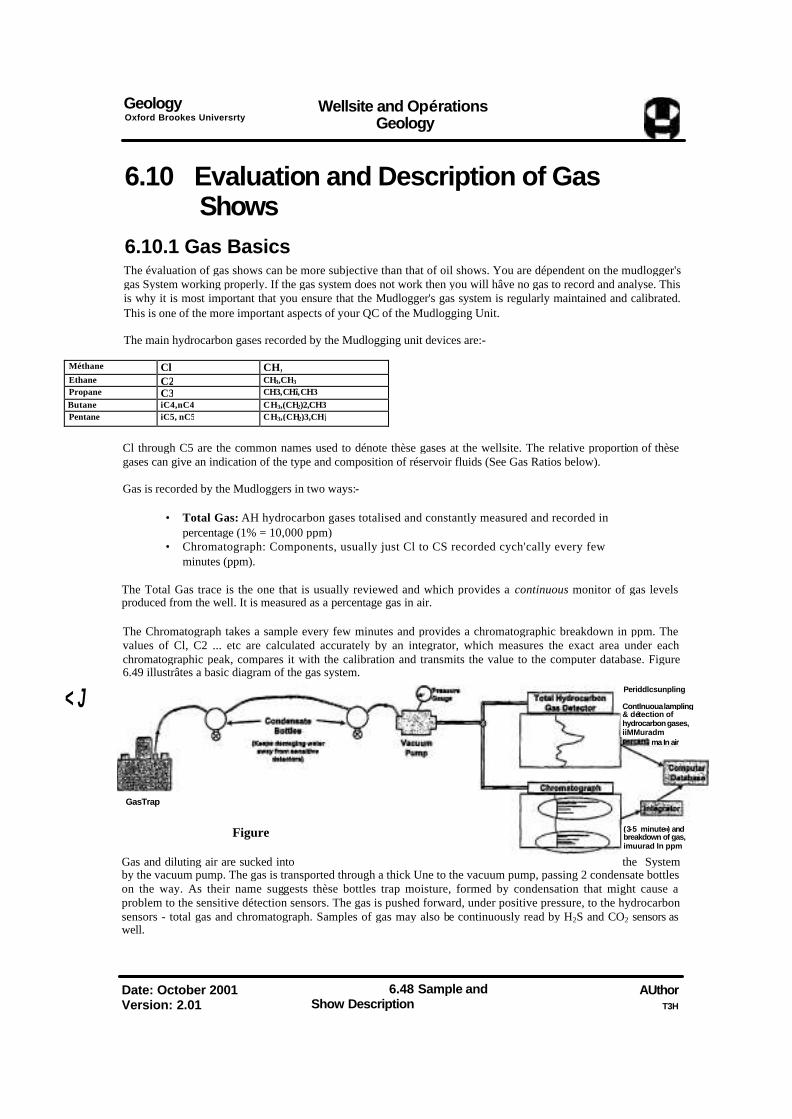
Geology Oxford Brookes Universrty
Wellsite and Opérations Geology
6.10 Evaluation and Description of Gas Shows
6.10.1 Gas Basics
The évaluation of gas shows can be more subjective than that of oil shows. You are dépendent on the mudlogger's gas System working properly. If the gas system does not work then you will hâve no gas to record and analyse. This is why it is most important that you ensure that the Mudlogger's gas system is regularly maintained and calibrated. This is one of the more important aspects of your QC of the Mudlogging Unit.
The main hydrocarbon gases recorded by the Mudlogging unit devices are:-
Méthane Cl CH, Ethane C2 CH3,CH3 Propane C3 CH3, CHî, CH3 Butane iC4,nC4 CH3,(CH2)2,CH3 Pentane iC5, nC5 CH3,(CH2)3,CHj
Cl through C5 are the common names used to dénote thèse gases at the wellsite. The relative proportion of thèse gases can give an indication of the type and composition of réservoir fluids (See Gas Ratios below).
Gas is recorded by the Mudloggers in two ways:-
• Total Gas: AH hydrocarbon gases totalised and constantly measured and recorded in percentage (1% = 10,000 ppm)
• Chromatograph: Components, usually just Cl to CS recorded cych'cally every few minutes (ppm).
The Total Gas trace is the one that is usually reviewed and which provides a continuous monitor of gas levels produced from the well. It is measured as a percentage gas in air.
The Chromatograph takes a sample every few minutes and provides a chromatographic breakdown in ppm. The values of Cl, C2 ... etc are calculated accurately by an integrator, which measures the exact area under each chromatographic peak, compares it with the calibration and transmits the value to the computer database. Figure 6.49 illustrâtes a basic diagram of the gas system.
< J Periddlcsunpling
(3-5 minute») and breakdown of gas, imuurad In ppm
Gas and diluting air are sucked into the System by the vacuum pump. The gas is transported through a thick Une to the vacuum pump, passing 2 condensate bottles on the way. As their name suggests thèse bottles trap moisture, formed by condensation that might cause a problem to the sensitive détection sensors. The gas is pushed forward, under positive pressure, to the hydrocarbon sensors - total gas and chromatograph. Samples of gas may also be continuously read by H2S and CO2 sensors as well.
Date: October 2001 Version: 2.01
6.48 Sample and Show Description
AUthor T3H
Contlnuoua lampling & détection of hydrocarbon gases, iiMMuradm
ma In air
GasTrap
Figure
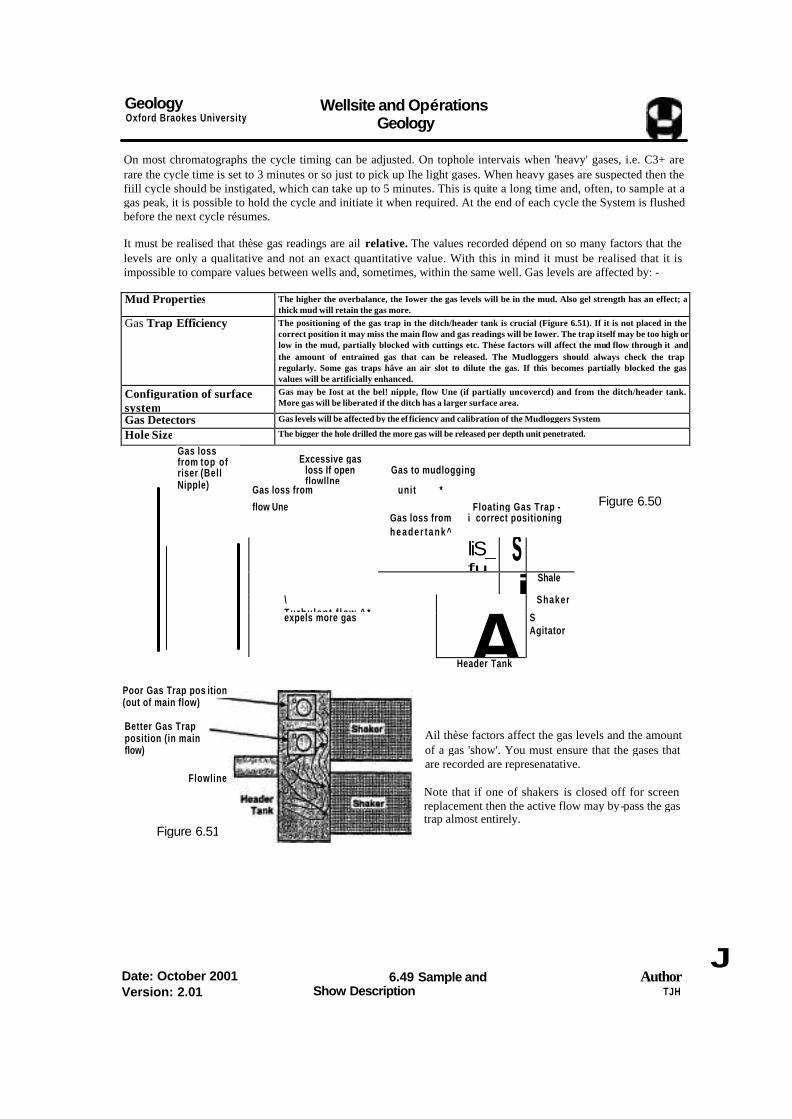
Geology Oxford Braokes University
Wellsite and Opérations Geology
On most chromatographs the cycle timing can be adjusted. On tophole intervais when 'heavy' gases, i.e. C3+ are rare the cycle time is set to 3 minutes or so just to pick up Ihe light gases. When heavy gases are suspected then the fiill cycle should be instigated, which can take up to 5 minutes. This is quite a long time and, often, to sample at a gas peak, it is possible to hold the cycle and initiate it when required. At the end of each cycle the System is flushed before the next cycle résumes.
It must be realised that thèse gas readings are ail relative. The values recorded dépend on so many factors that the levels are only a qualitative and not an exact quantitative value. With this in mind it must be realised that it is impossible to compare values between wells and, sometimes, within the same well. Gas levels are affected by: -
Mud Properties The higher the overbalance, the Iower the gas levels will be in the mud. Also gel strength has an effect; a thick mud will retain the gas more.
Gas Trap Effîciency The positioning of the gas trap in the ditch/header tank is crucial (Figure 6.51). If it is not placed in the correct position it may miss the main flow and gas readings will be Iower. The trap itself may be too high or low in the mud, partially blocked with cuttings etc. Thèse factors will affect the mud flow through it and the amount of entrained gas that can be released. The Mudloggers should always check the trap regularly. Some gas traps hâve an air slot to dilute the gas. If this becomes partially blocked the gas values will be artificially enhanced.
Configuration of surface system
Gas may be Iost at the bel! nipple, flow Une (if partially uncovercd) and from the ditch/header tank. More gas will be liberated if the ditch has a larger surface area.
Gas Detectors Gas levels will be affected by the ef ficiency and calibration of the Mudloggers System. Hole Size The bigger the hole drilled the more gas will be released per depth unit penetrated.
Gas loss from top of riser (Bell Nipple)
Excessive gas loss If open flowllne
Gas to mudlogging
Gas loss from unit * flow Une Floating Gas Trap - Gas loss from i correct positioning h e a d e r t a n k ^ liS_
fu s
il
Shale
\ Turbu len t f low ^ *
Shaker expels more gas A
S Agitator
Header Tank
Figure 6.50
Poor Gas Trap pos ition (out of main flow)
Better Gas Trap position (in main flow)
Flowline
Ail thèse factors affect the gas levels and the amount of a gas 'show'. You must ensure that the gases that are recorded are represenatative.
Note that if one of shakers is closed off for screen replacement then the active flow may by-pass the gas trap almost entirely.
Date: October 2001 Version: 2.01
6.49 Sample and Show Description
Author TJH
J
Figure 6.51

Geology Wellsite and Opérations Oxford Brookes University _ , Geology
6.10.2 Représentative Gas Values
How can we assure that we hâve représentative gas values? Although the mudlogger is responsible the wellsite geologist should:
At beginning of well check that the gas trap is optimally placed Penodically check that gas trap height is optimal (even if floating type) Penodically check that gas line to unit is OK and vacuum pump is working - no leaks that may dilute the sample - and that condensation bottles are closed Check that gas system caUbrations are carried out Check that gas peaks are reported consistently
Date: October 2001 6.50 Author Version: 2.01 Sample and Show Description HH
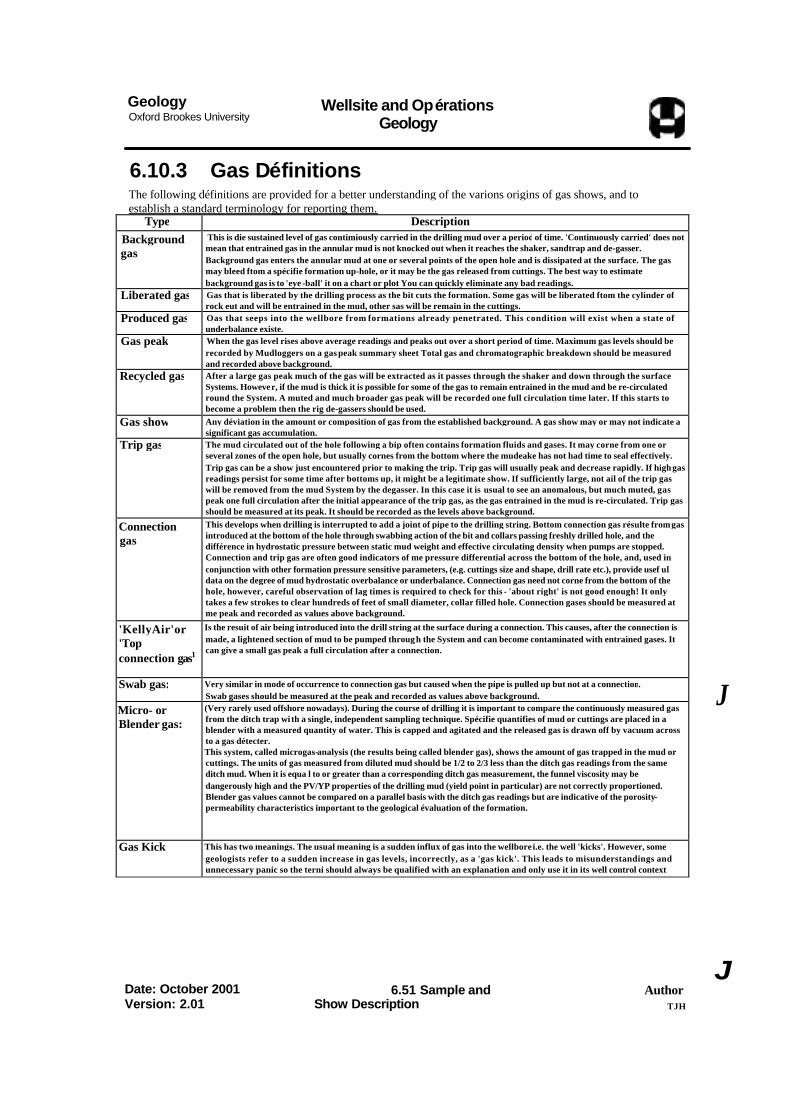
Geology Oxford Brookes University
Wellsite and Opérations Geology
6.10.3 Gas Définitions
The following définitions are provided for a better understanding of the varions origins of gas shows, and to establish a standard terminology for reporting them.
Type Description Background gas
This is die sustained level of gas contimiously carried in the drilling mud over a period of time. 'Continuously carried' does not mean that entrained gas in the annular mud is not knocked out when it reaches the shaker, sandtrap and de-gasser. Background gas enters the annular mud at one or several points of the open hole and is dissipated at the surface. The gas may bleed ftom a spécifie formation up-hole, or it may be the gas released from cuttings. The best way to estimate background gas is to 'eye -ball' it on a chart or plot You can quickly eliminate any bad readings.
Liberated gas Gas that is liberated by the drilling process as the bit cuts the formation. Some gas will be liberated ftom the cylinder of rock eut and will be entrained in the mud, other sas will be remain in the cuttings.
Produced gas Oas that seeps into the wellbore from formations already penetrated. This condition will exist when a state of underbalance existe.
Gas peak When the gas level rises above average readings and peaks out over a short period of time. Maximum gas levels should be recorded by Mudloggers on a gas peak summary sheet Total gas and chromatographic breakdown should be measured and recorded above background.
Recycled gas After a large gas peak much of the gas will be extracted as it passes through the shaker and down through the surface Systems. However, if the mud is thick it is possible for some of the gas to remain entrained in the mud and be re-circulated round the System. A muted and much broader gas peak will be recorded one full circulation time later. If this starts to become a problem then the rig de-gassers should be used.
Gas show Any déviation in the amount or composition of gas from the established background. A gas show may or may not indicate a significant gas accumulation.
Trip gas The mud circulated out of the hole following a bip often contains formation fluids and gases. It may corne from one or several zones of the open hole, but usually cornes from the bottom where the mudeake has not had time to seal effectively. Trip gas can be a show just encountered prior to making the trip. Trip gas will usually peak and decrease rapidly. If high gas readings persist for some time after bottoms up, it might be a legitimate show. If sufficiently large, not ail of the trip gas will be removed from the mud System by the degasser. In this case it is usual to see an anomalous, but much muted, gas peak one full circulation after the initial appearance of the trip gas, as the gas entrained in the mud is re-circulated. Trip gas should be measured at its peak. It should be recorded as the levels above background.
Connection gas
This develops when drilling is interrupted to add a joint of pipe to the drilling string. Bottom connection gas résulte from gas introduced at the bottom of the hole through swabbing action of the bit and collars passing freshly drilled hole, and the différence in hydrostatic pressure between static mud weight and effective circulating density when pumps are stopped. Connection and trip gas are often good indicators of me pressure differential across the bottom of the hole, and, used in conjunction with other formation pressure sensitive parameters, (e.g. cuttings size and shape, drill rate etc.), provide usef ul data on the degree of mud hydrostatic overbalance or underbalance. Connection gas need not corne from the bottom of the hole, however, careful observation of lag times is required to check for this - 'about right' is not good enough! It only takes a few strokes to clear hundreds of feet of small diameter, collar filled hole. Connection gases should be measured at me peak and recorded as values above background.
'KellyAir'or 'Top connection gas1
Is the resuit of air being introduced into the drill string at the surface during a connection. This causes, after the connection is made, a lightened section of mud to be pumped through the System and can become contaminated with entrained gases. It can give a small gas peak a full circulation after a connection.
Swab gas: Very similar in mode of occurrence to connection gas but caused when the pipe is pulled up but not at a connection. Swab gases should be measured at the peak and recorded as values above background.
Micro- or Blender gas:
(Very rarely used offshore nowadays). During the course of drilling it is important to compare the continuously measured gas from the ditch trap wi th a single, independent sampling technique. Spécifie quantifies of mud or cuttings are placed in a blender with a measured quantity of water. This is capped and agitated and the released gas is drawn off by vacuum across to a gas détecter. This system, called microgas-analysis (the results being called blender gas), shows the amount of gas trapped in the mud or cuttings. The units of gas measured from diluted mud should be 1/2 to 2/3 less than the ditch gas readings from the same ditch mud. When it is equa l to or greater than a corresponding ditch gas measurement, the funnel viscosity may be dangerously high and the PV/YP properties of the drilling mud (yield point in particular) are not correctly proportioned. Blender gas values cannot be compared on a parallel basis with the ditch gas readings but are indicative of the porosity-permeability characteristics important to the geological évaluation of the formation.
Gas Kick This has two meanings. The usual meaning is a sudden influx of gas into the wellbore i.e. the well 'kicks'. However, some geologists refer to a sudden increase in gas levels, incorrectly, as a 'gas kick'. This leads to misunderstandings and unnecessary panic so the terni should always be qualified with an explanation and only use it in its well control context
J
Date: October 2001 Version: 2.01
6.51 Sample and Show Description
Author TJH
J
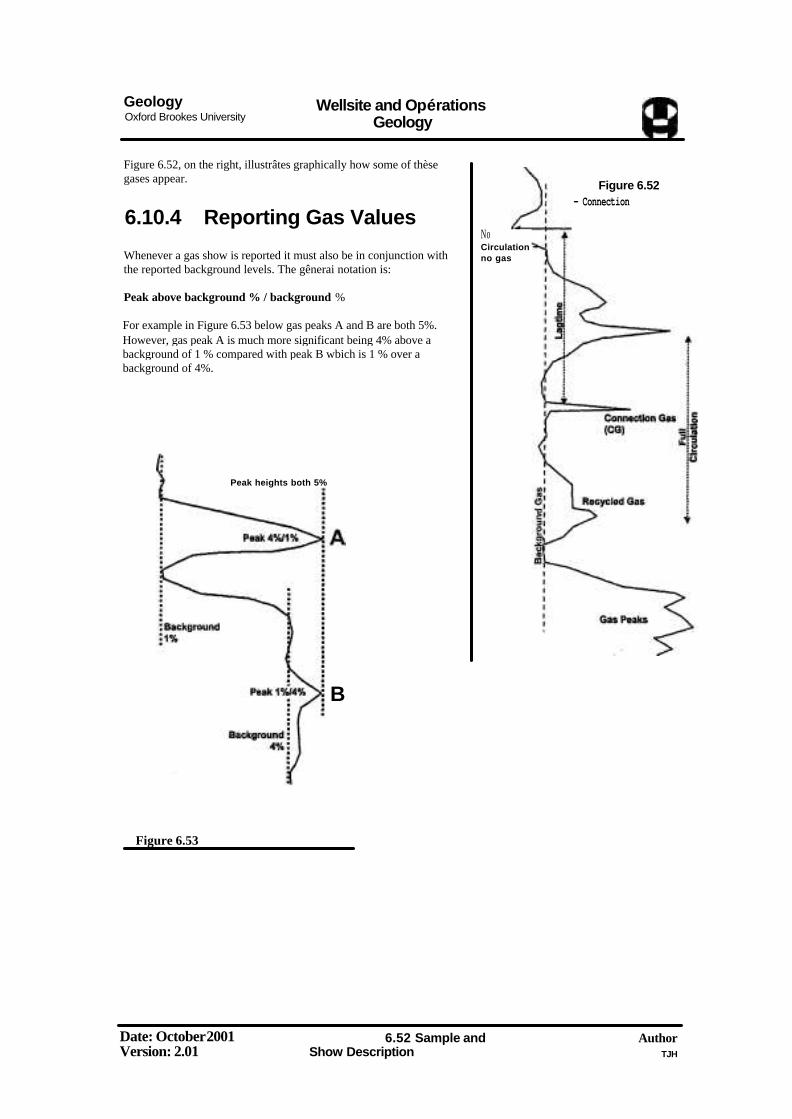
Geology Oxford Brookes University
Wellsite and Opérations Geology
Figure 6.52, on the right, illustrâtes graphically how some of thèse gases appear.
6.10.4 Reporting Gas Values
Whenever a gas show is reported it must also be in conjunction with the reported background levels. The gênerai notation is:
Peak above background % / background %
For example in Figure 6.53 below gas peaks A and B are both 5%. However, gas peak A is much more significant being 4% above a background of 1 % compared with peak B wbich is 1 % over a background of 4%.
Figure 6.53
Date: October 2001 Version: 2.01
6.52 Sample and Show Description
Author TJH
Figure 6.52 - Connection
No Circulation no gas
Peak heights both 5%
B
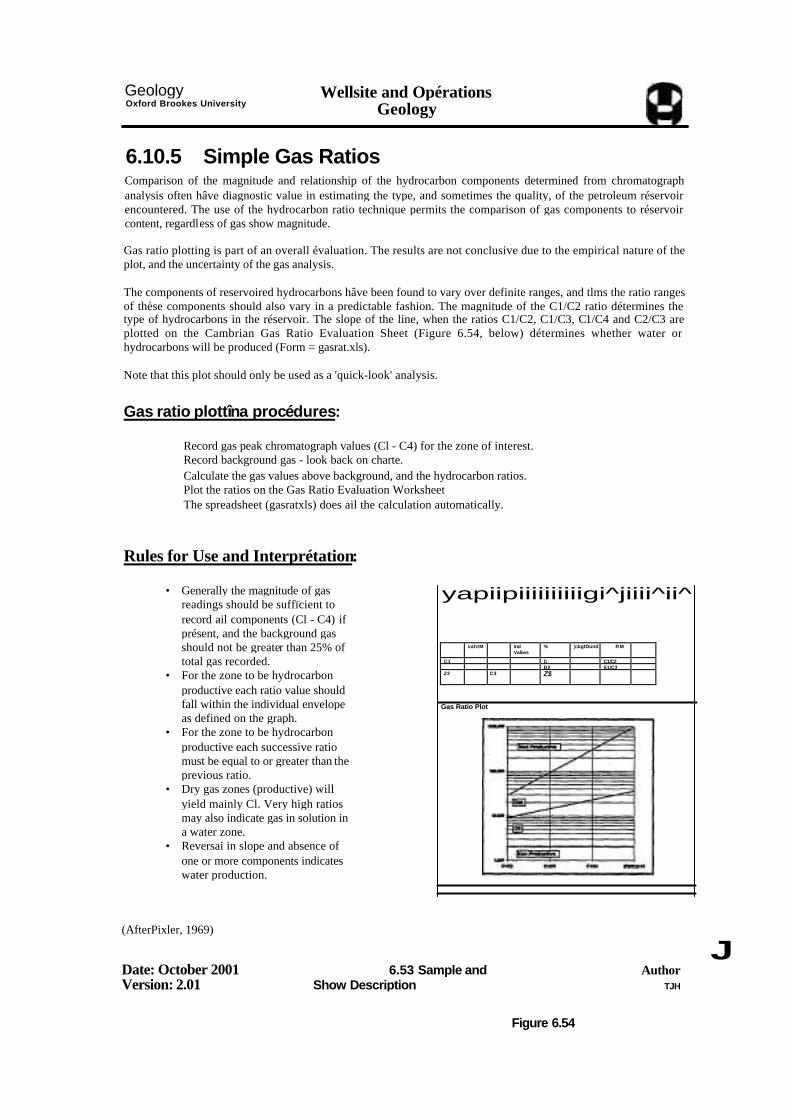
Geology Oxford Brookes University
Wellsite and Opérations Geology
6.10.5 Simple Gas Ratios
Comparison of the magnitude and relationship of the hydrocarbon components determined from chromatograph analysis often hâve diagnostic value in estimating the type, and sometimes the quality, of the petroleum réservoir encountered. The use of the hydrocarbon ratio technique permits the comparison of gas components to réservoir content, regardless of gas show magnitude.
Gas ratio plotting is part of an overall évaluation. The results are not conclusive due to the empirical nature of the plot, and the uncertainty of the gas analysis.
The components of reservoired hydrocarbons hâve been found to vary over definite ranges, and tlms the ratio ranges of thèse components should also vary in a predictable fashion. The magnitude of the C1/C2 ratio détermines the type of hydrocarbons in the réservoir. The slope of the line, when the ratios C1/C2, C1/C3, C1/C4 and C2/C3 are plotted on the Cambrian Gas Ratio Evaluation Sheet (Figure 6.54, below) détermines whether water or hydrocarbons will be produced (Form = gasrat.xls).
Note that this plot should only be used as a 'quick-look' analysis.
Gas ratio plottîna procédures:
Record gas peak chromatograph values (Cl - C4) for the zone of interest. Record background gas - look back on charte. Calculate the gas values above background, and the hydrocarbon ratios. Plot the ratios on the Gas Ratio Evaluation Worksheet The spreadsheet (gasratxls) does ail the calculation automatically.
Rules for Use and Interprétation:
• Generally the magnitude of gas readings should be suffïcient to record ail components (Cl - C4) if présent, and the background gas should not be greater than 25% of total gas recorded.
• For the zone to be hydrocarbon productive each ratio value should fall within the individual envelope as defined on the graph.
• For the zone to be hydrocarbon productive each successive ratio must be equal to or greater than the previous ratio.
• Dry gas zones (productive) will yield mainly Cl. Very high ratios may also indicate gas in solution in a water zone.
• Reversai in slope and absence of one or more components indicates water production.
yapiipiiiiiiiiiigi^jiiii^ii ̂
vahtM ind Valiws % ¦ckgtDund RM
C1 CI C1/C2 D2 S1/C3 23 C3 Z$
Gas Ratio Plot
(AfterPixler, 1969)
Date: October 2001 Version: 2.01
6.53 Sample and Show Description
Author TJH
J
Figure 6.54

Geology Oxford Brookes University
Wellsite and Opérations Geology
6.10.6 Mudlog Gas Ratios
The mudlogging companies ail hâve programs that will plot out gas ratios versus depth or for spécifie readings. Thèse help to interpret and identify réservoir type and productivité
The output is far superior to single page plots described in the previous section. They are continuous plots of chromatograph gas ratios and can give much more interprétative résulte. They will use also use différent terminology and produce différent styles of output You will still need to interpret thèse plots so make sure you understand the principles and resuite of their plots.
Baker Huahes Intea Gas Ratios Baker Hughes Inteq use the following:
Ratio Equation Notes Hydrocarbon Wetness Ratio (Wh)
C2 + C3 + C4 + C5 xlOO C1 + C2 + C3 + C4 + C5
Will increase with increase in oil and gas densities. Interprétation: Wh% Fluid Potential <0.5% Non Productive/dry gas 0.5 -17.5 Potential gas - Increasing density with increasing Wh% 0.5 - 17.5 Potential oil - Increasing density with increasing Wh% >40 Residual Oil Plotted in same track as Bh - Log scale
Hydrocarbon Balance Ratio (Bh)
C1+C2 C3 + C4 + C5
Relates to density of réservoir fluid, decreases with increase in fluid density Plotted in same track as Wh - Log Scale
Hydrocarbon Character Ratio (CH)
C4 + C5 Ci
Only used when excessive méthane is présent - this retards Wh and Bh values. If Ch > 0.5, gas/light oil or condensate is indicated. See steps interprétation steps below. Plotted in ifs own track - Linear scale.
Date: Octobar 2001 Version: 2.01
6.54 Sample and Show Description
Author TJH
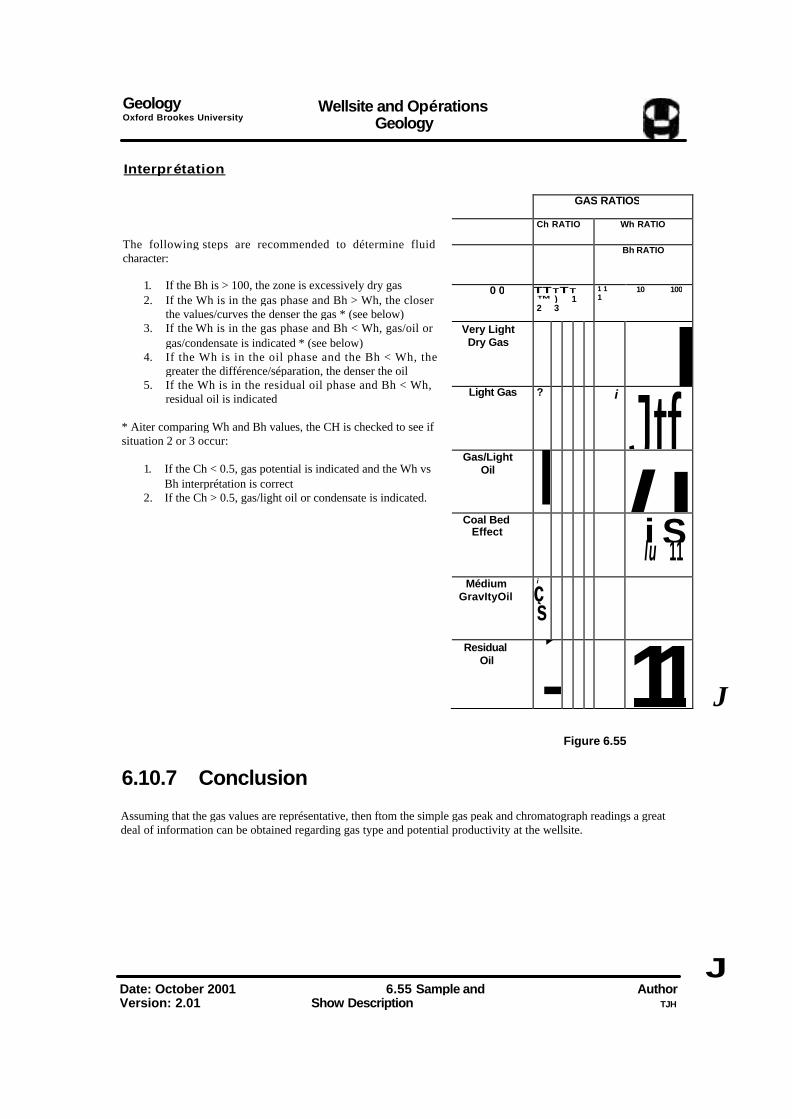
Geology Oxford Brookes University
Wellsite and Opérations Geology
Interprétation
The following steps are recommended to détermine fluid character:
1. If the Bh is > 100, the zone is excessively dry gas 2. If the Wh is in the gas phase and Bh > Wh, the closer
the values/curves the denser the gas * (see below) 3. If the Wh is in the gas phase and Bh < Wh, gas/oil or
gas/condensate is indicated * (see below) 4. If the Wh is in the oil phase and the Bh < Wh, the
greater the différence/séparation, the denser the oil 5. If the Wh is in the residual oil phase and Bh < Wh,
residual oil is indicated
* Aiter comparing Wh and Bh values, the CH is checked to see if situation 2 or 3 occur:
1. If the Ch < 0.5, gas potential is indicated and the Wh vs Bh interprétation is correct
2. If the Ch > 0.5, gas/light oil or condensate is indicated.
GAS RATIOS
Ch RATIO Wh RATIO
Bh RATIO
0 0 TTTTT™ ) 1 2 3
1 1 1
10 100
Very Light Dry Gas
ILight Gas ? i
JtfGas/Light Oil I
l I
Coal Bed Effect
i S
lu 11
Médium GravItyOil
i ç s
Residual Oil 1
11 J
Figure 6.55
6.10.7 Conclusion
Assuming that the gas values are représentative, then ftom the simple gas peak and chromatograph readings a great deal of information can be obtained regarding gas type and potential productivity at the wellsite.
J Date: October 2001 Version: 2.01
6.55 Sample and Show Description
Author TJH
Geology Oxford Brookes University
Wellsite and Opérations Geology
6.11 Evaluation and Description of Oil Shows Ali drilled samples should be routinely examined by the wellsite geologist for hydrocarbon shows. It is not sufficient to examine samples in ultra violet light only when hydrocarbons are anticipated - the geologist must get into the habit of inspecting every sample for fluorescence during the course of a well. This will not only avoid the risk of missing a subtle oil show, but will also help distinguish the characteristics of spurious oil shows from pipe dope and other mud contaminants, and with minerai fluorescence.
The wellsite geologist should be especially vigilant if the 'heavy gases', C3-C5 appear and start to increase in magnitude. Thèse are strong indicators of the présence of hydrocarbons.
Followed correctly, the systematic approach to show évaluation and description outlined below will ensure that ail the characteristics of a particular show are evaluated and described.
6.11.1 Show Characteristics There are a number of characteristics of a show that must be described: -
Oil in Mud Evaluate the présence of oil in the mud as well as the cuttings.
Microgas Analysis
Evaluate the hydrocarbons in tbe mud and sample using the Microgas System.
Odour Is there any hydrocarbon odour?
Oil staining and bleeding
Examine cuttings or core chips under naturel light and microscope. Is oil staining apparent
Fluorescence Check samples for uniformity, percentage, colour, and intensity of fluorescence under UV light.
Solvent eut Check rate colour and character of solvent cut fluorescence. Crush Cut Is there an improvement when the sample is crushed? Re-check
fluorescence and cut Residue Is there any residue? Note colour, fluorescence and amount
6.11.2 Equipment
To ensure quality show descriptions you will need to ensure that you hâve working equipment This needs to be checked well before it is used - if the UV box is not working it may take days to get another one to the wellsite. Make sure it Works well before you need it and check that there are spare UV bulbs. Other equipment that will be
required are good quality, clean spot trays. It is a good idea to wash ail spot trays with détergent before using them for show évaluation.
Figure 6.56
Date: October 2001 Version: 2.01
6.56 Sample and Show
Description
Author TJH
Figure 6.57
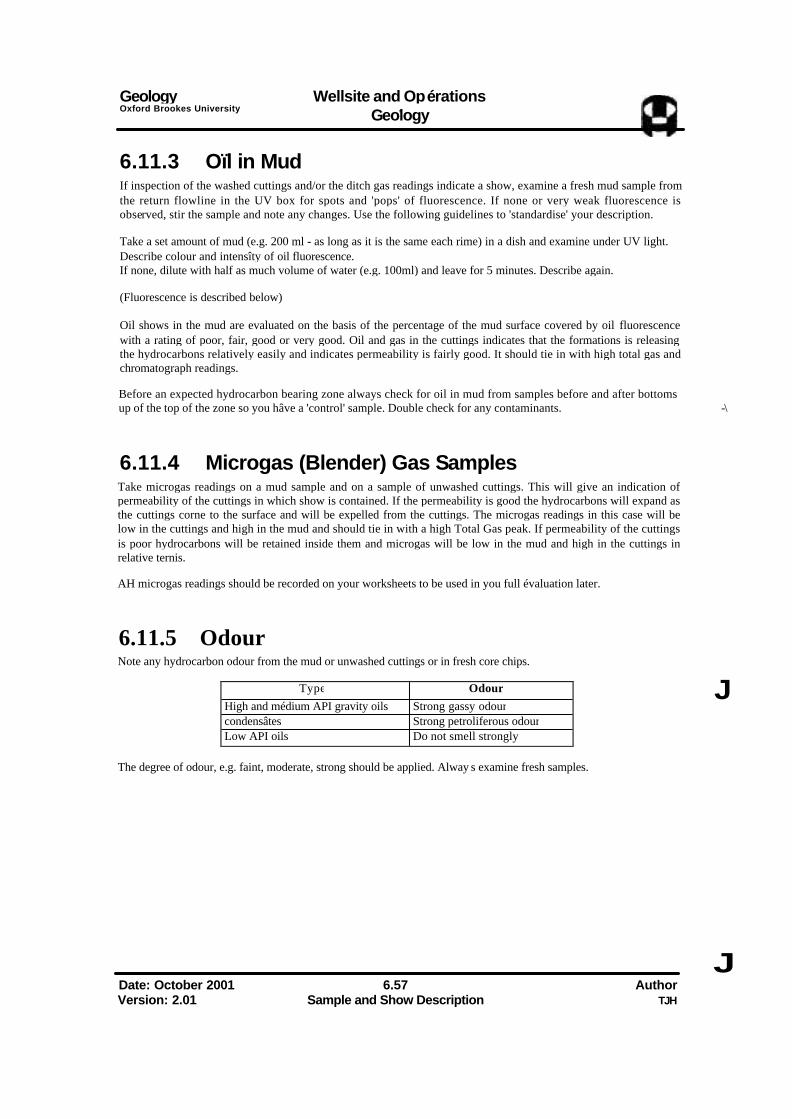
Geology Wellsite and Opérations Oxford Brookes University _ , Geology
6.11.3 Oïl in Mud
If inspection of the washed cuttings and/or the ditch gas readings indicate a show, examine a fresh mud sample from the return flowline in the UV box for spots and 'pops' of fluorescence. If none or very weak fluorescence is observed, stir the sample and note any changes. Use the following guidelines to 'standardise' your description.
Take a set amount of mud (e.g. 200 ml - as long as it is the same each rime) in a dish and examine under UV light. Describe colour and intensîty of oil fluorescence. If none, dilute with half as much volume of water (e.g. 100ml) and leave for 5 minutes. Describe again.
(Fluorescence is described below)
Oil shows in the mud are evaluated on the basis of the percentage of the mud surface covered by oil fluorescence with a rating of poor, fair, good or very good. Oil and gas in the cuttings indicates that the formations is releasing the hydrocarbons relatively easily and indicates permeability is fairly good. It should tie in with high total gas and chromatograph readings.
Before an expected hydrocarbon bearing zone always check for oil in mud from samples before and after bottoms up of the top of the zone so you hâve a 'control' sample. Double check for any contaminants. -\
6.11.4 Microgas (Blender) Gas Samples
Take microgas readings on a mud sample and on a sample of unwashed cuttings. This will give an indication of permeability of the cuttings in which show is contained. If the permeability is good the hydrocarbons will expand as the cuttings corne to the surface and will be expelled from the cuttings. The microgas readings in this case will be low in the cuttings and high in the mud and should tie in with a high Total Gas peak. If permeability of the cuttings is poor hydrocarbons will be retained inside them and microgas will be low in the mud and high in the cuttings in relative ternis.
AH microgas readings should be recorded on your worksheets to be used in you full évaluation later.
6.11.5 Odour
Note any hydrocarbon odour from the mud or unwashed cuttings or in fresh core chips.
Type Odour High and médium API gravity oils Strong gassy odour condensâtes Strong petroliferous odour Low API oils Do not smell strongly.
J
The degree of odour, e.g. faint, moderate, strong should be applied. Alway s examine fresh samples.
Date: October 2001 6.57 Author Version: 2.01 Sample and Show Description TJH
J
Geology Oxford Brookes University
Wellsite and Opérations Geology
6.11.6 Oil Staining/Bleeding
Examine a sample of washed cuttings under the microscope for oil staining. Note the percentage of grains with a stain and its colour. State whether the stain is live or dead oil. Use descriptive adjectives to note the character of the stain (e.g. none, spotry, patchy, even, uniform, irregular etc.).
Oil may be seen to be bleeding from cores and this should be noted on any descriptions. However, if the permeability in the core was good the oil would hâve swiftly flowed out of the core so the observation of bleeding oil generally means that permeability may be poor. Note the percentage of stain in whole cores or core chips.
The colour of any stain or bleeding oil can be fairly characteristic:-
API Gravity Colour of oil Above45° Clear to pale yellow brown 15°to45° Yellow brown through brown Below 15° Dark brown through black
6.11.7 Fluorescence
Fluorescence is the property to glow when exposed to ultraviolet light. The fluorescence varies with the API gravity of the oil. Examine fresh surfaces of cuttings and core chips in the UV box for fluorescence and note the:-
• Uniformity - Is the fluorescence uniform throughout or patchily developed? • Percentage - Estimate the percentage of cuttings or the chip where show is apparent • Colour - What is the colour? This is very subjective. There are no colour charts but use
descriptive ternis such as white, straw yellow etc. • Intensity - The intensity varies from weak to very bright and dépends on the API
gravity. The more intense the colour the lower the API gravity.
Any changes of thèse parameters with depth can give évidence for différent zones within an oil column, possibly transition zones. The information should be combined with gas ratio data to try and give a better évaluation.
Pick out several of the fluorescent grains and check them under the microscope for staining.
The relation between the colour of fluorescence and the gravity of the crude oil can be very useful in the interprétation of shows and evaluating the readings of the gas detector. A comparison between gravity and colour of fluorescence is shown below.
Fluorescence Colour of Crude Oils Gravity, °API Colour of Fluorescence Below 15 Brown 15-25 Orange 25-35 Yellow to cream 35-45 White Over45 Blue-white to violet
OH Gravitv N.B. Oil gravity in degrees API is computed as:
°API = (141,5 / spec. grav.) -131,5 Where spec. grav. means spécifie gravity of oil at 60 °F referred to water at 60 °F.
Date: October 2001 Version: 2.01
6.58 Sample and Show Description
Author TJH
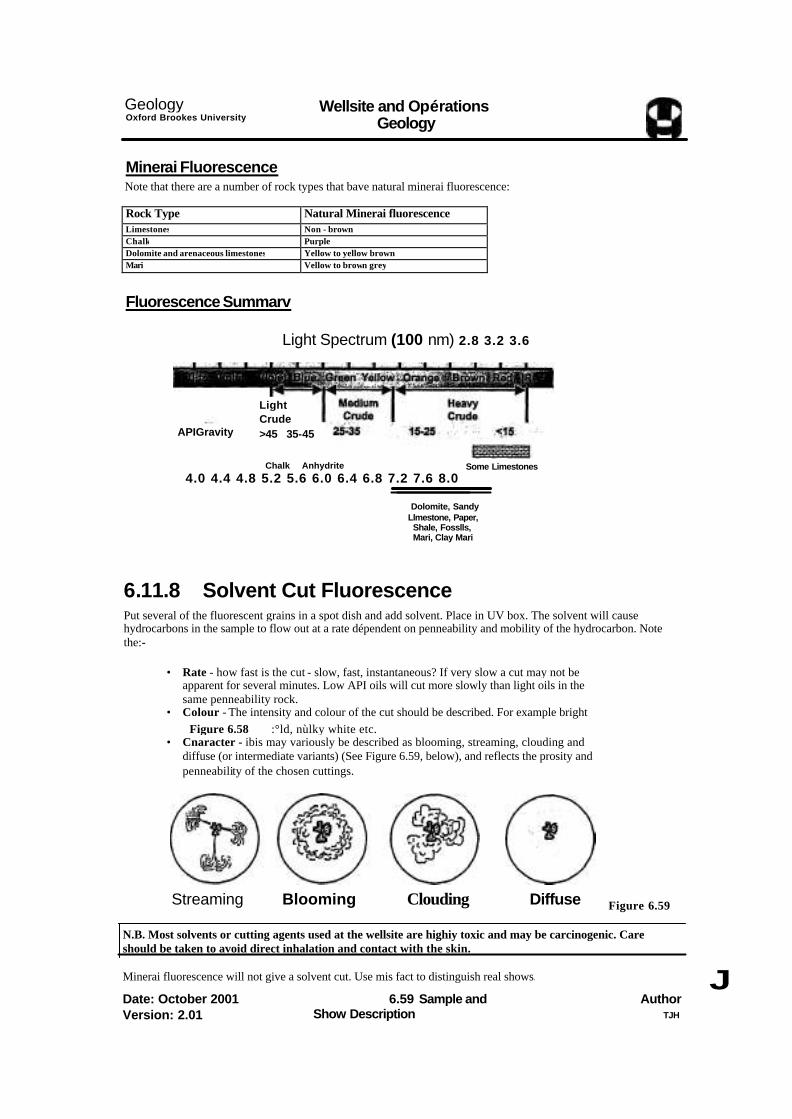
Geology Oxford Brookes University
Wellsite and Opérations Geology
Minerai Fluorescence Note that there are a number of rock types that bave natural minerai fluorescence:
Rock Type Natural Minerai fluorescence Limestones Non - brown Chalk Purple Dolomite and arenaceous limestones Yellow to yellow brown Mari Vellow to brown grey
Fluorescence Summarv
Light Spectrum (100 nm) 2.8 3.2 3.6
4.0 4.4 4.8 5.2 5.6 6.0 6.4 6.8 7.2 7.6 8.0
Dolomite, Sandy Llmestone, Paper, Shale, Fosslls, Mari, Clay Mari
6.11.8 Solvent Cut Fluorescence
Put several of the fluorescent grains in a spot dish and add solvent. Place in UV box. The solvent will cause hydrocarbons in the sample to flow out at a rate dépendent on penneability and mobility of the hydrocarbon. Note the:-
• Rate - how fast is the cut - slow, fast, instantaneous? If very slow a cut may not be apparent for several minutes. Low API oils will cut more slowly than light oils in the same penneability rock.
• Colour - The intensity and colour of the cut should be described. For example bright Figure 6.58 :°ld, nùlky white etc.
• Cnaracter - ibis may variously be described as blooming, streaming, clouding and diffuse (or intermediate variants) (See Figure 6.59, below), and reflects the prosity and penneability of the chosen cuttings.
Streaming Blooming Clouding Diffuse Figure 6.59
N.B. Most solvents or cutting agents used at the wellsite are highiy toxic and may be carcinogenic. Care should be taken to avoid direct inhalation and contact with the skin.
Date: October 2001 Version: 2.01
6.59 Sample and Show Description
Author TJH
J
Light Crude >45 35-45 APIGravity
Chalk Anhydrite Some Limestones
Minerai fluorescence will not give a solvent cut. Use mis fact to distinguish real shows.
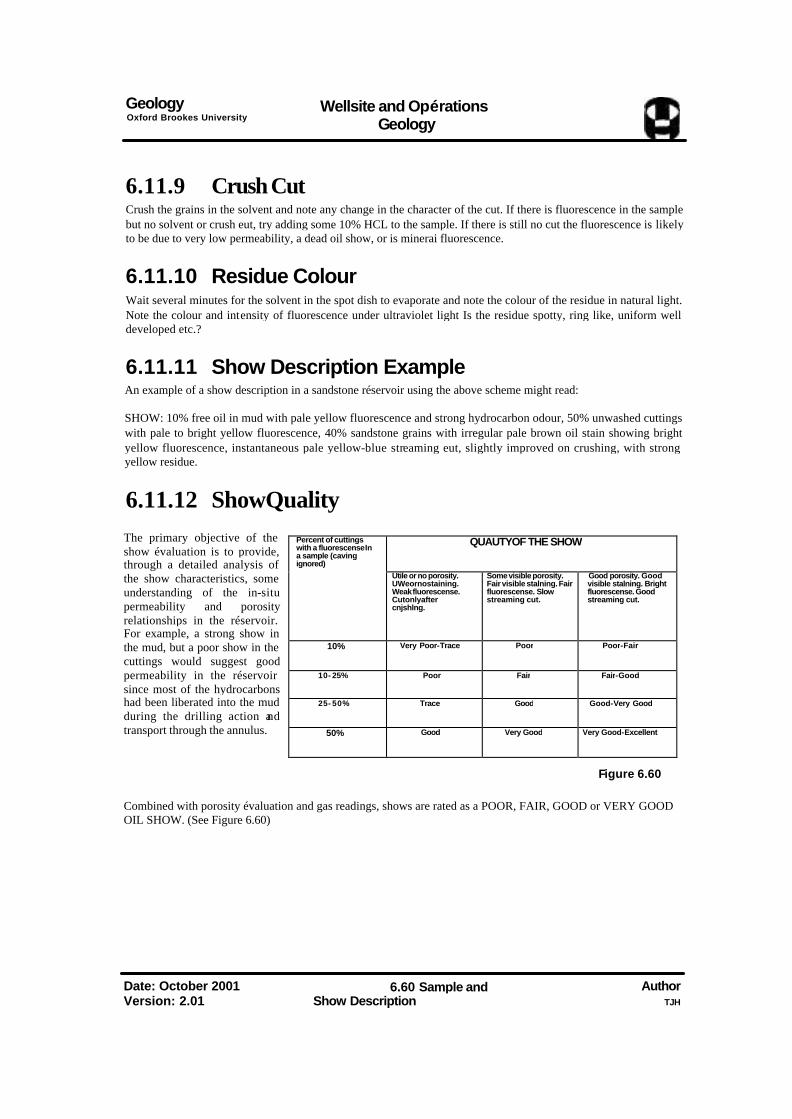
Geology Oxford Brookes University
Wellsite and Opérations Geology
6.11.9 Crush Cut
Crush the grains in the solvent and note any change in the character of the cut. If there is fluorescence in the sample but no solvent or crush eut, try adding some 10% HCL to the sample. If there is still no cut the fluorescence is likely to be due to very low permeability, a dead oil show, or is minerai fluorescence.
6.11.10 Residue Colour
Wait several minutes for the solvent in the spot dish to evaporate and note the colour of the residue in natural light. Note the colour and intensity of fluorescence under ultraviolet light Is the residue spotty, ring like, uniform well developed etc.?
6.11.11 Show Description Example
An example of a show description in a sandstone réservoir using the above scheme might read:
SHOW: 10% free oil in mud with pale yellow fluorescence and strong hydrocarbon odour, 50% unwashed cuttings with pale to bright yellow fluorescence, 40% sandstone grains with irregular pale brown oil stain showing bright yellow fluorescence, instantaneous pale yellow-blue streaming eut, slightly improved on crushing, with strong yellow residue.
6.11.12 ShowQuality
The primary objective of the show évaluation is to provide, through a detailed analysis of the show characteristics, some understanding of the in-situ permeability and porosity relationships in the réservoir. For example, a strong show in the mud, but a poor show in the cuttings would suggest good permeability in the réservoir since most of the hydrocarbons had been liberated into the mud during the drilling action and transport through the annulus.
Percent of cuttings with a fluorescense In a sample (caving ignored)
QUAUTYOF THE SHOW
Utile or no porosity. UWeornostaining. Weak fluorescense. Cutonlyafter cnjshlng.
Some visible porosity. Fair visible stalning. Fair fluorescense. Slow streaming cut.
Good porosity. Good visible stalning. Bright fluorescense. Good streaming cut.
10% Very Poor-Trace Poor Poor-Fair
10- 25% Poor Fair Fair-Good
25- 50% Trace Good Good-Very Good
50% Good Very Good Very Good-Excellent
Figure 6.60
Combined with porosity évaluation and gas readings, shows are rated as a POOR, FAIR, GOOD or VERY GOOD OIL SHOW. (See Figure 6.60)
Date: October 2001 Version: 2.01
6.60 Sample and Show Description
Author TJH
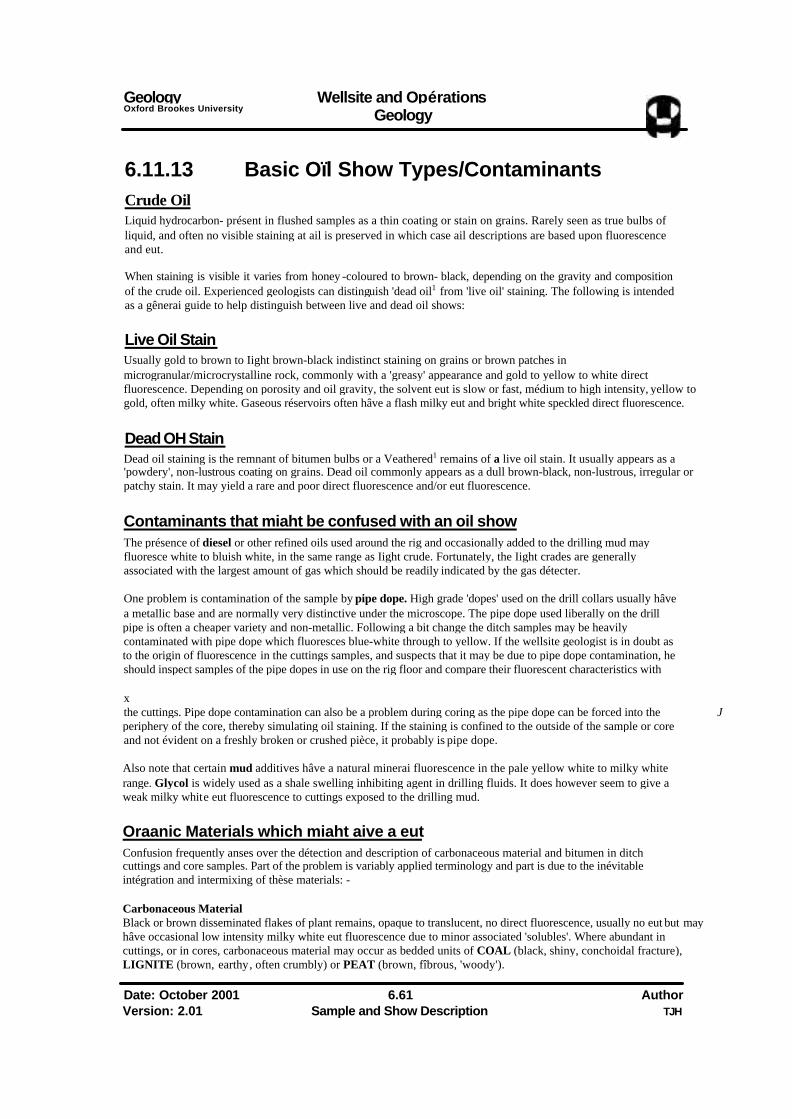
Geology Wellsite and Opérations Oxford Brookes University _ , Geology
6.11.13 Basic Oïl Show Types/Contaminants
Crude Oil Liquid hydrocarbon- présent in flushed samples as a thin coating or stain on grains. Rarely seen as true bulbs of liquid, and often no visible staining at ail is preserved in which case ail descriptions are based upon fluorescence and eut.
When staining is visible it varies from honey -coloured to brown- black, depending on the gravity and composition of the crude oil. Experienced geologists can distinguish 'dead oil1 from 'live oil' staining. The following is intended as a gênerai guide to help distinguish between live and dead oil shows:
Live Oil Stain Usually gold to brown to Iight brown-black indistinct staining on grains or brown patches in microgranular/microcrystalline rock, commonly with a 'greasy' appearance and gold to yellow to white direct fluorescence. Depending on porosity and oil gravity, the solvent eut is slow or fast, médium to high intensity, yellow to gold, often milky white. Gaseous réservoirs often hâve a flash milky eut and bright white speckled direct fluorescence.
Dead OH Stain Dead oil staining is the remnant of bitumen bulbs or a Veathered1 remains of a live oil stain. It usually appears as a 'powdery', non-lustrous coating on grains. Dead oil commonly appears as a dull brown-black, non-lustrous, irregular or patchy stain. It may yield a rare and poor direct fluorescence and/or eut fluorescence.
Contaminants that miaht be confused with an oil show
The présence of diesel or other refined oils used around the rig and occasionally added to the drilling mud may fluoresce white to bluish white, in the same range as Iight crude. Fortunately, the Iight crades are generally associated with the largest amount of gas which should be readily indicated by the gas détecter.
One problem is contamination of the sample by pipe dope. High grade 'dopes' used on the drill collars usually hâve a metallic base and are normally very distinctive under the microscope. The pipe dope used liberally on the drill pipe is often a cheaper variety and non-metallic. Following a bit change the ditch samples may be heavily contaminated with pipe dope which fluoresces blue-white through to yellow. If the wellsite geologist is in doubt as to the origin of fluorescence in the cuttings samples, and suspects that it may be due to pipe dope contamination, he should inspect samples of the pipe dopes in use on the rig floor and compare their fluorescent characteristics with x the cuttings. Pipe dope contamination can also be a problem during coring as the pipe dope can be forced into the J periphery of the core, thereby simulating oil staining. If the staining is confined to the outside of the sample or core and not évident on a freshly broken or crushed pièce, it probably is pipe dope.
Also note that certain mud additives hâve a natural minerai fluorescence in the pale yellow white to milky white range. Glycol is widely used as a shale swelling inhibiting agent in drilling fluids. It does however seem to give a weak milky white eut fluorescence to cuttings exposed to the drilling mud.
Oraanic Materials which miaht aive a eut Confusion frequently anses over the détection and description of carbonaceous material and bitumen in ditch cuttings and core samples. Part of the problem is variably applied terminology and part is due to the inévitable intégration and intermixing of thèse materials: -
Carbonaceous Material Black or brown disseminated flakes of plant remains, opaque to translucent, no direct fluorescence, usually no eut but may hâve occasional low intensity milky white eut fluorescence due to minor associated 'solubles'. Where abundant in cuttings, or in cores, carbonaceous material may occur as bedded units of COAL (black, shiny, conchoidal fracture), LIGNITE (brown, earthy, often crumbly) or PEAT (brown, fîbrous, 'woody').
Date: October 2001 6.61 Author Version: 2.01 Sample and Show Description TJH
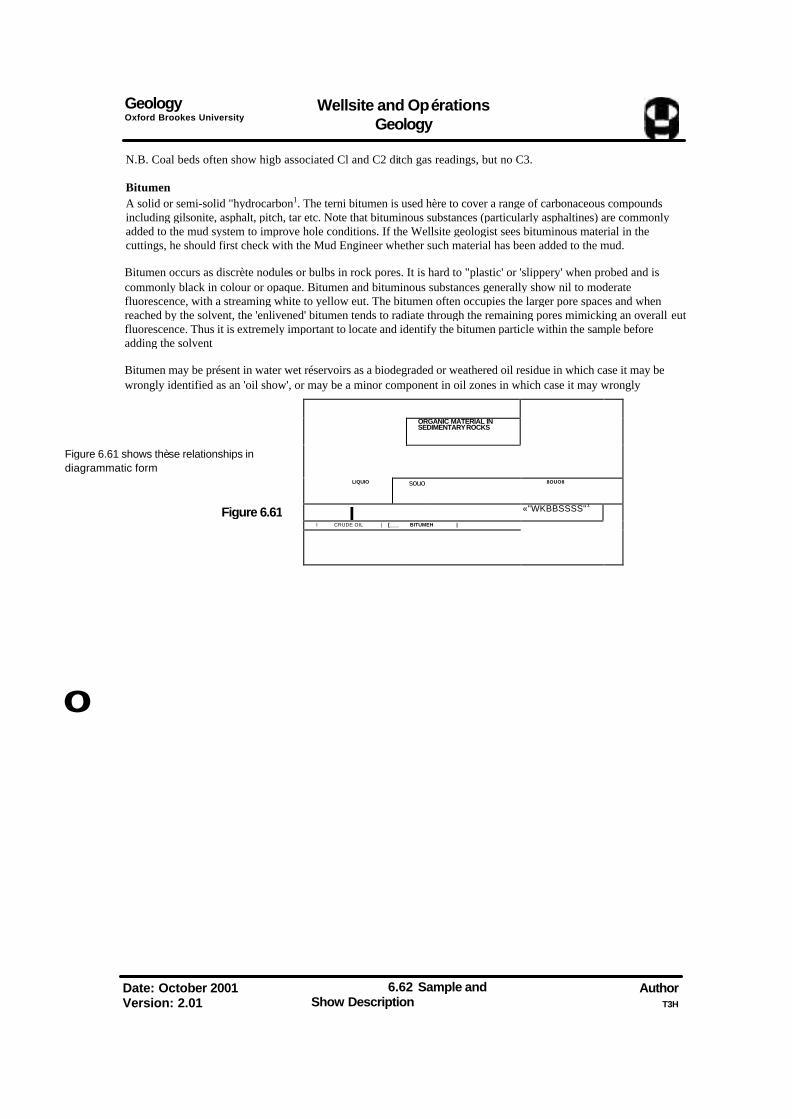
Geology Oxford Brookes University
Wellsite and Opérations Geology
N.B. Coal beds often show higb associated Cl and C2 ditch gas readings, but no C3.
Bitumen A solid or semi-solid "hydrocarbon1. The terni bitumen is used hère to cover a range of carbonaceous compounds including gilsonite, asphalt, pitch, tar etc. Note that bituminous substances (particularly asphaltines) are commonly added to the mud system to improve hole conditions. If the Wellsite geologist sees bituminous material in the cuttings, he should first check with the Mud Engineer whether such material has been added to the mud.
Bitumen occurs as discrète nodules or bulbs in rock pores. It is hard to "plastic' or 'slippery' when probed and is commonly black in colour or opaque. Bitumen and bituminous substances generally show nil to moderate fluorescence, with a streaming white to yellow eut. The bitumen often occupies the larger pore spaces and when reached by the solvent, the 'enlivened' bitumen tends to radiate through the remaining pores mimicking an overall eut fluorescence. Thus it is extremely important to locate and identify the bitumen particle within the sample before adding the solvent
Bitumen may be présent in water wet réservoirs as a biodegraded or weathered oil residue in which case it may be wrongly identified as an 'oil show', or may be a minor component in oil zones in which case it may wrongly
ORGANIC MATERIAL IN
SEDIMENTARY ROCKS
Figure 6.61 shows thèse relationships in diagrammatic form
LIQUIO souo 8OUO8
Figure 6.61 l «"WKBBSSSS"1 I CRUDE OIL | [___ BITUMEH |
o
Date: October 2001 Version: 2.01
6.62 Sample and Show Description
Author T3H
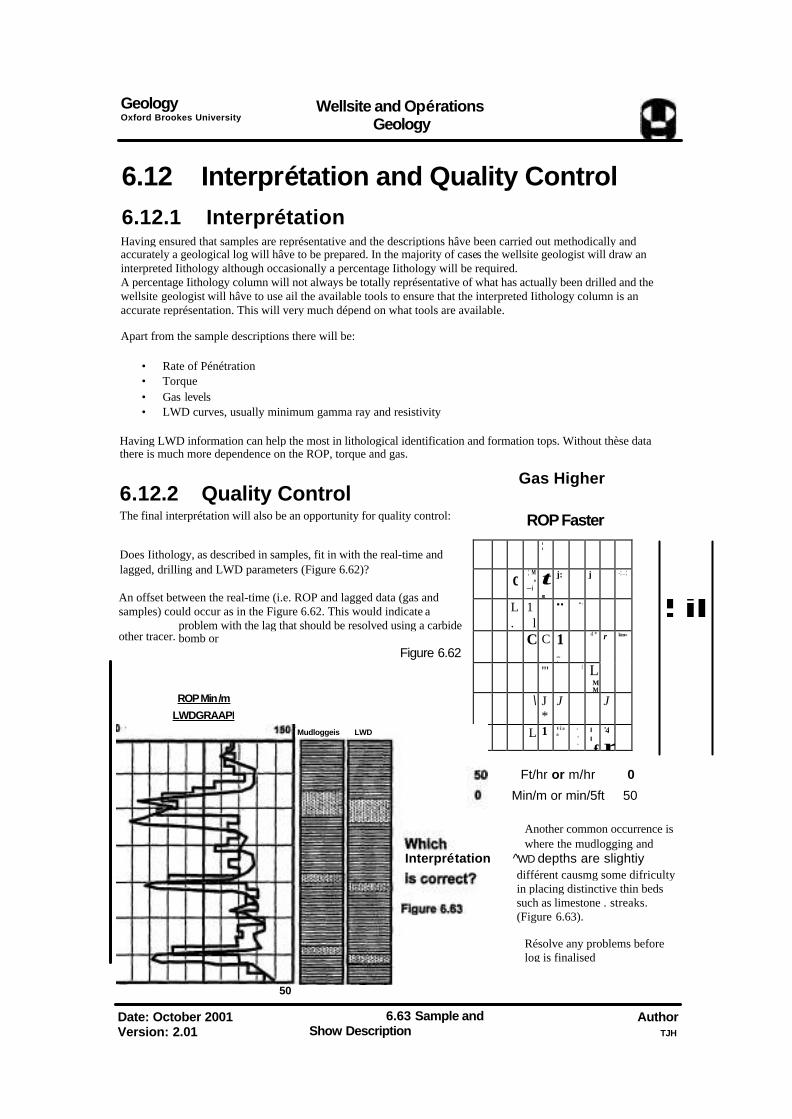
Geology Oxford Brookes University
Wellsite and Opérations Geology
6.12 Interprétation and Quality Control
6.12.1 Interprétation
Having ensured that samples are représentative and the descriptions hâve been carried out methodically and accurately a geological log will hâve to be prepared. In the majority of cases the wellsite geologist will draw an interpreted Iithology although occasionally a percentage Iithology will be required. A percentage Iithology column will not always be totally représentative of what has actually been drilled and the wellsite geologist will hâve to use ail the available tools to ensure that the interpreted Iithology column is an accurate représentation. This will very much dépend on what tools are available.
Apart from the sample descriptions there will be:
• Rate of Pénétration • Torque • Gas levels • LWD curves, usually minimum gamma ray and resistivity
Having LWD information can help the most in lithological identification and formation tops. Without thèse data there is much more dependence on the ROP, torque and gas.
6.12.2 Quality Control The final interprétation will also be an opportunity for quality control:
Does Iithology, as described in samples, fit in with the real-time and lagged, drilling and LWD parameters (Figure 6.62)?
An offset between the real-time (i.e. ROP and lagged data (gas and samples) could occur as in the Figure 6.62. This would indicate a
problem with the lag that should be resolved using a carbide bomb or
Figure 6.62
ROP Min /m
50
Date: October 2001 Version: 2.01
6.63 Sample and Show Description
Author TJH
¦ il
Gas Higher
ROP Faster
¦
c ¦ M
» —i t
m
j: j -¦ _ ¦
L.
1 l
•• » .
C C 1 _¦
4 * r km»
'" | L MM
\ J*
J J
L 1 W Ê mm ^
«
•*
¦f
'4
r
other tracer.
LWDGRAAPI
Mudloggeis LWD
Ft/hr or m/hr 0
Min/m or min/5ft 50
Another common occurrence is where the mudlogging and
Interprétation ^WD depths are slightiy différent causmg some difriculty in placing distinctive thin beds such as limestone . streaks. (Figure 6.63).
Résolve any problems before log is finalised
Related Documents