IDFC Green Finance Mapping Report 2021 November 2021

Welcome message from author
This document is posted to help you gain knowledge. Please leave a comment to let me know what you think about it! Share it to your friends and learn new things together.
Transcript

IDFC Green Finance MappingReport 2021
November 2021

Over $1 trilliontotal green financesince 2015
20% of total new commitments in 2020 were green finance commitments
$185 billionin green finance in 2020

TABLE OF CONTENTS
EXECUTIVE SUMMARY 4
2020 Key Findings 4
Climate Finance in 2020 6
Biodiversity Finance in 2020 6
Improving Green Finance Mapping Methodology 7
1. INTRODUCTION 9
2. METHODOLOGY 12
2.1 TRACKING POSITIVE CONTRIBUTIONS TO BIODIVERSITY IN THE GFM 12
3. GREEN FINANCE MAPPING OUTCOMES 15
3.1 CLIMATE FINANCE 18
3.2 BIODIVERSITY FINANCE 26
4. ALIGNMENT WITH THE PARIS AGREEMENT 30
5. CONCLUSIONS 32
6. APPENDICES 33
6.1 APPENDIX A.1: LIST AND BRIEF DESCRIPTION OF IDFC OECD MEMBER ORGANIZATIONS 33
6.2 APPENDIX A.2: LIST AND BRIEF DESCRIPTION OF IDFC NON-OECD MEMBER ORGANIZATIONS 33
6.3 APPENDIX B: METHODOLOGY GUIDANCE – DEFINITIONS AND TERMINOLOGY 34
6.4 APPENDIX C: METHODOLOGY GUIDANCE – ESTIMATING PRIVATE SECTOR MOBILIZATION 38
6.5 APPENDIX D: ELIGIBLE PROJECT CATEGORIES 40
6.6 APPENDIX E: DATA TABLE 42
6.7 APPENDIX F: INDEX OF ACRONYMS 44
7. ENDNOTES 45

4
EXECUTIVE SUMMARY
1 $= US dollar.
Since 2011, the International Development Finance Club (IDFC) has conducted a periodic mapping of member institutions’ green finance contributions.
In 2020, cumulative green finance commitments by IDFC members surpassed the $1 trillion1 mark since the Paris Agreement was signed. This is a major milestone, which materializes IDFC members’ ability to deliver on unprecedented flows of green finance. Adaptation finance continued to grow, increasing by 42% over 2019 and more than fivefold compared to 2016 to reach $27.5 billion. Mitigation finance suffered a shortfall in 2020, driven, at least in part, by the COVID-19 pandemic and the need to allocate resources to emergency response and economic recovery. Despite this challenge, six institutions increased their green commitments in 2020, compared to 2019.
In light of new priorities triggered by the economic response to the COVID-19 pandemic, IDFC institutions redistributed their green financing efforts towards
adaptation and resilience while also including more conservation efforts. Indeed, at the inaugural 2020 Finance in Common Summit, IDFC members com-mitted to step up investment in conservation, sustain-able use, and the restoration of biodiversity. To better reflect these priorities, this year’s Green Finance Mapping (GFM) report separates IDFC finance commit-ments to biodiversity projects, alongside conventional climate finance and other environmental objectives. Such efforts form part of a broader trend that acknowl-edges the intersectionality between the climate and biodiversity crisis, both in terms of causes, conse-quences, and potential (policy) solutions.
2020 KEY FINDINGS
• IDFC members reported total green finance commitments of $185 billion. This represents a 6% decrease from 2019, primarily driven by the impact of the COVID-19 pandemic.
Figure ES 1: IDFC green finance commitments in 2020 by theme

5
• In 2020, green finance represented approximately 20% of total new commitments reported by IDFC members. Since 2015, green finance commitments have consistently represented more than one-fifth of total IDFC investments.
- Climate finance—consisting of all activities related to the mitigation of greenhouse gas (GHG) emissions and adaptation to climate change—accounted for 96% of total green finance (or $178.5 billion).
- Finance for green energy and mitigation of GHGs was the largest climate finance category, representing 82%. However, in the context of a challenging year, mitigation finance declined 10%, primarily driven by lower commitments for the transport sector.
2 For KfW, the breakdown of domestic finance flows was estimated based on figures reported in 2019.
- Adaptation projects represented 15% of climate finance, an increase of 42% from 2019. This continues four years of consecutive growth, achieving over five times the level of adaptation commitments in 2016.
• Finance to projects containing elements of both mitigation and adaptation has been steadily increasing, but remains a small portion of total climate finance, at 2.6% (or $4.7 billion).
• Finance for biodiversity projects reached $14 billion in 2020. This includes, for example, finance for water supply, wastewater treatment, biodiversity conservation, and waste management, among others.
• Additionally, IDFC members reported $1.4 billion of finance for other environmental objectives.
Figure ES 2: IDFC green finance commitments in 2015-20202
6
CLIMATE FINANCE IN 2020
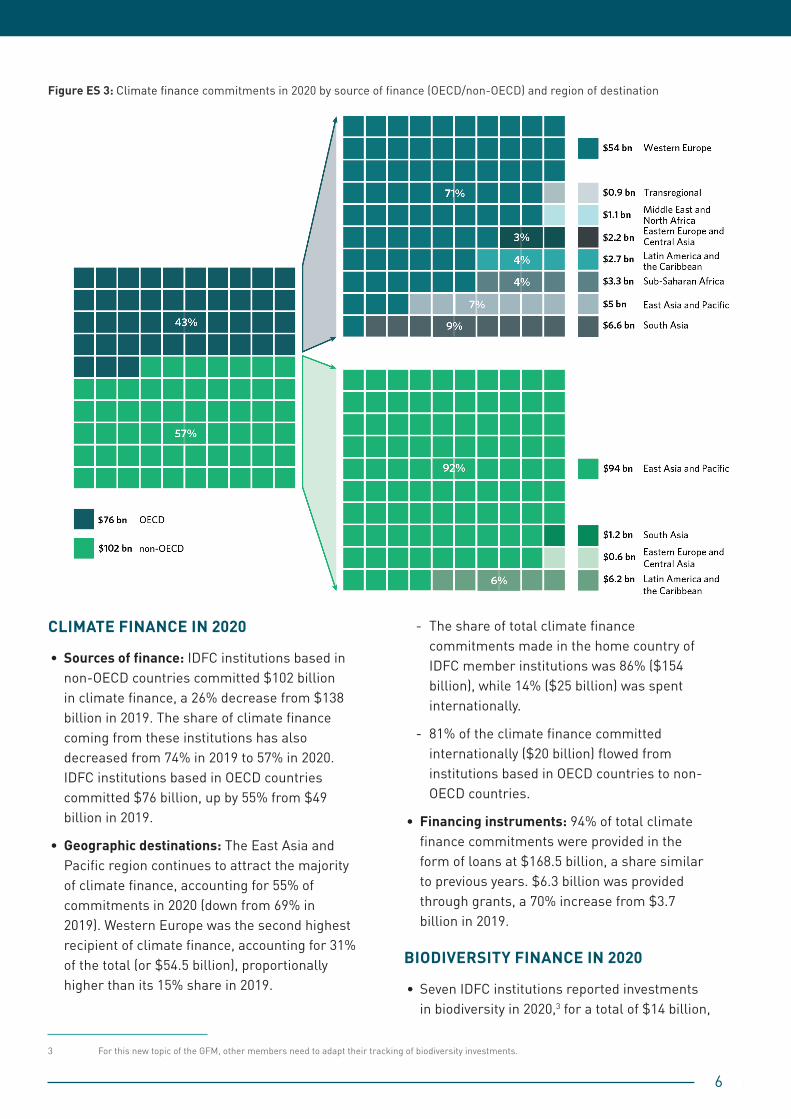
• Sources of finance: IDFC institutions based in non-OECD countries committed $102 billion in climate finance, a 26% decrease from $138 billion in 2019. The share of climate finance coming from these institutions has also decreased from 74% in 2019 to 57% in 2020. IDFC institutions based in OECD countries committed $76 billion, up by 55% from $49 billion in 2019.
• Geographic destinations: The East Asia and Pacific region continues to attract the majority of climate finance, accounting for 55% of commitments in 2020 (down from 69% in 2019). Western Europe was the second highest recipient of climate finance, accounting for 31% of the total (or $54.5 billion), proportionally higher than its 15% share in 2019.
3 For this new topic of the GFM, other members need to adapt their tracking of biodiversity investments.
- The share of total climate finance commitments made in the home country of IDFC member institutions was 86% ($154 billion), while 14% ($25 billion) was spent internationally.
- 81% of the climate finance committed internationally ($20 billion) flowed from institutions based in OECD countries to non-OECD countries.
• Financing instruments: 94% of total climate finance commitments were provided in the form of loans at $168.5 billion, a share similar to previous years. $6.3 billion was provided through grants, a 70% increase from $3.7 billion in 2019.
BIODIVERSITY FINANCE IN 2020
• Seven IDFC institutions reported investments in biodiversity in 2020,3 for a total of $14 billion,
Figure ES 3: Climate finance commitments in 2020 by source of finance (OECD/non-OECD) and region of destination

7
or 7.5% of total green finance commitments.
• 39% of biodiversity finance commitments ($5.4 billion) went to non-climate finance related biodiversity projects, while an additional $8.6 billion consisted of climate finance projects simultaneously reporting biodiversity objectives. 4.6% of these dual-benefits projects had biodiversity objectives with an internal weight higher than 50% of the total value of the project.
• Sources of finance: IDFC institutions based in non-OECD countries committed 90% ($12.6 billion) of biodiversity finance.
• Geographic destinations: The East Asia and Pacific region attracted 84% of biodiversity finance commitments in 2020 ($11.8 billion), followed by Latin America and the Caribbean at 10% ($1.4 billion).
• Sectors: Most biodiversity finance went to water preservation projects (24%), followed by wastewater treatment (16%), and agriculture and natural resources (15%).
IMPROVING GREEN FINANCE MAPPING METHODOLOGY
To inform this exercise, IDFC members completed a survey, from which data are checked for consistency and aggregated. The number of reporting institutions for 2020 is 21 out of 26 total IDFC members.
The IDFC survey uses the Multilateral Development Banks (MDBs) and IDFC Common Principles for Climate Mitigation and Adaptation Finance Tracking. The list of reporting institutions and reporting coverage varies from year to year. Consequently, comparison with previous GFM figures may not be entirely consistent.
Following the Common Principles, uncertainty is overcome via the principle of conservativeness where climate finance is preferred to be under-reported rather than over-reported. In particular, adaptation commitments are expected to be conservative, since adaptation-related activities are broadly context-specific and institutions are not always able to identify relevant projects consistently.
Figure ES 4: Biodiversity finance commitments in 2020 by source of finance (OECD/non-OECD) and end use

8
For the first time this year, and in response to growing international momentum on the topic, the GFM tracks biodiversity as a separate category from other environmental finance. IDFC members could report
on biodiversity finance at the project- or aggregate-level, weighted according to each institution’s internal method for calculating the percentage of project funding allocated to biodiversity benefits.

9
1. INTRODUCTION Global climate finance flows reached a biennial average of $632 billion in 2019/2020, the highest tracked level to date, but still far below the estimated needs to achieve the international climate goals outlined in the Paris Agreement (CPI, 2021).
Total global climate finance flows continue to be evenly split between public and private actors. However, the sectoral and regional breakdown vary much more across the different sources of finance: 71% of private finance in the period 2019/2020 flowed to renewable energy generation, with private commitments primarily going to East Asia and Pacific, North America, and Western Europe. Public actors displayed a more balanced portfolio, prioritising energy systems and low-carbon transport alongside investments into agriculture, forestry and land use, water and wastewater, and cross-sectoral projects, among others (CPI, 2021).
This Green Finance Mapping (GFM) report assesses financial commitments made by the International Development Finance Club (IDFC) members in 2020 – a challenging year that revealed the intricate relationship between planetary- and human-health, as well as the vulnerabilities of “business-as-usual” economic growth. In spite of the challenges posed by the pandemic, the 10th anniversary of this GFM report marked an important milestone for IDFC: cumulative total green commitments since 2015 surpassed the $1 trillion mark. Such progress confirms IDFC’s position as the largest provider of climate finance in the world. With bold ambitions for continued increases in climate finance flows, an IDFC Climate Facility was launched in 2019; the Facility is designed to foster knowledge transfer and capacity building amongst member institutions, ultimately with a view towards increasing the effectiveness and catalytic potential of climate finance. Currently still in the four-year pilot phase, the Facility is also focused on facilitating access to the Green Climate Fund (GCF) by providing project preparation support.
In light of increasing evidence linking the climate and biodiversity crises in terms of causes, consequences and possible solutions, IDFC members have also committed to step up investment in the conservation,
sustainable use, and restoration of biodiversity – a priority reflected in this year’s GFM report via the explicit tracking of biodiversity finance. IDFC recognizes the need for a more comprehensive understanding of the current biodiversity finance landscape, hence this report, for the first time, provides a dedicated analysis of financial commitments with biodiversity as principal objective, as well as climate finance with biodiversity co-benefits, in anticipation of the post-2020 global biodiversity framework (GBF) to be formulated at the 15th meeting of the Convention on Biological Diversity (CBD) in October 2021 and April-May 2022 in Kunming, China. On the occasion of the 2020 Finance in Common Summit (see Box 1), IDFC members issued a Common Position Paper on Biodiversity, highlighting the challenges to achieving the objectives of the future post-2020 GBF and aligning all members’ investment portfolios to this framework.
At a more granular level, many IDFC members have recently begun to display stronger pledges to climate action and green finance more broadly, the extent to which will be reflected in future iterations of the GFM report, notably:
• Agence Française de Développement (AFD) announced it would double its financing for ecosystem protection to EUR 1 billion each year, aiming to ensure 30% of climate finance simultaneously provides biodiversity co-benefits by 2025, with an in-house biodiversity unit to support implementation (AFD, 2021)
• Japan International Cooperation Agency (JICA) pledged to strengthen organisational management from a climate change perspective, with emphasis on disclosure of climate-related information, while they also developed a climate change support tool in order to improve project development and mainstream climate change measures (mitigation/adaptation) institution-wide (JICA, 2020)
• Korean Development Bank (KDB) announced that 2021 would be a landmark year for their
10
sustainability practices, establishing a new department dedicated to mainstreaming sustainability into the institution’s agenda, as well as expanding green financial products and services (KDB, 2020)
• The Development bank of Latin America (CAF) enhanced its collaboration with other PDBs including, for example, a co-financing framework with the European Investment bank (EIB) to fund climate action projects boosting jobs and competitiveness, and a partnership with AFD to mobilise funds for green initiatives across Latin America (CAF, 2020)
• The Industrial Development Bank of Turkey (TSKB) announced it intends to prioritise the weight of SDG-linked loans within the total portfolio at 90% until 2025 (TSKB, 2021)
• The Black Sea Trade and Development Bank (BSTDB) approved a new climate change strategy aiming to achieve net zero emissions by 2050, while gradually increasing the share of funds directed to climate activities and projects with climate co-benefits to at least 30% in the next ten years (BSTDB, 2021)
In short, both as a collective and as individual entities, IDFC continues to bolster the momentum behind, and ambition for, more green finance.
4 At the New York Climate Action Summit (2019), IDFC pledged to deploy more than $1 trillion in climate finance by 2025, an increasing portion of which is to be specifically allocated towards adaptation activities.
Robust and consistent tracking of green finance flows will be essential for IDFC members to assess, and evaluate, progress towards achieving their green finance pledges.4 Data gaps, especially in certain sectors, make it challenging to estimate the true volume and impact of green finance. Committing to better reporting, including filling these data gaps, is essential to understanding the current state of green finance, measuring progress and mapping specific actions to reach Paris-aligned goals within this decade.
This report presents the methodology used in, and the findings derived from, the annual GFM exercise, concerning commitments made by 21 IDFC members during the year 2020. The report, prepared with the support of Climate Policy Initiative and Trinomics, is structured as follows:
• Section 2 outlines the methodology used to record IDFC members institutions’ green financial commitments
• Section 3 presents GFM outcomes, including aggregated flows across IDFC and breakdowns by region of destination, financial instrument, sector of use, and sub-sectoral technologies
• Section 4 discusses IDFC’s commitments for aligning with the Paris Agreement
• Section 5 summarises trends and concludes
Box 1: Finance in Common Summit, 2020
The first Finance in Common Summit was held in November 2020, a meeting in which 453 Public Development Banks (PDBs) gathered to collectively commit to align their activities with climate-resilient and sustainable development. The Summit emphasised the opportunity to harness COVID-19 recovery packages to meet Nationally Determined Contributions (NDCs) and long-term strategies, a critical juncture for both the climate and biodiversity crisis.
The Summit culminated in a Joint Declaration—of which IDFC was a signatory—issued by all PDBs worldwide, confirming their role and responsibility to support not only green finance, but a green financial system. Given their ability to bridge the public with the private sector, and their agility in moving between domestic and international agendas, PDBs emphasised a collective responsibility to reorient global finance flows towards climate action and the fulfilment of sustainable development goals more broadly.
The 2021 Finance in Common Summit, which was hosted on 19-20 October 2021 in Rome by Cassa Depositi e Prestiti (CDP), promised to turn attention towards the transformation of agriculture and agribusiness for food security, under the broader aim of adapting to climate change and ensuring biodiversity preservation. IDFC engaged with the whole coalition of PDBs, representing investments of over 2,000 billion dollars, to reiterate its commitment to tackling climate change and aligning its activities and strategies with the objectives of the Paris Agreement. On this occasion, IDFC published with the MDBs the updated Common Principles for Climate Mitigation Finance Tracking, communicated the high level of climate finance observed amongst members, and worked to improve on transparency.
Source: Finance in Common (2021).

11

12
2. METHODOLOGY
5 Average annual exchange rates were drawn from the Global Economic Monitor (World Bank, 2021).
6 The 21 respondents included: AFD, Bancoldex, BICE BNDES, BOAD, BSTDB, CABEI, CAF, CDB, CDC, CDP, DBSA, HBOR, ICD, JICA, KDB, KfW, PT SMI, TDB, TSKB, and VEB. Additionally, AFD, BNDES, CAF, CDB, DBSA, JICA, and KfW also reported their biodiversity finance commitments. There were 22 respondents on 2019 data, 17 respondents for 2018, 18 respondents for 2017, and 20 respondents for 2016 and 2015.
The methodology utilized for the GFM reports has evolved over time to improve the transparency, comparability, consistency, and flexibility of the process. For the first time, this edition (covering 2020 commitments) separately tracks finance commitments to biodiversity in addition to climate finance. The survey template sent out to IDFC members was expanded to include additional reporting features dedicated to biodiversity finance commitments.
For climate finance, the IDFC survey is aligned with the MDB-IDFC Common Principles for Climate Mitigation Finance Tracking and MDB-IDFC Common Principles for Climate Change Adaptation Finance Tracking. In the absence of common principles for biodiversity finance, the IDFC survey was built on the Organisation for Economic Co-operation and Development (OECD) guidelines and uses the DAC markers dedicated to the Rio Convention on Biological Diversity (CBD) (see Section 2.1).
As in previous years, mapping is conducted in three stages:
i. Collecting commitments data using a survey template filled out by member institutions. All commitments were reported in U.S. dollars, which institutions converted using World Bank exchange rate data where required.5 Detailed guidelines were provided to IDFC members on the categorization of projects and use of this template, including standardized definitions of regions, categories, and instruments; lists of eligible projects; and methodologies for estimating private finance mobilization. Specific guidelines for the biodiversity component of the survey were developed for the first time and are further detailed in Section 2.1.
ii. Checking the data and verifying reliability and consistency of reporting. Institutions were encouraged to note and report any deviations from the guidelines, and inconsistencies were identified and corrected. In cases of uncertainty, the reported estimates are conservative, following a preference for under-reporting rather than over-reporting green finance.
iii. Analyzing the dataset and presenting findings at aggregate and organization levels. Commitments by individual institutions were published for the first time in the 2017 GFM exercise, a practice continued in the current edition.
This year’s mapping is based on survey responses from 21 out of 26 IDFC members, of which seven also reported financial commitments to biodiversity.6 All institutions submitting data this year also returned surveys last year, with the exception of one. Four of the 21 institutions that responded to the survey reported no green finance commitments for 2020, primarily due to the COVID-19 pandemic. Annual fluctuations in the number of reporting institutions and in coverage across green finance activities does affect year-to-year comparisons.
Given reporting constraints, estimates were made for KfW’s breakdown of domestic finance with respect to sectors, destinations and instruments, based on ratios reported in 2019.
2.1 TRACKING POSITIVE CONTRIBUTIONS TO BIODIVERSITY IN THE GFM
The methodology used to track biodiversity finance flows builds upon prior work of the IDFC in the report “Benchmarking report on Biodiversity Practices of Development Banks” (IDFC, 2020) and the study on “Testing of Reporting Methodologies on Biodiversity Finance” (Belvaux, 2020). It is based on the OECD approach using the Common Reporting Standard (CRS) codes and the Rio Markers rating system.

13
This is the first time that biodiversity is included in the GFM survey as a separate dedicated section. In previous years, IDFC members could report on biodiversity as a sub-category of the ‘Other Environment’ category. This year, IDFC members could report their financial flows targeting biodiversity either as a primary objective or as a co-benefit to interventions targeting climate or other environmental issues. Members could report biodiversity relevant finance at the project or aggregate level.
Only positive contributions to biodiversity, also known as ‘net gains’, or co-benefits, are tracked in this year’s survey. Compliance to ‘do no significant harm principles’ and contributions to achieve neutrality or to mitigate environmental risks when undertaking projects7, were not counted. However, the GFM survey template leaves room for IDFC members to report qualitative information on best practices or specific procedures related to net gains.
Eligibility criteria
As stated by the OECD Development Assistance Committee (DAC), to be relevant for biodiversity, an activity should comply with at least one of the following eligibility criteria:
1. Conservation or enhancement of ecosystems, species or genetic resources, and/or enhancement of the sustainability of their use, through in-situ or ex-situ measures, or the restoration of existing damages; or
2. Integration of biodiversity and ecosystem services concerns within recipient countries’ development objectives, economic decision making and sectoral policies, through measures such as institution building, capacity development, strengthening the regulatory and policy frameworks, research, technology transfer, knowledge management and stakeholder engagement; or
3. Elimination, phasing out or reform of incentives, including subsidies, harmful to biodiversity, and provision of positive incentives for the conservation and sustainable use of biodiversity; or
7 As defined by environmental safeguards published by ADB (2021), AFD (2018) and IFC (2021).
4. Maintenance of genetic diversity of seeds, cultivated plants and farmed and domesticated animals and their related wild species; or
5. Fair and equitable sharing of the benefits arising from the utilization of genetic resources, including by appropriate access to these resources and by appropriate transfer of relevant technologies, as internationally agreed; or
6. Developing countries’ efforts to meet their obligations under the Convention on Biological Diversity (CBD).
A comprehensive list of activities eligible to classify as biodiversity finance is included in Appendix D.
Justification based on project documentation
In addition, biodiversity relevance should be justified in the project documentation on three levels:
• Context: The biodiversity theme is discussed as a relevant issue for the intervention in the background information (typically the sector context section of the project document)
• Objectives: An explicit intent to address the biodiversity theme is expressed, preferably, at the level of the overall objective or specific objective(s) or expected results
• Activities: The intervention includes activities that clearly address identified issues in relation to the biodiversity theme
Weighting system for scoring activities with relevance for biodiversity
According to the OECD DAC Marking scoring logic, the level of biodiversity relevance is indicated by a DAC Marker 1 or 2:
• DAC Marker 2 indicates that the project has been undertaken specifically to contribute positively to biodiversity (principal objective).
• DAC Marker 1 indicates that elements of the project contribute positively to biodiversity (significant objective).

14
Drawing on the DAC approach, the GFM weights finance for projects which are primarily dedicated to biodiversity conservation as 100% of their value (principal objective). Finance for projects in other categories which have biodiversity benefits is weighted as 30%,8 or at the internal rate used by the reporting member institution if one is provided (significant objective or co-benefit).
It should be noted that this methodology is not widely used yet: only seven out of the 26 IDFC members reported biodiversity finance. Common principles for biodiversity finance tracking – as they exist for climate finance – still need to be built, in coherence with the forthcoming post-2020 Global Biodiversity Framework. While providing a first picture for tracking
8 30% was used as a conservative approach for mainstreaming biodiversity into climate projects, rather than the 40% more typically used/recommended by OECD guidance.
biodiversity investment, the methodology presented here will need to be refined to better reflect the CBD goals (i.e., protection, restoration, integrated spatial management, governance, sustainable management of natural resources, reduction of local pressures). So far, the flat rate applied to all projects marked as “DAC 1” does not allow to identify the goal of investments with respect to biodiversity, as opposed to the GFM framework used for climate finance which allows to specify whether finance is reported towards climate mitigation or adaptation goals of the Paris Agreement.

15
3. GREEN FINANCE MAPPING OUTCOMES
9 All figures are in US dollars nominal values unless otherwise stated.
This report outlines green finance commitments by IDFC members in three major categories: climate finance, biodiversity finance and finance for other environment objectives.
Climate finance is composed of financial flows for green energy and mitigation of greenhouse gases (GHG) (henceforth ‘mitigation’), adaptation to climate change, and projects that include elements of both mitigation and adaptation. Biodiversity finance includes, for example, finance for water supply, wastewater treatment, biodiversity conservation and waste management, among others. In many cases, climate-related activities also have biodiversity co-benefits and vice versa (e.g., a forestry project which includes, as a significant objective, the protection and sustainable management of biodiversity-rich ecosystems). These co-benefits are assigned a specific weight depending on whether biodiversity was the principal objective or a significant objective, as explained in Section 2.1. The category of other environmental objectives includes finance for all those activities that have no climate and biodiversity
co-benefits. These may include projects which do not clearly integrate activities dedicated to biodiversity and nature-based solutions (e.g., municipal wastewater treatment).
In 2020, cumulative green finance commitments by IDFC members since the 2015 Paris Agreement surpassed $1 trillion9. This is a major milestone, which materializes IDFC members’ ability to deliver on unprecedented flows of green finance.
New green finance commitments by 21 IDFC members who responded to the GFM survey reached $185 billion in 2020 (Figure 1), a decline by 6% from 2019 which was primarily driven by the impact of the COVID-19 pandemic. In 2020, green finance represented 20% of total new commitments by the members: climate finance represented $178 billion accounting for 96% of total green finance, whereas finance for projects targeting solely biodiversity was $5.4 billion (3%). Within climate finance, $8.6 billion was dedicated to projects with biodiversity co-benefits. Therefore, total biodiversity finance in 2020 reached $14 billion. An additional $1.4 billion was reported for other
Figure 1. Breakdown of IDFC green finance commitments in 2020 ($ billion)

16
environment objectives.
Adaptation finance continued to grow, increasing by 42% over 2019 and more than fivefold compared to 2016 to reach $27.4 billion. This is aligned with the need to globally scale up adaptation finance, which still lags behind mitigation finance and represents only a small portion of overall annual climate finance commitments – 7.3% in 2019/2020 (CPI, 2021). Mitigation finance suffered a shortfall in 2020, driven, at least in part, by the COVID-19 pandemic and the need to allocate resources to emergency response
and economic recovery. Despite this challenge, six institutions (CABEI, CAF, CDP, JICA, KfW and TSKB) increased their green commitments in 2020, compared to 2019 (Figure 2).
Table 1 provides an overview of each IDFC institution’s green finance commitments in 2020 compared to 2018/2019 broken down by category. Further findings on climate finance are discussed in Section 3.1 whereas Section 3.2 describes financial commitments to biodiversity in detail.
Figure 2. Breakdown of IDFC green finance commitments in 2015-2020 ($ billion)

17
Table 1. Green finance commitments by IDFC member in 2020 as compared to 2019 ($billion)
Location of IDFC member
Reporting member institutions in 2020
Green energy and mitigation of GHGs Adaptation
Both mitigation and adaptation
Other environment
Biodiversity (weighted/total)
Biodiversity (weighted/non-double-counted)
Total green commitments
2019 2020 2019 2020 2019 2020 2019 2020 2020 2020 2019 2020
Europe
KfW 28235 49162 2437 4243 629 1095 1314 200 566 32616 54700AFD 3056 2675 1154 1081 2761 3108 80 710 38 7052 6902VEB 6686 626 6686 626CDP 2559 3183 14 1358 494 205 260 3327 4746TSKB 227 435 5 232 435BSTDB 270 147 25 295 147IIBHBOR 142 125 142 125Sub-total 41175 56353 3605 6682 3884 4408 1684 200 1276 38 50350 67680
Latin America and the Caribbean
CAF 1613 1556 161 1722 758 830 29 2532 3307BE (Banco Estado)BNDES 1983 1408 263 104 104 2246 1512BCIE/CABEI 550 1027 286 435 251 1087 1462
Bancoldex 117 25 1 118 25COFIDE 101 101BICE 77 77NAFIN 0Sub-total 4441 4016 447 2157 1272 0 934 133 6161 6306
Africa
DBSA 357 103 28 1 1 65 93 1 449 198TDB 153 12 10 176BOAD 34 34 23 16 28 16 101 49CDG 38 39Sub-total 544 137 63 17 38 1 119 93 1 764 247
Asia and MENA
CDB 110743 80390 14453 14822 6822 11658 5264 132018 100475JICA 5527 5000 720 3783 246 224 1062 182 9 6471 10100KDB 882 527 882 527PTSMI 92 25 92 25ICD 50 50SIDBISub-total 117294 85942 15174 18605 246 7046 1062 11840 5273 139514 111128
Total
163455 146447 19289 27461 3923 4655 10121 1354 14051 5444 196789 185361

18
3.1 CLIMATE FINANCE
3.1.1 CLIMATE FINANCE COMMITMENTS BY USE
Climate finance commitments by IDFC members is tracked across three broad categories:
1. Green energy and mitigation of greenhouse gases (GHG);
2. Adaptation; and
3. Projects with both mitigation and adaptation elements.
In 2020, finance for green energy and mitigation of GHG was the largest category and accounted for 82% of the total $178 billion climate finance. However, in the context of a challenging year, mitigation finance declined 10%, primarily driven by lower commitments for the transport sector. While the COVID-19 pandemic has certainly played a role, lower mitigation commitments in these sectors can also be partially explained by the rapid decline in some technology costs. Thanks to these dramatic cost reductions, the same asset would require a lower investment in 2020 than in previous years, hence lower financial commitments do not necessarily mean fewer assets being financed.
Adaptation projects represented 15% of climate finance, an increase of 42% from 2019. This continues four years of consecutive growth, achieving over five times the level of adaptation commitments in 2016. Finance to projects containing elements of both mitigation and adaptation has been steadily increasing but remains a small portion of the total, at 2.6%.
Green energy and GHG mitigation
Within $146 billion committed for mitigation projects, the transport sector continues to receive the most finance – $56 billion or 38% of the total (Figure 3). The share of transport, however, reduced by 12% compared to 2019. Energy efficiency finance reached $40 billion representing 27% of total mitigation finance, up by 11% compared to 2019. This is an encouraging trend given that energy efficiency has long been underfinanced and can play a key role in sustainable post-COVID recovery packages. Renewable energy remained stable compared to 2019, at $35 billion, or 24% of total mitigation finance (see Figure 3).
Figure 3. Green finance commitments to green energy and mitigation of GHG by subcategory, 2015-2020 (percent and $ billion)
Note: For KfW, the breakdown of domestic finance flows was estimated based on figures reported in 2019.

19
As shown in Figure 4, in 2020 most renewable energy finance was committed for wind, accounting for $13 billion, or 38% of the total commitments. Finance for wind projects was mainly provided by institutions based in non-OECD countries ($12.7 billion). In 2020, IDFC members further committed $8.3 billion to unattributed renewable generation investment (from OECD-based institutions), $7 billion to hydropower (mainly from non-OECD based institutions) and $4 billion to solar generation. Compared to 2019, hydropower investments were up 23%, while solar and wind commitments were down 38% and 31%, respectively. The majority of solar investment in 2020 ($3.5 billion) was provided by institutions based in non-OECD countries.
Finance for other mitigation sectors (i.e., agriculture, forestry and land use, lower-carbon and efficient energy generation, and others) totaled $15 billion, or 10% of total mitigation finance. In particular, finance for agriculture, forestry and land use increased by 25% compared to 2019, reaching $6.3 billion (Figure 3).
Of the $146 billion committed by IDFC members to climate mitigation, 58% was provided by institutions based in non-OECD countries (Figure 5). Non-OECD institutions’ international commitments to other non-OECD countries were $0.4 billion. OECD institutions’ overall commitments to mitigation increased from $41 billion in 2019 to $60 billion in 2020, where most of the increase is attributable to financing in home country. Mitigation finance committed by institutions based in OECD countries to non-OECD countries amounted to $10 billion.
Adaptation
Adaptation finance reached $27.5 billion in 2020 increasing 42% over 2019 and more than fivefold compared to 2016. IDFC members increased commitments towards disaster risk reduction by $4 billion compared to 2019 reaching $10 billion in 2020 (Figure 6). Finance for water preservation was $14 billion in 2020, a $3 billion increase compared to 2019. These two sub-categories continue to be the main activities (88%) where adaptation finance flows.
Note: For KfW, the breakdown of domestic finance flows was estimated based on figures reported in 2019.
Figure 4 | Commitments to renewable energy technologies by technologies and OECD and non-OECD based

20
Figure 7 shows the domestic and international flows to adaptation projects, broken down by the location of the funding institution. Non-OECD institutions’ commitments to adaptation in their home countries represented the dominant share, at 61%, up by $2 billion in 2020, compared to 2019. Approximately $36 million went to other non-OECD institutions in 2020. OECD institutions’ adaptation financing in their home country increased by $4 billion in 2020, equalling to 15% of total adaptation finance. In 2020, these
institutions increased their adaptation financing to non-OECD countries by $2 billion compared to 2019, reaching a total of $6 billion.
Tracking adaptation finance is difficult, as standardized definitions and methodologies for measuring adaptation benefits are less developed compared to mitigation activities. Based on the MDB-IDFC Common Principles, adaptation finance consists of projects with a stated intent to address any identified climate risks,
Figure 5 | Commitments to green energy and mitigation of GHGs from IDFC members in 2020 (percent and $ billion)
Figure 6 | Green finance commitments to adaptation by subcategory, 2015-2020 (percent and $ billion)
Note: For KfW, the breakdown of domestic finance flows was estimated based on figures reported in 2019.

21
vulnerabilities and impacts, and requires adaptation activities to be disaggregated from non-adaptation activities as far as reasonably possible. Box 2 depicts
an example of adaptation project financed by JICA in Indonesia in 2020.
Figure 7 | Commitments for adaptation to climate change from OECD and non-OECD IDFC members, 2015-2020 (percent and $ billion)
Box 2: Adaptation project case study: JICA in Indonesia – Disaster Resilience Enhancement and Management Program
Indonesia is already prone to floods, earthquakes, volcanic eruptions, and other natural disasters; a situation that threatens to worsen in the face of climate change. 2018 was a particularly difficult year for the country which suffered heavy casualties and large financial loss from a series of earthquake- and tsunami-related disasters. The Ministry of Finance estimates annual disaster-related economic loss in Indonesia to be approximately $1.64 billion. This compares to an annual disaster response fund (the “Dana Cadangan”) of $227 million set aside by the government.
In June 2019, the Government of Indonesia launched the Disaster Resilience Enhancement and Management (DREAM) Program, in collaboration with the Government of Japan, through JICA to support the implementation of disaster-related policies and strategies via policy dialogue, and strengthen the country’s capacity to deal with natural disasters.
JICA is particularly active in the disaster-risk reduction (DRR) space, working to support and improve policies and systems relating to disaster prevention, while providing technical assistance and capacity building to enhance the resilience of societies to natural disasters. In February 2020 and March 2021, JICA signed two Official Development Assistance (ODA) loans with the Government of Indonesia, providing JPY 31.8 billion ($290 million) and JPY 50 billion ($450 million), respectively, in support of the DREAM Program. Concurrent with the Sendai Framework for Disaster Risk Reduction, 2015-2030, the Program was expected to help Indonesia along four key dimensions: strengthening DRR governance and mainstreaming; promoting understanding of disaster risk; promoting investment in DRR resilience; and ensuring the country Builds Back Better in recovery, rehabilitation, and reconstruction.
The Program was executed by the Ministry of National Development Planning between June 2019 and June 2021, with related line ministries including the Ministry of Public Works and National Housing, National Disaster Management Agency, etc., supported by various experts of integrated water resource management and earthquake/tsunami analysis. In addition to the ODA loans a grant aid project was implemented to develop a disaster observation network, including the provision of seismometers.
In line with JICA’s stated priority to enhance climate risk assessment and countermeasures, the Program aimed to increase Indonesia’s capacity to respond to the risk of floods via the installation of a flood early warning system. The Program also contributes to adaptation to climate change through climate risk mitigation by strengthening resilience to disasters which is incorporated into The Government Work Plan (RKP) based on The National Medium Term Development Plan (RPJMN) 2020-2024, Disaster Management Master Plan (DMMP) 2020-2044, Disaster Risk Reduction (DRR) strategies/plans, and contingency plan.
In July 2021, AFD joined JICA in supporting the DREAM Program, signing a loan agreement for EUR 100 million ($115 million). Along with Climate Action (SDG 13), the Program is designed to simultaneously work towards achieving Sustainable Cities and Communities (SDG 11) in Indonesia.
Source: JICA (2021).
22
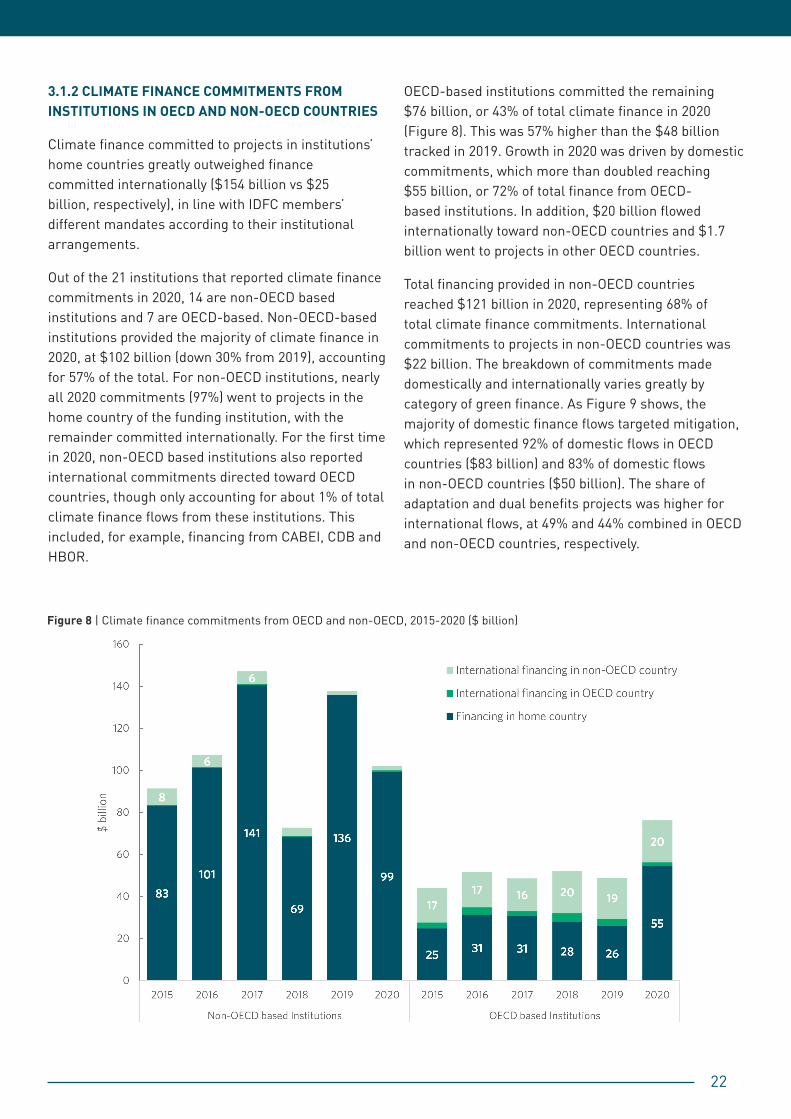
3.1.2 CLIMATE FINANCE COMMITMENTS FROM INSTITUTIONS IN OECD AND NON-OECD COUNTRIES
Climate finance committed to projects in institutions’ home countries greatly outweighed finance committed internationally ($154 billion vs $25 billion, respectively), in line with IDFC members’ different mandates according to their institutional arrangements.
Out of the 21 institutions that reported climate finance commitments in 2020, 14 are non-OECD based institutions and 7 are OECD-based. Non-OECD-based institutions provided the majority of climate finance in 2020, at $102 billion (down 30% from 2019), accounting for 57% of the total. For non-OECD institutions, nearly all 2020 commitments (97%) went to projects in the home country of the funding institution, with the remainder committed internationally. For the first time in 2020, non-OECD based institutions also reported international commitments directed toward OECD countries, though only accounting for about 1% of total climate finance flows from these institutions. This included, for example, financing from CABEI, CDB and HBOR.
OECD-based institutions committed the remaining $76 billion, or 43% of total climate finance in 2020 (Figure 8). This was 57% higher than the $48 billion tracked in 2019. Growth in 2020 was driven by domestic commitments, which more than doubled reaching $55 billion, or 72% of total finance from OECD-based institutions. In addition, $20 billion flowed internationally toward non-OECD countries and $1.7 billion went to projects in other OECD countries.
Total financing provided in non-OECD countries reached $121 billion in 2020, representing 68% of total climate finance commitments. International commitments to projects in non-OECD countries was $22 billion. The breakdown of commitments made domestically and internationally varies greatly by category of green finance. As Figure 9 shows, the majority of domestic finance flows targeted mitigation, which represented 92% of domestic flows in OECD countries ($83 billion) and 83% of domestic flows in non-OECD countries ($50 billion). The share of adaptation and dual benefits projects was higher for international flows, at 49% and 44% combined in OECD and non-OECD countries, respectively.
Figure 8 | Climate finance commitments from OECD and non-OECD, 2015-2020 ($ billion)

23
3.1.3 CLIMATE FINANCE COMMITMENTS BY INSTRUMENT TYPE
As in previous years, loans were the primary vehicle through which IDFC member institutions committed climate finance, in line with the typology of their port-folios, accounting for $169 billion or 94% of the 2020 total, with concessional and non-concessional loans accounting for 29% and 62%, respectively. Finance committed in the form of grants increased by 61% in 2020 to $6 billion, or 4% of total climate finance. This share of grants in IDFC climate finance commitments is similar to the overall share of grants contributed by
all development finance institutions in global climate finance flows (GLCF, 2021). The overall share of grants in global climate finance has been steadily increasing over the past five years, as public actors seek to build strong enabling environments and undertake demon-stration projects for sustainable investment across a range of sectors. Other instruments, such as guaran-tees and equity, continue to account for only a small percentage (2%) of IDFC climate finance commitments.
Figure 10 shows the breakdown of climate financing received by instrument type from 2015 to 2020, while Figure 11 demonstrates the variation by category
Figure 9 | Proportion of domestic and international climate finance commitments by category in 2020 (percent and $ billion)
Note: For KfW, the breakdown of domestic finance flows was estimated based on figures reported in 2019.
Figure 10 | Climate finance commitments by instrument type, 2015-2020 (percent and $ billion)
Note: For KfW, the breakdown of domestic finance flows was estimated based on figures reported in 2019.

24
and year. Non-concessional (i.e., market-rate) loans to mitigation decreased to $91 billion, while conces-sional loans and grants increased to $44 billion and $4 billion. Both non-concessional and concessional loans for adaptation projects increased in 2020, reaching $17 billion and $6 billion, respectively.
3.1.4 CLIMATE FINANCE COMMITMENTS BY GEOGRAPHIC DESTINATION
Figure 12 shows the distribution of climate finance by geographic destination in 2020. The majority of com-mitments ($98.9 billion) went to the East Asia and Pacific region, accounting for 55% of total climate finance flows. Western Europe10 received the second largest amount of commitments at $54.5 billion (or 31% of the total), a substantial increase on $28 billion (15%) in 2019. Climate finance commitments reaching Eastern Europe and Central Asia fell from $9.9 billion (5%) in 2019 to $2.8 billion (1.6%), mainly due to lower commitments in energy efficiency, while commitments to the other remaining regions remained largely the same between 2019 and 2020. These trends reflect the IDFC members’ relative scale within their region of
10 Reported as the European Union and the United Kingdom. Please refer to Appendix B for more details about regional groupings used for this analysis.
operation and their wider climate mandates.
The East Asia and Pacific region received the majority of commitments going to mitigation and adaptation, recording $80.4 billion and $18.1 billion, respectively. This accounted for 55% and 66% of total commitments in each category. Sub-Saharan Africa received the highest amount of commitments going to projects with both mitigation and adaptation objectives (multiple objectives), at $1.1 billion, or 24% of the total commit-ments in this category.
3.1.5 MOBILIZED PRIVATE FINANCE
IDFC green finance tracking has included private sector mobilization since 2014, but generalizable findings remain difficult primarily due to limited data and varying methodologies. In this mapping exercise, the IDFC survey included a simplified template for members to report their total commitments to projects receiving co-financing from private institutions, as well as from other IDFC institutions and other public institutions. Where possible, member institutions also disaggregated their reported mobilized finance by the financial instrument used.
Note: For KfW, the breakdown of domestic finance flows was estimated based on figures reported in 2019.
Figure 11 | Climate finance commitments by instrument and category, 2015-2019 (percent and $ billion)

25
Among the six institutions reporting co-financing data, five members provided an instrument breakdown and four members provided data at the project-level.
In total, these institutions reported around $3.6 billion mobilized in co-financing for climate finance projects from other public and private institutions. The majority of this was provided by private institutions ($3 billion) followed by other public institutions and other IDFC institutions (Figure 13). Mitigation received the largest share of co-finance from private institutions and other public institutions. Adaptation received only $54 million in co-financing from private institutions. While this reflects a significant adaptation finance gap, this result is partly due to challenges in tracking and accounting
for private investment in adaptation sectors.
Among co-financing received from private institutions, concessional loans accounted for the largest share at 63% (up from 14% in 2019), followed by non-concessional loans at 35% (down from 61% in 2019).
Box 3 provides an overview of the Bio-CLIMA Project in Nicaragua, financed by CABEI and which received co-financing from the Green Climate Fund (GCF) and the Global Environment Facility (GEF).
Going forward, blended finance, using a mixture of concessional- and commercial-capital, will be crucial to crowding-in private sector investment to help
Figure 12 | Climate finance commitments by geographic destination in 2020
Figure 13 | Co-finance mobilized for climate finance projects in 2020, by source and category ($ billion)
26
deliver on the Paris Agreement.
3.2 BIODIVERSITY FINANCE
In addition to climate finance, this edition of the GFM tracks finance flows to projects delivering biodiversity benefits. These can include financial flows targeting biodiversity either as a primary objective or as a co-benefit to interventions targeting climate or other environmental issues. In previous editions of the GFM, IDFC members could already report on biodiversity as a sub-category of the ‘Other Environment’ category.
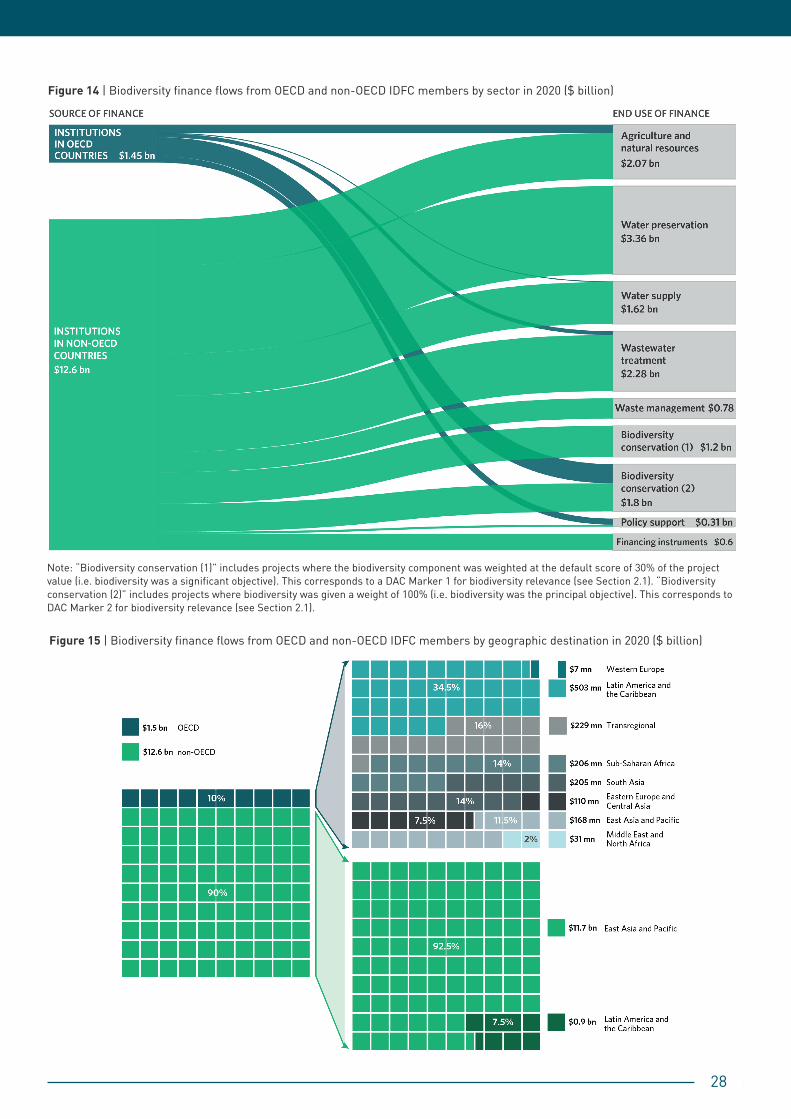
For 2020, seven IDFC institutions reported investments in biodiversity, namely AFD, BNDES, CAF, CDB, DBSA, JICA, and KfW, for a total commitment of $14 billion, or 7.5% of total green finance in 2020. 39% of these commitments ($5.4 billion) went to projects which had biodiversity as the sole objective. An additional $8.6 billion was further invested in climate finance projects
simultaneously reporting biodiversity objectives. In particular, 4.6% of these dual-benefits projects had biodiversity objectives with an internal weight higher than 50% of the total value of the project.
Box 4 provides an example of project funded by AFD in Madagascar which showed clear co-benefits and was therefore tagged as both biodiversity and adaptation finance.
The relatively low level of reporting for biodiver-sity finance is not surprising given this was the first attempt to track these financial commitments as part of the GFM. Therefore, reported figures only partly reflect IDFC members activities in the field. IDFC members are committed to continue improving the methodology for tracking biodiversity finance in the coming years, making it more refined, specific, and harmonised.
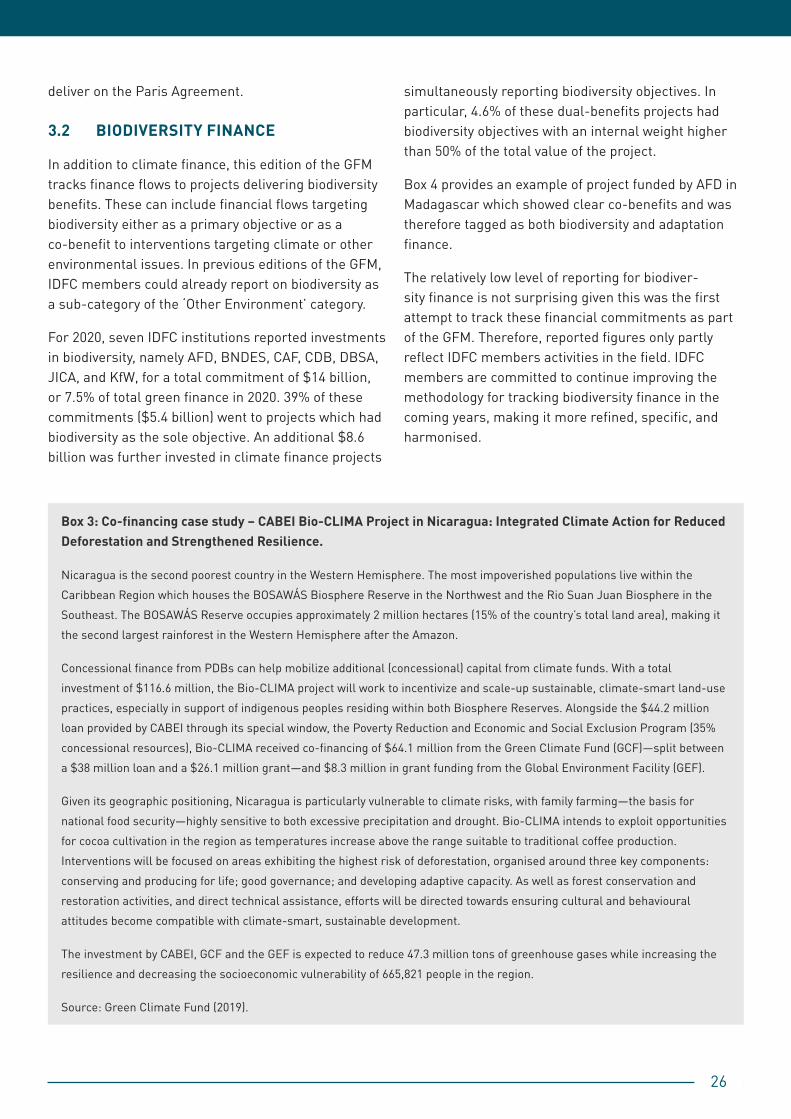
Box 3: Co-financing case study – CABEI Bio-CLIMA Project in Nicaragua: Integrated Climate Action for Reduced Deforestation and Strengthened Resilience.
Nicaragua is the second poorest country in the Western Hemisphere. The most impoverished populations live within the Caribbean Region which houses the BOSAWÁS Biosphere Reserve in the Northwest and the Rio Suan Juan Biosphere in the Southeast. The BOSAWÁS Reserve occupies approximately 2 million hectares (15% of the country’s total land area), making it the second largest rainforest in the Western Hemisphere after the Amazon.
Concessional finance from PDBs can help mobilize additional (concessional) capital from climate funds. With a total investment of $116.6 million, the Bio-CLIMA project will work to incentivize and scale-up sustainable, climate-smart land-use practices, especially in support of indigenous peoples residing within both Biosphere Reserves. Alongside the $44.2 million loan provided by CABEI through its special window, the Poverty Reduction and Economic and Social Exclusion Program (35% concessional resources), Bio-CLIMA received co-financing of $64.1 million from the Green Climate Fund (GCF)—split between a $38 million loan and a $26.1 million grant—and $8.3 million in grant funding from the Global Environment Facility (GEF).
Given its geographic positioning, Nicaragua is particularly vulnerable to climate risks, with family farming—the basis for national food security—highly sensitive to both excessive precipitation and drought. Bio-CLIMA intends to exploit opportunities for cocoa cultivation in the region as temperatures increase above the range suitable to traditional coffee production. Interventions will be focused on areas exhibiting the highest risk of deforestation, organised around three key components: conserving and producing for life; good governance; and developing adaptive capacity. As well as forest conservation and restoration activities, and direct technical assistance, efforts will be directed towards ensuring cultural and behavioural attitudes become compatible with climate-smart, sustainable development.
The investment by CABEI, GCF and the GEF is expected to reduce 47.3 million tons of greenhouse gases while increasing the resilience and decreasing the socioeconomic vulnerability of 665,821 people in the region.
Source: Green Climate Fund (2019).
27
3.2.1 BIODIVERSITY FINANCE COMMITMENTS FROM INSTITUTIONS IN OECD AND NON-OECD COUNTRIES
Out of the seven institutions that reported biodiversity finance flows, four are based in non-OECD countries (BNDES, CAF, CDB and DBSA) while three are OECD-based (AFD, JICA, KfW).
Institutions based in non-OECD countries provided the majority of biodiversity finance in 2020, having committed $12.6 billion, or 90% of the total. Institutions based in OECD countries accounted for the remaining $1.5 billion committed for biodiversity projects in 2020, or 10% of the total.
In terms of biodiversity sectors (see Appendix D), institutions based in non-OECD countries invested $3.4 billion in water preservation (27% of the total commitments from these institutions), $2.2 billion in biodiversity conservation (18%) and $2.1 billion in wastewater treatment (17%). A third of investments from these institutions also went to agriculture and natural resources ($1.7 billion) and water supply ($1.6 billion) (Figure 14).
Financing from OECD-based institutions was more concentrated in a handful of sectors. Half of commitments ($732 million) was directed to biodiversity conservation projects, followed by agriculture and natural resources (22% or $324 million). Support to national, regional, or local policy, through technical assistance or policy lending accounted for 16% of commitments from these institutions ($229 million), while wastewater treatment received 10% ($145 million).
For non-OECD based institutions, nearly all 2020 commitments (93%) went to projects in East Asia and Pacific. The remaining 7% of finance from non-OECD based institutions was directed to projects in Latin America and the Caribbean ($926 million). It should be noted that, given the low number of IDFC members reporting on biodiversity finance (seven out of 26), the specific geographic focus of these institutions inevitably affects the geographical distribution of commitments.
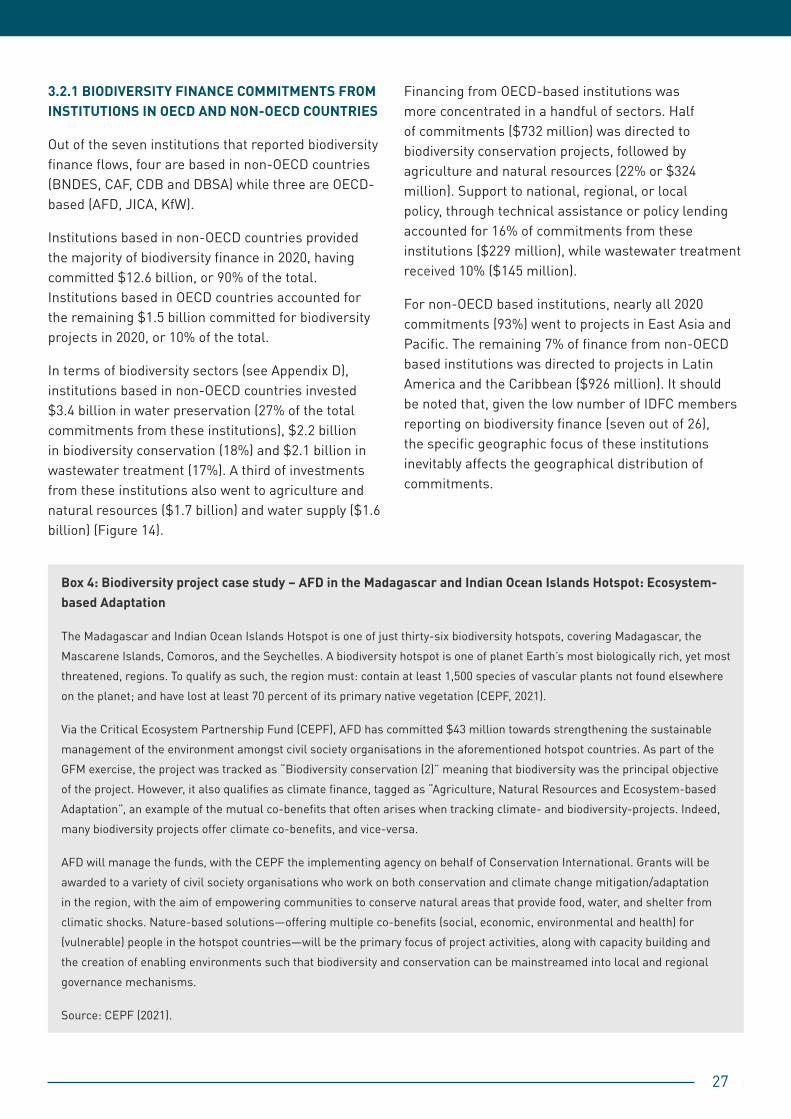
Box 4: Biodiversity project case study – AFD in the Madagascar and Indian Ocean Islands Hotspot: Ecosystem-based Adaptation
The Madagascar and Indian Ocean Islands Hotspot is one of just thirty-six biodiversity hotspots, covering Madagascar, the Mascarene Islands, Comoros, and the Seychelles. A biodiversity hotspot is one of planet Earth’s most biologically rich, yet most threatened, regions. To qualify as such, the region must: contain at least 1,500 species of vascular plants not found elsewhere on the planet; and have lost at least 70 percent of its primary native vegetation (CEPF, 2021).
Via the Critical Ecosystem Partnership Fund (CEPF), AFD has committed $43 million towards strengthening the sustainable management of the environment amongst civil society organisations in the aforementioned hotspot countries. As part of the GFM exercise, the project was tracked as “Biodiversity conservation (2)” meaning that biodiversity was the principal objective of the project. However, it also qualifies as climate finance, tagged as “Agriculture, Natural Resources and Ecosystem-based Adaptation”, an example of the mutual co-benefits that often arises when tracking climate- and biodiversity-projects. Indeed, many biodiversity projects offer climate co-benefits, and vice-versa.
AFD will manage the funds, with the CEPF the implementing agency on behalf of Conservation International. Grants will be awarded to a variety of civil society organisations who work on both conservation and climate change mitigation/adaptation in the region, with the aim of empowering communities to conserve natural areas that provide food, water, and shelter from climatic shocks. Nature-based solutions—offering multiple co-benefits (social, economic, environmental and health) for (vulnerable) people in the hotspot countries—will be the primary focus of project activities, along with capacity building and the creation of enabling environments such that biodiversity and conservation can be mainstreamed into local and regional governance mechanisms.
Source: CEPF (2021).
28
Figure 14 | Biodiversity finance flows from OECD and non-OECD IDFC members by sector in 2020 ($ billion)
Note: “Biodiversity conservation (1)” includes projects where the biodiversity component was weighted at the default score of 30% of the project value (i.e. biodiversity was a significant objective). This corresponds to a DAC Marker 1 for biodiversity relevance (see Section 2.1). “Biodiversity conservation (2)” includes projects where biodiversity was given a weight of 100% (i.e. biodiversity was the principal objective). This corresponds to DAC Marker 2 for biodiversity relevance (see Section 2.1).
Figure 15 | Biodiversity finance flows from OECD and non-OECD IDFC members by geographic destination in 2020 ($ billion)

29
Biodiversity finance provided by OECD-based institutions was more equally distributed among regions and was mainly invested internationally. The Latin America and the Caribbean region was the main destination having attracted 34% of commitments in 2020. Transregional flows accounted for 16%, while South Asia and Sub-Saharan Africa received 14% each, followed by East Asia and Pacific at 12% (Figure 15).
3.2.2 BIODIVERSITY FINANCE COMMITMENTS BY SECTOR
In 2020, the sector receiving the largest share of biodiversity finance was water preservation, at 24%
(or $3.4 billion), with funding coming from institutions based in non-OECD countries. Wastewater treatment was next at 17% ($2.3 billion) followed by agriculture and natural resources ($2.1 billion). Biodiversity conservation projects, including both those having biodiversity as a principal and a significant objective, accounted together for 22%, or $3 billion. As shown in Figure 16, all sectors received the majority of their financing from IDFC members based in non-OECD based countries, with the exception of policy support where 75% of financing in 2020 was provided by OECD-based institutions.
Figure 16 | Biodiversity finance flows from OECD and non-OECD IDFC members by geographic destination in 2020 ($ billion)

30
4. ALIGNMENT WITH THE PARIS AGREEMENTThe concept of alignment with the Paris Agreement has set a renewed context for climate action within the financial community, in particular amongst Public Development Banks, and has become fertile ground for research, as well as a topic of discussion in international climate negotiations.
National and regional development institutions can play a crucial role in efforts to shift global finance toward a sustainable future. They are best placed to enable strong interconnections between public and private sectors and have an important capacity to redirect financing flows towards activities that are vital to the transition to low carbon and climate-resilient economies. In particular, IDFC member institutions can act as game-changers in the achievement of long-term national climate objectives.
In support of making flows consistent with a pathway towards low greenhouse gas emissions and climate resilient development, IDFC members, along with MDBs, pledged to align finance flows with the Paris Agreement at the One Planet Summit in December 2017 (MDBs and IDFC, 2017). Since then, IDFC has made considerable progress to advance understanding of Paris alignment and mobilize action towards alignment. In September 2019, at the occasion of the United Nations Secretary-General’s climate summit in New York, and then at COP24, IDFC members published a position paper (IDFC, 2018) and a study (CPI and I4CE, 2019), commissioned with the European Climate Foundation, fleshing out the meaning of alignment, along six core principles:
- Increasingly mobilize finance for climate action
- Support country-led climate related policies
- Seek to catalyze investments, and to mobilize private capital (local and international)
- Recognize the importance of adaptation and resilience, especially in most vulnerable countries
- Support the transition from fossil fuels to renewables financing
- Engage a process of internal transformation of the institutions
In support of the above commitments, IDFC commissioned a clear and practical guide on how to reach a better alignment of each member’s strategies, programs, and operations, with the requirements of the Paris Agreement. This operationalization framework, produced by the two independent think tanks NCI and I4CE and published in June 2021, provides some useful guidelines on how IDFC members—and the financial community at large—can go further, ensuring that their whole portfolios (not just the climate finance portions) are supportive of, or at least do not undermine, the objectives of the Paris Agreement.
As each institution is different, this report does not seek to define a common methodology to be applied by all, but instead presents a “menu of options,” with a number of actionable recommendations, tools and processes designed to align any financial institutions’ vision with the goals of the Paris Agreement at the country, strategic, and operational levels. Indeed, aligning with the Paris Agreement will also require a process of internal transformation amongst all actors, developing the appropriate institutional architecture and internal capacity to deliver on alignment targets (I4CE and NCI, 2021). Moreover, it has been acknowledged that ensuring Paris alignment also means ensuring alignment of intermediated finance, therefore, clear rules and guidance on this should be devised moving forward (NCI, 2021).
Other recent developments include: the Joint Declaration issued by 453 Public Development Banks worldwide at the inaugural Finance in Common Summit (2020) to help green the financial system (see Box 1); and the launch of the internal IDFC Climate Facility in 2019. The Facility aims to further institutionalize and facilitate collaboration among members on climate change, while strengthening the capacity of development banks to design climate mitigation and adaptation projects, as well as new joint business opportunities in this area. The Facility will also support project preparation and mobilization of international co-financing for projects to support IDFC members on the above commitments. A part of this work will involve further development of standardized definitions for green financing activities and common
31
principles for finance tracking, with inputs from all IDFC members.
The newly released MDB-IDFC Common Principles for Climate Mitigation Finance Tracking (2021), whose implementation will be an important focus for the Climate Facility moving forward, considers new mitigation activities that can help achieve the structural changes demanded by the Paris Agreement. This refresh of the Common Principles will be reflected in future iterations of the GFM exercise and reporting requirements therein.
In addition to IDFC’s overarching Climate Facility, individual members have also worked to establish their own initiatives for catalysing climate- or climate-aligned finance (see Box 5).
Finally, the partnership with the GCF signed in June 2019 is an additional resource for IDFC members, as it supports further knowledge sharing on climate finance, integration of climate considerations in financial institutions, facilitates access to GCF resources (with co-financing from IDFC members and support to capacity building activities), as well as increasing joint outreach and awareness raising. In 2019, two new members of the club were accredited to the GCF (reaching a total of 13) and five projects submitted by members were approved by the GCF for an amount of $265 million (reaching a total of 15 projects representing $985 million of GCF co-financing to IDFC).
Moreover, during the first edition of the Finance in Common Summit in November 2020, IDFC and the GCF launched a joint publication titled “A strategic alliance to realize the full potential of public development banks in financing the green transition” examining how Public Development Banks (PDBs) can unlock their potential for a green, low carbon and resilient future. The five key pillars on which the GCF’s work can catalyze public capital are: co-financing and risk-sharing; promoting sound governance and management; deepening local capital markets; strengthening capacity and deal flow management; and facilitating access to the global climate finance landscape and key actors or networks therein (GCF and IDFC, 2020).
Box 5: Climate Finance Facility – Development Bank of Southern Africa (DBSA)
Housed by the Development Bank of Southern Africa, this private sector Climate Finance Facility (CFF) is the first of its kind in Africa, utilising the green bank model tailored to the specific regional requirements of Southern Africa. It is intended to alleviate market constraints inhibiting private sector investment, while helping to crowd-in and catalyse market-rate capital for infrastructure projects with mitigation and/or adaptation objectives. As such, it provides a key support unit for targeted countries (South Africa, Eswatini, Lesotho and Namibia) working towards meeting their Nationally Determined Contributions under the Paris Agreement.
Conceived of in 2017 at the San Giorgio Group meeting, convened by Climate Policy Initiative, the CFF is anchored by two funders - DSBA and the Green Climate Fund (GCF) - both of whom contributed $55 million along with additional grant funding to cover start-up costs. Convergence and ClimateWorks provided seed funding to support DBSA with the initial design and launch in 2019. The Facility has begun utilizing two main credit enhancement instruments—long-term subordinated debt and tenor extension—to facilitate access to market-rate capital at scale amongst commercially viable projects otherwise inhibited by local banking constraints.
The CFF is likely to play a crucial role in helping to meet Sustainable Development Goal 13 (Climate Action) in the Southern African region, along with other SDGs, including but not limited to, Goal 6 (Safe Water and Sanitation), Goal 7 (Affordable and Clean Energy) and Goal 8 (Decent Work and Economic Growth). Mitigation and adaptation projects incubated by the CFF are to be crafted with a gender lens, where possible, explicitly designed to benefit local communities and vulnerable groups.
Source: Convergence (2019); DBSA (2021).

32
5. CONCLUSIONS In 2020, IDFC institutions committed $185 billion in green finance, representing 20% of total new commitments made by reporting institutions. Compared to 2019 levels, green finance commitments declined 6%, primarily due to the unprecedented challenge posed by the COVID-19 pandemic and the need to reallocate public resources to emergency response and economic recovery.
Despite this challenge, in 2020, cumulative green finance commitments by IDFC members surpassed the $1 trillion mark since 2015, a major milestone which demonstrates the ability of IDFC members to deliver unprecedented flows of green finance. In 2020, six IDFC institutions reported higher overall green finance commitments, compared to 2019. At the same time, adaptation finance continued to grow, reaching a record-high investment of $27.5 billion, reflecting growing awareness around the need to build resilience to the impacts of climate change.
To better reflect the growing international recognition of the intersectionality between climate and biodiversity, as well as IDFC members’ efforts to scale-up investment in the conservation, sustainable use, and restoration of biodiversity, the GFM survey this year was improved to specifically track biodiversity finance commitments, alongside conventional climate finance and other environmental objectives. In 2020, seven members reported biodiversity finance flows for a total of $14 billion. The Convention on Biological Diversity (CBD) Conference of the Parties (COP 15) in October 2021 and Spring 2022 will set a post-2020 Global Biodiversity Framework of goals, outlining actions for countries. Much like the Paris Agreement, CBD COP 15 is expected to trigger financial commitments for alignment. In line with this
forthcoming framework, IDFC members will improve and harmonise the biodiversity finance tracking in coming years so as to increase and mainstream biodiversity in their investments, and align them to the post-2020 global biodiversity framework as is being done for climate finance commitments and the Paris Agreement.
While the COVID-19 pandemic may have negatively impacted green finance flows in 2020, in 2021 IDFC members have made strong pledges to climate action and green finance which will likely be reflected in next year’s GFM exercise.
At the 2017 One Planet Summit, IDFC members committed for the first time to align their finance flows with the Paris Agreement. In 2019, at the United Nations Climate Action Summit, they further pledged to mobilize significant financing volumes for achieving the Paris Agreement objectives and launched the IDFC Climate Facility to support members in their efforts to integrate climate change into their mandates and align their approaches to address the needs of financing related projects.
IDFC members are strategically positioned to strengthen climate action and promote a post COVID-19 green recovery. This is a real and much needed opportunity, given the scale and urgency of both the climate and health crises, their interlinkages, and mutual solutions. By scaling up finance and redirecting priorities toward green sectors, IDFC can support governments in the implementation of ambitious green recovery plans. Moreover, with their participation in green projects, they can also help further mobilize private investments. Finally, they are well positioned to foster effective collaboration and dialogue among market actors, governments, and regulators.

33
6. APPENDICES 6.1 APPENDIX A.1: LIST AND BRIEF DESCRIPTION OF IDFC OECD MEMBER
ORGANIZATIONS
6.2 APPENDIX A.2: LIST AND BRIEF DESCRIPTION OF IDFC NON-OECD MEMBER ORGANIZATIONS
REGION ORGANIZATION
Europe Agence Française de Développement (AFD), FranceBlack Sea Trade and Development Bank (BSTDB), GreeceCassa Depositi e Prestiti (CDP), ItalyIndustrial Development Bank of Turkey (TSKB), TurkeyKfW Bankengruppe, Germany
Central and South America Banco Estado (BE) ChileNacional Financiera (NAFIN), Mexico
Asia and MENA The Korea Development Bank (KDB), South KoreaJapan International Cooperation Agency (JICA), Japan
REGION ORGANIZATION
Europe Croatian Bank for Reconstruction and Development (HBOR), Croatia
Vnesheconombank (VEB.RF), Russia
Central and South America Banco de Inversion y Comercio Exterior S.A. (BICE), Argentina
Bancoldex S.A., Colombia
Banco Nacional de Desenvolvimento Econômico e Social (BNDES), Brazil
Central American Bank for Economic Integration (BCIE/CABEI), Honduras
Corporación Financiera de Desarrollo S.A. (COFIDE), Peru
Development Bank of Latin America (CAF), Peru
Africa Banque Ouest Africaine de Développement (BOAD), Togo
Caisse de Dépôt et de Gestion (CDG), Morocco
Development Bank of Southern Africa (DBSA), South Africa
The Trade and Development Bank (TDB), Burundi
Asia and MENA China Development Bank (CDB), China
PT Sarana Multi Infrastruktur (PT SMI)Indonesia Exim Bank, Indonesia
Small Industries Development Bank of India (SIDBI), India
Inter-regional institutions Islamic Corporation for the Development of the Private Sector (ICD), Saudi Arabia
International Investment Bank (IIB), Russia Hungary

34
6.3 APPENDIX B: METHODOLOGY GUIDANCE – DEFINITIONS AND TERMINOLOGY
DEFINITIONS AND TERMINOLOGY
With no standardized and internationally agreed definitions for green and climate finance, this methodology provides working definitions for both the terminologies. Green finance is a broad term that can refer to financial investments flowing into sustainable development projects and initiatives, environmental products, and policies that encourage the development of a more sustainable economy. Green finance includes: (i) climate finance; (ii) biodiversity finance (including, for example, for water supply, wastewater treatment, biodiversity conservation and waste management); and (iii) finance for other environmental objectives, that is finance for all those activities that have no climate and biodiversity co-benefits.
Within climate finance, mitigation financial flows refer to investments in projects and programmes that contribute to reducing or avoiding GHG emissions, whereas adaptation financial flows refer to investments that contribute to reducing the vulnerability of goods and persons to the effects of climate change. Thus, for the purposes of the mapping exercise, green finance is split into four separate categories/themes:
• Green energy and mitigation of GHG
• Adaptation to climate change impacts
• Biodiversity
• Other environmental objectives
To provide accurate and comparable data for this mapping exercise, a consistent categorization of mitigation and adaptation activities was agreed to by IDFC members, taking into consideration the outcomes of the MDBs-IDFC Common Principles for Climate Finance Tracking. This year, IDFC member further agreed on a categorization of biodiversity activities. The mapping exercise adopted a two-step approach based on:
• A global definition of mitigation, adaptation, and biodiversity projects. A list of definitions is provided in Table B1.
• A core list of project categories that were consensually accepted by all IDFC members as projects that typically contribute to tackling climate change. A list of project categories is provided in Appendix D.
The categories were adopted from the 2011 IDFC GFM methodology and updated according to the MDBs-IDFC Common Principles for Climate Finance Tracking. As there are significant challenges to unambiguously attributing specific investments to only one of the four themes, it was decided to split each theme into separate subcategories with clear project activity examples. The category on green energy and mitigation was also disaggregated further into sub-subcategories, based on the developed MDBs-IDFC Common Principles for Climate Mitigation Finance Tracking. This approach also helps to avoid double-counting of projects. Additional details on the themes, subcategories, and sub-subcategories are provided in Appendix D. In those cases where IDFC members did not have, or refrained from providing, subcategory information, non-attributed data were provided. In 2021, MDBs and IDFC agreed and released new Common Principles for Climate Mitigation Finance Tracking which take into account new mitigation activities in line with the structural changes required for the Paris Agreement. These newly released Common Principles will be reflected in future iterations of the GFM exercise and reporting requirements. Similarly, the methodology for biodiversity finance tracking will be further enhanced to integrate any relevant developments from the UN Biodiversity Conference (COP 15) with regards to the Post-2020 Global Biodiversity Framework. In this study, data provided are for financial flows committed in the year 2020 in the form of inter alia loans (concessional and non-concessional), grants, guarantees, equity, and mezzanine finance. A definition of financial instruments is provided in Table B2. New commitments refer to financial commitments signed or approved by the board of the reporting institution during 2020. Cross financial flows between IDFC banks are minimal in the green financing area and hence are not accounted for in the assessment. Table B3 shows the regional grouping used for the analysis of green finance flows this report, Table B4 provides a definition of private sector co-financing and Table B5 provides a definition of climate policies.
35
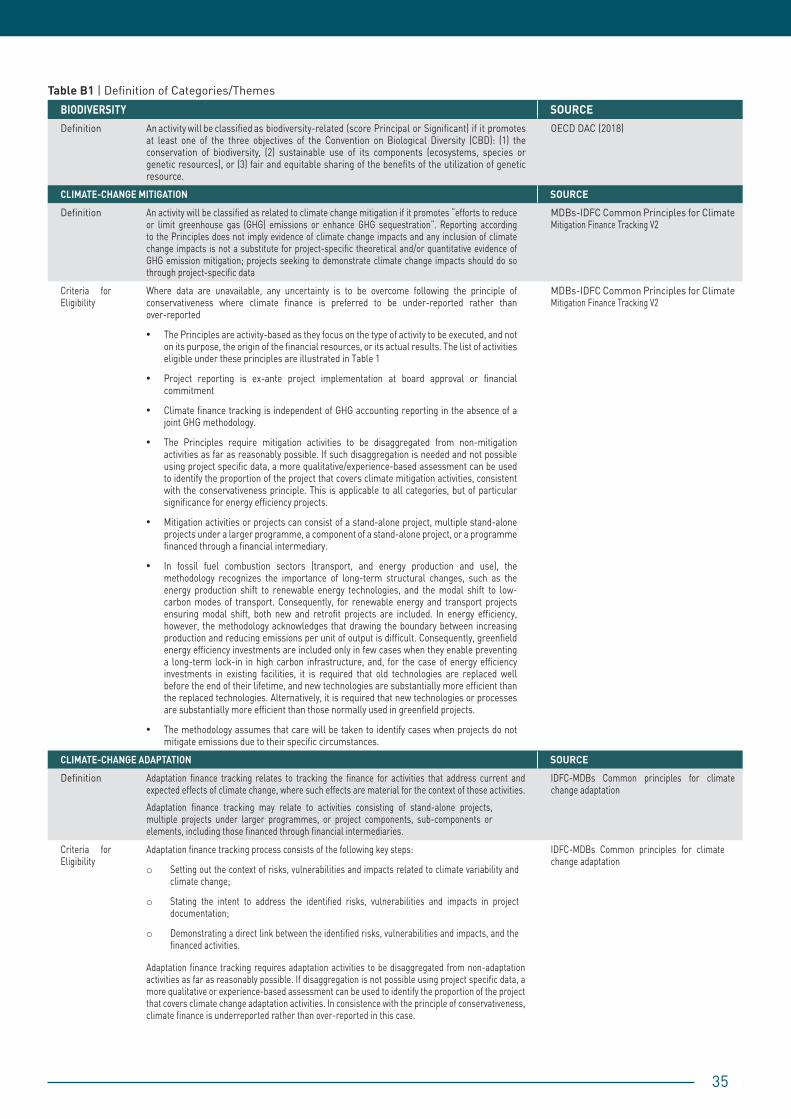
Table B1 | Definition of Categories/ThemesBIODIVERSITY SOURCEDefinition An activity will be classified as biodiversity-related (score Principal or Significant) if it promotes
at least one of the three objectives of the Convention on Biological Diversity (CBD): (1) the conservation of biodiversity, (2) sustainable use of its components (ecosystems, species or genetic resources), or (3) fair and equitable sharing of the benefits of the utilization of genetic resource.
OECD DAC (2018)
CLIMATE-CHANGE MITIGATION SOURCEDefinition An activity will be classified as related to climate change mitigation if it promotes “efforts to reduce
or limit greenhouse gas (GHG) emissions or enhance GHG sequestration”. Reporting according to the Principles does not imply evidence of climate change impacts and any inclusion of climate change impacts is not a substitute for project-specific theoretical and/or quantitative evidence of GHG emission mitigation; projects seeking to demonstrate climate change impacts should do so through project-specific data
MDBs-IDFC Common Principles for Climate Mitigation Finance Tracking V2
Criteria for Eligibility
Where data are unavailable, any uncertainty is to be overcome following the principle of conservativeness where climate finance is preferred to be under-reported rather than over-reported
• The Principles are activity-based as they focus on the type of activity to be executed, and not on its purpose, the origin of the financial resources, or its actual results. The list of activities eligible under these principles are illustrated in Table 1
• Project reporting is ex-ante project implementation at board approval or financial commitment
• Climate finance tracking is independent of GHG accounting reporting in the absence of a joint GHG methodology.
• The Principles require mitigation activities to be disaggregated from non-mitigation activities as far as reasonably possible. If such disaggregation is needed and not possible using project specific data, a more qualitative/experience-based assessment can be used to identify the proportion of the project that covers climate mitigation activities, consistent with the conservativeness principle. This is applicable to all categories, but of particular significance for energy efficiency projects.
• Mitigation activities or projects can consist of a stand-alone project, multiple stand-alone projects under a larger programme, a component of a stand-alone project, or a programme financed through a financial intermediary.
• In fossil fuel combustion sectors (transport, and energy production and use), the methodology recognizes the importance of long-term structural changes, such as the energy production shift to renewable energy technologies, and the modal shift to low-carbon modes of transport. Consequently, for renewable energy and transport projects ensuring modal shift, both new and retrofit projects are included. In energy efficiency, however, the methodology acknowledges that drawing the boundary between increasing production and reducing emissions per unit of output is difficult. Consequently, greenfield energy efficiency investments are included only in few cases when they enable preventing a long-term lock-in in high carbon infrastructure, and, for the case of energy efficiency investments in existing facilities, it is required that old technologies are replaced well before the end of their lifetime, and new technologies are substantially more efficient than the replaced technologies. Alternatively, it is required that new technologies or processes are substantially more efficient than those normally used in greenfield projects.
• The methodology assumes that care will be taken to identify cases when projects do not mitigate emissions due to their specific circumstances.
MDBs-IDFC Common Principles for Climate Mitigation Finance Tracking V2
CLIMATE-CHANGE ADAPTATION SOURCEDefinition Adaptation finance tracking relates to tracking the finance for activities that address current and
expected effects of climate change, where such effects are material for the context of those activities. Adaptation finance tracking may relate to activities consisting of stand-alone projects, multiple projects under larger programmes, or project components, sub-components or elements, including those financed through financial intermediaries.
IDFC-MDBs Common principles for climate change adaptation
Criteria for Eligibility
Adaptation finance tracking process consists of the following key steps:
o Setting out the context of risks, vulnerabilities and impacts related to climate variability and climate change;
o Stating the intent to address the identified risks, vulnerabilities and impacts in project documentation;
o Demonstrating a direct link between the identified risks, vulnerabilities and impacts, and the financed activities.
Adaptation finance tracking requires adaptation activities to be disaggregated from non-adaptation activities as far as reasonably possible. If disaggregation is not possible using project specific data, a more qualitative or experience-based assessment can be used to identify the proportion of the project that covers climate change adaptation activities. In consistence with the principle of conservativeness, climate finance is underreported rather than over-reported in this case.
IDFC-MDBs Common principles for climate change adaptation

36
INSTRUMENT DEFINITION
Loans A loan is a debt evidenced by a note that specifies, among other things, the principal amount, interest rate, and date of repayment.
…of which concessional loans Loans which are extended on terms substantially more generous than market loans. The concessionality is achieved either through interest rates below those available on the market or by longer pay back periods or a combination of these.
…of which non-concessional loans
Loans with regular market conditions
Grants Grants are transfers made in cash, goods, or services for which no repayment is required.
Other Instruments includes
Guarantee Formal assurance that liabilities of a debtor will be met if the debtor fails to settle the debt.
Equity A stock or any other security representing an ownership interest.
Table B2 | Definition of Instruments
Table B3 | Definition of Regions (adapted from the World Bank)
EAST ASIA AND THE PACIFIC
EASTERN EUROPE AND CENTRAL ASIA
LATIN AMERICA AND THE CARIBBEAN
MIDDLE EAST AND NORTH AFRICA
SOUTH ASIA
American Samoa Albania Antigua and Barbuda Algeria Afghanistan
Cambodia Armenia Argentina Djibouti Bangladesh
China Azerbaijan Belize Egypt, Arab Rep. Bhutan
Fiji Belarus Bolivia Iran, Islamic Rep. India
Indonesia Bosnia and Herzegovina Brazil Iraq Maldives
Kiribati Georgia Chile Jordan Nepal
Korea, Dem. Rep. Kazakhstan Colombia Lebanon Pakistan
Lao PDR Kosovo Costa Rica Libya Sri Lanka
Malaysia Kyrgyz Republic Cuba Morocco
Marshall Islands Macedonia, FYR Dominica Syrian Arab Republic
Micronesia, Fed. Sts Moldova Dominican Republic Tunisia
Mongolia Montenegro Ecuador West Bank and Gaza
Myanmar Russian Federation El Salvador Yemen, Rep.
Palau Serbia Grenada
Papua New Guinea Tajikistan Guatemala
Philippines Turkey Guyana
Samoa Turkmenistan Haiti
Solomon Islands Ukraine Honduras
Thailand Uzbekistan Jamaica
Timor-Leste Mexico
Tuvalu Nicaragua
Tonga Panama
Vanuatu Paraguay
Vietnam Peru
St. Lucia
St. Vincent and the
Grenadines
Suriname
Uruguay
Venezuela, RB
37
Philippines Turkey Guyana
Samoa Turkmenistan Haiti
Solomon Islands Ukraine Honduras
Thailand Uzbekistan Jamaica
Timor-Leste Mexico
Tuvalu Nicaragua
Tonga Panama
Vanuatu Paraguay
Vietnam Peru
St. Lucia
St. Vincent and the
Grenadines
Suriname
Uruguay
Venezuela, RB
SUB-SAHARAN AFRICA EU Others
Angola Mauritania Austria Trans-regional
Include funds that are channelled to more than one region and/or that are
channelled through multilateral climate funds.Benin Mauritius Belgium
Botswana Mozambique Bulgaria
Burkina Faso Namibia Cyprus
Burundi Niger Czech Republic Australia
Cameroon Nigeria Denmark Canada
Cape Verde Rwanda Estonia Japan
Central African Republic São Tomé and Principe Finland United States
Chad Senegal France
Comoros Seychelles Germany
Congo, Dem. Rep. Sierra Leone Greece
Congo, Rep Somalia Hungary
Côte d’Ivoire South Africa Ireland
Eritrea South Sudan Italy
Ethiopia Sudan Latvia
Gabon Swaziland Lithuania
Gambia, The Tanzania Luxembourg
Ghana Togo Malta
Guinea Uganda Netherlands
Guinea- Zambia Poland
Bissau Zimbabwe Portugal
Kenya Romania
Lesotho Slovakia
Liberia Slovenia
Madagascar Spain
Malawi Sweden
Mali United Kingdom

38
6.4 APPENDIX C: METHODOLOGY GUIDANCE – ESTIMATING PRIVATE SECTOR MOBILIZATION
Description Defined as the amount of financial resources contributed by external entities alongside finance invested by an IDFC member.
Eligiblility IDFC INSTRUMENT PRIVATE FINANCE MOBILIZED
ATTRIBUTION IF SEVERAL PUBLIC SECTOR ACTORS
Grants Private finance loans, equity
Allocate mobilised investment on a pro-rata basis to different public financiers independent of the specific instruments applied.
Loans Private finance loans, equity
Equity Private finance loans, equity
Guarantees Private finance loans, equity
Credit lines Private finance loans, subtracting original loan amount to avoid double counting
Sampling vs. Complete coverage
It is acceptable to derive representative mobilisation factors (e.g. 1.5 for revolving credit lines to banks or 1.5 for equity in project finance) for homogenous fractions of the portfolio based on a representative subset of projects. Member institutions were asked to indicate which factors were used per instrument type in the survey sheet.
Source KfW, 2015. Proposal of a methodology for tracking publicly mobilized private climate finance.
Table C1 | Joint DFI Group

39
Description Implies a causal link for when specific mechanisms stimulate the allocation of additional financial resources to particular objectives.
Eligibility IDFC INSTRUMENT PRIVATE FINANCE MOBILZED ATTRIBUTION IF SEVERAL PUBLIC SECTOR ACTORS
Syndicated loans Private finance loans in the syndicate If public arranger, allocate 50% of private finance loans to arranger, and the remainder to all public financiers on a pro-rata basis.
If private arranger, allocate 100% of private finance loans on a pro-rata basis among public financiers.
Shares in Collective Investment Vehicles (e.g. funds)
Private finance equity in CIV At the time of each private investment, 50% of amount to those in riskiest tranche pro-rata, and the remainder 50% pro-rata to all (including those in riskiest tranche).
Guarantees Private finance loans (full value) Allocate private finance on a pro-rata basis among public financiers
Credit lines Additional loans from local private finance institution, equity from private end-borrower (estimated). If credit line is longer maturity than typical loan for target borrowers, apply factor for use of revolving funds by credit line. (calculated by estimating the proportion of the average loan maturity against the credit line term and multiply by average utilization rate (percentage of the finance available in similar credit lines)).
Allocate private finance on a pro-rata basis among public financiers
Direct investment in companies
Private loans, equity during financing round
At the time of the financing round, 50% of private finance amount to those in riskiest part of corporate structure e.g. equity or mezzanine, and the remainder 50% pro-rata among all public financiers
Sampling vs. Complete coverage
It is acceptable to derive representative mobilisation factors (e.g.1,5 for revolving credit lines to banks or 1,5 for equity in project finance) for homogenous fractions of the portfolio based on a representative subset of projects. Please indicate which factors were used per instrument type in the survey sheet.
Source OECD DAC, 2018. DAC methodologies for measuring the amounts mobilised from the private sector by official development finance interventions.
Table C2 | OECD Development Assistance Committee

40
6.5 APPENDIX D: ELIGIBLE PROJECT CATEGORIES
Despite the efforts of MDBs and IDFC to develop Common Principles for Climate Finance Tracking, a key challenge of the mapping study is to overcome the varying definitions for green finance and to distin-guish the finance flows, attributed to green energy and mitigation of GHG, adaptation, biodiversity and other environmental objectives, categories, from each other. In order to most effectively distinguish between these
categories, guidance was provided to IDFC members. Much of this guidance was determined in close coordi-nation with representatives of IDFC.
Disaggregated data was collected as shown in Table D1 below. IDFC members were asked to disaggregate their financial commitments to: (i) green energy and mitigation of greenhouse gas emissions; (ii) adaptation to climate change; and (iii) biodiversity by sub-sector and activity, wherever possible.
Table D1 | Eligible Project Categories (based on MDBs-IDFC Common Principles, 2015)
CATEGORY SUBCATEGORY ACTIVITIES
Green energy and mitigation of greenhouse gas emissions
1. Renewable Energy
1.1 Electricity Generation
Wind power
Geothermal power (only if net emission reductions can be demonstrated)
Solar power (concentrated solar power, photovoltaic power)
Biomass or biogas power (only if net emission reductions, including carbon pool balance, can be demonstrated)
Ocean power (wave, tidal, ocean currents, salt gradient, etc.)
Hydropower plants (only if net emission reductions can be demonstrated)
Renewable energy power plant retrofits
1.2 Heat Production or other renewable energy application
Solar water heating and other thermal applications of solar power in all sectors
Thermal applications of geothermal power in all sectors
Wind-driven pumping systems or similar
Thermal applications of sustainably/produced bioenergy in all sectors, incl. efficient, improved biomass stoves
1.3 Measures to facilitate integration of renewable energy into grids
New, expanded and improved transmission systems (lines, substations).
Storage systems (battery, mechanical, pumped storage)
New information and communication technology, smart-grid and mini-grid
2. Lower-carbon and efficient energy generation
2.1 Transmission and distribution systems
Retrofit of transmission lines or substations and/or distribution systems to reduce energy use and/or technical losses including improving grid stability/reliability, (only if net emission reductions can be demonstrated)[1]
2.2 Power Plants
Thermal power plant retrofit to fuel switch from a more GHG-intensive fuel to a different and less GHG-intensive fuel type
Conversion of existing fossil-fuel based power plant to co-generation[2] technologies that generate electricity in addition to providing heating/cooling
Waste heat recovery improvements.
Energy-efficiency improvement in existing thermal power plant, industrial energy-efficiency improvements though the installation of more efficient equipment, changes in processes, reduction of heat losses and/or increased waste heat recovery

41
3. Energy efficiency
3.1 Energy efficiency in industry in existing facilities
industrial energy-efficiency improvements though the installation of more efficient equipment, changes in processes, reduction of heat losses and/or increased waste heat recovery
Installation of co/generation plants that generate electricity in addition to providing heating/cooling
More efficient facility replacement of an older facility (old facility retired)
3.2 Energy efficiency improvements in existing commercial, public and residential buildings
Energy-efficiency improvement in lighting, appliances and equipment
Substitution of existing heating/cooling systems for buildings by co/generation plants that generate electricity in addition to providing heating/cooling[3]
Retrofit of existing buildings: Architectural or building changes that enable reduction of energy consumption
3.3 Energy efficiency improvements in the utility sector and public services
Energy-efficiency improvement in utilities and public services through the installation of more efficient lighting or equipment
Rehabilitation of district heating and cooling systems
Utility heat loss reduction and/or increased waste heat recovery
Improvement in utility scale energy efficiency through efficient energy use, and loss reduction
3.4 Vehicle energy efficiency fleet retrofit
Existing vehicles, rail or boat fleet retrofit or replacement (including the use of lower-carbon fuels, electric or hydrogen technologies, etc.)
3.5 Energy efficiency in new commercial, public and residential buildings
Use of highly efficient architectural designs, energy efficiency appliances and equipment, and building techniques that reduce building energy consumption, exceeding available standards and complying with high energy efficiency certification or rating schemes
3.6 Energy audits Energy audits to energy end-users, including industries, buildings, and transport systems
4. Agriculture, forestry and land-use
4.1 Agriculture Reduction in energy use in traction (e.g. efficient tillage), irrigation, and other agricultural processes
Agricultural projects that improve existing carbon pools (, rangeland management, collection and use of bagasse, rice husks, or other agricultural waste, reduced tillage techniques that increase carbon contents of soil, rehabilitation of degraded lands, peatland restoration, etc.)
Reduction of non Co2 GHG emissions from agricultural practices (eg: paddy rice production, reduction in fertilizer use …).
4.2 Afforestation and reforestation, and biosphere conservation
Afforestation (plantations) on non-forested land
Reforestation on previously forested land
Sustainable forest management activities that increase carbon stocks or reduce the impact of forestry activities
Biosphere conservation projects (including payments for ecosystem services) targeting reducing emissions from the deforestation or degradation of ecosystems
4.3 Livestock Livestock projects that reduce methane or other GHG emissions (manure management with biodigestors, etc.)
4.4 Biofuels Production of biofuels (including biodiesel and bioethanol) (only if net emission reductions can be demonstrated)
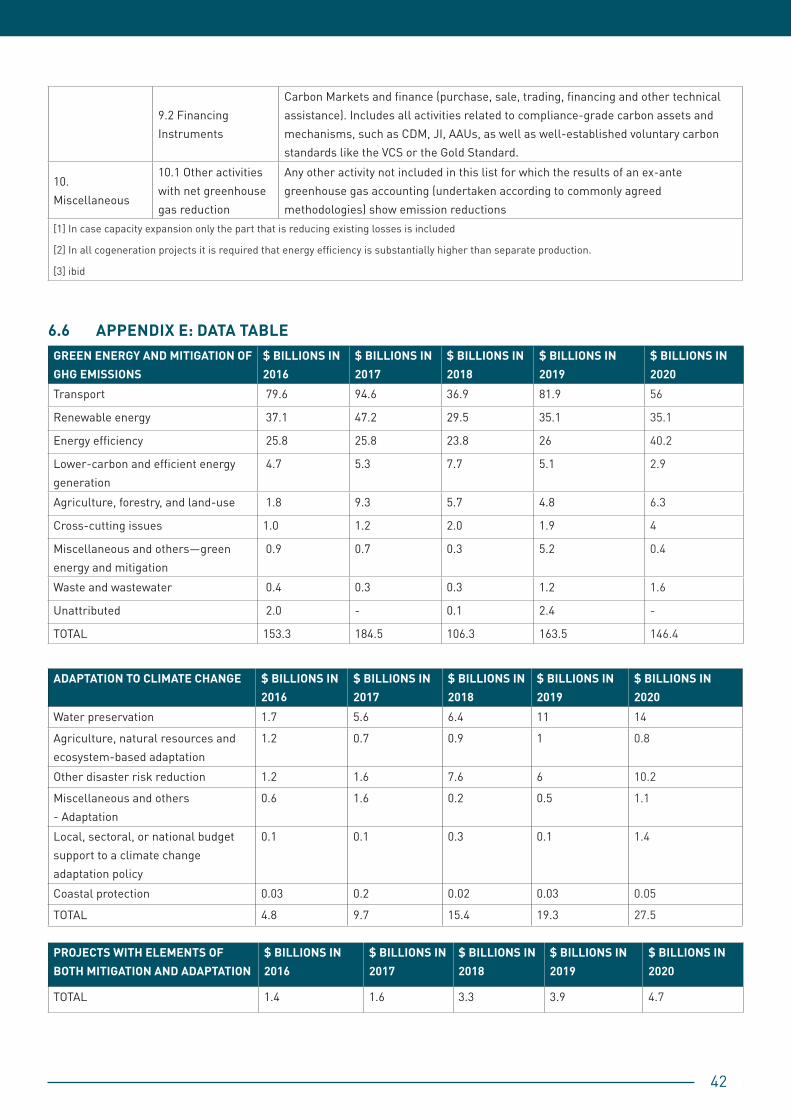
42
9.2 Financing Instruments
Carbon Markets and finance (purchase, sale, trading, financing and other technical assistance). Includes all activities related to compliance-grade carbon assets and mechanisms, such as CDM, JI, AAUs, as well as well-established voluntary carbon standards like the VCS or the Gold Standard.
10. Miscellaneous
10.1 Other activities with net greenhouse gas reduction
Any other activity not included in this list for which the results of an ex-ante greenhouse gas accounting (undertaken according to commonly agreed methodologies) show emission reductions
[1] In case capacity expansion only the part that is reducing existing losses is included
[2] In all cogeneration projects it is required that energy efficiency is substantially higher than separate production.
[3] ibid
6.6 APPENDIX E: DATA TABLE GREEN ENERGY AND MITIGATION OF GHG EMISSIONS
$ BILLIONS IN 2016
$ BILLIONS IN 2017
$ BILLIONS IN 2018
$ BILLIONS IN 2019
$ BILLIONS IN 2020
Transport 79.6 94.6 36.9 81.9 56
Renewable energy 37.1 47.2 29.5 35.1 35.1
Energy efficiency 25.8 25.8 23.8 26 40.2
Lower-carbon and efficient energy generation
4.7 5.3 7.7 5.1 2.9
Agriculture, forestry, and land-use 1.8 9.3 5.7 4.8 6.3
Cross-cutting issues 1.0 1.2 2.0 1.9 4
Miscellaneous and others—green energy and mitigation
0.9 0.7 0.3 5.2 0.4
Waste and wastewater 0.4 0.3 0.3 1.2 1.6
Unattributed 2.0 - 0.1 2.4 -
TOTAL 153.3 184.5 106.3 163.5 146.4
ADAPTATION TO CLIMATE CHANGE $ BILLIONS IN 2016
$ BILLIONS IN 2017
$ BILLIONS IN 2018
$ BILLIONS IN 2019
$ BILLIONS IN 2020
Water preservation 1.7 5.6 6.4 11 14
Agriculture, natural resources and ecosystem-based adaptation
1.2 0.7 0.9 1 0.8
Other disaster risk reduction 1.2 1.6 7.6 6 10.2
Miscellaneous and others - Adaptation
0.6 1.6 0.2 0.5 1.1
Local, sectoral, or national budget support to a climate change adaptation policy
0.1 0.1 0.3 0.1 1.4
Coastal protection 0.03 0.2 0.02 0.03 0.05
TOTAL 4.8 9.7 15.4 19.3 27.5
PROJECTS WITH ELEMENTS OF BOTH MITIGATION AND ADAPTATION
$ BILLIONS IN 2016
$ BILLIONS IN 2017
$ BILLIONS IN 2018
$ BILLIONS IN 2019
$ BILLIONS IN 2020
TOTAL 1.4 1.6 3.3 3.9 4.7

43
OTHER ENVIRONMENTAL OBJECTIVES
$ BILLIONS IN 2016 $ BILLIONS IN 2017 $ BILLIONS IN 2018 $ BILLIONS IN 2019
Industrial pollution control 6.0 14.0 4.2 0.2
Water supply 3.2 1.8 1.8 4
Waste water treatment 2.1 2.7 1.2 2
Miscellaneous and others - ‘other environment’
1.6 1.3 1.2 2
Sustainable infrastructure 0.7 2.6 0.2 0.8
Waste management 0.1 1.5 0.2 1
Biodiversity 0.1 0.3 0.06 0.03
Soil remediation and mine rehabilitation
0.001 0.001 0.00
TOTAL 13.8 24.2 10.1
BIODIVERSITY $ BILLIONS IN 2020
Agriculture and natural resources 2.1
Water preservation 3.4
Water supply 1.6
Waste water treatment 2.3
Industrial pollution control -
Waste management 0.8
Biodiversity conservation (1) 1.2
Biodiversity conservation (2) 1.8
Support to national, regional or local policy, through technical assistance or policy lending
0.3
Financing instruments 0.6
TOTAL 14.1
Note: In 2020, $1.4 billion of finance for other environmental objectives was tracked at the aggregated level.
Note: Biodiversity finance was not tracked in the years prior to 2020.

44
6.7 APPENDIX F: INDEX OF ACRONYMS
ADB Asian Development BankAFD Agence Française de DéveloppementAfDB African Development BankBancoldex Banco de Comercio Exterior de ColombiaBE Banco de EstadoBICE Banco de Inversión y Comercio Exterior S.ABNDES Brazilian Development BankBOAD Banque Ouest Africain de DéveloppementBSTDB Black Sea Trade and Development BankCABEI Central American Bank for Economic IntegrationCAF Development Bank of Latin AmericaCDB China Development Bank
CDG Caisse de Dépôt et de Gestion
CDP Cassa Depositi e Prestiti
CO2 Carbon dioxide
COFIDE Corporación Financiera de Desarrollo S.A.
MDB-IDFC Common Principles
Common Principles for Climate Mitigation as well Climate Change Adaptation Finance Tracking, jointly developed by MDBs and IDFC
COP Conference of Parties
CPI Climate Policy Initiative
DBSA Development Bank of Southern Africa
HBOR Croatian Bank for Reconstruction and Development
ICD Islamic Corporation for the Development of the Private Sector
IEB Indonesia Exim Bank
IDFC International Development Finance Club
IFC International Finance Corporation
IIB International Investment Bank
JICA Japan International Cooperation Agency
KFW Kreditanstalt für Wiederaufbau
KDB Korean Development Bank
MDB Multilateral Development Bank
NAFIN Nacional Financiera S.N.C
OECD Organisation for Economic Cooperation and Development
OECD-DAC Organisation for Economic Cooperation and Development Assistance Committee
PT SMI PT Sarana Multi Infrastruktur (Persero)
PV Photovoltaic
SEI Stockholm Environment Institute
SIDBI Small Industries Development Bank of India
TDB Trade and Development Bank
TSKB Industrial Development Bank of Turkey
UNEP United Nations Environmental Programme
UNEP BFI United Nations Environmental Programme Bilateral Finance Institutions
UNFCCC United Nations Framework Convention on Climate ChangeVEB Vnesheconombank

45
7. ENDNOTES Agence Française de Développement (AFD), 2021. €1 Billion for Biodiversity. Available at: https://www.afd.fr/en/actualites/eu1-billion-biodiversity
AFD, 2018. Environmental And Social Framework. Available at: https://www.afd.fr/en/ressources/environmental-and-social-framework
Asian Development Bank (ADB). 2021. Environment Safeguards. Available at: https://www.adb.org/site/safeguards/environment
Belvaux, Eric. 2020. Testing of methodologies on biodiversity finance. Support to the IDFC Making Finance Work for Nature Group. Report shared by AFD.
Black Sea Trade & Development Bank (BSTDB), 2021. BSTDB Climate Change Strategy. Available at: https://www.bstdb.org/BSTDB_Climate_Change_Strategy.pdf
Climate Policy Initiative (CPI), 2021. Preview: The 2021 Global Landscape of Climate Finance. Available at: https://www.climatepolicyinitiative.org/wp-content/uploads/2021/10/Global-Landscape-of-Climate-Finance-2021.pdf
CPI and I4CE, 2019. Aligning with the Paris Agreement. Available at: https://www.climatepolicyinitiative.org/wp-content/uploads/2019/09/Implementing-alignment-recommendations-for-the-International-Development-Finance-Club-_-Executive-Summary.pdf
Convergence. Blending Global Finance, 2019. Case Study. Climate Finance Facility. Available at: https://greenbanknetwork.org/wp-content/uploads/2019/07/Convergence__Climate_Finance_Facility_Case_Study__2019.pdf
Corporación Andina de Fomento (CAF), 2020. “CAF and EIB to Fund Climate Action Projects to Boost Jobs and Competitiveness.” Available at: https://www.caf.com/en/currently/news/2020/12/caf-and-eib-to-fund-climate-action-projects-to-boost-jobs-and-competitiveness/
Critical Ecosystem Partnership Fund (CEPF), 2021. The Madagascar and Indian Ocean Islands Hotspot Ecosystem Profile Summary. Available at: https://www.cepf.net/sites/default/files/cepf_madagascar_profile_summary_eng.pdf
Development Bank of Southern Africa (DBSA), 2021. Climate Financing. Available at: https://www.dbsa.org/solutions/climate-financing
Finance in Common, 2021. Joint Declaration of all Public Development Banks in the World. Available at: https://financeincommon.org/
Green Climate Fund (GCF), 2019. Bio-CLIMA Nicaragua. Integrated climate action for reduced deforestation and strengthened resilience in the BOSAWÁS and Rio San Juan Biosphere Reserves. Available at: https://www.greenclimate.fund/document/bio-clima-nicaragua
GCF and IDFC. 2020. A strategic alliance to realize the full potential of public development banks in financing the green transition. Available at: https://www.idfc.org/wp-content/uploads/2020/11/7-idfc-gcf_final-version_eng.pdf
I4CE and NIC, 2021. Operationalization Framework on Aligning with the Paris Agreement. Available at: https://www.i4ce.org/download/operationalization-framework-on-aligning-with-the-paris-agreement/

46
IDFC. 2020. Benchmarking report on Biodiversity Practices of Development Banks. Available at: https://www.idfc.org/wp-content/uploads/2020/11/idfc-benchmark-on-biodiversity-practices-of-development-banks-1.pdf
IDFC. 2018. IDFC Position Paper- Aligning with the Paris Agreement. Available at: https://www.idfc.org/wp-content/uploads/2018/12/idfc_alignment-with-paris-agreement_position-paper_12_2018.pdf
International Finance Corporation (IFC). 2021. Environmental, Health, and Safety Guidelines. Available at: https://www.ifc.org/wps/wcm/connect/topics_ext_content/ifc_external_corporate_site/sustainability-at-ifc/policies-standards/ehs-guidelines
IUCN Red List. 2021. Summary Statistics. Available at: https://www.iucnredlist.org/statistics
Japan International Cooperation Agency (JICA), 2020. Annual Report. Available at: https://www.jica.go.jp/english/publications/reports/annual/2020/index.html
Japan International Cooperation Agency (JICA), 2021. Japanese ODA Loan. Ex-Ante Evaluation. Available at: https://www.jica.go.jp/english/our_work/evaluation/oda_loan/economic_cooperation/c8h0vm000001rdjt-att/indonesia_200218_01.pdf
Korean Development Bank (KDB), 2020. Annual Report. Available at: https://www.kdbbank.eu/financial-figures-annual-reports
MDBs and IDFC. 2017. Joint IDFC-MDB Statement at One Planet
Summit. Available at: https://www.oneplanetsummit.fr/IMG/pdf/10_idfc_mdb_statement.pdf
Turkiye Sinai Kalkinma Bankasi (TSKB), 2021. “TSKB publishes its “Climate Risks Report” in line with the TCFD recommendations to break new ground in the Turkish banking sector.” Available at: https://www.tskb.com.tr/tskb-publishes-its-climate-risks-report-in-line-with-the-tcfd-recommendations-to-break-new-ground-in-the-turkish-banking-sector
UNEP WCMC. 2021. Megadiverse Countries. Available at: https://www.biodiversitya-z.org/content/megadiverse-countries
World Bank, 2021. Global Economic Monitor. Available at: https://databank.worldbank.org/reports.aspx?source=1179&series=DPANUSLCU
Related Documents