Identification of Tibial Stress Fractures Using Therapeutic Continuous Ultrasound By: William A. Romani, PhD, PT ATC 1 , David H. Perrin, PhD, ATC 2 , Robert G. Dussault, MD 3 , Donald W. Ball, PhD 4 , David M. Kahler, MD 5 Romani, W.A., Perrin, D.H ., Dussault, R.G., Ball, D.W., Kahler, D.M. (2000). Identification of tibial stress fractures using therapeutic continuous ultrasound. Journal of Orthopaedic and Sports Physical Therapy , 30:444-452. Made available courtesy of the Orthopaedic Section and the Sports Physical Therapy Section of the American Physical Therapy Association (APTA): http://www.jospt.org/ ***Note: Figures may be missing from this format of the document Abstract: Study Design: One-group discriminant analysis. Objective: To determine whether 1 MHz of continuous ultrasound can identify tibial stress fractures in subjects. Background: Stress fractures can lead to loss of function or to more serious nonunion fractures. Early diagnosis is important to reduce the risk of further injury and to assure a safe return to activity. Therapeutic ultrasound has been reported to be an accessible, less expensive alternative in diagnosing stress fractures compared with other diagnostic techniques. Methods and Measures: Twenty-six subjects (12 men, 20.33 ± 1.37 years; 14 women, 20.78 ± 3.8 years) with unilateral tibia pain for less than 2 weeks volunteered to participate in the study. Continuous, 1 MHz ultrasound was applied to the uninvolved and involved tibias at 7 increasing intensities for 30 seconds each. Subjects completed a visual analog scale after the application of each intensity to assess the pain response to ultrasound. Results from the visual analog scale were compared to magnetic resonance imaging (MRI) findings to determine if continuous ultrasound could predict whether subjects had a normal MRI, increased bone remodeling, or advanced bone remodeling consistent with a stress fracture. 1 Department of Physical Therapy, University of Maryland School of Medicine, Baltimore, Md. I Curry School of Education, University of Virginia, Charlottesville, Va. 2 Department of Radiology, University of Virginia Health Sciences Center, Charlottesville, Va. 3 Curry School of Education, University of Virginia, Charlottesville, Va. 4 Department of Orthopaedics, University of Virginia Health Sciences Center, Charlottesville, Va. This protocol was approved by the Human Investigation Committee at the University of Virginia, Charlottesville, Va. It was funded by grants from the National Athletic Trainers' Association Research and Education Foundation and NATA District 3. At the time of this study, William Romani was a Doctoral candidate in the University of Virginia Curry School of Education. Send correspondance to: William A. Romani, Department of Physical Therapy, University of Maryland School of Medicine, 100 Penn St., Baltimore, MD 21201. E-mail: wromaniPphysio.umaryland.edu

Welcome message from author
This document is posted to help you gain knowledge. Please leave a comment to let me know what you think about it! Share it to your friends and learn new things together.
Transcript
Identification of Tibial Stress Fractures Using Therapeutic Continuous Ultrasound
By: William A. Romani, PhD, PT ATC1, David H. Perrin, PhD, ATC
2, Robert G. Dussault, MD
3,
Donald W. Ball, PhD4, David M. Kahler, MD
5
Romani, W.A., Perrin, D.H., Dussault, R.G., Ball, D.W., Kahler, D.M. (2000). Identification of
tibial stress fractures using therapeutic continuous ultrasound. Journal of Orthopaedic
and Sports Physical Therapy, 30:444-452.
Made available courtesy of the Orthopaedic Section and the Sports Physical Therapy Section of
the American Physical Therapy Association (APTA): http://www.jospt.org/
***Note: Figures may be missing from this format of the document
Abstract:
Study Design: One-group discriminant analysis.
Objective: To determine whether 1 MHz of continuous ultrasound can identify tibial stress
fractures in subjects.
Background: Stress fractures can lead to loss of function or to more serious nonunion fractures.
Early diagnosis is important to reduce the risk of further injury and to assure a safe return to
activity. Therapeutic ultrasound has been reported to be an accessible, less expensive alternative
in diagnosing stress fractures compared with other diagnostic techniques.
Methods and Measures: Twenty-six subjects (12 men, 20.33 ± 1.37 years; 14 women, 20.78 ±
3.8 years) with unilateral tibia pain for less than 2 weeks volunteered to participate in the study.
Continuous, 1 MHz ultrasound was applied to the uninvolved and involved tibias at 7 increasing
intensities for 30 seconds each. Subjects completed a visual analog scale after the application of
each intensity to assess the pain response to ultrasound. Results from the visual analog scale
were compared to magnetic resonance imaging (MRI) findings to determine if continuous
ultrasound could predict whether subjects had a normal MRI, increased bone remodeling, or
advanced bone remodeling consistent with a stress fracture.
1 Department of Physical Therapy, University of Maryland School of Medicine, Baltimore, Md. I Curry School of
Education, University of Virginia, Charlottesville, Va. 2Department of Radiology, University of Virginia Health Sciences Center, Charlottesville, Va.
3Curry School of Education, University of Virginia, Charlottesville, Va.
4Department of Orthopaedics, University of Virginia Health Sciences Center, Charlottesville, Va. This protocol was
approved by the Human Investigation Committee at the University of Virginia, Charlottesville, Va. It was funded by
grants from the National Athletic Trainers' Association Research and Education Foundation and NATA District 3.
At the time of this study, William Romani was a Doctoral candidate in the University of Virginia Curry School of
Education.
Send correspondance to: William A. Romani, Department of Physical Therapy, University of Maryland School of
Medicine, 100 Penn St., Baltimore, MD 21201. E-mail: wromaniPphysio.umaryland.edu
Results: Discriminant analysis on the visual analog scale correctly classified subjects into 1 of 3
clinical classification groups in 42.31% of the cases. None of the subjects found to have a stress
fracture by MRI were correctly identified by continuous ultrasound. This resulted in a predicted
sensitivity of 0% and a predicted specificity of 100%.
Conclusions: A protocol using visual analog scores after the application of 1 MHz continuous
ultrasound is not sensitive for identifying subjects with tibial stress fractures. J Orthop Sports
Phys Ther 2000;30:444-452.
Key Words: bone remodeling, magnetic resonance, MRI
Article:
The tibia is the most common location of stress fractures in runners.6,15,20
Proper diagnosis is
important to prevent the development of a complete or nonunion fracture and subsequent
incapacitation.13,26
Radiographs are used in the diagnosis of stress fractures, but their usefulness
is limited by the inability to detect fractures until 3 weeks to 3 months after the onset of
symptoms.9,13,27,28,31
Bone scan with Technetium-99 meta-diphosphonate detects stress fractures
earlier than radiographs,13,21,31
but this procedure requires an injection and a 3-hour wait before
imaging. Recent studies have used magnetic resonance imaging (MRI) to diagnose tibial stress
fractures on a continuum from periosteal inflammation, to bone marrow edema, to cortical
fracture.1,12
MRI is also noninvasive, less time consuming, and has been used with a similar' or
higher sensitivity and better specificity than scintigraphy.3,12,16,22
Ultrasound is a commonly used modality in the treatment of soft tissue injuries. Several authors
have suggested that continuous ultrasound may also be an accurate, cost efficient alternative to
other
radiologic methods for diagnosing tibial stress fractures.15.24.25
The reported validity of
ultrasound as a tool for diagnosing stress fractures is mixed. Nitz and Scoville25
examined 54
military recruits who reported knee pain while running in their first 4 weeks of training. They
used continuous ultrasound for 30 seconds at intensities from 2.0 to 3.0 W/cm2. When compared
to radiographs, this protocol had a sensitivity of 89.5% (34/38), a specificity of 100% (16/ 16),
and had 92.6% overall accuracy in diagnosing stress fractures of the medial tibial plateau. The
frequency, sound head size, and area of application were not reported in their study. Moss and
Mowatt24
had similar results when using ultrasound to diagnose radiographically confirmed tibial
shaft stress fractures. Using a frequency of .75 MHz and intensities between l.0 and 2.0 W/cm2,
the authors successfully diagnosed stress fractures 96% of the time. Other researchers, however,
have used ultrasound to diagnose stress fractures with less success.5,10
Deveraux et al10
reported a 44% rate of correctly diagnosing tibial and fibular stress fractures
using the methods described by Moss and Mowatt.24
Boam et al,5 using an intensity of 2.0
W/cm2 applied for 30 seconds, reported an accuracy of 46%.
The researchers who used ultrasound to identify patients with tibial stress fractures used different
testing techniques and failed to document all of the ultrasound application parameters that were
used. We found no studies that compared the results of an ultrasound examination to MRI or that
have completely documented ultrasound intensity, frequency, size of sound head, time of
application, size of the area of application, and rate of intensity increase. In addition, the .75
MHz frequency used by Moss and Mowatt24 is an ultrasound frequency that is not commonly
used in the United States.
When an orthopaedic physical therapist or an athletic trainer has a patient who may have a stress
fracture, it is important that they understand the implications of using ultrasound for evaluation
and treatment of the injury. A common modality such as ultrasound could be a useful tool to the
clinician who is practicing independently and does not have immediate access to other radiologic
examination techniques. In addition, the application of continuous ultrasound over a suspected
stress fracture can cause discomfort,8 which should contraindicate treatment with continuous
ultrasound of a confirmed stress fracture. Where continuous ultrasound does cause pain over a
tibial injury, it is possible that this may
indicate an undiagnosed stress fracture that requires the attention of a physician.
The purpose of our study was to determine how accurately a protocol of 1 MHz continuous ultra-
sound could identify early tibial stress fractures revealed by MRI. We hypothesized that subject
responses on a visual analog scale during the application of continuous ultrasound would
correctly classify subjects into "no fracture," "transition," or "stress fracture" groups. A detailed
protocol that described the frequency, sound head size, treatment area, time of application, and
rate of intensity increase is included. The diagnostic sensitivity of the therapeutic continuous
ultrasound protocol was based on a criterion standard provided by MRI findings.
MATERIALS AND METHODS
Subjects
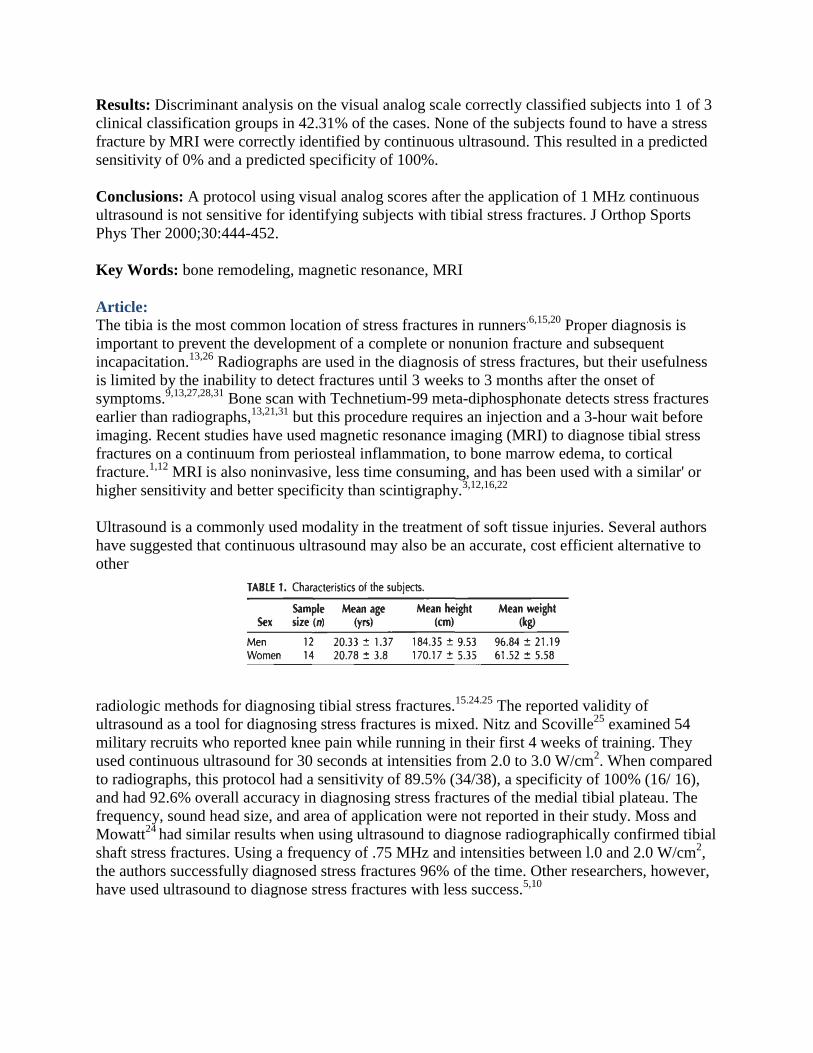
Twenty-six subjects between the ages of 18 and 31 years with complaints of unilateral,
nontraumatic symptoms of tibial stress fracture were studied (Table 1). We recruited subjects
from 8 varsity and 2 recreational activities (Table 2). Twenty of 26 subjects reported some form
of running as the activity that aggravated their symptoms (Table 3). A recent change in activity
or activity intensity, in shoes worn, or in a playing surface was also indicated by all 26 subjects
within 3 months of their participation in the study. The criteria for inclusion in the study were
anterior leg pain that increased with activity and decreased
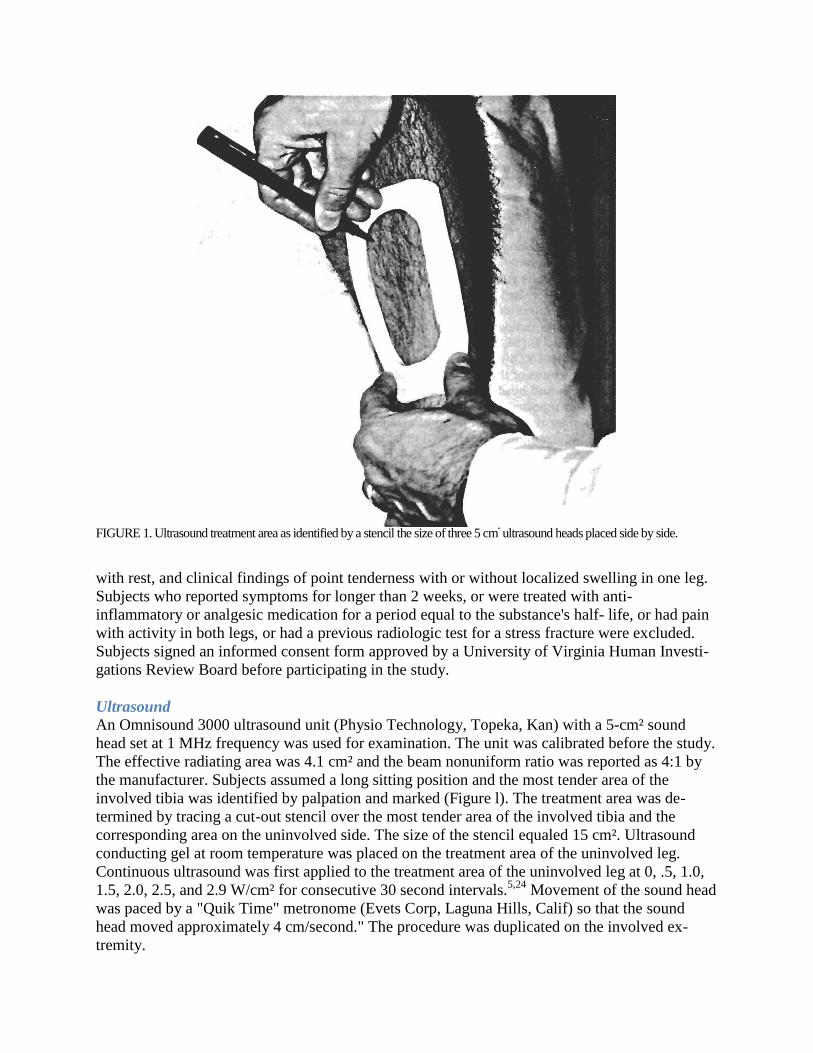
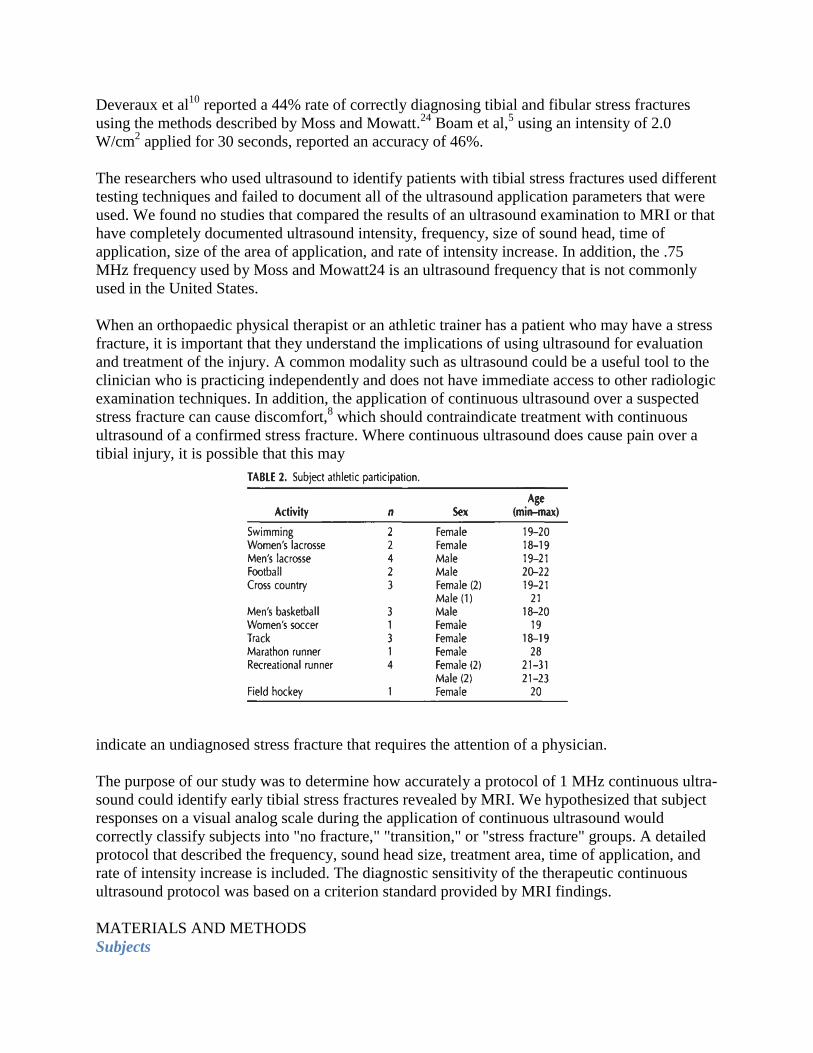
FIGURE 1. Ultrasound treatment area as identified by a stencil the size of three 5 cm
² ultrasound heads placed side by side.
with rest, and clinical findings of point tenderness with or without localized swelling in one leg.
Subjects who reported symptoms for longer than 2 weeks, or were treated with anti-
inflammatory or analgesic medication for a period equal to the substance's half- life, or had pain
with activity in both legs, or had a previous radiologic test for a stress fracture were excluded.
Subjects signed an informed consent form approved by a University of Virginia Human Investi-
gations Review Board before participating in the study.
Ultrasound
An Omnisound 3000 ultrasound unit (Physio Technology, Topeka, Kan) with a 5-cm² sound
head set at 1 MHz frequency was used for examination. The unit was calibrated before the study.
The effective radiating area was 4.1 cm² and the beam nonuniform ratio was reported as 4:1 by
the manufacturer. Subjects assumed a long sitting position and the most tender area of the
involved tibia was identified by palpation and marked (Figure l). The treatment area was de-
termined by tracing a cut-out stencil over the most tender area of the involved tibia and the
corresponding area on the uninvolved side. The size of the stencil equaled 15 cm². Ultrasound
conducting gel at room temperature was placed on the treatment area of the uninvolved leg.
Continuous ultrasound was first applied to the treatment area of the uninvolved leg at 0, .5, 1.0,
1.5, 2.0, 2.5, and 2.9 W/cm² for consecutive 30 second intervals.5,24
Movement of the sound head
was paced by a "Quik Time" metronome (Evets Corp, Laguna Hills, Calif) so that the sound
head moved approximately 4 cm/second." The procedure was duplicated on the involved ex-
tremity.
Pain Assessment
At the end of each ultrasound application intensity, the subjects marked a 100-mm blank visual
analog scale (VAS). The mark corresponded with the subject's level of comfort during the
previous 30 seconds. A mark on the left of the scale indicated "no pain," whereas a mark on the
far right indicated "unbearable pain." A blank scale was used for each measurement according to
the guidelines reported by Scott and Huskisson.29
Subject responses on the VAS were calculated
by measuring the mark in millimeters from the left border of the scale.
The subject's uninvolved leg was used as a control because it was without pain during activity.
To compare the difference in perceived pain between each subject's involved and uninvolved
(control) leg a delta pain score was calculated for each of the 7 ultrasound intensities applied.
The VAS response that followed the application of the continuous ultrasound to the control leg
was subtracted from the VAS response following the application of the same ultrasound intensity
to the involved leg. Calculation of a delta pain score was made for the 7 ultrasound intensities
applied to each subject. The largest of the 7 delta pain scores, or the largest difference between
perceived pain on the involved and uninvolved legs was used as the dependent variable for each
subject.
Magnetic Resonance Imaging
MR imaging was performed with a Siemens Vision 1.5 T system (B-31, Islin, NJ). With the use
of a body phase ring coil, T1 and Turbo 7 echo train inversion recovery images were obtained on
both lower legs simultaneously in the sagittal and axial plane. Parameters included repetition
time of 4250 msec, echo time of 30 msec, and inversion time of 150 msec and one signal
acquisition. For sagittal images, the section thickness and gap were 8 mm and 30%, respectively,
and the field of view (FOV) was 160 mm. Axial section thickness of 4 mm with a gap of 0 and a
FOV of 260 mm were used. The matrix for T1 and turbo images was set at 384 X 512 and 252 x
256, respectively. MRI studies were evaluated by a musculoskeletal radiologist blinded to the
results of the physical and ultrasound examination.
MRI classification The radiologist graded subjects on a scale of 0 to 4 based on a MRI
classification scheme introduced by Fredericson et al.12
MRI classification of bone remodeling
and stress fractures by Fredericson et al was consistent with classification of bone scan findings
in 77.8% of the cases examined. It has also been suggested that MRI is a more appropriate
diagnostic technique than bone scan to correlate the degree of injury in relation to clinical
findings.1,12
Pilot testing indicated that ultrasound would not be a tool sensitive enough to
separate subjects into 5 groups. Moreover, previous studies suggested that the clinical differences
between grade 0 and l,1,7,12
and grade 3 and 4 16,19,22,30
MRI presentations were negligible.12
As a
result, we used the MRI grade12
to classify subjects into 1 of 3 clinical classification groups, "no
fracture MRI grade 0 & 1," "transition MRI grade 2," or "stress fracture MRI grade 3 & 4."
Statistical Analyses
The "no fracture" group included subjects that the radiologist graded as "0" or "1," indicating that
there was either no change or appearance of periosteal swelling on MRI. The "transition" group
included subjects graded as "2" with signs of increased bone marrow edema. The "stress
fracture" group included subjects graded as "3" or "4," indicating the presence of advanced bone
marrow edema or cortical fracture.
A one-group discriminant analysis was conducted to determine if the largest delta pain score
correctly predicted the subject's classification into the "no fracture," "transition," or "stress
fracture" group (P≤.05). The outcome of the discriminant analysis was then used to estimate
sensitivity and specificity. Sensitivity was calculated to measure how frequently continuous
ultrasound predicted subjects to have a stress fracture when they also had a grade 3 or 4 MRI
finding (the criterion standard for a tibial stress fracture).16,19,22.30
) Specificity was calculated to
measure how frequently continuous ultrasound predicted subjects to be without a stress fracture
when they had a grade 0, 1, or 2 MRI finding (the criterion standard indicating that subjects had
a normal MRI, presentation of periosteal edema, or minor bone marrow edema seen only on T2
weighted images). These findings are commonly seen with normal bone remodeling and are not
necessarily indicative of a tibial stress fracture.4,17,22,30
) SPSS 6.1 statistical package for the
Power Mac was used to analyze the data.
RESULTS
Magnetic Resonance Imaging Results
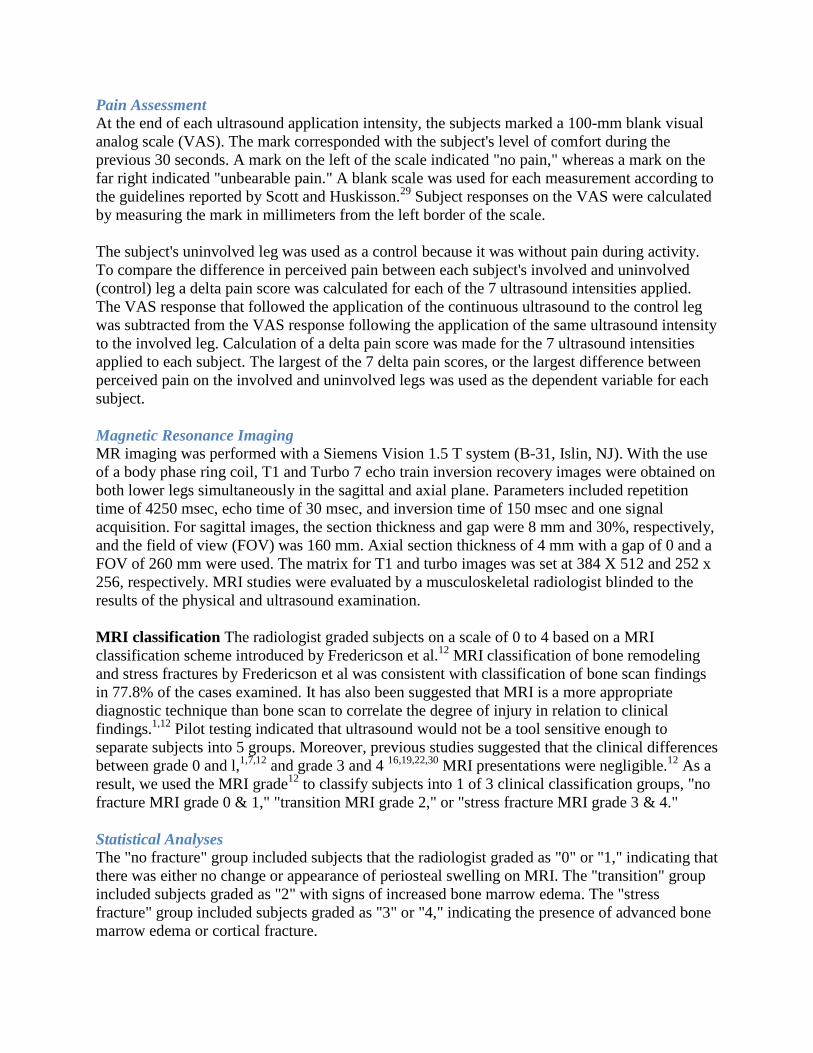
Magnetic resonance imaging studies of each subject's involved and uninvolved legs were graded
as; normal presentation (grade 0), soft tissue and subperiosteal edema (grade 1), bone marrow
edema on Turbo (inversion recovery) images (grade 2), and bone marrow edema on Turbo and
T1 images (grade 3) (Figure 2). The findings in a grade 3 image are consistent with the definition
of a stress fracture.16,19,22,30
No subjects were classified as a grade 4 (cortical fracture). Subject
classification is listed in Table 4.
In addition to positive findings at the symptomatic sites of the involved legs, MRI revealed
significant bone marrow edema at the corresponding sites of the asymptomatic uninvolved legs
in 7 subjects. Four grade 2 and one grade 3 areas of bone remodeling were identified in the
anteromedial border of the uninvolved tibias Two grade 2 findings were located at the
posteromedial tibial border and one on the anterior tibia.
Classification into Diagnostic Groups
Means and standard deviations for the delta pain scores for each ultrasound intensity are shown
in Table 5. The mean delta pain scores for the largest difference between involved and
noninvolved legs are illustrated for the clinical classification scheme (Figure 3) and the MRI
classification scheme (Figure 4). When compared to the MRI findings, the largest del-
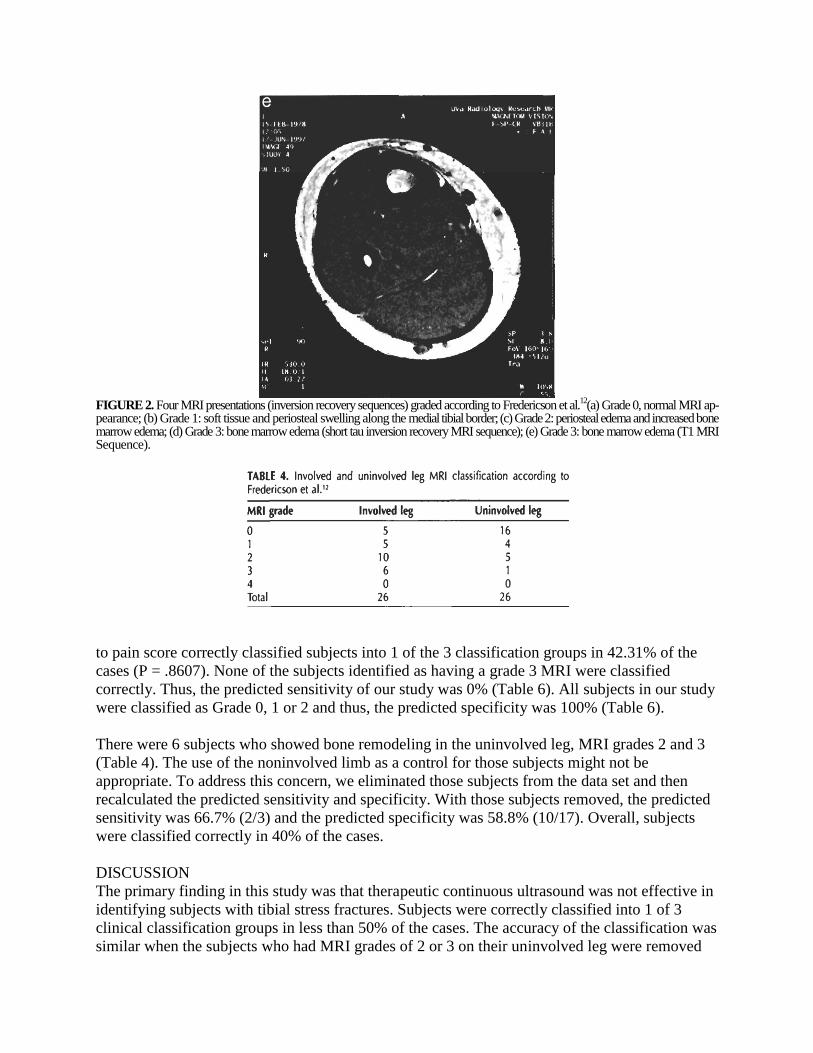
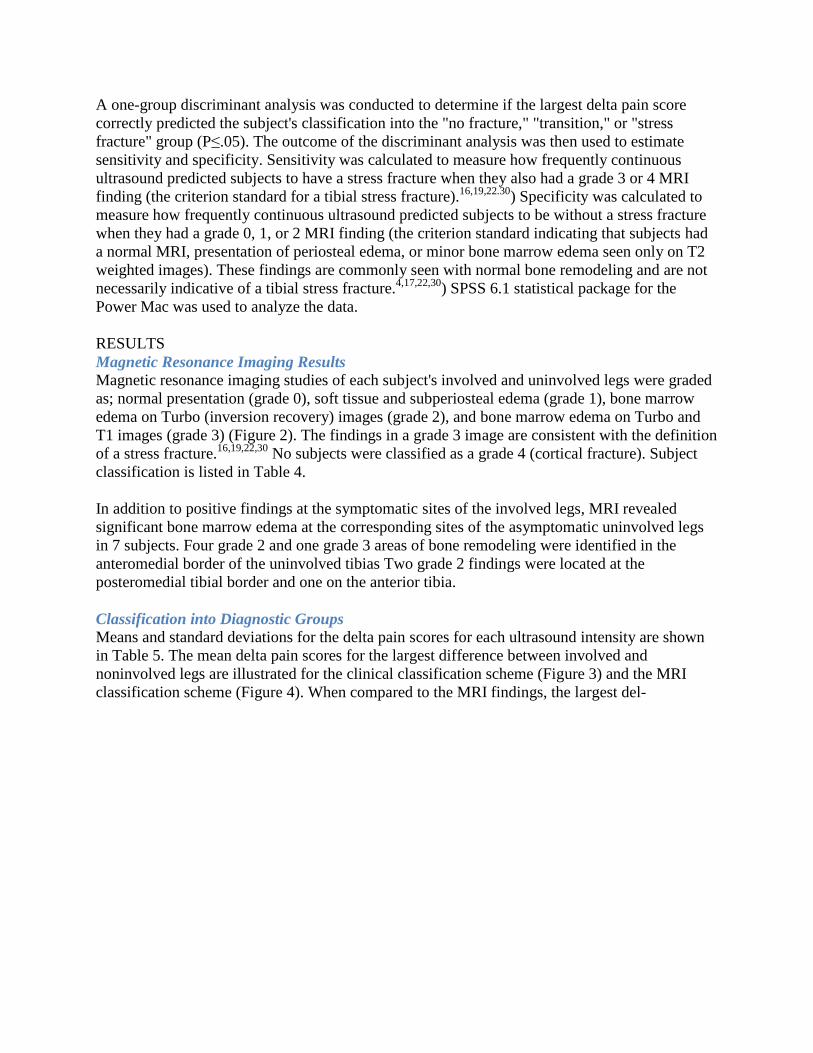
FIGURE 2. Four MRI presentations (inversion recovery sequences) graded according to Fredericson et al.
12(a) Grade 0, normal MRI ap-
pearance; (b) Grade 1: soft tissue and periosteal swelling along the medial tibial border; (c) Grade 2: periosteal edema and increased bone marrow edema; (d) Grade 3: bone marrow edema (short tau inversion recovery MRI sequence); (e) Grade 3: bone marrow edema (T1 MRI Sequence).
to pain score correctly classified subjects into 1 of the 3 classification groups in 42.31% of the
cases (P = .8607). None of the subjects identified as having a grade 3 MRI were classified
correctly. Thus, the predicted sensitivity of our study was 0% (Table 6). All subjects in our study
were classified as Grade 0, 1 or 2 and thus, the predicted specificity was 100% (Table 6).
There were 6 subjects who showed bone remodeling in the uninvolved leg, MRI grades 2 and 3
(Table 4). The use of the noninvolved limb as a control for those subjects might not be
appropriate. To address this concern, we eliminated those subjects from the data set and then
recalculated the predicted sensitivity and specificity. With those subjects removed, the predicted
sensitivity was 66.7% (2/3) and the predicted specificity was 58.8% (10/17). Overall, subjects
were classified correctly in 40% of the cases.
DISCUSSION
The primary finding in this study was that therapeutic continuous ultrasound was not effective in
identifying subjects with tibial stress fractures. Subjects were correctly classified into 1 of 3
clinical classification groups in less than 50% of the cases. The accuracy of the classification was
similar when the subjects who had MRI grades of 2 or 3 on their uninvolved leg were removed
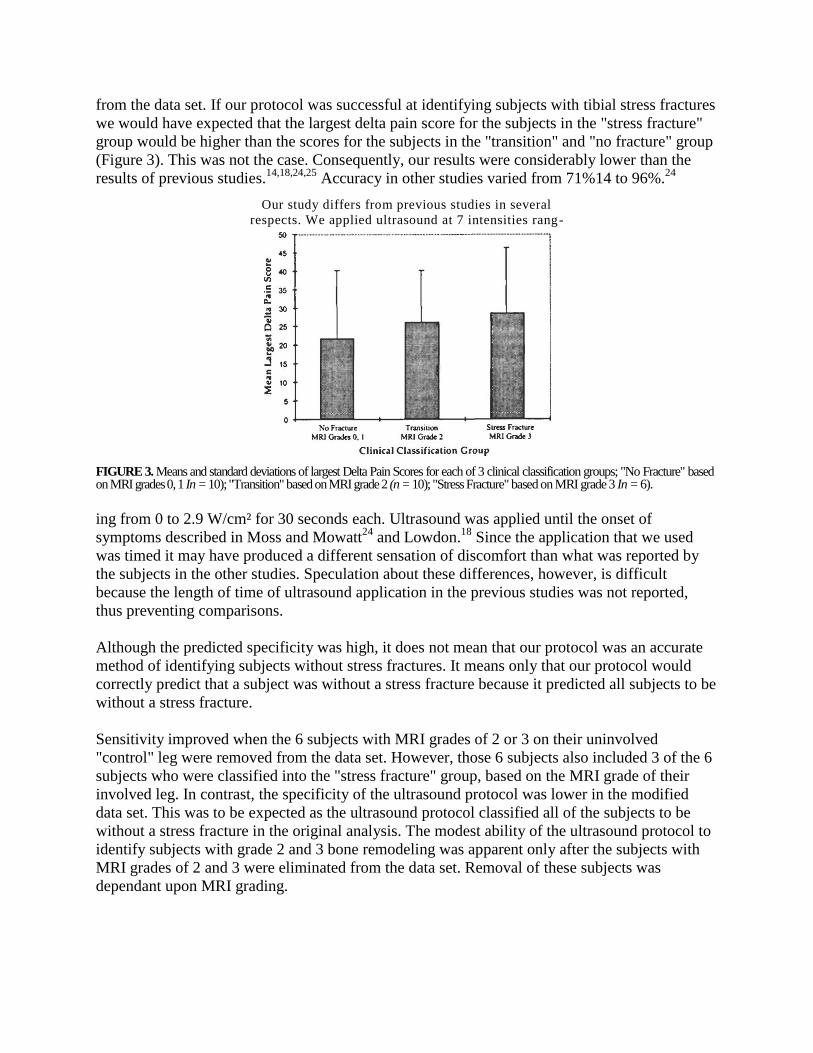
from the data set. If our protocol was successful at identifying subjects with tibial stress fractures
we would have expected that the largest delta pain score for the subjects in the "stress fracture"
group would be higher than the scores for the subjects in the "transition" and "no fracture" group
(Figure 3). This was not the case. Consequently, our results were considerably lower than the
results of previous studies.14,18,24,25
Accuracy in other studies varied from 71%14 to 96%.24
Our study differs from previous studies in several
respects. We applied ultrasound at 7 intensities rang-
FIGURE 3. Means and standard deviations of largest Delta Pain Scores for each of 3 clinical classification groups; "No Fracture" based on MRI grades 0, 1 In = 10); "Transition" based on MRI grade 2 (n = 10); "Stress Fracture" based on MRI grade 3 In = 6).
ing from 0 to 2.9 W/cm² for 30 seconds each. Ultrasound was applied until the onset of
symptoms described in Moss and Mowatt24
and Lowdon.18
Since the application that we used
was timed it may have produced a different sensation of discomfort than what was reported by
the subjects in the other studies. Speculation about these differences, however, is difficult
because the length of time of ultrasound application in the previous studies was not reported,
thus preventing comparisons.
Although the predicted specificity was high, it does not mean that our protocol was an accurate
method of identifying subjects without stress fractures. It means only that our protocol would
correctly predict that a subject was without a stress fracture because it predicted all subjects to be
without a stress fracture.
Sensitivity improved when the 6 subjects with MRI grades of 2 or 3 on their uninvolved
"control" leg were removed from the data set. However, those 6 subjects also included 3 of the 6
subjects who were classified into the "stress fracture" group, based on the MRI grade of their
involved leg. In contrast, the specificity of the ultrasound protocol was lower in the modified
data set. This was to be expected as the ultrasound protocol classified all of the subjects to be
without a stress fracture in the original analysis. The modest ability of the ultrasound protocol to
identify subjects with grade 2 and 3 bone remodeling was apparent only after the subjects with
MRI grades of 2 and 3 were eliminated from the data set. Removal of these subjects was
dependant upon MRI grading.
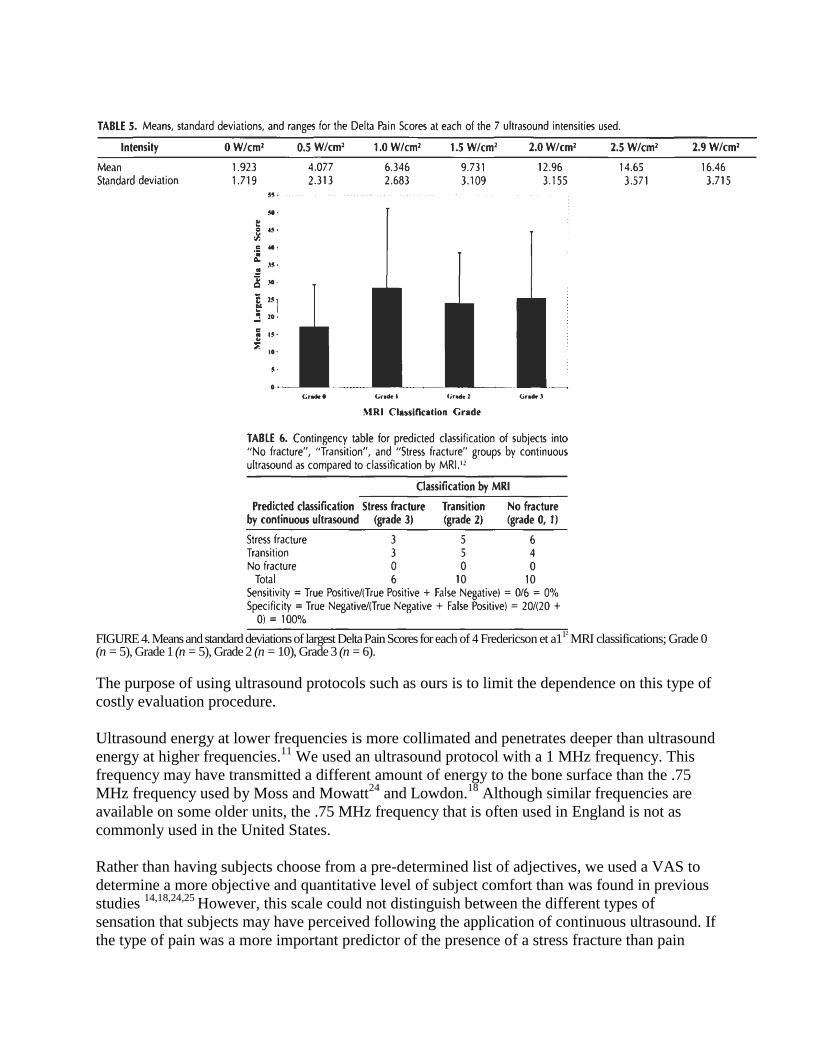
FIGURE 4. Means and standard deviations of largest Delta Pain Scores for each of 4 Fredericson et a1
1² MRI classifications; Grade 0
(n = 5), Grade 1 (n = 5), Grade 2 (n = 10), Grade 3 (n = 6).
The purpose of using ultrasound protocols such as ours is to limit the dependence on this type of
costly evaluation procedure.
Ultrasound energy at lower frequencies is more collimated and penetrates deeper than ultrasound
energy at higher frequencies.11
We used an ultrasound protocol with a 1 MHz frequency. This
frequency may have transmitted a different amount of energy to the bone surface than the .75
MHz frequency used by Moss and Mowatt24
and Lowdon.18
Although similar frequencies are
available on some older units, the .75 MHz frequency that is often used in England is not as
commonly used in the United States.
Rather than having subjects choose from a pre-determined list of adjectives, we used a VAS to
determine a more objective and quantitative level of subject comfort than was found in previous
studies 14,18,24,25
However, this scale could not distinguish between the different types of
sensation that subjects may have perceived following the application of continuous ultrasound. If
the type of pain was a more important predictor of the presence of a stress fracture than pain
intensity, then the VAS might not be a valid scale to evaluate subject symptoms after the
application of our protocol.
Our subjects were tested with ultrasound less than 2 weeks after the onset of their symptoms.
Moss and Mowatt24
and Lowdon's18
subjects were examined only after they presented at a sports
medicine clinic. Consequently, the subjects in their studies may have had more advanced stages
of injuries than our subjects and thus were more sensitive to the ultrasound at evaluation.
It is also possible that continuous ultrasound may not cause greater heating in a remodeling bone
than in a normal, healthy one. This suggestion contradicts the theory that increased osteoclastic
resorption that accompanies stress fractures also results in greater heat absorption and an
increase in bone pain." Our findings are more consistent with those of Devereaux et al10
and
Boam et al.5 Devereaux et al
10 used the same ultrasound parameters described by Moss and
Mowatt24
to examine 18
subjects reporting tibial or fibular pain. They reported that ultrasound
was used to correctly diagnose tibia and fibular stress fractures in 44% of their subjects' involved
legs based on radiographs and scintigraphy. Devereaux et al10
suspected that the differences
between their study and Moss and Mowatt24
were due to the decreased ability of ultrasound to
cause pain in the callousing bone that begins to develop 2 to 3 weeks after the injury. We
attempted to account for this callous development by applying ultrasound to subjects who had
pain complaints for less than 2 weeks. Hence, any decrease in our subjects' perception of
discomfort was probably not due to callous formation on healing bone.
Boam et al5 studied 78 patients with ultrasound and scintiscan. Subjects were examined using an
ultrasound intensity of 2.0 W/cm² or 0 W/cm² for 30 seconds. The ultrasound examination was
classified as positive if the subject reported pain during ultrasound application. The authors
reported that compared to scintiscan, ultrasound had a sensitivity of 43% (15/35) and a
specificity of 49% (21/43). The positive predictive value was 41% and the negative predictive
value was 51%. The accuracy reported by Boam et al is consistent with ours. However, Boam et
al reported a higher sensitivity and lower specificity than what we found.7,23
Similar to the other
studies described, Boam et al used the presence of "pain" to identify subjects with a stress
fracture. This is in contrast to the VAS used in our study. If the type of pain is more effective at
identifying subjects that have a stress fracture compared to pain intensity, then protocols that
measure the presence of pain will identify more subjects as "positive" for a stress fracture and
have a higher sensitivity than a protocol that measures pain intensity.
Another explanation for the low percentage of subjects correctly classified in our study may be
that nearly 25% (6/26) of our subjects had MRI-confirmed areas of bone remodeling on their
uninvolved legs. In a controlled study of 23 subjects with exercise induced shin pain for a period
of less than 3 months, Batt et al4 also reported MRI changes on otherwise asymptomatic legs. Of
the 46 asymptomatic legs imaged, 4 showed abnormalities (8.7%). Since we were using the
uninvolved legs as controls for each subject, any differences in the perception of discomfort
between the 2 legs may have been compromised because areas of increased bone remodeling
were present. In these cases the uninvolved leg was not a suitable control. Additionally, 1 MHz
ultrasound frequency may not be the best frequency to deliver ultrasound energy to the
superficial medial tibial border. Other studies have used .75 MHz,25,28
but 3 MHz may be more
appropriate because it is commonly used to treat superficial tissues.11
We found no studies that
used a frequency of 3 MHz to identify stress fractures.
Magnetic Resonance Imaging Findings
The MRI results in this study consistently showed less advanced stages of bone remodeling than
Fredericson et al's subjects.12
More than one-third of the subjects in our study had Grade 0 or
grade 1 findings upon MRI examination. Only 2 of 18 subjects in the study by Fredericson et
all.12
study presented as grade 0 (11.1%) and 2 as grade 1 (11.1%). Frederic- son et al,12
however,
did show a higher number of subjects classified as grade 3 (n = 10, 55.5%) and grade 4 (n = 1,
5.6%) than our study. There were about half this many subjects with a grade 3 presentation and
no subjects with a grade 4 in our study. The study selection criterion of pain with activity that
discontinued with rest used in our study probably eliminated any subjects with a Grade 4 injury
since these injuries often cause pain with and without activity.
Fredericson et all.12
probably studied a population with more advanced bone remodeling than our
subjects. The subjects who had a previous imaging study for their injuries were excluded from
this study, yet Fredericson et al included subjects who had positive bone scans, shin splints, tibial
stress reaction, or fracture. Moreover, the subjects in our study had a shorter time between the
onset of symptoms and completion of ultrasound and imaging studies. As a result, our subjects
had less advanced bone remodeling than the subjects in Fredericson et al12
and Anderson et al.1
It is unclear how long Fredericson et al's12
subjects experienced their symptoms before clinical
and radiological examination. However, the subjects in Anderson et al' reported symptoms for 2
to 84 months (mean = 23.8 months). The longer duration of symptoms coupled with a longer
exposure to the aggravating activity may have resulted in an increased level of bone marrow
remodeling. As a result of this potentially higher level of remodeling, the subjects in the other
studies might have had a corresponding MRI grade that was higher than the MRI grade for our
subjects.
Clinical Classification Scheme
Classification of stress fractures by clinical presentation is not unique. Arendt and Griffiths2
proposed a 2-category scheme based on scintigraphic findings. The subjects in this study were
classified into 3 clinical groups based on the MRI grading scheme of Fredericson et al.12
The
subperiosteal edema present in Fredericson et al grade 1 images has been identified as a normal
response of bone to stress.1,7,12,23
Since grade 1 findings are prevalent with normal bone
remodeling, alone they are probably not indicative of true "stress fractures." Clinically, the
symptomatic subjects usually require modification of the insulting activity and less than 3 weeks
of rest and rehabilitation.12
As a result, grade 0 and 1 injuries were considered as having "no
fracture" in our study.
Conversely, several studies suggest that a decreased Tl signal intensity with increased signal
intensity on T2 or STIR MRI images is indicative of a "stress fracture." 16,19,22,30
This common
definition is consistent with a Fredericson et al12
grade 3. Fredericson et al reported that these
more advanced cases of bone remodeling required from 6 to more than 12 weeks of
rehabilitation and, in some cases, casting. Because of the advanced radiologic appearance and
increased time of morbidity demonstrated previously,12 subjects with these types of injuries
were assigned to the "stress fracture" clinical classification group.
The Fredericson et al12
grade 2 injuries include visible marrow changes on STIR sequences only
and have a more inconsistent clinical appearance. Many continue to increase in severity to a
grade 3 lesion while others revert to a less severe grade 1 appearance. Because of their varying
clinical appearance and questionable fit into either of the "fracture" or "no fracture" group,
subjects with this stage of bone remodeling were labeled as "transition."
Cassifying subjects into 3 clinical groups was done for 3 reasons. First, after pilot testing, we
believed that ultrasound would not be a sensitive enough modality to separate subjects into 5
groups. Second, findings consistent with a Fredericson grade 3 injury have been identified in the
literature as positive for a stress fracture.16,18,22,30
Third, we thought that it was more important to
identify those subjects who did or did not have bone remodeling consistent with a stress fracture,
as opposed to the need to identify the subtle changes between normal findings (grade 0) and
findings of periosteal edema (grade l), and advanced bone marrow edema (grade 3), and frank
cortical fracture (grade 4).
Clinical Applications
The application of therapeutic continuous ultrasound with this protocol is not an effective
method for identifying subjects with tibial stress fractures. As the MRI studies of the
asymptomatic legs revealed, it is unrealistic to assume that an asymptomatic leg is normal and
without changes in bone remodeling. Ultrasound may not be a sensitive enough modality to
classify subjects into 3 groups.
Future studies should examine the use of other ultrasound parameters and subject reporting
methods to identify subjects with advanced bone marrow edema consistent with a grade 3 MRI
classification. Clinically, these are the patients who are most "at risk" of developing a frank
cortical fracture and who would benefit from early identification, prolonged rest, and a
modification of their aggravating activity.
ACKNOWLEDGMENTS
The authors recognize the technical assistance of John Christopher and the expertise and support
of Joe H. Gieck and Ethan N. Saliba.
REFERENCES
1. Anderson MW, Ugalde V, Batt M, Gacayan J. Shin splints: MR appearance in a preliminary
study. Musculoskel Radiol. 1997;204:177-180.
2. Arendt EA, Griffiths HJ. The use of MR imaging in the assessment and clinical
management of stress reactions of bone in high performance athletes. Clin Sports Med.
1997;16:291-306.
3. Atlan H, Sigal R, Hadar H, et al. Nuclear magnetic resonance proton imaging of bone
pathology. / Nucl Med. 1986;27:207-215.
4. Batt ME, Ugalde V, Anderson MW, Shelton DK. A prospective controlled study of
diagnostic imaging for acute shin splints. Med Sci Sports Exerc. 1998;30:1564-1571.
5. Boam WD, Miser WF, Yuill SC, Delaplain CB, Gayle EL, MacDonald DC. Comparison of
ultrasound examination with bone scintiscan in the diagnosis of stress fractures. J Am Board
Fam Pract. 1996;9:414-417.
6. Brukner P, Bradshaw KM, Khan KM, White S, Crossley K. Stress fractures: review of 180
cases. Clin J Sports Med. 1996;6:85-89.
7. Clement DB. Tibial stress syndrome in athletes. J Sports Med. 1974;2:81-85.
8. Delacerda FG. A case study: application of ultrasound to determine a stress fracture of the
fibula. I Orthop Sports Phys Ther. 1981;2:134-136.
9. Devas MB. Stress fractures in the tibia of athletes with shin soreness. J Bone Joint Surg.
1958;40B:227-239.
10. Deveraux MD, Parr GR, Lachmann SM, Page-Thomas P, Hazelman BL. The diagnosis of stress
fractures in athletes. JAMA. 1984;252:531-533.
11. Draper DO. Ten mistakes commonly made with ultrasound use: current research sheds
light on myths. Ath Train Sports Hlth Care Perspect. 1996;2:95-107.
12. Fredericson M, Bergman AG, Hoffman KL, Dillingham MS. Tibial stress reaction in runners:
correlation of clinical symptoms and scintigraphy with a new magnetic resonance imaging
grading system. Am I Sports Med. 1995; 23:472-481.
13. Geslien GE, Thrall JH, Espinosa JL, Older RA. Early detection of stress fractures using 99m
tc-polyphosphate. Radiol. 1976;121:683-687.
14. Giladi M, Ziv Y, Aharonson E, Nili E, Danon YL. Comparison between radiology, bone
scan, and ultrasound in the diagnosis of stress fractures. Mil Med. 1984;149:459461.
15. Greaney RB, Gerber FH, Laughlin RL, et al. Distribution and natural history of stress
fractures in U.S. marine recruits. Radiol. 1983;146:339-346.
16. Lee JK, Yao L. Stress fractures: MR imaging. Radiol. 1988; 169:217-220.
17. Li G, Zhang S, Chen G, Chen H, Wang A. Radiologic and histologic analyses of stress fracture in
rabbit tibias. Am J Sports Med. 1985;13:285-294.
18. Lowdon A. Application of ultrasound to assess stress fractures. Physiotherapy. 1986; 72:160-
161.
19. Martin SD, Healey JH, Horowitz S. Stress fracture MRI. AIR. 1993;16:75-77.
20. Matheson GO, Clement DB, McKenzie DC, et al. Stress fractures in athletes: a study of 320
cases. Am J Sports Med. 1987;15:46-58.
21. Matheson GO, Clement DB, McKenzie DC, Taunton JE, Lloyd-Smith DR, Macintyre JG.
Scintigraphic uptake of 99mTc at non-painful sites in athletes with stress fractures: the
concept of bone strain. Sports Med. 1987;4:6575.
22. Meyers SP, Wiener SN. Magnetic resonance imaging features of fractures using the short tau
inversion (STIR) sequence: correlation with radiographic findings. Skeletal Radiol.
1991;20:499-507.
23. Milgrom C, Chison R, Giladi M, et al. Negative bone scan in impending tibial stress fractures.
Am J Sports Med. 1984;12:488-491.
24. Moss A, Mowatt AG. Ultrasonic assessment of stress fractures. Br Med J. 1983;286:1479-
1480.
25. Nitz AJ, Scoville CR. Use of ultrasound in early detection of stress fractures of the medial
tibial plateau. Mil Med. 1980;145:844-846.
26. Norfray JF, Schlachter L, Kernahan WT Jr, et al. Early confirmation of stress fractures in joggers.
JAMA. 1980;243: 1647-1649.
27. Prather JL, Nusynowitz ML, Snowdy HA, Hughes AD, McCartney WH, Bagg RJ. Scintigraphic
findings in stress fractures. J Bone Joint Surg. 1977;59A:869-875.
28. Savoca CJ. Stress fractures: a classification of the earliest radiographic signs. Radiol.
1971;100:519-524.
29. Scott J, Huskisson EC. Graphic representation of pain. Pain. 1976;2:175-184.
30. Stafford SA, Rosenthal DI, Gebhardt MC, et al. MRI in stress fracture. AIR. 1986;147:553-
556.
31. Wilcox JR, Moniot AL, Green JP. Bone scanning in the evaluation of exercise related
stress injuries. Radiol. 1977;123:699-703.
Related Documents