I. Sustainable convergence in the euro area: A multi- dimensional process Volume 16 No 3 | 9 I.1. Introduction "Sustainable convergence" (defined here as a convergence process that is durable and sustainable over time) is key in the context of economic and monetary integration in the euro area. It importantly contributes to the well-functioning of EMU in terms of economic performance, as well as to its socio-economic and political sustainability in the longer run. In turn, a well-functioning EMU supports sustainable convergence as it strengthens the incentives for, inter alia, cross-border trade and capital flows, technology and knowledge transfers, labour mobility and price arbitrage, all drivers of convergence. Discussions on how to strengthen sustainable convergence have recently occupied the centre stage in the debate on the completion of EMU. ( 2 ) ( 1 ) This section was prepared by Katia Berti and Eric Meyermans. The authors wish to thank Erik Canton, Alessandro Turrini and Nicolas Philiponnet for useful comments. ( 2 ) The Five Presidents' Report of June 2015 suggested to strengthen the existing governance framework for economic policy coordination in the short run, while introducing a more formalised set of commonly agreed binding standards in the In this section the point is made that sustainable convergence should be looked at as a multi- dimensional process, covering different relevant dimensions (nominal, real, social and cyclical convergence, as well as convergence towards resilient economic structures). All these dimensions together concur in ensuring the long-term economic, social and political sustainability of the EMU. At the same time, some of these dimensions are relatively more important for the well- functioning of EMU and should therefore be achieved as a matter of priority. Measures to strengthen convergence towards resilient economic structures, as well as reforms (of institutional nature too) that help preventing unsustainable financial cycles are key in this respect. Conceiving convergence as a multi-dimensional process implies medium term. To the same aim, the European Commission's Reflection Paper on the deepening of the Economic and Monetary Union of May 2017 pointed to the possibility of: i) strengthening the EU-level framework for convergence (the single market, the banking and capital markets union); ii) strengthening economic policy coordination under the European Semester (and here reference is made also to the possibility of a more binding convergence process based on agreed standards, as envisaged in the Five Presidents' Report); and iii) reinforcing the link between national reforms and EU funding. Economic and social divergences between euro area Member States that emerged with the recent crisis have brought to the forefront of the policy debate the issue of convergence, and in particular what could be called "sustainable convergence" (i.e. a convergence process that is durable and sustainable over time). In this section the point is made that to achieve sustainable convergence among EMU members, different relevant dimensions of convergence need to be fostered. Convergence should indeed be looked at as a multi-dimensional process, whereby nominal, real, social, cyclical convergence (as affected by both business and financial cycles) and convergence towards resilient economic structures are different but relevant and interrelated dimensions. Together they concur to determining the longer-term socio-economic and political sustainability of EMU. The empirical analysis shows, for instance, that real convergence (measured as real GDP per capita), weakened with the crisis, especially among the older euro area Member States. Differences among these countries in income distribution and in poverty rates were widened by the crisis too. Moreover, business cycles appear to have differed significantly in terms of amplitude across euro area Member States since the late '90s and remarkable differences have been observed in the amplitudes of the financial cycles. As shown by the experience of the recent crisis, convergence towards resilient economic structures is pivotal for a well-functioning EMU. This section argues that measures aimed at further deepening of the Single Market, labour market reforms that protect workers more than jobs, effective education and training systems and well-functioning financial markets are particularly relevant under this dimension. It is also argued that avoiding very large asymmetries in financial cycles is important to promote macro-financial stability in the institutional set up of EMU. Completing the Banking Union, making significant progress on the Capital Markets Union and strengthening macro-prudential policies in EMU would all contribute to preventing the building up of unsustainable asymmetries in financial cycles. ( 1 )

Welcome message from author
This document is posted to help you gain knowledge. Please leave a comment to let me know what you think about it! Share it to your friends and learn new things together.
Transcript
I. Sustainable convergence in the euro area: A multi-dimensional process
Volume 16 No 3 | 9
I.1. Introduction
"Sustainable convergence" (defined here as a convergence process that is durable and sustainable over time) is key in the context of economic and monetary integration in the euro area. It importantly contributes to the well-functioning of EMU in terms of economic performance, as well as to its socio-economic and political sustainability in the longer run. In turn, a well-functioning EMU supports sustainable convergence as it strengthens the incentives for, inter alia, cross-border trade and capital flows, technology and knowledge transfers, labour mobility and price arbitrage, all drivers of convergence. Discussions on how to strengthen sustainable convergence have recently occupied the centre stage in the debate on the completion of EMU. (2)
(1) This section was prepared by Katia Berti and Eric Meyermans.
The authors wish to thank Erik Canton, Alessandro Turrini and Nicolas Philiponnet for useful comments.
(2) The Five Presidents' Report of June 2015 suggested to strengthen the existing governance framework for economic policy coordination in the short run, while introducing a more formalised set of commonly agreed binding standards in the
In this section the point is made that sustainable convergence should be looked at as a multi-dimensional process, covering different relevant dimensions (nominal, real, social and cyclical convergence, as well as convergence towards resilient economic structures). All these dimensions together concur in ensuring the long-term economic, social and political sustainability of the EMU. At the same time, some of these dimensions are relatively more important for the well-functioning of EMU and should therefore be achieved as a matter of priority. Measures to strengthen convergence towards resilient economic structures, as well as reforms (of institutional nature too) that help preventing unsustainable financial cycles are key in this respect. Conceiving convergence as a multi-dimensional process implies
medium term. To the same aim, the European Commission's Reflection Paper on the deepening of the Economic and Monetary Union of May 2017 pointed to the possibility of: i) strengthening the EU-level framework for convergence (the single market, the banking and capital markets union); ii) strengthening economic policy coordination under the European Semester (and here reference is made also to the possibility of a more binding convergence process based on agreed standards, as envisaged in the Five Presidents' Report); and iii) reinforcing the link between national reforms and EU funding.
Economic and social divergences between euro area Member States that emerged with the recent crisis
have brought to the forefront of the policy debate the issue of convergence, and in particular what
could be called "sustainable convergence" (i.e. a convergence process that is durable and sustainable
over time). In this section the point is made that to achieve sustainable convergence among EMU
members, different relevant dimensions of convergence need to be fostered. Convergence should
indeed be looked at as a multi-dimensional process, whereby nominal, real, social, cyclical convergence
(as affected by both business and financial cycles) and convergence towards resilient economic
structures are different but relevant and interrelated dimensions. Together they concur to determining
the longer-term socio-economic and political sustainability of EMU.
The empirical analysis shows, for instance, that real convergence (measured as real GDP per capita),
weakened with the crisis, especially among the older euro area Member States. Differences among
these countries in income distribution and in poverty rates were widened by the crisis too. Moreover,
business cycles appear to have differed significantly in terms of amplitude across euro area Member
States since the late '90s and remarkable differences have been observed in the amplitudes of the
financial cycles.
As shown by the experience of the recent crisis, convergence towards resilient economic structures is
pivotal for a well-functioning EMU. This section argues that measures aimed at further deepening of the
Single Market, labour market reforms that protect workers more than jobs, effective education and
training systems and well-functioning financial markets are particularly relevant under this dimension.
It is also argued that avoiding very large asymmetries in financial cycles is important to promote
macro-financial stability in the institutional set up of EMU. Completing the Banking Union, making
significant progress on the Capital Markets Union and strengthening macro-prudential policies in EMU
would all contribute to preventing the building up of unsustainable asymmetries in financial cycles. (1)
10 | Quarterly Report on the Euro Area
that policy design needs to consider the interactions between the different dimensions, with particular focus on possible self-reinforcing mechanisms to be exploited and trade-offs to be accounted for.
In economic terms, the concept of convergence can take different connotations depending on the precise definition that is adopted in terms of: i) factors that are looked at to establish the case for convergence or divergence; (3) ii) criteria used to assess convergence; (4) and iii) the geographical dimension at which convergence is analysed (typically countries or regions within countries – the focus in this section will be on the former). (5)
This section of the report analyses, from a conceptual and empirical point of view, convergence in the euro area across the aforementioned dimensions. Sub-section 2 focusses on the different dimensions of convergence from a conceptual point of view, discussing briefly their functional relevance for EMU. Sub-section 3 describes convergence patterns in the euro area with respect to nominal, real, social and cyclical convergence, taking into account both business and financial cycles. The interactions between the different dimensions of convergence and business/financial cycle synchronisation are then examined in sub-section 4. Conclusions and policy implications are drawn in sub-section 5.
I.2. Sustainable convergence as a multi-dimensional concept: definitions and economic rationale for EMU
This section briefly explores the concept of sustainable convergence in its various dimensions and elaborates on its rationale in the context of EMU.
(3) Based on this it is possible to distinguish between nominal, real,
social and cyclical convergence and convergence towards resilient economic structures.
(4) This involves, for instance, a distinction between sigma-convergence, absolute and conditional beta-convergence under the dimension of real convergence, as well as between cycle synchronisation and differences in cycle amplitudes under cyclical convergence. See Subsection I.3 below for more details.
(5) It is beyond the scope of this section to cover the regional dimension of convergence. Convergence will be meant here as convergence between countries, rather than between regions within a country. On the latter, see, for instance, Goecke, H. and M. Hüther (2016), 'Regional Convergence in Europe', Intereconomics, Vol. 51, No. 3, pp. 165-171.
Sustainable convergence is most appropriately defined as a multidimensional process. Five different dimensions of convergence can usefully be distinguished in this respect: i) nominal, ii) real, iii) social, iv) cyclical (impacted by both business and financial cycles) and v) convergence towards resilient economic structures. Some of these dimensions (like convergence in living standards and social outcomes) can be thought of as having a direct impact on citizens' welfare across Member States, while others (nominal convergence, for instance) are instrumental in raising welfare. As will be explained in what follows, some of the aforementioned dimensions are needed for a smooth functioning of the EMU. They refer, for instance, to important features of the economy that would strengthen the euro area capacity to respond to shocks (convergence toward resilient economic structures), or importantly ensure macro-financial stability and the smooth conduct of the common monetary policy in the currency union (avoidance of unsustainable differences in financial cycles). Other dimensions of convergence are instead needed to ensure the economic and political sustainability of EMU in the longer run (convergence in living standards and in social outcomes, for instance). Each of these dimensions is analysed in more detail below.
Nominal convergence refers to convergence in nominal variables like interest rates, inflation and exchange rates. A focus on nominal convergence has informed the Maastricht criteria to be fulfilled for entering EMU. Nominal convergence, prior to joining, in long-term interest rates and inflation improves the capability of copying with a single monetary policy rate and the absence of the exchange rate within the currency union. (6)
Real convergence instead refers to convergence in living standards, typically (but not exclusively) measured by real GDP per capita. While real convergence is not necessarily a pre-condition for a well-functioning monetary union, (7) the euro was introduced as a means to achieve the Union's objectives. These explicitly include economic, social and territorial cohesion, and the Treaty
(6) The Maastricht criteria additionally impose requirements (in the
form of upper limits) related to public finances (government budget deficit and debt-to-GDP ratio).
(7) For instance, Young, A., Higgins, M. and D. Levy (2013), 'Heterogeneous convergence', Economics Letters, Vol. 120, pp. 238–241, report a significant heterogeneity in the state-level convergence rates across 22 US states.
I. Sustainable convergence in the euro area: A multi-dimensional process
Volume 16 No 3 | 11
mentions convergence as a means to promote the latter. (8) Over the longer run, real convergence in the euro area supports economic and political sustainability of the integration process, and eases the identification of common economic policy priorities and common/coordinated policy-making in the area. For these reasons, economic policy coordination in the context of the European Semester covers policies that contribute to real convergence and European Structural and Investment (ESI) Funds have been actively used to the purpose. Completing the institutional architecture of EMU is also key to support real convergence in the euro area, through strengthening the incentives for reforms that improve economic performance.
Social convergence is defined, to the purpose of the analysis presented in this section, as (upward) convergence across Member States in social outcomes, such as income inequality and poverty rates (which can of course be achieved with different economic and social structures and institutions). (9) As for real convergence, the social dimension is highlighted in the Treaty as one of the Union's objectives ('social cohesion'), and has been taken up explicitly in the European Commission's Europe 2020 strategy for growth and jobs. (10) Reforms and policies that are essential to foster social convergence are guided by the European Pillar of Social Rights. (11)
(8) In the Treaty on the Functioning of the European Union
(TFEU), convergence (in the sense of "overall harmonious development" of the Union and "reducing disparities between the levels of development of the various regions and the backwardness of the least favoured regions") is a means to promote economic, social and territorial cohesion. Cohesion is to be achieved via the coordination of economic policies and budgetary instruments. At the same time, the objective of convergence is repeated in the TFEU, in the legal basis for economic policy coordination in the Union. See Andor L. (2014), "Cohesion and convergence in Europe", lecture delivered at the Warsaw School of Economics, 24 October 2014.
(9) As such, social convergence is to be kept separate from real convergence, though there is a strong inter-relation between the two dimensions. While real convergence is based on the comparison across Member States of real GDP per capita as the average national aggregate, social convergence relies on the comparison across Member States of a distribution (income distribution) within the country.
(10) For instance, one of the targets of the Europe 2020 Strategy is to have at least 20 million fewer people in or at risk of poverty/social exclusion for the EU as a whole in 2020 compared to 2008.
(11) The principles set out in the Pillar fall into three broad chapters: i) equal opportunities and access to the labour market, ii) fair working conditions, and iii) social protection and inclusion. The Pillar is accompanied by a social scoreboard to monitor performances and track trends across the Member States. The
A concept that is attracting renewed attention recently is the one of cyclical convergence (under which business (12) and financial cycles are to be distinguished). This involves two distinct dimensions: i) the cycle synchronisation (i.e. the correlation of business/financial cyclical fluctuations across euro area countries) and ii) the alignment in (business/financial) cycle amplitudes. (13) Business cycle convergence is particularly important in the euro area as the conduct of the common monetary policy is more effective if Member States are in the same stage of the business cycle, and experience no major differences in the monetary policy stance that would be optimal for each of them. At the same time, developments in financial cycles are important too, as shown by the way the last crisis unravelled in the euro area. Differences in financial cycles can become excessive and get to the point of amplifying economic fluctuations through inefficient and unsustainable credit allocation. Financial cycle de-synchronisation and large misalignments in financial cycle amplitudes can endanger macro-financial stability in the currency union. This is especially the case when financial integration is not "resilient", i.e. it can unravel and become itself a source of instability in the face of large shocks (with debt finance being more subject to sudden reversals than equity and FDI, for instance). (14) When both the business and financial cycles are not synchronised, the single monetary policy might not be able alone to stabilise the economy. (15) Completing the institutional architecture of EMU (in particular through the completion of the Financial Union and continued
scoreboard provides a number of headline indicators to screen the employment and social performance of Member States along the three dimensions of the Pillar (see the Joint Employment Report 2018).
(12) The literature on business cycle convergence includes: Belo, F. (2001), ‘Some Facts about the Cyclical Convergence in the Euro Zone’, Banco de Portugal, Economic Bulletin December 2001, pp. 37-44; Gayer, C. (2007), 'A fresh look at business cycle synchronisation in the euro area', European Economy, Economic Papers No. 287; and Balta, N. (2015), 'Business cycle synchronisation in the euro area, Quarterly Report on the Euro Area', Quarterly Review of the Euro Area, Vol.14, No.2.
(13) A distinction is made here between cyclical convergence and cyclical synchronisation, as in Belo (2001), op. cit., that proposes to define cyclical convergence in terms of a combination of association and synchronization concepts. The former can be measured by the concordance coefficient (as done in this section) and the latter by correlating amplitudes.
(14) ECB (2016), Financial Integration in Europe 2016.. (15) In such cases traditional monetary policies should be
complemented by macro-prudential policies. See, for example, Jorda, O. et al. (2014), 'The Great Mortgaging: Housing Finance, Crises, and Business Cycles', NBER Working Paper No. 20501.
12 | Quarterly Report on the Euro Area
progress on key areas of the Single Market) would provide support under this dimension too.
Last but not the least, among the different dimensions of convergence is the concept of convergence towards resilient economic structures. This was used in the Five Presidents' Report, and more recently in the Commission Reflection Paper on the deepening of EMU, to refer to strengthening EMU countries' ability to withstand shocks and swiftly return to potential. (16) Strengthening resilience entails acting on three elements: i) reducing the economies' vulnerability to shocks; ii) increasing their shock-absorption capacity; and iii) increasing their ability to reallocate resources and recover from the shocks. The recent economic and financial crisis has indeed shown that several euro area Member States lacked appropriate economic structures to prevent and respond to the build-up of imbalances and the economic recession that followed. This has caused sizeable adjustment costs in terms of output losses and persistence of high unemployment rates, which have underlined the importance of strengthening convergence towards more resilient economic structures. Economic resilience is particularly relevant for a well-functioning EMU, where intra-area exchange rates are not available any longer as an adjustment tool against asymmetric shocks, monetary policy cannot be tailored to country-specific needs and inflation differentials can exacerbate real interest rate differentials that can magnify shocks.
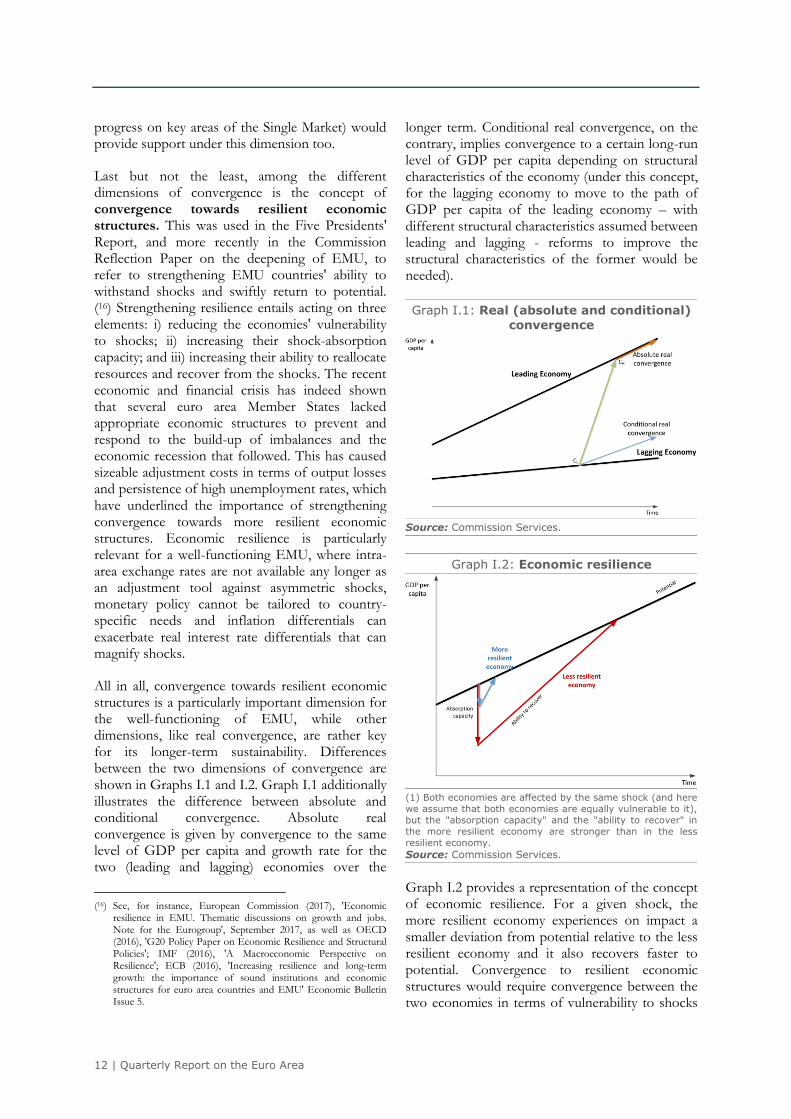
All in all, convergence towards resilient economic structures is a particularly important dimension for the well-functioning of EMU, while other dimensions, like real convergence, are rather key for its longer-term sustainability. Differences between the two dimensions of convergence are shown in Graphs I.1 and I.2. Graph I.1 additionally illustrates the difference between absolute and conditional convergence. Absolute real convergence is given by convergence to the same level of GDP per capita and growth rate for the two (leading and lagging) economies over the
(16) See, for instance, European Commission (2017), 'Economic
resilience in EMU. Thematic discussions on growth and jobs. Note for the Eurogroup', September 2017, as well as OECD (2016), 'G20 Policy Paper on Economic Resilience and Structural Policies'; IMF (2016), 'A Macroeconomic Perspective on Resilience'; ECB (2016), 'Increasing resilience and long-term growth: the importance of sound institutions and economic structures for euro area countries and EMU' Economic Bulletin Issue 5.
longer term. Conditional real convergence, on the contrary, implies convergence to a certain long-run level of GDP per capita depending on structural characteristics of the economy (under this concept, for the lagging economy to move to the path of GDP per capita of the leading economy – with different structural characteristics assumed between leading and lagging - reforms to improve the structural characteristics of the former would be needed).
Graph I.1: Real (absolute and conditional)
convergence
Source: Commission Services.
Graph I.2: Economic resilience
(1) Both economies are affected by the same shock (and here
we assume that both economies are equally vulnerable to it),
but the "absorption capacity" and the "ability to recover" in
the more resilient economy are stronger than in the less
resilient economy.
Source: Commission Services.
Graph I.2 provides a representation of the concept of economic resilience. For a given shock, the more resilient economy experiences on impact a smaller deviation from potential relative to the less resilient economy and it also recovers faster to potential. Convergence to resilient economic structures would require convergence between the two economies in terms of vulnerability to shocks
I. Sustainable convergence in the euro area: A multi-dimensional process
Volume 16 No 3 | 13
and ability to respond to them, independently of differences in economic structures between the two. (17) It is indeed important to stress that convergence towards resilient economic structures does not imply harmonisation. In areas where policy measures to foster convergence to resilient economic structures can be taken, such as labour markets and competitive goods and services markets, different policies can lead to similarly good performance and country-specific solutions can be called for. (18)
I.3. Convergence patterns in the euro area
This section provides a synthetic overview of main developments under the various dimensions of convergence for euro area Member States. Aim is to provide a snapshot of where we stand in terms of convergence, from a multi-dimensional point of view, after the first 15 years of EMU.
Results presented below show that while, in terms of nominal convergence, interest rate differentials across euro area members have narrowed again over the last few years (with benefits for lending to the real economy in the periphery), real and social convergence have both been weakened by the crisis, especially in the EA12, with no re-convergence evident in the data yet. As far as cyclical convergence is concerned, the analysis mostly hints at large cross-country differences, for both business and financial cycles, in terms of cycles' amplitude, over the last 15 and 13 years of EMU respectively. Financial cycle concordance indicators provide clear indications of the unsustainable asymmetries that built up in the run up to the crisis.
I.3.1. Strengthening nominal convergence
As explained in the previous section, nominal convergence refers to a whole set of nominal variables, including interest rates and inflation. During the first 10 years of EMU, differences in interest rates between participating Member States narrowed. But the initial years after the crisis led to sizeable nominal divergences in interest rates, when
(17) For a comprehensive discussion on the strengthening of
economic resilience, see, for instance, Canton, E., P. Mohl, , A. Reut and M. Ward-Warmedinger (2016), 'How to make the Economic and Monetary Union more resilient?', Quarterly Report on the Euro Area, Vol. 15, No. 3, pp. 7-18.
(18) European Commission (2017), 'Reflection Paper on the Deepening of the Economic and Monetary Union', COM(2017) 291 of 31 May 2017.
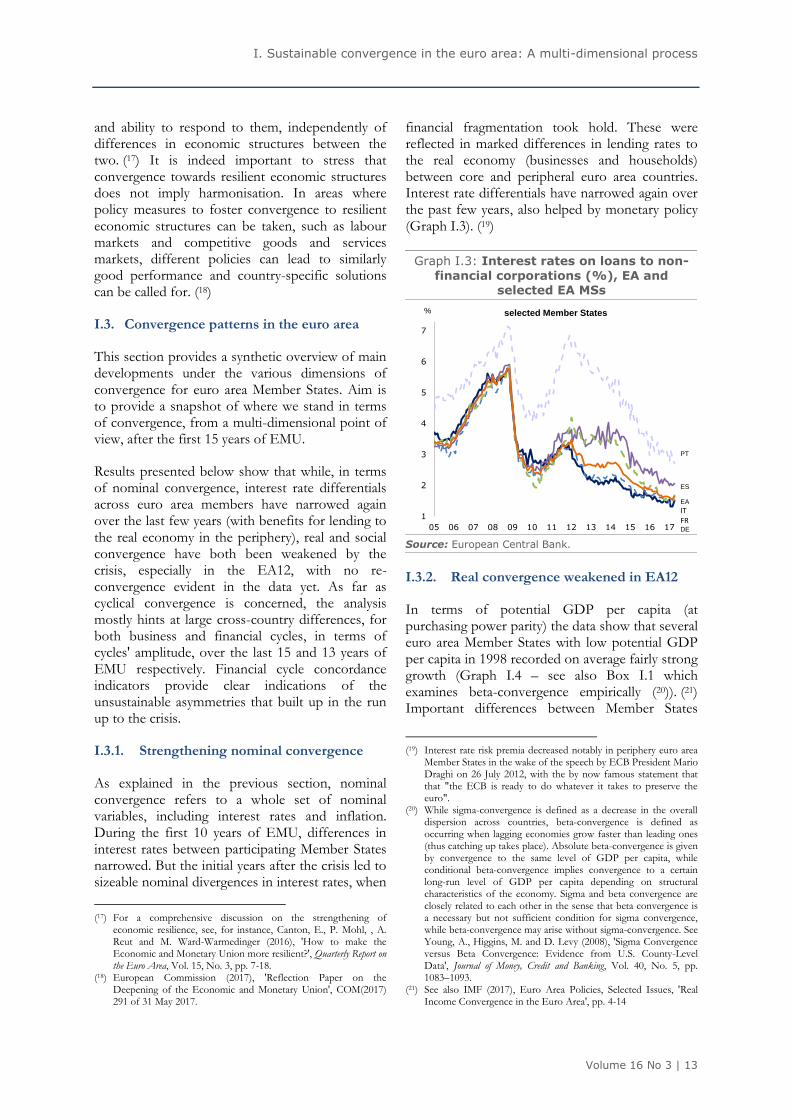
financial fragmentation took hold. These were reflected in marked differences in lending rates to the real economy (businesses and households) between core and peripheral euro area countries. Interest rate differentials have narrowed again over the past few years, also helped by monetary policy (Graph I.3). (19)
Graph I.3: Interest rates on loans to non-
financial corporations (%), EA and selected EA MSs
1
2
3
4
5
6
7
05 06 07 08 09 10 11 12 13 14 15 16 17
%
PT
ES
EA
ITFRDE
selected Member States
Source: European Central Bank.
I.3.2. Real convergence weakened in EA12
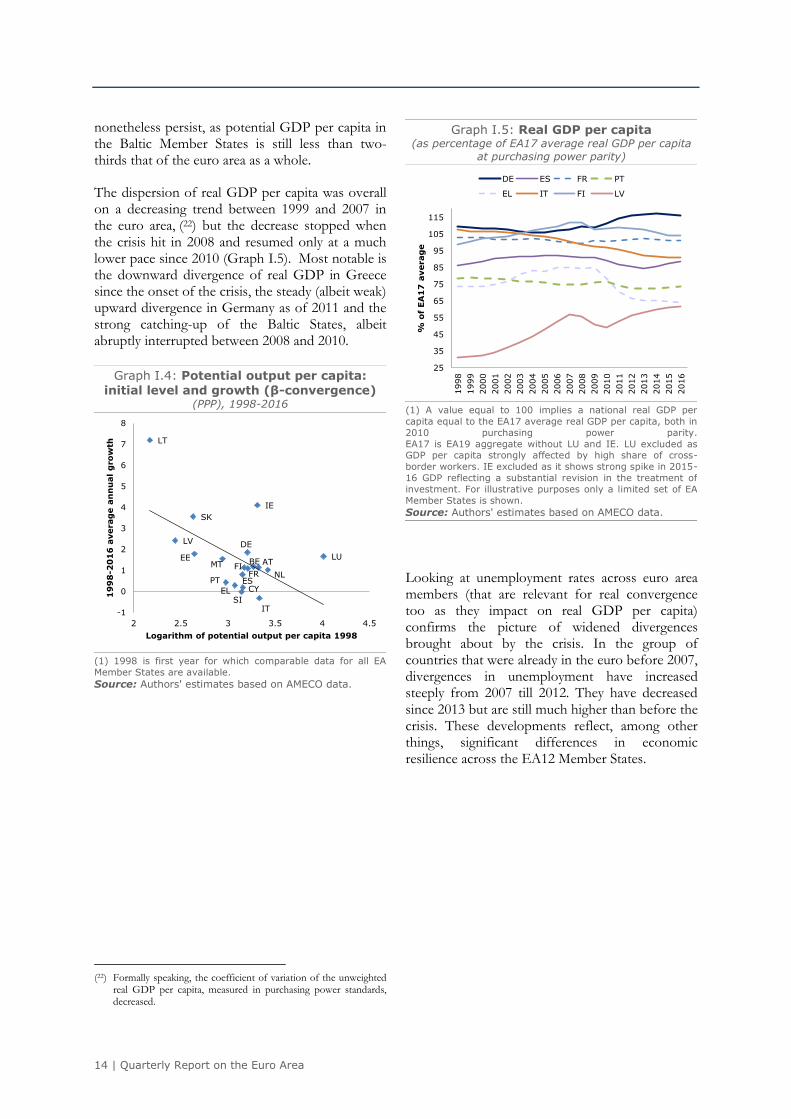
In terms of potential GDP per capita (at purchasing power parity) the data show that several euro area Member States with low potential GDP per capita in 1998 recorded on average fairly strong growth (Graph I.4 – see also Box I.1 which examines beta-convergence empirically (20)). (21) Important differences between Member States
(19) Interest rate risk premia decreased notably in periphery euro area
Member States in the wake of the speech by ECB President Mario Draghi on 26 July 2012, with the by now famous statement that that "the ECB is ready to do whatever it takes to preserve the euro".
(20) While sigma-convergence is defined as a decrease in the overall dispersion across countries, beta-convergence is defined as occurring when lagging economies grow faster than leading ones (thus catching up takes place). Absolute beta-convergence is given by convergence to the same level of GDP per capita, while conditional beta-convergence implies convergence to a certain long-run level of GDP per capita depending on structural characteristics of the economy. Sigma and beta convergence are closely related to each other in the sense that beta convergence is a necessary but not sufficient condition for sigma convergence, while beta-convergence may arise without sigma-convergence. See Young, A., Higgins, M. and D. Levy (2008), 'Sigma Convergence versus Beta Convergence: Evidence from U.S. County-Level Data', Journal of Money, Credit and Banking, Vol. 40, No. 5, pp. 1083–1093.
(21) See also IMF (2017), Euro Area Policies, Selected Issues, 'Real Income Convergence in the Euro Area', pp. 4-14
14 | Quarterly Report on the Euro Area
nonetheless persist, as potential GDP per capita in the Baltic Member States is still less than two-thirds that of the euro area as a whole.
The dispersion of real GDP per capita was overall on a decreasing trend between 1999 and 2007 in the euro area, (22) but the decrease stopped when the crisis hit in 2008 and resumed only at a much lower pace since 2010 (Graph I.5). Most notable is the downward divergence of real GDP in Greece since the onset of the crisis, the steady (albeit weak) upward divergence in Germany as of 2011 and the strong catching-up of the Baltic States, albeit abruptly interrupted between 2008 and 2010.
Graph I.4: Potential output per capita:
initial level and growth (β-convergence) (PPP), 1998-2016
BE
DE
EE
IE
ELES
FR
IT
CY
LV
LT
LUMT
NL
AT
PT
SI
SK
FI
-1
0
1
2
3
4
5
6
7
8
2 2.5 3 3.5 4 4.5
19
98
-20
16
averag
e a
nn
ual
gro
wth
Logarithm of potential output per capita 1998
(1) 1998 is first year for which comparable data for all EA
Member States are available.
Source: Authors' estimates based on AMECO data.
(22) Formally speaking, the coefficient of variation of the unweighted
real GDP per capita, measured in purchasing power standards, decreased.
Graph I.5: Real GDP per capita (as percentage of EA17 average real GDP per capita
at purchasing power parity)
25
35
45
55
65
75
85
95
105
115
1998
1999
2000
2001
2002
2003
2004
2005
2006
2007
2008
2009
2010
2011
2012
2013
2014
2015
2016
% o
f E
A1
7 a
verag
e
DE ES FR PT
EL IT FI LV
(1) A value equal to 100 implies a national real GDP per
capita equal to the EA17 average real GDP per capita, both in
2010 purchasing power parity.
EA17 is EA19 aggregate without LU and IE. LU excluded as GDP per capita strongly affected by high share of cross-
border workers. IE excluded as it shows strong spike in 2015-
16 GDP reflecting a substantial revision in the treatment of
investment. For illustrative purposes only a limited set of EA
Member States is shown.
Source: Authors' estimates based on AMECO data.
Looking at unemployment rates across euro area members (that are relevant for real convergence too as they impact on real GDP per capita) confirms the picture of widened divergences brought about by the crisis. In the group of countries that were already in the euro before 2007, divergences in unemployment have increased steeply from 2007 till 2012. They have decreased since 2013 but are still much higher than before the crisis. These developments reflect, among other things, significant differences in economic resilience across the EA12 Member States.
I. Sustainable convergence in the euro area: A multi-dimensional process
Volume 16 No 3 | 15
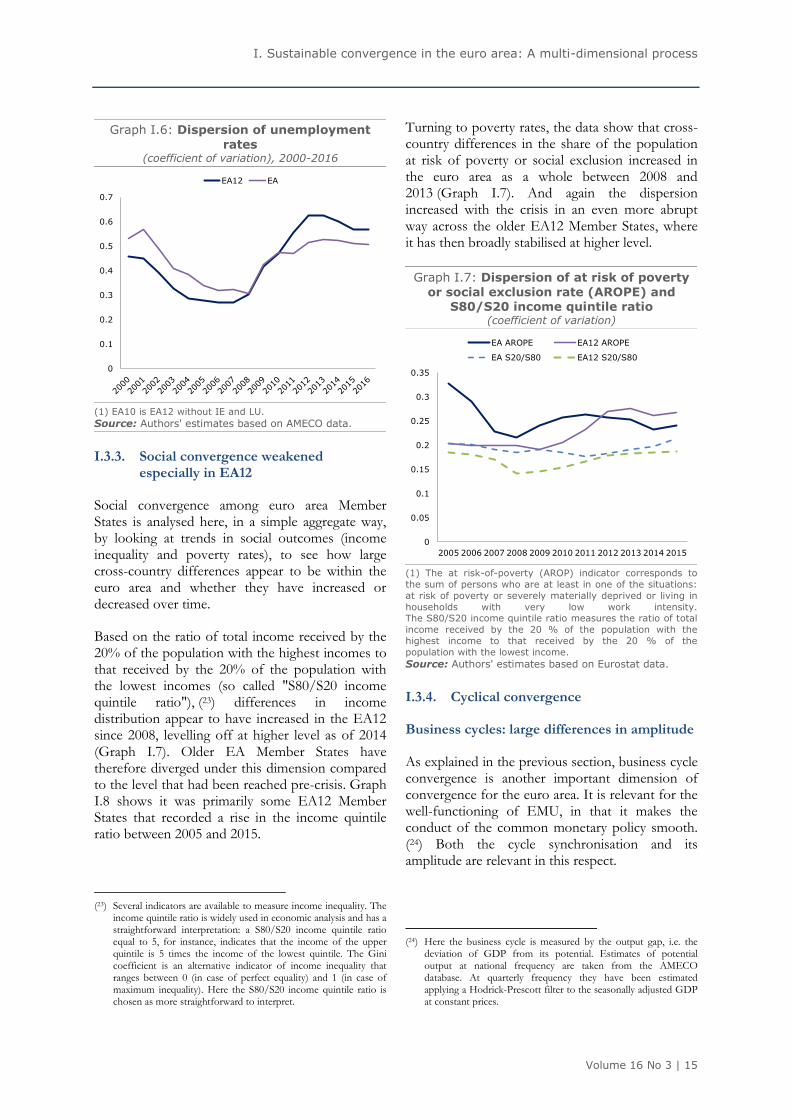
Graph I.6: Dispersion of unemployment
rates (coefficient of variation), 2000-2016
0
0.1
0.2
0.3
0.4
0.5
0.6
0.7
EA12 EA
(1) EA10 is EA12 without IE and LU.
Source: Authors' estimates based on AMECO data.
I.3.3. Social convergence weakened especially in EA12
Social convergence among euro area Member States is analysed here, in a simple aggregate way, by looking at trends in social outcomes (income inequality and poverty rates), to see how large cross-country differences appear to be within the euro area and whether they have increased or decreased over time.
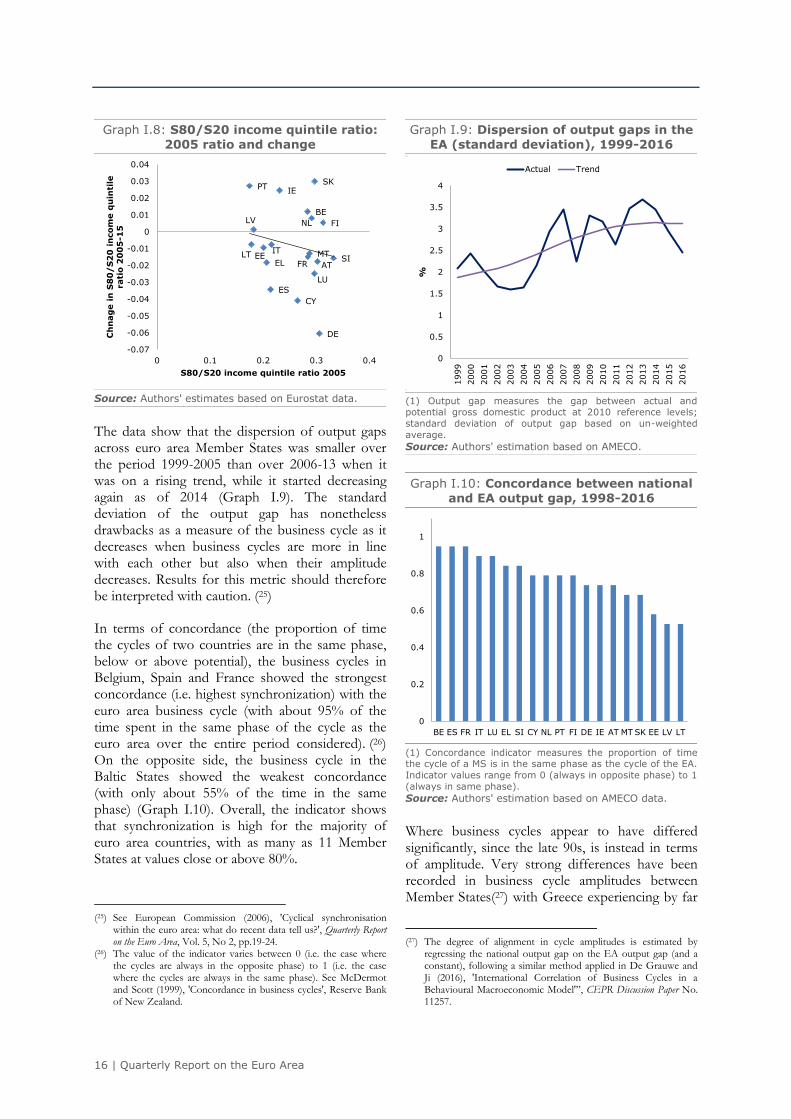
Based on the ratio of total income received by the 20% of the population with the highest incomes to that received by the 20% of the population with the lowest incomes (so called "S80/S20 income quintile ratio"), (23) differences in income distribution appear to have increased in the EA12 since 2008, levelling off at higher level as of 2014 (Graph I.7). Older EA Member States have therefore diverged under this dimension compared to the level that had been reached pre-crisis. Graph I.8 shows it was primarily some EA12 Member States that recorded a rise in the income quintile ratio between 2005 and 2015.
(23) Several indicators are available to measure income inequality. The
income quintile ratio is widely used in economic analysis and has a straightforward interpretation: a S80/S20 income quintile ratio equal to 5, for instance, indicates that the income of the upper quintile is 5 times the income of the lowest quintile. The Gini coefficient is an alternative indicator of income inequality that ranges between 0 (in case of perfect equality) and 1 (in case of maximum inequality). Here the S80/S20 income quintile ratio is chosen as more straightforward to interpret.
Turning to poverty rates, the data show that cross-country differences in the share of the population at risk of poverty or social exclusion increased in the euro area as a whole between 2008 and 2013 (Graph I.7). And again the dispersion increased with the crisis in an even more abrupt way across the older EA12 Member States, where it has then broadly stabilised at higher level.
Graph I.7: Dispersion of at risk of poverty
or social exclusion rate (AROPE) and S80/S20 income quintile ratio
(coefficient of variation)
0
0.05
0.1
0.15
0.2
0.25
0.3
0.35
2005 2006 2007 2008 2009 2010 2011 2012 2013 2014 2015
EA AROPE EA12 AROPE
EA S20/S80 EA12 S20/S80
(1) The at risk-of-poverty (AROP) indicator corresponds to
the sum of persons who are at least in one of the situations:
at risk of poverty or severely materially deprived or living in
households with very low work intensity. The S80/S20 income quintile ratio measures the ratio of total
income received by the 20 % of the population with the
highest income to that received by the 20 % of the
population with the lowest income.
Source: Authors' estimates based on Eurostat data.
I.3.4. Cyclical convergence
Business cycles: large differences in amplitude
As explained in the previous section, business cycle convergence is another important dimension of convergence for the euro area. It is relevant for the well-functioning of EMU, in that it makes the conduct of the common monetary policy smooth. (24) Both the cycle synchronisation and its amplitude are relevant in this respect.
(24) Here the business cycle is measured by the output gap, i.e. the
deviation of GDP from its potential. Estimates of potential output at national frequency are taken from the AMECO database. At quarterly frequency they have been estimated applying a Hodrick-Prescott filter to the seasonally adjusted GDP at constant prices.
16 | Quarterly Report on the Euro Area
Graph I.8: S80/S20 income quintile ratio:
2005 ratio and change
BE
DE
EE
IE
EL
ES
FR
IT
CY
LV
LT
LU
MT
NL
AT
PT
SI
SK
FI
-0.07
-0.06
-0.05
-0.04
-0.03
-0.02
-0.01
0
0.01
0.02
0.03
0.04
0 0.1 0.2 0.3 0.4
Ch
nag
e i
n S
80
/S
20
in
co
me q
uin
tile
rati
o 2
00
5-1
5
S80/S20 income quintile ratio 2005
Source: Authors' estimates based on Eurostat data.
The data show that the dispersion of output gaps across euro area Member States was smaller over the period 1999-2005 than over 2006-13 when it was on a rising trend, while it started decreasing again as of 2014 (Graph I.9). The standard deviation of the output gap has nonetheless drawbacks as a measure of the business cycle as it decreases when business cycles are more in line with each other but also when their amplitude decreases. Results for this metric should therefore be interpreted with caution. (25)
In terms of concordance (the proportion of time the cycles of two countries are in the same phase, below or above potential), the business cycles in Belgium, Spain and France showed the strongest concordance (i.e. highest synchronization) with the euro area business cycle (with about 95% of the time spent in the same phase of the cycle as the euro area over the entire period considered). (26) On the opposite side, the business cycle in the Baltic States showed the weakest concordance (with only about 55% of the time in the same phase) (Graph I.10). Overall, the indicator shows that synchronization is high for the majority of euro area countries, with as many as 11 Member States at values close or above 80%.
(25) See European Commission (2006), 'Cyclical synchronisation
within the euro area: what do recent data tell us?', Quarterly Report on the Euro Area, Vol. 5, No 2, pp.19-24.
(26) The value of the indicator varies between 0 (i.e. the case where the cycles are always in the opposite phase) to 1 (i.e. the case where the cycles are always in the same phase). See McDermot and Scott (1999), 'Concordance in business cycles', Reserve Bank of New Zealand.
Graph I.9: Dispersion of output gaps in the
EA (standard deviation), 1999-2016 With
thi
0
0.5
1
1.5
2
2.5
3
3.5
4
1999
2000
2001
2002
2003
2004
2005
2006
2007
2008
2009
2010
2011
2012
2013
2014
2015
2016
%
Actual Trend
(1) Output gap measures the gap between actual and potential gross domestic product at 2010 reference levels;
standard deviation of output gap based on un-weighted
average.
Source: Authors' estimation based on AMECO.
Graph I.10: Concordance between national
and EA output gap, 1998-2016
0
0.2
0.4
0.6
0.8
1
BE ES FR IT LU EL SI CY NL PT FI DE IE AT MT SK EE LV LT
(1) Concordance indicator measures the proportion of time the cycle of a MS is in the same phase as the cycle of the EA.
Indicator values range from 0 (always in opposite phase) to 1
(always in same phase).
Source: Authors' estimation based on AMECO data.
Where business cycles appear to have differed significantly, since the late 90s, is instead in terms of amplitude. Very strong differences have been recorded in business cycle amplitudes between Member States(27) with Greece experiencing by far
(27) The degree of alignment in cycle amplitudes is estimated by
regressing the national output gap on the EA output gap (and a constant), following a similar method applied in De Grauwe and Ji (2016), 'International Correlation of Business Cycles in a Behavioural Macroeconomic Model'”, CEPR Discussion Paper No. 11257.
I. Sustainable convergence in the euro area: A multi-dimensional process
Volume 16 No 3 | 17
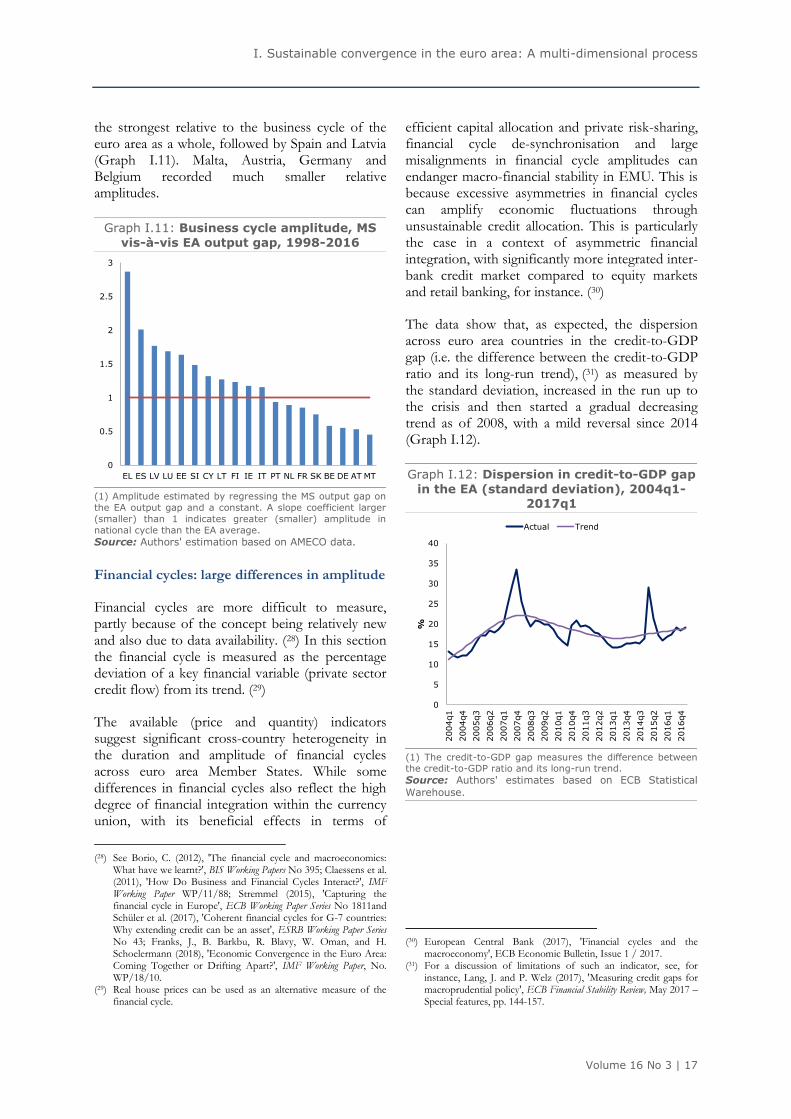
the strongest relative to the business cycle of the euro area as a whole, followed by Spain and Latvia (Graph I.11). Malta, Austria, Germany and Belgium recorded much smaller relative amplitudes.
Graph I.11: Business cycle amplitude, MS
vis-à-vis EA output gap, 1998-2016
0
0.5
1
1.5
2
2.5
3
EL ES LV LU EE SI CY LT FI IE IT PT NL FR SK BE DE AT MT
(1) Amplitude estimated by regressing the MS output gap on
the EA output gap and a constant. A slope coefficient larger
(smaller) than 1 indicates greater (smaller) amplitude in
national cycle than the EA average.
Source: Authors' estimation based on AMECO data.
Financial cycles: large differences in amplitude
Financial cycles are more difficult to measure, partly because of the concept being relatively new and also due to data availability. (28) In this section the financial cycle is measured as the percentage deviation of a key financial variable (private sector credit flow) from its trend. (29)
The available (price and quantity) indicators suggest significant cross-country heterogeneity in the duration and amplitude of financial cycles across euro area Member States. While some differences in financial cycles also reflect the high degree of financial integration within the currency union, with its beneficial effects in terms of
(28) See Borio, C. (2012), 'The financial cycle and macroeconomics:
What have we learnt?', BIS Working Papers No 395; Claessens et al. (2011), 'How Do Business and Financial Cycles Interact?', IMF Working Paper WP/11/88; Stremmel (2015), 'Capturing the financial cycle in Europe', ECB Working Paper Series No 1811and Schüler et al. (2017), 'Coherent financial cycles for G-7 countries: Why extending credit can be an asset', ESRB Working Paper Series No 43; Franks, J., B. Barkbu, R. Blavy, W. Oman, and H. Schoelermann (2018), 'Economic Convergence in the Euro Area: Coming Together or Drifting Apart?', IMF Working Paper, No. WP/18/10.
(29) Real house prices can be used as an alternative measure of the financial cycle.
efficient capital allocation and private risk-sharing, financial cycle de-synchronisation and large misalignments in financial cycle amplitudes can endanger macro-financial stability in EMU. This is because excessive asymmetries in financial cycles can amplify economic fluctuations through unsustainable credit allocation. This is particularly the case in a context of asymmetric financial integration, with significantly more integrated inter-bank credit market compared to equity markets and retail banking, for instance. (30)
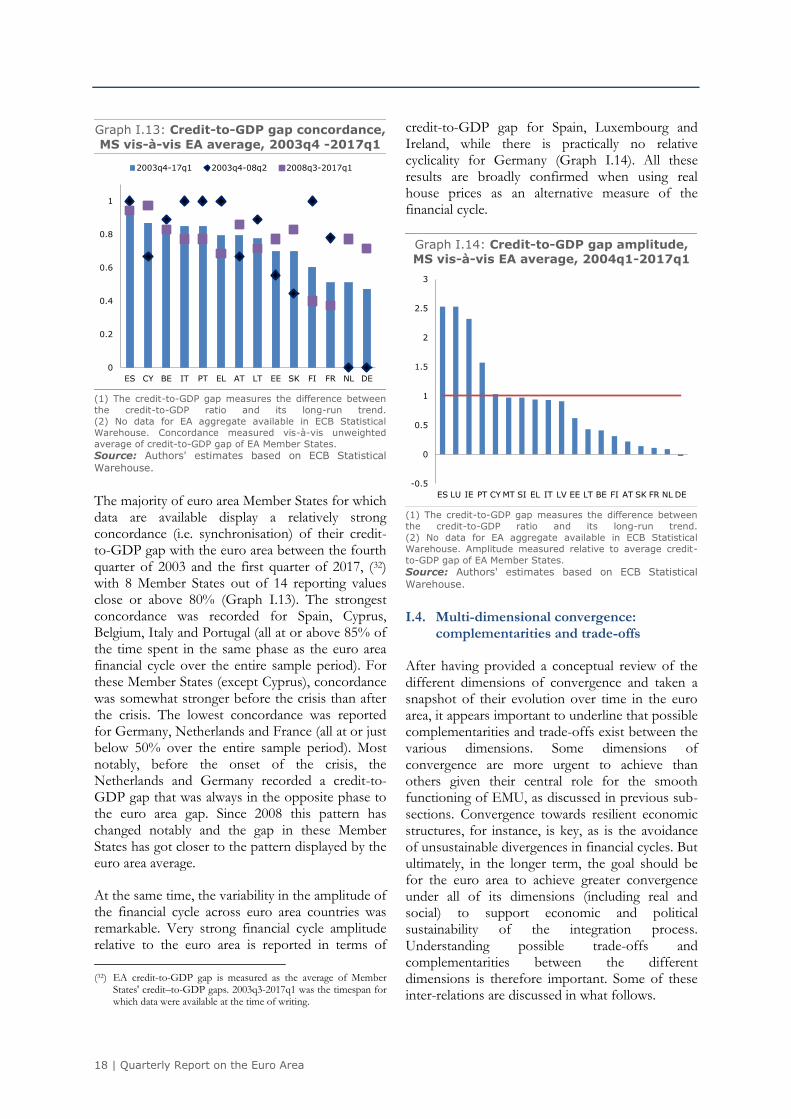
The data show that, as expected, the dispersion across euro area countries in the credit-to-GDP gap (i.e. the difference between the credit-to-GDP ratio and its long-run trend), (31) as measured by the standard deviation, increased in the run up to the crisis and then started a gradual decreasing trend as of 2008, with a mild reversal since 2014 (Graph I.12).
Graph I.12: Dispersion in credit-to-GDP gap
in the EA (standard deviation), 2004q1-2017q1
0
5
10
15
20
25
30
35
40
2004q1
2004q4
2005q3
2006q2
2007q1
2007q4
2008q3
2009q2
2010q1
2010q4
2011q3
2012q2
2013q1
2013q4
2014q3
2015q2
2016q1
2016q4
%
Actual Trend
(1) The credit-to-GDP gap measures the difference between the credit-to-GDP ratio and its long-run trend.
Source: Authors' estimates based on ECB Statistical
Warehouse.
(30) European Central Bank (2017), 'Financial cycles and the
macroeconomy', ECB Economic Bulletin, Issue 1 / 2017. (31) For a discussion of limitations of such an indicator, see, for
instance, Lang, J. and P. Welz (2017), 'Measuring credit gaps for macroprudential policy', ECB Financial Stability Review, May 2017 – Special features, pp. 144-157.
18 | Quarterly Report on the Euro Area
Graph I.13: Credit-to-GDP gap concordance,
MS vis-à-vis EA average, 2003q4 -2017q1
0
0.2
0.4
0.6
0.8
1
ES CY BE IT PT EL AT LT EE SK FI FR NL DE
2003q4-17q1 2003q4-08q2 2008q3-2017q1
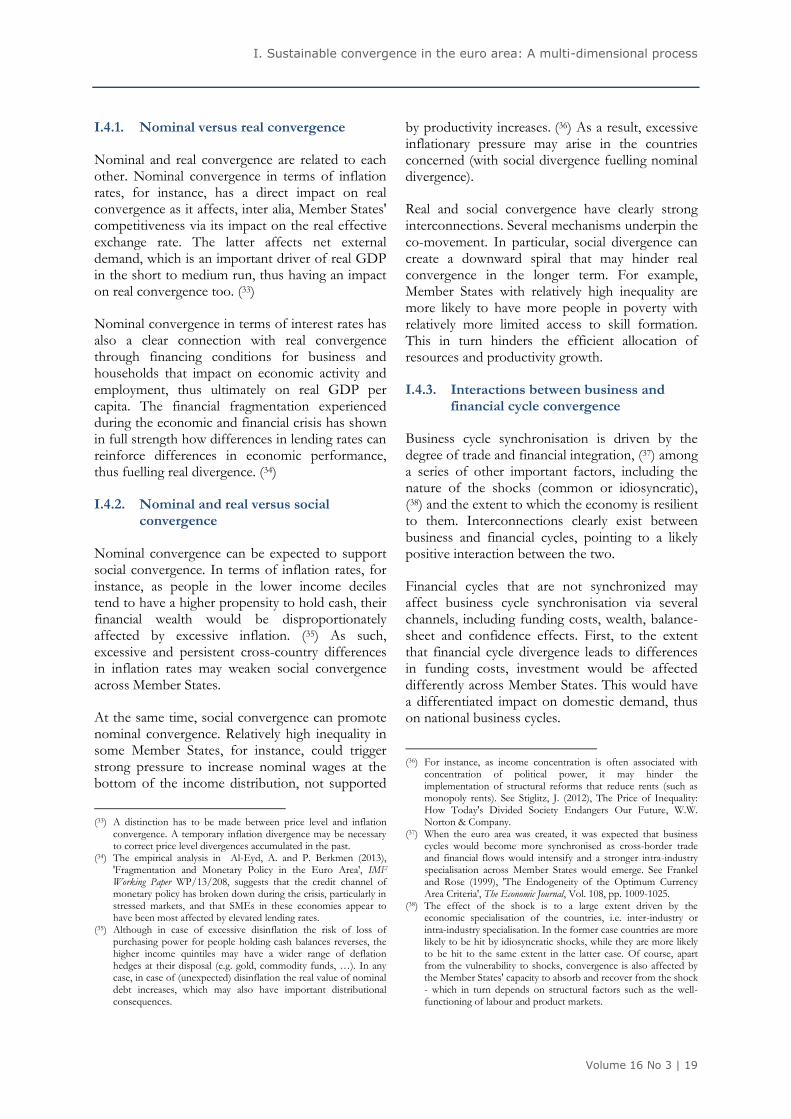
(1) The credit-to-GDP gap measures the difference between
the credit-to-GDP ratio and its long-run trend.
(2) No data for EA aggregate available in ECB Statistical
Warehouse. Concordance measured vis-à-vis unweighted
average of credit-to-GDP gap of EA Member States.
Source: Authors' estimates based on ECB Statistical
Warehouse.
The majority of euro area Member States for which data are available display a relatively strong concordance (i.e. synchronisation) of their credit-to-GDP gap with the euro area between the fourth quarter of 2003 and the first quarter of 2017, (32) with 8 Member States out of 14 reporting values close or above 80% (Graph I.13). The strongest concordance was recorded for Spain, Cyprus, Belgium, Italy and Portugal (all at or above 85% of the time spent in the same phase as the euro area financial cycle over the entire sample period). For these Member States (except Cyprus), concordance was somewhat stronger before the crisis than after the crisis. The lowest concordance was reported for Germany, Netherlands and France (all at or just below 50% over the entire sample period). Most notably, before the onset of the crisis, the Netherlands and Germany recorded a credit-to-GDP gap that was always in the opposite phase to the euro area gap. Since 2008 this pattern has changed notably and the gap in these Member States has got closer to the pattern displayed by the euro area average.
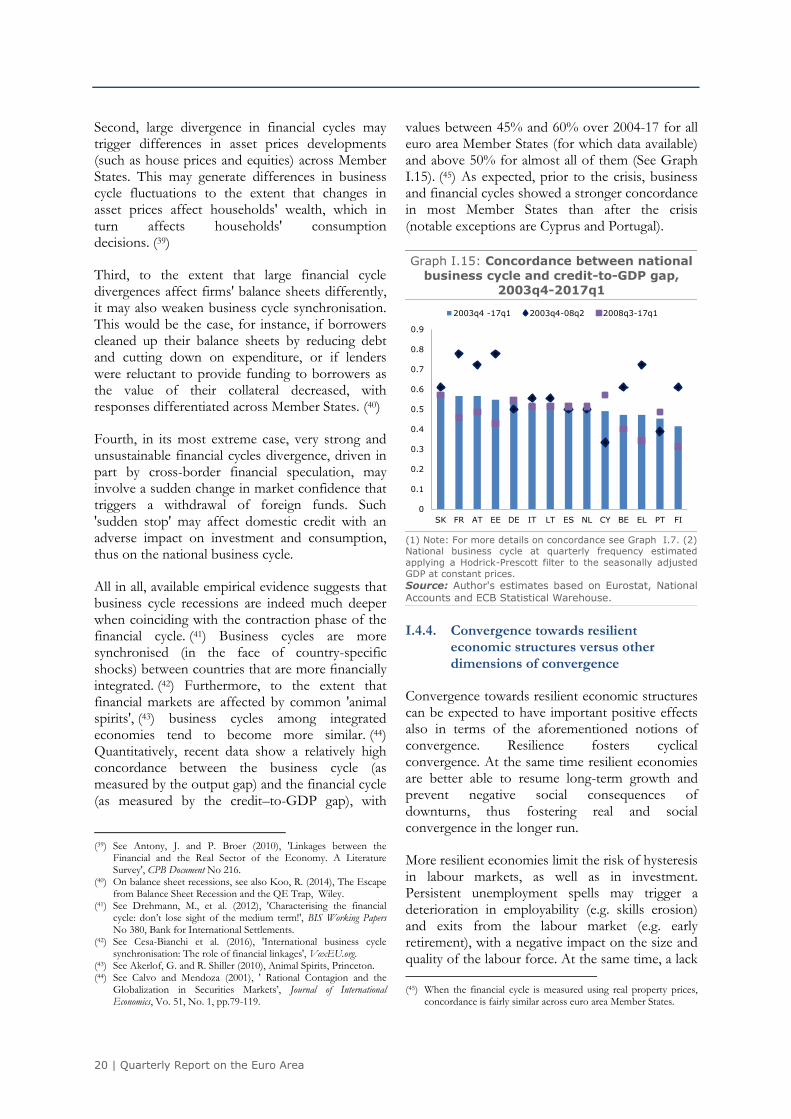
At the same time, the variability in the amplitude of the financial cycle across euro area countries was remarkable. Very strong financial cycle amplitude relative to the euro area is reported in terms of
(32) EA credit-to-GDP gap is measured as the average of Member
States' credit–to-GDP gaps. 2003q3-2017q1 was the timespan for which data were available at the time of writing.
credit-to-GDP gap for Spain, Luxembourg and Ireland, while there is practically no relative cyclicality for Germany (Graph I.14). All these results are broadly confirmed when using real house prices as an alternative measure of the financial cycle.
Graph I.14: Credit-to-GDP gap amplitude, MS vis-à-vis EA average, 2004q1-2017q1
-0.5
0
0.5
1
1.5
2
2.5
3
ES LU IE PT CY MT SI EL IT LV EE LT BE FI AT SK FR NL DE
(1) The credit-to-GDP gap measures the difference between
the credit-to-GDP ratio and its long-run trend.
(2) No data for EA aggregate available in ECB Statistical
Warehouse. Amplitude measured relative to average credit-
to-GDP gap of EA Member States.
Source: Authors' estimates based on ECB Statistical
Warehouse.
I.4. Multi-dimensional convergence: complementarities and trade-offs
After having provided a conceptual review of the different dimensions of convergence and taken a snapshot of their evolution over time in the euro area, it appears important to underline that possible complementarities and trade-offs exist between the various dimensions. Some dimensions of convergence are more urgent to achieve than others given their central role for the smooth functioning of EMU, as discussed in previous sub-sections. Convergence towards resilient economic structures, for instance, is key, as is the avoidance of unsustainable divergences in financial cycles. But ultimately, in the longer term, the goal should be for the euro area to achieve greater convergence under all of its dimensions (including real and social) to support economic and political sustainability of the integration process. Understanding possible trade-offs and complementarities between the different dimensions is therefore important. Some of these inter-relations are discussed in what follows.
I. Sustainable convergence in the euro area: A multi-dimensional process
Volume 16 No 3 | 19
I.4.1. Nominal versus real convergence
Nominal and real convergence are related to each other. Nominal convergence in terms of inflation rates, for instance, has a direct impact on real convergence as it affects, inter alia, Member States' competitiveness via its impact on the real effective exchange rate. The latter affects net external demand, which is an important driver of real GDP in the short to medium run, thus having an impact on real convergence too. (33)
Nominal convergence in terms of interest rates has also a clear connection with real convergence through financing conditions for business and households that impact on economic activity and employment, thus ultimately on real GDP per capita. The financial fragmentation experienced during the economic and financial crisis has shown in full strength how differences in lending rates can reinforce differences in economic performance, thus fuelling real divergence. (34)
I.4.2. Nominal and real versus social convergence
Nominal convergence can be expected to support social convergence. In terms of inflation rates, for instance, as people in the lower income deciles tend to have a higher propensity to hold cash, their financial wealth would be disproportionately affected by excessive inflation. (35) As such, excessive and persistent cross-country differences in inflation rates may weaken social convergence across Member States.
At the same time, social convergence can promote nominal convergence. Relatively high inequality in some Member States, for instance, could trigger strong pressure to increase nominal wages at the bottom of the income distribution, not supported
(33) A distinction has to be made between price level and inflation
convergence. A temporary inflation divergence may be necessary to correct price level divergences accumulated in the past.
(34) The empirical analysis in Al-Eyd, A. and P. Berkmen (2013), 'Fragmentation and Monetary Policy in the Euro Area', IMF Working Paper WP/13/208, suggests that the credit channel of monetary policy has broken down during the crisis, particularly in stressed markets, and that SMEs in these economies appear to have been most affected by elevated lending rates.
(35) Although in case of excessive disinflation the risk of loss of purchasing power for people holding cash balances reverses, the higher income quintiles may have a wider range of deflation hedges at their disposal (e.g. gold, commodity funds, …). In any case, in case of (unexpected) disinflation the real value of nominal debt increases, which may also have important distributional consequences.
by productivity increases. (36) As a result, excessive inflationary pressure may arise in the countries concerned (with social divergence fuelling nominal divergence).
Real and social convergence have clearly strong interconnections. Several mechanisms underpin the co-movement. In particular, social divergence can create a downward spiral that may hinder real convergence in the longer term. For example, Member States with relatively high inequality are more likely to have more people in poverty with relatively more limited access to skill formation. This in turn hinders the efficient allocation of resources and productivity growth.
I.4.3. Interactions between business and financial cycle convergence
Business cycle synchronisation is driven by the degree of trade and financial integration, (37) among a series of other important factors, including the nature of the shocks (common or idiosyncratic), (38) and the extent to which the economy is resilient to them. Interconnections clearly exist between business and financial cycles, pointing to a likely positive interaction between the two.
Financial cycles that are not synchronized may affect business cycle synchronisation via several channels, including funding costs, wealth, balance-sheet and confidence effects. First, to the extent that financial cycle divergence leads to differences in funding costs, investment would be affected differently across Member States. This would have a differentiated impact on domestic demand, thus on national business cycles.
(36) For instance, as income concentration is often associated with
concentration of political power, it may hinder the implementation of structural reforms that reduce rents (such as monopoly rents). See Stiglitz, J. (2012), The Price of Inequality: How Today's Divided Society Endangers Our Future, W.W. Norton & Company.
(37) When the euro area was created, it was expected that business cycles would become more synchronised as cross-border trade and financial flows would intensify and a stronger intra-industry specialisation across Member States would emerge. See Frankel and Rose (1999), 'The Endogeneity of the Optimum Currency Area Criteria', The Economic Journal, Vol. 108, pp. 1009-1025.
(38) The effect of the shock is to a large extent driven by the economic specialisation of the countries, i.e. inter-industry or intra-industry specialisation. In the former case countries are more likely to be hit by idiosyncratic shocks, while they are more likely to be hit to the same extent in the latter case. Of course, apart from the vulnerability to shocks, convergence is also affected by the Member States' capacity to absorb and recover from the shock - which in turn depends on structural factors such as the well-functioning of labour and product markets.
20 | Quarterly Report on the Euro Area
Second, large divergence in financial cycles may trigger differences in asset prices developments (such as house prices and equities) across Member States. This may generate differences in business cycle fluctuations to the extent that changes in asset prices affect households' wealth, which in turn affects households' consumption decisions. (39)
Third, to the extent that large financial cycle divergences affect firms' balance sheets differently, it may also weaken business cycle synchronisation. This would be the case, for instance, if borrowers cleaned up their balance sheets by reducing debt and cutting down on expenditure, or if lenders were reluctant to provide funding to borrowers as the value of their collateral decreased, with responses differentiated across Member States. (40)
Fourth, in its most extreme case, very strong and unsustainable financial cycles divergence, driven in part by cross-border financial speculation, may involve a sudden change in market confidence that triggers a withdrawal of foreign funds. Such 'sudden stop' may affect domestic credit with an adverse impact on investment and consumption, thus on the national business cycle.
All in all, available empirical evidence suggests that business cycle recessions are indeed much deeper when coinciding with the contraction phase of the financial cycle. (41) Business cycles are more synchronised (in the face of country-specific shocks) between countries that are more financially integrated. (42) Furthermore, to the extent that financial markets are affected by common 'animal spirits', (43) business cycles among integrated economies tend to become more similar. (44) Quantitatively, recent data show a relatively high concordance between the business cycle (as measured by the output gap) and the financial cycle (as measured by the credit–to-GDP gap), with
(39) See Antony, J. and P. Broer (2010), 'Linkages between the
Financial and the Real Sector of the Economy. A Literature Survey', CPB Document No 216.
(40) On balance sheet recessions, see also Koo, R. (2014), The Escape from Balance Sheet Recession and the QE Trap, Wiley.
(41) See Drehmann, M., et al. (2012), 'Characterising the financial cycle: don’t lose sight of the medium term!', BIS Working Papers No 380, Bank for International Settlements.
(42) See Cesa-Bianchi et al. (2016), 'International business cycle synchronisation: The role of financial linkages', VoxEU.org.
(43) See Akerlof, G. and R. Shiller (2010), Animal Spirits, Princeton. (44) See Calvo and Mendoza (2001), ' Rational Contagion and the
Globalization in Securities Markets’, Journal of International Economics, Vo. 51, No. 1, pp.79-119.
values between 45% and 60% over 2004-17 for all euro area Member States (for which data available) and above 50% for almost all of them (See Graph I.15). (45) As expected, prior to the crisis, business and financial cycles showed a stronger concordance in most Member States than after the crisis (notable exceptions are Cyprus and Portugal).
Graph I.15: Concordance between national
business cycle and credit-to-GDP gap, 2003q4-2017q1
0
0.1
0.2
0.3
0.4
0.5
0.6
0.7
0.8
0.9
SK FR AT EE DE IT LT ES NL CY BE EL PT FI
2003q4 -17q1 2003q4-08q2 2008q3-17q1
(1) Note: For more details on concordance see Graph I.7. (2) National business cycle at quarterly frequency estimated
applying a Hodrick-Prescott filter to the seasonally adjusted
GDP at constant prices.
Source: Author's estimates based on Eurostat, National
Accounts and ECB Statistical Warehouse.
I.4.4. Convergence towards resilient economic structures versus other dimensions of convergence
Convergence towards resilient economic structures can be expected to have important positive effects also in terms of the aforementioned notions of convergence. Resilience fosters cyclical convergence. At the same time resilient economies are better able to resume long-term growth and prevent negative social consequences of downturns, thus fostering real and social convergence in the longer run.
More resilient economies limit the risk of hysteresis in labour markets, as well as in investment. Persistent unemployment spells may trigger a deterioration in employability (e.g. skills erosion) and exits from the labour market (e.g. early retirement), with a negative impact on the size and quality of the labour force. At the same time, a lack (45) When the financial cycle is measured using real property prices,
concordance is fairly similar across euro area Member States.
I. Sustainable convergence in the euro area: A multi-dimensional process
Volume 16 No 3 | 21
of investment embedding the latest innovations and technological advances and an under-use of existing capital may reduce the size and quality of the capital stock. When hysteresis risks materialize, less resilient economies can be expected to fare relatively worse under other dimensions of convergence, from real to social. In this sense, convergence towards resilient economic structures can foster these other dimensions of convergence.
Less resilient economies also risk recording stronger deviations from the inflation reference value as persistently negative output gaps can trigger stronger deflationary pressures, thereby weakening nominal convergence. (46) At the same time, this lower inflation (or even deflation) in less resilient economies may then trigger a rise in real interest rates, which could have an adverse impact on other dimensions of convergence (real, for instance). (47)
Finally, stronger resilience might promote convergence under other dimensions by strengthening the effectiveness of the common monetary policy.
I.5. Conclusions and policy implications
Divergences across EA Member States generated by the recent economic and financial crisis, particularly in the EA12, have brought the issue of sustainable convergence to the forefront of the policy debate, also in relation to the institutional reforms to complete EMU. (48)
As explained in this section, sustainable convergence should be looked at as a multi-dimensional process, whereby nominal, real, social, cyclical convergence and convergence towards resilient economic structures are all different but relevant dimensions. All these dimensions together concur to determining the longer-term sustainability of EMU, in socio-economic, financial and political terms. Some of these dimensions (convergence towards resilient economic structures
(46) Depending on where these Member States are in term of inflation
rates. (47) Nevertheless, the domestic deflationary pressures may increase
international price competitiveness which may boost external demand. It is an empirical matter to determine which of the two effects will dominate.
(48) See European Commission (2017), 'Reflection paper on the deepening of the economic and monetary union', 31 May 2017; Juncker, J.C., in cooperation with D. Tusk, J. Dijsselbloem, M. Draghi and M. Schulz (2015), 'Completing Europe's Economic and Monetary Union', 22 June 2015.
and the avoidance of large unsustainable differences in financial cycles) are necessary – though - not sufficient conditions for sustainable real convergence. They therefore require appropriate policy action as a matter of priority. However, at the same time, conceiving convergence as a multi-dimensional process importantly means also internalising in policy design possible trade-offs with other dimensions of convergence where appropriate. (49)
The analysis presented here of the possible interactions between the different dimensions of convergence hints at the complexity of the matter. It is generally not possible to expect an unambiguous relationship between the various dimensions of convergence. Focussing exclusively on one or some specific dimensions to achieve sustainable convergence overall would therefore be misguided. Possible complementarities and trade-offs should rather be factored in, and eventually the latter corrected for. For example, ensuring that social convergence goes along with other dimensions of convergence that might be more directly pursued by the authorities requires giving due consideration to the social impact of policy measures and reforms on a regular basis.
Interconnections are present also between business and financial cycles, and should be accounted for in policy design. In particular, the amplifying effects on economic fluctuations that large differences in financial cycles can generate have been laid bare by the recent crisis. Avoiding large unsustainable financial cycle divergences appears important to guarantee macro-financial stability in the institutional set up of the EMU. In this sense, strengthening macro-prudential policies in EMU, completing the Banking Union with the European Deposit Insurance Scheme (EDIS) and the common backstop to the Single Resolution Fund (SRF), and making significant progress on the Capital Markets Union would all importantly contribute to preventing the building up of unsustainable asymmetries in financial cycles.
Convergence towards resilient economic structures is also pivotal to support a well-functioning EMU by reducing the economies' exposure to shocks, raising their shock-absorption capacity and strengthening their ability to recover quickly after a shock.
(49) This might call for appropriate flanking measures.
22 | Quarterly Report on the Euro Area
The economy's capacity to cushion the effects of a shock is influenced by the degree of risk-sharing through financial markets. In this respect a well-capitalised banking sector and measures to create a Capital Markets Union are key to economic resilience. At the same time, both properly functioning labour market institutions that respond to cyclical conditions (including flexible working time arrangements and flexible wage setting mechanisms) and competitive product markets support adjustment in response to shocks. Finally, governments too support shock absorption capacity through automatic adjustments in spending and revenues related to cyclical developments, like automatic changes in tax revenues and spending on unemployment benefits.
The recovery phase of economic resilience is helped by mechanisms that support the swift reallocation of resources following the shock. Product market institutions that foster competition and provide a business-friendly environment are important to foster reallocation during the
recovery. At the same time, an efficient judicial system supports business dynamics by facilitating contract enforcements and via effective insolvency frameworks.
Labour market institutions that support a smooth transition of workers towards new opportunities also support the recovery and reduce the risk of labour market duality. To this aim, flexible employment protection legislation needs to go hand in hand with an adequate social safety net and active labour market policies to support the taking up of new opportunities in more productive activities. Education and training further support such reallocation.
Finally, well-functioning financial markets also support the recovery by ensuring that financing is available for the most productive and financially viable firms in the reallocation process. Developed equity markets and availability of venture capital may, for instance, support the funding and facilitate the growth of dynamic firms.
I. Sustainable convergence in the euro area: A multi-dimensional process
Volume 16 No 3 | 23
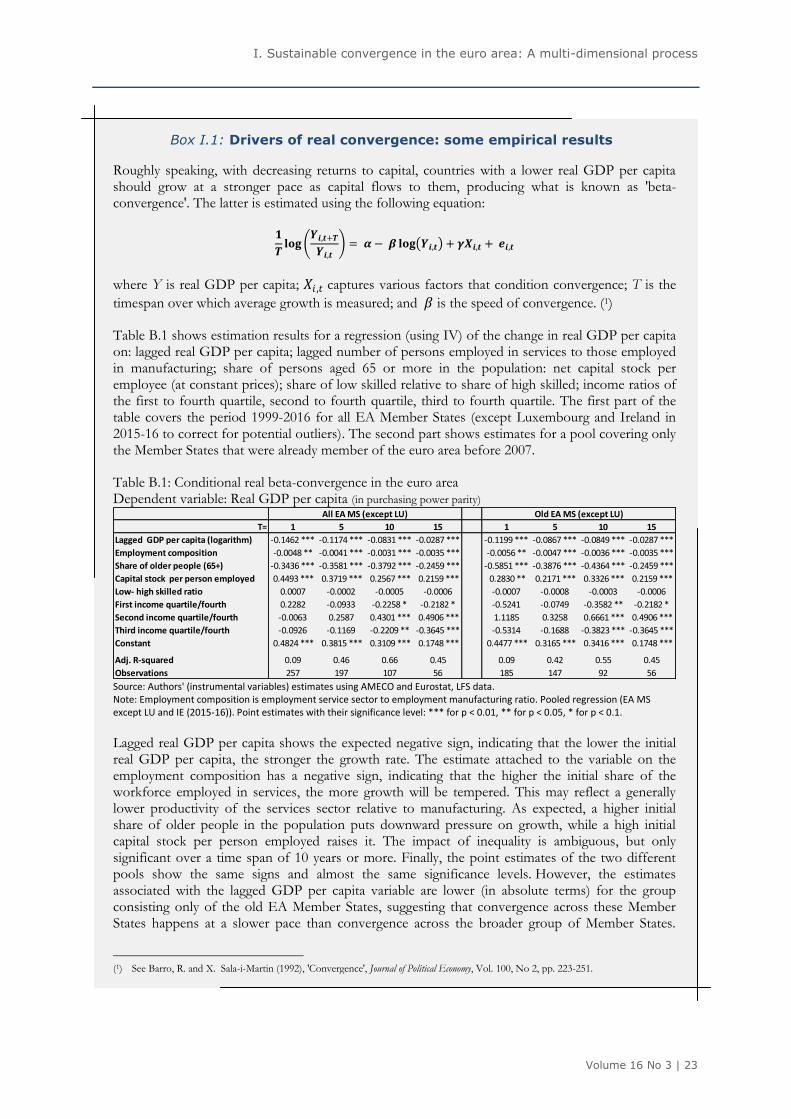
Box I.1: Drivers of real convergence: some empirical results
Roughly speaking, with decreasing returns to capital, countries with a lower real GDP per capita should grow at a stronger pace as capital flows to them, producing what is known as 'beta-convergence'. The latter is estimated using the following equation:
𝟏
𝑻𝐥𝐨𝐠 �
𝒀𝒊,𝒕+𝑻
𝒀𝒊,𝒕 = 𝜶− 𝜷 𝐥𝐨𝐠 𝒀𝒊,𝒕 + 𝜸𝑿𝒊,𝒕 + 𝒆𝒊,𝒕
where Y is real GDP per capita; 𝑋𝑖 ,𝑡 captures various factors that condition convergence; T is the
timespan over which average growth is measured; and 𝛽 is the speed of convergence. (1)
Table B.1 shows estimation results for a regression (using IV) of the change in real GDP per capita on: lagged real GDP per capita; lagged number of persons employed in services to those employed in manufacturing; share of persons aged 65 or more in the population: net capital stock per employee (at constant prices); share of low skilled relative to share of high skilled; income ratios of the first to fourth quartile, second to fourth quartile, third to fourth quartile. The first part of the table covers the period 1999-2016 for all EA Member States (except Luxembourg and Ireland in 2015-16 to correct for potential outliers). The second part shows estimates for a pool covering only the Member States that were already member of the euro area before 2007.
Table B.1: Conditional real beta-convergence in the euro area Dependent variable: Real GDP per capita (in purchasing power parity)
Source: Authors' (instrumental variables) estimates using AMECO and Eurostat, LFS data. Note: Employment composition is employment service sector to employment manufacturing ratio. Pooled regression (EA MS except LU and IE (2015-16)). Point estimates with their significance level: *** for p < 0.01, ** for p < 0.05, * for p < 0.1.
Lagged real GDP per capita shows the expected negative sign, indicating that the lower the initial real GDP per capita, the stronger the growth rate. The estimate attached to the variable on the employment composition has a negative sign, indicating that the higher the initial share of the workforce employed in services, the more growth will be tempered. This may reflect a generally lower productivity of the services sector relative to manufacturing. As expected, a higher initial share of older people in the population puts downward pressure on growth, while a high initial capital stock per person employed raises it. The impact of inequality is ambiguous, but only significant over a time span of 10 years or more. Finally, the point estimates of the two different pools show the same signs and almost the same significance levels. However, the estimates associated with the lagged GDP per capita variable are lower (in absolute terms) for the group consisting only of the old EA Member States, suggesting that convergence across these Member States happens at a slower pace than convergence across the broader group of Member States. (1) See Barro, R. and X. Sala-i-Martin (1992), 'Convergence', Journal of Political Economy, Vol. 100, No 2, pp. 223-251.
T= 1 5 10 15 1 5 10 15
Lagged GDP per capita (logarithm) -0.1462 *** -0.1174 *** -0.0831 *** -0.0287 *** -0.1199 *** -0.0867 *** -0.0849 *** -0.0287 ***
Employment composition -0.0048 ** -0.0041 *** -0.0031 *** -0.0035 *** -0.0056 ** -0.0047 *** -0.0036 *** -0.0035 ***
Share of older people (65+) -0.3436 *** -0.3581 *** -0.3792 *** -0.2459 *** -0.5851 *** -0.3876 *** -0.4364 *** -0.2459 ***
Capital stock per person employed 0.4493 *** 0.3719 *** 0.2567 *** 0.2159 *** 0.2830 ** 0.2171 *** 0.3326 *** 0.2159 ***
Low- high skilled ratio 0.0007 -0.0002 -0.0005 -0.0006 -0.0007 -0.0008 -0.0003 -0.0006
First income quartile/fourth 0.2282 -0.0933 -0.2258 * -0.2182 * -0.5241 -0.0749 -0.3582 ** -0.2182 *
Second income quartile/fourth -0.0063 0.2587 0.4301 *** 0.4906 *** 1.1185 0.3258 0.6661 *** 0.4906 ***
Third income quartile/fourth -0.0926 -0.1169 -0.2209 ** -0.3645 *** -0.5314 -0.1688 -0.3823 *** -0.3645 ***
Constant 0.4824 *** 0.3815 *** 0.3109 *** 0.1748 *** 0.4477 *** 0.3165 *** 0.3416 *** 0.1748 ***
Adj. R-squared 0.09 0.46 0.66 0.45 0.09 0.42 0.55 0.45
Observations 257 197 107 56 185 147 92 56
All EA MS (except LU) Old EA MS (except LU)

24 | Quarterly Report on the Euro Area
Related Documents