2156 Hydrophobic analogues of rhodamine B and rhodamine 101: potent fluorescent probes of mitochondria in living C. elegans Laurie F. Mottram 1 , Safiyyah Forbes 1 , Brian D. Ackley 2 and Blake R. Peterson *1 Full Research Paper Open Access Address: 1 Department of Medicinal Chemistry, The University of Kansas, Lawrence, KS 66045, United States and 2 Department of Molecular Biosciences, The University of Kansas, Lawrence, KS 66045, United States Email: Blake R. Peterson * - [email protected] * Corresponding author Keywords: Caenorhabditis elegans; chemical biology; fission; fluorophores; fluorescence; fusion; imaging; in vivo; microscopy; mitochondria; model organisms; organelle; rhodamine; spectroscopy Beilstein J. Org. Chem. 2012, 8, 2156–2165. doi:10.3762/bjoc.8.243 Received: 29 September 2012 Accepted: 09 November 2012 Published: 11 December 2012 This article is part of the Thematic Series "Synthetic probes for the study of biological function". Guest Editor: J. Aube © 2012 Mottram et al; licensee Beilstein-Institut. License and terms: see end of document. Abstract Mitochondria undergo dynamic fusion and fission events that affect the structure and function of these critical energy-producing cellular organelles. Defects in these dynamic processes have been implicated in a wide range of human diseases including ischemia, neurodegeneration, metabolic disease, and cancer. To provide new tools for imaging of mitochondria in vivo, we synthesized novel hydrophobic analogues of the red fluorescent dyes rhodamine B and rhodamine 101 that replace the carboxylate with a methyl group. Compared to the parent compounds, methyl analogues termed HRB and HR101 exhibit slightly red-shifted absorbance and emission spectra (5–9 nm), modest reductions in molar extinction coefficent and quantum yield, and enhanced partitioning into octanol compared with aqueous buffer of 10-fold or more. Comparison of living C. elegans (nematode roundworm) animals treated with the classic fluorescent mitochondrial stains rhodamine 123, rhodamine 6G, and rhodamine B, as well as the structurally related fluorophores rhodamine 101, and basic violet 11, revealed that HRB and HR101 are the most potent mitochondrial probes, enabling imaging of mitochondrial motility, fusion, and fission in the germline and other tissues by confocal laser scanning microscopy after treatment for 2 h at concentrations as low as 100 picomolar. Because transgenes are poorly expressed in the germline of these animals, these small molecules represent superior tools for labeling dynamic mitochondria in this tissue compared with the expres- sion of mitochondria-targeted fluorescent proteins. The high bioavailabilty of these novel fluorescent probes may facilitate the iden- tification of agents and factors that affect diverse aspects of mitochondrial biology in vivo. 2156

Welcome message from author
This document is posted to help you gain knowledge. Please leave a comment to let me know what you think about it! Share it to your friends and learn new things together.
Transcript
2156
Hydrophobic analogues of rhodamine B andrhodamine 101: potent fluorescent probes
of mitochondria in living C. elegansLaurie F. Mottram1, Safiyyah Forbes1, Brian D. Ackley2
and Blake R. Peterson*1
Full Research Paper Open Access
Address:1Department of Medicinal Chemistry, The University of Kansas,Lawrence, KS 66045, United States and 2Department of MolecularBiosciences, The University of Kansas, Lawrence, KS 66045, UnitedStates
Email:Blake R. Peterson* - [email protected]
* Corresponding author
Keywords:Caenorhabditis elegans; chemical biology; fission; fluorophores;fluorescence; fusion; imaging; in vivo; microscopy; mitochondria;model organisms; organelle; rhodamine; spectroscopy
Beilstein J. Org. Chem. 2012, 8, 2156–2165.doi:10.3762/bjoc.8.243
Received: 29 September 2012Accepted: 09 November 2012Published: 11 December 2012
This article is part of the Thematic Series "Synthetic probes for the studyof biological function".
Guest Editor: J. Aube
© 2012 Mottram et al; licensee Beilstein-Institut.License and terms: see end of document.
AbstractMitochondria undergo dynamic fusion and fission events that affect the structure and function of these critical energy-producing
cellular organelles. Defects in these dynamic processes have been implicated in a wide range of human diseases including ischemia,
neurodegeneration, metabolic disease, and cancer. To provide new tools for imaging of mitochondria in vivo, we synthesized novel
hydrophobic analogues of the red fluorescent dyes rhodamine B and rhodamine 101 that replace the carboxylate with a methyl
group. Compared to the parent compounds, methyl analogues termed HRB and HR101 exhibit slightly red-shifted absorbance and
emission spectra (5–9 nm), modest reductions in molar extinction coefficent and quantum yield, and enhanced partitioning into
octanol compared with aqueous buffer of 10-fold or more. Comparison of living C. elegans (nematode roundworm) animals treated
with the classic fluorescent mitochondrial stains rhodamine 123, rhodamine 6G, and rhodamine B, as well as the structurally related
fluorophores rhodamine 101, and basic violet 11, revealed that HRB and HR101 are the most potent mitochondrial probes, enabling
imaging of mitochondrial motility, fusion, and fission in the germline and other tissues by confocal laser scanning microscopy after
treatment for 2 h at concentrations as low as 100 picomolar. Because transgenes are poorly expressed in the germline of these
animals, these small molecules represent superior tools for labeling dynamic mitochondria in this tissue compared with the expres-
sion of mitochondria-targeted fluorescent proteins. The high bioavailabilty of these novel fluorescent probes may facilitate the iden-
tification of agents and factors that affect diverse aspects of mitochondrial biology in vivo.
2156
Beilstein J. Org. Chem. 2012, 8, 2156–2165.
2157
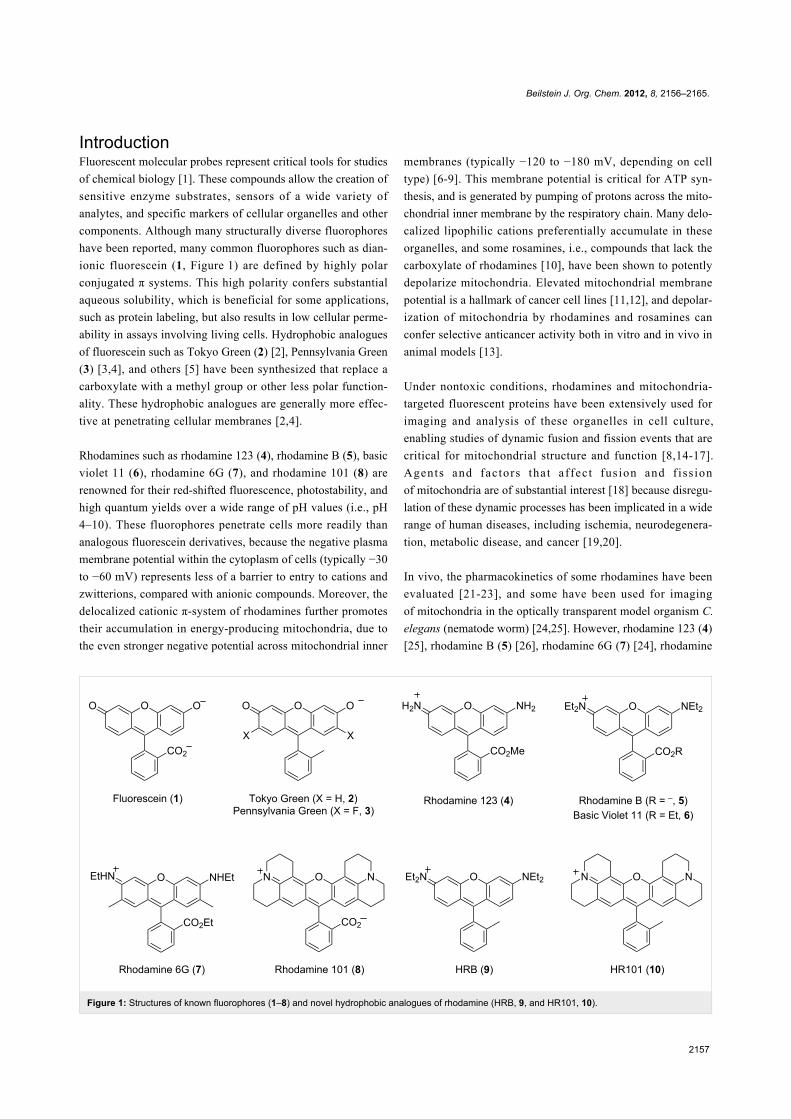
Figure 1: Structures of known fluorophores (1–8) and novel hydrophobic analogues of rhodamine (HRB, 9, and HR101, 10).
IntroductionFluorescent molecular probes represent critical tools for studies
of chemical biology [1]. These compounds allow the creation of
sensitive enzyme substrates, sensors of a wide variety of
analytes, and specific markers of cellular organelles and other
components. Although many structurally diverse fluorophores
have been reported, many common fluorophores such as dian-
ionic fluorescein (1, Figure 1) are defined by highly polar
conjugated π systems. This high polarity confers substantial
aqueous solubility, which is beneficial for some applications,
such as protein labeling, but also results in low cellular perme-
ability in assays involving living cells. Hydrophobic analogues
of fluorescein such as Tokyo Green (2) [2], Pennsylvania Green
(3) [3,4], and others [5] have been synthesized that replace a
carboxylate with a methyl group or other less polar function-
ality. These hydrophobic analogues are generally more effec-
tive at penetrating cellular membranes [2,4].
Rhodamines such as rhodamine 123 (4), rhodamine B (5), basic
violet 11 (6), rhodamine 6G (7), and rhodamine 101 (8) are
renowned for their red-shifted fluorescence, photostability, and
high quantum yields over a wide range of pH values (i.e., pH
4–10). These fluorophores penetrate cells more readily than
analogous fluorescein derivatives, because the negative plasma
membrane potential within the cytoplasm of cells (typically −30
to −60 mV) represents less of a barrier to entry to cations and
zwitterions, compared with anionic compounds. Moreover, the
delocalized cationic π-system of rhodamines further promotes
their accumulation in energy-producing mitochondria, due to
the even stronger negative potential across mitochondrial inner
membranes (typically −120 to −180 mV, depending on cell
type) [6-9]. This membrane potential is critical for ATP syn-
thesis, and is generated by pumping of protons across the mito-
chondrial inner membrane by the respiratory chain. Many delo-
calized lipophilic cations preferentially accumulate in these
organelles, and some rosamines, i.e., compounds that lack the
carboxylate of rhodamines [10], have been shown to potently
depolarize mitochondria. Elevated mitochondrial membrane
potential is a hallmark of cancer cell lines [11,12], and depolar-
ization of mitochondria by rhodamines and rosamines can
confer selective anticancer activity both in vitro and in vivo in
animal models [13].
Under nontoxic conditions, rhodamines and mitochondria-
targeted fluorescent proteins have been extensively used for
imaging and analysis of these organelles in cell culture,
enabling studies of dynamic fusion and fission events that are
critical for mitochondrial structure and function [8,14-17].
Agents and factors that affect fus ion and f iss ion
of mitochondria are of substantial interest [18] because disregu-
lation of these dynamic processes has been implicated in a wide
range of human diseases, including ischemia, neurodegenera-
tion, metabolic disease, and cancer [19,20].
In vivo, the pharmacokinetics of some rhodamines have been
evaluated [21-23], and some have been used for imaging
of mitochondria in the optically transparent model organism C.
elegans (nematode worm) [24,25]. However, rhodamine 123 (4)
[25], rhodamine B (5) [26], rhodamine 6G (7) [24], rhodamine
Beilstein J. Org. Chem. 2012, 8, 2156–2165.
2158
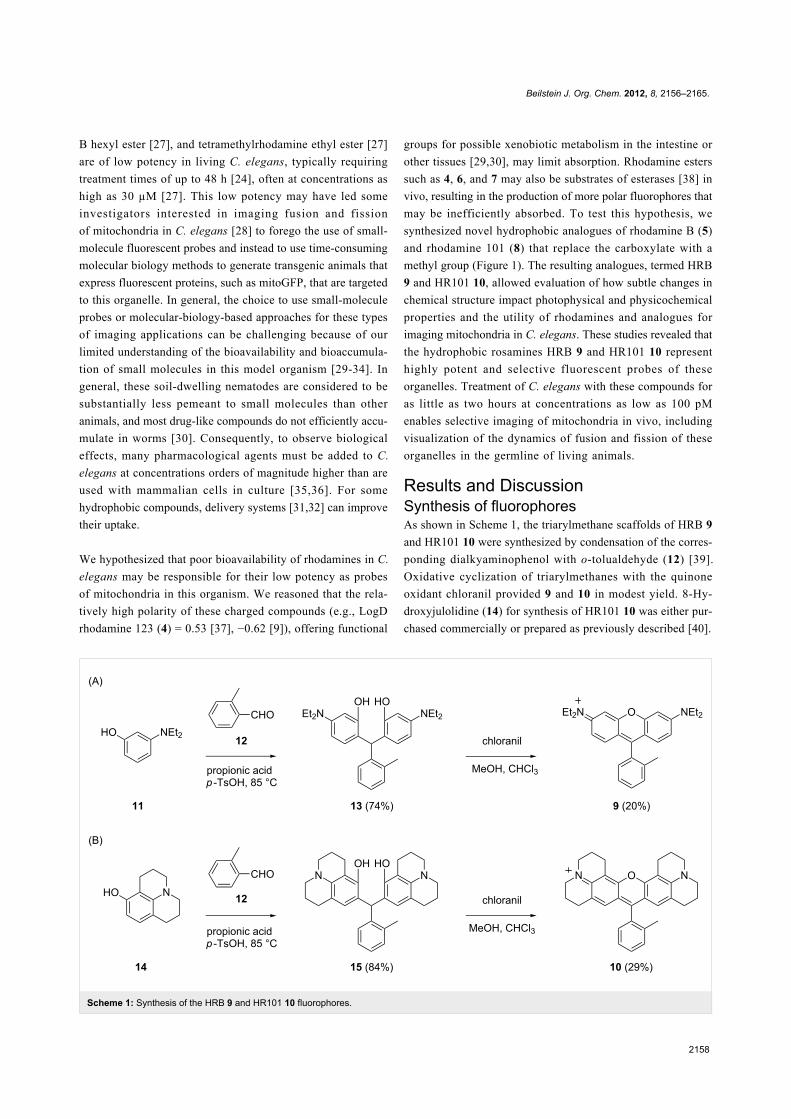
Scheme 1: Synthesis of the HRB 9 and HR101 10 fluorophores.
B hexyl ester [27], and tetramethylrhodamine ethyl ester [27]
are of low potency in living C. elegans, typically requiring
treatment times of up to 48 h [24], often at concentrations as
high as 30 µM [27]. This low potency may have led some
investigators interested in imaging fusion and fission
of mitochondria in C. elegans [28] to forego the use of small-
molecule fluorescent probes and instead to use time-consuming
molecular biology methods to generate transgenic animals that
express fluorescent proteins, such as mitoGFP, that are targeted
to this organelle. In general, the choice to use small-molecule
probes or molecular-biology-based approaches for these types
of imaging applications can be challenging because of our
limited understanding of the bioavailability and bioaccumula-
tion of small molecules in this model organism [29-34]. In
general, these soil-dwelling nematodes are considered to be
substantially less pemeant to small molecules than other
animals, and most drug-like compounds do not efficiently accu-
mulate in worms [30]. Consequently, to observe biological
effects, many pharmacological agents must be added to C.
elegans at concentrations orders of magnitude higher than are
used with mammalian cells in culture [35,36]. For some
hydrophobic compounds, delivery systems [31,32] can improve
their uptake.
We hypothesized that poor bioavailability of rhodamines in C.
elegans may be responsible for their low potency as probes
of mitochondria in this organism. We reasoned that the rela-
tively high polarity of these charged compounds (e.g., LogD
rhodamine 123 (4) = 0.53 [37], −0.62 [9]), offering functional
groups for possible xenobiotic metabolism in the intestine or
other tissues [29,30], may limit absorption. Rhodamine esters
such as 4, 6, and 7 may also be substrates of esterases [38] in
vivo, resulting in the production of more polar fluorophores that
may be inefficiently absorbed. To test this hypothesis, we
synthesized novel hydrophobic analogues of rhodamine B (5)
and rhodamine 101 (8) that replace the carboxylate with a
methyl group (Figure 1). The resulting analogues, termed HRB
9 and HR101 10, allowed evaluation of how subtle changes in
chemical structure impact photophysical and physicochemical
properties and the utility of rhodamines and analogues for
imaging mitochondria in C. elegans. These studies revealed that
the hydrophobic rosamines HRB 9 and HR101 10 represent
highly potent and selective fluorescent probes of these
organelles. Treatment of C. elegans with these compounds for
as little as two hours at concentrations as low as 100 pM
enables selective imaging of mitochondria in vivo, including
visualization of the dynamics of fusion and fission of these
organelles in the germline of living animals.
Results and DiscussionSynthesis of fluorophoresAs shown in Scheme 1, the triarylmethane scaffolds of HRB 9
and HR101 10 were synthesized by condensation of the corres-
ponding dialkyaminophenol with o-tolualdehyde (12) [39].
Oxidative cyclization of triarylmethanes with the quinone
oxidant chloranil provided 9 and 10 in modest yield. 8-Hy-
droxyjulolidine (14) for synthesis of HR101 10 was either pur-
chased commercially or prepared as previously described [40].
Beilstein J. Org. Chem. 2012, 8, 2156–2165.
2159
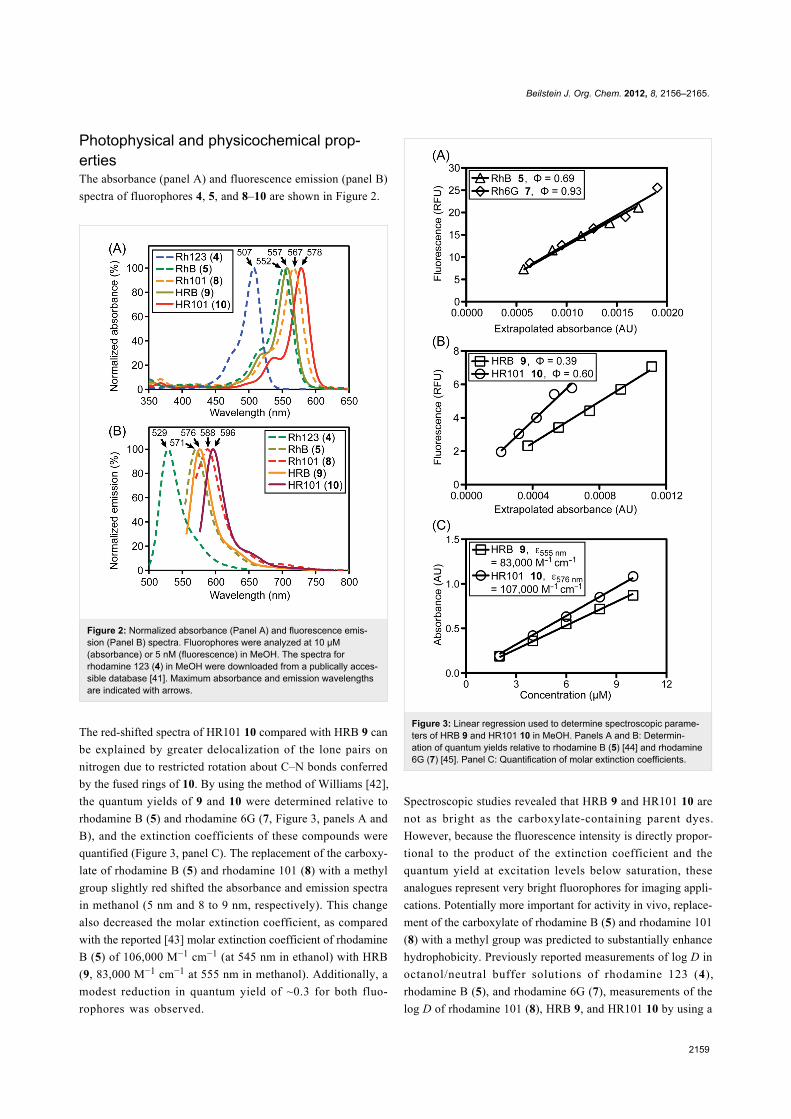
Photophysical and physicochemical prop-ertiesThe absorbance (panel A) and fluorescence emission (panel B)
spectra of fluorophores 4, 5, and 8–10 are shown in Figure 2.
Figure 2: Normalized absorbance (Panel A) and fluorescence emis-sion (Panel B) spectra. Fluorophores were analyzed at 10 µM(absorbance) or 5 nM (fluorescence) in MeOH. The spectra forrhodamine 123 (4) in MeOH were downloaded from a publically acces-sible database [41]. Maximum absorbance and emission wavelengthsare indicated with arrows.
The red-shifted spectra of HR101 10 compared with HRB 9 can
be explained by greater delocalization of the lone pairs on
nitrogen due to restricted rotation about C–N bonds conferred
by the fused rings of 10. By using the method of Williams [42],
the quantum yields of 9 and 10 were determined relative to
rhodamine B (5) and rhodamine 6G (7, Figure 3, panels A and
B), and the extinction coefficients of these compounds were
quantified (Figure 3, panel C). The replacement of the carboxy-
late of rhodamine B (5) and rhodamine 101 (8) with a methyl
group slightly red shifted the absorbance and emission spectra
in methanol (5 nm and 8 to 9 nm, respectively). This change
also decreased the molar extinction coefficient, as compared
with the reported [43] molar extinction coefficient of rhodamine
B (5) of 106,000 M−1 cm−1 (at 545 nm in ethanol) with HRB
(9, 83,000 M−1 cm−1 at 555 nm in methanol). Additionally, a
modest reduction in quantum yield of ~0.3 for both fluo-
rophores was observed.
Figure 3: Linear regression used to determine spectroscopic parame-ters of HRB 9 and HR101 10 in MeOH. Panels A and B: Determin-ation of quantum yields relative to rhodamine B (5) [44] and rhodamine6G (7) [45]. Panel C: Quantification of molar extinction coefficients.
Spectroscopic studies revealed that HRB 9 and HR101 10 are
not as bright as the carboxylate-containing parent dyes.
However, because the fluorescence intensity is directly propor-
tional to the product of the extinction coefficient and the
quantum yield at excitation levels below saturation, these
analogues represent very bright fluorophores for imaging appli-
cations. Potentially more important for activity in vivo, replace-
ment of the carboxylate of rhodamine B (5) and rhodamine 101
(8) with a methyl group was predicted to substantially enhance
hydrophobicity. Previously reported measurements of log D in
octanol/neutral buffer solutions of rhodamine 123 (4),
rhodamine B (5), and rhodamine 6G (7), measurements of the
log D of rhodamine 101 (8), HRB 9, and HR101 10 by using a
Beilstein J. Org. Chem. 2012, 8, 2156–2165.
2160
fluorescence-based shake-flask method, and c·log P values for
compounds 4–10 calculated by using a recent version of
CambridgeSoft ChemBioDraw software, are shown in Table 1.
Although some differences exist between the calculated and
measured values, the relative trends illustrate how structural
modifications of these compounds are likely to affect fluo-
rophore solubility and cellular permeability.
Table 1: Partition constants of fluorophores.
Fluorophore c·log Pa log Doctanol/buffer
Rhodamine 123 (4) 1.5 0.5 [37], −0.6 [9]Rhodamine B (5) −1.1 2.3 [46]Basic Violet 11 (6) 3.7 N.D.b
Rhodamine 6G (7) 6.5 2.1 [37]Rhodamine 101 (8) 3.8 5.2c
HRB 9 3.4 5.9c
HR101 10 8.6 6.2c
aCalculated with ChemBioDraw Ultra, version 12.0.3, from structuresbearing functional groups at ionization states predicted to dominate atpH 7 (as shown in Figure 1). bN.D. Not determined. cDetermined inoctanol/bufferpH 7.4 by using a fluorescence-based shake-flaskmethod.
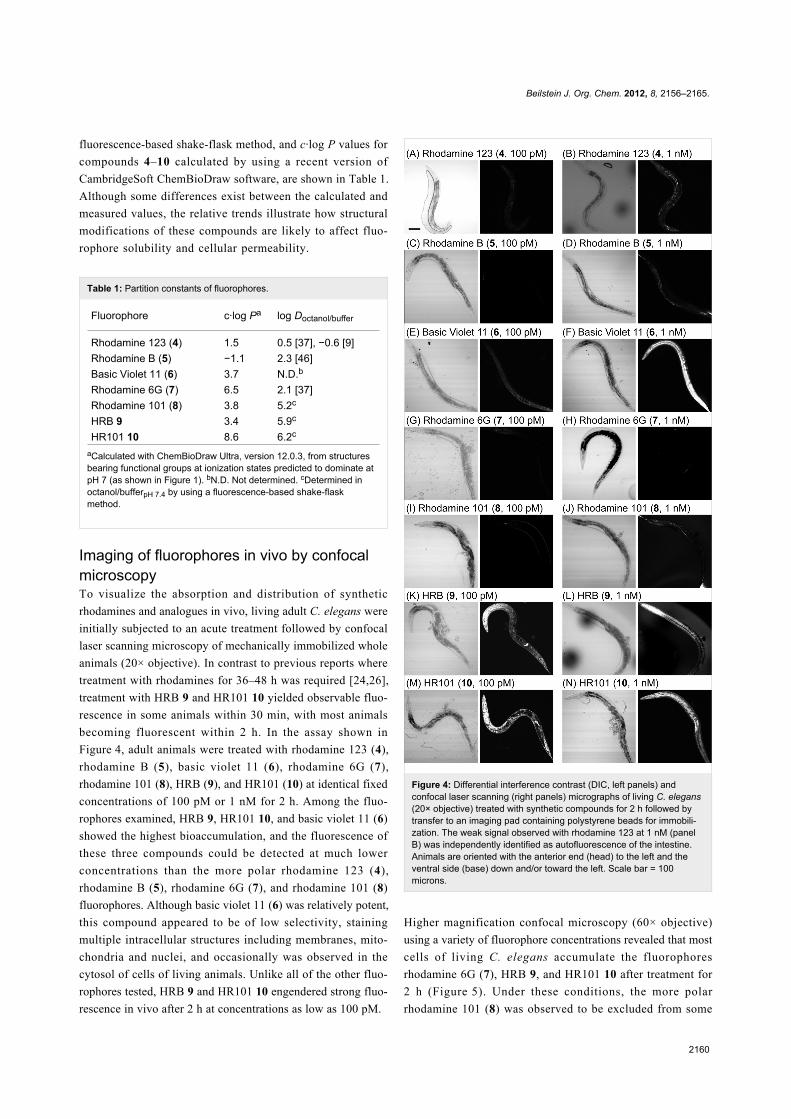
Imaging of fluorophores in vivo by confocalmicroscopyTo visualize the absorption and distribution of synthetic
rhodamines and analogues in vivo, living adult C. elegans were
initially subjected to an acute treatment followed by confocal
laser scanning microscopy of mechanically immobilized whole
animals (20× objective). In contrast to previous reports where
treatment with rhodamines for 36–48 h was required [24,26],
treatment with HRB 9 and HR101 10 yielded observable fluo-
rescence in some animals within 30 min, with most animals
becoming fluorescent within 2 h. In the assay shown in
Figure 4, adult animals were treated with rhodamine 123 (4),
rhodamine B (5), basic violet 11 (6), rhodamine 6G (7),
rhodamine 101 (8), HRB (9), and HR101 (10) at identical fixed
concentrations of 100 pM or 1 nM for 2 h. Among the fluo-
rophores examined, HRB 9, HR101 10, and basic violet 11 (6)
showed the highest bioaccumulation, and the fluorescence of
these three compounds could be detected at much lower
concentrations than the more polar rhodamine 123 (4),
rhodamine B (5), rhodamine 6G (7), and rhodamine 101 (8)
fluorophores. Although basic violet 11 (6) was relatively potent,
this compound appeared to be of low selectivity, staining
multiple intracellular structures including membranes, mito-
chondria and nuclei, and occasionally was observed in the
cytosol of cells of living animals. Unlike all of the other fluo-
rophores tested, HRB 9 and HR101 10 engendered strong fluo-
rescence in vivo after 2 h at concentrations as low as 100 pM.
Figure 4: Differential interference contrast (DIC, left panels) andconfocal laser scanning (right panels) micrographs of living C. elegans(20× objective) treated with synthetic compounds for 2 h followed bytransfer to an imaging pad containing polystyrene beads for immobili-zation. The weak signal observed with rhodamine 123 at 1 nM (panelB) was independently identified as autofluorescence of the intestine.Animals are oriented with the anterior end (head) to the left and theventral side (base) down and/or toward the left. Scale bar = 100microns.
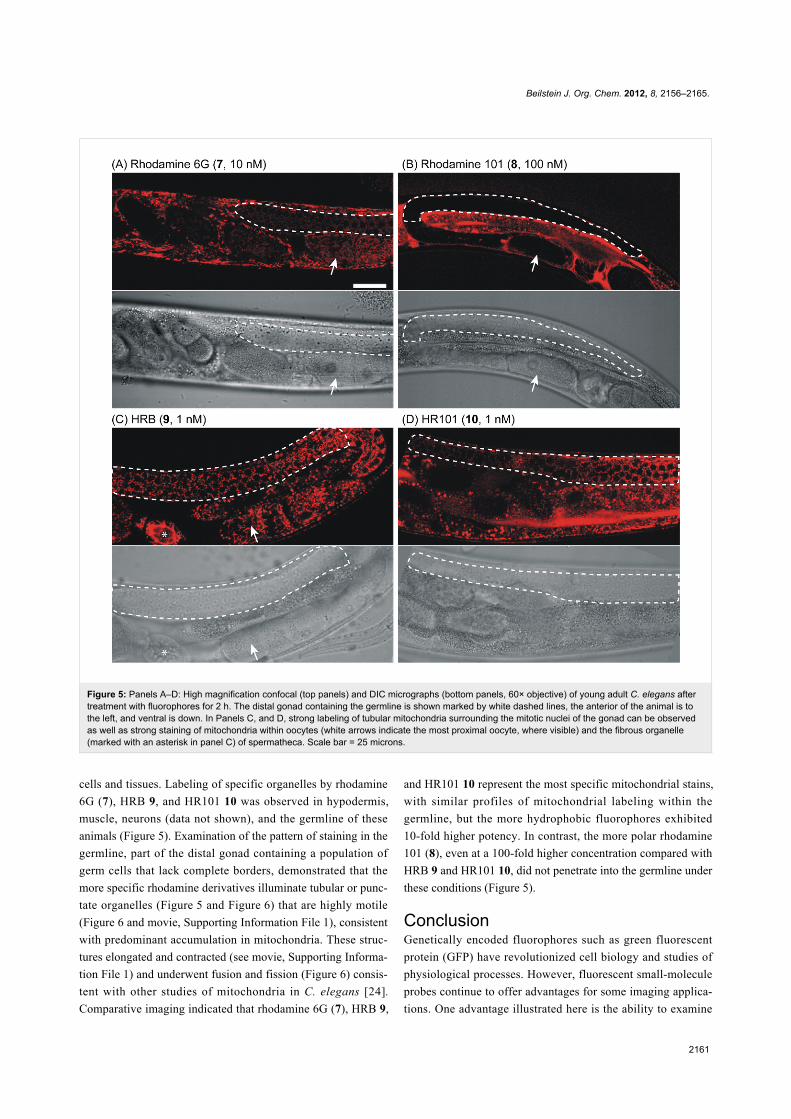
Higher magnification confocal microscopy (60× objective)
using a variety of fluorophore concentrations revealed that most
cells of living C. elegans accumulate the fluorophores
rhodamine 6G (7), HRB 9, and HR101 10 after treatment for
2 h (Figure 5). Under these conditions, the more polar
rhodamine 101 (8) was observed to be excluded from some
Beilstein J. Org. Chem. 2012, 8, 2156–2165.
2161
Figure 5: Panels A–D: High magnification confocal (top panels) and DIC micrographs (bottom panels, 60× objective) of young adult C. elegans aftertreatment with fluorophores for 2 h. The distal gonad containing the germline is shown marked by white dashed lines, the anterior of the animal is tothe left, and ventral is down. In Panels C, and D, strong labeling of tubular mitochondria surrounding the mitotic nuclei of the gonad can be observedas well as strong staining of mitochondria within oocytes (white arrows indicate the most proximal oocyte, where visible) and the fibrous organelle(marked with an asterisk in panel C) of spermatheca. Scale bar = 25 microns.
cells and tissues. Labeling of specific organelles by rhodamine
6G (7), HRB 9, and HR101 10 was observed in hypodermis,
muscle, neurons (data not shown), and the germline of these
animals (Figure 5). Examination of the pattern of staining in the
germline, part of the distal gonad containing a population of
germ cells that lack complete borders, demonstrated that the
more specific rhodamine derivatives illuminate tubular or punc-
tate organelles (Figure 5 and Figure 6) that are highly motile
(Figure 6 and movie, Supporting Information File 1), consistent
with predominant accumulation in mitochondria. These struc-
tures elongated and contracted (see movie, Supporting Informa-
tion File 1) and underwent fusion and fission (Figure 6) consis-
tent with other studies of mitochondria in C. elegans [24].
Comparative imaging indicated that rhodamine 6G (7), HRB 9,
and HR101 10 represent the most specific mitochondrial stains,
with similar profiles of mitochondrial labeling within the
germline, but the more hydrophobic fluorophores exhibited
10-fold higher potency. In contrast, the more polar rhodamine
101 (8), even at a 100-fold higher concentration compared with
HRB 9 and HR101 10, did not penetrate into the germline under
these conditions (Figure 5).
ConclusionGenetically encoded fluorophores such as green fluorescent
protein (GFP) have revolutionized cell biology and studies of
physiological processes. However, fluorescent small-molecule
probes continue to offer advantages for some imaging applica-
tions. One advantage illustrated here is the ability to examine
Beilstein J. Org. Chem. 2012, 8, 2156–2165.
2162
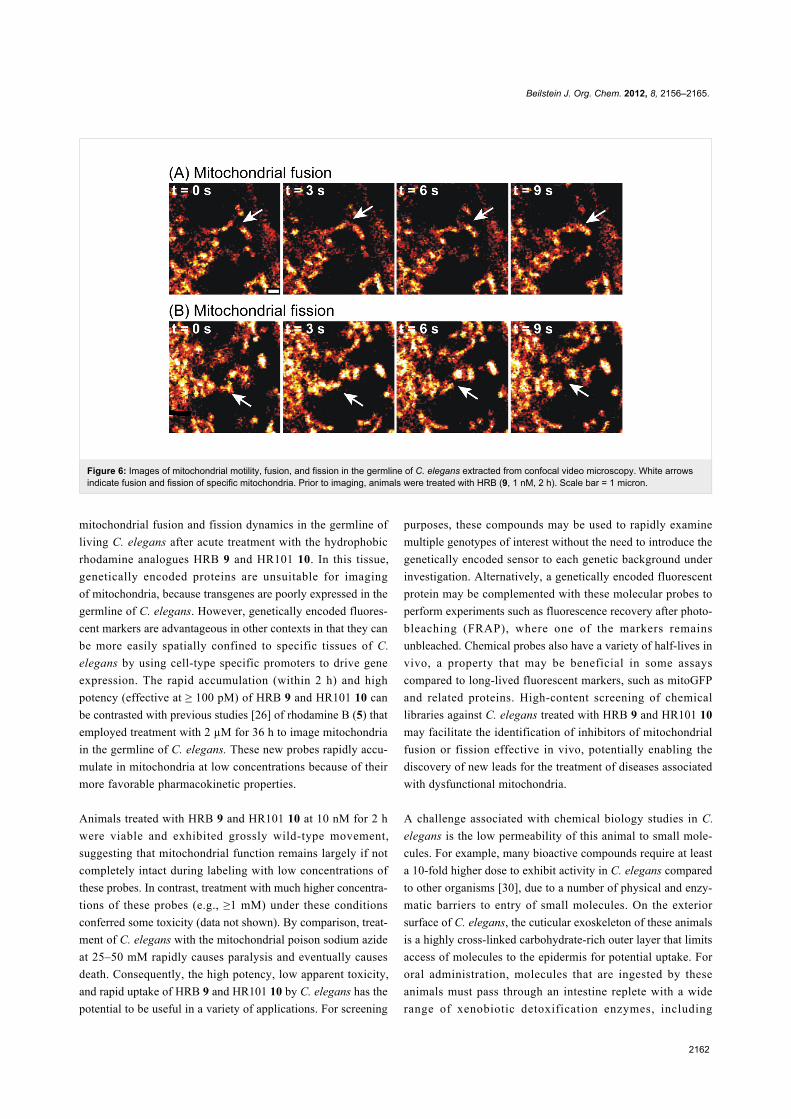
Figure 6: Images of mitochondrial motility, fusion, and fission in the germline of C. elegans extracted from confocal video microscopy. White arrowsindicate fusion and fission of specific mitochondria. Prior to imaging, animals were treated with HRB (9, 1 nM, 2 h). Scale bar = 1 micron.
mitochondrial fusion and fission dynamics in the germline of
living C. elegans after acute treatment with the hydrophobic
rhodamine analogues HRB 9 and HR101 10. In this tissue,
genetically encoded proteins are unsuitable for imaging
of mitochondria, because transgenes are poorly expressed in the
germline of C. elegans. However, genetically encoded fluores-
cent markers are advantageous in other contexts in that they can
be more easily spatially confined to specific tissues of C.
elegans by using cell-type specific promoters to drive gene
expression. The rapid accumulation (within 2 h) and high
potency (effective at ≥ 100 pM) of HRB 9 and HR101 10 can
be contrasted with previous studies [26] of rhodamine B (5) that
employed treatment with 2 µM for 36 h to image mitochondria
in the germline of C. elegans. These new probes rapidly accu-
mulate in mitochondria at low concentrations because of their
more favorable pharmacokinetic properties.
Animals treated with HRB 9 and HR101 10 at 10 nM for 2 h
were viable and exhibited grossly wild-type movement,
suggesting that mitochondrial function remains largely if not
completely intact during labeling with low concentrations of
these probes. In contrast, treatment with much higher concentra-
tions of these probes (e.g., ≥1 mM) under these conditions
conferred some toxicity (data not shown). By comparison, treat-
ment of C. elegans with the mitochondrial poison sodium azide
at 25–50 mM rapidly causes paralysis and eventually causes
death. Consequently, the high potency, low apparent toxicity,
and rapid uptake of HRB 9 and HR101 10 by C. elegans has the
potential to be useful in a variety of applications. For screening
purposes, these compounds may be used to rapidly examine
multiple genotypes of interest without the need to introduce the
genetically encoded sensor to each genetic background under
investigation. Alternatively, a genetically encoded fluorescent
protein may be complemented with these molecular probes to
perform experiments such as fluorescence recovery after photo-
bleaching (FRAP), where one of the markers remains
unbleached. Chemical probes also have a variety of half-lives in
vivo, a property that may be beneficial in some assays
compared to long-lived fluorescent markers, such as mitoGFP
and related proteins. High-content screening of chemical
libraries against C. elegans treated with HRB 9 and HR101 10
may facilitate the identification of inhibitors of mitochondrial
fusion or fission effective in vivo, potentially enabling the
discovery of new leads for the treatment of diseases associated
with dysfunctional mitochondria.
A challenge associated with chemical biology studies in C.
elegans is the low permeability of this animal to small mole-
cules. For example, many bioactive compounds require at least
a 10-fold higher dose to exhibit activity in C. elegans compared
to other organisms [30], due to a number of physical and enzy-
matic barriers to entry of small molecules. On the exterior
surface of C. elegans, the cuticular exoskeleton of these animals
is a highly cross-linked carbohydrate-rich outer layer that limits
access of molecules to the epidermis for potential uptake. For
oral administration, molecules that are ingested by these
animals must pass through an intestine replete with a wide
range of xenobiotic detoxification enzymes, including
Beilstein J. Org. Chem. 2012, 8, 2156–2165.
2163
cytochrome P450s, phase-II transferases, and efflux pumps such
as P-glycoprotein [35], to reach target tissues [29]. Thus, com-
pounds such as HRB 9 and HR101 10 that show high potency in
this animal have passed through a stringent biological filter,
providing a basis to justify studies in more complex and costly
animal models. Fluorescence-imaging studies of small mole-
cules in C. elegans have the potential to provide a deeper under-
standing of molecular modifications that facilitate the access of
compounds to targets in vivo and may improve our ability to
design more effective therapeutics and probes.
ExperimentalSynthesisChemical reagents were obtained from Acros, Aldrich, Alfa
Aesar, or TCI America. Solvents were from EM Science.
Commercial grade reagents were used without further purifica-
tion unless otherwise noted. Anhydrous solvents were obtained
after passage through a drying column of a solvent-purification
system from GlassContour (Laguna Beach, CA). All reactions
were performed under an atmosphere of dry argon or nitrogen.
Reactions were monitored by analytical thin-layer chromatog-
raphy on plates coated with 0.25 mm silica gel 60 F254 (EM
Science). TLC plates were visualized by UV irradiation (254
nm) or stained with a solution of phosphomolybdic acid and
sulfuric acid in ethanol (1:1:20). Flash column chromatography
employed ICN SiliTech Silica Gel (32–63 μm). Melting points
were measured with a Thomas Hoover capillary melting point
apparatus and are uncorrected. Infrared spectra were obtained
with a Perkin Elmer 1600 Series FTIR. NMR spectra were
obtained with Bruker CDPX-300, DPX-300, or DRX-400
instruments with chemical shifts reported in parts per million
(ppm, δ) referenced to either CDCl3 (1H, 7.27 ppm; 13C, 77.23
ppm), or DMSO-d6 (1H, 2.50 ppm; 13C, 39.51 ppm). High-reso-
lution mass spectra were obtained from mass spectrometry
facilities at the University of Kansas or The Pennsylvania State
University (ESI and TOF). Peaks are reported as m/z.
Absorbance spectra were obtained with an Agilient 8453
UV–vis spectrophotometer. Fluorescence measurements
employed either a PTi MD-5020 or a Perkin-Elmer LS55 fluo-
rescence spectrometer with a 10 nm excitation slit width.
5-(Diethylamino)-2-{[4-(diethylamino)-2-hydroxyphenyl](2-
methylphenyl)methyl}phenol (13): 3-Diethylaminophenol (11,
500 mg, 3.0 mmol) and o-tolualdehyde (12, 175 µL, 1.5 mmol)
were dissolved in propionic acid (15 mL) and catalytic p-TsOH
acid was added. The reaction was purged with argon and heated
to 80–85 °C. The reaction was monitored by TLC by quenching
aliquots (100 µL) in aqueous saturated sodium bicarbonate (200
µL), followed by extraction of the organic material with EtOAc
(200 µL). When all starting materials had been consumed (5 h),
the solution was cooled to 0 °C and poured into excess aqueous
sodium acetate (3 M, 100 mL) to neutralize the propionic acid
and precipitate the triarylmethane. The filtrate was collected by
vacuum filtration, washed with copious amounts of water, and
dried under reduced pressure to provide 13 (480 mg, 74%) as a
tan solid. Mp 68–70 °CM; 1H NMR (400 MHz, CDCl3) δ 7.02
(m, 3H), 6.90 (d, J = 6.8 Hz, 1H), 6.51 (d, J = 8.3 Hz, 1H), 6.05
(m, 4H), 5.55 (s, 1H), 3.10 (q, J = 6.9 Hz, 8H), 2.10 (s, 3H),
0.98 (t, J = 6.9 Hz, 12H); 13C NMR (75 MHz, CDCl3) δ 154.8,
148.1, 140.8, 136.8, 130.4, 130.4, 130.2, 115.2, 105.0, 104.8,
100.2, 100.0, 44.2, 40.8, 19.4, 12.4; IR (film) νmax: 3457, 2971,
1620, 1521 cm−1; HRMS (ESI+, TOF, m/z): [M + H]+ calcd for
C28H36O2N2, 433.2850; found, 433.2848.
6-(Diethylamino)-N,N-diethyl-9-(2-methylphenyl)-3H-
xanthen-3-imine (HRB, 9): 5-(Diethylamino)-2-{[4-(diethyl-
amino)-2-hydroxyphenyl](2-methylphenyl)methyl}phenol (13,
100 mg, 0.23 mmol) and chloranil (85 mg, 0.34 mmol) were
dissolved in MeOH/CHCl3 (1:1, 10 mL). The solution was
stirred at 23 °C for 1 h. When the reaction was complete as evi-
denced by TLC, the solvent was removed under reduced pres-
sure and the residue was applied directly to a column of silica
gel. Flash chromatography (MeOH/CHCl3 1:9) afforded 9
(21 mg, 20%) as a purple film of the chloride salt. 1H NMR
(300 MHz, CDCl3) δ 7.54–7.38 (m, 3H), 7.16–7.13 (m, 3H),
6.86–6.79 (m, 4H), 3.62 (q, J = 7.2 Hz, 8H), 2.06 (s, 3H), 1.33
(t, J = 7.1 Hz, 12H); 13C NMR (75 MHz, CDCl3) δ 157.9,
157.8, 155.6, 135.8, 131.6, 131.4, 130.7, 130.1, 128.7, 126.1,
114.0, 113.4, 96.5, 46.0, 19.5, 12.4; IR (film) νmax: 2981, 1590,
1179 cm−1; HRMS (ESI+, TOF, m/z): [M]+ calcd for
C28H33ON2, 413.2587; found, 413.2583.
9,9'-[(2-Methylphenyl)methylene]bis(2,3,6,7-tetrahydro-
1H,5H-pyrido[3,2,1-ij]quinolin-8-ol) (15): 8-Hydroxy-
julolidine (14, 500 mg, 2.6 mmol) and o-tolualdehyde (12, 154
µL, 1.3 mmol) were dissolved in propionic acid (15 mL) and
catalytic p-TsOH acid was added. The reaction was performed
as described for the preparation of 13 to afford 15 (525 mg,
84%) as a gray solid. Mp 170–174 °C; 1H NMR (400 MHz,
CDCl3) δ 7.12–7.04 (m, 3H), 6.73 (d, J1 = 7.5 Hz, 1H), 6.34 (3,
2H), 6.02 (s, 1H), 3.35 (m, 4H), 3.24 (m, 4H), 2.69 (m, 8H),
2.12 (s, 3H), 2.10 (m, 8H); 13C NMR (75 MHz, CDCl3) δ
150.3, 139.8, 136.1, 132.5, 129.8, 127.9, 127.7, 125.8, 125.0,
119.6, 116.6, 52.1, 51.5, 39.9, 24.8, 20.1, 19.7, 19.1, 18.5 (× 2);
IR (film) νmax: 3270, 2953, 1673, 1471 cm−1; HRMS (ESI+,
TOF, m/z): [M + H]+ calcd for C32H36O2N2, 481.2850; found,
481.2875.
16-(2-Methylphenyl)-3-oxa-9,23-diazaheptacyclo-
[17.7.1.1{5,9} .0{2,17} .0{4,15} .0{23,27} .0{13,28}]octacosa-
1(27),2(17),4,9(28),13,15,18-heptaen-9-ium (HR101, 10):
9,9'-[(2-Methylphenyl)methylene]bis(2,3,6,7-tetrahydro-1H,5H-
Beilstein J. Org. Chem. 2012, 8, 2156–2165.
2164
pyrido[3,2,1-ij]quinolin-8-ol) (15, 91 mg, 0.19 mmol) and chlo-
ranil (69 mg, 0.28 mmol) in MeOH/CHCl3 (1:1, 10 mL) were
stirred at 23 °C for 1 h. When the reaction had been complete as
evidenced by TLC, the solvent was removed under reduced
pressure, and the residue was applied directly to a column of
silica gel. Flash chromatography (MeOH/CHCl3, 1:9) afforded
10 (27 mg, 29%) as a purple film of the chloride salt. 1H NMR
(400 MHz, CDCl3) δ 7.44–7.25 (m, 3H), 7.07 (d, J = 6.9 Hz,
1H), 6.56 (s, 2H), 3.41 (m, 8H), 2.97 (t, J = 6.2 Hz, 4H), 2.58
(t, J = 5.9 Hz, 4H), 2.01 (p, J = 6.3 Hz, 4H), 1.90 (s, 3H), 1.84
(p, J = 5.3 Hz, 4H); 13C NMR (75 MHz, CDCl3) δ 156.0,
153.6, 152.6, 137.2, 133.9, 131.6, 130.2, 127.1 (× 2), 125.5,
113.9, 106.7, 51.8, 51.4, 28.5, 21.7, 20.9, 20.8, 19.6; IR (film)
νmax: 2923, 1682, 1596, 1298 cm−1; HRMS (ESI+, TOF, m/z):
[M]+ calcd for C32H33ON2, 461.2587; found, 461.2580.
Determination of log D valuesValues of log D were measured by dissolution of solids in 1:1
octanol/phosphate buffer (4 mL total volume, 5 mM phosphate,
pH 7.4) to provide 5 mM solutions of the fluorophore. Samples
were shaken for 24 h at 25 °C to equilibrate. The top and
bottom 1 mL fractions were isolated and centrifuged at 15,000
rpm (no precipitate was observed for any of the samples).
Aliquots of these fractions were diluted in octanol (derived
from the top fraction) or buffer (derived bottom fraction) to
generate stock solutions (10×) appropriate for analysis. These
stock solutions were further diluted 10-fold and analyzed in a
solvent mixture comprising ethanol (80%), octanol (10%), and
phosphate buffer (10%, pH 7.4). The ratio of fluorescence emis-
sion at λmax was used to calculate log D.
Biological evaluationThe N2 strain of C. elegans was cultured as described [47] and
maintained at 20–22.5 °C. Fluorophores were added to normal
growth media (NMG) liquid (at 45–55 °C), poured into Petri
dishes (60 mm), and allowed to cool until solidified. Fluo-
rophores, were prepared fresh as DMSO stocks (1000×) from
dry powders and used immediately. The final amount of DMSO
exposed to animals did not exceed 0.1%. Storage of fluo-
rophores as frozen solutions in DMSO is not recommended and
can result in loss of potency. Prepared media were seeded with
the normal food source of OP50 E. coli and incubated overnight
at room temperature to dry. Adult C. elegans animals (10–20)
were added to the media and allowed to feed freely for 2 h prior
to imaging. Animals were transferred and imaged on 10%
agarose pads in the presence of 2.5% (w/v) polystyrene beads
(50 nm, Bangs Laboratory) to prevent movement. Imaging
employed an Olympus FV1000 laser scanning confocal micro-
scope and Fluoview software. Images were acquired with Plan-
apochromat objectives.
Supporting InformationSupporting Information File 1Supplementary time-lapse confocal microscopy video
showing dynamics of mitochondrial fusion and fission in a
living adult C. elegans animal imaged after treatment with
HRB (9, 1 nM) for 2 h followed by immobilization on an
agarose pad containing polystyrene beads. Frames were
acquired every 3.3 seconds, and are animated at 3 frames
per second. The animal in the video is oriented such that
the ventral side is left and the anterior is toward the top of
the frame. The distal (mitotic) gonad arm is on the right
half of the animal, whereas the proximal oocytes are on the
left. Dynamic motility of mitochondria in the gonad
including elongation, collapse, fusion, and fission can be
observed.
[http://www.beilstein-journals.org/bjoc/content/
supplementary/1860-5397-8-243-S1.mov]
AcknowledgementsWe thank the NIH (R01-CA83831, RC1-GM091086, and P20-
GM103638) for financial support. S.F. thanks the NIH for an
IRACDA postdoctoral fellowship.
References1. Lavis, L. D.; Raines, R. T. ACS Chem. Biol. 2008, 3, 142–155.
doi:10.1021/cb700248m2. Urano, Y.; Kamiya, M.; Kanda, K.; Ueno, T.; Hirose, K.; Nagano, T.
J. Am. Chem. Soc. 2005, 127, 4888–4894. doi:10.1021/ja043919h3. Mottram, L. F.; Boonyarattanakalin, S.; Kovel, R. E.; Peterson, B. R.
Org. Lett. 2006, 8, 581–584. doi:10.1021/ol052655g4. Mottram, L. F.; Maddox, E.; Schwab, M.; Beaufils, F.; Peterson, B. R.
Org. Lett. 2007, 9, 3741–3744. doi:10.1021/ol70150935. Koide, K.; Song, F.; de Groh, E. D.; Garner, A. L.; Mitchell, V. D.;
Davidson, L. A.; Hukriede, N. A. ChemBioChem 2008, 9, 214–218.doi:10.1002/cbic.200700565
6. Nicholls, D. G. Eur. J. Biochem. 1974, 50, 305–315.doi:10.1111/j.1432-1033.1974.tb03899.x
7. Chen, L. B. Annu. Rev. Cell Biol. 1988, 4, 155–181.doi:10.1146/annurev.cb.04.110188.001103
8. Perry, S. W.; Norman, J. P.; Barbieri, J.; Brown, E. B.; Gelbard, H. A.BioTechniques 2011, 50, 98–115. doi:10.2144/000113610
9. Belostotsky, I.; da Silva, S. M.; Paez, M. G.; Indig, G. L.Biotech. Histochem. 2011, 86, 302–314.doi:10.3109/10520295.2010.483656
10. Wu, L.; Burgess, K. J. Org. Chem. 2008, 73, 8711–8718.doi:10.1021/jo800902j
11. Modica-Napolitano, J. S.; Aprille, J. R. Adv. Drug Delivery Rev. 2001,49, 63–70. doi:10.1016/S0169-409X(01)00125-9
12. Lim, S. H.; Wu, L.; Burgess, K.; Lee, H. B. Anti-Cancer Drugs 2009, 20,461–468. doi:10.1097/CAD.0b013e32832b7bee
13. Smith, R. A. J.; Hartley, R. C.; Murphy, M. P. Antioxid. Redox Signaling2011, 15, 3021–3038. doi:10.1089/ars.2011.3969
Beilstein J. Org. Chem. 2012, 8, 2156–2165.
2165
14. Lemasters, J. J.; Ramshesh, V. K. Methods Cell Biol. 2007, 80,283–295. doi:10.1016/S0091-679X(06)80014-2
15. Huang, H.; Frohman, M. A. Methods Cell Biol. 2012, 108, 131–145.doi:10.1016/B978-0-12-386487-1.00007-9
16. Liu, X. G.; Weaver, D.; Shirihai, O.; Hajnoczky, G. EMBO J. 2009, 28,3074–3089. doi:10.1038/emboj.2009.255
17. Chan, D. C. Annu. Rev. Cell Dev. Biol. 2006, 22, 79–99.doi:10.1146/annurev.cellbio.22.010305.104638
18. Wang, D.; Wang, J.; Bonamy, G. M. C.; Meeusen, S.; Brusch, R. G.;Turk, C.; Yang, P.; Schultz, P. G. Angew. Chem., Int. Ed. 2012, 51,9302–9305. doi:10.1002/anie.201204589
19. Chan, D. C. Cell 2006, 125, 1241–1252. doi:10.1016/j.cell.2006.06.01020. Corrado, M.; Scorrano, L.; Campello, S. Int. J. Cell Biol. 2012, 2012,
729290. doi:10.1155/2012/72929021. Sweatman, T. W.; Seshadri, R.; Israel, M.
Cancer Chemother. Pharmacol. 1990, 27, 205–210.doi:10.1007/BF00685714
22. Elliott, G. S.; Mason, R. W.; Edwards, I. R. J. J. Toxicol., Clin. Toxicol.1990, 28, 45–59. doi:10.3109/15563659008993475
23. Cygalova, L. H.; Hofman, J.; Ceckova, M.; Staud, F.J. Pharmacol. Exp. Ther. 2009, 331, 1118–1125.doi:10.1124/jpet.109.160564
24. Labrousse, A. M.; Zappaterra, M. D.; Rube, D. A.; van der Bliek, A. M.Mol. Cell 1999, 4, 815–826. doi:10.1016/S1097-2765(00)80391-3
25. Kanazawa, T.; Zappaterra, M. D.; Hasegawa, A.; Wright, A. P.;Newman-Smith, E. D.; Buttle, K. F.; McDonald, K.; Mannella, C. A.;van der Bliek, A. M. PLoS Genet. 2008, 4, e1000022.doi:10.1371/journal.pgen.1000022
26. Deng, X.; Yin, X.; Allan, R.; Lu, D. D.; Maurer, C. W.;Haimovitz-Friedman, A.; Fuks, Z.; Shaham, S.; Kolesnick, R. Science2008, 322, 110–115. doi:10.1126/science.1158111
27. Jagasia, R.; Grote, P.; Westermann, B.; Conradt, B. Nature 2005, 433,754–760. doi:10.1038/nature03316
28. Lu, Y.; Rolland, S. G.; Conradt, B. Proc. Natl. Acad. Sci. U. S. A. 2011,108, E813–E822. doi:10.1073/pnas.1103218108
29. Lindblom, T. H.; Dodd, A. K. J. Exp. Zool., Part A 2006, 305, 720–730.doi:10.1002/jez.a.324
30. Burns, A. R.; Wallace, I. M.; Wildenhain, J.; Tyers, M.; Giaever, G.;Bader, G. D.; Nislow, C.; Cutler, S. R.; Roy, P. J. Nat. Chem. Biol.2010, 6, 549–557. doi:10.1038/nchembio.380
31. Kashima, N.; Fujikura, Y.; Komura, T.; Fujiwara, S.; Sakamoto, M.;Terao, K.; Nishikawa, Y. Biogerontology 2012, 13, 337–344.doi:10.1007/s10522-012-9378-3
32. Kokel, D.; Li, Y.; Qin, J.; Xue, D. Nat. Chem. Biol. 2006, 2, 338–345.doi:10.1038/nchembio791
33. Grünz, G.; Haas, K.; Soukup, S.; Klingenspor, M.; Kulling, S. E.;Daniel, H.; Spanier, B. Mech. Ageing Dev. 2012, 133, 1–10.doi:10.1016/j.mad.2011.11.005
34. Surco-Laos, F.; Cabello, J.; Gómez-Orte, E.; González-Manzano, S.;González-Paramás, A. M.; Santos-Buelga, C.; Dueñas, M. Food Funct.2011, 2, 445–456. doi:10.1039/c1fo10049a
35. Broeks, A.; Janssen, H. W.; Calafat, J.; Plasterk, R. H. EMBO J. 1995,14, 1858–1866.
36. Kwok, T. C. Y.; Ricker, N.; Fraser, R.; Chan, A. W.; Burns, A.;Stanley, E. F.; McCourt, P.; Cutler, S. R.; Roy, P. J. Nature 2006, 441,91–95. doi:10.1038/nature04657
37. Lampidis, T. J.; Castello, C.; del Giglio, A.; Pressman, B. C.; Viallet, P.;Trevorrow, K. W.; Valet, G. K.; Tapiero, H.; Savaraj, N.Biochem. Pharmacol. 1989, 38, 4267–4271.doi:10.1016/0006-2952(89)90525-X
38. Satoh, T.; Hosokawa, M. Annu. Rev. Pharmacol. Toxicol. 1998, 38,257–288. doi:10.1146/annurev.pharmtox.38.1.257
39. Martin, V. V.; Rothe, A.; Gee, K. R. Bioorg. Med. Chem. Lett. 2005, 15,1851–1855. doi:10.1016/j.bmcl.2005.02.017
40. Kauffman, J. M.; Imbesi, S. J.; Aziz, M. A. Org. Prep. Proced. Int. 2001,33, 603–613. doi:10.1080/00304940109356622
41. Fluorophores.org, Database of Fluorescent Dyes and Applications.http://www.fluorophores.tugraz.at (accessed Nov 19, 2012).
42. Williams, A. T. R.; Winfield, S. A.; Miller, J. N. Analyst 1983, 108,1067–1071. doi:10.1039/an9830801067
43. Dixon, J. M.; Taniguchi, M.; Lindsey, J. S. Photochem. Photobiol. 2005,81, 212–213. doi:10.1562/2004-11-06-TSN-361.1
44. Velapoldi, R. A.; Tonnesen, H. H. J. Fluoresc. 2004, 14, 465–472.doi:10.1023/B:JOFL.0000031828.96368.c1
45. Magde, D.; Wong, R.; Seybold, P. G. Photochem. Photobiol. 2002, 75,327–334. doi:10.1562/0031-8655(2002)075<0327:FQYATR>2.0.CO;2
46. Toropainen, E.; Ranta, V. P.; Talvitie, A.; Suhonen, P.; Urtti, A.Invest. Ophthalmol. Visual Sci. 2001, 42, 2942–2948.
47. Brenner, S. Genetics 1974, 77, 71–94.
License and TermsThis is an Open Access article under the terms of the
Creative Commons Attribution License
(http://creativecommons.org/licenses/by/2.0), which
permits unrestricted use, distribution, and reproduction in
any medium, provided the original work is properly cited.
The license is subject to the Beilstein Journal of Organic
Chemistry terms and conditions:
(http://www.beilstein-journals.org/bjoc)
The definitive version of this article is the electronic one
which can be found at:
doi:10.3762/bjoc.8.243
Related Documents