Hydrogeologic Controls on Induced Seismicity in Crystalline Basement Rocks Due to Fluid Injection into Basal Reservoirs by Yipeng Zhang 1 , Mark Person 2 , John Rupp 3 , Kevin Ellett 3 , Michael A. Celia 4 , Carl W. Gable 5 , Brenda Bowen 6 , James Evans 7 , Karl Bandilla 4 , Peter Mozley 1 , Thomas Dewers 8 , and Thomas Elliot 4 Abstract A series of M b 3.8 – 5.5 induced seismic events in the midcontinent region, United States, resulted from injection of fluid either into a basal sedimentary reservoir with no underlying confining unit or directly into the underlying crystalline basement complex. The earthquakes probably occurred along faults that were likely critically stressed within the crystalline basement. These faults were located at a considerable distance (up to 10 km) from the injection wells and head increases at the hypocenters were likely relatively small (∼70–150 m). We present a suite of simulations that use a simple hydrogeologic-geomechanical model to assess what hydrogeologic conditions promote or deter induced seismic events within the crystalline basement across the midcontinent. The presence of a confining unit beneath the injection reservoir horizon had the single largest effect in preventing induced seismicity within the underlying crystalline basement. For a crystalline basement having a permeability of 2 × 10 −17 m 2 and specific storage coefficient of 10 −7 /m, injection at a rate of 5455 m 3 /d into the basal aquifer with no underlying basal seal over 10 years resulted in probable brittle failure to depths of about 0.6 km below the injection reservoir. Including a permeable (k z = 10 −13 m 2 ) Precambrian normal fault, located 20 m from the injection well, increased the depth of the failure region below the reservoir to 3 km. For a large permeability contrast between a Precambrian thrust fault (10 −12 m 2 ) and the surrounding crystalline basement (10 −18 m 2 ), the failure region can extend laterally 10 km away from the injection well. Introduction The sixfold increase of earthquakes during the past decade in the midcontinent region of the United States (Ellsworth et al. 2012) has been attributed to deep injection of fluids (Frohlich 2012). This information has increased interest in reducing the risk of induced 1 Department of Earth and Environmental Science, New Mexico Institute of Mining and Technology, 801 Leroy Place, Socorro, NM 87801. 2 Corresponding author: Department of Earth and Environ- mental Science, New Mexico Institute of Mining and Technology, 801 Leroy Place, Socorro, NM 87801; (575) 835-6506; fax: (575) 835-6436; [email protected] 3 Indiana Geological Survey, Indiana University, 611 North Walnut Grove, Bloomington, IN 47405-2208. 4 Department of Civil Engineering, Princeton University, E-208 E-Quad, Princeton, NJ 08544. 5 Los Alamos National Laboratory, EES-16, Los Alamos, NM 87545. 6 Department of Earth and Atmospheric Sciences, Purdue University, 550 Stadium Mall Drive, West Lafayette, IN 47907. 7 Department of Geology, Utah State University, Logan, UT 84322-4505. 8 Sandia National Laboratory, Albuquerque, NM. Received November 2012, accepted April 2013. © 2013, National Ground Water Association. doi: 10.1111/gwat.12071 seismic events associated with unconventional oil/gas brine reinjection and from other deep waste disposal wells. Similar concerns have been raised regarding proposed future industrial-scale deployment of carbon-capture and storage projects across the midcontinent, particularly with regard to inducing fractures in overlying confining units (Zoback and Gorelick 2012). The issue of induced seismicity gained widespread attention following a series of relatively large earthquakes (up to M b 5.5) that were associated with hazardous waste injection at the Rocky Mountain Arsenal, Colorado, in 1966 (Healy et al. 1968; Hsieh and Bredehoeft 1981) (Figure 1A) and through confirmation of the hydraulically induced failure mechanism in controlled experiments at Rangley Colorado (Raleigh et al. 1972, 1976). At the Rocky Mountain Arsenal near Denver, earthquakes occurred within the crystalline basement when the fluid pressures were raised over 320 m above hydrostatic conditions (3.2 MPa) between a depth of about 0.7 – 7 km (Hsieh and Bredehoeft 1981). The maximum wellhead injection pressure was measured at 7.6 MPa (Figure 1B). However, much lower pressure changes are thought to have been responsible for the M7.9 Wenchuan earthquake in Sichuan province, China that killed over 80,000 people (Kerr and Stone 2009). Ge et al. (2009) used hydromechanical modeling NGWA.org Vol. 51, No. 4 – Groundwater – July-August 2013 (pages 525 – 538) 525

Welcome message from author
This document is posted to help you gain knowledge. Please leave a comment to let me know what you think about it! Share it to your friends and learn new things together.
Transcript
Hydrogeologic Controls on Induced Seismicityin Crystalline Basement Rocks Due to FluidInjection into Basal Reservoirsby Yipeng Zhang1, Mark Person2, John Rupp3, Kevin Ellett3, Michael A. Celia4, Carl W. Gable5, Brenda Bowen6,James Evans7, Karl Bandilla4, Peter Mozley1, Thomas Dewers8, and Thomas Elliot4
AbstractA series of Mb 3.8–5.5 induced seismic events in the midcontinent region, United States, resulted from injection of fluid either
into a basal sedimentary reservoir with no underlying confining unit or directly into the underlying crystalline basement complex.The earthquakes probably occurred along faults that were likely critically stressed within the crystalline basement. These faultswere located at a considerable distance (up to 10 km) from the injection wells and head increases at the hypocenters were likelyrelatively small (∼70–150 m). We present a suite of simulations that use a simple hydrogeologic-geomechanical model to assesswhat hydrogeologic conditions promote or deter induced seismic events within the crystalline basement across the midcontinent.The presence of a confining unit beneath the injection reservoir horizon had the single largest effect in preventing induced seismicitywithin the underlying crystalline basement. For a crystalline basement having a permeability of 2 × 10⁻¹⁷ m2 and specific storagecoefficient of 10−7/m, injection at a rate of 5455 m3/d into the basal aquifer with no underlying basal seal over 10 years resulted inprobable brittle failure to depths of about 0.6 km below the injection reservoir. Including a permeable (kz = 10−13 m2) Precambriannormal fault, located 20 m from the injection well, increased the depth of the failure region below the reservoir to 3 km. For alarge permeability contrast between a Precambrian thrust fault (10−12 m2) and the surrounding crystalline basement (10−18 m2),the failure region can extend laterally 10 km away from the injection well.
IntroductionThe sixfold increase of earthquakes during the past
decade in the midcontinent region of the United States(Ellsworth et al. 2012) has been attributed to deepinjection of fluids (Frohlich 2012). This informationhas increased interest in reducing the risk of induced
1Department of Earth and Environmental Science, New MexicoInstitute of Mining and Technology, 801 Leroy Place, Socorro, NM87801.
2Corresponding author: Department of Earth and Environ-mental Science, New Mexico Institute of Mining and Technology,801 Leroy Place, Socorro, NM 87801; (575) 835-6506; fax: (575)835-6436; [email protected]
3Indiana Geological Survey, Indiana University, 611 NorthWalnut Grove, Bloomington, IN 47405-2208.
4Department of Civil Engineering, Princeton University, E-208E-Quad, Princeton, NJ 08544.
5Los Alamos National Laboratory, EES-16, Los Alamos, NM87545.
6Department of Earth and Atmospheric Sciences, PurdueUniversity, 550 Stadium Mall Drive, West Lafayette, IN 47907.
7Department of Geology, Utah State University, Logan, UT84322-4505.
8Sandia National Laboratory, Albuquerque, NM.Received November 2012, accepted April 2013.© 2013, National Ground Water Association.doi: 10.1111/gwat.12071
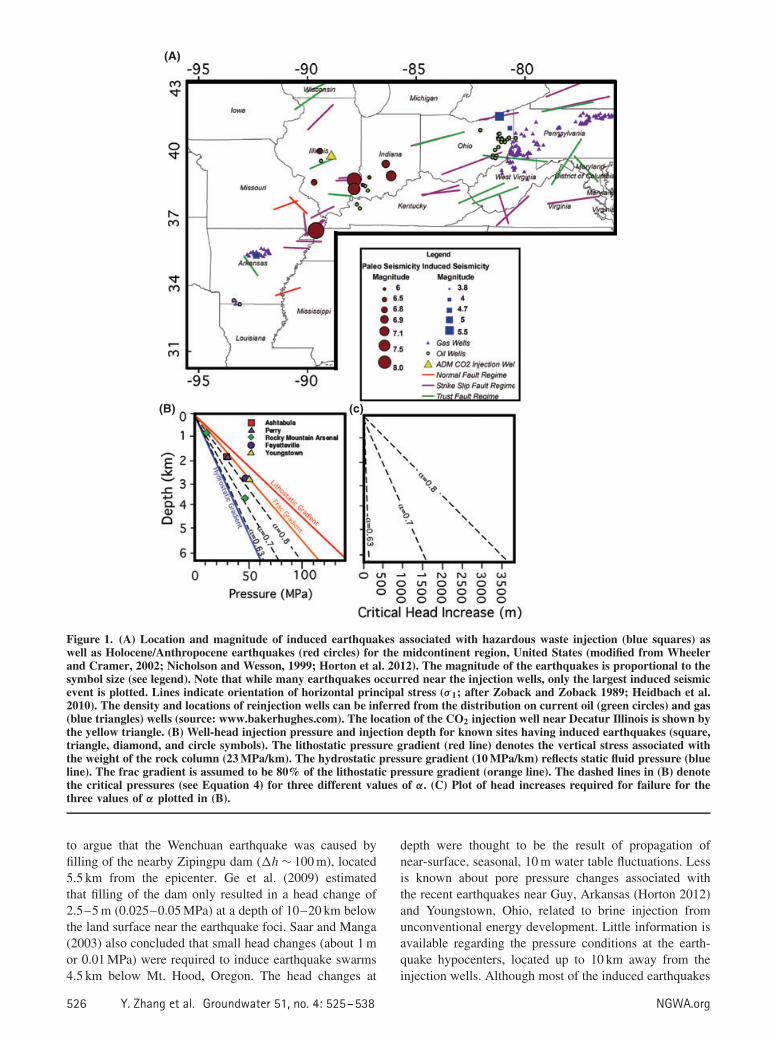
seismic events associated with unconventional oil/gasbrine reinjection and from other deep waste disposal wells.Similar concerns have been raised regarding proposedfuture industrial-scale deployment of carbon-capture andstorage projects across the midcontinent, particularlywith regard to inducing fractures in overlying confiningunits (Zoback and Gorelick 2012). The issue of inducedseismicity gained widespread attention following a seriesof relatively large earthquakes (up to M b 5.5) thatwere associated with hazardous waste injection at theRocky Mountain Arsenal, Colorado, in 1966 (Healy et al.1968; Hsieh and Bredehoeft 1981) (Figure 1A) andthrough confirmation of the hydraulically induced failuremechanism in controlled experiments at Rangley Colorado(Raleigh et al. 1972, 1976). At the Rocky MountainArsenal near Denver, earthquakes occurred within thecrystalline basement when the fluid pressures wereraised over 320 m above hydrostatic conditions (3.2 MPa)between a depth of about 0.7–7 km (Hsieh and Bredehoeft1981). The maximum wellhead injection pressure wasmeasured at 7.6 MPa (Figure 1B). However, much lowerpressure changes are thought to have been responsiblefor the M7.9 Wenchuan earthquake in Sichuan province,China that killed over 80,000 people (Kerr and Stone2009). Ge et al. (2009) used hydromechanical modeling
NGWA.org Vol. 51, No. 4–Groundwater–July-August 2013 (pages 525–538) 525
(A)
(B) (c)
Figure 1. (A) Location and magnitude of induced earthquakes associated with hazardous waste injection (blue squares) aswell as Holocene/Anthropocene earthquakes (red circles) for the midcontinent region, United States (modified from Wheelerand Cramer, 2002; Nicholson and Wesson, 1999; Horton et al. 2012). The magnitude of the earthquakes is proportional to thesymbol size (see legend). Note that while many earthquakes occurred near the injection wells, only the largest induced seismicevent is plotted. Lines indicate orientation of horizontal principal stress (σ 1; after Zoback and Zoback 1989; Heidbach et al.2010). The density and locations of reinjection wells can be inferred from the distribution on current oil (green circles) and gas(blue triangles) wells (source: www.bakerhughes.com). The location of the CO2 injection well near Decatur Illinois is shown bythe yellow triangle. (B) Well-head injection pressure and injection depth for known sites having induced earthquakes (square,triangle, diamond, and circle symbols). The lithostatic pressure gradient (red line) denotes the vertical stress associated withthe weight of the rock column (23 MPa/km). The hydrostatic pressure gradient (10 MPa/km) reflects static fluid pressure (blueline). The frac gradient is assumed to be 80% of the lithostatic pressure gradient (orange line). The dashed lines in (B) denotethe critical pressures (see Equation 4) for three different values of α. (C) Plot of head increases required for failure for thethree values of α plotted in (B).
to argue that the Wenchuan earthquake was caused byfilling of the nearby Zipingpu dam (�h ∼ 100 m), located5.5 km from the epicenter. Ge et al. (2009) estimatedthat filling of the dam only resulted in a head change of2.5–5 m (0.025–0.05 MPa) at a depth of 10–20 km belowthe land surface near the earthquake foci. Saar and Manga(2003) also concluded that small head changes (about 1 mor 0.01 MPa) were required to induce earthquake swarms4.5 km below Mt. Hood, Oregon. The head changes at
depth were thought to be the result of propagation ofnear-surface, seasonal, 10 m water table fluctuations. Lessis known about pore pressure changes associated withthe recent earthquakes near Guy, Arkansas (Horton 2012)and Youngstown, Ohio, related to brine injection fromunconventional energy development. Little information isavailable regarding the pressure conditions at the earth-quake hypocenters, located up to 10 km away from theinjection wells. Although most of the induced earthquakes
526 Y. Zhang et al. Groundwater 51, no. 4: 525–538 NGWA.org
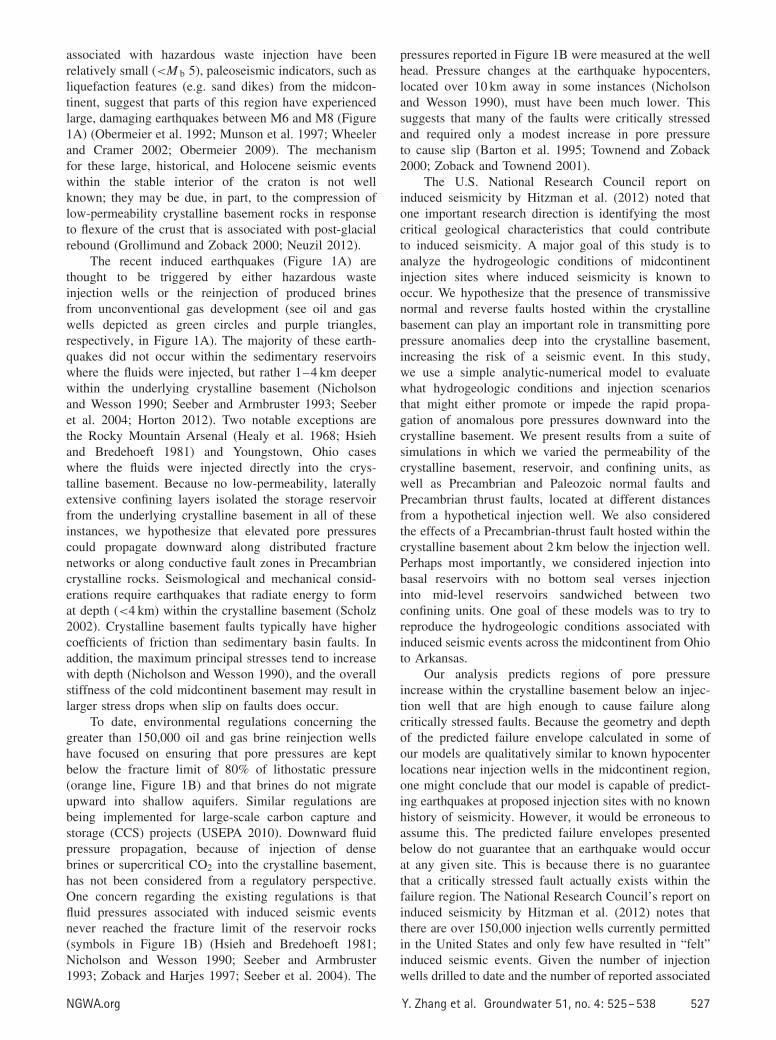
associated with hazardous waste injection have beenrelatively small (<M b 5), paleoseismic indicators, such asliquefaction features (e.g. sand dikes) from the midcon-tinent, suggest that parts of this region have experiencedlarge, damaging earthquakes between M6 and M8 (Figure1A) (Obermeier et al. 1992; Munson et al. 1997; Wheelerand Cramer 2002; Obermeier 2009). The mechanismfor these large, historical, and Holocene seismic eventswithin the stable interior of the craton is not wellknown; they may be due, in part, to the compression oflow-permeability crystalline basement rocks in responseto flexure of the crust that is associated with post-glacialrebound (Grollimund and Zoback 2000; Neuzil 2012).
The recent induced earthquakes (Figure 1A) arethought to be triggered by either hazardous wasteinjection wells or the reinjection of produced brinesfrom unconventional gas development (see oil and gaswells depicted as green circles and purple triangles,respectively, in Figure 1A). The majority of these earth-quakes did not occur within the sedimentary reservoirswhere the fluids were injected, but rather 1–4 km deeperwithin the underlying crystalline basement (Nicholsonand Wesson 1990; Seeber and Armbruster 1993; Seeberet al. 2004; Horton 2012). Two notable exceptions arethe Rocky Mountain Arsenal (Healy et al. 1968; Hsiehand Bredehoeft 1981) and Youngstown, Ohio caseswhere the fluids were injected directly into the crys-talline basement. Because no low-permeability, laterallyextensive confining layers isolated the storage reservoirfrom the underlying crystalline basement in all of theseinstances, we hypothesize that elevated pore pressurescould propagate downward along distributed fracturenetworks or along conductive fault zones in Precambriancrystalline rocks. Seismological and mechanical consid-erations require earthquakes that radiate energy to format depth (<4 km) within the crystalline basement (Scholz2002). Crystalline basement faults typically have highercoefficients of friction than sedimentary basin faults. Inaddition, the maximum principal stresses tend to increasewith depth (Nicholson and Wesson 1990), and the overallstiffness of the cold midcontinent basement may result inlarger stress drops when slip on faults does occur.
To date, environmental regulations concerning thegreater than 150,000 oil and gas brine reinjection wellshave focused on ensuring that pore pressures are keptbelow the fracture limit of 80% of lithostatic pressure(orange line, Figure 1B) and that brines do not migrateupward into shallow aquifers. Similar regulations arebeing implemented for large-scale carbon capture andstorage (CCS) projects (USEPA 2010). Downward fluidpressure propagation, because of injection of densebrines or supercritical CO2 into the crystalline basement,has not been considered from a regulatory perspective.One concern regarding the existing regulations is thatfluid pressures associated with induced seismic eventsnever reached the fracture limit of the reservoir rocks(symbols in Figure 1B) (Hsieh and Bredehoeft 1981;Nicholson and Wesson 1990; Seeber and Armbruster1993; Zoback and Harjes 1997; Seeber et al. 2004). The
pressures reported in Figure 1B were measured at the wellhead. Pressure changes at the earthquake hypocenters,located over 10 km away in some instances (Nicholsonand Wesson 1990), must have been much lower. Thissuggests that many of the faults were critically stressedand required only a modest increase in pore pressureto cause slip (Barton et al. 1995; Townend and Zoback2000; Zoback and Townend 2001).
The U.S. National Research Council report oninduced seismicity by Hitzman et al. (2012) noted thatone important research direction is identifying the mostcritical geological characteristics that could contributeto induced seismicity. A major goal of this study is toanalyze the hydrogeologic conditions of midcontinentinjection sites where induced seismicity is known tooccur. We hypothesize that the presence of transmissivenormal and reverse faults hosted within the crystallinebasement can play an important role in transmitting porepressure anomalies deep into the crystalline basement,increasing the risk of a seismic event. In this study,we use a simple analytic-numerical model to evaluatewhat hydrogeologic conditions and injection scenariosthat might either promote or impede the rapid propa-gation of anomalous pore pressures downward into thecrystalline basement. We present results from a suite ofsimulations in which we varied the permeability of thecrystalline basement, reservoir, and confining units, aswell as Precambrian and Paleozoic normal faults andPrecambrian thrust faults, located at different distancesfrom a hypothetical injection well. We also consideredthe effects of a Precambrian-thrust fault hosted within thecrystalline basement about 2 km below the injection well.Perhaps most importantly, we considered injection intobasal reservoirs with no bottom seal verses injectioninto mid-level reservoirs sandwiched between twoconfining units. One goal of these models was to try toreproduce the hydrogeologic conditions associated withinduced seismic events across the midcontinent from Ohioto Arkansas.
Our analysis predicts regions of pore pressureincrease within the crystalline basement below an injec-tion well that are high enough to cause failure alongcritically stressed faults. Because the geometry and depthof the predicted failure envelope calculated in some ofour models are qualitatively similar to known hypocenterlocations near injection wells in the midcontinent region,one might conclude that our model is capable of predict-ing earthquakes at proposed injection sites with no knownhistory of seismicity. However, it would be erroneous toassume this. The predicted failure envelopes presentedbelow do not guarantee that an earthquake would occurat any given site. This is because there is no guaranteethat a critically stressed fault actually exists within thefailure region. The National Research Council’s report oninduced seismicity by Hitzman et al. (2012) notes thatthere are over 150,000 injection wells currently permittedin the United States and only few have resulted in “felt”induced seismic events. Given the number of injectionwells drilled to date and the number of reported associated
NGWA.org Y. Zhang et al. Groundwater 51, no. 4: 525–538 527
induced seismic events, the probability is actually quitelow that a felt earthquake would occur at any given site.
Because the focus of this study is the Midcontinentregion, United States, where several induced earth-quakes have occurred recently, our analysis considershydrogeologic conditions within the Illinois Basin.The southern Illinois Basin hosts the Wabash ValleySeismic Zone, where paleoseismic indicators suggestthat a number of large (M6–M7.9) earthquakes haveoccurred in the past 12,000 years (Figure 1A). TheIllinois Basin hosts a thick sequence of laterally extensiveCambrian-Ordovician sheet sandstones and carbonates,along with three shale-rich confining units. Many ofthe strata found in the Illinois Basin exist across theMidcontinent region, although the formation names maychange. The basal Mount Simon Sandstone is considereda primary target for geologic carbon sequestration inthe Illinois Basin and throughout the Midwest region(Person et al. 2010). The first demonstration-scale, salineformation carbon capture, and storage project in theUnited States with injection of 1 million mt supercriticalCO2 over a 3-year period commenced in November,2011, with injection into the Mount Simon Sandstoneat Decatur, Illinois (see triangle, Figure 1A; http://www.fossil.energy.gov/news/techlines/2012/12056-Carbon_Storage_Partner_Completes_F.html). This formation isunderlain by granitic rocks of the Precambrian crystallinebasement complex (McBride et al. 2007).
The regional stress state in the midcontinent area ischaracterized primarily by strike-slip to reverse faulting(Figure 1A). Under these conditions, the vertical loadrepresents the intermediate principal stress. The maximumhorizontal stress is oriented northeast to east across themidcontinent (Figure 1A) (Zoback and Zoback 1989;Heidbach et al. 2010). A series of deep basement faultsassociated with historic and induced seismic events inthis region have been identified by Seeber et al. (2004);McBride et al. (2007), and Horton (2012).
Methods
Transport EquationsThe calculation of head or pore pressure changes
and rock failure analysis associated with hazardous-waste injection, CCS, or engineered geothermal systemstypically requires the use of computationally expensive,three-dimensional (Burbey 2006), multiphysics codes,such as FEHM (Kelkar et al. 2012) and TOUGH2-FLAC(Rutqvist et al. 2007). The calculations usually includeclose coupling between fluid flow, heat transfer, andgeomechanics. If multiple fault zones are considered,these codes likely require implementation on high-performance computers. Following the approach of Celiaand Nordbotten (2009), we have developed a hybridanalytical-numerical, cross-sectional model, which honorsthe linear feature of the fault zones, as well as theradial pressure change patterns associated with hazardouswaste/supercritical CO2 injection wells within reservoirs.
In this study, we consider a single injection well. Becauseof the short time-scale (10 years) and the high pressurechanges considered, we neglect variable-density fluid-floweffects that could be important on longer time-scales afterinjection has ceased.
The mathematical model for groundwater flow infault zones, the Precambrian crystalline basement, andsedimentary rock layers (excluding the injection reservoir)is given by:
∂
∂x
[Kx
∂h
∂x
]+ ∂
∂z
[Kz
∂h
∂z
]= Ss
∂h
∂t(1)
where x and z are the horizontal and vertical coordi-nates, respectively, S s is the specific storage, h is thehydraulic head, t is time, and Kx and Kz are hydraulicconductivities in the horizontal and vertical directions,respectively. Equation 1 represents single-phase flowin a two-dimensional, cross-sectional, Cartesian coor-dinate system. This coordinate system was chosenbecause faults are long-linear features that are notwell represented in a radial coordinate system. In mostinstances, vertical flow dominates outside of the injectionreservoir.
We used the analytical solution of Hantush (1960) tocalculate deviatoric heads within the reservoir. Hydraulichead increases within a reservoir near a single injectionwell are characterized by radial flow. The governinggroundwater flow equation solved by Hantush (1960) isgiven by:
1
r
∂s
∂r+ ∂2s
∂r2− K1
T
∂s1
∂z− K2
T
∂s2
∂z= S
T
∂s
∂t(2)
where T is transmissivity of the reservoir (T = Kb, whereb is the thickness of the formation); s is the head changeabove hydrostatic conditions in the reservoir; K 1 and K 2
are the vertical hydraulic conductivities of the upper andlower confining units, respectively; s1 and s2 are the headchanges in the upper and lower confining layers at theinterface between the reservoir and the confining units,respectively; S is the storage coefficient (S = Ssb); and ris radial distance from the injection well. This solutionpermits leakage across semipermeable top and bottomconfining units. In order to calculate leakage out of thereservoir, Hantush (1960) solved two vertical diffusionequations within the upper and lower confining units:
∂2s1
∂z2= S
′
b1K1
∂s
∂t
∂2s2
∂z2= S
′ ′
b2K2
∂s
∂t(3)
where S′s and S”
s are the specific storage coefficients withinthe upper and lower confining units, respectively. Hantush(1960) found an analytical solution for Equations 2 and 3subject to a specified hydrostatic head boundary conditionabove the upper confining unit and either a hydrostatichead or a no-flux boundary at the base of the lowerconfining layer (see Supporting Information).
528 Y. Zhang et al. Groundwater 51, no. 4: 525–538 NGWA.org
Solution Schemes, Boundary, and Initial ConditionsWe solved Equation 1 using the finite element method
(Reddy 1984). We used the solutions to Equations 2 and3 as specified value boundary conditions throughout theinjection reservoir. In this way, the radial behavior ofhead change propagation is captured analytically, whilethe Cartesian behavior, including head change propagationalong the faults and in the crystalline basement, iscaptured with the finite element solution. We set the timestep of the finite element model to 1 d and ran the modelfor 3650 d (10 years). This covers the time lag between theonset of injection and the timing of induced earthquakesreported by Nicholson et al. (1988), Nicholson andWesson (1990), and Seeber et al. (2004). The stratigraphicunits are discretized by triangular elements in a Cartesiancoordinate system; this preserves the linear feature ofthe fault zones. Faults tend to have anisotropic hydraulicproperties because of the formation of fault gouge anddamage zones in crystalline basement rock or lithifiedsediments (Caine et al. 1996) and clay and sand smearingin unlithified sediments (Bense and Person 2006). Thenormal fault zone was 2 m wide, and the thrust fault was10 m wide. Two elements were used to represent the faultzone in an equivalent, porous medium representation. Thevertical and horizontal permeabilities of the fault zoneswere varied. The model domain was discretized into 3381nodes and 6528 triangular elements. Element size variedfrom 1 to 800 m laterally and 10 to 300 m vertically.We used a telescoping grid with mesh refinement in thevicinity of the fault zone and the crystalline basement-sedimentary pile interface. The confining units weremore highly discretized to minimize numerical griddiffusion. By linking the radial and Cartesian coordinatesystems, our hybrid analytical-numerical model was ableto approximate hydrologic conditions in response toinjection into domains that included faults in two-spatialdimensions, which normally requires three-dimensionalanalysis. Our model was benchmarked, in part, byreproducing pressure change conditions for a single-wellinjection within a reservoir underlain by a thick bedrockunit using MODFLOW and by reproducing publishedmodel results from TOUGH2 for a multilayer, reservoir-confining-unit system by Birkholzer et al. (2009). Themodel results from Birkholzer et al. (2009) considersupercritical CO2 injection (see Supporting Information).
In solving Equation 1, the top boundary of the modeldomain was set to be hydrostatic (h = 2800 m). Thebottom of the solution domain was set to be a no-fluxboundary. Both sides of the solution domain were set tobe no-flux boundaries. We monitored calculated pressurechanges within formations adjacent to the injectionreservoirs and vertical fluxes out of the injection reservoirto ensure that the assumptions of the Hantush analyticalsolutions were honored (see Supporting Information).
Failure CriteriaWe used a simple failure criterion proposed
by Nicholson and Wesson (1990) for criticallystressed-cohesionless faults under a stress regime,
where the vertical stress (σ v) is of a similar magnitude tothe maximum horizontal stress (σ 1) (Lucier et al. 2006).Assuming a friction coefficient of 0.6, the critical porepressure for failure along a fault plane (P crit) is given by(Nicholson and Wesson 1990):
Pcrit = σv
2(3α − 1) (4)
where σ v is the vertical stress and α is the ratio ofthe minimum to maximum principal horizontal stress(σ 3/σ 1) (Jaeger and Cook 1979). This approach assumesthat the vertical load (here we assume 23 MPa/km) canapproximate the maximum principal stress, both of whichincrease with depth (Mark and Gadde 2008). In oursimulations, we used an α value of 0.63 that falls inthe middle of the range of stress measurements for themidcontinent region, reported by Lucier et al. (2006). Thisvalue was selected because it produced a predicted failureregion that is consistent with the distribution of earthquakehypocenters generated from induced historical seismicevents discussed below. This critical pressure includesboth hydrostatic pressure and any increase in pore pressureabove hydrostatic conditions as a result of pumping. Theeffect of the ratio of the minimum to maximum principalhorizontal stress on the predicted pore pressure increaseneeded to cause failure is illustrated in Figure 1B usingthree different values of α (dashed lines labeled α = 0.63,0.7, and 0.8). We have also plotted the equivalent headincreases (in m) with depth in Figure 1C (dashed) forthese three values of α. At 5 km depth, the head increaserequired to cause failure is equal to about 120 m, 1330, and3060 m for an α value of 0.63, 0.7, and 0.8, respectively.The edge of the failure region is where the computed porepressure equals P crit (Equation 4). Critically stressed faultswithin the failure region would be predicted to likely fail.A similar pressure criterion is used in FEHM to predictfault-plane failure (Kelkar et al. 2012). Our approachpermits rapid analysis of a wide range of hydrogeologicaland injection scenarios. The methods described here canbe modified for different geological conditions and rockproperties.
Hydrogeologic Framework ModelThe midcontinent hydrogeologic framework model
used in this study is based on stratigraphic (Figure 2A) andpermeability data (see boxplot, Figure 3) from the IllinoisBasin. The Illinois Basin is characterized by a Paleozoicsedimentary pile containing a series of siliciclastic andcarbonate reservoirs, separated by three major confiningunits (Eau Claire Formation, Maquoketa Shale, and NewAlbany Shale). Precambrian normal (Figure 2C) and thrust(Figure 2E) faults have been identified by seismic studies(McBride et al. 2007) and inferred by earthquake swarms(Nicholson and Wesson 1990; Horton 2012) that arethought to be associated with natural and induced seismicevents. Some of the normal faults cut the lower units ofthe sedimentary pile (Figure 2D), although displacementsare small and not represented here. Cambrian-Ordoviciansandstone and carbonate reservoirs were the focus of this
NGWA.org Y. Zhang et al. Groundwater 51, no. 4: 525–538 529
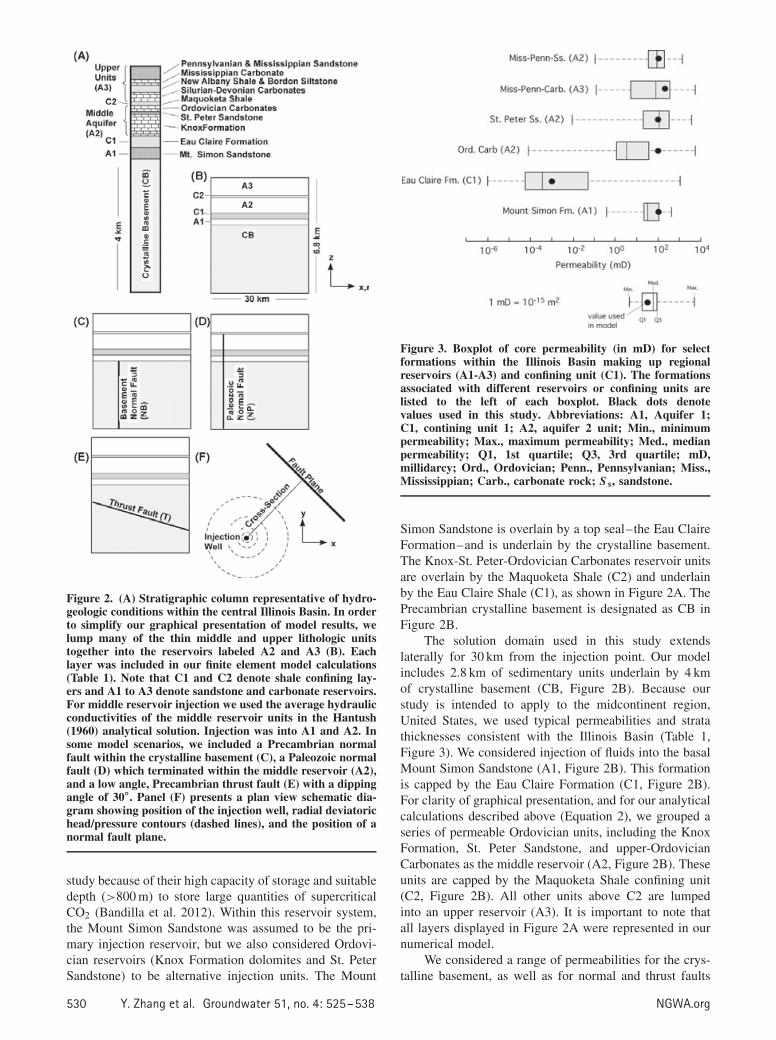
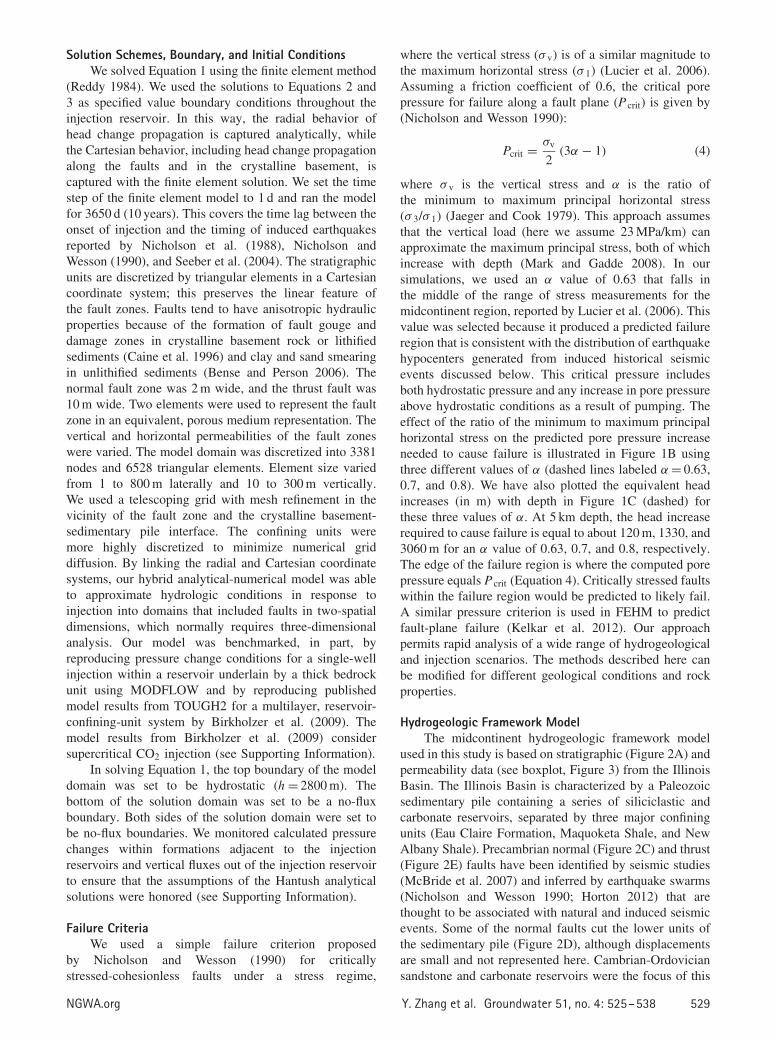
Figure 2. (A) Stratigraphic column representative of hydro-geologic conditions within the central Illinois Basin. In orderto simplify our graphical presentation of model results, welump many of the thin middle and upper lithologic unitstogether into the reservoirs labeled A2 and A3 (B). Eachlayer was included in our finite element model calculations(Table 1). Note that C1 and C2 denote shale confining lay-ers and A1 to A3 denote sandstone and carbonate reservoirs.For middle reservoir injection we used the average hydraulicconductivities of the middle reservoir units in the Hantush(1960) analytical solution. Injection was into A1 and A2. Insome model scenarios, we included a Precambrian normalfault within the crystalline basement (C), a Paleozoic normalfault (D) which terminated within the middle reservoir (A2),and a low angle, Precambrian thrust fault (E) with a dippingangle of 30◦. Panel (F) presents a plan view schematic dia-gram showing position of the injection well, radial deviatorichead/pressure contours (dashed lines), and the position of anormal fault plane.
study because of their high capacity of storage and suitabledepth (>800 m) to store large quantities of supercriticalCO2 (Bandilla et al. 2012). Within this reservoir system,the Mount Simon Sandstone was assumed to be the pri-mary injection reservoir, but we also considered Ordovi-cian reservoirs (Knox Formation dolomites and St. PeterSandstone) to be alternative injection units. The Mount
Figure 3. Boxplot of core permeability (in mD) for selectformations within the Illinois Basin making up regionalreservoirs (A1-A3) and confining unit (C1). The formationsassociated with different reservoirs or confining units arelisted to the left of each boxplot. Black dots denotevalues used in this study. Abbreviations: A1, Aquifer 1;C1, contining unit 1; A2, aquifer 2 unit; Min., minimumpermeability; Max., maximum permeability; Med., medianpermeability; Q1, 1st quartile; Q3, 3rd quartile; mD,millidarcy; Ord., Ordovician; Penn., Pennsylvanian; Miss.,Mississippian; Carb., carbonate rock; S s, sandstone.
Simon Sandstone is overlain by a top seal–the Eau ClaireFormation–and is underlain by the crystalline basement.The Knox-St. Peter-Ordovician Carbonates reservoir unitsare overlain by the Maquoketa Shale (C2) and underlainby the Eau Claire Shale (C1), as shown in Figure 2A. ThePrecambrian crystalline basement is designated as CB inFigure 2B.
The solution domain used in this study extendslaterally for 30 km from the injection point. Our modelincludes 2.8 km of sedimentary units underlain by 4 kmof crystalline basement (CB, Figure 2B). Because ourstudy is intended to apply to the midcontinent region,United States, we used typical permeabilities and stratathicknesses consistent with the Illinois Basin (Table 1,Figure 3). We considered injection of fluids into the basalMount Simon Sandstone (A1, Figure 2B). This formationis capped by the Eau Claire Formation (C1, Figure 2B).For clarity of graphical presentation, and for our analyticalcalculations described above (Equation 2), we grouped aseries of permeable Ordovician units, including the KnoxFormation, St. Peter Sandstone, and upper-OrdovicianCarbonates as the middle reservoir (A2, Figure 2B). Theseunits are capped by the Maquoketa Shale confining unit(C2, Figure 2B). All other units above C2 are lumpedinto an upper reservoir (A3). It is important to note thatall layers displayed in Figure 2A were represented in ournumerical model.
We considered a range of permeabilities for the crys-talline basement, as well as for normal and thrust faults
530 Y. Zhang et al. Groundwater 51, no. 4: 525–538 NGWA.org
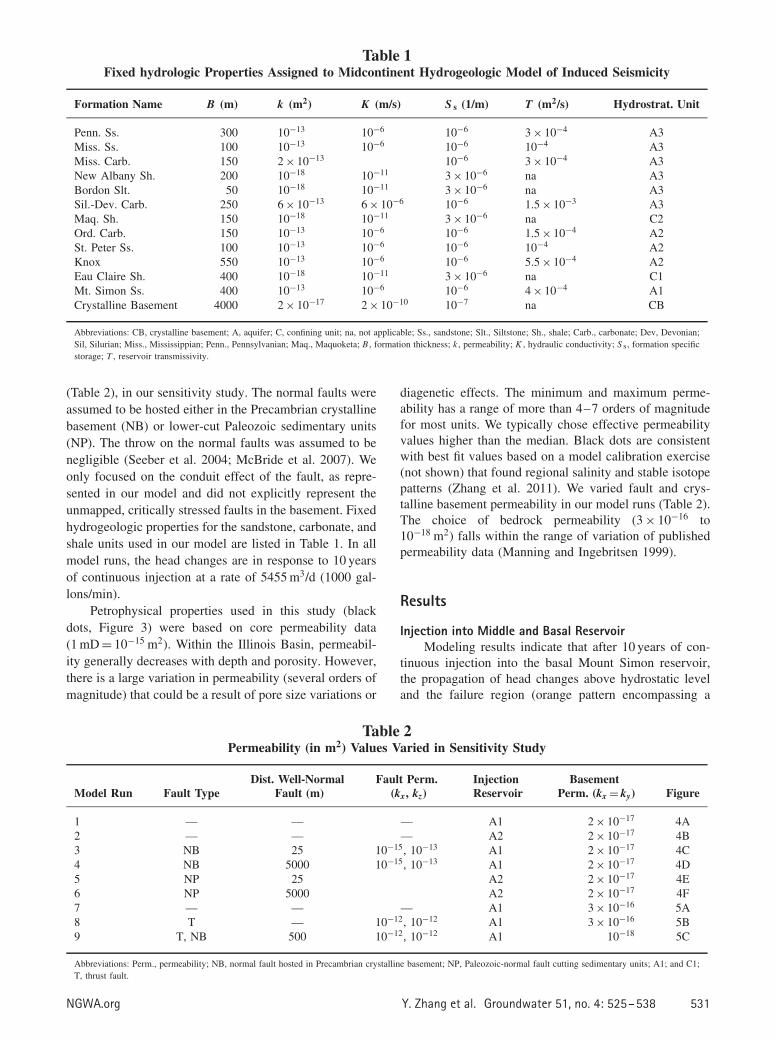
Table 1Fixed hydrologic Properties Assigned to Midcontinent Hydrogeologic Model of Induced Seismicity
Formation Name B (m) k (m2) K (m/s) S s (1/m) T (m2/s) Hydrostrat. Unit
Penn. Ss. 300 10−13 10−6 10−6 3 × 10⁻⁴ A3Miss. Ss. 100 10−13 10−6 10−6 10−4 A3Miss. Carb. 150 2 × 10⁻¹³ 10−6 3 × 10⁻⁴ A3New Albany Sh. 200 10−18 10−11 3 × 10⁻⁶ na A3Bordon Slt. 50 10−18 10−11 3 × 10⁻⁶ na A3Sil.-Dev. Carb. 250 6 × 10⁻¹³ 6 × 10⁻⁶ 10−6 1.5 × 10⁻³ A3Maq. Sh. 150 10−18 10−11 3 × 10⁻⁶ na C2Ord. Carb. 150 10−13 10−6 10−6 1.5 × 10⁻⁴ A2St. Peter Ss. 100 10−13 10−6 10−6 10−4 A2Knox 550 10−13 10−6 10−6 5.5 × 10⁻⁴ A2Eau Claire Sh. 400 10−18 10−11 3 × 10⁻⁶ na C1Mt. Simon Ss. 400 10−13 10−6 10−6 4 × 10⁻⁴ A1Crystalline Basement 4000 2 × 10⁻¹⁷ 2 × 10⁻¹⁰ 10−7 na CB
Abbreviations: CB, crystalline basement; A, aquifer; C, confining unit; na, not applicable; Ss., sandstone; Slt., Siltstone; Sh., shale; Carb., carbonate; Dev, Devonian;Sil, Silurian; Miss., Mississippian; Penn., Pennsylvanian; Maq., Maquoketa; B , formation thickness; k , permeability; K , hydraulic conductivity; S s, formation specificstorage; T , reservoir transmissivity.
(Table 2), in our sensitivity study. The normal faults wereassumed to be hosted either in the Precambrian crystallinebasement (NB) or lower-cut Paleozoic sedimentary units(NP). The throw on the normal faults was assumed to benegligible (Seeber et al. 2004; McBride et al. 2007). Weonly focused on the conduit effect of the fault, as repre-sented in our model and did not explicitly represent theunmapped, critically stressed faults in the basement. Fixedhydrogeologic properties for the sandstone, carbonate, andshale units used in our model are listed in Table 1. In allmodel runs, the head changes are in response to 10 yearsof continuous injection at a rate of 5455 m3/d (1000 gal-lons/min).
Petrophysical properties used in this study (blackdots, Figure 3) were based on core permeability data(1 mD = 10−15 m2). Within the Illinois Basin, permeabil-ity generally decreases with depth and porosity. However,there is a large variation in permeability (several orders ofmagnitude) that could be a result of pore size variations or
diagenetic effects. The minimum and maximum perme-ability has a range of more than 4–7 orders of magnitudefor most units. We typically chose effective permeabilityvalues higher than the median. Black dots are consistentwith best fit values based on a model calibration exercise(not shown) that found regional salinity and stable isotopepatterns (Zhang et al. 2011). We varied fault and crys-talline basement permeability in our model runs (Table 2).The choice of bedrock permeability (3 × 10⁻¹⁶ to10−18 m2) falls within the range of variation of publishedpermeability data (Manning and Ingebritsen 1999).
Results
Injection into Middle and Basal ReservoirModeling results indicate that after 10 years of con-
tinuous injection into the basal Mount Simon reservoir,the propagation of head changes above hydrostatic leveland the failure region (orange pattern encompassing a
Table 2Permeability (in m2) Values Varied in Sensitivity Study
Model Run Fault TypeDist. Well-Normal
Fault (m)Fault Perm.
(kx, kz)InjectionReservoir
BasementPerm. (kx = ky) Figure
1 — — — A1 2 × 10⁻¹⁷ 4A2 — — — A2 2 × 10⁻¹⁷ 4B3 NB 25 10−15, 10−13 A1 2 × 10⁻¹⁷ 4C4 NB 5000 10−15, 10−13 A1 2 × 10⁻¹⁷ 4D5 NP 25 A2 2 × 10⁻¹⁷ 4E6 NP 5000 A2 2 × 10⁻¹⁷ 4F7 — — — A1 3 × 10⁻¹⁶ 5A8 T — 10−12, 10−12 A1 3 × 10⁻¹⁶ 5B9 T, NB 500 10−12, 10−12 A1 10−18 5C
Abbreviations: Perm., permeability; NB, normal fault hosted in Precambrian crystalline basement; NP, Paleozoic-normal fault cutting sedimentary units; A1; and C1;T, thrust fault.
NGWA.org Y. Zhang et al. Groundwater 51, no. 4: 525–538 531
(A) (B)
(C) (D)
(E) (F)
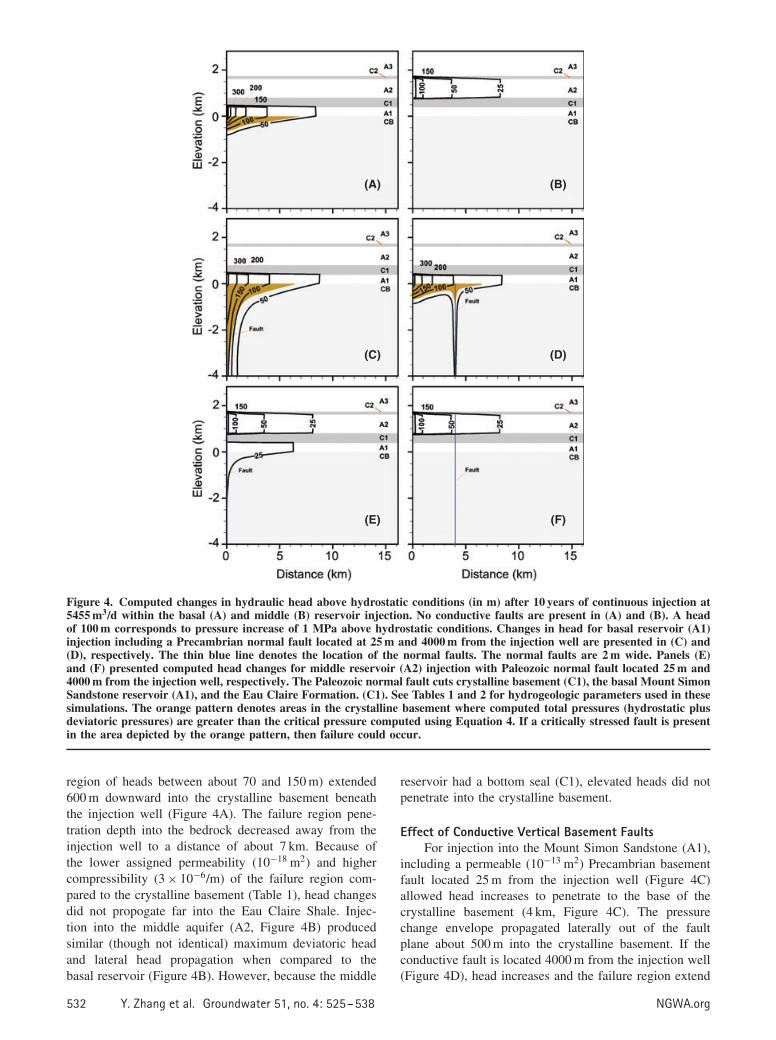
Figure 4. Computed changes in hydraulic head above hydrostatic conditions (in m) after 10 years of continuous injection at5455 m3/d within the basal (A) and middle (B) reservoir injection. No conductive faults are present in (A) and (B). A headof 100 m corresponds to pressure increase of 1 MPa above hydrostatic conditions. Changes in head for basal reservoir (A1)injection including a Precambrian normal fault located at 25 m and 4000 m from the injection well are presented in (C) and(D), respectively. The thin blue line denotes the location of the normal faults. The normal faults are 2 m wide. Panels (E)and (F) presented computed head changes for middle reservoir (A2) injection with Paleozoic normal fault located 25 m and4000 m from the injection well, respectively. The Paleozoic normal fault cuts crystalline basement (C1), the basal Mount SimonSandstone reservoir (A1), and the Eau Claire Formation. (C1). See Tables 1 and 2 for hydrogeologic parameters used in thesesimulations. The orange pattern denotes areas in the crystalline basement where computed total pressures (hydrostatic plusdeviatoric pressures) are greater than the critical pressure computed using Equation 4. If a critically stressed fault is presentin the area depicted by the orange pattern, then failure could occur.
region of heads between about 70 and 150 m) extended600 m downward into the crystalline basement beneaththe injection well (Figure 4A). The failure region pene-tration depth into the bedrock decreased away from theinjection well to a distance of about 7 km. Because ofthe lower assigned permeability (10−18 m2) and highercompressibility (3 × 10⁻⁶/m) of the failure region com-pared to the crystalline basement (Table 1), head changesdid not propogate far into the Eau Claire Shale. Injec-tion into the middle aquifer (A2, Figure 4B) producedsimilar (though not identical) maximum deviatoric headand lateral head propagation when compared to thebasal reservoir (Figure 4B). However, because the middle
reservoir had a bottom seal (C1), elevated heads did notpenetrate into the crystalline basement.
Effect of Conductive Vertical Basement FaultsFor injection into the Mount Simon Sandstone (A1),
including a permeable (10−13 m2) Precambrian basementfault located 25 m from the injection well (Figure 4C)allowed head increases to penetrate to the base of thecrystalline basement (4 km, Figure 4C). The pressurechange envelope propagated laterally out of the faultplane about 500 m into the crystalline basement. If theconductive fault is located 4000 m from the injection well(Figure 4D), head increases and the failure region extend
532 Y. Zhang et al. Groundwater 51, no. 4: 525–538 NGWA.org
down the fault zone 1000 m into the crystalline basement(Figure 4D). These increased heads are relatively small(between 60 and 160 m), yet could produce failure along acritically stressed fault for the value of α used (0.63). Ifa Paleozoic fault extends through the basal reservoir (A1)and the bottom seal (Eau Claire Formation confining unit,C2) at a distance of 25 m from the well and injectionis into the middle reservoir (A2), then increased headspropagate down along the Paleozoic fault through theEau Claire Formation into the Mount Simon Sandstoneand the Precambrian basement (Figure 4E). However,the head increases were too low (∼25 m) to produce aregion of failure. When the conductive Paleozoic fault islocated 4000 m from the well under the middle reservoirinjection scenario, the region of increased heads and thefailure region do not extend into the crystalline basement(Figure 4F).
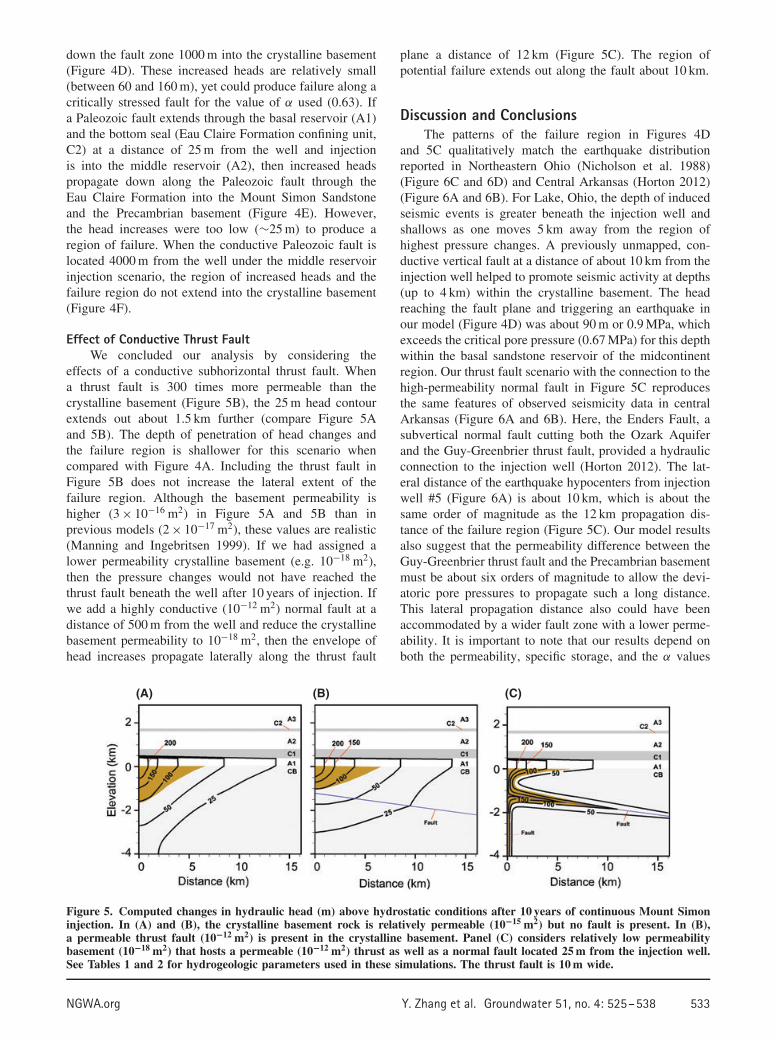
Effect of Conductive Thrust FaultWe concluded our analysis by considering the
effects of a conductive subhorizontal thrust fault. Whena thrust fault is 300 times more permeable than thecrystalline basement (Figure 5B), the 25 m head contourextends out about 1.5 km further (compare Figure 5Aand 5B). The depth of penetration of head changes andthe failure region is shallower for this scenario whencompared with Figure 4A. Including the thrust fault inFigure 5B does not increase the lateral extent of thefailure region. Although the basement permeability ishigher (3 × 10⁻¹⁶ m2) in Figure 5A and 5B than inprevious models (2 × 10⁻¹⁷ m2), these values are realistic(Manning and Ingebritsen 1999). If we had assigned alower permeability crystalline basement (e.g. 10−18 m2),then the pressure changes would not have reached thethrust fault beneath the well after 10 years of injection. Ifwe add a highly conductive (10−12 m2) normal fault at adistance of 500 m from the well and reduce the crystallinebasement permeability to 10−18 m2, then the envelope ofhead increases propagate laterally along the thrust fault
plane a distance of 12 km (Figure 5C). The region ofpotential failure extends out along the fault about 10 km.
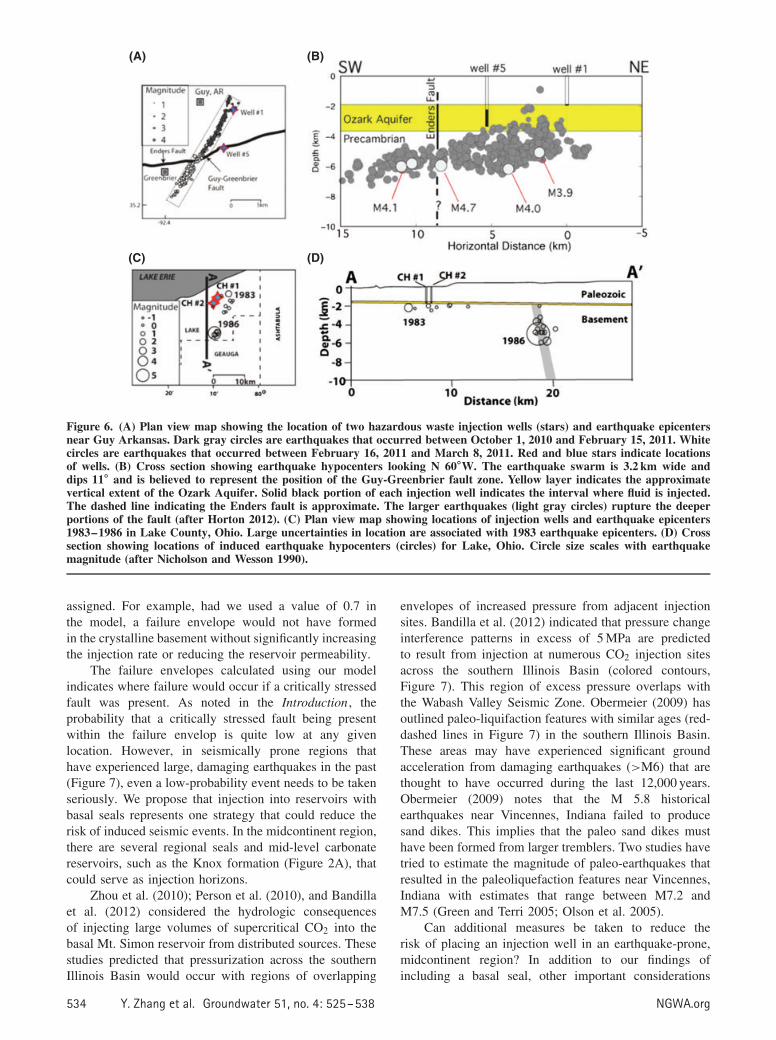
Discussion and ConclusionsThe patterns of the failure region in Figures 4D
and 5C qualitatively match the earthquake distributionreported in Northeastern Ohio (Nicholson et al. 1988)(Figure 6C and 6D) and Central Arkansas (Horton 2012)(Figure 6A and 6B). For Lake, Ohio, the depth of inducedseismic events is greater beneath the injection well andshallows as one moves 5 km away from the region ofhighest pressure changes. A previously unmapped, con-ductive vertical fault at a distance of about 10 km from theinjection well helped to promote seismic activity at depths(up to 4 km) within the crystalline basement. The headreaching the fault plane and triggering an earthquake inour model (Figure 4D) was about 90 m or 0.9 MPa, whichexceeds the critical pore pressure (0.67 MPa) for this depthwithin the basal sandstone reservoir of the midcontinentregion. Our thrust fault scenario with the connection to thehigh-permeability normal fault in Figure 5C reproducesthe same features of observed seismicity data in centralArkansas (Figure 6A and 6B). Here, the Enders Fault, asubvertical normal fault cutting both the Ozark Aquiferand the Guy-Greenbrier thrust fault, provided a hydraulicconnection to the injection well (Horton 2012). The lat-eral distance of the earthquake hypocenters from injectionwell #5 (Figure 6A) is about 10 km, which is about thesame order of magnitude as the 12 km propagation dis-tance of the failure region (Figure 5C). Our model resultsalso suggest that the permeability difference between theGuy-Greenbrier thrust fault and the Precambrian basementmust be about six orders of magnitude to allow the devi-atoric pore pressures to propagate such a long distance.This lateral propagation distance also could have beenaccommodated by a wider fault zone with a lower perme-ability. It is important to note that our results depend onboth the permeability, specific storage, and the α values
(A) (B) (C)
Figure 5. Computed changes in hydraulic head (m) above hydrostatic conditions after 10 years of continuous Mount Simoninjection. In (A) and (B), the crystalline basement rock is relatively permeable (10−15 m2) but no fault is present. In (B),a permeable thrust fault (10−12 m2) is present in the crystalline basement. Panel (C) considers relatively low permeabilitybasement (10−18 m2) that hosts a permeable (10−12 m2) thrust as well as a normal fault located 25 m from the injection well.See Tables 1 and 2 for hydrogeologic parameters used in these simulations. The thrust fault is 10 m wide.
NGWA.org Y. Zhang et al. Groundwater 51, no. 4: 525–538 533
(A) (B)
(C) (D)
Figure 6. (A) Plan view map showing the location of two hazardous waste injection wells (stars) and earthquake epicentersnear Guy Arkansas. Dark gray circles are earthquakes that occurred between October 1, 2010 and February 15, 2011. Whitecircles are earthquakes that occurred between February 16, 2011 and March 8, 2011. Red and blue stars indicate locationsof wells. (B) Cross section showing earthquake hypocenters looking N 60◦W. The earthquake swarm is 3.2 km wide anddips 11◦ and is believed to represent the position of the Guy-Greenbrier fault zone. Yellow layer indicates the approximatevertical extent of the Ozark Aquifer. Solid black portion of each injection well indicates the interval where fluid is injected.The dashed line indicating the Enders fault is approximate. The larger earthquakes (light gray circles) rupture the deeperportions of the fault (after Horton 2012). (C) Plan view map showing locations of injection wells and earthquake epicenters1983–1986 in Lake County, Ohio. Large uncertainties in location are associated with 1983 earthquake epicenters. (D) Crosssection showing locations of induced earthquake hypocenters (circles) for Lake, Ohio. Circle size scales with earthquakemagnitude (after Nicholson and Wesson 1990).
assigned. For example, had we used a value of 0.7 inthe model, a failure envelope would not have formedin the crystalline basement without significantly increasingthe injection rate or reducing the reservoir permeability.
The failure envelopes calculated using our modelindicates where failure would occur if a critically stressedfault was present. As noted in the Introduction , theprobability that a critically stressed fault being presentwithin the failure envelop is quite low at any givenlocation. However, in seismically prone regions thathave experienced large, damaging earthquakes in the past(Figure 7), even a low-probability event needs to be takenseriously. We propose that injection into reservoirs withbasal seals represents one strategy that could reduce therisk of induced seismic events. In the midcontinent region,there are several regional seals and mid-level carbonatereservoirs, such as the Knox formation (Figure 2A), thatcould serve as injection horizons.
Zhou et al. (2010); Person et al. (2010), and Bandillaet al. (2012) considered the hydrologic consequencesof injecting large volumes of supercritical CO2 into thebasal Mt. Simon reservoir from distributed sources. Thesestudies predicted that pressurization across the southernIllinois Basin would occur with regions of overlapping
envelopes of increased pressure from adjacent injectionsites. Bandilla et al. (2012) indicated that pressure changeinterference patterns in excess of 5 MPa are predictedto result from injection at numerous CO2 injection sitesacross the southern Illinois Basin (colored contours,Figure 7). This region of excess pressure overlaps withthe Wabash Valley Seismic Zone. Obermeier (2009) hasoutlined paleo-liquifaction features with similar ages (red-dashed lines in Figure 7) in the southern Illinois Basin.These areas may have experienced significant groundacceleration from damaging earthquakes (>M6) that arethought to have occurred during the last 12,000 years.Obermeier (2009) notes that the M 5.8 historicalearthquakes near Vincennes, Indiana failed to producesand dikes. This implies that the paleo sand dikes musthave been formed from larger tremblers. Two studies havetried to estimate the magnitude of paleo-earthquakes thatresulted in the paleoliquefaction features near Vincennes,Indiana with estimates that range between M7.2 andM7.5 (Green and Terri 2005; Olson et al. 2005).
Can additional measures be taken to reduce therisk of placing an injection well in an earthquake-prone,midcontinent region? In addition to our findings ofincluding a basal seal, other important considerations
534 Y. Zhang et al. Groundwater 51, no. 4: 525–538 NGWA.org
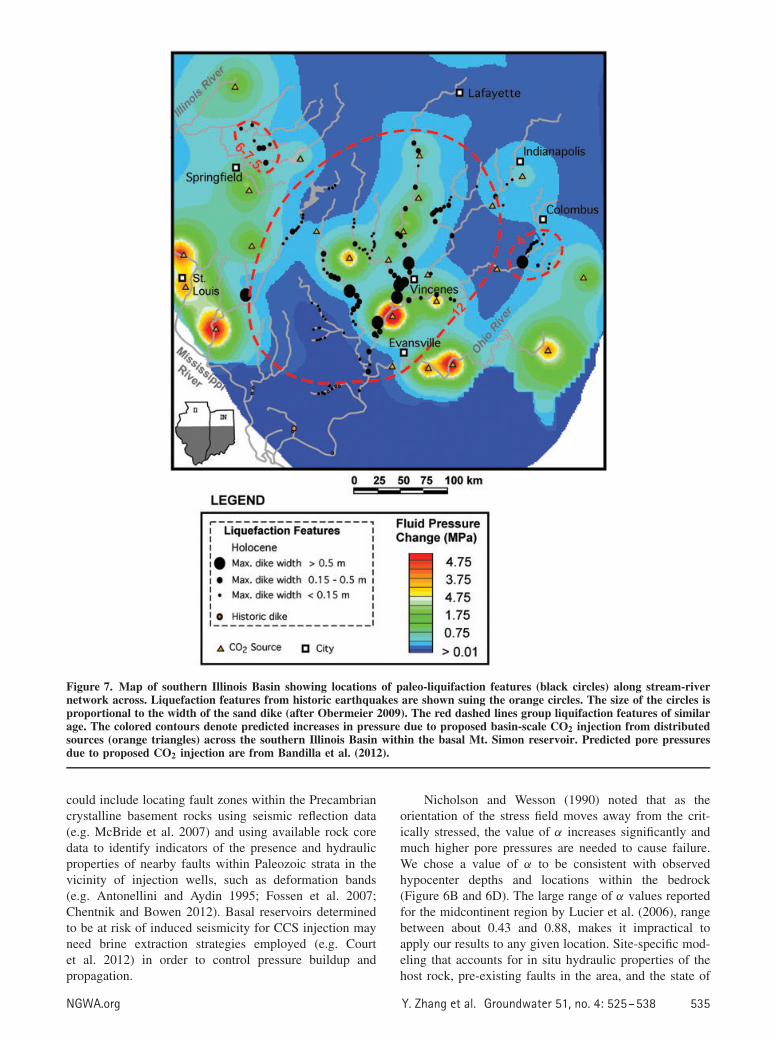
Figure 7. Map of southern Illinois Basin showing locations of paleo-liquifaction features (black circles) along stream-rivernetwork across. Liquefaction features from historic earthquakes are shown suing the orange circles. The size of the circles isproportional to the width of the sand dike (after Obermeier 2009). The red dashed lines group liquifaction features of similarage. The colored contours denote predicted increases in pressure due to proposed basin-scale CO2 injection from distributedsources (orange triangles) across the southern Illinois Basin within the basal Mt. Simon reservoir. Predicted pore pressuresdue to proposed CO2 injection are from Bandilla et al. (2012).
could include locating fault zones within the Precambriancrystalline basement rocks using seismic reflection data(e.g. McBride et al. 2007) and using available rock coredata to identify indicators of the presence and hydraulicproperties of nearby faults within Paleozoic strata in thevicinity of injection wells, such as deformation bands(e.g. Antonellini and Aydin 1995; Fossen et al. 2007;Chentnik and Bowen 2012). Basal reservoirs determinedto be at risk of induced seismicity for CCS injection mayneed brine extraction strategies employed (e.g. Courtet al. 2012) in order to control pressure buildup andpropagation.
Nicholson and Wesson (1990) noted that as theorientation of the stress field moves away from the crit-ically stressed, the value of α increases significantly andmuch higher pore pressures are needed to cause failure.We chose a value of α to be consistent with observedhypocenter depths and locations within the bedrock(Figure 6B and 6D). The large range of α values reportedfor the midcontinent region by Lucier et al. (2006), rangebetween about 0.43 and 0.88, makes it impractical toapply our results to any given location. Site-specific mod-eling that accounts for in situ hydraulic properties of thehost rock, pre-existing faults in the area, and the state of
NGWA.org Y. Zhang et al. Groundwater 51, no. 4: 525–538 535
stress at the locality would be needed to make any mean-ingful predictions of the potential for induced seismicityat a given location. Important insights might be gainedfrom post-audit studies of induced seismic events usingthree-dimensional, geomechanical-hydrologic models.
Using the hydrologic (Table 1) and mechanical(α = 0.63) parameters reported above, we found thatfailure was induced when computed hydraulic heads wereabout 70–150 m (0.7–1.5 MPa) above hydrostatic levelsat a depth of 1–4 km below the reservoir-crystallinebedrock interface. Changes in pressure in our model weregreater than those reported by Ge et al. (2009) and Saarand Manga (2003) but less than those reported for theRocky Mountain Arsenal (Hsieh and Bredehoeft 1981;320 m).
We have shown that the presence of a basal sealhas a potentially important effect on reducing pressureincreases in the crystalline basement, decreasing the riskof an induced seismic event. While many field sites inthe midcontinent support our hypothesis, we are awareof two possible exceptions to this rule in the WesternUnited States. Since 1991, the Bureau of Reclamationhas been injecting shallow, naturally occurring brineswithin Paradox Valley in western Colorado that wouldotherwise flow into the Colorado River (Ake et al. 2005;O’Connell and Creed 2013). A series of shallow salinityabatement pumping wells collected the brine and injectedit into the Leadville Limestone 4.3 km below land surface.Injection fluid pressures reached 82 MPa and induced upto 4000 earthquakes up to 3 km from the wellhead. Thelargest induced earthquake was M 4.3. The LeadvilleLimestone is underlain by Devonian and Cambrian strata.However, these authors indicate that the deep injectionwell was intentionally sited to intersect a highly fracturedregion of this formation in order to optimize fluidinjection rates. The well intersected the Wray Mesa faultsystem that has acted as one of the principal zones ofseismicity.
Meremonte et al. (2001) reported a close spatial corre-lation between the locations of a series of brine reinjectionwells associated with coal bed methane production andthe 2001 earthquake swarm (M3.4–M4.6) near Trinidad,CO. This same region experienced a M5.3 earthquake onAugust 23, 2011, the largest earthquake in Colorado since1967. The seismic events were thought to have occurredwithin the crystalline basement in close proximity towhere brines were injected into the Dakota Sandstone.The Dakota Sandstone is a midlevel reservoir at a depth ofabout 1.2 km. The Dakota is underlain by Pennsylvanian-and Permian-age Magdalena Groups and Sangre de CristoGroups that contain shale units. The base of the sedimen-tary units is about 1.8 km. The earthquake swarm occurredat a depth of between 3 and 6 km within crystallinebedrock. Given the stratigrapahy underlying the Dakota,we hypothesize that a transmissive fault must have facili-tated fluid transmission into the deep subsurface. We notethat both of these counterexamples are in more tectoni-cally active regions of the United States.
In summary, our study has shown that the majorityof the midcontinent induced seismic events are associatedwith basal reservoir injection in which no bottom sealwas present. The presence of conductive faults within thePrecambrian crystalline basement played a critical role inallowing increased pore pressures to propagate downward.Our numerical model results suggest that injecting intoa reservoir with both a bottom and top seal reduces thepotential risk of induced seismicity. Such a strategy shouldbe considered in areas that have experienced large seismicevents in the past.
AcknowledgmentThe authors gratefully acknowledge Paul Hsieh for
his thorough review of this manuscript and thoughtfulcomments. Carl Gable and Mark Person thank theDOE IGGP program for their support of this research.Tom Dewers was supported as part of the Center forFrontiers of Subsurface Energy Security, an EnergyFrontier Research Center funded by the U.S. Departmentof Energy, Office of Science, Basic Energy Sciencesunder Award Number DE-SC0001114. Sandia NationalLaboratories is a multi-program laboratory managedand operated by Sandia Corporation, a wholly ownedsubsidiary of Lockheed Martin Corporation, for theU.S. Department of Energy’s National Nuclear SecurityAdministration under contract DE-AC04-94AL85000.
Supporting InformationAdditional Supporting Information may be found in theonline version of this article:
Appendix S1. Discussion of Hantush analytic solution,model benchmark exercises, and verification of Hantushanalytical solution assumptionsFigure S1. Plot of Hantush (1960) well function H (u ,β)verses 1/u . The numbers on each line represent differentvalues of β.Figure S2. (A) Schematic diagram illustrating MOD-FLOW benchmark model domain geometry. The blueregion schematically denotes the area of elevated porepressures that are plotted in cross section in (B). (B)Comparison of computed head increases using MODFOW(solid black line) and our analytical-numerical model(red dashed lines) results assuming constant pumping for10 years. The parameters used in the model are listed inTable S1.Figure S3. (A) Cross-sectional schematic diagram show-ing geometry of reservoirs and confining units in a radialcoordinate system with injection into the basal reservoir atr = 0 m. Comparison of published computed (excess) fluidpressures above hydrostatic conditions using TOUGH2(solid black lines) and our hybrid analytical-numericalmodel (red dashed lines) due to fluid injection. Confiningunit permeability was between 10−17 m2 (B), 10−18 m2
(C), 10−19 m2 (D), and 10−20 m2 (E). Results are after
536 Y. Zhang et al. Groundwater 51, no. 4: 525–538 NGWA.org
30 years of continuous injection (after Birkholzer et al.2009).Table S1. Parameters used in MODFLOW benchmarkstudy.Table S2. Parameters used in TOUGH2 benchmarkexercise.
ReferencesAke, J., K. Mahrer, D. O’Connell, and L. Block. 2005. Deep-
injection and closely monitored induced seismicity atParadox Valley, Colorado. Bulletin of the SeismologicalSociety of America 95, no. 2: 664–683.
Antonellini, M., and A. Aydin. 1995. Effect of faulting onfluid flow in porous sandstones: Geometry and spatialdistribution. American Association of Petroleum GeologistsBulletin 79: 642–671.
Bandilla, K.W., M.A. Celia, T.R. Elliot, M. Person, K.M.Ellett, J.A. Rupp, C. Gable, and Y. Zhang. 2012. Modelingcarbon sequestration in the Illinois Basin using a vertically-integrated approach. Computing and Visualization inScience. In press.
Barton, C.A., M.D. Zoback, and D. Moos. 1995. Fluid flowalong potentially active faults in crystalline rock. Geology23: 683–686.
Bense, V.F., and M.A. Person. 2006. Faults as conduit-barriersystem to fluid flow in silicilastic sedimentary aquifers.Water Resources Research 42, no. 5: 1–18.
Birkholzer, J.T., Q. Zhou, and C.-F. Tsang. 2009. Large-scale impact of CO2 storage in deep saline aquifers:a sensitivity study on pressure response in stratifiedsystems. International Journal of Greenhouse Gas Control3: 181–194.
Burbey, T. 2006. Three-dimensional deformation and straininduced by municipal pumping, part 2:382 numericalanalysis. Journal of Hydrology 330, no. 3–4: 422–434.
Caine, J.S., J.P. Evans, and C.B. Forster. 1996. Fault zonearchitecture and permeability structure. Geology 24, no. 11:1025–1028.
Celia, M., and J.M. Nordbotten. 2009. Practical modelingapproaches for geological storage of carbon dioxide.Ground Water 47, no. 5: 627–638.
Chentnik, B.M., and B.B. Bowen. 2012. Characterizing fracturesand deformation bands. Journal of Purdue UndergraduateResearch 2: 8–15.
Court, B., K.W. Bandilla, M.A. Celia, T.A. Buscheck, J.M.Nordbotten, M. Dobossy, and A. Janzen. 2012. Ini-tial evaluation of advantageous synergies associated withsimultaneous brine production and CO2 geological seques-tration. International Journal of Greenhouse Gas Control8: 90–100.
Ellsworth, W.L., S.H. Hickman, A.L. Lleons, A. Mcgarr,A.J. Michael, and J.L. Rubinstein. 2012. Are seismicityrate changes in the midcontinent natural or manmade?(Abstract). Seismological Society of America Annual Meet-ing 83, no. 12: 137.
Fossen, H., R.A. Schultz, Z.K. Shipton, and K. Mair. 2007.Deformation bands in sandstone: A review. Journal of theGeological Society of London 164: 1–15.
Frohlich, C. 2012. Two-year survey comparing earthquake activ-ity and injection-well locations in the Barnett Shale, Texas.Proceedings of the National Academy of Sciences 109, no.35: 13934–13938. DOI:10.1073/pnas.1207728109.
Ge, S., M. Liu, N. Lu, J. Godt, and G. Luo. 2009. Didthe Zipingpu Reservoir trigger the 2008 Wenchuan earth-quake? Geophysical Research Letters 36, no. 20: 1–5.DOI:10.1029/2009GL040349.
Green, R., and G. Terri. 2005. Number of equivalent cyclesconcept for liquefaction evaluations—Revisited. Journal of
Geotechnical and Geoenvironmental Engineering 131, no.4: 477–488.
Grollimund, B., and M.D. Zoback. 2000. Post glacial litho-spheric flexure and induced stresses and pore pressurechanges in the northen North Sea. Tectonophysics 327:61–81.
Hantush, M.S. 1960. Modification of the theory of leakyaquifers. Journal of Geophysical Research 65, no. 11:3713–3732.
Healy, J.H., W.W. Rubey, D.T. Griggs, and C.B. Raleigh.1968. The Denver earthquakes. Science 161, no. 3848:1301–1310.
Heidbach, O., M. Tingay, A. Barth, J. Reinecker, D. Kurfeß, andB. Muuller. 2010. Global crustal stress pattern based on theWorld Stress Map database release 2008. Tectonophysics482, no. 2010: 3–15.
Hitzman, M.W., D.D. Clarke, E. Detournay, J.H. Deiterich,D.K. Dillon, S.J. Green, R.M. Habiger, R.K. McGuire,J.K. Mitchell, J.E. Shemeta, and J.L. Smith. 2012. InducedSeismicity Potential in Energy Technologies , 300. Washing-ton, DC: The National Academies Press. ISBN:978-0-309-25367–3.
Horton, S. 2012. Disposal of hydrofracking waste water fluidby injection into subsurface aquifers triggers earthquakeswarm in Central Arkansas with potential for damagingearthquake. Seismological Research Letters 83, no. 2:250–260.
Hsieh, P.A., and J.D. Bredehoeft. 1981. A reservoir analysisof the Denver earthquakes: A case of induced seismicity.Journal of Geophysical Research 86, no. 2: 903–920.
Jaeger, C.J., and N.G.W. Cook. 1979. Fundamentals of RockMechanics . London: Methuen.
Kelkar, S., K. Lewis, S. Hickman, N. C. Davatzes, D.Moos, and G. Zyvoloski. 2012. Modeling coupled thermal-hydrological-mechanical processes during shear stimulationof an EGS well. In Proceedings of Thirty-Seventh Workshopon Geothermal Reservoir Engineering , Stanford University,Stanford, California, SGP-TR-194.
Kerr, R.A., and R. Stone. 2009. A human trigger for the greatquake of Sichuan? Science 323: 322.
Lucier, A., M. Zoback, N. Gupta, and T.S. Ramakrishnan.2006. Geomechanical aspects of CO2 sequestration in adeep saline reservoir in the Ohio river valley region.Environmental Geoscience 13, no. 2: 85–103.
Manning, C.E., and S.E. Ingebritsen. 1999. Permeability of thecontinental crust: the implications of geothermal data andmetamorphic systems. Reviews of Geophysics 37: 127–150.
Mark, C., and M. Gadde. 2008. Global trends in coal minehorizontal stress measurements. In Proceedings 27th Inter-national Conference on Ground Control in Mining , ed. S.S.Peng, S.C. Tadolini, C. Mark, G.L. Finfinger, K.A. Heasley,A.W. Khair, and Y. Luo, 319–331. Morgantown, WV: WestVirginia University.
McBride, J.H., H.E. Leetaru, R.A. Bauer, B.E. Tingey, andS.E.A. Schmidt. 2007. Deep faulting and structural reac-tivation beneath the Southern Illinois Basin. PrecambrianResearch 15: 289–313.
Meremonte, M.E., J.C. Lahr, A.D. Frankel, J.W. Dewey,A.J. Crone, D.E. Overturf, D.L. Carver, and T.W. Bice.2001. Investigation of an earthquake swarm near Trinidad,CO. USGS, Open-File Report 02–0073, Reston, Virginia:USGS.
Munson, P., S.F. Obermeier, C.A. Munson, and E. Hajic. 1997.Liquefaction evidence for Holocene and Latest Pleistoceneseismicity in the southern halves of Indiana and Illinois: Apreliminary overview. Seismological Research Letters 68,no. 4: 521–536.
Neuzil, C.E.. 2012. Hydromechanical effects of continentalglaciation on groundwater systems. Geofluids 12: 22–37.
Nicholson, C., and R.L. Wesson. 1990. Earthquake hazardassociated with deep well injection: a report to the U.S.
NGWA.org Y. Zhang et al. Groundwater 51, no. 4: 525–538 537
Environmental Protection Agency. U.S. Geol. Sur. Bull.1951, Reston, Virginia: USGS.
Nicholson, C., E. Roeloffs, and R.L. Wesson. 1988. TheNortheastern Ohio earthquakes of 31 january 1986: Was itinduced? Bulletin of the Seismological Society of America78, no. 1: 188–217.
O’Connell, D., and R. Creed. 2013. Determining injection-induced earthquake magnitude and ground motionexceedance probability using Paradox Valley, Coloradoinjection and seismicity data including paratmetric sensi-tivities. In Proceeding of the Thirty-Eighth Workshop onGeothermal Reservoir Engineering , SGP-TR-198.
Obermeier, S.F. 2009. Using liquefaction-induced features andother soft-sediment features for paleoseismic analysis. InPaleoseismology , 2nd ed., ed. J.P. McCaplin, 497–564.Amsterdam: Elsevier.
Obermeier, S.F., P.J. Munson, C.A. Munson, J.R. Martin, A.D.Frankel, T.L. Youd, and E.C. Pond. 1992. Liquefactionevidence for strong holocene earthquake(s) in the WabashValley of Indiana–Illinois. Seismological Research Letters63: 321–335.
Olson, S.M., R.A. Green, and S.F. Obermeier. 2005. Revisedmagnitude-bound relation for the Wabash Valley seismiczone of the central United States. Seismological ResearchLetters 76, no. 6: 756–771.
Person, M., A. Banerjee, J. Rupp, C. Medina, P. Lichtner, C.Gable, R. Pawar, M. Celia, J. McIntosh, and V. Bense.2010. Assessment of basin-scale hydrologic impacts ofCO2 sequestration, Illinois Basin. International Journal ofGreenhouse Gas Control 4: 840–854.
Raleigh, C.B., J.H. Healy, and J.D. Bredehoeft. 1976. Anexperiment in earthquake control at Rangely, Colorado.Science 191: 1230–1237.
Raleigh, C.B., J.H. Healy, and J.D. Bredehoeft. 1972. Faultingand crustal stress at Rangely, Colorado. American Geophys-ical Union Geophysical Monograph Series 16: 275–284.
Reddy, J.N. 1984. An Introduction to the Finite Element Method .New York: McGraw Hill.
Rutqvist, J., J. Birkholzer, F. Cappa, and C.F. Tsang. 2007.Estimating maximum sustainable injection pressure duringgeological sequestration of CO2 using coupled fluid flowand geomechanical fault-slip analysis. Energy Conversionand Management 48: 1798–1807.
Saar, M.O., and M. Manga. 2003. Seismicity induced byseasonal groundwater recharge at Mt. Hood, Oregon. Earthand Planetary Science Letters 214: 605–618.
Scholz, C.H. 2002. The Mechanics of Earthquakes and Faulting .Cambridge: Cambridge University Press.
Seeber, L., J.G. Armbruster, and W.Y. Kim. 2004. A fluid-injection-triggered earthquake sequence in Ashtabula, Ohio:implications for seismogenesis in stable continental regions.Bulletin of the Seismological Society of America 94, no. 1:76–87.
Seeber, L., and J.G. Armbruster. 1993. Natural and induced seis-micity in the Lake Erie-Lake Ontario region: reactivationof ancient faults with little neotectonic displacement.Geographie physique et Quaternaire 47, no. 3: 363–378.
Townend, J., and M.D. Zoback. 2000. How faulting keeps thecrust strong. Geology 28: 399–402.
U.S. Environmental Protection Agency. 2010. Federal Require-ments Under the Underground Injection Control (UIC)Program for Carbon Dioxide (CO2) Geologic Seques-tration (GS) Wells, Federal Register , 75. FR 77230.http://www.federalregister.gov/articles/2010/12/10/2010-29954/federal-requirements-under-the-undergroundinjection-control-uic-program-for-carbon-dioxide-co2#h-34.
Wheeler, R.L., and C.H. Cramer. 2002. Updated seismic hazardin the Southern Illinois Basin—Geological and geophysicalfoundations for use in the 2002 USGS national seismichazard maps. Seismological Research Letters 73, no. 5:776–791.
Zhang, Y., M. Person, C. Gable, J. Rupp, K. Ellett, K. Bandilla,T. Elliot, and M. Celia. 2011. Multi-layer, sharp-interfacemodels of pore pressure buildup within the Illinois Basindue to basin-wide CO2 injection. In Paper Presented atthe Annual AGU Fall Meeting (Abstract), San Francisco,California, December 5–9.
Zhou, Q., J.T. Birkholzer, E. Mehnert, Y.F. Lin, and K. Zhang.2010. Modeling basin- and plume-scale processes of CO2storage for full-scale deployment. Ground Water 48, no. 4:494–514.
Zoback, M.D., and S.E. Gorelick. 2012. Earthquake trigger-ing and large-scale geologic storage of carbon diox-ide. Proceedings of the National Academy of Sciences .DOI:10.1073/pnas.1202473109.
Zoback, M.D., and J. Townend. 2001. Implications of hydrostaticpore pressures and high crustal strength for the deformationof intraplate lithosphere. Tectonophysics 336: 19–30.
Zoback, M.D., and H.P. Harjes. 1997. Injection-induced earth-quakes and crustal stress at 9 km depth at the KTB deepdrilling site, Germany. Journal of Geophysical Research102, no. B8: 18477–18491.
Zoback, M.D., and M.L. Zoback. 1989. Tectonic stress fieldof the conterminous United States. Geological Society ofAmerica Memoirs 172: 523–539.
538 Y. Zhang et al. Groundwater 51, no. 4: 525–538 NGWA.org
Related Documents