How Puerto Rico Became White: An Analysis of Racial Statistics in the 1910 and 1920 Censuses Mara Loveman Jeronimo Muniz University of Wisconsin, Madison University of Wisconsin, Madison Paper prepared for presentation at the Center for Demography and Ecology, University of Wisconsin-Madison February 7, 2006 Work in Progress. Please do not cite or quote without permission of the authors. Comments welcome! Please direct them to: [email protected] Abstract The gradual “whitening” of Puerto Rico over the course of the twentieth century is often noted in scholarly, journalistic, and popular descriptions of the island’s population. In 1899, a year after Puerto Rico came under U.S. dominion, the census reported that 62 percent of the population was white; by the year 2000, according to official census results, the white proportion of the Puerto Rican population reached 80 percent. Observers of Puerto Rican society have speculated about the sources of this trend, which is typically cited as evidence of the hold of “whitening ideology” on the island. To date, however, none of the hypothesized mechanisms of whitening have been subjected to empirical test. Using newly available public use samples of the 1910 and 1920 censuses of Puerto Rico, this paper explores three possible explanations for the growth in the white population according to official statistics: (1) demographic processes, (2) institutional bias of the Census Office, and (3) socio-cultural shifts in societal conceptions of race. We find little support for the first two hypotheses. The proportion of whites in the Puerto Rican population in 1920 is at least ten percent higher than would be expected due to natural rates of population growth. And it appears, somewhat surprisingly, that any institutional bias of the Puerto Rican Census Office worked to mitigate the magnitude of whitening in this period rather than contributing to it. We find that the statistical whitening of Puerto Rico between 1910 and 1920 is primarily due to changes in the social definition of whiteness. The children of interracial unions, in particular, were much more likely to be classified as white in 1920 than in 1910.

Welcome message from author
This document is posted to help you gain knowledge. Please leave a comment to let me know what you think about it! Share it to your friends and learn new things together.
Transcript

How Puerto Rico Became White: An Analysis of Racial Statistics in the 1910 and 1920 Censuses
Mara Loveman Jeronimo Muniz University of Wisconsin, Madison University of Wisconsin, Madison
Paper prepared for presentation at the Center for Demography and Ecology, University of Wisconsin-Madison
February 7, 2006
Work in Progress. Please do not cite or quote without permission of the authors.
Comments welcome!
Please direct them to: [email protected]
Abstract The gradual “whitening” of Puerto Rico over the course of the twentieth century
is often noted in scholarly, journalistic, and popular descriptions of the island’s population. In 1899, a year after Puerto Rico came under U.S. dominion, the census reported that 62 percent of the population was white; by the year 2000, according to official census results, the white proportion of the Puerto Rican population reached 80 percent. Observers of Puerto Rican society have speculated about the sources of this trend, which is typically cited as evidence of the hold of “whitening ideology” on the island. To date, however, none of the hypothesized mechanisms of whitening have been subjected to empirical test. Using newly available public use samples of the 1910 and 1920 censuses of Puerto Rico, this paper explores three possible explanations for the growth in the white population according to official statistics: (1) demographic processes, (2) institutional bias of the Census Office, and (3) socio-cultural shifts in societal conceptions of race. We find little support for the first two hypotheses. The proportion of whites in the Puerto Rican population in 1920 is at least ten percent higher than would be expected due to natural rates of population growth. And it appears, somewhat surprisingly, that any institutional bias of the Puerto Rican Census Office worked to mitigate the magnitude of whitening in this period rather than contributing to it. We find that the statistical whitening of Puerto Rico between 1910 and 1920 is primarily due to changes in the social definition of whiteness. The children of interracial unions, in particular, were much more likely to be classified as white in 1920 than in 1910.

2
Introduction
The idea that race is a social construction is by now conventional wisdom across the social sciences, and the field of social demography is no exception. Indeed, it has become increasingly common for social demographers who investigate racial disparities to explicitly note, in published work, the socially constructed nature of race.1 But the passing nods to social constructivism elide a tension between the adoption of a constructivist stance and the use of demographic methods to explore the workings of race in society. This paper brings the tension between social demographic and social constructivist approaches to the study of race to the fore -- though this was not our original design. The tension emerged naturally, as it were, as we attempted to resolve an empirical puzzle that happens to lie at the intersection of intellectual terrain that is typically claimed by each tradition of research. The puzzle itself only came into bold relief thanks to the conceptual apparatus and methodological tools of demography; the puzzle’s pieces and their possible connections, in turn, were only made visible through a constructivist mode of analysis. This paper thus brings social demographic and social constructivist approaches to the study of race into a rare conversation. Without aspiring to resolve the challenges that each perspective poses for the other, we draw on their combined resources to specify and attempt to resolve a deceptively simple puzzle: How did the population of Puerto Rico become white?
According to official statistics, the Puerto Rican population became significantly whiter over the course of the twentieth century. A census taken by the U.S. Department of War in 1899, a year after Puerto Rico came under U.S. dominion, found that 61.8 percent of the Puerto Rican population was “white.” A century later, the 2000 U.S. census results showed that 80.5 percent of the island’s population was “white.” What accounts for this dramatic shift in the racial composition of Puerto Rico’s population as reported in official statistics?
For those familiar with Puerto Rican society and history, this question may seem disingenuous. After all, ever since the island came under U.S. control Puerto Rican elites have worked long and hard to create and maintain Puerto Rico’s image as the “white island of the Antilles.” At the turn of the twentieth century, the effort to portray the Puerto Rican population as white was partly a response to scientific racism. Confronted with scientific theories that linked prospects for development to a society’s “racial stock,” Puerto Rican elites – like their counterparts elsewhere in Latin America – sought to position their society on the road to racial progress.2 Perhaps even more ominous than the predictions of race science, for Puerto Rican elites, was the specter of what might become of their society were their colonizers to see Puerto Rico as predominantly non-white. The shadow of the Jim Crow south hung over the island of Puerto Rico in the early twentieth-
1 See, for example, Frank’s (2001) reply to van den Ord and Rowe (2000) regarding the interpretation of racial disparities in birth weights. There is also a growing literature on the racial classification of “bi-racial” children in the United States that engages the idea that race is a social construction (Paret and Saperstein, unpublished manuscript; Xie and Goyette 1997). 2 The road to racial progress, as envisioned by national elites, followed different routes in different parts of Latin America (see, e.g., Skidmore 1993; Lesser 1999; Graham 1990; de la Fuente 2000).

3
century, a constant reminder of what it meant to be non-white under the rule of the United States.
Against this historical backdrop, observers of Puerto Rican society have generally glossed the census reports of an increasing proportion of whites in the population as yet another indicator of Puerto Rico’s “whitening ideology.” Historians have demonstrated, beyond any doubt, that whiteness was highly valued in Puerto Rican society in the early twentieth-century. But it is not at all clear how, exactly, the elite project of emphasizing the whiteness of Puerto Rican society got translated into census results showing a whiter and whiter Puerto Rican population. Some authors have speculated about the link between whitening ideology and whitening census results (these speculations are discussed below), but to date, there has been no empirical treatment of this issue.
There are three principal ways that the statistical observation of a whiter Puerto Rican population could have been generated: (1) the whitening of Puerto Rico could have resulted from demographic processes, in which case the census results capture shifts in the racial demography of the island’s population; (2) the whitening of Puerto Rico could have been generated by the Census Office itself, in which case the census results reflect either unselfconscious bias or deliberate interference (or both) on the part of Census Office personnel, or; (3) the whitening of Puerto Rico could be due to gradual changes in socio-cultural definitions of race, in which case the census results reflect either the movement of individuals across racial boundaries from one census to the next or – and this is a possibility that is rarely recognized in studies of “whitening” in Latin America --the movement of racial boundaries across individuals from one census to the next.
This paper attempts to identify the relative contribution of demographic, institutional, and socio-cultural sources of increase in the enumerated white population of Puerto Rico. We focus our analysis on a single decade of whitening: 1910-1920. We focus on this period primarily to take advantage of newly available public use samples of the 1910 and 1920 Puerto Rican censuses. These samples make it possible to bring empirical data to bear on the question of how, according to official statistics, Puerto Rico became white. With these datasets, we can put prior speculations about Puerto Rico’s whitening to empirical test, and weigh the plausibility of alternative accounts. Given our question, the availability of datasets from 1910 and 1920 is particularly propitious; Puerto Rico whitened more from 1910-1920 than in any other single decade of the twentieth century. Thus, the only two census years of the early twentieth century for which public use samples exists correspond to the most important decade for tackling the question of how Puerto Rico became white. The Official Picture: Racial Statistics and the Whitening of Puerto Rico, 1899-2000
The gradual whitening of the Puerto Rican population began well before the U.S.
took control of the island; a modest version of the trend appears already in the nineteenth-century statistics produced by the Spanish imperial government.3 The first U.S.-directed enumeration of the island’s population, in 1899, registered a minor racial “set-back” from the Spanish count of the population a few years before. From then on out, however, Puerto Rico’s enumerated white population began a steady upward climb, reaching a 3 For an overview of the population counts conducted by the Spanish prior to the U.S. occupation of the island, see United States. War Department. 1900 (Informe sobre el Censo de Puerto Rico, 1899).

4
peak, apparently, around 1950. From 1899 to 1950, the white share of the population increased from 60 to 80 percent, remaining at about that level for the remainder of the twentieth century. No racial data were collected in the censuses of Puerto Rico between 1960 and 1990, but the 2000 census results registered a less than 1 percent increase in the percentage of whites in the Puerto Rican population from 1950.4
Table 1. The Whitening of Puerto Rico: percent of population by year and color
0%
10%
20%
30%
40%
50%
60%
70%
80%
90%
1765
1800
1815
1827
1834
1860
1887
1910
1930
1940
1960
1980
2000
Whites Blacks and Mulatos
Year White Non-White 1887 59.5 40.5 1897 64.3 35.7 1899 61.8 38.2 1910 65.5 34.5 1920 73.0 27.0 1930 74.3 25.7 1935 76.2 23.8 1940 76.5 23.5 1950 79.7 20.3 2000 80.5 19.5
4 The omission of a race question from Puerto Rican censuses between 1960 and 1990 parallels a similar move across much of Latin America in the wake of WWII. But the omission in the Puerto Rican context is quite remarkable given that the U.S. continued to include race questions in mainland censuses, without any interruption, all the way through the twentieth century and up to the present day. The 1950 U.S. Census notes with respect to Puerto Rico: “There is considerable evidence which indicates that color is misreported” (U.S. Bureau of the Census 1952: viii, cited in Duany 2002: 252). This may have been behind the removal of the question from Puerto Rican questionnaires in 1960, but the question merits additional research.

5
Sources: From 1765 to 1887, Calzada (1988: 8), based on Lasierra (1866); Flinter (1834); Toste (1899); US War Department (1900). From 1897 and over, Duany (2002: 248) based on statistics reported in Administración de Puerto Rico (1938); Departamento de la Guerra (1900); U.S. Bureau of the Census (1913), (1921), (1932), (1943a), (1953a), (2001).
By the year 2000, according to official statistics, the population of Puerto Rico was much more racially homogenous, and much whiter, than the population of the mainland United States. Even with the revision to the race question in the 2000 census allowing respondents to choose more than one race – a revision that was applied to Puerto Rican census forms as well – the Puerto Rican population self-identified overwhelmingly as white-and-only-white. In fact, only 4 percent of Puerto Ricans marked more than one race on their census forms (comparable to respondents in California and New York). According to 2000 census results, today Puerto Rican society is more than 80 percent “white.”
The Whitening of Puerto Rico from 1910-1920
For the most part, the whitening of Puerto Rico’s population happened gradually, with incremental upward shifts - from about one to three percent - in the proportion of the population reported as “white” from one census to the next. But from 1910-1920 the proportion of whites in the Puerto Rican population jumped by 7.5 percentage points, more than twice that of any other single decade in the twentieth century. In 1910, census results showed that 65.5 percent of Puerto Rico’s population was “white”; according to the census of 1920, the “white” share of the population reached 73 percent. The demographic picture painted by official statistics was unmistakable: in the course of a decade the Puerto Rican population had become significantly whiter.
The jump in the relative size of the white population -- and the corresponding decline in the relative size of the non-white population -- is even more remarkable than it initially appears. Demographic analysis reveals that the percentage of whites in Puerto Rico’s population in 1920 was between 10 to 14 percent5 higher than would be expected based on the percentage of whites in the population in 1910, assuming the mortality schedule of the population remained the same over the decade.6 To determine what the racial composition of the Puerto Rican population in 1920 should have been based on its
5 These numbers represents the ratio between observed and projected white populations in 1920. The 10 percent estimate incorporates fertility, while the 14 percent estimate takes into account only persons above age ten. We have reason to suspect the accuracy of our estimates for race-specific fertility – discussed below – so we rely for now on the 14 percent estimate, which does not take fertility into account. 6 This assumption is reasonable given that mortality rates were very similar in 1910 and 1920. In the total population, estimated age-specific death rates had an average absolute decline of 2.8 deaths for every 1,000 persons in reproductive ages (between 15 and 50 years). These estimates, however, do not take into account the influenza pandemics of 1917 and 1918. The mortality differentials between 1910 and 1920 would probably be even smaller if the pandemics had been taken into account. According to Calzada (1988: 218), between 1910-14, the crude death rate was 22 for every 1,000 persons, and between 1920-24 it was equal to 21.2 per 1,000. Combs and Davis (1951: 105) provide similar estimates: 23.4 per 1,000 in 1910 and 22.3 per 1,000 in 1920.

6
composition in 1910, we calculated intercensal survivorship ratios (ISRs) for each racial group (whites, mulattos, blacks). The ISRs, which refer to the proportion of people surviving the intercensal period using age as a marker for cohort membership, allowed us to project the size of the white, mulatto, and black populations based on their respective sizes in 1910.7 8 Table 2: Observed and projected populations by race and sex, ages 10 and above, Puerto Rico 1920
-
100,000
200,000
300,000
400,000
500,000
600,000
Enumerated pop. Projection 1 * Projection 2 **
Enumerated pop. 344,285 353,465 21,005 21,990 103,940 108,565 469,230 484,020
Projection 1 * 310,673 308,424 20,066 21,729 145,807 149,737 476,546 479,889
Projection 2 ** 304,881 309,774 19,613 21,537 142,876 150,752 467,370 482,063
Men Women Men Women Men Women Men Women
White Black Mullato Total ***
7 The assumption behind the ISR is that, between two censuses, all population loss is due to death. For instance, if two censuses are separated by ten years, a birth cohort present at the first census should be 10 years older at the second census. Of course, this assumption could be problematic given that coverage, migration and misreporting can create “spurious flows into and out of cohorts” (Preston, Heuveline and Guillot, 2001: 247), unless both periods are equally affected by these factors. In this study we used two different indirect methods to obtain survivorship ratios. The first is in Preston, Heuveline and Guillot
(2001: 247) and has the form: ⎟⎟⎠
⎞⎜⎜⎝
⎛= +
20/1910,,
20/1910,,1020/1910,,
jxn
jxnjxn L
LISR . The second method uses a more
elaborated formula adapted from Carvalho, Wood and Andrade (2004: 334), and can be written as:
⎥⎥⎦
⎤
⎢⎢⎣
⎡⎟⎟⎠
⎞⎜⎜⎝
⎛⎟⎟⎠
⎞⎜⎜⎝
⎛⋅= ++
20/1910,,
20/1910,,10
20/1910,,
20/1910,,1020/1910,,20/1910,,
PRxn
PRxn
jxn
jxnPRxnjxn
LL
LL
ISRISR ; where nLx is the number
of person-years lived between age x and x+5 in the life table pertaining to the intercensal period; n is the length of the age group in years; j indexes the racial group; and PR means that the ratios derive from the life table of the whole population. Our results show, however, that both methods give very similar results. 8 To calculate survivorship ratios by race requires race-specific life tables, which do not exist for Puerto Rico for 1910. We therefore estimated life tables by sex and race in 1910 using a combination of historical published data (Calzada, 1988) and an adaptation of indirect demographic methods (Brass et al., 1968; Preston, Heuveline and Guillot, 2001; Carvalho, Wood and Andrade, 2004).

7
* Uses only race-specific life tables based on data from 1910 ** Uses an adaptation of the formula proposed by Carvalho, Wood and Andrade (2004) *** Differences between the total enumerated and projected populations are due to net migration, which is not considered in the projections Source: Puerto Rico Census Project 1910-1920
Taking the average of the two projections, we find that the white male population
should have been about 12 percent smaller, and the white female population about 14 percent smaller, than what was actually observed in 1920. The black male population should have been 6 percent smaller and the black female population 2 percent smaller than what the 1920 census reported. The mulatto/a population, meanwhile, should have been larger, by about 39 percent for both males and females.
Despite the slight increase in the percentage of blacks relative to mulattoes from 1910-1920, overall official statistics described a Puerto Rican population that was decidedly whiter in 1920 than it had been in 1910. The “surplus” in the white population from 1910 to 1920 presents us with an empirical puzzle: What accounts for the rapid whitening of the Puerto Rican population in the course of a single decade?
Observers of Puerto Rican society have often noted how statistics show the island becoming increasingly white over the course of the twentieth century. Indeed, the statistical trend is frequently invoked to illustrate the historical prevalence, and contemporary persistence, of “whitening ideologies” amongst Puerto Ricans. It remains unknown, however, how such ideologies translated into official statistics that show an increasingly “white” population. What we have, to date, is a collection of anecdotes that illustrate how cultural preferences for lighter-skin shades sometimes translate into individual behaviors (whom to marry, whom to hire, etc) that favor the reproduction of lighter traits. Though useful for suggesting some mechanisms of whitening on the island, such anecdotes neither cover the full range of possibilities nor help us discern the relative significance of those mechanisms described.
As we alluded to above, there are at least three possible routes through which “whitening ideologies” could have helped to generate Puerto Rico’s ever-whiter racial statistics in the first half of the twentieth century. First, whitening ideologies could have influenced demographic trends. Through various means, a cultural preference for lighter-skin shades would favor the natural increase of the white population over the non-white population, which official statistics would then simply record. Second, whitening ideologies could have influenced how the census office in Puerto Rico generated official racial statistics. Whether through changes in bureaucratic procedure, or through the discretionary classificatory practices of census-bureau personnel, an institutional preference for whiteness at the census bureau could have helped produce the whitening trend that the census appeared to merely record. Finally, whitening ideologies could have fostered changes in the social logic of racial classification on the island. The chances that a given individual would be defined as “white” in Puerto Rican society might have increased from one census to the next.
In the remainder of this paper, we attempt to determine the most significant sources of whitening in Puerto Rico between 1910 and 1920. We do this by subjecting several hypothesized mechanisms of whitening on the island to empirical test. For

8
heuristic purposes, we group the hypotheses considered into three clusters: demographic hypotheses (whitening produced by demographic shifts); institutional hypotheses (whitening produced by those who compiled and published official racial statistics); and socio-cultural hypotheses (whitening produced by changes in the social definition of race).9
Demographic Hypotheses
If we temporarily bracket our knowledge that racial categories used in censuses do not correspond to naturally existing, bounded groups of human beings, and assume, for the sake of argument, that census categories actually capture inherently differentiated and mutually exclusive sub-populations in a society, we can explore the possibility that the whitening of Puerto Rico from 1910-1920 resulted from basic demographic processes. By momentarily suspending the possibility of migration across racial categories between censuses, we can examine whether racial differentials in rates of birth, death, immigration or emigration contributed to making Puerto Rico whiter. Fertility
Fertility estimates for Puerto Rico in the first half of the 20th century show that a differential between whites and non-whites has existed since 1910, when the number of children under 5 years borne to every 1,000 white women aged 15-49 was 93.1 percent of the number borne by non-whites. This differential appears to have increased slightly up to the 1950s (Combs and Davis, 1951:105), which is when the growth of Puerto Rico’s white population seems to have stalled. These trends suggest that in the long term, any contribution of differential fertility rates to changes in the racial composition of the Puerto Rican population would have been to mitigate the extent of whitening, not increase it.
In the short term, however, fertility levels would have helped to marginally increase the white share of the total population, only because the absolute number of women at reproductive ages among whites was larger than among the non-white population between 1910-1920. As a result, the number of white births and thus the proportion of whites in the entire population would be higher than for non-whites, despite the lower relative fertility of whites. Therefore, absolute fertility may have marginally boosted the white population from 1910-1920, while differential fertility rates in the period would have worked in the opposition direction.
To investigate the possibility that fertility played a role in the whitening of Puerto Rico from 1910-1920, we incorporated the number of expected births in the projections.10
9 Some of the hypothesized mechanisms of whitening we consider lie at the interstices of demographic, socio-cultural and socio-institutional dynamics. The grouping of hypotheses into these three categories is done to simplify the presentation. 10 We assumed that each racial category corresponded to a closed population and calculated age specific fertility rates for each “race” in 1910 using methods of indirect fertility estimation (Mortara, 1949 and Arriaga, 1983) and assumed that those rates would remain stable over the decade. We estimated total fertility rates (TFRs) equal to 6.17 children for whites, 6.13 for blacks, 5.93 for mulattos, and 6.1 for all races combined.
9
After taking fertility into account, the surplus of whites decreased from 14 to ten percent (999,345/ 904,395), suggesting that the number of births contributed to the increase in the white population between 1910 and 1920. Even with fertility included in our projections, however, a large gap remains between the observed and projected white population. The fertility rate of whites would have to be 31 percent higher than what was estimated to make up for this gap. This translates into an improbable average number of children equal to 8.08 for whites, instead of the estimated 6.17.
Clearly, net of children born during the decade, the white population of Puerto Rico reported in the 1920 census was still much larger than it should have been given its size in 1910. We thus decided to restrict our analyses to the population above age 10 in 1920, for three reasons. First, it is unlikely that the assumption of fertility constancy, required if we include fertility in the projection, holds.11 Second, our interracial estimates of total fertility rates contradict those presented in the literature (Combs and Davis, 1951); it is unlikely that whites had higher fertility than non-whites in 1910.12 And third, we can safely ignore fertility without compromising our analysis.13 We are interested in how the racial composition of the Puerto Rican population changed from 1910-1920, not in the total size of the population. When we exclude those born after 1910 from our comparison of the projected and observed white population in 1920, we find a 14 percent surplus in the observed white population. This surplus, which we know cannot be due to fertility, represents the “extra” white population whose origins we seek to explain. Differential Mortality If non-whites lived shorter lives than whites in early twentieth century Puerto Rico, this might help account for the observed whitening of the island. We calculated life expectancies of Puerto Ricans in 1910 and 1920 by sex, age and race by combining Brass method of indirect mortality (Brass et al, 1968)14 with other demographic methodologies.15 We found, not surprisingly, that the white population had lower mortality than mulattos or blacks, and women had lower mortality than men. In 1910, life expectancy for Puerto Rican women at birth was 37.5 years for whites, 32.2 years for mulattas, and 28.5 for blacks. Among men these numbers were slightly lower: 36.2 for whites, 31.2 for mulattos and 28.1 years for blacks. These results are consistent with
11 This assumption is required because the 1920 census did not include a question on the number of children born in the previous decade. 12 The inconsistencies in inter racial fertility estimates may be due to differential reporting of the number of children ever had. If “blacks” and “mulattas” underreported the number of children ever had, this would result in the underestimation of fertility for these groups. 13 To take fertility into account would only add an extra source of noise in the projections because of the assumption of fertility stability – which is problematic – and because of the quality of the data associated with the report of children ever had. 14 The original and commonly used Brass method for estimating child/infant mortality consists of taking a representative sample of women ages 15-50 and asking them about the number of children ever born and the number of children surviving. The appeal of the method, therefore, is that it is based on only two retrospective questions. The logic behind the Brass approach is to assume that there is some age at which the proportion dead among children ever born, reported by women at age i, is equal to the probability of dying at a certain age a, adjusted by a correction factor which adjusts the age of women i, and the age of children for whom cumulative mortality is best identified. 15 See Appendix for a description of the other methodologies used in the study.

10
published numbers for Puerto Rico in the beginning of the twentieth century (Calzada, 1988: 223-27). Graph 1. Life expectancies by age, sex and race, Puerto Rico, 1910 Source: Puerto Rico Census Project 1910-1920 and Calzada (1988) Do the higher mortality rates of blacks and mulattos help to explain how Puerto Rico became white? Once again assuming closed populations, the overall effect of differential mortality rates would have been to gradually increase the proportion of whites in the population relative to non-whites. But given the size of the differentials, mortality rates could only have made a very modest contribution to the whitening of Puerto Rico during the early twentieth century. If mortality differentials were the primary factor responsible for whitening, observed and projected populations by race should be similar when all racial groups are exposed to the same mortality conditions. When we exposed all racial groups to the same mortality rate (the average rate for the whole population, but controlling for sex differentials), however, we found that the difference between the observed and projected white population in 1920 persisted.16 In order for mortality
16 When the “average” mortality rate was used to project the white population to 1920 based on its size in 1910 (that is, when we assumed no racial difference in mortality rates), the “surplus” in the observed white population was 14 percent higher than the projected white population. When the race-specific mortality rate of whites was used to make the projection, there was a 12 percent surplus in the enumerated over the projected white population. The smaller surplus using race-specific mortality rates makes sense given that the white mortality rate was lower than the average for the whole population. Since the projected white population using the race-specific mortality rate was larger (i.e. more people survive), the difference between the projected and observed white population in this scenario was smaller than in the scenario that assumed no racial differentials in mortality.
WOMEN
05
101520253035404550
0 5 15 25 35 45 55 65
age
e0
All women White womenBlack women Mullatas
MEN
05
101520253035404550
0 5 15 25 35 45 55 65
age
e0
All men White menBlack men Mullatos
11
differentials to be responsible for the whitening, the differences in death rates between races would have to be much, much higher than those estimated in 1910.17 Differential in-migration or out-migration If, in the first decades of the twentieth century, “whites” were more likely to immigrate to Puerto Rico and non-whites were more likely to leave the island, migration flows might help to account for the whitening of the Puerto Rican population. For racial differences in migration rates to be a plausible source of the observed whitening of the Puerto Rican population in early twentieth century, however, the absolute net migration flows would have to be large enough to make a difference to the relative sizes of the white, mulatto, and black populations. Available data on migration to and from Puerto Rico in this period reveal that whitening did not result from the flow of human beings across borders. Even if only “whites” entered Puerto Rico and only non-whites left between 1910 and 1920, the absolute size of migration flows in this period was not sufficient to produce the observed surplus in the white population in 1920.18 According to the 1920 Puerto Rican census 2505 individuals immigrated to Puerto Rico between 1910 and 1920. Of these, 2,270 were classified as “white” in the 1920 census (1205 from Spain, 280 from Venezuela, 180 from Cuba and 135 from the Dominican Republic). Altogether, these immigrants accounted for less than 3.3 percent of the increase in number of whites above what we would have expected based on 1910 population. Immigration, then, was not a significant source of increase in the white population in this period. Immigration cannot account for the magnitude of observed whitening in Puerto Rico between 1910 and 1920. But together with emigration, it might have at least contributed marginally to the relative shift in the racial composition of the population. To explore this possibility, we examined emigration flows from Puerto Rico to the continental United States between 1910 and 1920, which accounts for the vast majority of all emigration from the island in this decade (Duany 2000; Calzada 1988). We found that if emigration played any role in shaping the racial composition of Puerto Rico in this period, it was to “darken”, not “lighten”, the island’s population. In the beginning of the 20th century, out-migration from Puerto Rico was much more common than immigration to the island. Attracted by better wages, between 1900 and 1944, about 90,000 Puerto Ricans emigrated to the United States to work in cotton fields in Arizona and sugar plantations in Hawaii. Some of these emigrants were recruited by “agentes de empleo”, while others were motivated to emigrate with their families hoping to find better living standards in the continent (Calzada, 1988: 283-88). From 1910 to 1920 in particular, according to the U.S. census, 7873 Puerto Ricans emigrated to the U.S. Of these, 6561 were classified as “white” on the U.S. mainland census; 909 as “Spanish white” and 403 as “black”.19 17 For instance, if mortality was the only source of decrement, the cohort crude death rate of whites would have to be 63 percent lower in 1910 than the values estimated for the projection in order to account for the whitening. 18 As Duany (2000: 15) notes, “the number of white immigrants was not enough to produce such a large shift in racial groups. Nor was there a massive outflow of black people at this time.” 19 These numbers come from the mainland U.S. census of 1920, representing all individuals who reported Puerto Rico as “place of birth” and year of arrival in continental U.S. between 1910 and 1920
12
Combining these emigration numbers with the immigration numbers, we find that between 1910 and 1920 there was a net outflow from Puerto Rico of 4,291 “whites” and 170 “mulattos”, and a net inflow of 338 “blacks.” These numbers should be taken as rough estimates, because they do not include emigration flows to places other than the United States. It could well be, for example, that non-whites were more likely to emigrate to other Caribbean countries while whites were more likely to emigrate to the United States, in which case our numbers would overstate the “darkening” effect of net-migration flows on Puerto Rican society. The racial differentials in net migration rates must also be interpreted with some caution, given that those Puerto Ricans who left the island for the U.S. may have been racially reclassified in the 1920 census on the mainland.20 Despite the small size of migration flows and the limitations of our data, race-specific net migration rates provide at least a clue to whether selective migration would have helped to lighten or darken the population in this period. Race-specific net migration rates represent the difference between the number of persons in each racial category (white, mulatto, black) entering and leaving the island during the decade per 1,000 persons in that category.21 For every 1,000 blacks, there was a net outflow from the island of 6.6 persons in the decade. For every 1,000 whites, there was a net outflow of 5.1 persons. And for every 1,000 mulattos, there was a negligible net inflow of less than one person (0.53/1,000 population). These numbers suggest that, if anything, migration should have decreased the whitening of the island.
Taken as a whole, and still assuming that racial categories in the census correspond to closed sub-groups of the population, the empirical evidence suggests demographic trends could have contributed, marginally, to the whitening of Puerto Rico between 1910 and 1920. Racial differences in life expectancies might have contributed slightly to a gradual whitening of the population, but differential mortality rates in this period were much too small to account for the extensive whitening of the population from 1910-1920. Fertility probably boosted the relative size of the white population under age 10 in 1920, but since that population is excluded, for methodological reasons, from our calculation of a 14 percent surplus of whites in the observed 1920 population, we know that most of the whitening of the Puerto Rican population in this decade was not due to the birth of white children. Had they been large enough to make a significant impact on the racial composition of the population, racial differentials in birth rates and in net migration rates, meanwhile, would have exerted the opposite of the observed effect – helping to mitigate the whitening of the island rather than contributing to it. We can thus conclude that the census results from 1910 to 1920, showing a marked jump in the percentage of whites in the population, registered a shift on the island that was more cultural than demographic.
20 There is good reason to believe that racial classification of Puerto Ricans shifted as they moved from the island to the continent (see, e.g., Rodriguez Changing Race]. Today, most Puerto Ricans self-identify as either Hispanics or “others” (Duany, 2000: 24) when forced to separate their origin from their racial identity on the census. 21 The population at the midpoint of the period (1915) was used to do these calculations. The 1915 population was estimated using exponential age-race-specific growth rates between 1910 and 1920.

13
Institutional Hypotheses If demographic dynamics cannot account for the whitening of Puerto Rico from 1910-1920, then the change in the racial composition of the population reported in official statistics must have resulted from the reclassification of individuals’ race from one census to the next. This leaves us with another set of questions. Who reclassified whom? And why, when, and how did this reclassification take place? There are two primary possibilities. The first possibility, considered in the subsequent section, is that the social definition of whiteness underwent a broad shift across Puerto Rican society in this period, such that certain kinds of individuals who were generally considered non-white in 1910 were much more likely to be classified by enumerators as white in 1920. The other possibility – which does not necessarily rule out the first - is that reclassification was engineered, more or less deliberately, by Puerto Rican Census Office staff. Evidence from census-taking agencies in other parts of Latin America in the early twentieth-century suggests that the producers of official statistics in the region were not always neutral with respect to the racial data they collected. In some cases, the collection, processing, and selective publication of official statistics appears to have been influenced, in more or less subtle ways, by the desire to document “racial improvement” in the population (Loveman 2001). Were officials working in the Puerto Rican Census Office part of this more general trend? Did they subscribe, like most of their contemporaries, to the desirability of a whiter population? If so, this predilection could have biased the agency towards “finding” a growing percentage of whites in the population of the island. We consider two ways that socio-institutional practices of the census bureau in Puerto Rico could themselves have produced the statistical observation of a whitening population. The first hypothesis is that changes in official census-taking procedures from 1910 to 1920 resulted in the systematic reclassification of a significant segment of Puerto Rico’s population as white. The second hypothesis is that the discretionary practices Census Office staff, in their role as official classifiers, moved aggregate population statistics from 1910 to 1920 in a whiter direction.22 Formal procedures Did formal procedures for collecting data on “race” undergo changes from 1910 to 1920 that could help account for the rapid growth of the white population in a single decade? The published instructions for recording “race” of individuals did change slightly from 1910 to 1920, and it is possible that the change would have encouraged enumerators to “lighten” or “whiten” the racial classification of those enumerated.
22 Another institutional hypothesis is that there was differential coverage of the population in the enumerations of 1910 and 1920. Better coverage of predominantly whiter areas, and/or worse coverage of predominately non-white areas in 1920 than in 1910 could have helped generate the statistical observation of a growing percentage of whites in the Puerto Rican population over time. This hypothesis could fall under the rubric of either ‘formal procedures’ or ‘discretionary practices’ depending on the circumstances. We have not found any evidence, however, that coverage differed from 1910 to 1920.

14
In 1910, enumerators were instructed to record one of three categories: “Write ‘B’ for blanco, ‘N’ for negro, and “Mu’ for mulatto, as the case may be.” The instructions also specified the criteria for distinguishing between “blacks” and “mulattos”: “For the purpose of the census, the word “negro” (N) includes all blacks of pure race, while the word ‘mulatto’ (Mu) includes all blacks that are not pure race, but that have traces of black blood, whether in half, fourth, eighth or sixteenth degree, as the case may be.”23 These instructions differed ever-so-slightly from those given to enumerators for the mainland U.S. Census of 1910.24 The latter were also given the option of recording “ ‘Ch’for Chinese; ‘Jp’ for Japanese; ‘In’ for Indian” and “ ‘Ot’ (for other).” More interestingly, the instructions to enumerators on the mainland used slightly different language to specify the difference between a “black” and a “mulatto”: “the term ‘black’ (B) includes all persons who are evidently full-blooded negroes, while the term "mulatto" (Mu) includes all other persons having some proportion or perceptible trace of negro blood.” The reference to specific fractions of ‘black blood” in the Puerto Rican instructions thus departed from the mainland instructions for 1910, harkening back instead to use of the categories “quadroon” and “octoroon” in the mainland U.S. Censuses of 1870, 1880, and 1890. Perhaps someone at the U.S. Census Bureau thought the phrase “some proportion or perceptible trace of negro blood” too ambiguous a guide for detecting “non-whites” in Puerto Rico. Yet given that the instructions were edited for the Puerto Rican context, it is noteworthy that no clarification of the category “white” was provided to enumerators on the island. Apparently, the boundary between “white” and “non-white” was assumed to be self-evident enough, even in Puerto Rico, to make any such clarification unnecessary. In 1920, the enumerator instructions for reporting “color or race” were basically identical for the U.S. mainland and Puerto Rico, except that categories for “Filipino”, “Hindu” and “Korean” were added to the former but not the latter.25 In Puerto Rico, the “white”, “black” and “mulatto” categories remained from 1910, but enumerators were also given three additional options for recording individuals’ race: “Chi” for Chinese, “Jp” for Japanese, and “Ot” for Other (in which case enumerators were to record the race
23 Departamento de Comercio y Trabajo (1910, p.24). [Departamento de Comercio y Trabajo. 1910. Oficina del Censo. “Censo Décimotercero de los Estados Unidos. Puerto Rico. Abril 15, 1910. Instrucciones á los Enumeradores. Washington: Government Printing Office]
24 The mainland U.S. enumerator instructions for reporting “race” on the 1910 U.S. Census read: “108.Column 6. Color or race.—Write "W" for white; "B" for black; "Mu" for mulatto; "Ch" for Chinese; "Jp" for Japanese; "In" for Indian. For all persons not falling within one of these classes, write "Ot" (for other), and write on the left-hand margin of the schedule the race of the person so indicated.” 109. For census purposes, the term "black" (B) includes all persons who are evidently full-blooded negroes, while the term "mulatto" (Mu) includes all other persons having some proportion or perceptible trace of negro blood.
25 Enumerator instructions for reporting “color or race” in the mainland U.S. census of 1920 read: “120. Column 10. Color or race.—Write "W" for white, "B" for black; "Mu" for mulatto; "In" for Indian; "Ch" for Chinese; "Jp" for Japanese; "Fil" for Filipino; "Hin" for Hindu; "Kor" for Korean. for all persons not falling within one of these classes, write "Ot" (for other), and write on the left-hand margin of the schedule the race of the person so indicated.

15
of the person in the left margin of the census form). And, as in 1910, the instructions in both the mainland U.S. and Puerto Rico clarified the distinction between “black” and “mulatto” for the purpose of the census. Notably, however, the specific language used to denote membership in the “mulatto” category was altered just slightly. Whereas in 1910 in Puerto Rico “mulatto” included blacks that were not “pure race” but that had any trace of “black blood”, in 1920, “mulatto” included “all blacks that are not of pure race, but that have some proportion of white blood.”26 Although the definition of a “mulatto” in 1910 and 1920 was effectively the same -- a “mulatto” was defined as an “impure black” -- the emphasis in how to discern a “mulatto” shifted slightly from one census to the next. In 1910, enumerators were cued to be on the lookout for traces of black blood; in 1920 they were cued to note any trace of white blood. It is not possible to ascertain empirically whether his subtle semantic shift affected enumerators’ classificatory practices. But it would seem that if it had any influence at all, it would have been to nudge classifications in a lighter direction. Comparing the enumerator instructions of 1910 and 1920 side by side, we can surmise that in the Puerto Rican context, at least, the 1910 instructions, with their emphasis on detecting “black blood”, would have been more likely to trigger the classification of some erstwhile “whites” as “mulattos”, while the 1920 instructions, with their emphasis on detecting “white blood”, may have been more likely to trigger the classification of some erstwhile “blacks” as “mulattos.” In both 1910 and 1920, in both the U.S. mainland and Puerto Rico, enumerators’ instructions for classifying individuals by race in the census embodied a biological (il)logic of race; race was given by nature, passed on through blood, and visible in embodied traits. Whether in the U.S. mainland or in Puerto Rico, enumerators were instructed to distinguish whites from non-whites by invoking a “one drop rule”: there might be some ambiguity between “mulattos” and “blacks”, but anyone with any trace of “black blood” would be barred from categorization as “white.” Yet the specific terms used to describe this one drop rule shifted slightly from 1910 to 1920. Instead of alerting census-takers to be on the lookout for mulattos as “impure blacks” with any trace of black blood (i.e. individuals who were not “really white”), the instructions for Puerto Rican census-takers in 1920 cued census-takers to be on the lookout for mulattos as “impure blacks” with any trace of white blood (i.e. individuals who were not “really black”). The shift in the 1920 enumerator instructions in Puerto Rico, subtle as it was, created more wiggle room in the application of the one drop rule than was possible in the previous census. In both cases, race was construed to be determined by “blood.” But whereas in 1910, any trace of “black blood” was sufficient to keep an individual from being categorized as “white”, in 1920, any trace of “white blood” was sufficient to keep an individual from being categorized as “black.”
26 Departamento de Comercio (1919, p.20). [Departamento de Comercio. Oficina del Censo. Washington. Censo Décimocuarto de los Estados Unidos. Enero 1, 1920. Instrucciones a los Enumeradores. Puerto Rico. Washington: Imprenta del Gobierno, 1919]. In the mainland U.S., this was phrased: “For census purposes the term "black" (B) includes all Negroes of full blood, while the term "mulatto" (Mu) includes all Negroes having some proportion of white blood.”

16
If the terminological shift in the enumerator instructions had exerted a profound effect on enumerators, we would expect to see a relative decline in the “black” share of population together with a corresponding increase in the “mulatto” population – as “blacks” with “traces of white blood” were reclassified as “mulattos.” But the official statistics instead show a small increase in the proportion of “blacks,” an outright decline in the proportion of “mulattos,” and a large increase in the proportion of whites. Even if other mechanisms were simultaneously at play to move large numbers of individuals classified as “mulattos” in 1910 into the “white” category in 1920, we would still expect to see a decline in the proportion of blacks in 1920 if the change in enumerator instructions had any significant effect. Thus, changes in the formal instructions for racial classification from 1910 to 1920, interesting as they might be, do not appear to help account for the statistical whitening of the island. Bureaucratic discretion In the Puerto Rican censuses of both 1910 and 1920, the enumerators’ instructions for recording individuals’ “race” were based on the assumption that race is an individual trait, determined through inheritance, and observable through physical traces of black or white “blood.” The job of enumerators was to get it right, that is, to accurately report the putatively naturally given race of each individual. The instructions, however, did not specify how enumerators were supposed to discern traces of different kinds of blood. There was no explicit guidance as to which physical cues or social characteristics were to be taken as indicators of “black blood” or “white blood.” Nor were there necessary or sufficient criteria put forth for identifying the characteristic “impurity” of mulattos. Thus, to do their job of sorting the Puerto Rican population into the categories “white”, “mulatto” and “black,” Puerto Rican census enumerators in 1910 and 1920 had to “fill in” the official instructions with their own understandings of race. Sometimes, enumerators’ understandings of what made an individual one race rather than another did not correspond with the understandings of their supervisors or other U.S. Census Bureau personnel. We know this because in several thousand of the census forms used to create the public use samples of the 1910 and 1920 Puerto Rican censuses, the original racial classification on the form was crossed out and a different classification was written in.27 There is no indication on the census forms of who was responsible for the edits. The three logical possibilities are (1) enumerators “corrected” their own classifications before submitting the forms to their supervisors; (2) supervisors in the Puerto Rico census office edited the forms before sending them to Washington D.C.; or (3) Census Bureau personnel in Washington D.C. edited the forms after receiving them from Puerto Rico. We rule out the first possibility as both unlikely and, given the magnitude of edits in the samples, implausible. Between the latter two possibilities, we think it is most likely that 27 In the process of transcribing the information contained on the original census forms into a useable form for statistical analyses, the data entry operators noted that on some census forms the race field had been manually changed. In coding edited census returns, the data entry team opted to input the original racial classification, except where this was illegible, in which case the subsequently added category was used. All census returns with manual edits are flagged in the dataset. For a description of coding procedures and instructions for interpreting flagged data fields in the 1910 and 1920 public use samples of the Puerto Rican census, see http://www.ipums.org/usa/flags.html

17
the edits were done in Puerto Rico, either by Puerto Rican census office bureaucrats, or by the U.S. Director of the Census in Puerto Rico, in an effort to “clean up” the data before sending them to Washington for final processing.28 Pending the discovery of historical evidence that would contradict this hypothesis, we explore the possibility that Census Office officials in Puerto Rico used their bureaucratic discretion to systematically “correct” census returns such that the island appeared to be getting whiter. Though an appealingly simple and straightforward hypothesis, the official “editing” of racial classification on census returns cannot account for the statistical whitening of Puerto Rico in this decade. We can say this with confidence because the total number of census returns with manual changes to the race field was too small to account for the increase in the white population in 1920, even if all such changes had reclassified individuals as “white.” Moreover, the vast majority of edits to the race field were not incorporated into the public use samples from which we calculated the surplus in the observed over the projected white population in 1920.29 Edited values in the race field were only entered into the database when the enumerator’s original racial classification was illegible (approximately 47 percent of edited cases in the 1910 sample [90/191] and 16 percent of edited cases in the 1920 sample [371/2,349]). It is nonetheless instructive to scrutinize the edited census returns to learn whether Puerto Rican census personnel might have at least attempted to deliberately sway the racial count of the island in 1920. The set of edited census forms provide clues to the tacit racial logic of census agency personnel who used their bureaucratic discretion to “correct” the classificatory decisions of enumerators. We identified all cases where the race field was edited in the 1910 and 1920 public use samples of the Puerto Rican census and compared enumerators’ racial classifications with the subsequently entered “corrections.” Analysis of the census forms where racial classification was manually changed by census personnel produced two striking findings. First, edits of the race field on census forms were much more common in 1920 than in 1910. In 1910, an estimated 1,700 out of 1,165,379 census forms had the race field edited (.0014). In 1920, an estimated 20,485 out of 1,365, 825 census forms had the race field edited (.0149).30 In both years, then, manual edits of racial classifications were the exception, not the rule. But in 1920, the racial classification of an individual in the census was about ten times more likely to be subsequently edited by census agency personnel than in 1910. The second striking finding, given the statistical whitening of the population over this period, is that the majority of these edits, in both 1910 and 1920, changed
28 We are investigating how the U.S. Census Bureau in 1910 and 1920 handled the census returns from the island of Puerto Rico (who was in charge of doing what, when, and where with the data in order to get it into publishable forms, what was the relationship between Puerto Ricans and U.S. mainlanders in this process, etc). 29 It may be the case, however, that the edited values were used to calculate the totals that are reported in the published census results for these years. This could help to account for the small discrepancy in the population totals based on the public use samples and those published for 1910 and 1920. For a detailed description of the procedures used to create the public use samples, see Velyvis, Thompson-Colón and Winsborough (in progress). 30 These estimates come from statistical expansion of the 1910 and 1920 public use samples. For 1910, N=137,891 and 191 cases had the race field edited. For 1920, N=160,483 and 2,349 cases had the race field edited.

18
individuals to “mulatto” not “white.” Using population estimates of the expanded sample, the table below describes the reclassification of race on census returns in 1910: Table 3: Bureaucratic Edits of Reported Race in Puerto Rican Census of 1910 Race Recorded by Enumerator Race Edited To:
White Black Mulatto Unknown Total
Mulatto 765 40 0 445 1250 White 0 0 80 285 365 Black 20 0 15 30 65 Chinese 0 0 0 20 20 Total 785 40 95 780 1700 Edits of the race field in 1910 were much more likely to reclassify people as “mulatto” than “white”, and only very rarely reclassified someone as “black.” Of 1,700 cases edited in 1910, 21 percent (365) cases were changed to “white” while 73 percent (1250 cases) were changed to “mulatto.” Of those changed to “mulatto,” more than 60 percent (765 cases) were originally “white” while only 3 percent (40 cases) were originally “black.” (For the remaining 36 percent of those edited to “mulatto” (445 cases) the original “race” was not legible so the direction of the change --whether it was from “black” to “mulatto” or from “white” to “mulatto” -- is unknown). The strong bias towards reclassifying “whites” as “mulattos” would seem to be consonant with the emphasis of the enumerators’ instructions for 1910; the verbal cue to note traces of “black blood” in individuals who were not “pure blacks” could have predisposed census personnel to be vigilant of the boundary between “white” and “mulatto.” Rather surprisingly, however, the tendency of census personnel to change “whites” to “mulattos” was even more pronounced in 1920 than in 1910. This was the case despite the revised definition of a “mulatto” in the 1920 census (to recall, from an “impure black” with traces of “black blood” to an “impure black” with traces of “white blood”) which would seem to divert attention from the white-mulatto boundary to the boundary between mulatto and black. There were 1,710 cases in 1920 where “blacks” were changed to “mulattos”, but this number was dwarfed by the 14,115 cases where the category “mulatto” replaced “white.” Table 4. Bureaucratic Edits of Reported Race in Puerto Rican Census of 1920 Race Recorded by Enumerator Race Edited To:
White Black Mulatto Chinese Unknown Total
Mulatto 14,115 1,710 20 0 2,160 18,005 White 35 20 855 10 1,010 1930 Black 130 0 185 0 225 540 Unknown 0 0 0 0 10 10 Total 14,280 1,730 1,060 10 3,405 20,485

19
Taken together, only 9 percent (1930 cases) of all reclassifications by census personnel in 1920 made individuals “white”, and only 2.6 percent made individuals “black.” A whopping 87.9 percent (18,005 cases) of the supervisors’ edits reclassified individuals as “mulatto.”31 It is worth reiterating that these edits by census personnel do not factor into our calculus of the size of the “surplus” white population in 1920, because the vast majority of these edited values were not the values entered into the public use sample dataset (the exception being the 371 cases in the sample where the original racial classification was illegible). The discovery that census agency personnel intended the data to be altered, and in the direction we have seen, is nonetheless quite remarkable. It seems to all but rule out the possibility that the whitening of racial statistics in early twentieth-century Puerto Rico resulted from institutional bias within the census agency itself. The pattern of reclassification in the 1920 census returns speaks against the idea that those charged with conducting the census of Puerto Rico deliberately altered census results to confirm ideological visions of a whiter society. Far from pushing Puerto Rican population statistics in a whiter direction, those in charge of producing the official statistics actively intervened to police the boundaries of whiteness. This suggests either that Puerto Rican census officials, in contrast to their contemporaries in other Latin American census agencies in this same period (see Loveman 2001), did not allow their own ideological preferences for a whiter society to interfere with their work in producing official statistics. Or, more likely, that any bias of Puerto Rican census personnel towards whitening the population was deliberately checked by the actions of their supervisors – whether in Puerto Rico or, at a later stage, in the United States. The effort to reclassify more than 14,000 “whites” as “mulattos” in 1920 leaves little doubt that census agency personnel were actively interested in the racial status of Puerto Ricans. The overwhelmingly uniform direction of the reclassificatory impulse, meanwhile, suggests that either Puerto Rican census supervisors were particularly diligent in their attempt to make the returns conform to the enumerator instructions, with their embodied U.S. logic of racial classification, or that U.S. mainlanders, whether working in the census office in Puerto Rico or Washington D.C., were the ones responsible for the edits.32 In either case, the fact that official statistics showed the Puerto Rican population becoming so white, so quickly, despite the efforts by Census Office personnel to restrict the use of the category “white,” makes the whitening of Puerto Rico in this period all the more remarkable. Socio-cultural Hypotheses Having ruled out demographic trends and institutional bias as the main engines of whitening, changes in the way race was reported on census forms between 1910 and
31 We are in the process of analyzing these data to discern whether supervisor edits of census forms were targeted with respect to individual characteristics (position in the household, age, sex) or place of residence (were forms from some municipalities more likely to have the race field edited than forms from other municipalities?). 32 We are investigating the relationship between U.S. census bureau personnel on the mainland and in Puerto Rico during this period.
20
1920 remains as the most plausible explanation for the observed statistical whitening of the island. If the Puerto Rican census bureau did not alter the census returns ex post facto to favor the whitening of the island, then the statistical whitening of the Puerto Rican population reflected how race was reported on census forms in the first place. Did tacit understandings of race in Puerto Rican society undergo some change between 1910 and 1920 such that enumerators, who were recruited from the Puerto Rican population,33 were more likely to report people as “white” in 1920 than in 1910? Notably, this is the official explanation for the striking whitening trend revealed by official statistics. An official bulletin reporting the results of the 1935 census of Puerto Rico noted that the decline in the “colored” proportion of the population from 1899 to 1935 was “without doubt the result of a gradual change in the concept of the race classification as applied by the census enumerators” (Administración de Reconstrucción de Puerto Rico, 1938:17). Duany (2002: 250) is skeptical that enumerator’s conceptions of race underwent change in this period. He notes that “since 1899, enumerators have been recruited from the Island’s population and have presumably applied local standards of racial classification.” Yet “local standards of racial classification” are themselves subject to change. And since, as Duany notes, enumerators were recruited from the population, their classificatory practices could very well reflect any such changes. The possibility that social definitions of race were changing in early twentieth-century Puerto Rico was also posited in the 1940s by an American sociologist. Rogler (1946: 80) noted that the rapid decline in Puerto Rico’s non-white population was “probably the consequence of changing race conceptions or, more specifically, the social definition as to who is a person of color. In other words, these percentages would suggest that many persons of color are moving into the white race” (Rogler 1946:80). Perhaps because this observation is embedded in a lengthy discussion of Puerto Rico’s “absence of marked race prejudice” and putatively optimal “moral conditions” for race mixture,” Duany takes Rogler to task for suggesting that Puerto Ricans did not (and do not) differentiate between whites and blacks. As Duany (2002: 249) notes, “the Puerto Rican scheme of racial classification is primarily concerned – perhaps even obsessed – with distinguishing various shades of skin color.” For this reason, it is indeed unlikely that people of color became “white” in any literal sense – that is, that they were perceived and treated as if they were “white” in any and all social situations. But for the purposes of the census, it does indeed appear that people who were classified as non-white in one census were quite often classified as “white” in the next. Duany’s own account of the statistical whitening of Puerto Rico emphasizes the imposition by the U.S. government of “a binary race model to a fluid multiracial situation in Puerto Rico” (2002: 250). Duany argues that from the perspective of the U.S., the Island was always divided between “ ‘pure whites and those who are not’” (Duany 2002:250, citing U.S. War Department 1900, p.57). This bi-racial vision was superimposed on a society that drew myriad racial distinctions, but with relatively blurry
33 We are investigating methods of recruitment and minimum qualifications of census enumerators for the 1910 and 1920 Puerto Rican censuses. A story in National Geographic Magazine on the 1899 census of Puerto Rico, taken under the direction of the U.S. Department of War, noted “The facts presented in the reports were gathered in all cases by the people themselves, as the most intelligent of the better classes were induced to compete for positions as census-takers by the relatively handsome salaries offered by the U.S. government” (1901, p.80).
21
boundaries between one category and the next. According to Duany, the mismatch between the official categories and popular understandings of race drove the statistical whitening of Puerto Rico. Specifically, the elimination of the intermediate “mulatto” category from the census of Puerto Rico in 1930 “accelerated the movement from nonwhite to white categories on the Island” (Duany 2002: 250). The hitch for this argument is that, according to census results, Puerto Rico became much whiter between 1899-1920 than it did in the much longer period since 1930. And in the censuses of the former period (1899, 1910, 1920) “mulatto” was one of the categories enumerators were instructed to use (as it was, as well, in the mainland U.S. censuses of 1910 and 1920). The U.S.-directed censuses of Puerto Rico up to 1920 registered more than an 11 percent increase in the white proportion of the population, compared to a 6 percent increase between 1930 and 2000. Thus, the elimination of the “mulatto” category from the Puerto Rican census in 1930 may have contributed to the relative increase in the white population thereafter, but it cannot be taken as the primary source of the statistical whitening of the Island. Indeed, the slower rate of increase of the relative size of the white population of Puerto Rico after 1930 suggests that the tendency to reclassify an individual as white was not as closely related to the options for classifying non-whites as we might expect. During the most intensive decade of statistical whitening in Puerto Rico, from 1910-1920, the census categories retained a space for recognition of “intermediate” racial types. That whitening occurred despite the existence of a “mulatto” option on the census suggests reclassification as “white” was not simply a defensive reaction to the imposition of a bi-polar U.S. definition of race. Census data, by their very nature, are silent as to the social significance of being classified one way rather than another. Census data cannot tell us what it meant, in experiential terms, to be perceived as “white” versus “mulatto” versus “black” in early twentieth-century Puerto Rico. Nor, for that matter, can the data tell us whether an individual classified as “white” on the census was perceived and treated as “white” in other walks of life – at school, at church, or in the workplace, for example. What the census data do reveal, however, is that the likelihood that an individual would be classified as white in the census increased markedly between 1910 and 1920. In the absence of evidence that racial classifications on census forms were “whitened” after the fact, this suggests, at a minimum, that enumerators used a different standard for adjudicating the white/non-white boundary in 1920 than they did in 1910. The discovery that the whitening of Puerto Rico was produced through racial reclassification by enumerators is in itself an interesting finding, but it is not the end of the story.34 Instead, it leads to a new empirical puzzle: who was reclassified from one census to the next, and why? While Rogler would direct our attention primarily to shifts in the definition of people of color, and Rogler would have us focus on the collapse of the boundary between “blacks” and “mulattos,” our analyses of census data from this period suggest we ought to focus our attention, instead, on changes in the social definition of “who is white.” To begin to specify more precisely exactly how conceptions of race were changing in early twentieth-century Puerto Rico, we examined the data from the 1910
34 A recent study of the changing racial composition of Brazil concludes with finding of racial reclassification (wood et al 200x) – is this true – review this article, and find others (telles?) that have dealt with this in brazil or elsewhere.
22
and 1920 censuses for patterned changes in how particular kinds of individuals were racially classified from one census to the next. Was racial reclassification randomly distributed across the Puerto Rican population? Or, more plausibly, were some types of individuals more likely to be reclassified as white than others? By discerning whether particular kinds of individuals were more likely to be counted as white in 1920 than in 1910, we can make inferences about how, exactly, conceptions of race were changing in early twentieth-century Puerto Rico, and consider how such changes might have driven the statistical whitening of the island. Existing descriptive accounts of whitening in Puerto Rico and elsewhere in Latin America emphasize two principal social mechanisms for migrating across racial boundaries: intermarriage and social mobility. Taking our cue from this literature, we looked at three segments of the Puerto Rican population in 1910 that were the most likely candidates for reclassification in the census of 1920: people in inter-racial unions, the children of such unions, and socially mobile individuals. Inter-racial Unions Numerous ethnographic and historical accounts have shown that in Latin American societies influenced by “whitening ideologies” there are often societal and family pressures to “mejorar la raza” (“improve the race”) through marriage with a lighter partner. As a mechanism of whitening, racial intermarriage – meaning marriage between two individuals socially regarded as belonging on different sides of a racial boundary, however that boundary is drawn – may work in one of two ways. The first possibility is that upon entering into a union with a person of a lighter race, an individual’s own racial status changes to match his or her partners. In this case, whitening through intermarriage occurs in “real time” as a person’s socially defined racial status is recalibrated to match that of his or her spouse. The second and presumably more likely possibility is that intermarriage acts as a mechanism of whitening through the couple’s progeny. The children produced in inter-racial unions will be socially regarded as lighter than the darker of the two parents.35 In contrast to the instant whitening implied by spousal reclassification, in this second scenario, whitening through intermarriage happens across generations, through the classification of ones children as a lighter race than oneself. If intermarriage was increasingly recognized in Puerto Rican society as a means of whitening, whether of spouses, children, or both, census enumerators might have “recognized” greater numbers of individuals involved in such unions as “white” in 1920 than they did in 1910. Was reclassification due to intermarriage a source of the whitening of Puerto Rico between 1910 and 1920? 35 Logically, of course, the “whitening” of one side of the family comes at the expense of the “darkening” of the other. But this was rarely noted by proponents of inter-generational whitening in the region, most of whom refined their predictions of how “miscegenation” would lead to racial improvement around the turn of the twentieth century. Contrary to their North American counterparts, most intellectual, social and political elites in Latin America in this period preferred to see “mulattos” as “half-white” rather than “half-black.” For a recent discussion of inter-familial tensions generated by the fact that lightening for one side of the family implies darkening for the other, see Sheriff (200x, p.xx).
23
Inter-racial Unions: Spousal reclassification Historians of colonial Latin America have found evidence that individuals’ racial classification sometimes changed from one census to another to match the racial classification of a spouse. In a remarkable study of this phenomenon, referred to in the colonial historiography as “racial drift,” Castleman (1998) matched the records for 1012 individuals in two censuses taken 14 years apart, in 1777 and 1791, in what is today the city of Oaxaca. He found that 333 individuals had “drifted” from one racial classification to another across census reports, and that the majority of these had moved into higher status classifications, often matching the racial classification of their spouse (Castleman 1998: 168). We do not have comparable studies of spousal “racial drift” in modern Latin America, if only because public use samples of modern censuses do not allow us to link specific individuals across censuses. But the colonial evidence combined with descriptive accounts of whitening “through association” in nineteenth and twentieth-century Latin America, suggest that spousal reclassification could have contributed to the statistical whitening of Puerto Rico. Do the 1910 and 1920 census data give us any indication that intermarriage routinely occasioned racial reclassification of a spouse? Looking at patterns of union formation36 by race in 1910 and 1920, we see three puzzling trends: (1) Between 1910 and 1920 the proportion of all marriages that were racially exogamous – meaning the partners had different racial classifications on the census -- diminished from 16.3 to 14.2 percent. Most of this decline was due to the reduction in the number of those classified as “mulattos” marrying people classified as some other race; (2) The number of endogamous marriages between mulattos also decreased from 21.5 to 14.1 percent, while among whites there was an increase from 59 to 69 percent; (3) “mulattos” were marrying much less in 1920 than they were in 1910: the proportion of all marital unions involving at least one person classified as “mulatto” declined from 36.8 percent in 1910 (12.7% white-mulatto + 2.6% black-mulatto + 21.5% mulatto-mulatto) to 27.1 percent in 1920.
36 These tables include marriages and consensual unions. We plan to analyze these separately in the future to determine if the distribution of marriages by race looks any different for legally recognized marriages than it does for consensual unions. It is possible, for example, that reclassification of spouses was more likely in cases of marriage than in consensual unions, in which case we would expect to see more nominally inter-racial unions in consensual union households than in married households.

24
Table 5. Distribution of marital unions by race of partners, 1910 and 1920
Type of marriage 1910 1920Black-white 0.9% 1.1% 0.2%Black-mulatto 2.6% 1.8% -0.8%White- mulatto 12.7% 11.2% -1.5%Sub-TOTAL 16.3% 14.2% -2.1%White-white 59.3% 69.0% 9.6%Black-black 2.8% 2.7% -0.1%Mulatto-mulatto 21.5% 14.1% -7.5%Sub-TOTAL 83.7% 85.8% 2.1%
Total of unions 154,846 185,010
Distribution of interracial marriage
Difference 1920-1910
Source: Puerto Rico Census Project 1910-1920
Racial reclassification of spouses is a very plausible, and parsimonious, explanation for the changes in marriage patterns from 1910 to 1920. With respect to observation (1), the statistical picture of an overall decline in exogamous marriages could be due, quite simply, to an increasing tendency for enumerators to give married partners the same racial classification on the census. The particular decline in exogamous marriages involving a “mulatto” spouse supports this hypothesis. “Mulattos” would presumably be the most vulnerable to reclassification to match a spouse; an increased tendency to classify spouses together would thus be particularly likely to obscure “exogamy” amongst “mulattos.” This possibility is further supported by observation (2): the 7 percent decline in endogamous “mulatto” marriages next to the 9 percent increase in endogamous “white” marriages. These numbers suggest that marriages involving a “white” partner were increasingly likely to occasion the reclassification of the spouse to match. The decline in mulatto-mulatto marriages, meanwhile, would be an artifact of the reclassification of so many “mulattos” as “white”. Indeed, the proportion of marriages of any kind that involved a “mulatto” partner declined from about a third to a quarter between 1910 and 1920 (observation 3). Essentially, the increasing tendency to reclassify “mulattos” to match their spouses meant a decreasing tendency for married individuals to be classified as “mulatto” at all.
Data showing the prevalence of nominally inter-racial unions as a proportion of all unions for members of a given racial category yield two additional noteworthy observations: (4) In both 1910 and 1920, endogamous marriages were more common than exogamous marriages for individuals in any racial category, but this is especially the case for those classified as “white”, and it is more the case in 1920 than in 1910; and (5) Within each racial group, the prevalence of marriages with a “white” partner increased for all racial categories over time. In 1910, 15 percent of married blacks had a white partner. In 1920, this figure increased to 20 percent. Among mulattos, this figure also increased, jumping from 35 percent, in 1910, to 41 percent, in 1920. The table also shows that within each racial group (columns of the table) blacks and mulattos were less likely to marry each other in 1920 than in 1910. In 1910, 41 percent of married blacks had a mulatto partner. In 1920, this figure decreased to 32 percent. Among mulattos, this figure also decreased, from 7.1, in 1910, to 6.8 percent, in 1920.
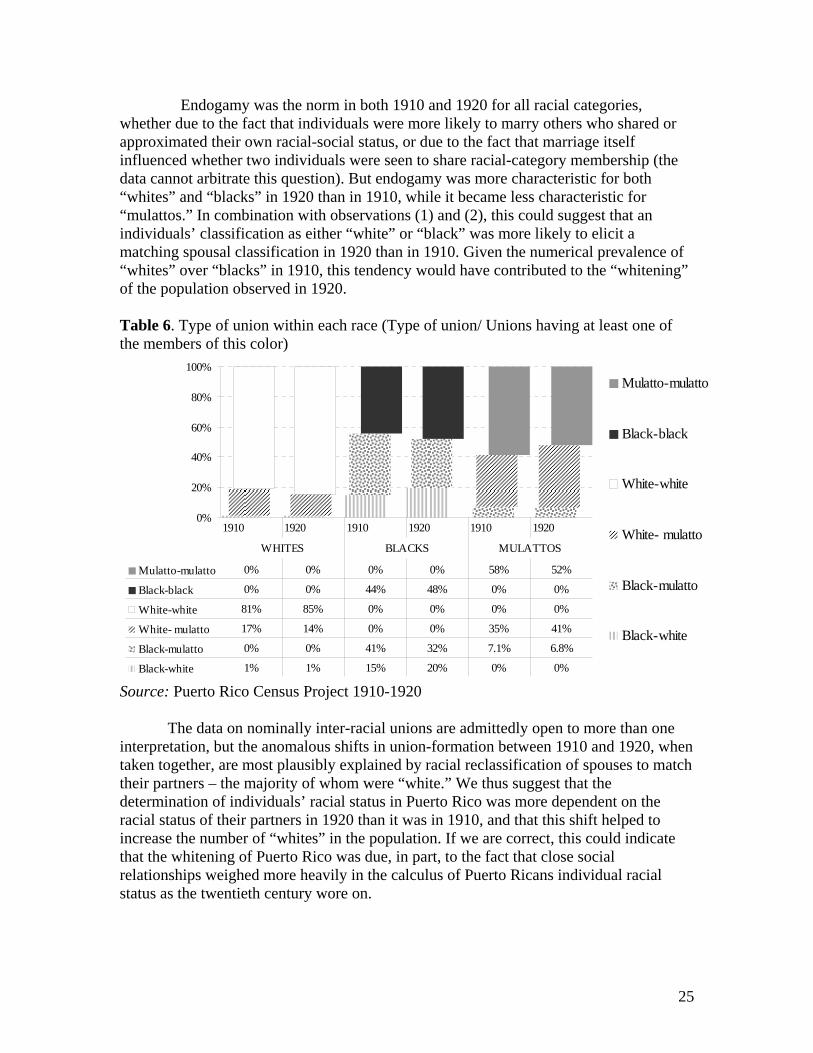
25
Endogamy was the norm in both 1910 and 1920 for all racial categories, whether due to the fact that individuals were more likely to marry others who shared or approximated their own racial-social status, or due to the fact that marriage itself influenced whether two individuals were seen to share racial-category membership (the data cannot arbitrate this question). But endogamy was more characteristic for both “whites” and “blacks” in 1920 than in 1910, while it became less characteristic for “mulattos.” In combination with observations (1) and (2), this could suggest that an individuals’ classification as either “white” or “black” was more likely to elicit a matching spousal classification in 1920 than in 1910. Given the numerical prevalence of “whites” over “blacks” in 1910, this tendency would have contributed to the “whitening” of the population observed in 1920.
Table 6. Type of union within each race (Type of union/ Unions having at least one of the members of this color)
0%
20%
40%
60%
80%
100%Mulatto-mulatto
Black-black
White-white
White- mulatto
Black-mulatto
Black-white
Mulatto-mulatto 0% 0% 0% 0% 58% 52%
Black-black 0% 0% 44% 48% 0% 0%
White-white 81% 85% 0% 0% 0% 0%
White- mulatto 17% 14% 0% 0% 35% 41%
Black-mulatto 0% 0% 41% 32% 7.1% 6.8%
Black-white 1% 1% 15% 20% 0% 0%
1910 1920 1910 1920 1910 1920
WHITES BLACKS MULATTOS
Source: Puerto Rico Census Project 1910-1920
The data on nominally inter-racial unions are admittedly open to more than one interpretation, but the anomalous shifts in union-formation between 1910 and 1920, when taken together, are most plausibly explained by racial reclassification of spouses to match their partners – the majority of whom were “white.” We thus suggest that the determination of individuals’ racial status in Puerto Rico was more dependent on the racial status of their partners in 1920 than it was in 1910, and that this shift helped to increase the number of “whites” in the population. If we are correct, this could indicate that the whitening of Puerto Rico was due, in part, to the fact that close social relationships weighed more heavily in the calculus of Puerto Ricans individual racial status as the twentieth century wore on.
26
Inter-racial Unions: Classification of Children The idea that inter-racial unions would, through their progeny, gradually lighten Latin American societies figured centrally in nation-making narratives throughout the region in the early-to-mid 20th century.37 In contrast to the prevailing North American view that racial mixture was degenerative, Latin American scientists and ideologues argued for the regenerative potential of inter-racial unions (cf. Skidmore 1993; Graham 1990). At a societal level, mixture was seen to lighten, not darken, the population: the offspring of a “white” and a “black” was not a “black” but a “mulatto”; and the offspring of a “white” and a “mulatto” would often be “white.” The whitening of society through procreation was a common theme in the official presentation and analysis of census results across Latin America during this period.38 Through procreation, it was believed, the racial composition of Latin American societies would naturally “improve”; blacks would eventually disappear altogether. Intermarriage was therefore seen as a primary mechanism of “racial improvement” in early twentieth-century Latin America. The idea that whitening was a demographic inevitability given the tendency for “exogamous” unions also figured in Puerto Rican census publications in the early twentieth century. The forward to the Puerto Rican census of 1910, for example, noting the decline in the black population from the previous count in 1899, explained matter-of-factly:
As regards the decrease of the black population, it should be borne in mind that where blacks intermarry with those of other classes, their children are classified as mulattos. To the extent of their intermarriage with other classes the blacks are therefore estopped [sic] from any natural increase whatever. If the number of such marriages were sufficiently great, the births of blacks would be insufficient to offset the deaths, and the number of blacks would in that case necessarily decrease. (Department of Commerce 1913: 16).
The gradual disappearance of “blacks” from Puerto Rican society was thus to be expected as long as “blacks” continued to form unions with non-blacks. Whether hailed as a desirable demographic trend, described neutrally in statistics as a matter of fact, or criticized as a product of racial prejudice in union formation, the idea that Puerto Rico whitened through “miscegenation” pervades historical and contemporary accounts of racial dynamics on the island.39 Do the census data from 1910 and 1920 confirm this
37 This possibility was recognized in Spanish colonial custom and art, for example the casta paintings popular in eighteenth century Mexico and Peru. See: Ilona Katzew, "Casta Painting: Identity and Social Stratification in Colonial Mexico," which first appeared in the catalog for the exhibition New World Orders: Casta Painting and Colonial Latin America, organized by the Americas Society Art Gallery, Sept. 26-Dec. 22, 1996. 38 See Loveman 2001: Chapter 6. 39 Incorporate: Kantrowitz, 1971; Pico de Hernandez et al., 1985; Seda Bonilla, 1973, 1980; Zenon Cruz, 1975 in Duany, 2000: 10. Also: Rogler (1946) argued that race mixing producing anatomical change in Puerto Rican population: “race mixing is changing the racial character of the Puerto Rican population with comparative rapidity” because “Puerto Rico approaches a morally optimum condition for race mixing” (1946, p.80). This anatomical shift produces whitening when “. . . combined with tendency to define light

27
view? We consider two possible ways that the off-spring of inter-racial unions could have contributed to the whitening of the Puerto Rican population. The first possibility is that there were many more children of inter-racial unions in 1920 than in 1910, either due to a proportionately greater number of inter-racial unions in the population, or because inter-racial unions for some reason generated more children than endogamous unions in these years. We already know, however, that the number of children from mixed unions cannot be the source of the 14 percent surplus of “whites” in the 1920 census count; recall that we controlled for fertility when we projected the 1910 population by race. But even if we suspend this knowledge momentarily, we can see at a glance that the statistical whitening of Puerto Rico from 1910 to 1920 does not simply reflect the dynamics of union-formation and procreation. First of all, if “miscegenation” were driving the whitening of the island, we would expect the census results from 1920 to show a decline in the proportion of the population classified as “black” coupled with an increase in the proportion of the population classified as “mulatto.” The 1920 enumerator instructions, remember, dictated that all “blacks” with any trace of “white blood” be classified on the census as “mulatto.” Instead, we see a decline in the “mulatto” share of the population and a slight increase in the proportion of “blacks,” alongside the dramatic increase in the proportion of “whites.” Second, the overall rate of exogamous marriages declined between 1910 and 1920 from 16 to 14 percent; if anything, we would thus expect miscegenation to have had more “lightening” influence in 1910 than in 1920. It does not appear, therefore, that “miscegenation” drove the statistical whitening of Puerto Rico in any straightforward manner. But there is a second possible mechanism through which inter-racial unions could have whitened the Puerto Rican population: the reclassification of children of such unions as “white” from one census to the next. We found compelling evidence that such reclassification did, in fact, take place. A comparison of how children of mixed-unions were classified on the censuses of 1910 and 1920 revealed a significant increase in the likelihood that such progeny would be classified as “white.” Specifically, a child of a “white”/“mulatto” union had a 16.8 percent chance of being labeled “white” in the 1910 census, but a 26.3 percent chance of being labeled “white” in 1920. A child of a “mulatto”/”white” union was thus 56 percent more likely to be classified as “white” in the census of 1920 than in the census of 1910.
mulattos as white”. Rogler also states that “the available evidence indicates that three white men marry a mulatto woman for every white woman who marries a mulatto man” (Rogler 1946, p.8) (it is not clear what the “available evidence” is that he is referring to here).

28
Table 7. Racial Classification of Children of Interracial Unions, Puerto Rico 1910-1920
Type of marriage 1910 1920 1910 1920 1910 1920 1910 1920 Black-white 5.5% 9.0% 10.8% 9.0% 83.7% 82.0% 2,540 4,060 Black-mulatto 0.1% 1.0% 26.2% 22.4% 73.6% 76.6% 8,840 7,205 White- mulatto 16.8% 26.3% 0.2% 0.0% 83.0% 73.7% 46,601 50,100
Black-black 0.7% 0.0% 97.2% 98.8% 2.2% 1.2% 10,630 12,440 Mulatto-mulatto 0.7% 1.3% 0.1% 0.2% 99.2% 98.5% 81,575 69,250 White-white 99.8% 99.6% 0.0% 0.0% 0.2% 0.4% 264,523 381,770
74.6% 57,981 61,365 Total (Any type of Inter-Racial
Marriage)13.8% 22.2% 4.6%
Probability child classified as…WHITE BLACK MULATTO # of Children
3.3% 81.6%
Source: Puerto Rico Census Project 1910-1920 It is noteworthy that over 80 percent of children of “black”/“white” unions were classified as “mulatto” in both 1910 and 1920. This suggests that the basic idea that a “mulatto” resulted from the union of a “black” and a “white” did not change much over the decade. However, there was a shift in how the remaining children of “black”/”white” unions were classified, from mostly “black” in 1910 to equally “black” or “white” in 1920. This shift, however, could have contributed only marginally to the statistical whitening of the population in 1920, given the small numbers of “black”/”white” unions, and the fact that in only 9 percent of these unions were the children classified as “white” in 1920. Indeed, “black”/“white” unions were comparatively rare in both 1910 and 1920; they made up 5 percent of exogamous unions in 1910 and 7 percent in 1920. In terms of the aggregate statistics, therefore, the classificatory practice for the children of “black”/“white” unions were all but inconsequential next to the classificatory practice for the children of “mulatto”/“white” unions. It is also worth drawing attention to the fact that the children of “black”/“mulatto” unions were also somewhat less likely to be classified as “black” in 1920 than in 1910. This may be evidence that the subtle shift in enumerator instructions with regard to the definition of a “mulatto” – from a “black” with only partial “black blood”, to a “black” with any trace of “white blood” -- exerted some influence on the classificatory choices of enumerators. Again, however, the absolute number of such cases was too small for this tendency to exert a noticeable effect on the aggregate statistics. It appears that the tacit rules for racial classification of children of nominally inter-racial unions underwent a shift between 1910 and 1920, such that they were much more frequently classified as “white.” Taking all such unions together, a child of nominally mixed parents was 60 percent more likely to be classified as “white” in 1920 than in 1910 (22.2/13.8). This very likely underestimates the extent of reclassification of children of nominally-mixed unions, however. If the apparent decline in exogamy across the population from 1910 to 1920 was actually an artifact of spousal reclassification, as we suggested above, then it is quite likely that children associated with such unions would have been automatically reclassified to match both parents. Such children would not appear in our comparison in Table 7 because their parents would be classified as the same race on the census in 1920. Thus, any union in which one partner was reclassified to match the other would result, ipso facto, in the reclassification of their children in the
29
same direction. And those children would appear in the census of 1920 as progeny of endogamous unions. The fact that children of inter-racial unions were so much more likely to be considered “white” in 1920 than in 1910 suggests that social understandings of the racial status of such children underwent a shift in this period. Contrary to traditional accounts of the role of interracial procreation in the whitening of the island, in early twentieth century Puerto Rico it appears that it was not an increase in “miscegenation” per se that drove the whitening of the island, but rather, the increased tendency to define the products of “white”/”mulatto” unions as “white.” With respect to children of such unions, it appears that the boundary between “white” and “non-white” in Puerto Rican society became more porous and more inclusive between 1910 and 1920. The social definition of who is white expanded to more regularly and systematically include the off-spring of mixed-unions where one parent was “white.” At the same time that a one-drop rule for defining “who is black” was becoming legally and socially entrenched in the United States, an inverted one drop-rule – where any proportion of “white blood” could make a person socially “white” -- seems to have been making significant inroads in Puerto Rico. A one-drop rule for defining a person as “white” was not hegemonic in Puerto Rican society by 1920 -- the offspring of “white”/“mulatto” unions were still much more likely to be classified as “mulatto” than “white” in the 1920 census. But the increasing likelihood that such offspring would be classified as “white” suggests that whatever influence U.S. racial logic had on the island was beginning to lose out by 1920 to an inverse racial calculus according to which the presence of “white blood” was grounds for classification as “white.” Social Mobility and Whitening [section to be added]. The Geography of Whitening This section presents some preliminary findings about the geographic distribution of whitening in Puerto Rico from 1910-1920. We mapped the racial composition of the population by municipality for 1910 and 1920, and discovered that the whitening of the Puerto Rican population in this decade was not evenly distributed across the island. According to census results, 60 municipalities became whiter between 1910 and 1920 and eight municipalities became darker.40
40 Eight new municipalities (Ceiba, Guanica, Guaynabo, Hormigueros, Jayuya, Las Piedras, Luquillo and Villalba) were created in 1920. The comparison shown here, however, does not take them into account. Those municipalities that were divided to form new ones probably had their population underestimated in 1920. Thus, municipalities that had their boundaries changed in 1920 are not comparable with those observed in 1910.
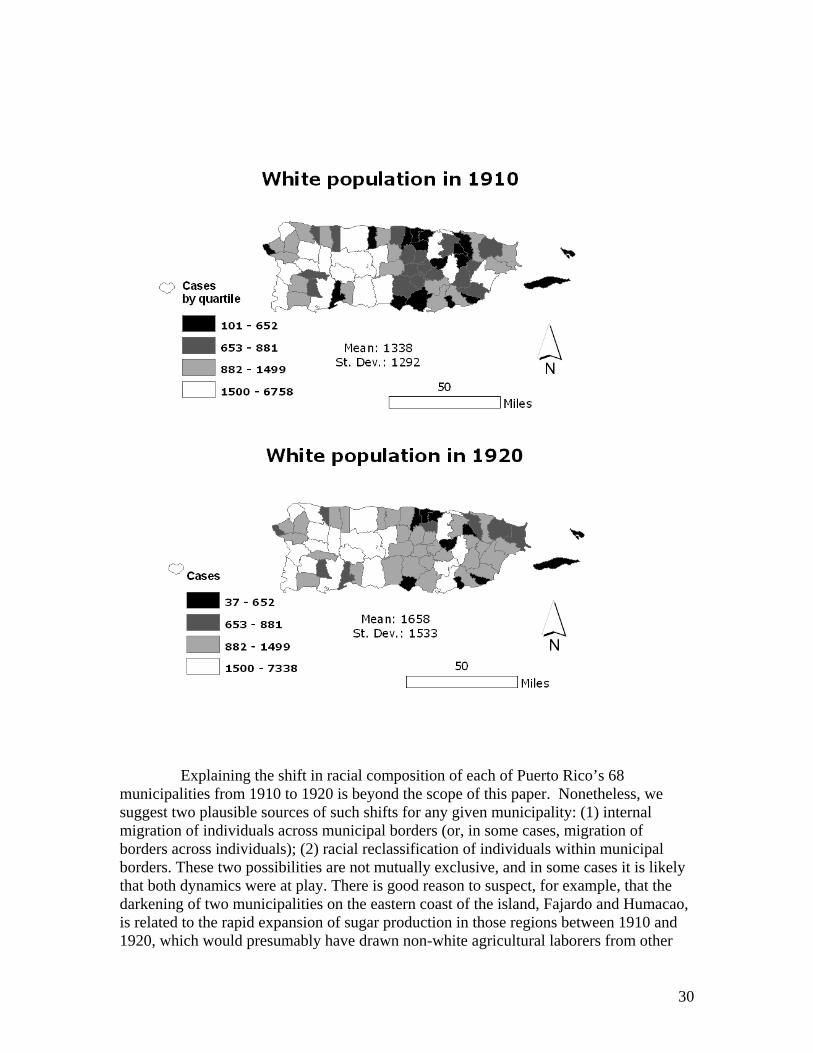
30
Explaining the shift in racial composition of each of Puerto Rico’s 68 municipalities from 1910 to 1920 is beyond the scope of this paper. Nonetheless, we suggest two plausible sources of such shifts for any given municipality: (1) internal migration of individuals across municipal borders (or, in some cases, migration of borders across individuals); (2) racial reclassification of individuals within municipal borders. These two possibilities are not mutually exclusive, and in some cases it is likely that both dynamics were at play. There is good reason to suspect, for example, that the darkening of two municipalities on the eastern coast of the island, Fajardo and Humacao, is related to the rapid expansion of sugar production in those regions between 1910 and 1920, which would presumably have drawn non-white agricultural laborers from other
31
provinces. The migration of many non-whites to the region, meanwhile, might have increased the propensity of census enumerators to perceive individuals living in the region as non-white (“neighborhood effects”). While internal migration may have been a significant factor in the shifting demographic picture of some municípios, however, we can be sure that internal population movements alone cannot account for the overall whitening of the island. This is self-evident, because the shuffling and shifting of the population within Puerto Rico would not alone generate the surplus in the total “white” population of the island in 1920. This leaves us with the question of whether – and why – geography would exert any influence on enumerators’ propensity to classify as “white”, and whether any such influence would be greater in 1920 than in 1910. Why did some municipalities whiten dramatically from 1910 to 1920, others only moderately, and still others not at all? We have yet to explore this question systematically, but three possibilities present themselves. First, it is possible that in municipalities that became more urbanized in this decade, classification as “white” became more likely. This would be consistent with the idea that upward mobility – socioeconomic, occupational, educational – can translate into racial mobility (as in the infamous phrase “money whitens”). In municípios that experienced rapid growth or development in this decade, geography may have exerted an indirect effect on racial classification in the census. By virtue of being in a more prosperous region, individuals might have been more commonly classified as “white” regardless of their individual-level mobility (or lack thereof). A related possibility is that migration across borders within Puerto Rico resulted in racial reclassification due to “neighborhood effects.” Whitening could have been propelled in part by reclassification of migrants in the direction of neighbors. If there was more migration to “whiter” areas in 1920, the net effect of such reclassification would be to statistically whiten the population. A final possibility, not mutually exclusive of the previous two, is that enumerators in some municipalities were simply more likely to classify people as “white” than enumerators in other municipalities, ceteris paribus. It seems unlikely, however, that a few rogue enumerators could have generated the magnitude of whitening reported in official census results in 1920.41 In the future, we will (1) consult the secondary literature to identify areas where migration was a likely cause of the observed change in racial composition (e.g. labor flows into or out of a municipality in this time period); (2) identify municípios where a notable shift in racial composition occurs between 1910-1920 in the absence of known migration into or out of the area in that decade. For this subset of municípios, we could consider other micro-contextual and historical factors that might explain why shifts in classificatory practices would be more dramatic than elsewhere on the island. 41 It would be possible to cross-tabulate the enumerator with the number of times they classified someone as “white” versus other racial categories; but it is not clear how we would read the results of such an exercise regardless of how it turned out. That is, short of a 100% “white” response pattern, what would constitute decisive evidence of systematic bias of individual enumerators? Hypothetically, we could compare racial composition by census tract from 1910-1920, but this is not possible as the data are mapped only to the municipal level.
32
Discussion
We used the Puerto Rican census of 1910 to project the population by race and sex forward ten years. Our empirical findings show that the observed white population was 14 percent higher (697,750/ 611,676) in 1920 than it should have been if sex and race specific net migration and mortality rates were the only factors operating in the demographic racial dynamics of the island. After taking fertility into account, the surplus of whites decreased to ten percent (999,345/ 904,395), suggesting that the number of births contribute to diminish the gap between projected and observed populations.
We did not find evidence to support the hypotheses that differential mortality, fertility and migration rates by race could be responsible for the whitening. Mortality could have contributed to the whitening only very marginally -- whites had higher life expectancy (36.9 years for both sexes) than blacks (28.3) or mulattos (31.7) in 1910 – but these differentials are not large enough to have made a significant impact on the racial composition of the population. Absolute fertility levels probably boosted the white share of the population a little, but could not possibly be responsible for the magnitude of whitening in this decade. Differential fertility and migration rates, meanwhile, would have exerted the opposite of the observed effect – helping to mitigate the whitening of the island rather than contributing to it. Therefore, we must look to non-demographic factors to explain how Puerto Rico became white.
Nor did we find evidence that the whitening of the Puerto Rican population was produced by the Census Office itself. They may well have been eager to demonstrate Puerto Rico’s whiteness to their colonizers (lest they suffer the fate of the Jim Crow south) but there is no evidence that Census Office staff engineered the increase in the white population reported by the 1920 census. A large number of census returns had the racial classifications edited, but the vast majority of those edits reclassified people as “mulatto,” not “white.” Whatever their ideological preferences, it does not appear that the bureaucrats at the Puerto Rican Census Office were responsible for the statistical whitening of the island’s population.
We did find evidence, however, to support the hypothesis that Puerto Rico became white through shifts in the social definition of racial boundaries. Specifically, our results show that certain kinds of individuals were much more likely to be classified as “white” in 1920 than they were in 1910. The children of nominally inter-racial unions were particularly likely to be reclassified as white; they were 60 percent more likely to be “white” in 1920 than they were in 1910. As we noted, however, this is likely an underestimate of the extent of reclassification of children as “white,” because it only includes those children whose parents’ union was classified as “inter-racial” in 1920. Our data on interracial unions, meanwhile, suggests that many unions that appeared as inter-racial in 1910 appeared as endogamous in 1920, an artifact of partners’ reclassification to match their spouses. In the total population, the number of endogamous white marriages jumped from 59 to 69 percent between 1910 and 1920, and within each racial group, the prevalence of marriages with a “white” partner increased over time. The exogamy rate, meanwhile, declined for the total population, and in particular for unions involving “mulattos.” Taken together, these trends suggest that a cultural preference for union-formation with a lighter spouse was amplified several-fold, as a source of whitening, by the racial reclassification of spouses.

33
It seems clear from our analysis so far that the primary mechanism of whitening in early twentieth-century Puerto Rico was the shifting definition of who counted as white. Echoing the recent contribution by Carvalho et al (2004), we found that the increase in the white share of the population could only be due to the reclassification of significant numbers of individuals from one census to the next. We pushed beyond this finding, however, to explore who, in the general population, was most likely to be reclassified as “white.” Our findings to date lend empirical support to those who have speculated, over the course of the twentieth century, that the growth in the white population of Puerto Rico was both a product and a reflection of the influence of whitening ideology on the island. But our analysis suggests that the mechanism through which whitening ideology exerted its effects was not as straightforward as most existing accounts suggest. Official statistics describing the whitening of the Puerto Rican population did not simply register an increase in inter-racial unions and their progeny – whitening was not the demographic process that both its advocates and its critics tended to assume. It appears that whitening resulted, instead, from a change in the social definition of whiteness itself. The boundary of whiteness in Puerto Rican society shifted during the first half of the twentieth century, and especially in the decade from 1910-1920. Individuals who were seen to be on one side of the racial boundary in 1910 found themselves on the other side in 1920. This suggests that the story of how Puerto Rico became white may be as much or more a story of racial boundaries migrating over individuals as it is a story of individuals crossing over racial boundaries. Concluding thoughts: Social Demography and the Social Construction of Race
As we noted at the outset of this paper, there is a tension between social constructivist and demographic approaches to the study of “race.” This tension derives, at least in part, from demographers’ necessary reliance on census data or other large-scale surveys to explore racial disparities in demographic outcomes. As constructivist analyses have shown, the particular category sets used to classify populations by “race” in large-scale social surveys are themselves a testament to historical struggles over the meaning of race and the nature of racial boundaries. Indeed, the instability of racial categories in U.S. censuses over time may well be the most frequently invoked illustration of the point that “race is socially constructed” (cf. Lee 1993; Dominguez 1996; Nobles 2000; Rodriguez 2000; Goldberg 199x; Pederson 198x; etc.). Beyond the U.S., too, the racial categories used in censuses have been scrutinized and deconstructed as cultural artifacts that reveal the racialist visions, political interests, and ideological biases of those who produce them (see, for example, Hirschman 1986; 1983; Nobles 2000; Dominguez 1996; Patriarca 1996; Hirsh 199x). Yet in the wake of this constructivist critique, demographers have, almost without exception, proceeded-as-usual to investigate and explain differences between “racial groups” delimited by the very racial categories that have been heralded as prima facie evidence of the social construction of race.
The technical and methodological challenges posed by changes in racial categories used from one census to the next tend to be taken very seriously in social demographic research. But the corresponding conceptual challenge posed by the socially constructed nature of such categories is rarely confronted directly. What, exactly, is
34
captured by the racial categories used in large-scale datasets that are the mainstay of quantitative sociological and social demographic research? If race is not a biological characteristic, nor even an individual attribute, but rather a social construction that is an expression of a social relationship, then what, after all, do the racial categories in our datasets denote? Are they indicators of social group membership, where social groups have been defined in racial terms? Are they indicators of individual physical appearance, with no necessary connection to membership in a social group? Are they indicators of social status, and only loosely if at all connected to phenotypical traits? Or are they indicators of individual self-understandings, of “identity” – whatever that may be understood to mean in a given time or place? In semiotic terms, how do we know what the “sign” (the racial category) signifies in any given dataset?
It could be argued that for the purpose of doing demographic research on a wide range of questions it really does not matter what racial categories actually denote. After all, the steady flow of studies demonstrating disparities in social demographic outcomes between the sets of individuals captured by the racial categories used in censuses would seem to render irrelevant any discussion of what the categories “really” designate. As long as the population sets demarcated by racial categories continue to exhibit statistically significant disparities in socially relevant outcomes, then social demographers may be justified to bracket concerns about the meaning of racial categories – leaving such considerations to cultural sociologists, anthropologists, historians, and the like. Indeed, taking this line of reasoning further, the empirical findings of social demographers with respect to racial group differences might even be seen to pose a challenge to constructivist accounts of race, especially those that see the existence of race in discourse, ideology, institutionalized knowledge, or embodied practices, but reject the substantialist proposition that races exist qua social groups.
But the case presented here offers a modest example of why the pragmatic neglect of constructivism may not always be an optimal stance. At a minimum, our analysis of how Puerto Rico became white suggests that for a certain range of questions demographers’ decision to hold constructivist insights about race in abeyance may actually undermine the explanatory potential of demographic models and modes of analysis. Our attempt to bring social demographic and constructivist perspectives together around the question of racial whitening in Puerto Rico highlights the fact that there are real tensions between these approaches with respect to the study of race. It may be, however, that the explanatory leverage of both perspectives would be enhanced if these tensions were openly acknowledged and addressed rather than ignored.

35
References (incomplete list) Administración de Reconstrucción de Puerto Rico. 1938. Censo de Puerto Rico: 1935
Población y Agricultura. Washington: United States Government Printing Office. Arriaga, E. 1983. "Estimating fertility from data on children ever born by age of mother."
in International Research Document No. 11. Washington, DC: United States Bureau of the Census.
Brass, W., Ansley J. Coale, Paul Demeny, Donald F. Heisel, Frank Lorimer, Anatole
Romaniuk, and Etienne Van de Walle. 1968. The Demography of Tropical Africa. Princeton: Princeton University Press.
Calzada, J.L.V. 1988. La Población de Puerto Rico y su Trayectoria Histórica: Escuela
Graduada de Salud Publica Recinto de Ciencias Medicas Universidad de Puerto Rico.
Carvalho, J.A.M.d., Charles H.Wood, and Flavia Cristina Drummond Andrade. 2004.
"Estimating the stability of census-based racial/ethnic classifications: The case of Brazil." Population Studies 58(3):331-343.
Combs, J.W., and Kingsley Davis. 1951. "Differential Fertility in Puerto Rico."
Population Studies 5(2):104-116. de la Fuente, Alejandro. 2001. Race, Inequality and Politics in Twentieth-Century Cuba.
Chapel Hill: University of North Carolina Press. Duany, J. 2000. "Neither White nor Black: the Politics of Race and Ethnicity among
Puerto Ricans on the Island and in the US Mainland." Presented at The Meaning of Race and Blackness in the Americas: Contemporary Perspectives, Brown University, Providence, Rhode Island.
Duany, J. 2002. The Puerto Rican Nation on the Move: Identities on the Island and in the
United States. Chapel Hill and London: University of North Carolina Press. Findlay, Eileen J. Suárez. 1999. Imposing Decency: The Politics of Sexuality and Race in
Puerto Rico, 1870-1920. Durham and London: Duke University Press. Frank, Reanne. 2001. “The Misuse of Biology in Demographic Research on
Racial/Ethnic Differences: A reply to van den Oord and Rowe.” Demograph 38(4): 563-567.
Graham, Richard, (ed.). 1990. The Idea of Race in Latin America, 1870-1940. Austin:
University of Texas Press.
36
Lesser, Jeff. 1999. Negotiating National Identity: Immigrants, Minorities, and the Struggle for Ethnicity in Brazil. Durham: Duke University Press.
Mortara, G. 1949. "Methods of Using Census Statistics for the Calculation of Life Tables
and Other Demographic Measures." Pp. 40-60 in United Nations publication, sales no. 1950. XIII.3.
Paret and Saperstein. Unpublished manuscript. “Inheriting Race: the Classification of
U.S. Newborns in the ECLS-B” (http://paa2006.princeton.edu/download.aspx?submissionId=60768)
Preston, S.H., Patrick Heuveline; Michel Guillot. 2001. Demography: Measuring and
Modeling Population Processes. Malden, Massachusetts: Blackwell Publishers. Rogler, Charles C. 1972 [1946]. “The Morality of Race Mixing in Puerto Rico.” Pp.57-64
in Eugenio Fernández Méndez, ed., Portrait of a Society: Readings on Puerto Rican Sociology. Rio Piedras, P.R.: University of Puerto Rico Press.
Skidmore, Thomas.1993 [1974]. Black into White. Race and Nationality in Brazilian
Thought. Durham: Duke University Press. U.S. Department of Commerce, B.o.t.C. 1913. Thirteenth Census of the United States
Taken in the Year 1910: Statistics for Porto Rico. Washington: Government Printing Office.
Unites States. War Department. 1900. Informe sobre el Censo de Puerto Rico, 1899. Dirección del Censo de Puerto Rico. Washington: Imprenta del Gobierno.
United-Nations. 1988. MortPak - The United Nations Software Package for Mortality
Measurement, Batch-oriented Software for the Mainframe Computer. New York: United Nations.
van den Oord, E.J.C.G. and D. Rowe. 2000. "Racial Differences in Birth Health Risk: A Quantitative Genetic Approach." Demography 37:285-98
Velyvis, Kristin, Teressa Thompson-Colón and Halliman Winsborough. (In Progress).
“Public Use Samples of 1910 and 1920 Puerto Rico Censuses.” Xie, Yu and Kimberly Goyette. 1997. “The Racial identification of Biracial Children
with One Asian Parent: Evidence from the 1990 Census.” Social Forces 76:547-70.
.

37
APPENDIX 1. Steps to estimate sex-race-specific life tables 1. Estimate race-specific child mortality probabilities (qi(x)), for both sexes at age x, using Brass method of indirect mortality (Brass et al, 1968), available in the software MORTPAK (UN, 1988); 2. After converting race-specific child mortality probabilities (qi(x)) into probabilities of surviving (pi(x) = 1- qi(x)), we calculated child sex-race-specific survival probabilities (pM
c, j (x, t-x), pFc, j (x, t-x) ) solving the following system:
( )
( )⎪⎪⎩
⎪⎪⎨
⎧
−+−=
−−
∗−−
=
2 ),(05.21),(
05.205.1)(
1 ),(),(
)()(
),(),(
,,
,
,
xtxpxtxpxp
xtxpxtxp
xtBxtB
txNtxN
Fic
Mici
Fic
Mic
Fi
Mi
Fi
Mi
Where B (t-x) is the number of births, N (x, t) is the number of males (M) or females (F) at age x in year t; i indexes the race (white, black or mulatto); and 1.05 is the Sex Ratio at Birth (SRB); 3. Calculate the number of survivors at age x, li M, F(x), for each sex (M or F) and race i. li M (x) = p Mc, j (x, t-x) * 100,000 (3) li F (x) = p F
c, j (x, t-x) * 100,000 (4) For instance, after using the Coale and Demeny West Patten of mortality (United Nations, 1983) in step one we obtain:
These estimates represent different levels of mortality by sex and race for different ages (i.e. different cohorts born in different years) and are associated with a full life table that can be obtained using MORTPAK (UN, 1988). 4. Take the average of the life expectancies estimated for ages 5, 10 and 15 using the mortality patterns of the West, South, North and the United Nations general life tables. Because mortality has not been constant, estimated life expectancies at ages 5, 10 and 15 refer, respectively, to years 1904, 1902 and 1899. As a result, we had to assume that mortality in 1910 has remained constant and equal to the average of the observed in these three years. Life expectancies at age one was not considered because of under reporting.
Total Pop WHITE BLACK MULLATO Total Pop WHITE BLACK MULLATO0-1 77,883 80,294 88,257 73,197 76,483 78,871 85,270 71,973 1-50-5 71,900 74,224 59,908 68,716 72,105 74,175 63,992 68,889 0-10 68,417 70,860 64,362 64,358 68,792 70,737 60,750 66,084 0-15 66,830 68,114 59,485 65,132 65,539 67,265 61,360 62,606 0-20 58,974 60,465 55,585 56,395 71,737 73,042 72,016 68,910
WEST PATTERNl(x)MALES (Males who reach age x) l(x)FEMALES (Females who reach age x)

38
Life expectancy at age 20 was also not considered in the global average because the sex ratio is very low at these ages due to male emigration, which affects equation 1. Mortality estimates in the first (reported by women between 15 and 24 years) and last (45-49 years) age groups are also usually biased because of the high proportion of first births, which generally have above-average risks of mortality, and because of recall errors in the last age groups. After averaging the life expectancies given by the West, South, North and UN general mortality patterns we obtain:
Total Pop WHITE BLACK MULLATO Total Pop WHITE BLACK MULLATO34.67 36.55 28.43 31.53 33.80 35.86 27.25 30.84
e(0)MALES e(0)FEMALESAVERAGE of average of the patterns
The table above shows that, within each sex, life expectancies are plausible. However, between the sexes, male mortality is too high. To solve this paradox, we decided to estimate new life tables by sex using published data (Calzada, 1988: 221), but making use of the inter-sexual difference by race, given by the following ratios: For white males: 36.55/ 34.67 = 1.0542 For black males: 28.43/ 34.67 = .82 Mulattos: 31.53/ 34.67 = .9094 For white females: 35.86/ 33.80 = 1.0609 For black females: 27.25/ 33.80 = .8062 Mulattas: 30.84/ 33.80 = .9124 These numbers show, for instance, that white males have life expectancy at birth 5.42 percent higher than the total population, while the life expectancy of black males is 82 percent of the one observed in the total male population. These adjustment factors are used in step 8, after re-estimating life expectancies by sex. 5. Calzada (1988: 221) reports, for both sexes combined, age-specific mortality rates in 1903 and 1930. Using this information, we applied age-specific reduction factors (nRFx) for age-specific mortality rates observed in 1903 to interpolate values for 1910. For 1903-1910 and 1910-1920, nRFx between ages x and x+ n are defined as:
)1( 1920,19101903
193019031910,1903
xx
xxxn RFm
mmRF++
= (5)
Where RF are Reduction Factors between 1903-1910 and 1910-1920, and mx are death rates at a given superscripted year. When RFx
1903,1910 = RFx1910,1920, then equation (5)
becomes a quadratic equation with only one positive root:
0)()( 193019031910,1903190321910,19031903 =−−∗+∗ xxxxxx mmRFmRFm (6)
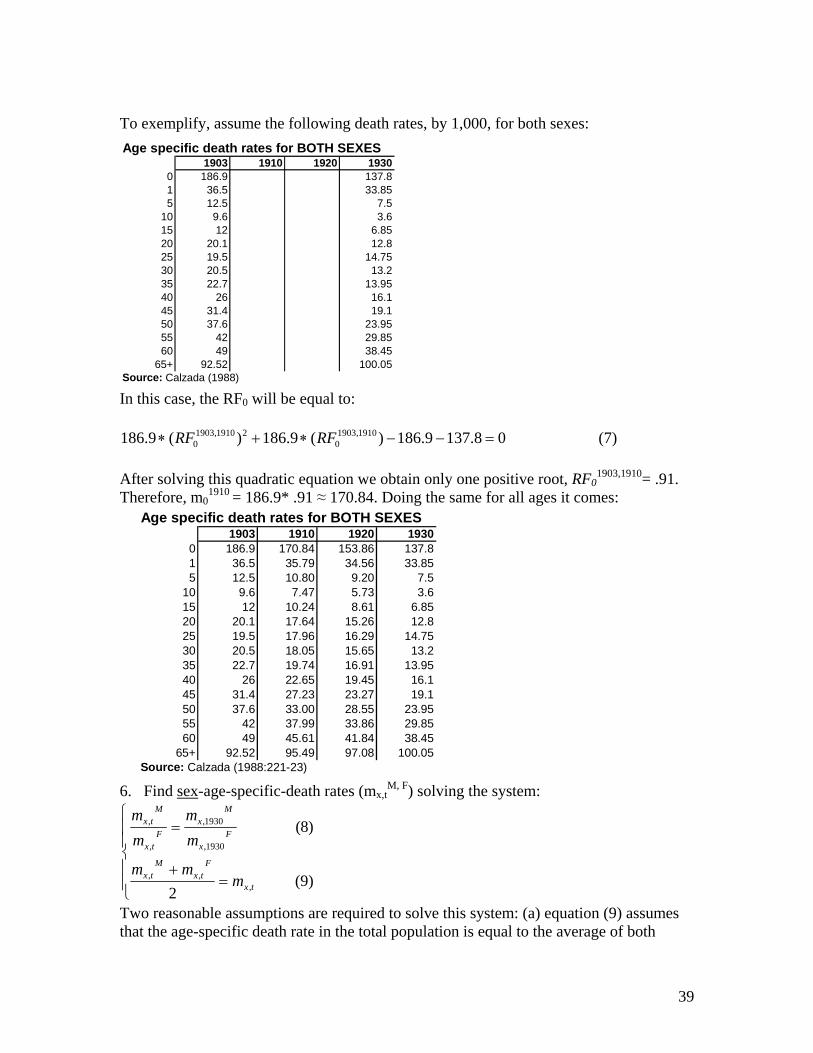
39
To exemplify, assume the following death rates, by 1,000, for both sexes: In this case, the RF0 will be equal to:
08.1379.186)(9.186)(9.186 1910,19030
21910,19030 =−−∗+∗ RFRF (7)
After solving this quadratic equation we obtain only one positive root, RF0
1903,1910= .91. Therefore, m0
1910 = 186.9* .91 ≈ 170.84. Doing the same for all ages it comes: 6. Find sex-age-specific-death rates (mx,t
M, F) solving the system:
⎪⎪
⎩
⎪⎪
⎨
⎧
=+
=
)9( 2
)8(
,,,
1930,
1930,
,
,
tx
Ftx
Mtx
Fx
Mx
Ftx
Mtx
mmm
mm
mm
Two reasonable assumptions are required to solve this system: (a) equation (9) assumes that the age-specific death rate in the total population is equal to the average of both
Age specific death rates for BOTH SEXES1903 1910 1920 1930
0 186.9 137.81 36.5 33.855 12.5 7.5
10 9.6 3.615 12 6.8520 20.1 12.825 19.5 14.7530 20.5 13.235 22.7 13.9540 26 16.145 31.4 19.150 37.6 23.9555 42 29.8560 49 38.45
65+ 92.52 100.05Source: Calzada (1988)
Age specific death rates for BOTH SEXES1903 1910 1920 1930
0 186.9 170.84 153.86 137.81 36.5 35.79 34.56 33.855 12.5 10.80 9.20 7.5
10 9.6 7.47 5.73 3.615 12 10.24 8.61 6.8520 20.1 17.64 15.26 12.825 19.5 17.96 16.29 14.7530 20.5 18.05 15.65 13.235 22.7 19.74 16.91 13.9540 26 22.65 19.45 16.145 31.4 27.23 23.27 19.150 37.6 33.00 28.55 23.9555 42 37.99 33.86 29.8560 49 45.61 41.84 38.45
65+ 92.52 95.49 97.08 100.05Source: Calzada (1988:221-23)

40
sexes; (b) equation (8) assumes that the ratio between sex-age specific death rates in 1910 and 1920 was the same as the one observed in 1930. This is reasonable given the temporal stability of the ratio before 1960.
7. With age-sex specific mortality rates in hand, we were able to calculate two life tables for Puerto Rico in 1910, one for males and another for females. 1910 MALES
Age x n nmx nax nqx npx lx lx+n ndx nLx Tx eox
0 1 0.1799 0.556691 0.1666 0.833397 100,000 83,340 16,660 92,614 3,431,476 34.3151 4 0.0358 1.248928 0.1305 0.869510 83,340 72,465 10,875 303,441 3,338,862 40.0635 5 0.0112 2.500000 0.0546 0.945365 72,465 68,506 3,959 352,425 3,035,421 41.888
10 5 0.0079 2.500000 0.0387 0.961336 68,506 65,857 2,649 335,906 2,682,996 39.16515 5 0.0093 2.500000 0.0453 0.954709 65,857 62,874 2,983 321,827 2,347,090 35.63920 5 0.0172 2.500000 0.0826 0.917415 62,874 57,682 5,192 301,390 2,025,262 32.21125 5 0.0169 2.500000 0.0812 0.918822 57,682 52,999 4,682 276,702 1,723,873 29.88630 5 0.0164 2.500000 0.0788 0.921204 52,999 48,823 4,176 254,556 1,447,171 27.30635 5 0.0187 2.500000 0.0892 0.910782 48,823 44,467 4,356 233,226 1,192,615 24.42740 5 0.0228 2.500000 0.1078 0.892179 44,467 39,673 4,795 210,350 959,389 21.57545 5 0.0289 2.500000 0.1349 0.865058 39,673 34,319 5,354 184,980 749,040 18.88150 5 0.0367 2.500000 0.1679 0.832107 34,319 28,557 5,762 157,191 564,060 16.43655 5 0.0428 2.500000 0.1932 0.806834 28,557 23,041 5,516 128,995 406,869 14.24860 5 0.0515 2.500000 0.2281 0.771924 23,041 17,786 5,255 102,067 277,874 12.06065 5 0.1012 1.0000 0.000000 17,786 0 17,786 175,807 175,807 9.885
1910 FEMALESAge x n nmx nax nqx npx lx lx+n ndx nLx Tx eo
x
0 1 0.1618 0.506009 0.1498 0.850185 100,000 85,018 14,982 92,599 3,531,749 35.3171 4 0.0357 1.276404 0.1303 0.869744 85,018 73,944 11,074 309,912 3,439,150 40.4525 5 0.0104 2.500000 0.0505 0.949462 73,944 70,207 3,737 360,379 3,129,238 42.319
10 5 0.0071 2.500000 0.0347 0.965335 70,207 67,774 2,434 344,952 2,768,859 39.43815 5 0.0112 2.500000 0.0545 0.945472 67,774 64,078 3,696 329,629 2,423,907 35.76520 5 0.0181 2.500000 0.0864 0.913622 64,078 58,543 5,535 306,553 2,094,278 32.68325 5 0.0190 2.500000 0.0907 0.909344 58,543 53,236 5,307 279,447 1,787,726 30.53730 5 0.0197 2.500000 0.0938 0.906184 53,236 48,241 4,994 253,693 1,508,279 28.33235 5 0.0208 2.500000 0.0989 0.901144 48,241 43,472 4,769 229,285 1,254,586 26.00640 5 0.0225 2.500000 0.1066 0.893439 43,472 38,840 4,632 205,781 1,025,301 23.58545 5 0.0255 2.500000 0.1199 0.880055 38,840 34,181 4,659 182,553 819,520 21.10050 5 0.0294 2.500000 0.1367 0.863273 34,181 29,508 4,674 159,223 636,967 18.63555 5 0.0332 2.500000 0.1534 0.846645 29,508 24,983 4,525 136,226 477,744 16.19060 5 0.0397 2.500000 0.1808 0.819249 24,983 20,467 4,516 113,624 341,518 13.67065 5 0.0898 1.0000 0.000000 20,467 0 20,467 227,893 227,893 11.135
Ratio between Sex-ASDR over time
0.00.5
1.01.5
2.02.53.0
3.54.0
4.55.0
1930 1940 1950 1960 1970 1980 1985
0
1
5
10
15
20
25
30
35
40
45
50
55
60
65
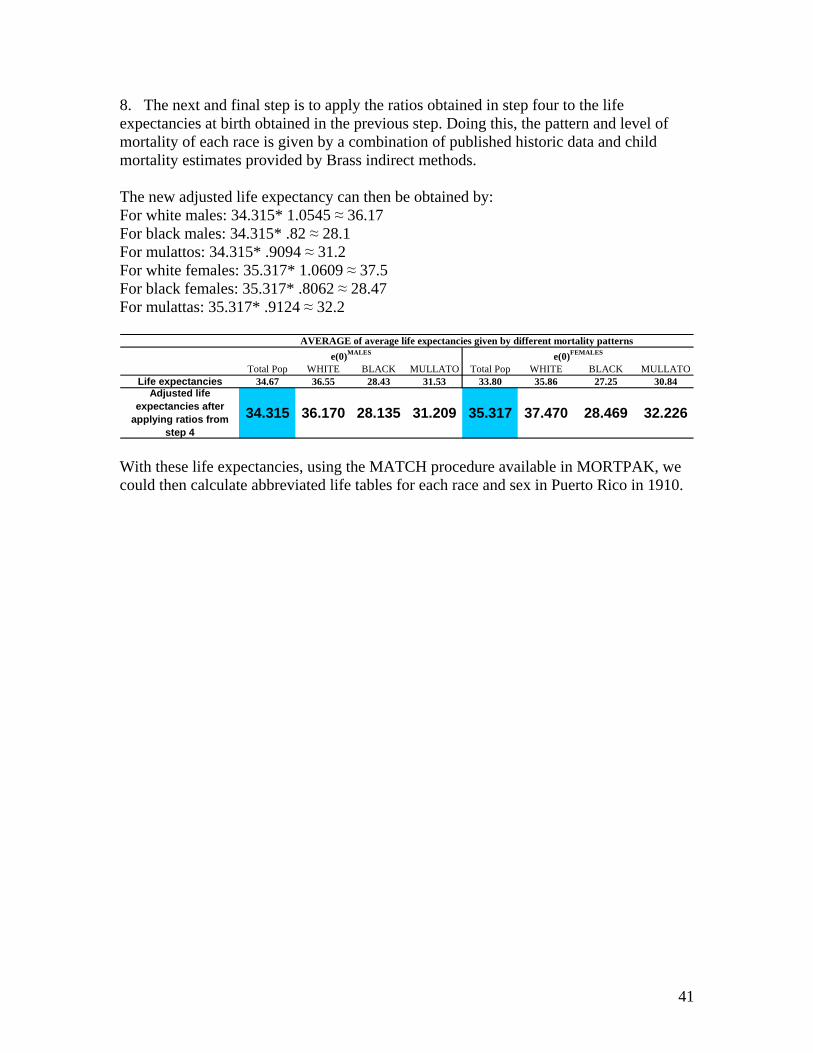
41
8. The next and final step is to apply the ratios obtained in step four to the life expectancies at birth obtained in the previous step. Doing this, the pattern and level of mortality of each race is given by a combination of published historic data and child mortality estimates provided by Brass indirect methods. The new adjusted life expectancy can then be obtained by: For white males: 34.315* 1.0545 ≈ 36.17 For black males: 34.315* .82 ≈ 28.1 For mulattos: 34.315* .9094 ≈ 31.2 For white females: 35.317* 1.0609 ≈ 37.5 For black females: 35.317* .8062 ≈ 28.47 For mulattas: 35.317* .9124 ≈ 32.2
Total Pop WHITE BLACK MULLATO Total Pop WHITE BLACK MULLATO34.67 36.55 28.43 31.53 33.80 35.86 27.25 30.84
Adjusted life expectancies after
applying ratios from step 4
34.315 36.170 28.135 31.209 35.317 37.470 28.469 32.226
e(0)MALES e(0)FEMALESAVERAGE of average life expectancies given by different mortality patterns
Life expectancies
With these life expectancies, using the MATCH procedure available in MORTPAK, we could then calculate abbreviated life tables for each race and sex in Puerto Rico in 1910.

42
APPENDIX 2. Sex-race specific life tables
WHITE WOMEN, Puerto Rico 1910, FOR A VALUE OF E(0)= 37.470 WHITE MEN, Puerto Rico 1910, FOR A VALUE OF E(0)= 36.170AGE M(X,N) Q(X,N) I(X) D(X,N) L(X,N) S(X,N) T(X) E(X) A(X,N) AGE M(X,N) Q(X,N) I(X) D(X,N) L(X,N) S(X,N) T(X) E(X) A
0 0.15917 0.14425 100000 14425 90624 0.81078 3747001 37.47 0.35 0 0.17853 0.15946 100000 15946 89316 0.79689 3617003 36.171 0.03315 0.12193 85575 10434 314765 0.90503 3656377 42.727 1.361 1 0.0331 0.12171 84054 10231 309127 0.90282 3527686 41.9695 0.00961 0.04694 75141 3527 366887 0.96021 3341612 44.471 2.5 5 0.01045 0.05091 73824 3758 359723 0.95622 3218560 43.598
10 0.00656 0.03228 71614 2312 352289 0.96043 2974725 41.539 2.5 10 0.00739 0.03627 70066 2541 343975 0.96184 2858837 40.80215 0.01037 0.05061 69302 3507 338351 0.93442 2622436 37.841 2.673 15 0.0087 0.04261 67525 2877 330848 0.94034 2514862 37.24420 0.01673 0.08037 65795 5288 316160 0.91609 2284085 34.715 2.577 20 0.01619 0.07792 64647 5037 311110 0.92064 2184014 33.78425 0.0177 0.08474 60507 5127 289631 0.91369 1967925 32.524 2.483 25 0.01596 0.07671 59610 4573 286421 0.92486 1872905 31.41930 0.01841 0.08799 55380 4873 264634 0.90952 1678293 30.305 2.483 30 0.01546 0.07442 55037 4096 264901 0.92138 1586484 28.82635 0.01961 0.09345 50507 4720 240690 0.90287 1413660 27.989 2.491 35 0.01766 0.08463 50941 4311 244074 0.90703 1321583 25.94340 0.02141 0.10159 45787 4652 217312 0.89216 1172970 25.618 2.501 40 0.02169 0.10296 46630 4801 221382 0.88458 1077509 23.10745 0.02442 0.11507 41135 4734 193876 0.87686 955658 23.232 2.507 45 0.02769 0.12963 41829 5422 195831 0.85437 856127 20.46750 0.02823 0.13185 36402 4800 170002 0.8604 761782 20.927 2.498 50 0.03535 0.16247 36407 5915 167312 0.82511 660295 18.13655 0.03209 0.14852 31602 4694 146268 0.83852 591781 18.726 2.498 55 0.04153 0.18804 30492 5734 138051 0.79548 492983 16.16860 0.03856 0.17574 26909 4729 122648 0.7247 445512 16.556 2.485 60 0.05028 0.223 24758 5521 109816 0.6906 354932 14.33665 0.0687 ..... 22180 22180 322864 ..... 322864 14.557 14.557 65 0.07848 ..... 19237 19237 245116 ..... 245116 12.742
BLACK WOMEN, Puerto Rico 1910, FOR A VALUE OF E(0)= 28.469 BLACK MEN, Puerto Rico 1910, FOR A VALUE OF E(0)= 28.135AGE M(X,N) Q(X,N) I(X) D(X,N) L(X,N) S(X,N) T(X) E(X) A(X,N) AGE M(X,N) Q(X,N) I(X) D(X,N) L(X,N) S(X,N) T(X) E(X) A
0 0.20374 0.17991 100000 17991 88306 0.75512 2846900 28.469 0.35 0 0.23661 0.20423 100000 20423 86316 0.73336 2813500 28.1351 0.0508 0.17919 82009 14695 289254 0.85926 2758594 33.638 1.361 1 0.05111 0.18006 79577 14328 280366 0.85593 2727184 34.2715 0.01498 0.07217 67313 4858 324422 0.93873 2469340 36.684 2.5 5 0.01579 0.07595 65248 4955 313854 0.93525 2446818 37.5
10 0.01015 0.04951 62455 3092 304546 0.93896 2144918 34.343 2.5 10 0.01081 0.05264 60293 3174 293532 0.94508 2132964 35.37715 0.01625 0.07827 59363 4646 285957 0.89925 1840373 31.002 2.663 15 0.01245 0.06049 57120 3455 277411 0.91628 1839432 32.20320 0.0261 0.12268 54717 6713 257146 0.87346 1554416 28.408 2.551 20 0.02293 0.10861 53664 5829 254187 0.88989 1562021 29.10725 0.02695 0.1261 48004 6053 224608 0.87298 1297270 27.024 2.454 25 0.02244 0.10609 47836 5075 226199 0.8959 1307834 27.3430 0.02736 0.12787 41951 5364 196077 0.87107 1072663 25.569 2.45 30 0.02176 0.10311 42761 4409 202652 0.89238 1081636 25.29535 0.0279 0.13026 36587 4766 170796 0.86794 876585 23.959 2.453 35 0.02422 0.11421 38352 4380 180842 0.87666 878983 22.91940 0.02891 0.1347 31821 4286 148242 0.86007 705789 22.18 2.466 40 0.02878 0.13431 33971 4563 158537 0.85246 698141 20.55145 0.03163 0.14645 27534 4032 127498 0.84572 557547 20.249 2.477 45 0.03538 0.16261 29409 4782 135146 0.82116 539604 18.34850 0.03552 0.16297 23502 3830 107828 0.82944 430049 18.298 2.472 50 0.04345 0.1958 24627 4822 110976 0.79282 404458 16.42455 0.03948 0.17952 19672 3531 89437 0.80716 322221 16.38 2.473 55 0.04937 0.21931 19805 4343 87984 0.76456 293482 14.81960 0.04641 0.20755 16140 3350 72190 0.68989 232784 14.422 2.459 60 0.05828 0.25357 15461 3921 67269 0.67265 205498 13.29165 0.07964 ..... 12790 12790 160595 ..... 160595 12.556 12.556 65 0.08349 ..... 11541 11541 138229 ..... 138229 11.977
MULLATA WOMEN, Puerto Rico 1910, FOR A VALUE OF E(0)= 32.226 MULLATO MEN, Puerto Rico 1910, FOR A VALUE OF E(0)=31.209AGE M(X,N) Q(X,N) I(X) D(X,N) L(X,N) S(X,N) T(X) E(X) A(X,N) AGE M(X,N) Q(X,N) I(X) D(X,N) L(X,N) S(X,N) T(X) E(X) A
0 0.18365 0.16407 100000 16407 89336 0.78001 3222600 32.226 0.35 0 0.21253 0.18604 100000 18604 87535 0.75923 3120899 31.2091 0.04247 0.15277 83593 12771 300670 0.8806 3133264 37.482 1.361 1 0.04332 0.15545 81396 12653 292079 0.8759 3033364 37.2675 0.01243 0.06027 70822 4268 343440 0.94889 2832595 39.996 2.5 5 0.01349 0.06523 68743 4484 332505 0.94422 2741285 39.877
10 0.00845 0.04136 66554 2753 325888 0.94912 2489154 37.401 2.5 10 0.00935 0.04566 64259 2934 313959 0.9522 2408780 37.48515 0.01345 0.0652 63801 4160 309305 0.91578 2163266 33.906 2.668 15 0.01086 0.05293 61325 3246 298953 0.9264 2094821 34.1620 0.02166 0.10285 59641 6134 283256 0.89337 1853961 31.085 2.563 20 0.02008 0.09575 58079 5561 276949 0.90276 1795868 30.92125 0.02259 0.10685 53507 5717 253053 0.89188 1570706 29.355 2.467 25 0.0197 0.0938 52518 4926 250019 0.90802 1518919 28.92230 0.02317 0.10942 47790 5229 225693 0.88878 1317653 27.572 2.465 30 0.0191 0.0911 47591 4336 227023 0.90447 1268900 26.66235 0.02406 0.1134 42561 4826 200592 0.88385 1091960 25.656 2.47 35 0.02147 0.10193 43256 4409 205336 0.8892 1041877 24.08640 0.02548 0.11972 37734 4518 177293 0.87451 891368 23.622 2.481 40 0.02584 0.12143 38847 4717 182586 0.86557 836541 21.53445 0.02837 0.13241 33217 4398 155044 0.8596 714075 21.497 2.49 45 0.03223 0.14922 34130 5093 158041 0.83455 653955 19.16150 0.03225 0.14916 28819 4299 133276 0.84314 559031 19.398 2.484 50 0.04017 0.18244 29037 5298 131894 0.8057 495914 17.07955 0.03619 0.16584 24520 4067 112370 0.82094 425755 17.363 2.484 55 0.04622 0.2069 23739 4912 106267 0.77679 364020 15.33460 0.04293 0.19362 20454 3960 92249 0.70564 313385 15.322 2.47 60 0.05509 0.24153 18828 4547 82547 0.67975 257753 13.6965 0.07459 ..... 16493 16493 221136 ..... 221136 13.408 13.408 65 0.0815 ..... 14280 14280 175207 ..... 175207 12.269
Related Documents