Population, Socioeconomics and Health Summary FEBRUARY 2011 How healthy are we? 2010 ALBERTA

Welcome message from author
This document is posted to help you gain knowledge. Please leave a comment to let me know what you think about it! Share it to your friends and learn new things together.
Transcript
Population, Socioeconomics and
Health Summary
FEBRUARY 2011
Ho
w h
ealt
hy
are
we?
20
10
ALBERTA
How healthy are we? / 2010 : Alberta 2
If you have questions about the information in this report, please contact:
Health Status Assessment, Population & Public Health, Alberta Health Services
Phone 780-342-0284
Suite 104, Main Floor, West Tower
14310 – 111 Avenue
Edmonton, AB T5M 3Z7
AHS provides this Health Status Report (the "How healthy are we? 2010" Report) on an "as-is, where-is" basis, and hereby expressly disclaims
any other representation or warranty, express or implied, oral or written, statutory or otherwise, including without limitation, warranties of fitness
for a particular purpose, implied warranties, and warranties of non-infringement or merchantability. AHS has made reasonable efforts to ensure the
accuracy of the information included in the Report. AHS expressly disclaims all liability for the use of the Report and for any claims, actions, demands
or suits arising from such use.
© 2011 Alberta Health Services
This material is protected by Canadian copyright law.
Suggested Citation:
Predy GN, Lightfoot P, Edwards J, Sevcik M, Fraser-Lee N, Zhang J, Dominey J, Si J, Meyer C, Pennicott D, Walker S, Johnston C, Hildebrandt C,
Shahid R, Seidel J. How healthy are we? 2010 Report of the Senior Medical Officer of Health, Population and Public Health, Alberta Health Services,
Edmonton, AB (February 2011).
How healthy are we? / 2010 : Alberta 3
Population of Alberta
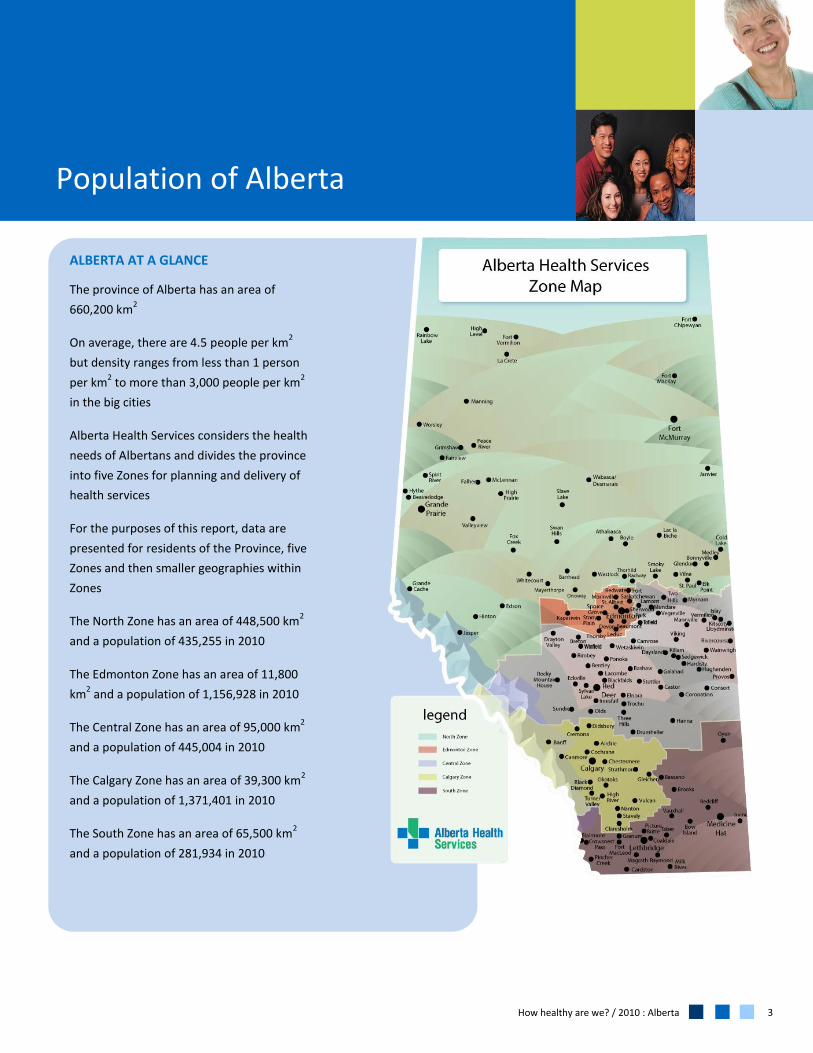
ALBERTA AT A GLANCE
The province of Alberta has an area of
660,200 km2
On average, there are 4.5 people per km2
but density ranges from less than 1 person
per km2 to more than 3,000 people per km
2
in the big cities
Alberta Health Services considers the health
needs of Albertans and divides the province
into five Zones for planning and delivery of
health services
For the purposes of this report, data are
presented for residents of the Province, five
Zones and then smaller geographies within
Zones
The North Zone has an area of 448,500 km2
and a population of 435,255 in 2010
The Edmonton Zone has an area of 11,800
km2 and a population of 1,156,928 in 2010
The Central Zone has an area of 95,000 km2
and a population of 445,004 in 2010
The Calgary Zone has an area of 39,300 km2
and a population of 1,371,401 in 2010
The South Zone has an area of 65,500 km2
and a population of 281,934 in 2010
How healthy are we? / 2010 : Alberta 4
Table 1: Population Summary for Albertans
Year Male Female Total
2000 1,482,169 1,486,514 2,968,683
2010 1,848,641 1,841,881 3,690,522
2020 2,229,289 2,190,420 4,419,709
Source: Please refer to Appendix 1 – Data Sources and Definitions
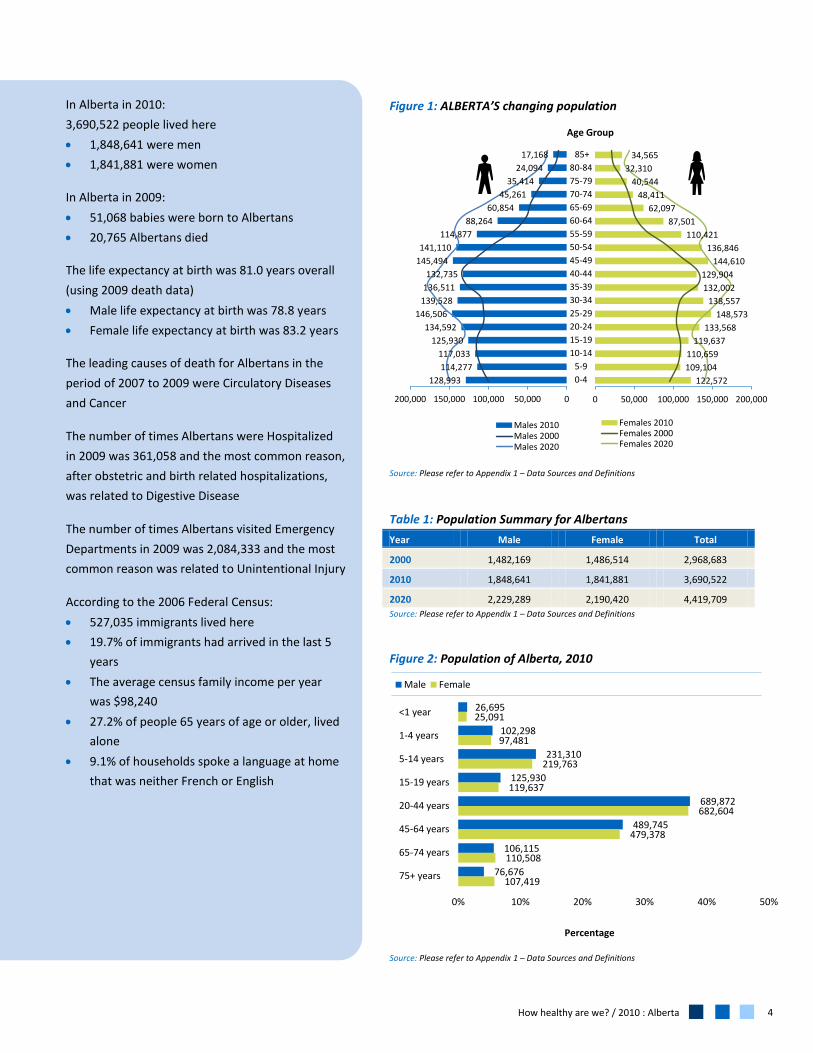
Figure 2: Population of Alberta, 2010
Source: Please refer to Appendix 1 – Data Sources and Definitions
26,695
102,298
231,310
125,930
689,872
489,745
106,115
76,676
25,091
97,481
219,763
119,637
682,604
479,378
110,508
107,419
0% 10% 20% 30% 40% 50%
Percentage
Male Female
<1 year
1-4 years
5-14 years
15-19 years
20-44 years
45-64 years
65-74 years
75+ years
In Alberta in 2010:
3,690,522 people lived here
1,848,641 were men
1,841,881 were women
In Alberta in 2009:
51,068 babies were born to Albertans
20,765 Albertans died
The life expectancy at birth was 81.0 years overall
(using 2009 death data)
Male life expectancy at birth was 78.8 years
Female life expectancy at birth was 83.2 years
The leading causes of death for Albertans in the
period of 2007 to 2009 were Circulatory Diseases
and Cancer
The number of times Albertans were Hospitalized
in 2009 was 361,058 and the most common reason,
after obstetric and birth related hospitalizations,
was related to Digestive Disease
The number of times Albertans visited Emergency
Departments in 2009 was 2,084,333 and the most
common reason was related to Unintentional Injury
According to the 2006 Federal Census:
527,035 immigrants lived here
19.7% of immigrants had arrived in the last 5
years
The average census family income per year
was $98,240
27.2% of people 65 years of age or older, lived
alone
9.1% of households spoke a language at home
that was neither French or English
Figure 1: ALBERTA’S changing population
Source: Please refer to Appendix 1 – Data Sources and Definitions
128,993
114,277
117,033
125,930
134,592
146,506
139,528
136,511
132,735
145,494
141,110
114,877
88,264
60,854
45,261
35,414
24,094
17,168
200,000 150,000 100,000 50,000 0
Males 2010Males 2000Males 2020
122,572
109,104
110,659
119,637
133,568
148,573
138,557
132,002
129,904
144,610
136,846
110,421
87,501
62,097
48,411
40,544
32,310
34,565
0 50,000 100,000 150,000 200,000
Females 2010Females 2000Females 2020
85+
80-84
75-79
70-74
65-69
60-64
55-59
50-54
45-49
40-44
35-39
30-34
25-29
20-24
15-19
10-14
5-9
0-4
Age Group
How healthy are we? / 2010 : Alberta 5
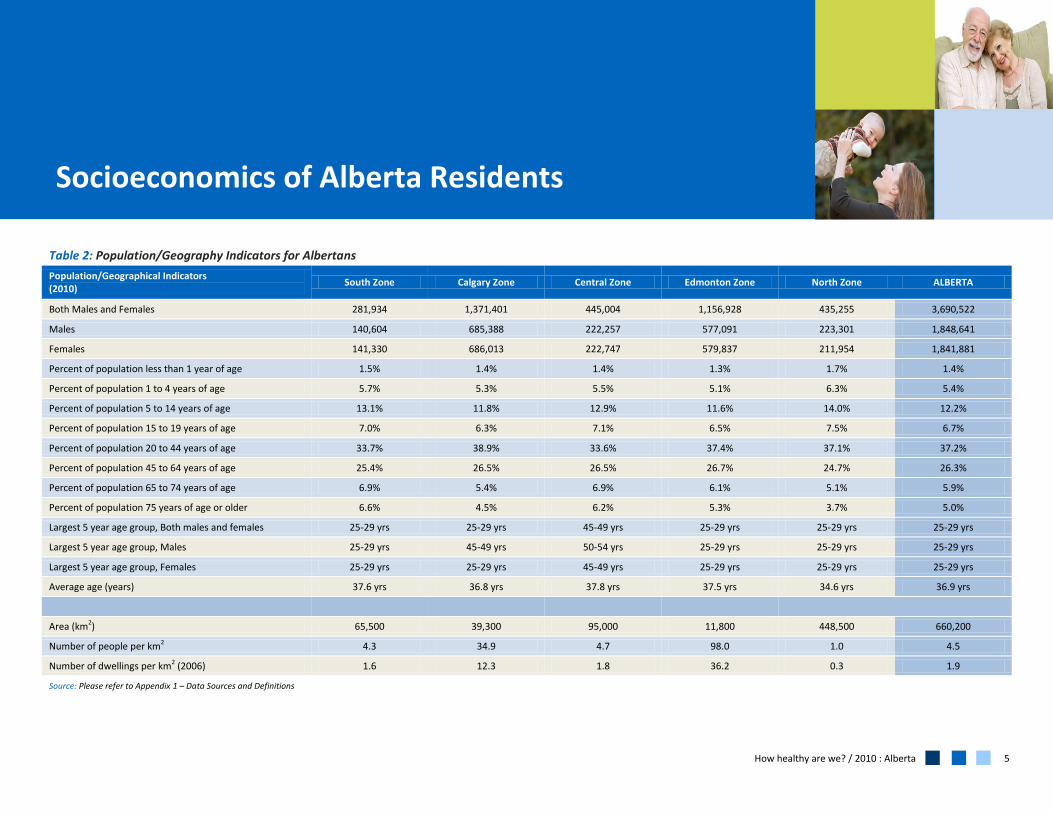
Socioeconomics of Alberta Residents
Table 2: Population/Geography Indicators for Albertans
Population/Geographical Indicators (2010)
South Zone Calgary Zone Central Zone Edmonton Zone North Zone ALBERTA
Both Males and Females 281,934 1,371,401 445,004 1,156,928 435,255 3,690,522
Males 140,604 685,388 222,257 577,091 223,301 1,848,641
Females 141,330 686,013 222,747 579,837 211,954 1,841,881
Percent of population less than 1 year of age 1.5% 1.4% 1.4% 1.3% 1.7% 1.4%
Percent of population 1 to 4 years of age 5.7% 5.3% 5.5% 5.1% 6.3% 5.4%
Percent of population 5 to 14 years of age 13.1% 11.8% 12.9% 11.6% 14.0% 12.2%
Percent of population 15 to 19 years of age 7.0% 6.3% 7.1% 6.5% 7.5% 6.7%
Percent of population 20 to 44 years of age 33.7% 38.9% 33.6% 37.4% 37.1% 37.2%
Percent of population 45 to 64 years of age 25.4% 26.5% 26.5% 26.7% 24.7% 26.3%
Percent of population 65 to 74 years of age 6.9% 5.4% 6.9% 6.1% 5.1% 5.9%
Percent of population 75 years of age or older 6.6% 4.5% 6.2% 5.3% 3.7% 5.0%
Largest 5 year age group, Both males and females 25-29 yrs 25-29 yrs 45-49 yrs 25-29 yrs 25-29 yrs 25-29 yrs
Largest 5 year age group, Males 25-29 yrs 45-49 yrs 50-54 yrs 25-29 yrs 25-29 yrs 25-29 yrs
Largest 5 year age group, Females 25-29 yrs 25-29 yrs 45-49 yrs 25-29 yrs 25-29 yrs 25-29 yrs
Average age (years) 37.6 yrs 36.8 yrs 37.8 yrs 37.5 yrs 34.6 yrs 36.9 yrs
Area (km2) 65,500 39,300 95,000 11,800 448,500 660,200
Number of people per km2 4.3 34.9 4.7 98.0 1.0 4.5
Number of dwellings per km2 (2006) 1.6 12.3 1.8 36.2 0.3 1.9
Source: Please refer to Appendix 1 – Data Sources and Definitions
How healthy are we? / 2010 : Alberta 6
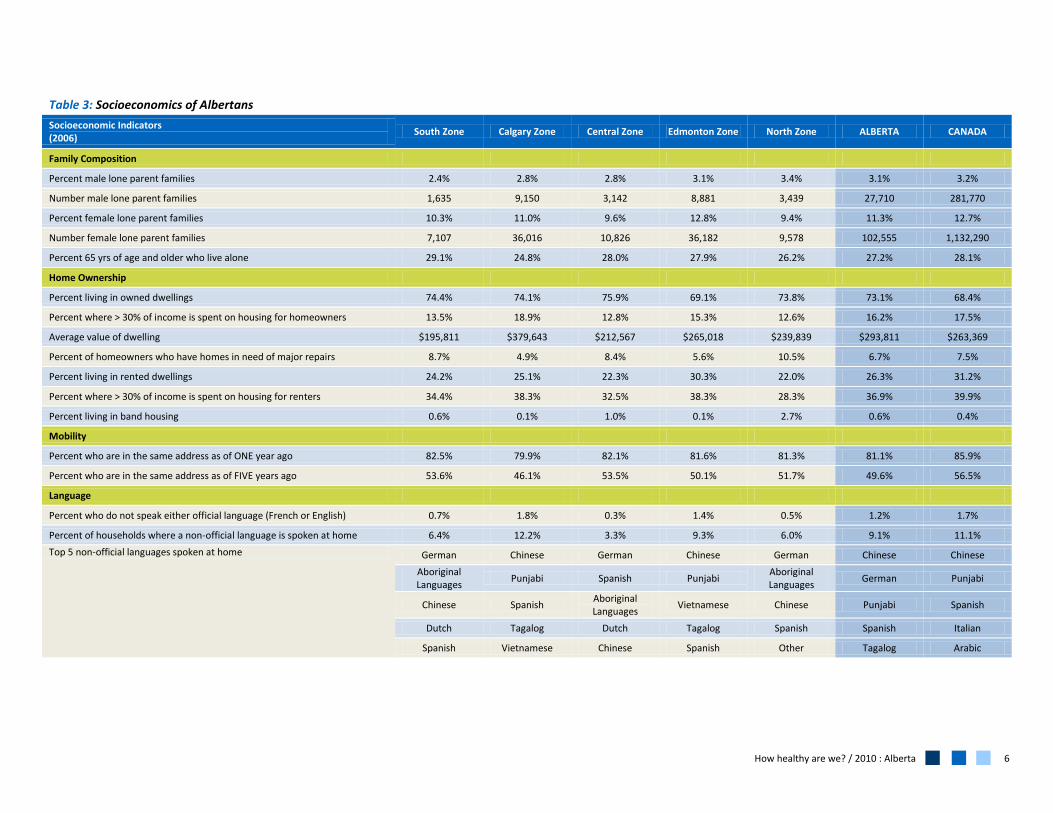
Table 3: Socioeconomics of Albertans
Socioeconomic Indicators (2006)
South Zone Calgary Zone Central Zone Edmonton Zone North Zone ALBERTA CANADA
Family Composition
Percent male lone parent families 2.4% 2.8% 2.8% 3.1% 3.4% 3.1% 3.2%
Number male lone parent families 1,635 9,150 3,142 8,881 3,439 27,710 281,770
Percent female lone parent families 10.3% 11.0% 9.6% 12.8% 9.4% 11.3% 12.7%
Number female lone parent families 7,107 36,016 10,826 36,182 9,578 102,555 1,132,290
Percent 65 yrs of age and older who live alone 29.1% 24.8% 28.0% 27.9% 26.2% 27.2% 28.1%
Home Ownership
Percent living in owned dwellings 74.4% 74.1% 75.9% 69.1% 73.8% 73.1% 68.4%
Percent where > 30% of income is spent on housing for homeowners 13.5% 18.9% 12.8% 15.3% 12.6% 16.2% 17.5%
Average value of dwelling $195,811 $379,643 $212,567 $265,018 $239,839 $293,811 $263,369
Percent of homeowners who have homes in need of major repairs 8.7% 4.9% 8.4% 5.6% 10.5% 6.7% 7.5%
Percent living in rented dwellings 24.2% 25.1% 22.3% 30.3% 22.0% 26.3% 31.2%
Percent where > 30% of income is spent on housing for renters 34.4% 38.3% 32.5% 38.3% 28.3% 36.9% 39.9%
Percent living in band housing 0.6% 0.1% 1.0% 0.1% 2.7% 0.6% 0.4%
Mobility
Percent who are in the same address as of ONE year ago 82.5% 79.9% 82.1% 81.6% 81.3% 81.1% 85.9%
Percent who are in the same address as of FIVE years ago 53.6% 46.1% 53.5% 50.1% 51.7% 49.6% 56.5%
Language
Percent who do not speak either official language (French or English) 0.7% 1.8% 0.3% 1.4% 0.5% 1.2% 1.7%
Percent of households where a non-official language is spoken at home 6.4% 12.2% 3.3% 9.3% 6.0% 9.1% 11.1%
Top 5 non-official languages spoken at home German Chinese German Chinese German Chinese Chinese
Aboriginal Languages
Punjabi Spanish Punjabi Aboriginal Languages
German Punjabi
Chinese Spanish Aboriginal Languages
Vietnamese Chinese Punjabi Spanish
Dutch Tagalog Dutch Tagalog Spanish Spanish Italian
Spanish Vietnamese Chinese Spanish Other Tagalog Arabic
How healthy are we? / 2010 : Alberta 7
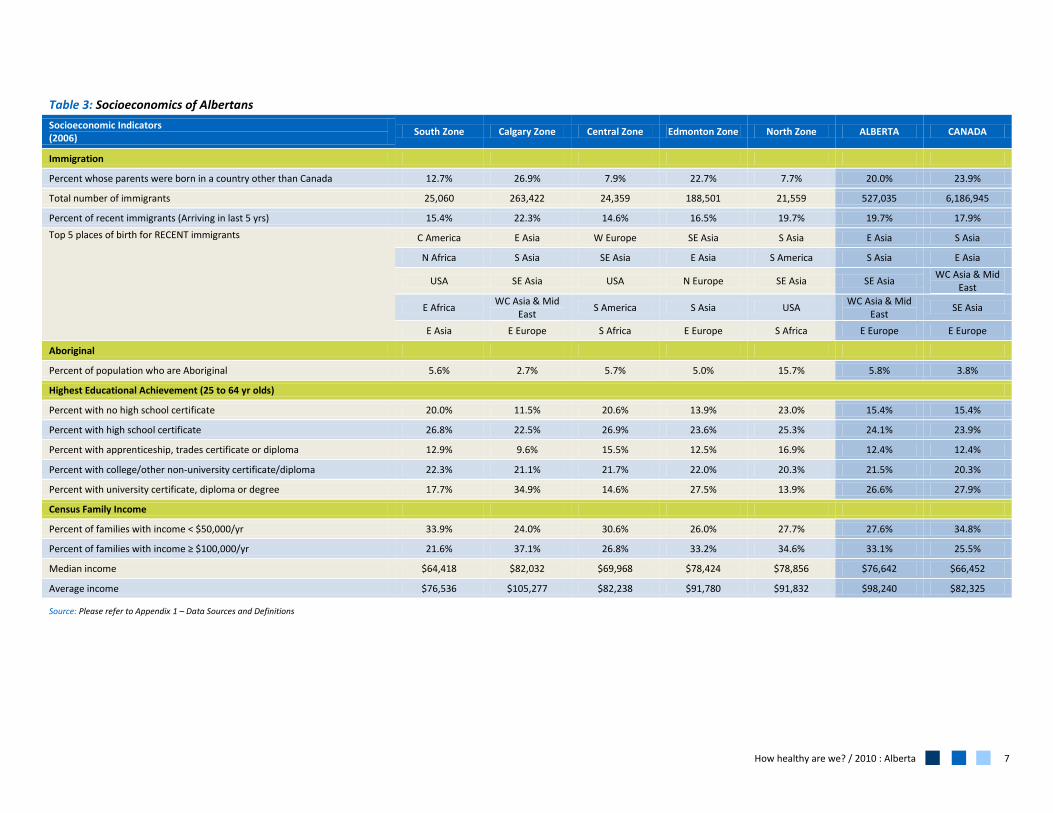
Table 3: Socioeconomics of Albertans
Socioeconomic Indicators (2006)
South Zone Calgary Zone Central Zone Edmonton Zone North Zone ALBERTA CANADA
Immigration
Percent whose parents were born in a country other than Canada 12.7% 26.9% 7.9% 22.7% 7.7% 20.0% 23.9%
Total number of immigrants 25,060 263,422 24,359 188,501 21,559 527,035 6,186,945
Percent of recent immigrants (Arriving in last 5 yrs) 15.4% 22.3% 14.6% 16.5% 19.7% 19.7% 17.9%
Top 5 places of birth for RECENT immigrants C America E Asia W Europe SE Asia S Asia E Asia S Asia
N Africa S Asia SE Asia E Asia S America S Asia E Asia
USA SE Asia USA N Europe SE Asia SE Asia WC Asia & Mid
East
E Africa WC Asia & Mid
East S America S Asia USA
WC Asia & Mid East
SE Asia
E Asia E Europe S Africa E Europe S Africa E Europe E Europe
Aboriginal
Percent of population who are Aboriginal 5.6% 2.7% 5.7% 5.0% 15.7% 5.8% 3.8%
Highest Educational Achievement (25 to 64 yr olds)
Percent with no high school certificate 20.0% 11.5% 20.6% 13.9% 23.0% 15.4% 15.4%
Percent with high school certificate 26.8% 22.5% 26.9% 23.6% 25.3% 24.1% 23.9%
Percent with apprenticeship, trades certificate or diploma 12.9% 9.6% 15.5% 12.5% 16.9% 12.4% 12.4%
Percent with college/other non-university certificate/diploma 22.3% 21.1% 21.7% 22.0% 20.3% 21.5% 20.3%
Percent with university certificate, diploma or degree 17.7% 34.9% 14.6% 27.5% 13.9% 26.6% 27.9%
Census Family Income
Percent of families with income < $50,000/yr 33.9% 24.0% 30.6% 26.0% 27.7% 27.6% 34.8%
Percent of families with income ≥ $100,000/yr 21.6% 37.1% 26.8% 33.2% 34.6% 33.1% 25.5%
Median income $64,418 $82,032 $69,968 $78,424 $78,856 $76,642 $66,452
Average income $76,536 $105,277 $82,238 $91,780 $91,832 $98,240 $82,325
Source: Please refer to Appendix 1 – Data Sources and Definitions

How healthy are we? / 2010 : Alberta 8
Health Summary of Albertans
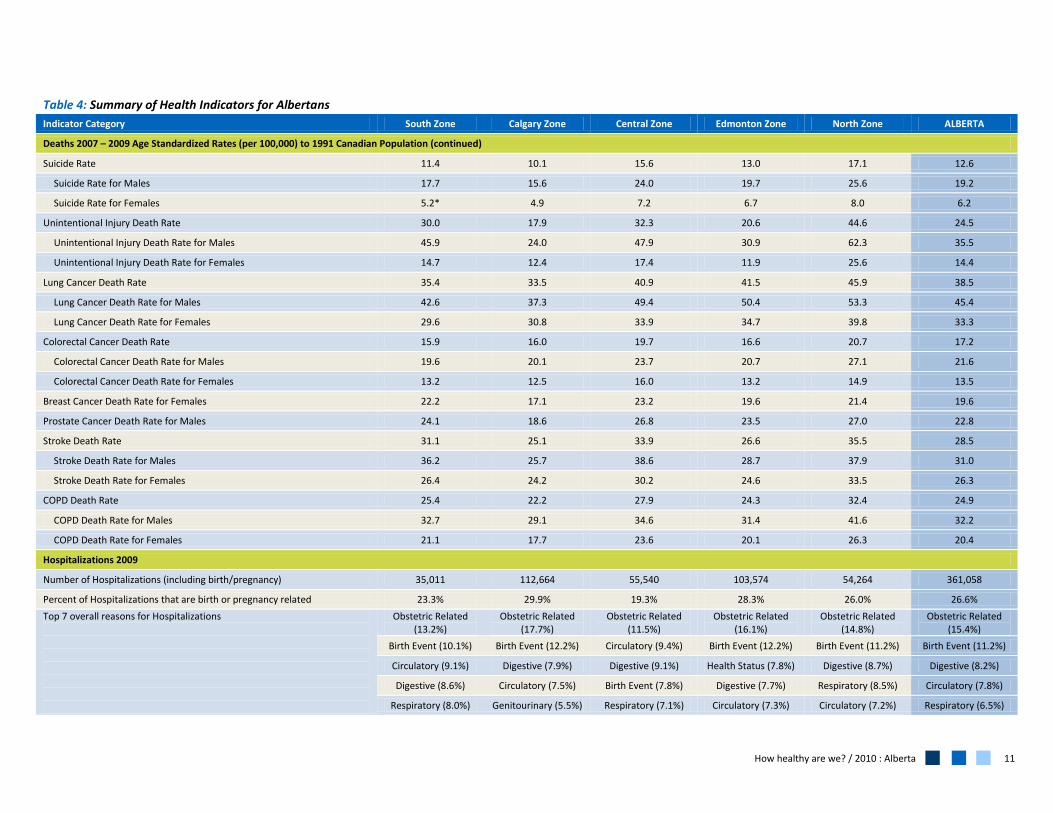
Table 4: Summary of Health Indicators for Albertans
Indicator Category South Zone Calgary Zone Central Zone Edmonton Zone North Zone ALBERTA
Births 2009
Number of Births 4,268 18,765 5,704 15,254 7,036 51,068
Percent Low Birth Weight (of live births, <2500 gm) 5.8% 7.7% 6.2% 7.0% 5.6% 6.9%
Percent High Birth Weight (of live births, ≥ 4000 gm) 12.0% 8.2% 11.7% 10.9% 13.2% 10.4%
Percent Small-for-Gestational-Age (of singleton live births) 7.5% 9.2% 6.7% 8.2% 6.5% 8.1%
Percent Preterm Births (of live births, <37 wks gestation) 6.6% 9.2% 8.6% 9.4% 7.9% 8.8%
Crude Birth Rate (per 1,000) 15.3 14.0 13.0 13.5 16.5 14.1
General Fertility Rate (per 1,000 women 15-49 yr) 64.3 52.2 53.2 51.6 63.6 54.4
Teen Birth Rate (per 1,000 women 15-19 yr) 25.9 12.2 22.8 16.0 39.0 19.4
Percent Maternal Prenatal Smoking (of deliveries) (2006-2008) 21.9% 12.0% 26.2% 17.0% 27.6% 18.1%
Life Expectancy (yrs) at Birth (based on 2009 death data) 80.1 82.4 80.1 81.0 79.3 81.0
Life Expectancy at Birth for Males (yrs) 77.9 80.2 78.0 78.6 77.0 78.8
Life Expectancy at Birth for Females (yrs) 82.3 84.4 82.2 83.3 81.8 83.2
Deaths 2007 - 2009
Infant Mortality Rate (per 1,000 live births) (2005-2009) 5.4 5.1 7.1 6.5 6.6 6.0
Number of Deaths (2009) 2,130 6,358 3,206 6,787 2,265 20,765
Number of Deaths (2007-2009) 6,323 18,872 9,781 19,728 6,813 61,566
Top 7 Causes of Death (2007-2009)
Circulatory (35.5%) Circulatory (32.2%) Circulatory (32.9%) Circulatory (29.6%) Circulatory (29.0%) Circulatory (31.5%)
Cancer (24.2%) Cancer (28.0%) Cancer (26.2%) Cancer (28.2%) Cancer (27.2%) Cancer (27.3%)
Respiratory (8.5%) Respiratory (8.4%) Respiratory (9.0%) Respiratory (9.9%) Respiratory (9.0%) Respiratory (9.1%)
Mental & Behavioral (4.6%)
Mental & Behavioral (5.9%)
Unintentional Injury (4.7%)
Mental & Behavioral (4.5%)
Unintentional Injury (7.8%)
Mental & Behavioral (4.7%)
How healthy are we? / 2010 : Alberta 9
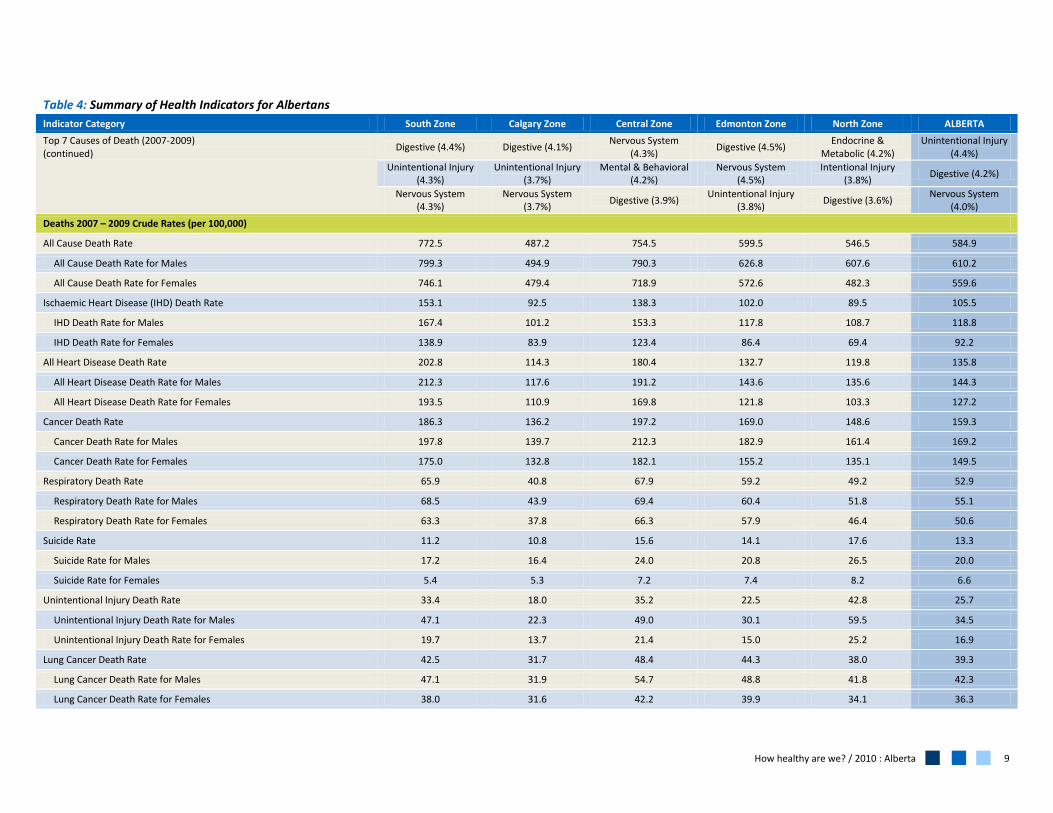
Table 4: Summary of Health Indicators for Albertans
Indicator Category South Zone Calgary Zone Central Zone Edmonton Zone North Zone ALBERTA
Top 7 Causes of Death (2007-2009) (continued)
Digestive (4.4%) Digestive (4.1%) Nervous System
(4.3%) Digestive (4.5%)
Endocrine & Metabolic (4.2%)
Unintentional Injury (4.4%)
Unintentional Injury (4.3%)
Unintentional Injury (3.7%)
Mental & Behavioral (4.2%)
Nervous System (4.5%)
Intentional Injury (3.8%)
Digestive (4.2%)
Nervous System (4.3%)
Nervous System (3.7%)
Digestive (3.9%) Unintentional Injury
(3.8%) Digestive (3.6%)
Nervous System (4.0%)
Deaths 2007 – 2009 Crude Rates (per 100,000)
All Cause Death Rate 772.5 487.2 754.5 599.5 546.5 584.9
All Cause Death Rate for Males 799.3 494.9 790.3 626.8 607.6 610.2
All Cause Death Rate for Females 746.1 479.4 718.9 572.6 482.3 559.6
Ischaemic Heart Disease (IHD) Death Rate 153.1 92.5 138.3 102.0 89.5 105.5
IHD Death Rate for Males 167.4 101.2 153.3 117.8 108.7 118.8
IHD Death Rate for Females 138.9 83.9 123.4 86.4 69.4 92.2
All Heart Disease Death Rate 202.8 114.3 180.4 132.7 119.8 135.8
All Heart Disease Death Rate for Males 212.3 117.6 191.2 143.6 135.6 144.3
All Heart Disease Death Rate for Females 193.5 110.9 169.8 121.8 103.3 127.2
Cancer Death Rate 186.3 136.2 197.2 169.0 148.6 159.3
Cancer Death Rate for Males 197.8 139.7 212.3 182.9 161.4 169.2
Cancer Death Rate for Females 175.0 132.8 182.1 155.2 135.1 149.5
Respiratory Death Rate 65.9 40.8 67.9 59.2 49.2 52.9
Respiratory Death Rate for Males 68.5 43.9 69.4 60.4 51.8 55.1
Respiratory Death Rate for Females 63.3 37.8 66.3 57.9 46.4 50.6
Suicide Rate 11.2 10.8 15.6 14.1 17.6 13.3
Suicide Rate for Males 17.2 16.4 24.0 20.8 26.5 20.0
Suicide Rate for Females 5.4 5.3 7.2 7.4 8.2 6.6
Unintentional Injury Death Rate 33.4 18.0 35.2 22.5 42.8 25.7
Unintentional Injury Death Rate for Males 47.1 22.3 49.0 30.1 59.5 34.5
Unintentional Injury Death Rate for Females 19.7 13.7 21.4 15.0 25.2 16.9
Lung Cancer Death Rate 42.5 31.7 48.4 44.3 38.0 39.3
Lung Cancer Death Rate for Males 47.1 31.9 54.7 48.8 41.8 42.3
Lung Cancer Death Rate for Females 38.0 31.6 42.2 39.9 34.1 36.3
How healthy are we? / 2010 : Alberta 10
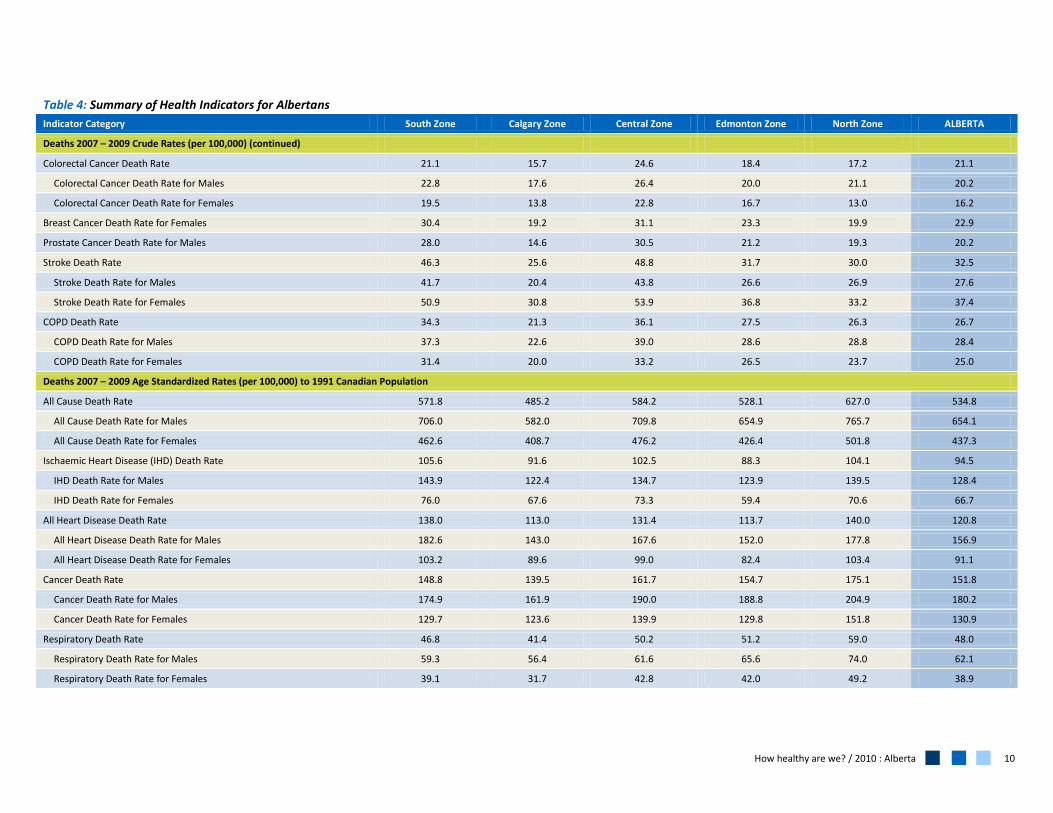
Table 4: Summary of Health Indicators for Albertans
Indicator Category South Zone Calgary Zone Central Zone Edmonton Zone North Zone ALBERTA
Deaths 2007 – 2009 Crude Rates (per 100,000) (continued)
Colorectal Cancer Death Rate 21.1 15.7 24.6 18.4 17.2 21.1
Colorectal Cancer Death Rate for Males 22.8 17.6 26.4 20.0 21.1 20.2
Colorectal Cancer Death Rate for Females 19.5 13.8 22.8 16.7 13.0 16.2
Breast Cancer Death Rate for Females 30.4 19.2 31.1 23.3 19.9 22.9
Prostate Cancer Death Rate for Males 28.0 14.6 30.5 21.2 19.3 20.2
Stroke Death Rate 46.3 25.6 48.8 31.7 30.0 32.5
Stroke Death Rate for Males 41.7 20.4 43.8 26.6 26.9 27.6
Stroke Death Rate for Females 50.9 30.8 53.9 36.8 33.2 37.4
COPD Death Rate 34.3 21.3 36.1 27.5 26.3 26.7
COPD Death Rate for Males 37.3 22.6 39.0 28.6 28.8 28.4
COPD Death Rate for Females 31.4 20.0 33.2 26.5 23.7 25.0
Deaths 2007 – 2009 Age Standardized Rates (per 100,000) to 1991 Canadian Population
All Cause Death Rate 571.8 485.2 584.2 528.1 627.0 534.8
All Cause Death Rate for Males 706.0 582.0 709.8 654.9 765.7 654.1
All Cause Death Rate for Females 462.6 408.7 476.2 426.4 501.8 437.3
Ischaemic Heart Disease (IHD) Death Rate 105.6 91.6 102.5 88.3 104.1 94.5
IHD Death Rate for Males 143.9 122.4 134.7 123.9 139.5 128.4
IHD Death Rate for Females 76.0 67.6 73.3 59.4 70.6 66.7
All Heart Disease Death Rate 138.0 113.0 131.4 113.7 140.0 120.8
All Heart Disease Death Rate for Males 182.6 143.0 167.6 152.0 177.8 156.9
All Heart Disease Death Rate for Females 103.2 89.6 99.0 82.4 103.4 91.1
Cancer Death Rate 148.8 139.5 161.7 154.7 175.1 151.8
Cancer Death Rate for Males 174.9 161.9 190.0 188.8 204.9 180.2
Cancer Death Rate for Females 129.7 123.6 139.9 129.8 151.8 130.9
Respiratory Death Rate 46.8 41.4 50.2 51.2 59.0 48.0
Respiratory Death Rate for Males 59.3 56.4 61.6 65.6 74.0 62.1
Respiratory Death Rate for Females 39.1 31.7 42.8 42.0 49.2 38.9
How healthy are we? / 2010 : Alberta 11
Table 4: Summary of Health Indicators for Albertans
Indicator Category South Zone Calgary Zone Central Zone Edmonton Zone North Zone ALBERTA
Deaths 2007 – 2009 Age Standardized Rates (per 100,000) to 1991 Canadian Population (continued)
Suicide Rate 11.4 10.1 15.6 13.0 17.1 12.6
Suicide Rate for Males 17.7 15.6 24.0 19.7 25.6 19.2
Suicide Rate for Females 5.2* 4.9 7.2 6.7 8.0 6.2
Unintentional Injury Death Rate 30.0 17.9 32.3 20.6 44.6 24.5
Unintentional Injury Death Rate for Males 45.9 24.0 47.9 30.9 62.3 35.5
Unintentional Injury Death Rate for Females 14.7 12.4 17.4 11.9 25.6 14.4
Lung Cancer Death Rate 35.4 33.5 40.9 41.5 45.9 38.5
Lung Cancer Death Rate for Males 42.6 37.3 49.4 50.4 53.3 45.4
Lung Cancer Death Rate for Females 29.6 30.8 33.9 34.7 39.8 33.3
Colorectal Cancer Death Rate 15.9 16.0 19.7 16.6 20.7 17.2
Colorectal Cancer Death Rate for Males 19.6 20.1 23.7 20.7 27.1 21.6
Colorectal Cancer Death Rate for Females 13.2 12.5 16.0 13.2 14.9 13.5
Breast Cancer Death Rate for Females 22.2 17.1 23.2 19.6 21.4 19.6
Prostate Cancer Death Rate for Males 24.1 18.6 26.8 23.5 27.0 22.8
Stroke Death Rate 31.1 25.1 33.9 26.6 35.5 28.5
Stroke Death Rate for Males 36.2 25.7 38.6 28.7 37.9 31.0
Stroke Death Rate for Females 26.4 24.2 30.2 24.6 33.5 26.3
COPD Death Rate 25.4 22.2 27.9 24.3 32.4 24.9
COPD Death Rate for Males 32.7 29.1 34.6 31.4 41.6 32.2
COPD Death Rate for Females 21.1 17.7 23.6 20.1 26.3 20.4
Hospitalizations 2009
Number of Hospitalizations (including birth/pregnancy) 35,011 112,664 55,540 103,574 54,264 361,058
Percent of Hospitalizations that are birth or pregnancy related 23.3% 29.9% 19.3% 28.3% 26.0% 26.6%
Top 7 overall reasons for Hospitalizations
Obstetric Related (13.2%)
Obstetric Related (17.7%)
Obstetric Related (11.5%)
Obstetric Related (16.1%)
Obstetric Related (14.8%)
Obstetric Related (15.4%)
Birth Event (10.1%) Birth Event (12.2%) Circulatory (9.4%) Birth Event (12.2%) Birth Event (11.2%) Birth Event (11.2%)
Circulatory (9.1%) Digestive (7.9%) Digestive (9.1%) Health Status (7.8%) Digestive (8.7%) Digestive (8.2%)
Digestive (8.6%) Circulatory (7.5%) Birth Event (7.8%) Digestive (7.7%) Respiratory (8.5%) Circulatory (7.8%)
Respiratory (8.0%) Genitourinary (5.5%) Respiratory (7.1%) Circulatory (7.3%) Circulatory (7.2%) Respiratory (6.5%)
How healthy are we? / 2010 : Alberta 12
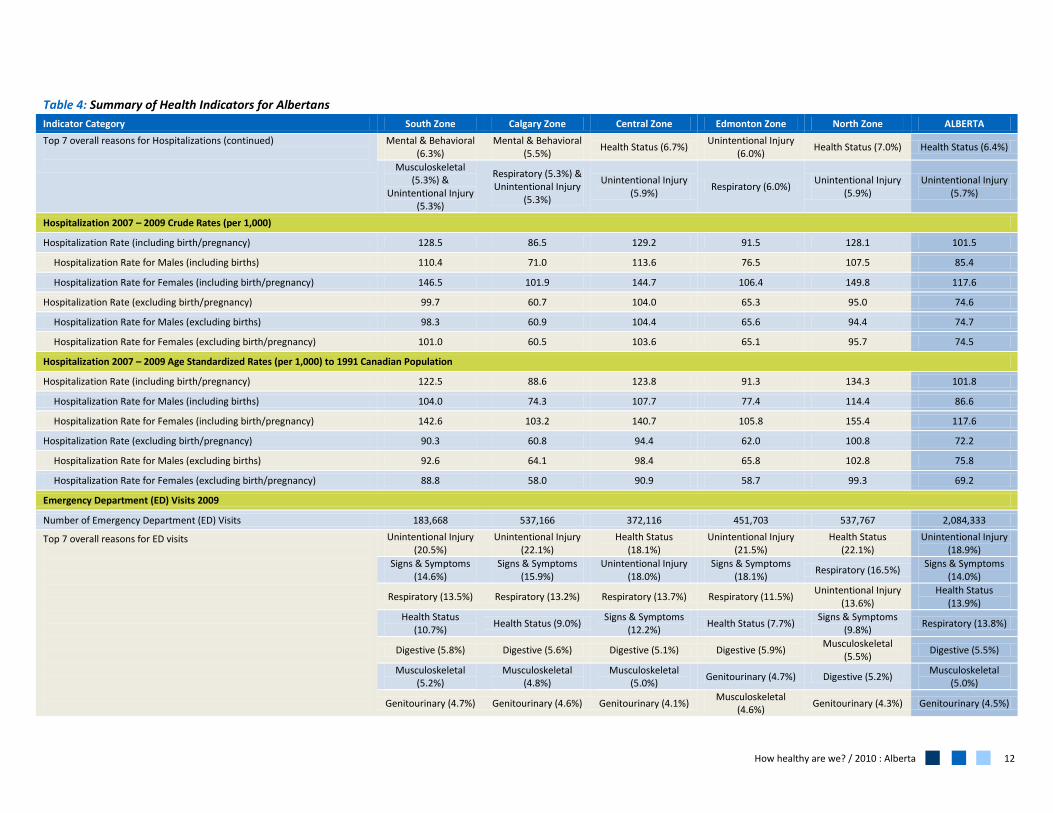
Table 4: Summary of Health Indicators for Albertans
Indicator Category South Zone Calgary Zone Central Zone Edmonton Zone North Zone ALBERTA
Top 7 overall reasons for Hospitalizations (continued)
Mental & Behavioral (6.3%)
Mental & Behavioral (5.5%)
Health Status (6.7%) Unintentional Injury
(6.0%) Health Status (7.0%) Health Status (6.4%)
Musculoskeletal (5.3%) &
Unintentional Injury (5.3%)
Respiratory (5.3%) & Unintentional Injury
(5.3%)
Unintentional Injury (5.9%)
Respiratory (6.0%) Unintentional Injury
(5.9%) Unintentional Injury
(5.7%)
Hospitalization 2007 – 2009 Crude Rates (per 1,000)
Hospitalization Rate (including birth/pregnancy) 128.5 86.5 129.2 91.5 128.1 101.5
Hospitalization Rate for Males (including births) 110.4 71.0 113.6 76.5 107.5 85.4
Hospitalization Rate for Females (including birth/pregnancy) 146.5 101.9 144.7 106.4 149.8 117.6
Hospitalization Rate (excluding birth/pregnancy) 99.7 60.7 104.0 65.3 95.0 74.6
Hospitalization Rate for Males (excluding births) 98.3 60.9 104.4 65.6 94.4 74.7
Hospitalization Rate for Females (excluding birth/pregnancy) 101.0 60.5 103.6 65.1 95.7 74.5
Hospitalization 2007 – 2009 Age Standardized Rates (per 1,000) to 1991 Canadian Population
Hospitalization Rate (including birth/pregnancy) 122.5 88.6 123.8 91.3 134.3 101.8
Hospitalization Rate for Males (including births) 104.0 74.3 107.7 77.4 114.4 86.6
Hospitalization Rate for Females (including birth/pregnancy) 142.6 103.2 140.7 105.8 155.4 117.6
Hospitalization Rate (excluding birth/pregnancy) 90.3 60.8 94.4 62.0 100.8 72.2
Hospitalization Rate for Males (excluding births) 92.6 64.1 98.4 65.8 102.8 75.8
Hospitalization Rate for Females (excluding birth/pregnancy) 88.8 58.0 90.9 58.7 99.3 69.2
Emergency Department (ED) Visits 2009
Number of Emergency Department (ED) Visits 183,668 537,166 372,116 451,703 537,767 2,084,333
Top 7 overall reasons for ED visits
Unintentional Injury (20.5%)
Unintentional Injury (22.1%)
Health Status (18.1%)
Unintentional Injury (21.5%)
Health Status (22.1%)
Unintentional Injury (18.9%)
Signs & Symptoms (14.6%)
Signs & Symptoms (15.9%)
Unintentional Injury (18.0%)
Signs & Symptoms (18.1%)
Respiratory (16.5%) Signs & Symptoms
(14.0%)
Respiratory (13.5%) Respiratory (13.2%) Respiratory (13.7%) Respiratory (11.5%) Unintentional Injury
(13.6%) Health Status
(13.9%)
Health Status (10.7%)
Health Status (9.0%) Signs & Symptoms
(12.2%) Health Status (7.7%)
Signs & Symptoms (9.8%)
Respiratory (13.8%)
Digestive (5.8%) Digestive (5.6%) Digestive (5.1%) Digestive (5.9%) Musculoskeletal
(5.5%) Digestive (5.5%)
Musculoskeletal (5.2%)
Musculoskeletal (4.8%)
Musculoskeletal (5.0%)
Genitourinary (4.7%) Digestive (5.2%) Musculoskeletal
(5.0%)
Genitourinary (4.7%) Genitourinary (4.6%) Genitourinary (4.1%) Musculoskeletal
(4.6%) Genitourinary (4.3%) Genitourinary (4.5%)
How healthy are we? / 2010 : Alberta 13
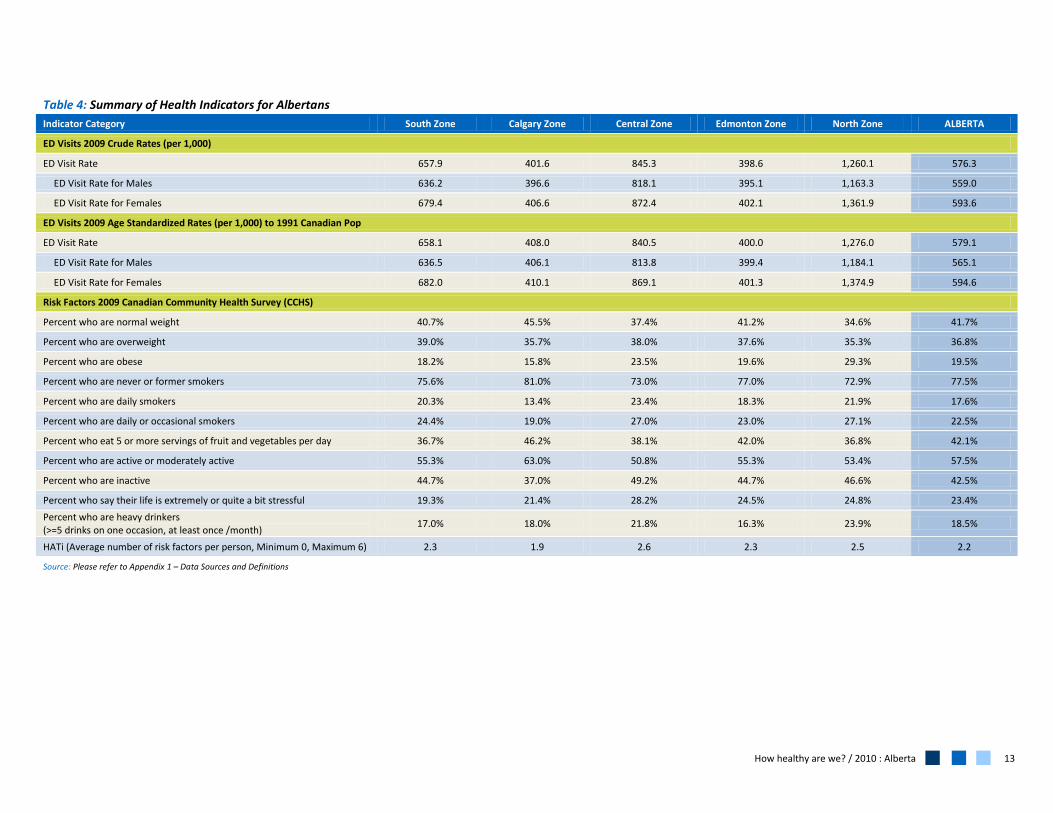
Table 4: Summary of Health Indicators for Albertans
Indicator Category South Zone Calgary Zone Central Zone Edmonton Zone North Zone ALBERTA
ED Visits 2009 Crude Rates (per 1,000)
ED Visit Rate 657.9 401.6 845.3 398.6 1,260.1 576.3
ED Visit Rate for Males 636.2 396.6 818.1 395.1 1,163.3 559.0
ED Visit Rate for Females 679.4 406.6 872.4 402.1 1,361.9 593.6
ED Visits 2009 Age Standardized Rates (per 1,000) to 1991 Canadian Pop
ED Visit Rate 658.1 408.0 840.5 400.0 1,276.0 579.1
ED Visit Rate for Males 636.5 406.1 813.8 399.4 1,184.1 565.1
ED Visit Rate for Females 682.0 410.1 869.1 401.3 1,374.9 594.6
Risk Factors 2009 Canadian Community Health Survey (CCHS)
Percent who are normal weight 40.7% 45.5% 37.4% 41.2% 34.6% 41.7%
Percent who are overweight 39.0% 35.7% 38.0% 37.6% 35.3% 36.8%
Percent who are obese 18.2% 15.8% 23.5% 19.6% 29.3% 19.5%
Percent who are never or former smokers 75.6% 81.0% 73.0% 77.0% 72.9% 77.5%
Percent who are daily smokers 20.3% 13.4% 23.4% 18.3% 21.9% 17.6%
Percent who are daily or occasional smokers 24.4% 19.0% 27.0% 23.0% 27.1% 22.5%
Percent who eat 5 or more servings of fruit and vegetables per day 36.7% 46.2% 38.1% 42.0% 36.8% 42.1%
Percent who are active or moderately active 55.3% 63.0% 50.8% 55.3% 53.4% 57.5%
Percent who are inactive 44.7% 37.0% 49.2% 44.7% 46.6% 42.5%
Percent who say their life is extremely or quite a bit stressful 19.3% 21.4% 28.2% 24.5% 24.8% 23.4%
Percent who are heavy drinkers (>=5 drinks on one occasion, at least once /month)
17.0% 18.0% 21.8% 16.3% 23.9% 18.5%
HATi (Average number of risk factors per person, Minimum 0, Maximum 6) 2.3 1.9 2.6 2.3 2.5 2.2
Source: Please refer to Appendix 1 – Data Sources and Definitions
How healthy are we? / 2010 : Alberta 14
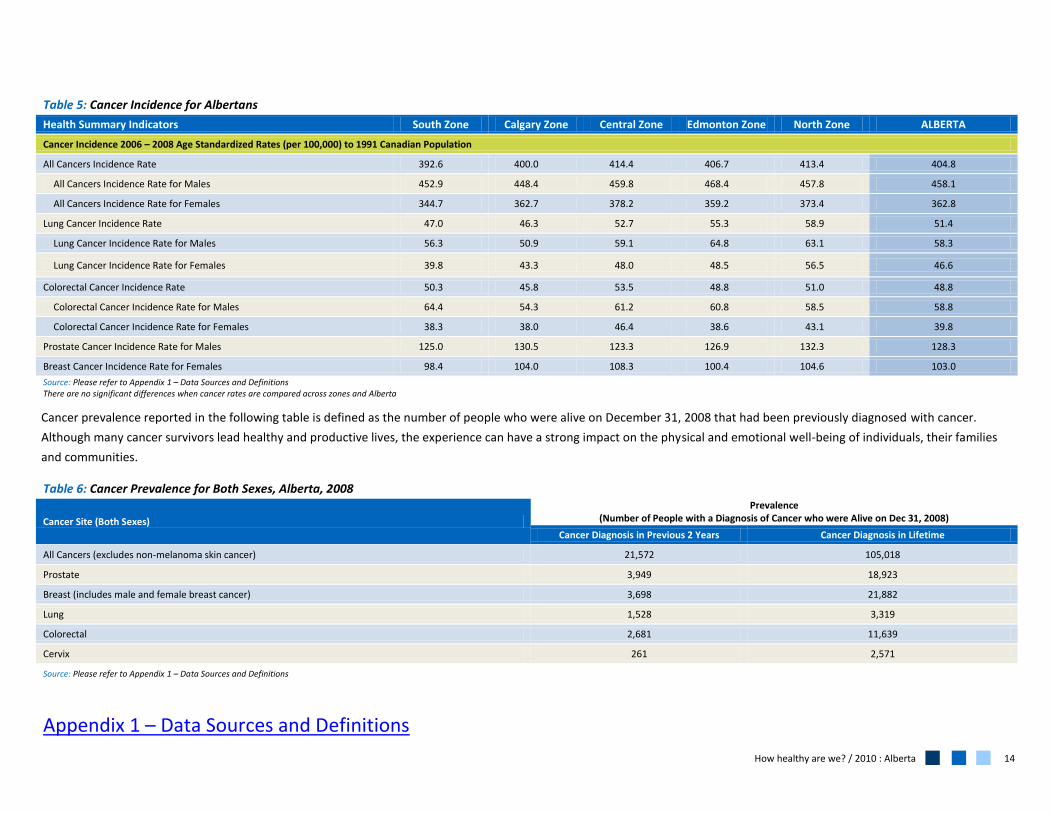
Table 5: Cancer Incidence for Albertans
Health Summary Indicators South Zone Calgary Zone Central Zone Edmonton Zone North Zone ALBERTA
Cancer Incidence 2006 – 2008 Age Standardized Rates (per 100,000) to 1991 Canadian Population
All Cancers Incidence Rate 392.6 400.0 414.4 406.7 413.4 404.8
All Cancers Incidence Rate for Males 452.9 448.4 459.8 468.4 457.8 458.1
All Cancers Incidence Rate for Females 344.7 362.7 378.2 359.2 373.4 362.8
Lung Cancer Incidence Rate 47.0 46.3 52.7 55.3 58.9 51.4
Lung Cancer Incidence Rate for Males 56.3 50.9 59.1 64.8 63.1 58.3
Lung Cancer Incidence Rate for Females 39.8 43.3 48.0 48.5 56.5 46.6
Colorectal Cancer Incidence Rate 50.3 45.8 53.5 48.8 51.0 48.8
Colorectal Cancer Incidence Rate for Males 64.4 54.3 61.2 60.8 58.5 58.8
Colorectal Cancer Incidence Rate for Females 38.3 38.0 46.4 38.6 43.1 39.8
Prostate Cancer Incidence Rate for Males 125.0 130.5 123.3 126.9 132.3 128.3
Breast Cancer Incidence Rate for Females 98.4 104.0 108.3 100.4 104.6 103.0
Source: Please refer to Appendix 1 – Data Sources and Definitions There are no significant differences when cancer rates are compared across zones and Alberta
Table 6: Cancer Prevalence for Both Sexes, Alberta, 2008
Cancer Site (Both Sexes)
Prevalence (Number of People with a Diagnosis of Cancer who were Alive on Dec 31, 2008)
Cancer Diagnosis in Previous 2 Years Cancer Diagnosis in Lifetime
All Cancers (excludes non-melanoma skin cancer) 21,572 105,018
Prostate 3,949 18,923
Breast (includes male and female breast cancer) 3,698 21,882
Lung 1,528 3,319
Colorectal 2,681 11,639
Cervix 261 2,571
Source: Please refer to Appendix 1 – Data Sources and Definitions
Cancer prevalence reported in the following table is defined as the number of people who were alive on December 31, 2008 that had been previously diagnosed with cancer.
Although many cancer survivors lead healthy and productive lives, the experience can have a strong impact on the physical and emotional well-being of individuals, their families
and communities.
Appendix 1 – Data Sources and Definitions
Related Documents