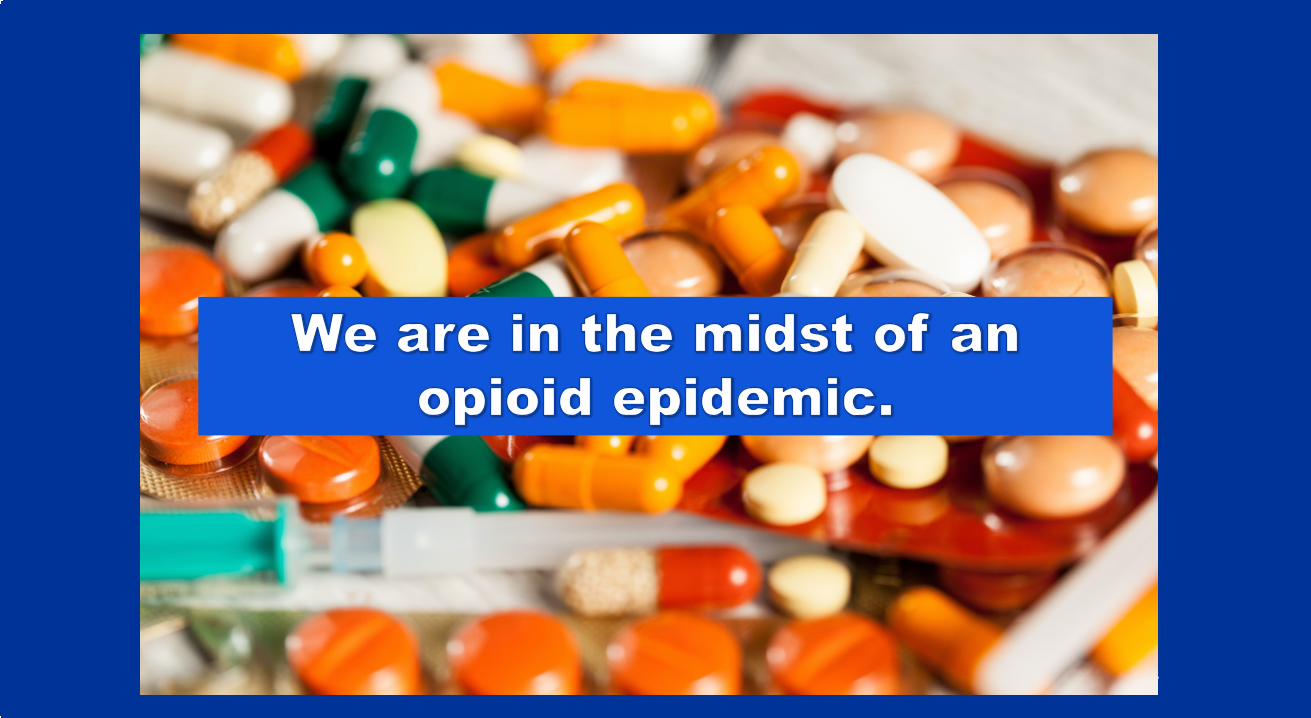
How Delaware is Addressing the Opioid Epidemic KARYL T. RATTAY, MD, MS DIRECTOR, DIVISION OF PUBLIC HEALTH 1

Welcome message from author
This document is posted to help you gain knowledge. Please leave a comment to let me know what you think about it! Share it to your friends and learn new things together.
Transcript
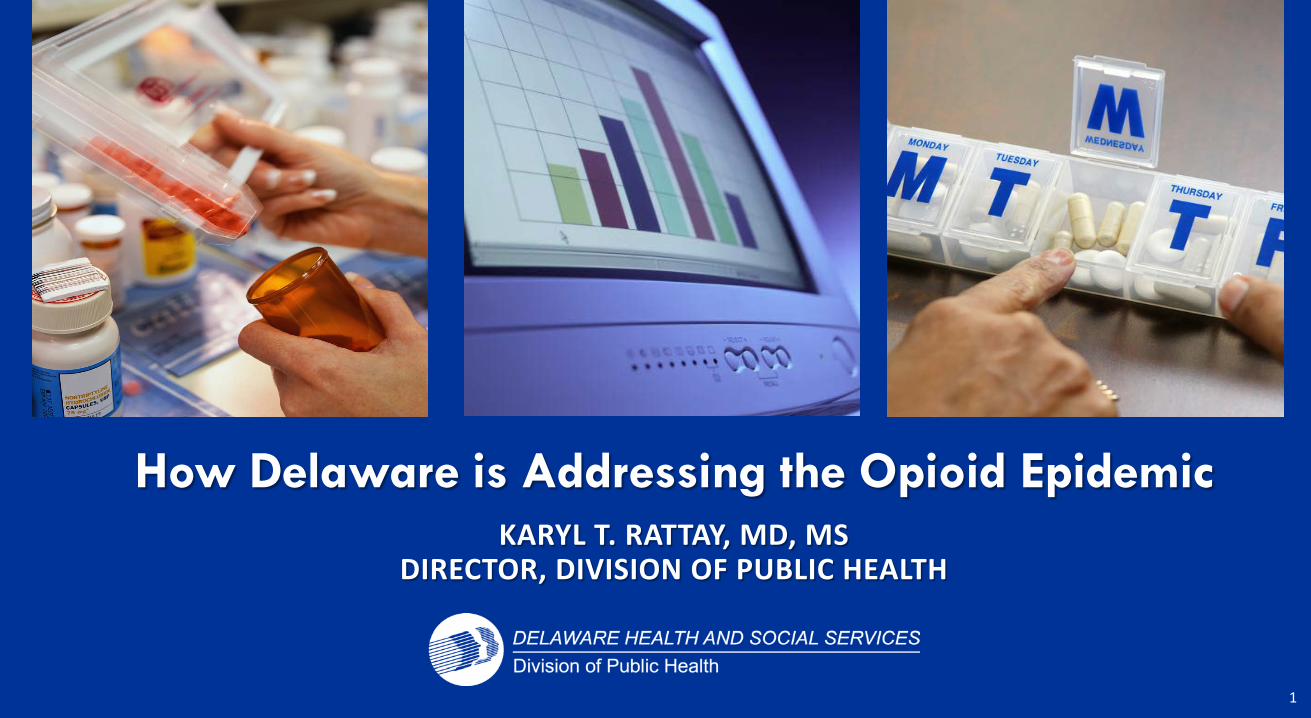
How Delaware is Addressing the Opioid Epidemic
KARYL T. RATTAY, MD, MS DIRECTOR, DIVISION OF PUBLIC HEALTH
1
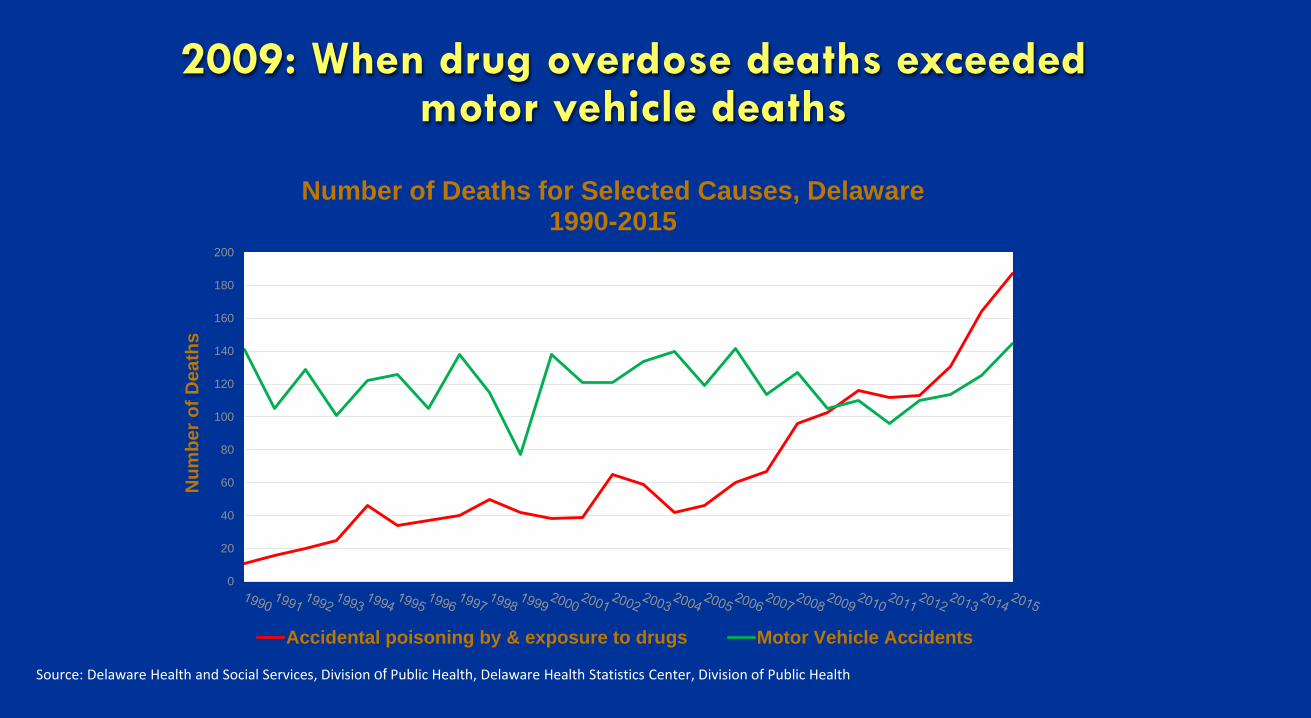
2009: When drug overdose deaths exceeded motor vehicle deaths
Source: Delaware Health and Social Services, Division of Public Health, Delaware Health Statistics Center, Division of Public Health
0
20
40
60
80
100
120
140
160
180
200
Num
ber o
f Dea
ths
Number of Deaths for Selected Causes, Delaware 1990-2015
Accidental poisoning by & exposure to drugs Motor Vehicle Accidents
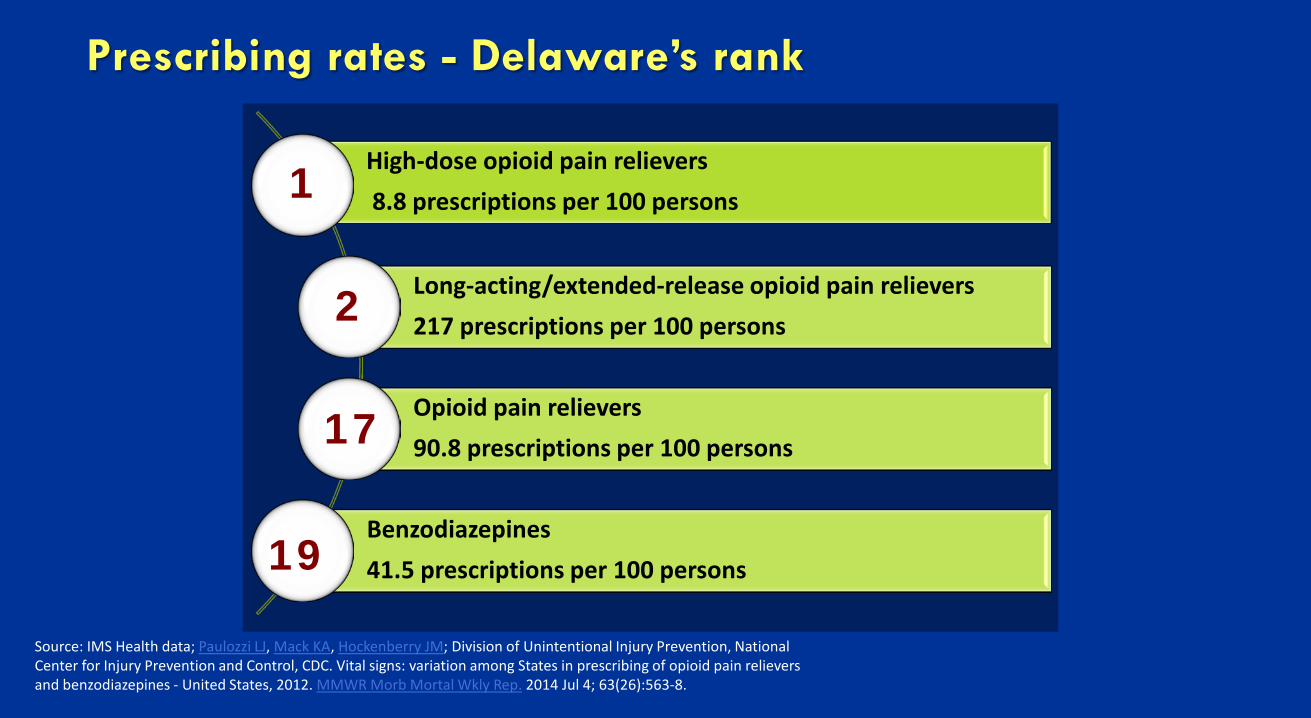
Prescribing rates - Delaware’s rank
High-dose opioid pain relievers 8.8 prescriptions per 100 persons
Long-acting/extended-release opioid pain relievers 217 prescriptions per 100 persons
Opioid pain relievers 90.8 prescriptions per 100 persons
Benzodiazepines 41.5 prescriptions per 100 persons
Source: IMS Health data; Paulozzi LJ, Mack KA, Hockenberry JM; Division of Unintentional Injury Prevention, National Center for Injury Prevention and Control, CDC. Vital signs: variation among States in prescribing of opioid pain relievers and benzodiazepines - United States, 2012. MMWR Morb Mortal Wkly Rep. 2014 Jul 4; 63(26):563-8.
1
2
17
19
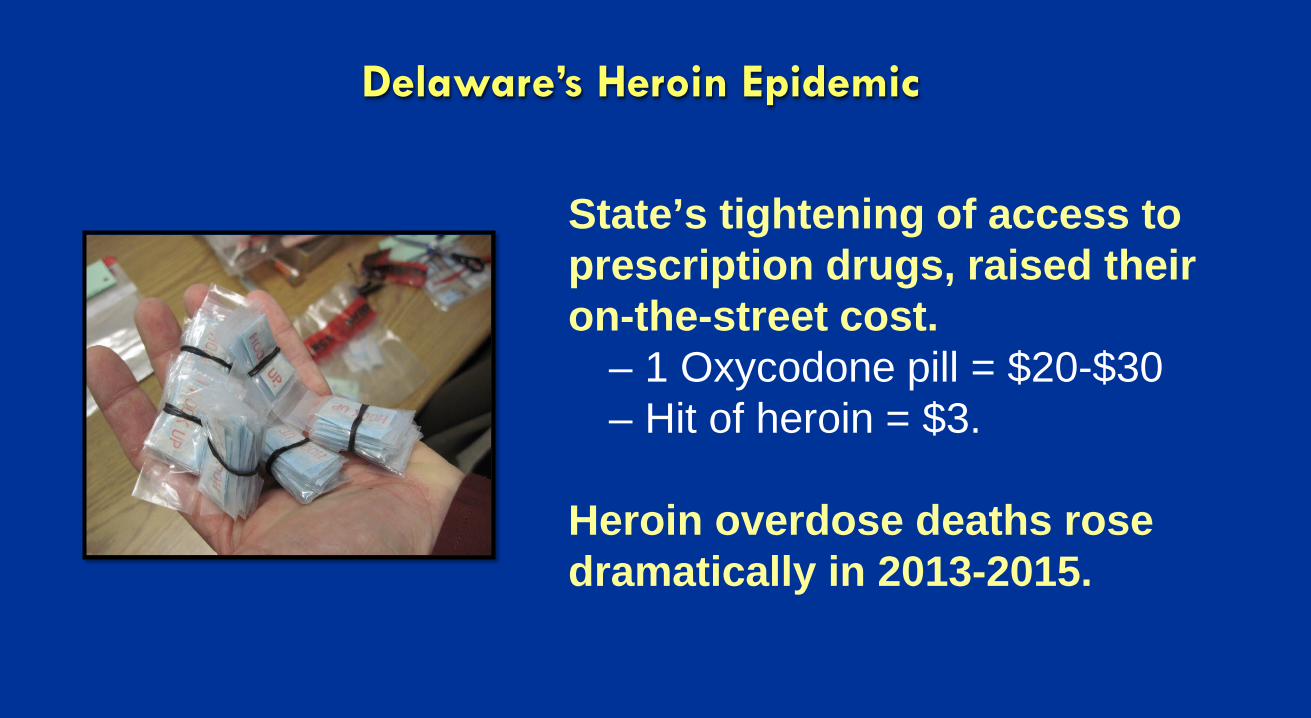
Delaware’s Heroin Epidemic
State’s tightening of access to prescription drugs, raised their on-the-street cost.
– 1 Oxycodone pill = $20-$30 – Hit of heroin = $3.
Heroin overdose deaths rose dramatically in 2013-2015.
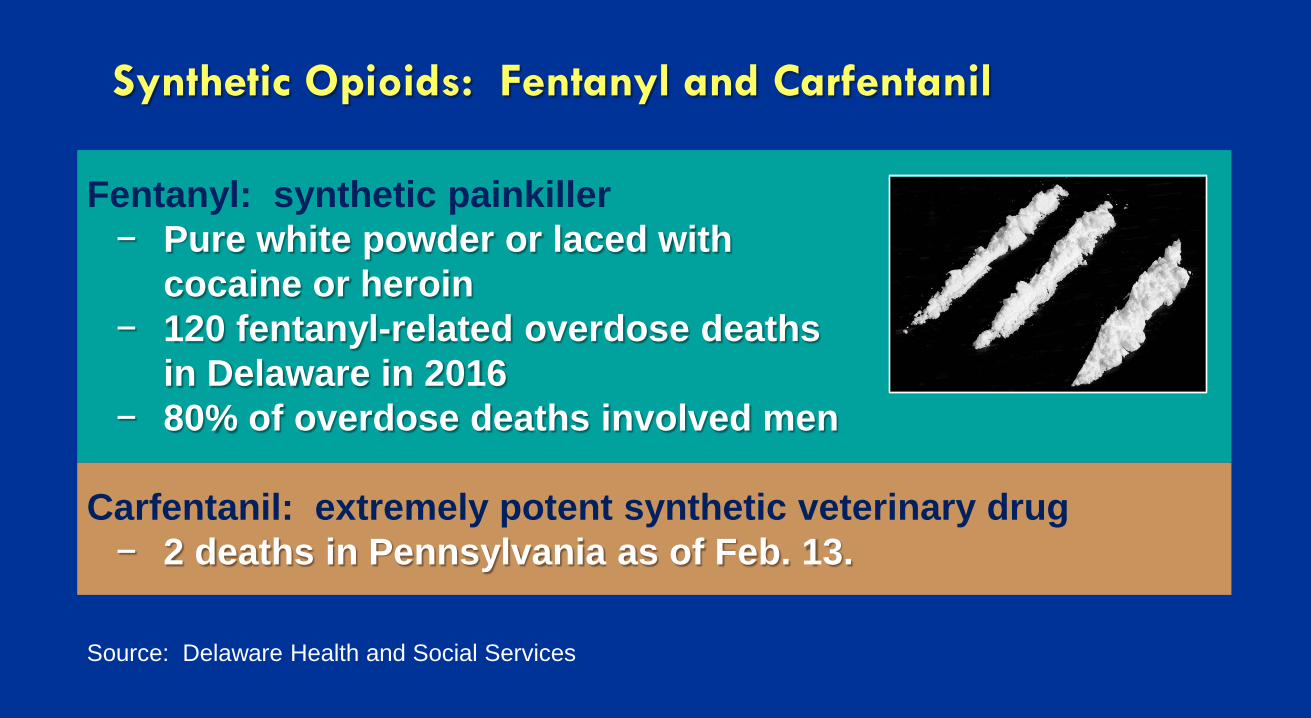
Synthetic Opioids: Fentanyl and Carfentanil
Fentanyl: synthetic painkiller − Pure white powder or laced with
cocaine or heroin − 120 fentanyl-related overdose deaths
in Delaware in 2016 − 80% of overdose deaths involved men
Source: Delaware Health and Social Services
Carfentanil: extremely potent synthetic veterinary drug − 2 deaths in Pennsylvania as of Feb. 13.
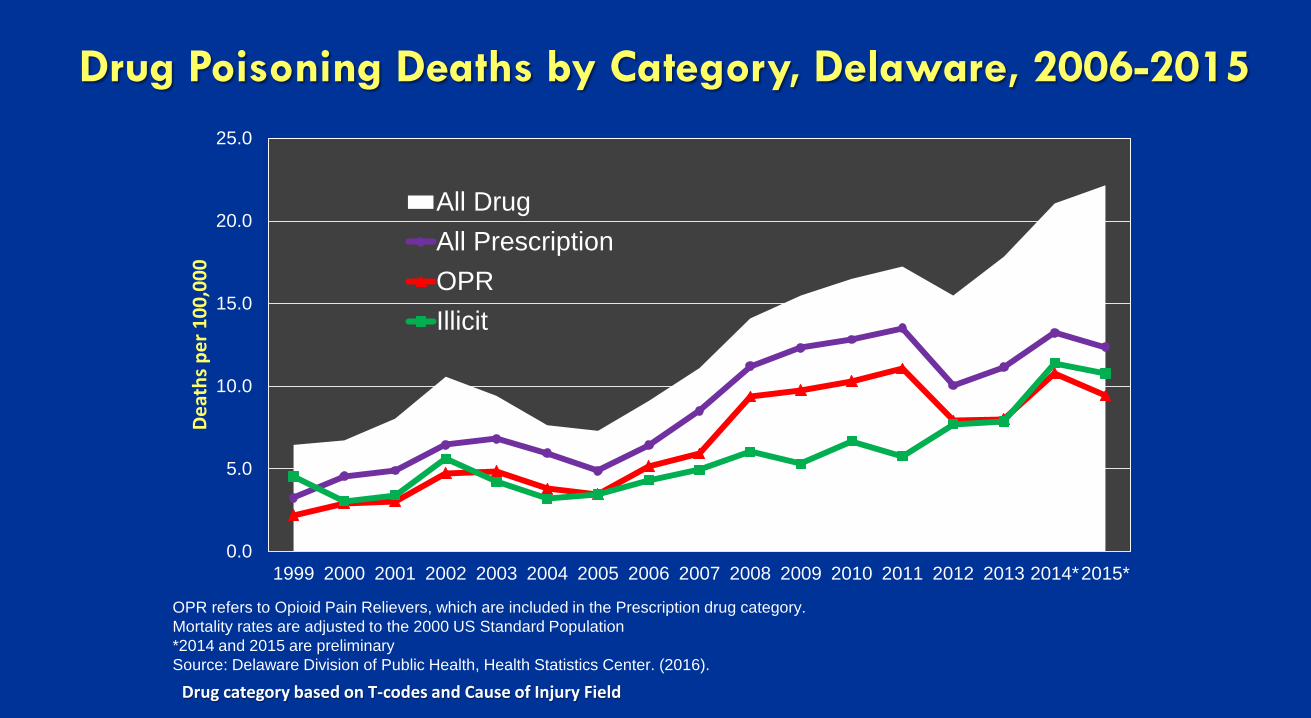
Drug Poisoning Deaths by Category, Delaware, 2006-2015
0.0
5.0
10.0
15.0
20.0
25.0
1999 2000 2001 2002 2003 2004 2005 2006 2007 2008 2009 2010 2011 2012 2013 2014*2015*
Deat
hs p
er 1
00,0
00
All DrugAll PrescriptionOPRIllicit
OPR refers to Opioid Pain Relievers, which are included in the Prescription drug category. Mortality rates are adjusted to the 2000 US Standard Population *2014 and 2015 are preliminary Source: Delaware Division of Public Health, Health Statistics Center. (2016).
Drug category based on T-codes and Cause of Injury Field
7
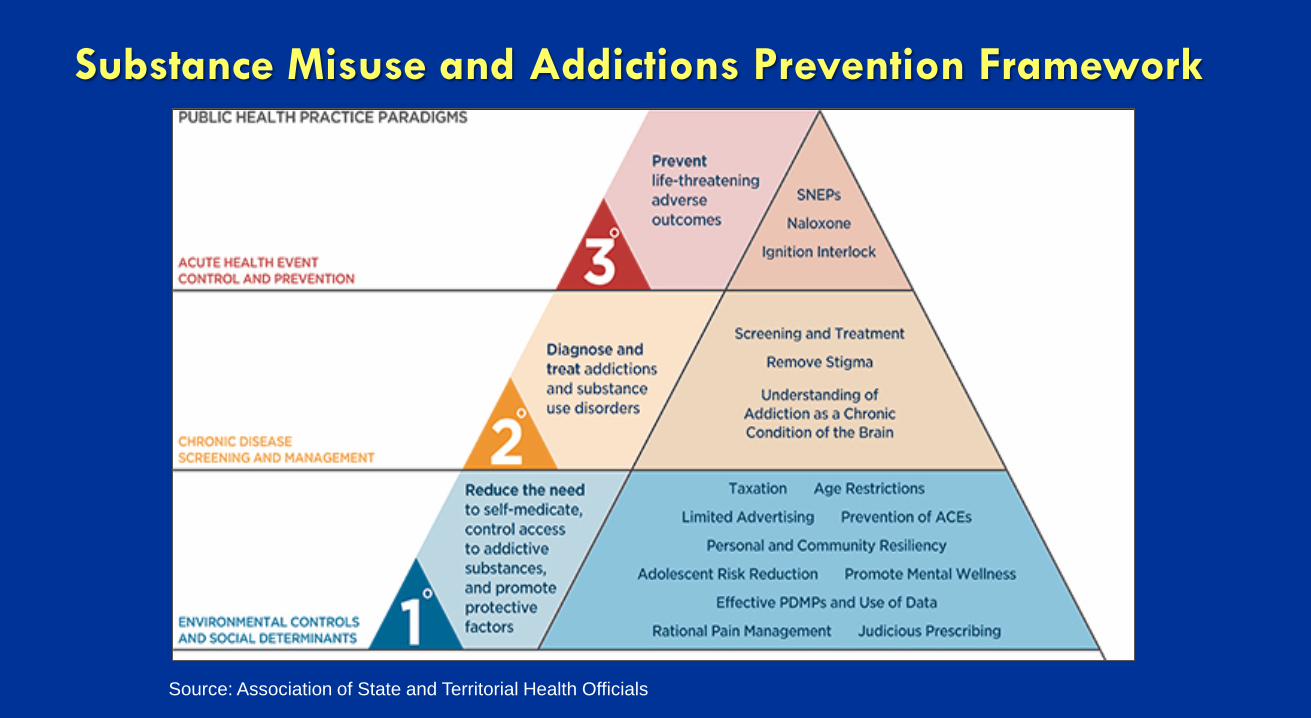
Substance Misuse and Addictions Prevention Framework
Source: Association of State and Territorial Health Officials

Getting the Right People to the Table
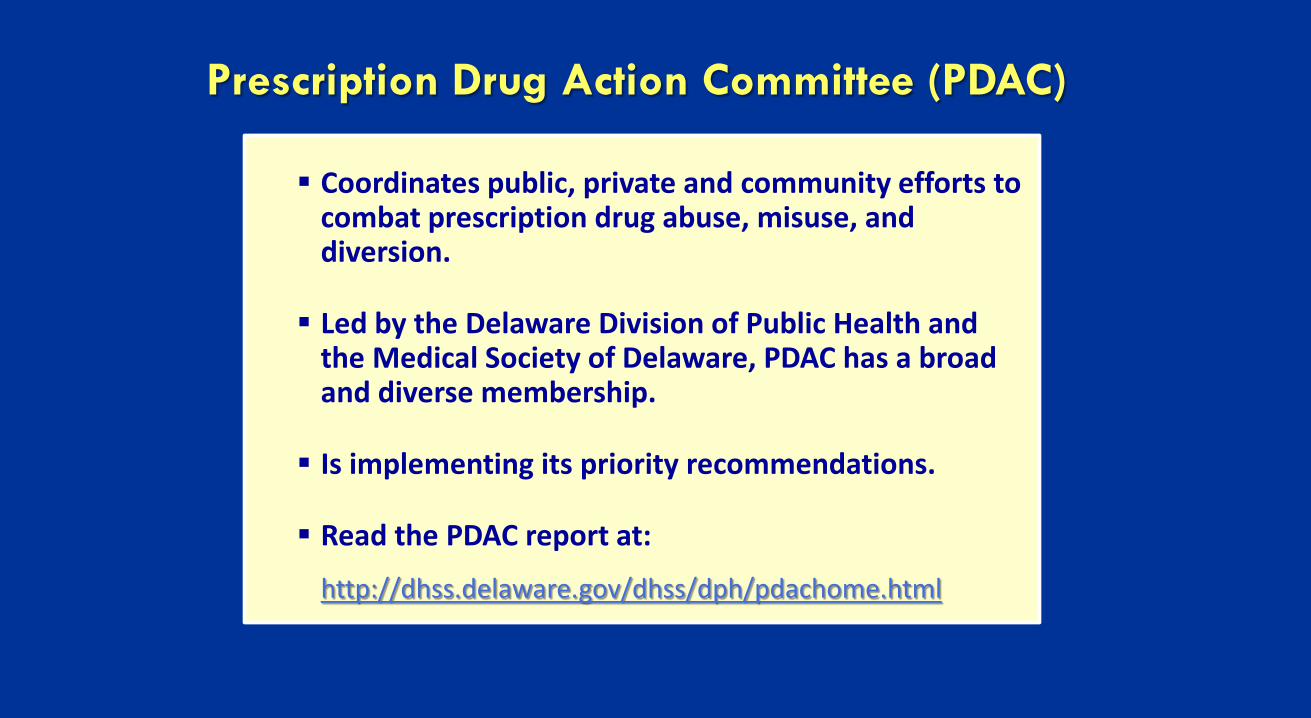
Prescription Drug Action Committee (PDAC)
Coordinates public, private and community efforts to combat prescription drug abuse, misuse, and diversion.
Led by the Delaware Division of Public Health and the Medical Society of Delaware, PDAC has a broad and diverse membership.
Is implementing its priority recommendations.
Read the PDAC report at:
http://dhss.delaware.gov/dhss/dph/pdachome.html
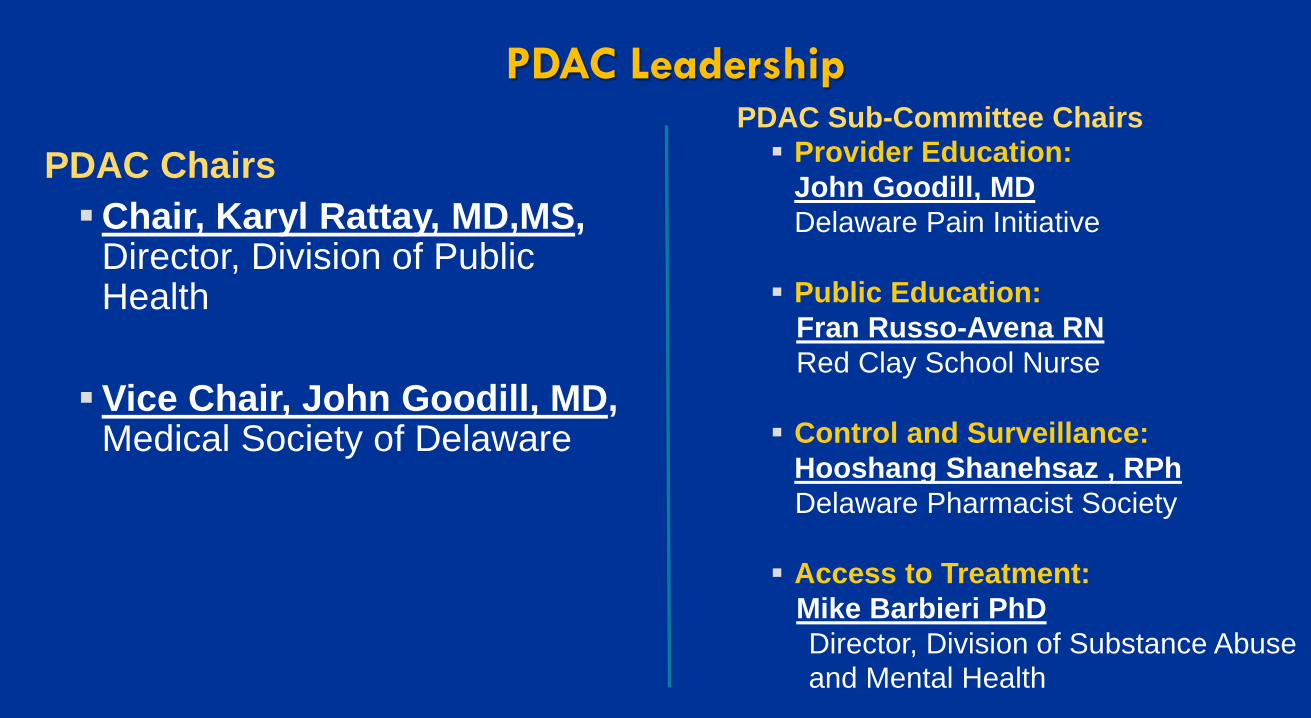
PDAC Leadership
PDAC Chairs Chair, Karyl Rattay, MD,MS,
Director, Division of Public Health Vice Chair, John Goodill, MD,
Medical Society of Delaware
PDAC Sub-Committee Chairs Provider Education:
John Goodill, MD Delaware Pain Initiative
Public Education: Fran Russo-Avena RN Red Clay School Nurse Control and Surveillance:
Hooshang Shanehsaz , RPh Delaware Pharmacist Society Access to Treatment: Mike Barbieri PhD
Director, Division of Substance Abuse and Mental Health
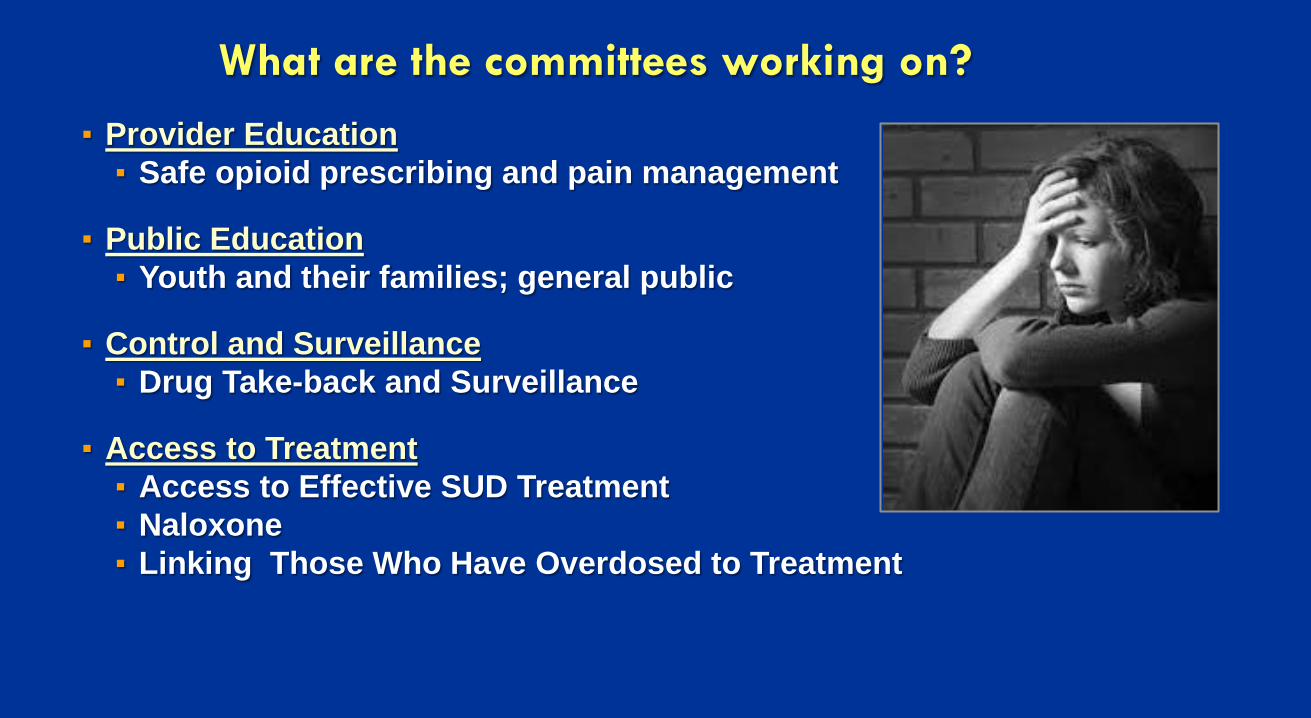
What are the committees working on?
▪ Provider Education ▪ Safe opioid prescribing and pain management
▪ Public Education ▪ Youth and their families; general public
▪ Control and Surveillance ▪ Drug Take-back and Surveillance
▪ Access to Treatment ▪ Access to Effective SUD Treatment ▪ Naloxone ▪ Linking Those Who Have Overdosed to Treatment
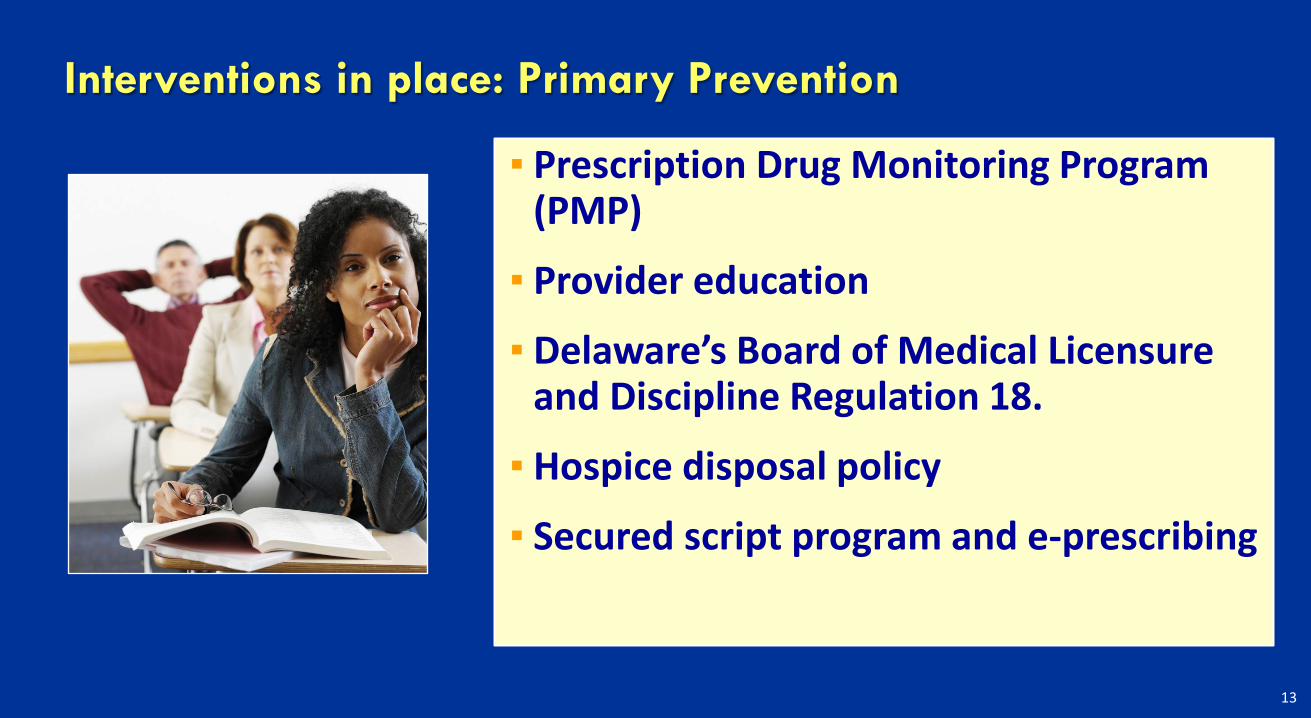
Interventions in place: Primary Prevention
▪ Prescription Drug Monitoring Program (PMP)
▪ Provider education
▪ Delaware’s Board of Medical Licensure and Discipline Regulation 18.
▪ Hospice disposal policy
▪ Secured script program and e-prescribing
13
Jan-Mar2012
Apr-Jun2012
Jul-Sep2012
Oct-Dec2012
Jan-Mar2013
Apr-Jun2013
Jul-Sep2013
Oct-Dec2013
Jan-Mar2014
Apr-Jun2014
Jul-Sep2014
Oct-Dec2014
Jan-Mar2015
Apr-Jun2015
Jul-Sep2015
Oct-Dec2015
Jan-Mar2016
Apr-Jun2016
Jul-Sep2016
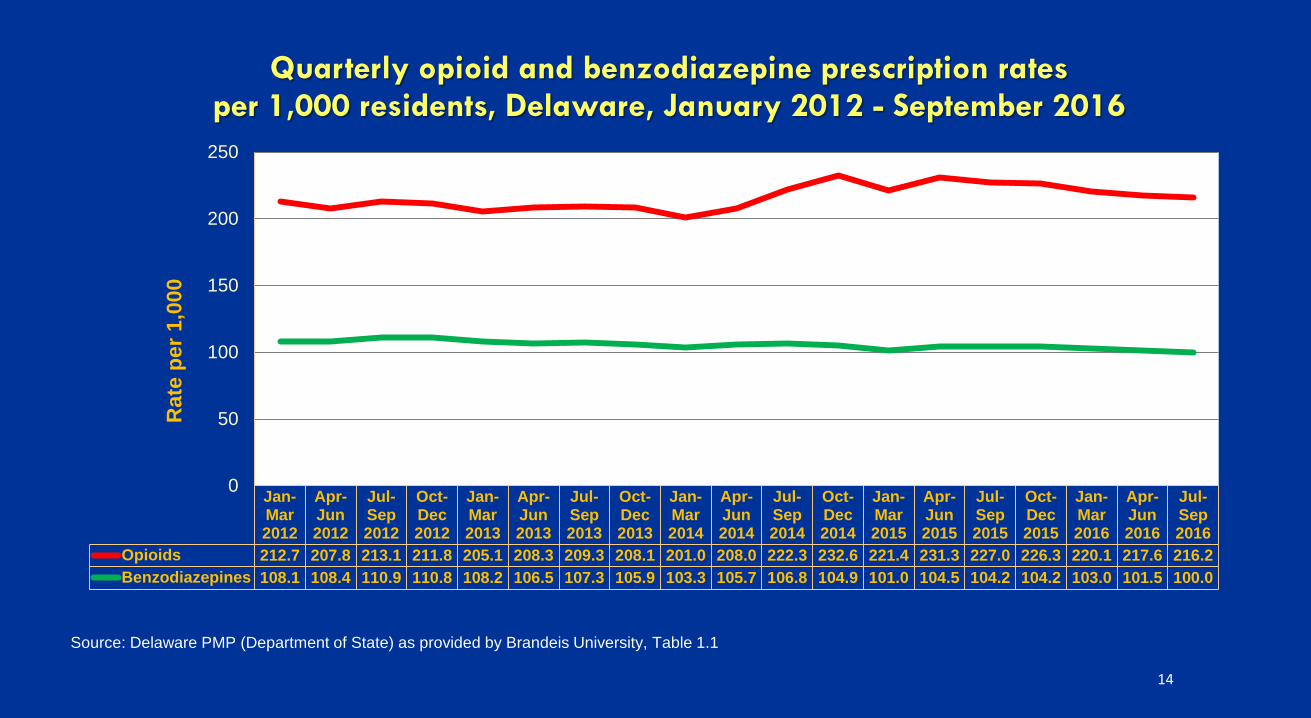
Opioids 212.7 207.8 213.1 211.8 205.1 208.3 209.3 208.1 201.0 208.0 222.3 232.6 221.4 231.3 227.0 226.3 220.1 217.6 216.2Benzodiazepines 108.1 108.4 110.9 110.8 108.2 106.5 107.3 105.9 103.3 105.7 106.8 104.9 101.0 104.5 104.2 104.2 103.0 101.5 100.0
0
50
100
150
200
250R
ate
per 1
,000
Quarterly opioid and benzodiazepine prescription rates per 1,000 residents, Delaware, January 2012 - September 2016
Source: Delaware PMP (Department of State) as provided by Brandeis University, Table 1.1
14

15
Jan-Mar2012
Apr-Jun2012
Jul-Sep2012
Oct-Dec2012
Jan-Mar2013
Apr-Jun2013
Jul-Sep2013
Oct-Dec2013
Jan-Mar2014
Apr-Jun2014
Jul-Sep2014
Oct-Dec2014
Jan-Mar2015
Apr-Jun2015
Jul-Sep2015
Oct-Dec2015
Jan-Mar2016
Apr-Jun2016
Jul-Sep2016
Any opioid 20.07 19.51 19.12 19.01 19.00 18.64 18.20 17.06 16.76 16.87 15.27 14.63 13.75 12.72 13.71 13.43 13.43 13.24 13.28
0
5
10
15
20
25Pe
rcen
tage
Quarterly percentage of patients receiving >100 MMEs1 daily, Delaware, January 2012 - September 2016
Source: Delaware PMP (Department of State) as provided by Brandeis University, Table 2.1
1 MMEs = Morphine Milligram Equivalents
16
0
2
4
6
8
10
12
14
16
18
20
Jan-Mar2012
Apr-Jun2012
Jul-Sep2012
Oct-Dec2012
Jan-Mar2013
Apr-Jun2013
Jul-Sep2013
Oct-Dec2013
Jan-Mar2014
Apr-Jun2014
Jul-Sep2014
Oct-Dec2014
Jan-Mar2015
Apr-Jun2015
Jul-Sep2015
Oct-Dec2015
Jan-Mar2016
Apr-Jun2016
Jul-Sep2016
Perc
enta
ge
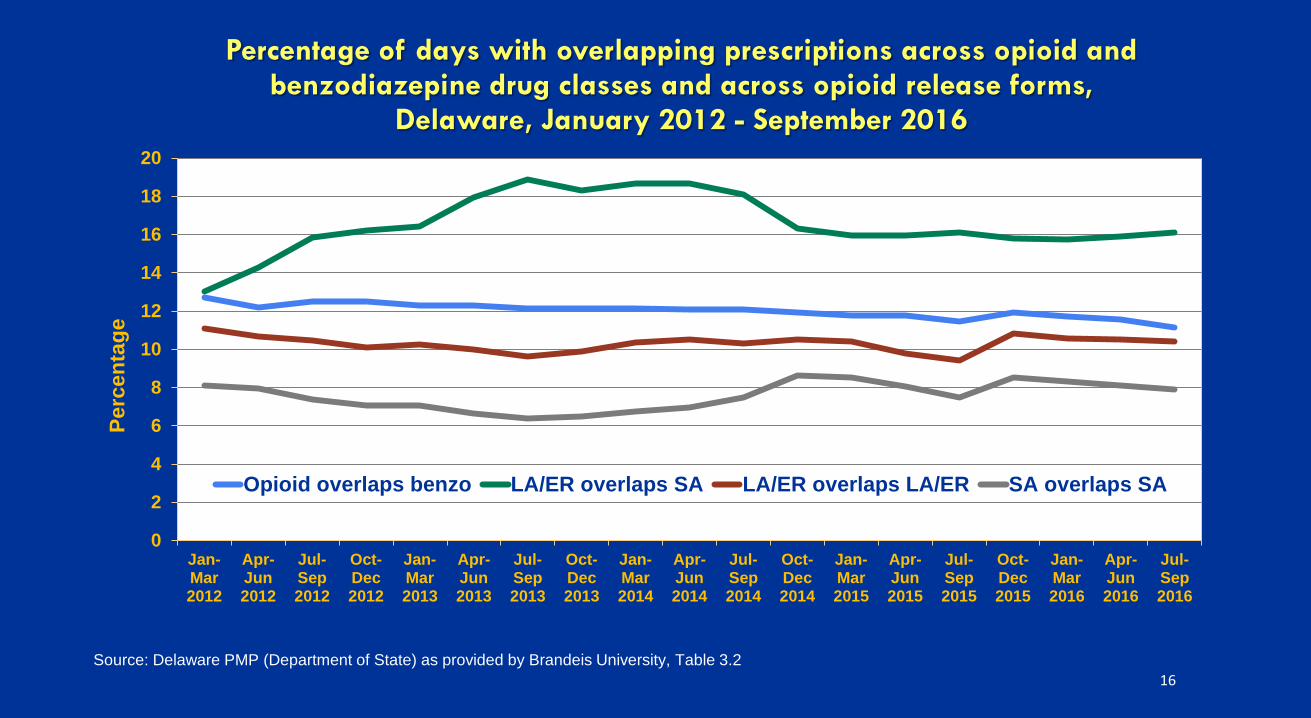
Percentage of days with overlapping prescriptions across opioid and benzodiazepine drug classes and across opioid release forms,
Delaware, January 2012 - September 2016
Opioid overlaps benzo LA/ER overlaps SA LA/ER overlaps LA/ER SA overlaps SA
Source: Delaware PMP (Department of State) as provided by Brandeis University, Table 3.2
17
0.00
2.00
4.00
6.00
8.00
10.00
12.00
14.00
16.00
Jan-Mar2012
Apr-Jun2012
Jul-Sep2012
Oct-Dec2012
Jan-Mar2013
Apr-Jun2013
Jul-Sep2013
Oct-Dec2013
Jan-Mar2014
Apr-Jun2014
Jul-Sep2014
Oct-Dec2014
Jan-Mar2015
Apr-Jun2015
Jul-Sep2015
Oct-Dec2015
Jan-Mar2016
Apr-Jun2016
Jul-Sep2016
Rat
e p
er 1
00,0
00
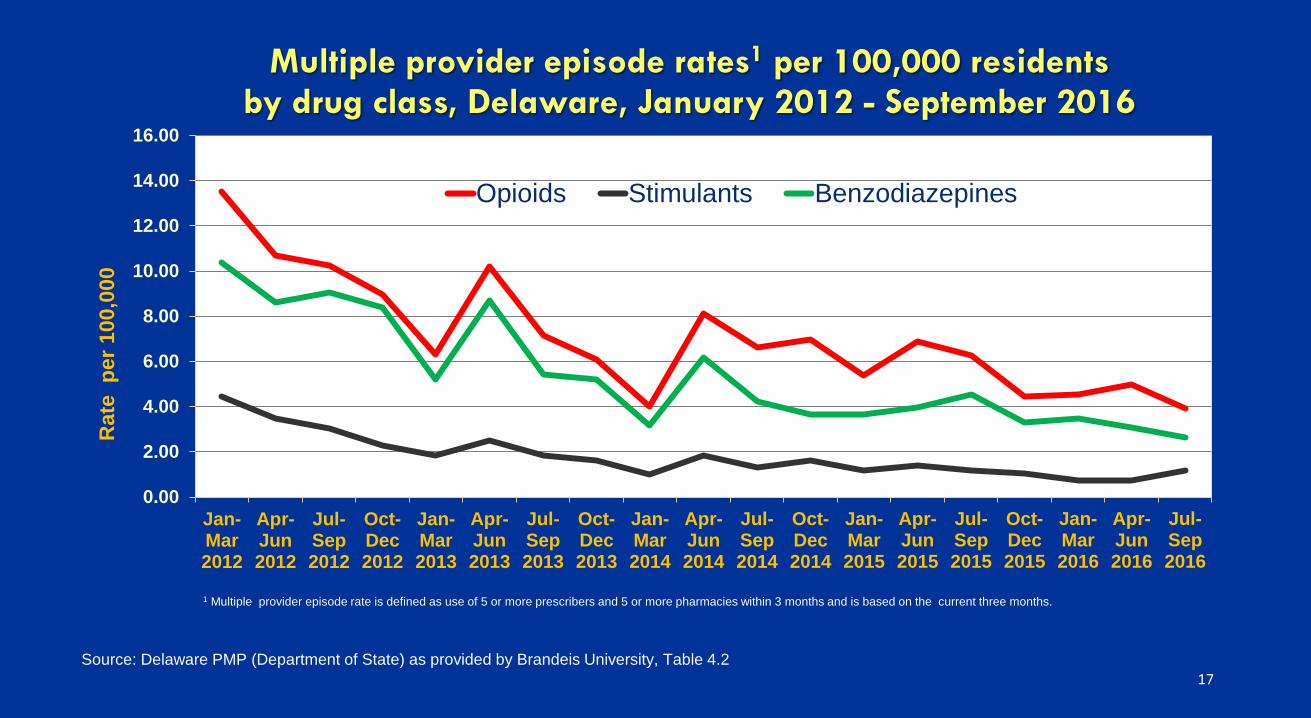
Multiple provider episode rates1 per 100,000 residents by drug class, Delaware, January 2012 - September 2016
Opioids Stimulants Benzodiazepines
1 Multiple provider episode rate is defined as use of 5 or more prescribers and 5 or more pharmacies within 3 months and is based on the current three months.
Source: Delaware PMP (Department of State) as provided by Brandeis University, Table 4.2
18
25.5
7
65.3
7
14.7
8
8.34
4.90
2.94
1.73
0.99
0.54
0.26
0.15
24.4
6
64.1
6
15.4
3
8.64
5.08
2.96
1.76
1.02
0.55
0.28
0.15
0
10
20
30
40
50
60
70
1st (Top 1%) 1st-10th 11th-20th 21st-30th 31st-40th 41st-50th 51st-60th 61st-70th 71st-80th 81st-90th 91st-100th
Perc
enta
ge
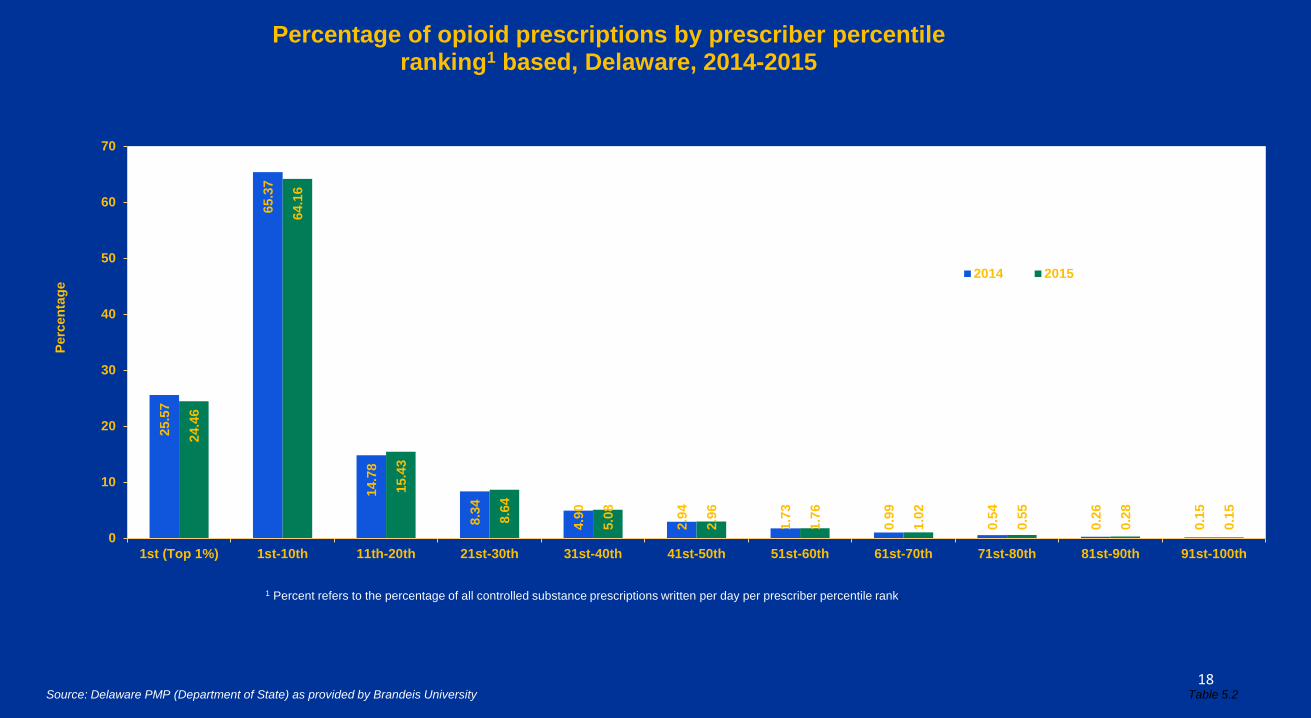
Percentage of opioid prescriptions by prescriber percentile ranking1 based, Delaware, 2014-2015
2014 2015
Table 5.2 Source: Delaware PMP (Department of State) as provided by Brandeis University
1 Percent refers to the percentage of all controlled substance prescriptions written per day per prescriber percentile rank.
19
87.0
7
81.3
2
55.5
2
54.0
5
47.7
4
45.0
3
44.2
9
43.8
7
45.7
2
39.8
0
43.6
2
77.1
3
75.4
7
52.5
0
49.9
2
41.7
2
40.3
2
39.8
3
38.7
0
39.9
6
36.2
1
38.9
7
0
10
20
30
40
50
60
70
80
90
100
1st (Top 1%) 1st-10th 11th-20th 21st-30th 31st-40th 41st-50th 51st-60th 61st-70th 71st-80th 81st-90th 91st-100th
Mea
n da
ily d
osag
es in
MM
Es
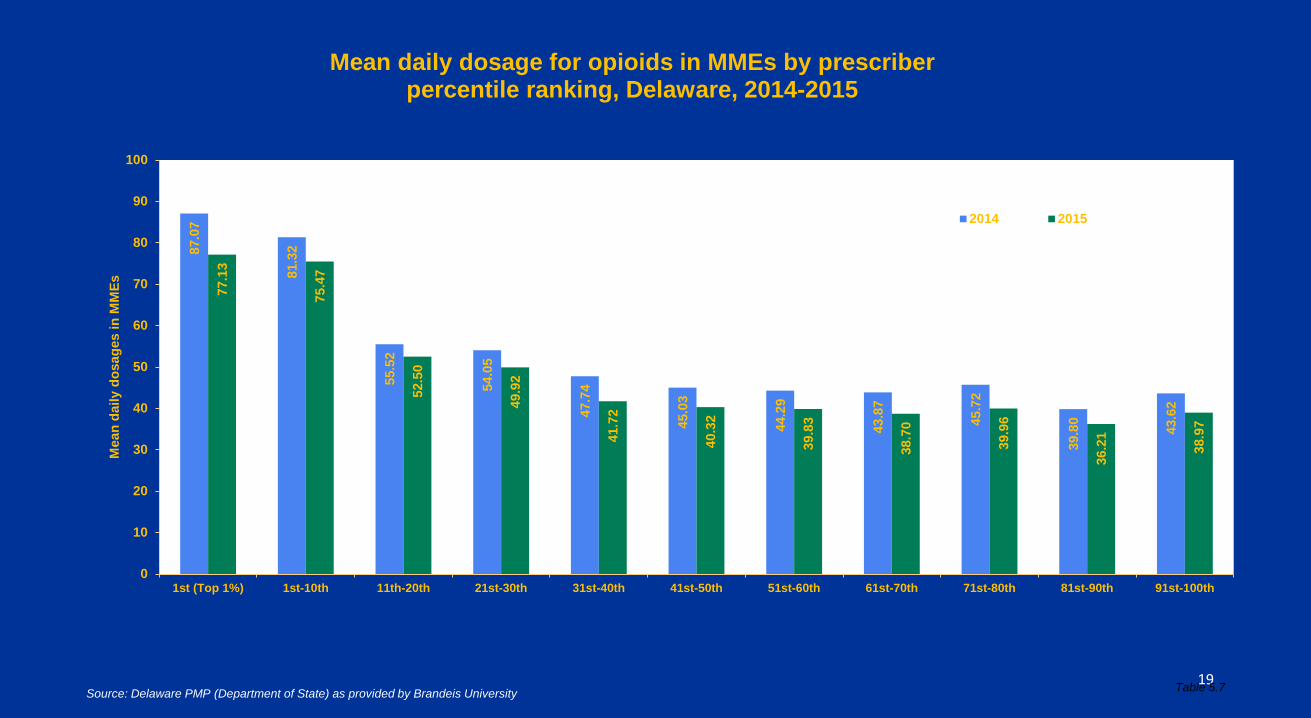
Mean daily dosage for opioids in MMEs by prescriber percentile ranking, Delaware, 2014-2015
2014 2015
Source: Delaware PMP (Department of State) as provided by Brandeis University Table 5.7
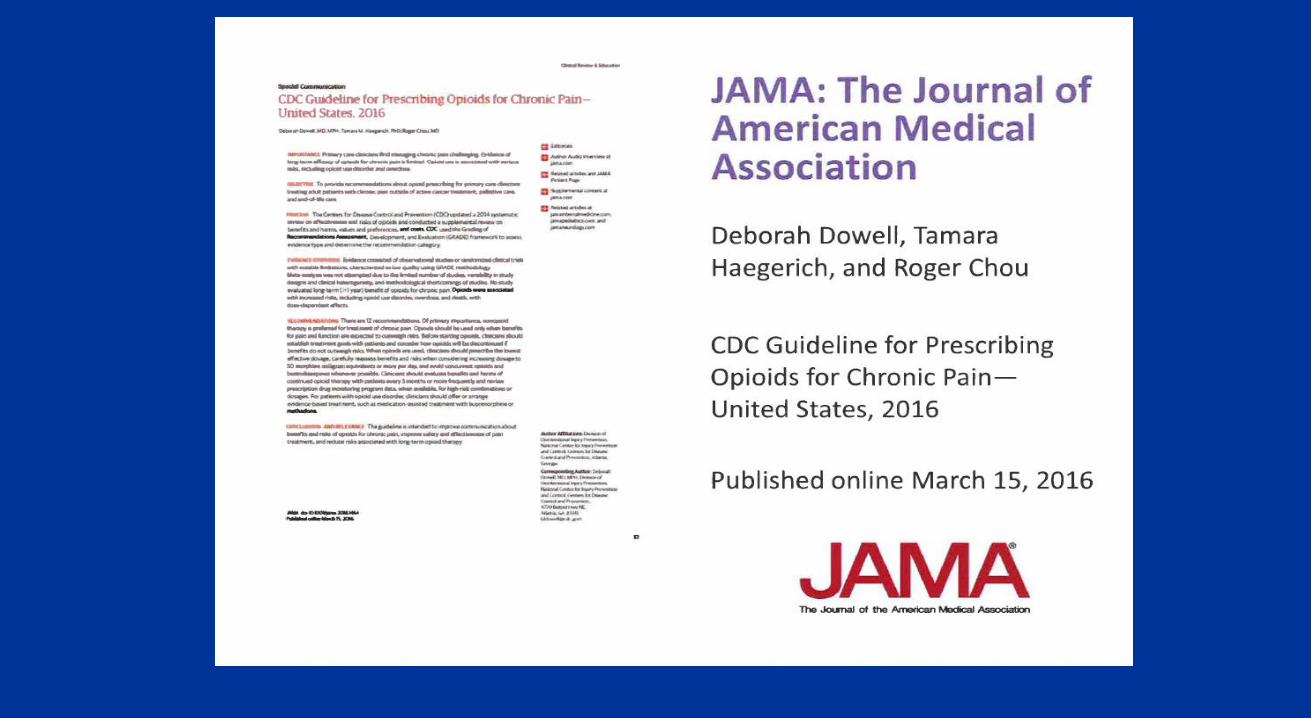
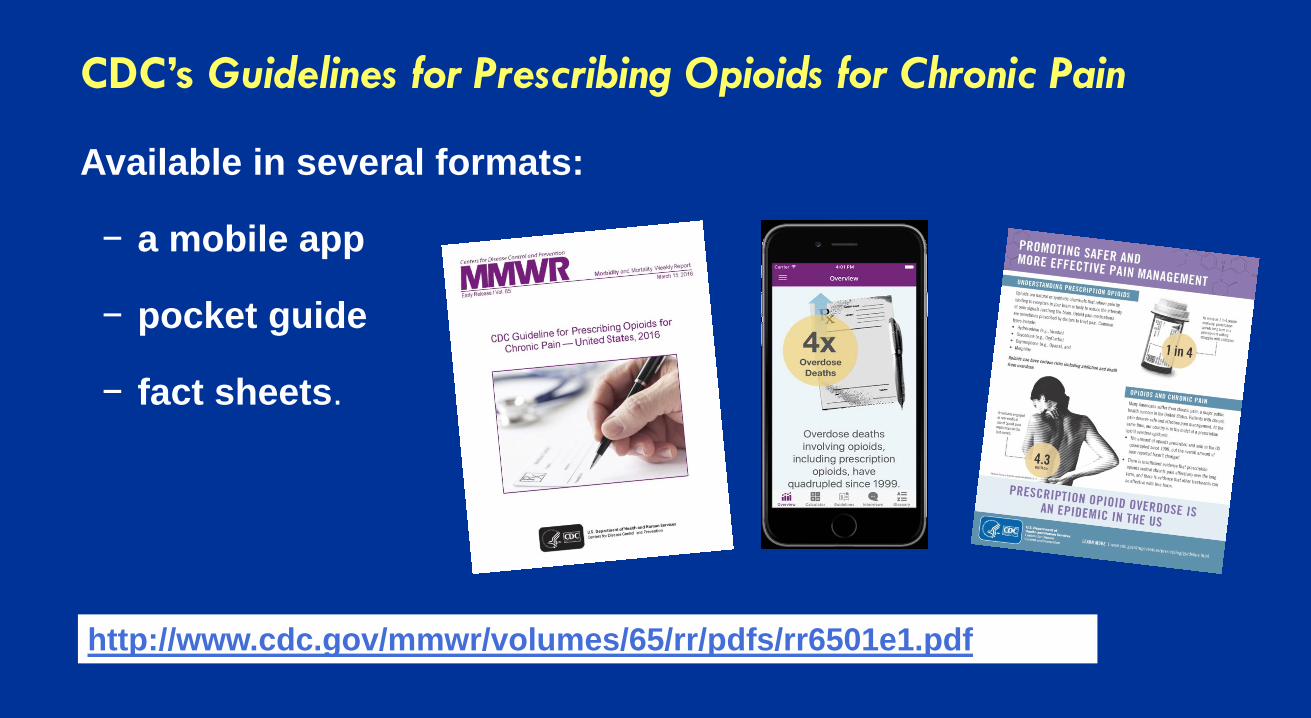
http://www.cdc.gov/mmwr/volumes/65/rr/pdfs/rr6501e1.pdf
CDC’s Guidelines for Prescribing Opioids for Chronic Pain Available in several formats:
− a mobile app
− pocket guide
− fact sheets.
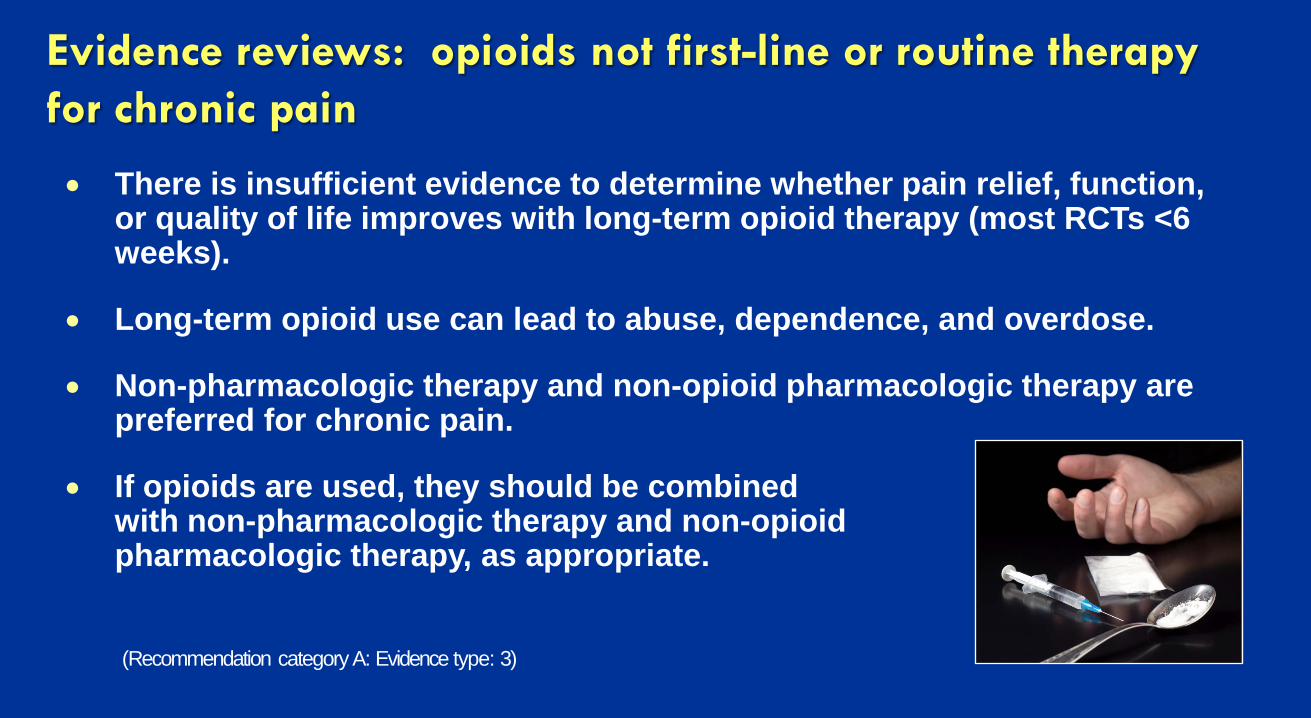
Evidence reviews: opioids not first-line or routine therapy for chronic pain
• There is insufficient evidence to determine whether pain relief, function, or quality of life improves with long-term opioid therapy (most RCTs <6 weeks).
• Long-term opioid use can lead to abuse, dependence, and overdose.
• Non-pharmacologic therapy and non-opioid pharmacologic therapy are preferred for chronic pain.
• If opioids are used, they should be combined with non-pharmacologic therapy and non-opioid pharmacologic therapy, as appropriate.
(Recommendation category A: Evidence type: 3)
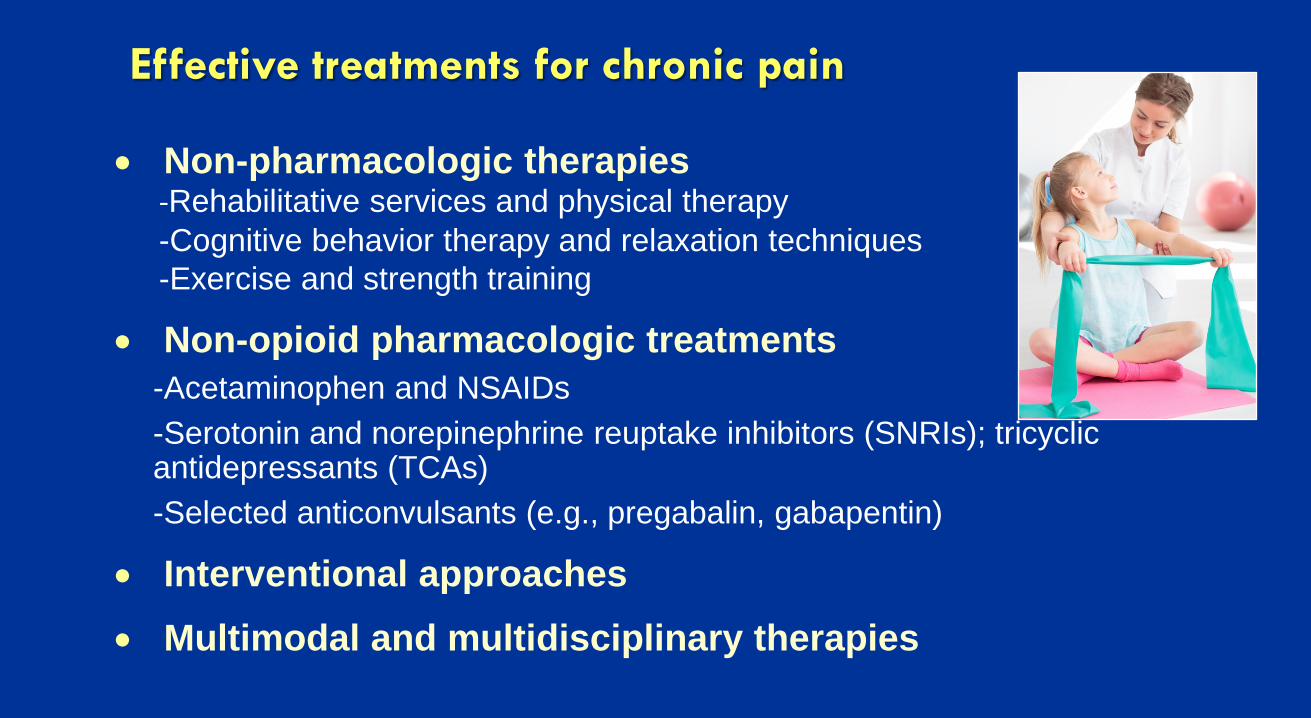
Effective treatments for chronic pain
• Non-pharmacologic therapies -Rehabilitative services and physical therapy -Cognitive behavior therapy and relaxation techniques -Exercise and strength training
• Non-opioid pharmacologic treatments -Acetaminophen and NSAIDs -Serotonin and norepinephrine reuptake inhibitors (SNRIs); tricyclic antidepressants (TCAs) -Selected anticonvulsants (e.g., pregabalin, gabapentin)
• Interventional approaches • Multimodal and multidisciplinary therapies
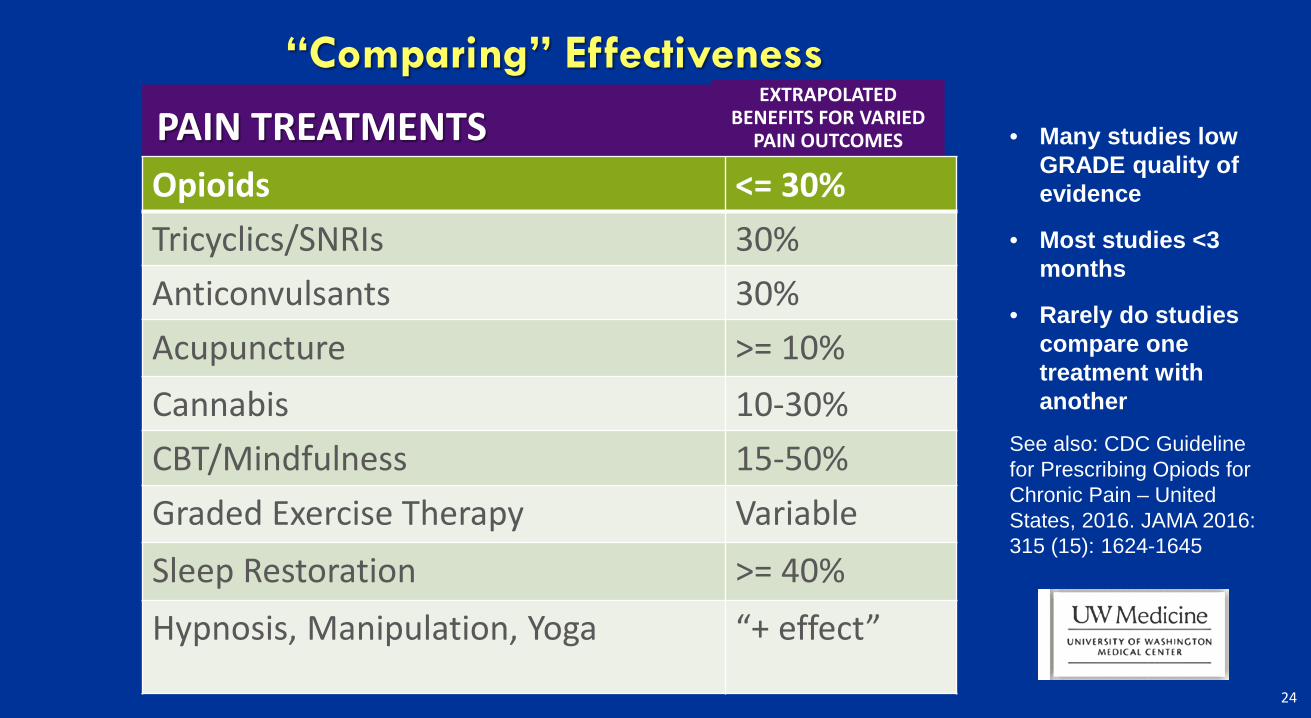
“Comparing” Effectiveness
PAIN TREATMENTS EXTRAPOLATED
BENEFITS FOR VARIED PAIN OUTCOMES
Opioids <= 30% Tricyclics/SNRIs 30% Anticonvulsants 30% Acupuncture >= 10% Cannabis 10-30% CBT/Mindfulness 15-50% Graded Exercise Therapy Variable Sleep Restoration >= 40% Hypnosis, Manipulation, Yoga “+ effect”
• Many studies low GRADE quality of evidence
• Most studies <3 months
• Rarely do studies compare one treatment with another
See also: CDC Guideline for Prescribing Opiods for Chronic Pain – United States, 2016. JAMA 2016: 315 (15): 1624-1645
24
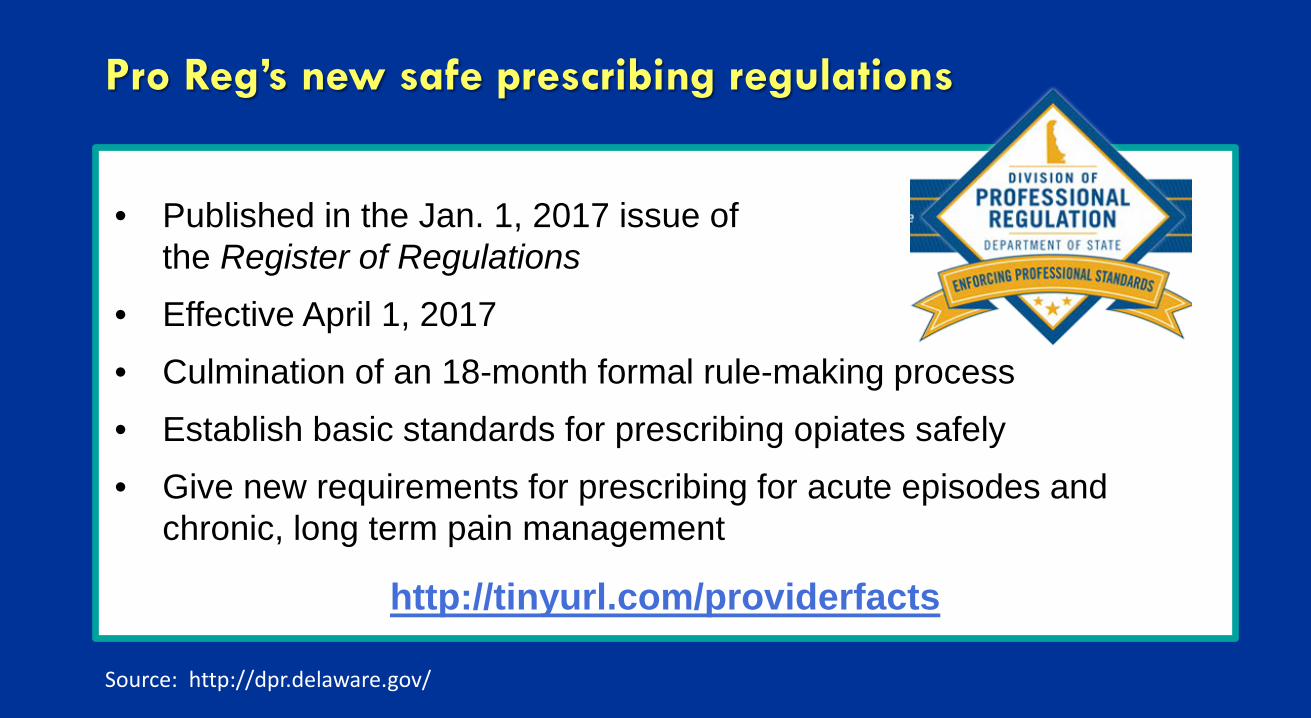
Pro Reg’s new safe prescribing regulations
• Published in the Jan. 1, 2017 issue of
the Register of Regulations
• Effective April 1, 2017 • Culmination of an 18-month formal rule-making process • Establish basic standards for prescribing opiates safely • Give new requirements for prescribing for acute episodes and
chronic, long term pain management
http://tinyurl.com/providerfacts
Source: http://dpr.delaware.gov/
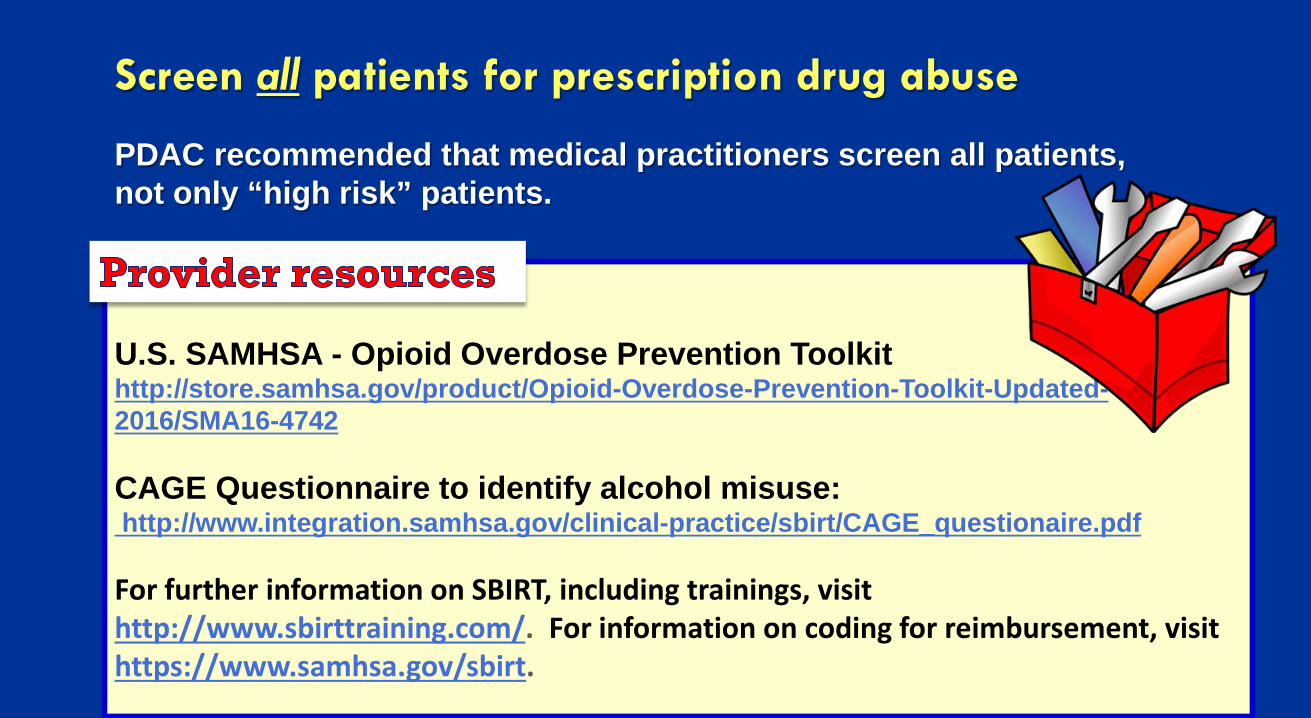
Screen all patients for prescription drug abuse
U.S. SAMHSA - Opioid Overdose Prevention Toolkit http://store.samhsa.gov/product/Opioid-Overdose-Prevention-Toolkit-Updated-2016/SMA16-4742 CAGE Questionnaire to identify alcohol misuse: http://www.integration.samhsa.gov/clinical-practice/sbirt/CAGE_questionaire.pdf For further information on SBIRT, including trainings, visit http://www.sbirttraining.com/. For information on coding for reimbursement, visit https://www.samhsa.gov/sbirt.
PDAC recommended that medical practitioners screen all patients, not only “high risk” patients.
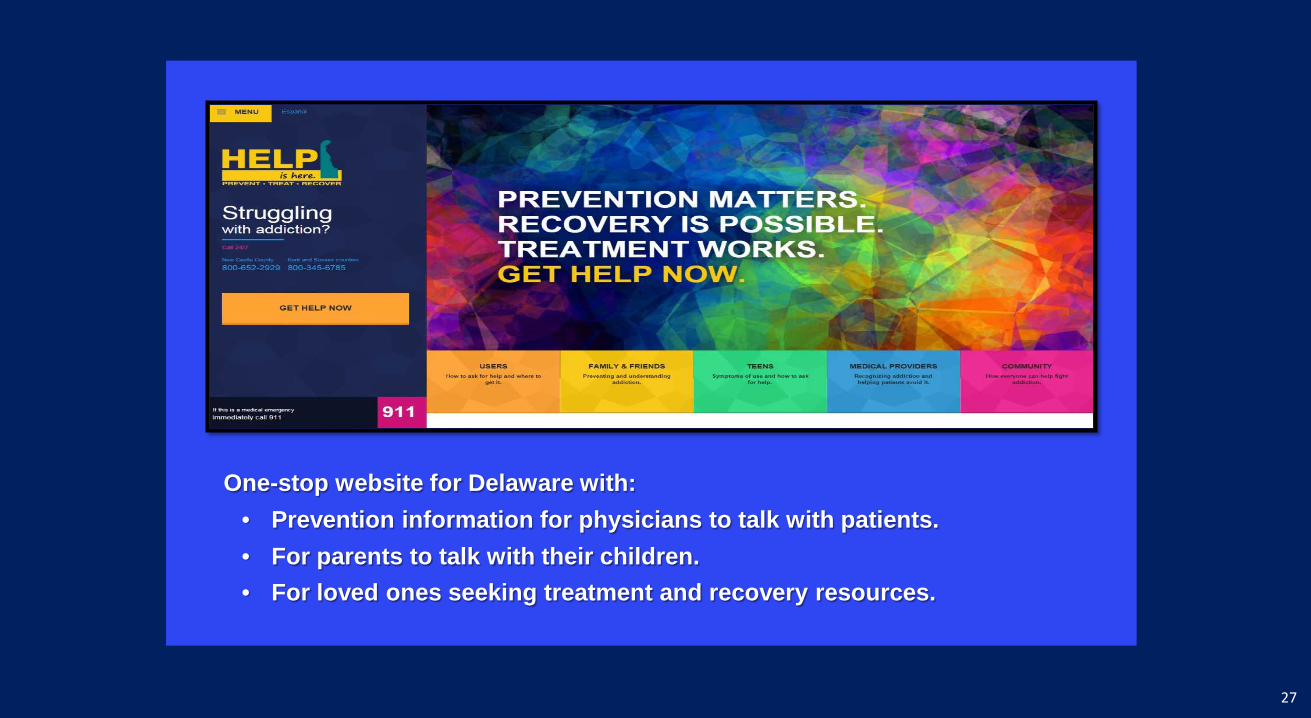
HelpIsHereDE.com
One-stop website for Delaware with: • Prevention information for physicians to talk with patients. • For parents to talk with their children. • For loved ones seeking treatment and recovery resources.
27

New CDC Prescription Drug Overdose Prevention Grant
Five-year grant (March 2016 – Aug. 31, 2020) DPH awarded $ 1,219,351
Priority Strategy #1: Enhance and Maximize the PMP
▬ Make the PMP easier to use and access
▬ Conduct Public Health surveillance with PMP data and disseminate
CDC
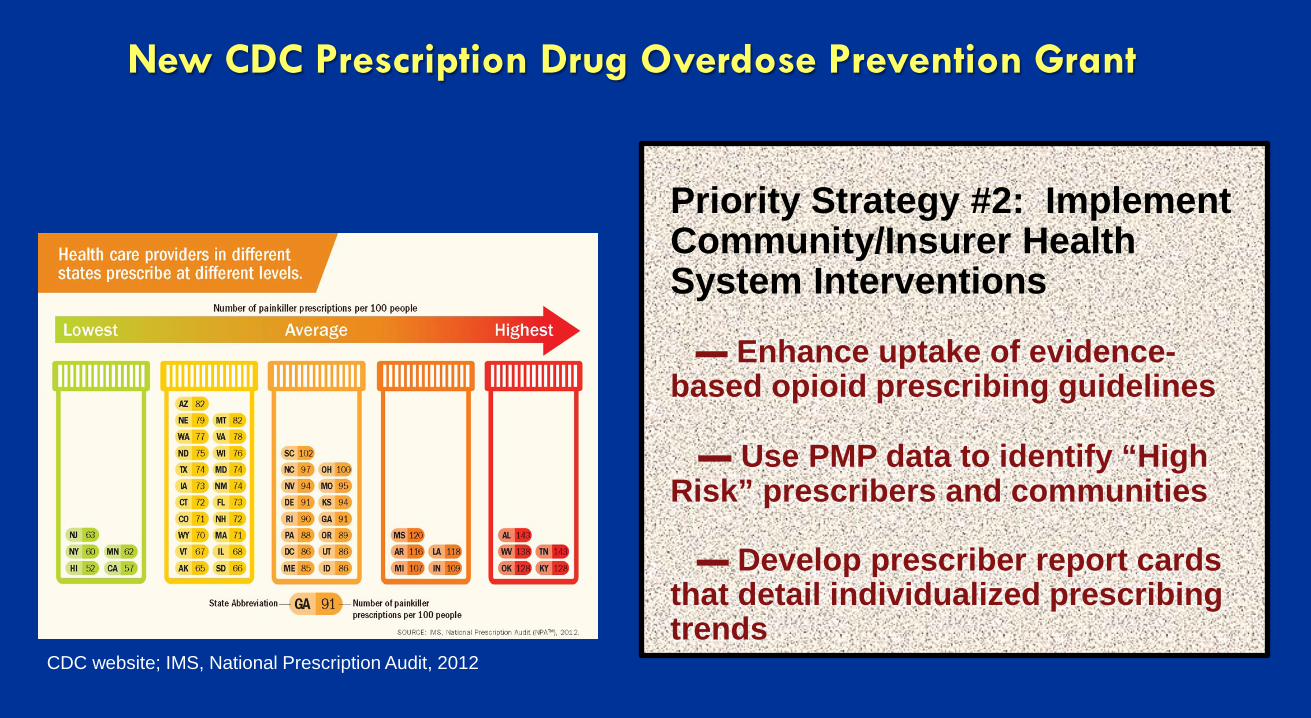
Priority Strategy #2: Implement Community/Insurer Health System Interventions ▬ Enhance uptake of evidence-based opioid prescribing guidelines ▬ Use PMP data to identify “High Risk” prescribers and communities ▬ Develop prescriber report cards that detail individualized prescribing trends
CDC website; IMS, National Prescription Audit, 2012
New CDC Prescription Drug Overdose Prevention Grant
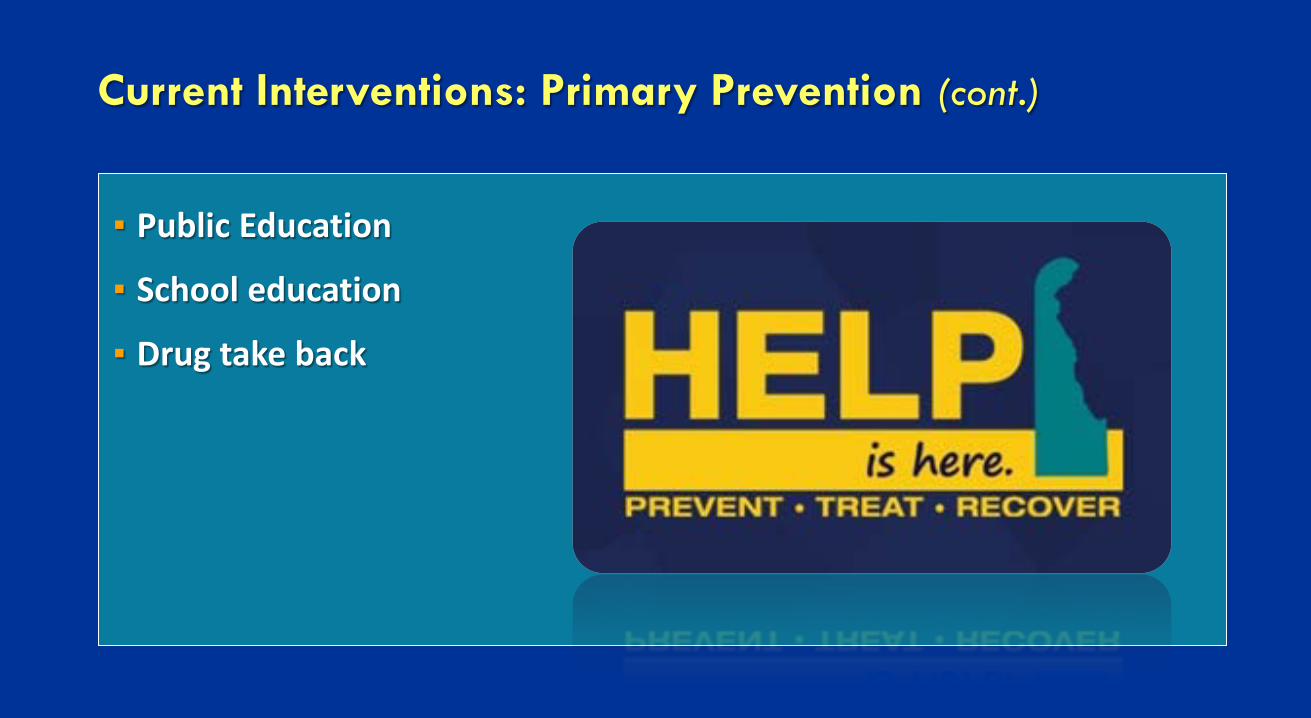
Current Interventions: Primary Prevention (cont.)
▪ Public Education
▪ School education
▪ Drug take back
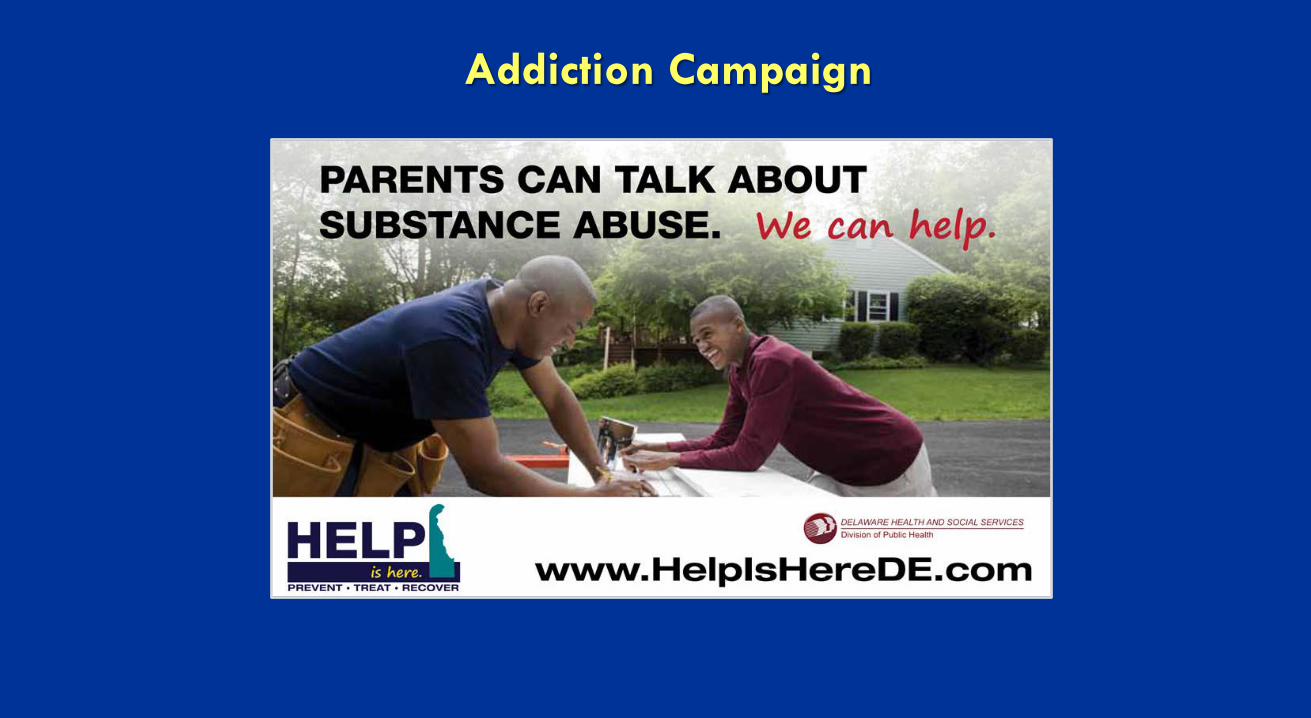
Addiction Campaign
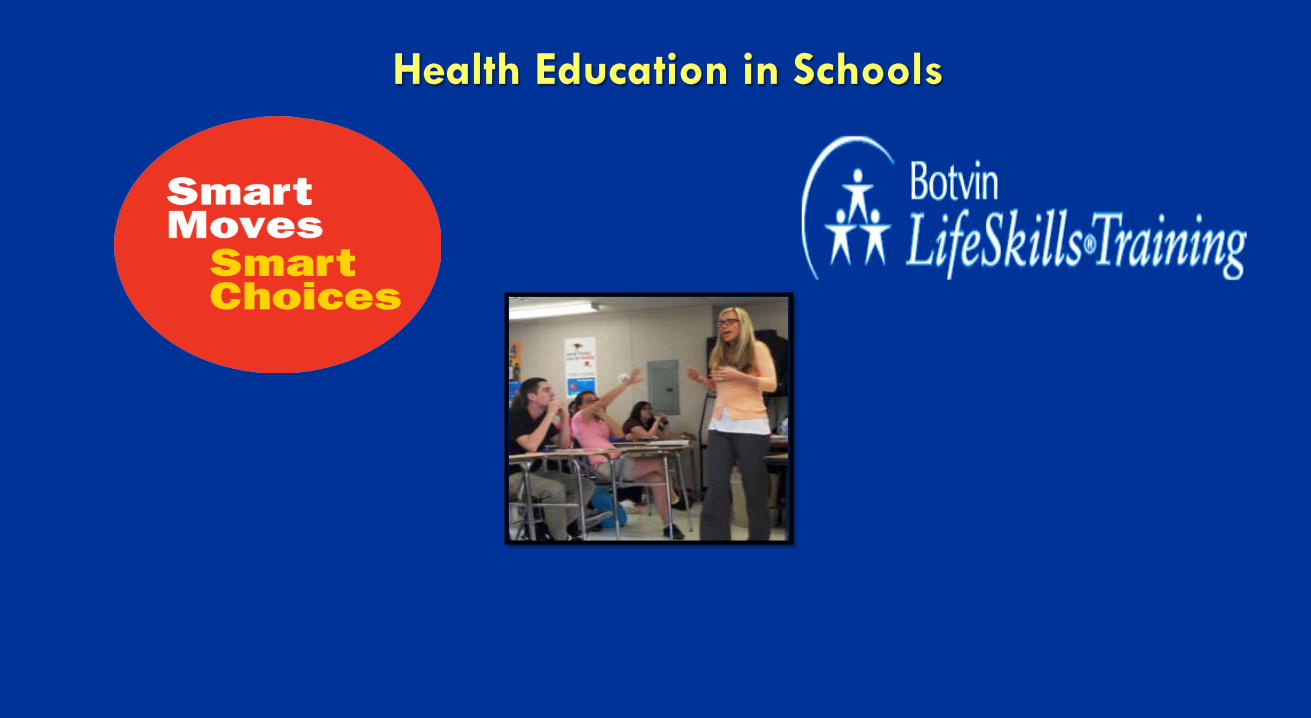
Health Education in Schools
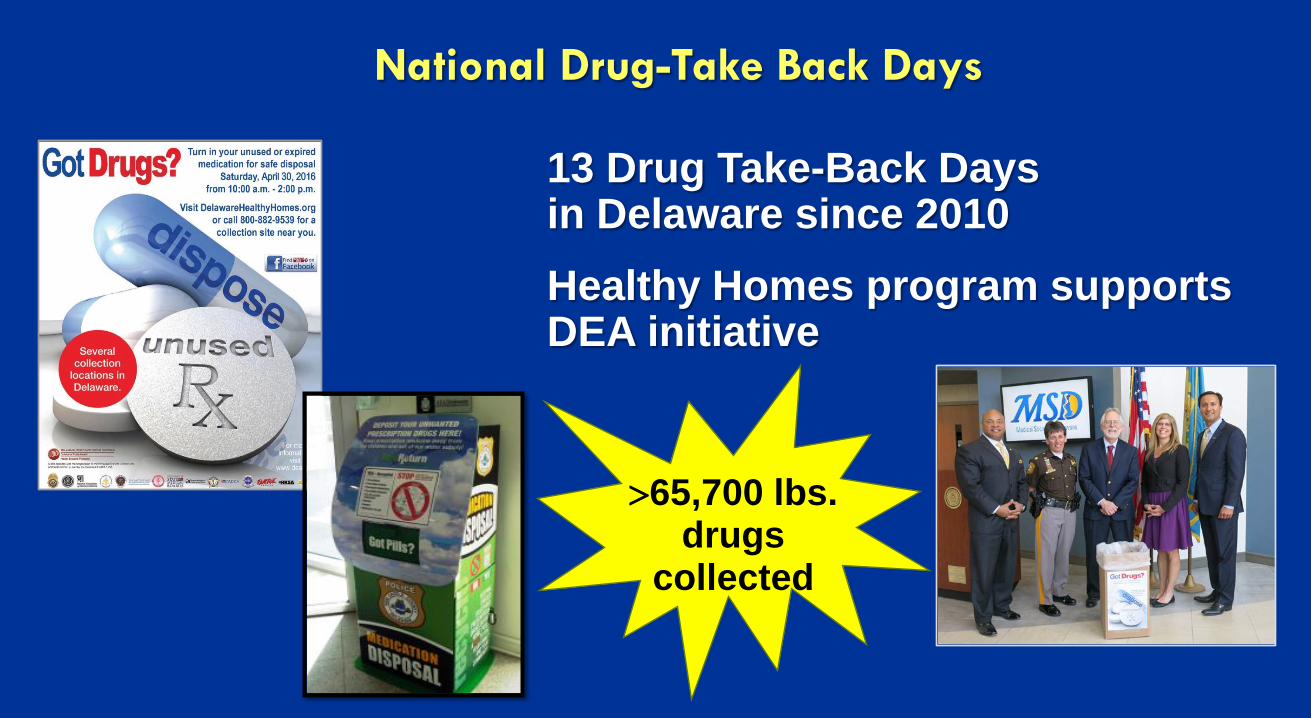
>65,700 lbs. drugs
collected
13 Drug Take-Back Days in Delaware since 2010 Healthy Homes program supports DEA initiative
National Drug-Take Back Days
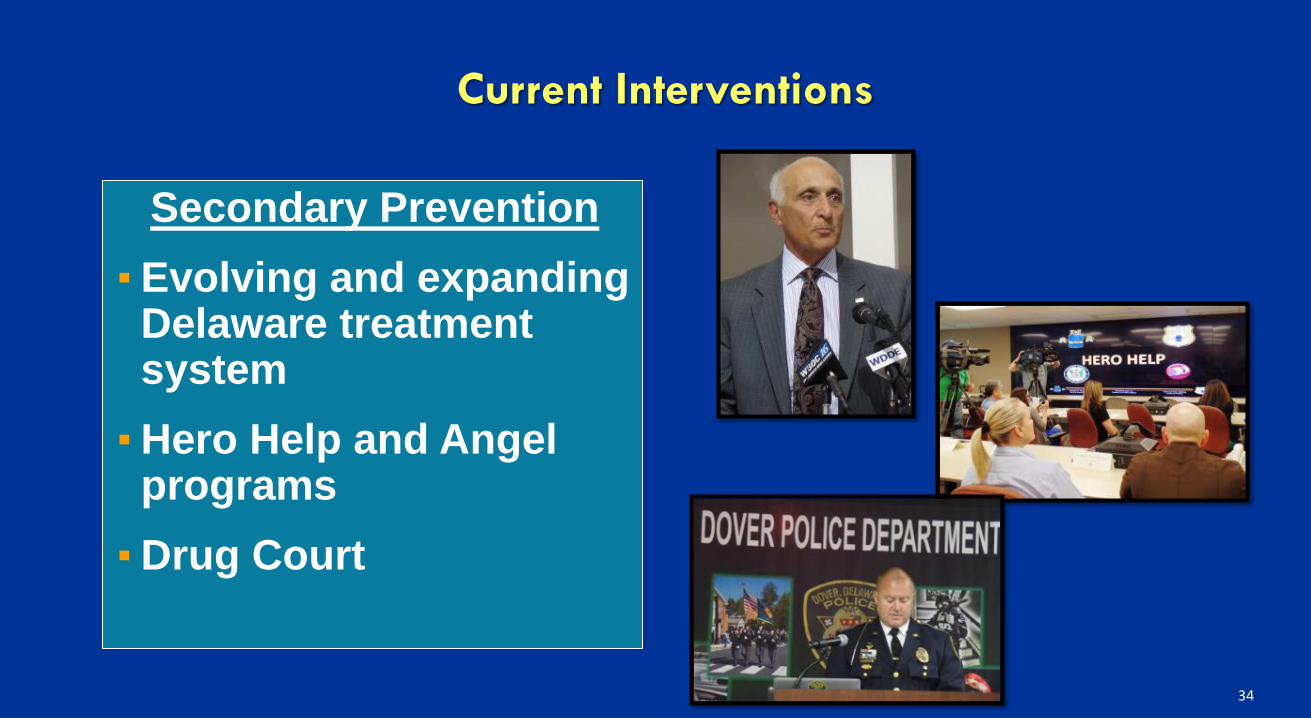
Current Interventions
Secondary Prevention ▪ Evolving and expanding
Delaware treatment system ▪Hero Help and Angel
programs ▪Drug Court
34
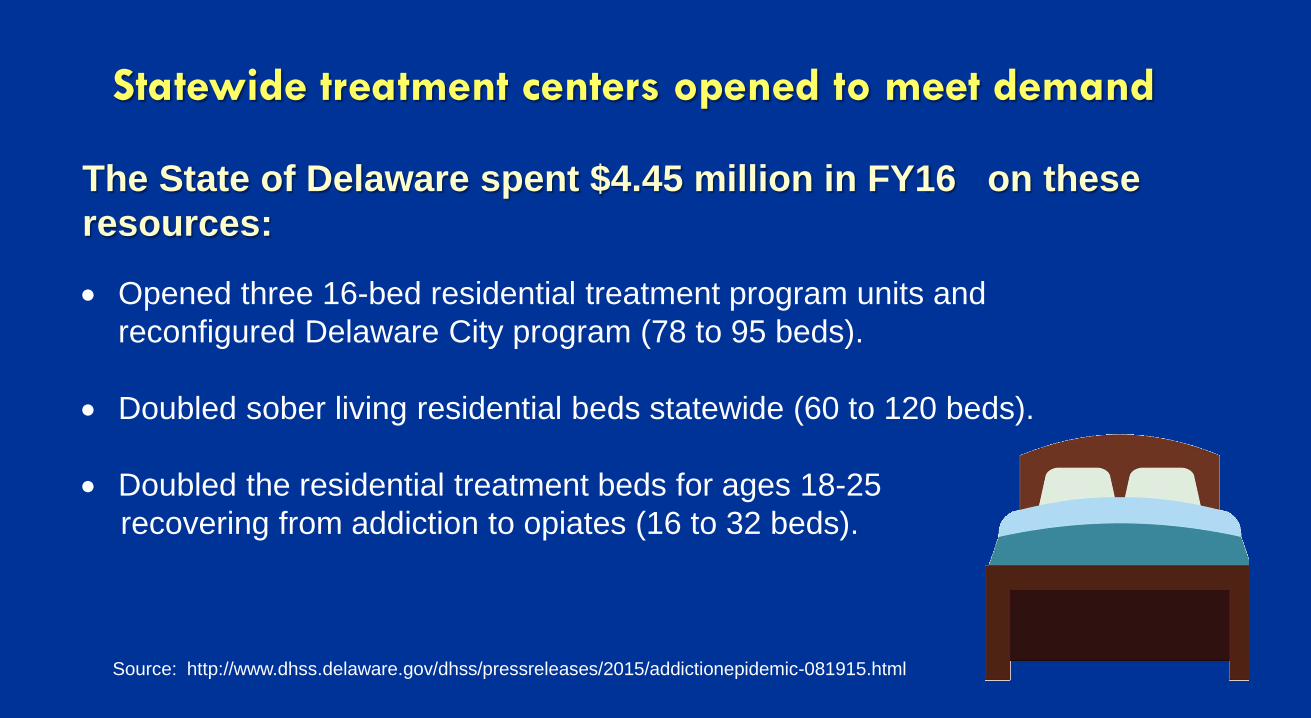
Statewide treatment centers opened to meet demand
Source: http://www.dhss.delaware.gov/dhss/pressreleases/2015/addictionepidemic-081915.html
The State of Delaware spent $4.45 million in FY16 on these resources: • Opened three 16-bed residential treatment program units and
reconfigured Delaware City program (78 to 95 beds).
• Doubled sober living residential beds statewide (60 to 120 beds).
• Doubled the residential treatment beds for ages 18-25 recovering from addiction to opiates (16 to 32 beds).
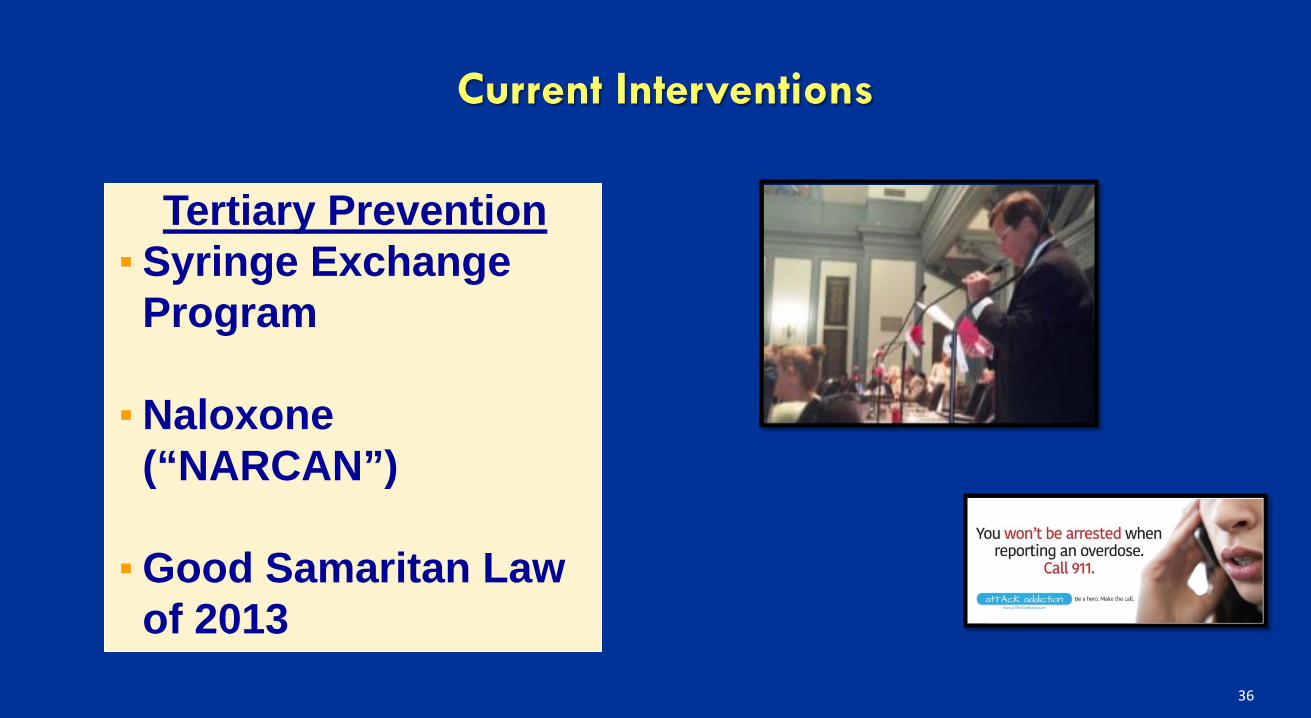
Current Interventions
Tertiary Prevention ▪ Syringe Exchange
Program ▪Naloxone
(“NARCAN”) ▪Good Samaritan Law
of 2013
36
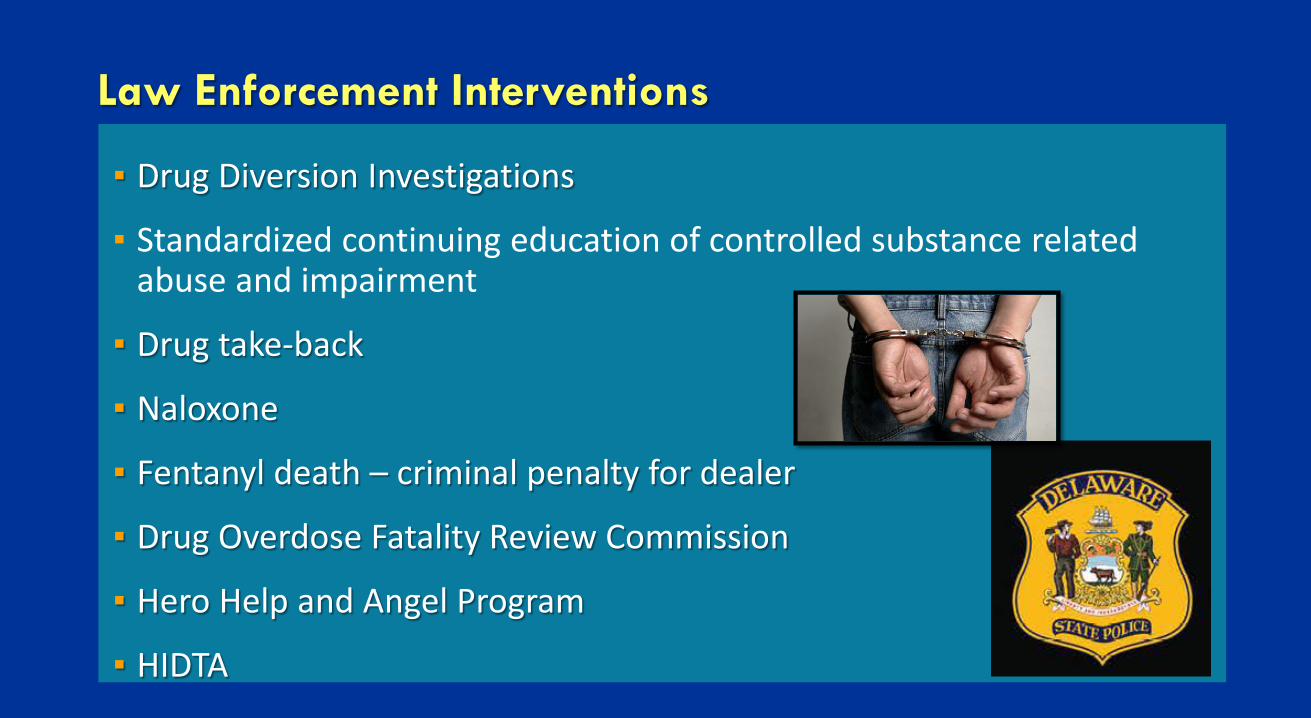
Law Enforcement Interventions
▪ Drug Diversion Investigations
▪ Standardized continuing education of controlled substance related abuse and impairment
▪ Drug take-back
▪ Naloxone
▪ Fentanyl death – criminal penalty for dealer
▪ Drug Overdose Fatality Review Commission
▪ Hero Help and Angel Program
▪ HIDTA
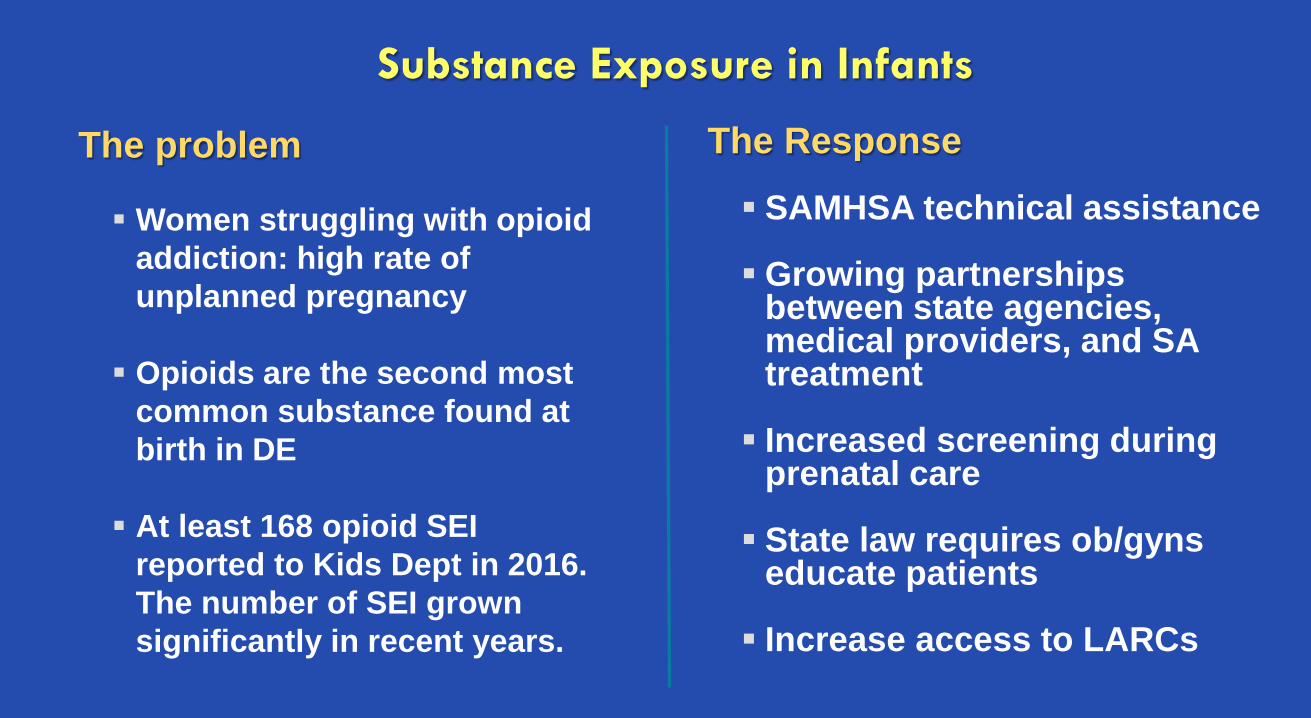
Substance Exposure in Infants
The problem
Women struggling with opioid addiction: high rate of unplanned pregnancy Opioids are the second most
common substance found at birth in DE At least 168 opioid SEI
reported to Kids Dept in 2016. The number of SEI grown significantly in recent years.
The Response
SAMHSA technical assistance Growing partnerships
between state agencies, medical providers, and SA treatment Increased screening during
prenatal care State law requires ob/gyns
educate patients Increase access to LARCs
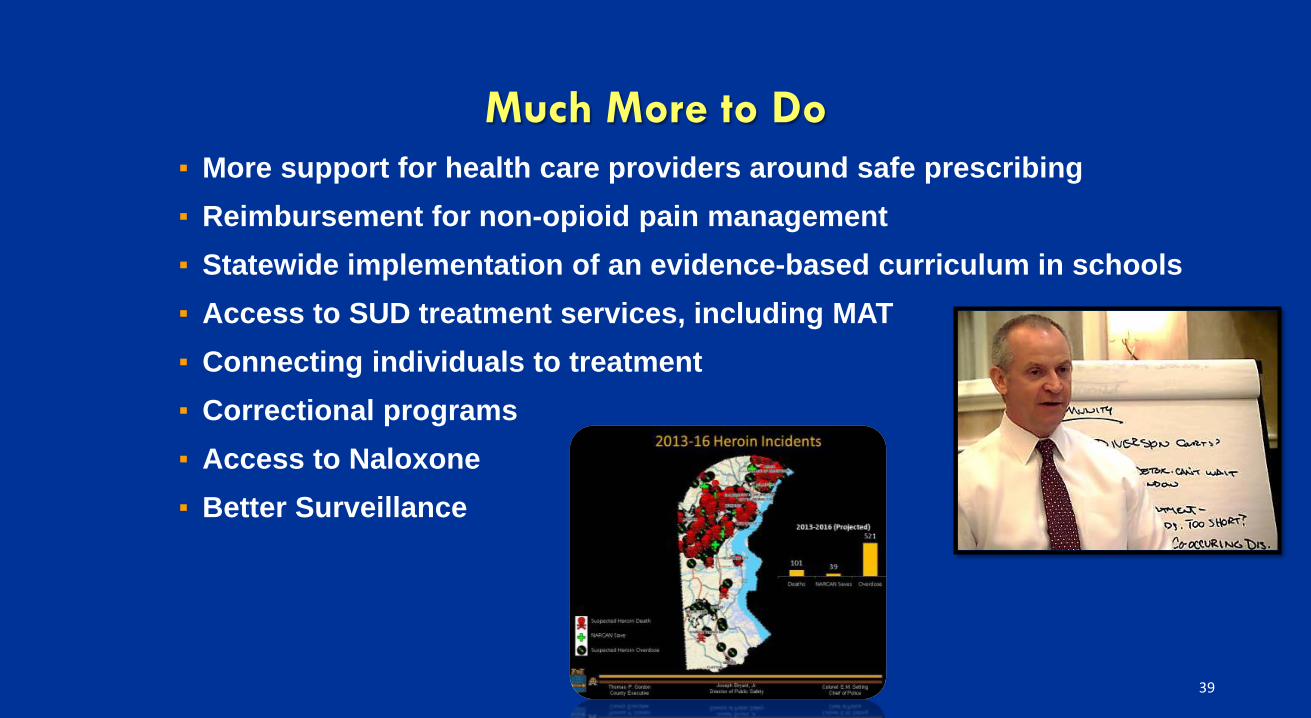
Much More to Do ▪ More support for health care providers around safe prescribing ▪ Reimbursement for non-opioid pain management ▪ Statewide implementation of an evidence-based curriculum in schools ▪ Access to SUD treatment services, including MAT ▪ Connecting individuals to treatment ▪ Correctional programs ▪ Access to Naloxone ▪ Better Surveillance
39
Thank You!
Related Documents