Welcome message from author
This document is posted to help you gain knowledge. Please leave a comment to let me know what you think about it! Share it to your friends and learn new things together.
Transcript
How a New Tennessee Milk Plant Could Grow the State EconomyAugust 2016
Authors:
David W. HughesProfessor and Greever Endowed Chair in Agribusiness Development
Department of Agricultural & Resource Economics
Andrew GriffithAssistant Professor
Department of Agricultural & Resource Economics
David MendezGraduate Student Associate
Rob HollandExtension Specialist and DirectorCenter for Profitable Agriculture
Kevin FergusonFarm Management Area Specialist
Department of Agricultural & Resource Economics
Table of Contents
Table of Contents..................................................................................2
Executive Summary..............................................................................3
Introduction..........................................................................................4
Hybrid Input-Output Model................................................................6
Review of Prior Studies.......................................................................8
Construction of Hybrid Input-Output Model for Tennessee.........10
Model Results.....................................................................................10
Summary and Conclusions................................................................13
References...........................................................................................14
This document has been prepared as part of a collaborative project between the Center for Profitable Agricultureand the UT Institute of Agriculture’s Department of Agricultural & Resource Economics. Support for this effort
was provided by the Tennessee office of the U.S. Department of Agriculture Rural Development and the Tennessee Department of Agriculture.
2
Executive Summary
Food processors are increasingly trying to source locally or regionally
in response to the local foods movement and concerns about trans-
portation costs and the carbon footprint effect of transportation.
As a result, milk-based value-added product processors currently
in Tennessee (for example ice cream or yogurt producers) could
source from a possible, new, in-state dried and condensed milk
plant. To draw inferences concerning possible economic impacts
of a new milk plant on the state economy, an IMPLAN-based,
hybrid input-output (I-O) model is constructed with a focus on
Tennessee milk production and processing. The model is based on
farmer survey data, dairy cost of production data for Tennessee
as reported by the U.S. Department of Agriculture, and discus-
sions with industry experts. Different assumptions regarding
the increase in milk from 724 to 2,253 in terms of jobs, $89.7
million to $145.3 million in gross state product, and $288.2 million
to $452.5 million in economic activity or gross output. Even assuming
no effect on Tennessee milk production, economic impacts are
sufficiently large to warrant further investigation regarding the
economic feasibility of a milk plant in Tennessee.
3
IntroductionEconomic development leaders at the regional level are increasingly interested in using agribusiness as a means ofraising productivity and per capita income, generating employment opportunities and increasing the size of the localtax base. Agribusiness leaders are also emphasizing the importance of value-added processing of regionally producedagricultural commodities as a way to create markets for farmers, increase farm incomes, and grow the regionalagribusiness sector (Hughes et al., 2013, Hughes et al., 2012, Hughes et al., 2011, Carpio et al., 2008, Barkley and Wil-son, 1995). Furthermore, because of the local foods movement and concerns about carbon footprint and shippingcosts, many food processors are looking to source locally or regionally (Hughes and Boys, 2015). Taken together, all ofthese elements suggest a growing interest in how eliminating gaps in the food supply chain could pay dividends interms of economic development.
Milk-based, value-added product processors currently in Tennessee (for example, yogurt, ice cream, cheese and fluid milk producers) would likely consider sourcing from a potential new, in-state milk plant. While Tennessee is a milk deficit state where demand outstrips supply by a wide margin, the state has several value-added dairy producers (Moss et al., 2012) who might find a local supply of processed milk a useful ingredient in furthering their value-added efforts. The economic impact of such an operation would provide useful information to policymakers considering supporting such an effort. Accordingly, discussed here are the results of a study examining the possible economic impact of a dried and condensed milk plant on the Tennessee economy.1
Major concepts in using input-output analysis for work of the type conducted in this study are initially examined, followed by a review of the literature regarding the economic impact of the dairy industry conducted for other areas. Adjustments made to the original model of the Tennessee economy are then described, followed by a discussion of the possible economic impact under four different scenarios regarding plant sourcing of milk supply. Summary conclusions regarding the study are then drawn.
4
1 A dried and condensed milk plant would take in fluid milk as the primary input and produce dried milk, condensed milk and, in our case, cream as outputs. Producers of milk-based products, such as ice cream and yogurt producers, would then use the output of the condensing plant as inputs in their production. Several condensing plants apparently operate in Tennessee, but this plant would meet a demand that is currently provided by out-of-state sources.
5
Tennessee is currently a
milk deficit state,where demand
exceeds supply.
Hybrid Input-Output ModelThe IMPLAN (Impact Planning) modeling system (Min-nesota IMPLAN Group, Inc., 2000) is the most popular
tool for computing regional I-O models (Hughes, 2003).IMPLAN is a ready-made modeling system, which relies onsecondary data, such as employment, and the assumptionthat the regional economy is similar in structure to the na-tional economy. Because this assumption may be tenuous, it is well established that ready-made I-O models should be
evaluated and altered in light of other data sources andknowledge concerning the local economy (Jensen,
1987). Data from a variety of sources can be usedto confirm, and in many cases modify, valuesfound in original I-O models. This resulted in ahybrid model (a ready-made model that has
been modified by more accurate externaldata or information). Hybrid I-O or SAM(Social Accounting Matrix) models arethe result of efforts on the part of usersto validate the model for a specific localeor use.2 Many different procedures areemployed in the validation process, ranging
from the use of secondary and primary datasources to statistical procedures. The signifi-
cance of these validation processes is particularlysensitive to the level of sector aggregation em-ployed in the model and the economic structure of the economy being modeled. These factors areparticularly important to those concerned withsubstate or rural economies.
A key to improving accuracy of this type of I-Omodel is to modify coefficients that accurately reflectthe behavior of the economic sector directly evaluated.Financial information obtained by surveys, frompublished data such as publicly available firm-levelfinancial records and information obtained from
6
2 While IMPLAN terms its models as SAMs, our judgment is that such models are actually input-output (I-O) models. For more details see Hughes and Isengildina-Massa, 2015.
industry experts can be used as a guide for modifyinginput-output relationships between sectors. These sourcesalso can be used in changing estimates of industry purchases,sales, employment and payments to factors of production(labor and capital).
Another change involves altering the general pattern ofin-region versus out-of-region purchases by all industrialsectors in the model. In IMPLAN, the level of in-regionversus out-of-region purchases for a given commodity isestimated through the use of Regional Purchase Coeffi-cients (RPCs) (Minnesota IMPLAN Group Inc., 2000). RPCs(and hence model estimates) can be adjusted based onlocation theory, other studies, and general knowledgeabout regional economies.
Theory provides some guidance regarding which coefficientsmay be important to the accuracy of a study. In particular,the fundamental economic structure (FES) indicates theneed to alter coefficients in input-output models. The FESstates that more natural resource-oriented sectors tendto vary between regional economies in a given countrywhile other sectors such as services often show littlechange in the nature of production between regions(West, 2001). That is, the underlying technical relation-ships in production can vary across regions, and the tech-nical relationships of production in some sectors may bemarkedly different from the nation as a whole or fromregion to region. Accordingly, if natural resource-ori-ented sectors such as agriculture or food processing arethe industry of interest for a particular study, then modelusers should be particularly concerned about the accuracyof important coefficients. Given that our effort is on milkprocessing and dairy farms as producers of milk, it is ap-propriate that we consider altering coefficients in the ap-propriate sectors of our input-output model.
The projected economic impact on the Tennesseeeconomy under the“No Increase in Tennessee Milk
Production Impact Scenario” was an
increase in employment of 724 jobs, $288.2 million in output,$50.7 million in
labor income, and $89.7 million in gross state product.
7
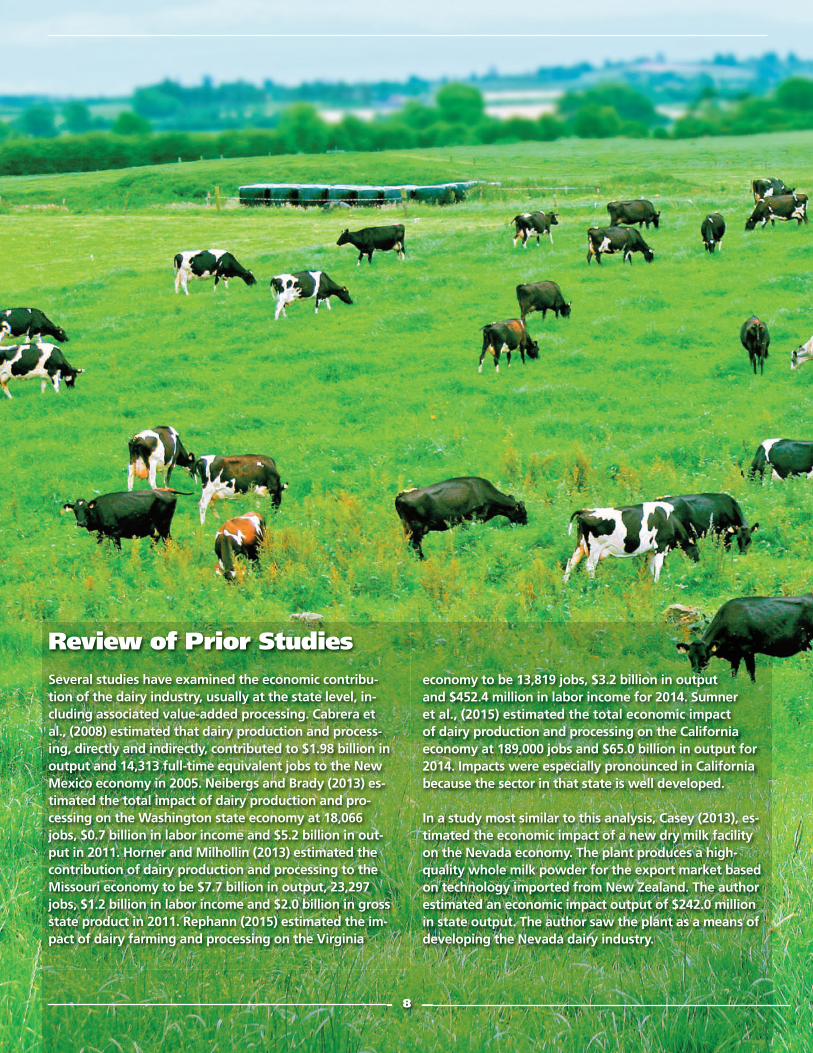
Review of Prior StudiesSeveral studies have examined the economic contribu-tion of the dairy industry, usually at the state level, in-cluding associated value-added processing. Cabrera etal., (2008) estimated that dairy production and process-ing, directly and indirectly, contributed to $1.98 billion inoutput and 14,313 full-time equivalent jobs to the NewMexico economy in 2005. Neibergs and Brady (2013) es-timated the total impact of dairy production and pro-cessing on the Washington state economy at 18,066jobs, $0.7 billion in labor income and $5.2 billion in out-put in 2011. Horner and Milhollin (2013) estimated thecontribution of dairy production and processing to theMissouri economy to be $7.7 billion in output, 23,297jobs, $1.2 billion in labor income and $2.0 billion in grossstate product in 2011. Rephann (2015) estimated the im-pact of dairy farming and processing on the Virginia
economy to be 13,819 jobs, $3.2 billion in output and $452.4 million in labor income for 2014. Sumner et al., (2015) estimated the total economic impact of dairy production and processing on the California economy at 189,000 jobs and $65.0 billion in output for2014. Impacts were especially pronounced in Californiabecause the sector in that state is well developed.
In a study most similar to this analysis, Casey (2013), es-timated the economic impact of a new dry milk facilityon the Nevada economy. The plant produces a high-quality whole milk powder for the export market basedon technology imported from New Zealand. The authorestimated an economic impact output of $242.0 millionin state output. The author saw the plant as a means of developing the Nevada dairy industry.
8
9
10
Construction of HybridInput-Output Model forTennesseeAn IMPLAN ready-made model of the state economy wasconstructed for 2013 based on the most recent availableIMPLAN data. Model coefficients were then adjusted fortwo key industries in the study, dairy cattle and milk pro-duction (IMPLAN Sector 12) and dry, condensed and evap-orated dairy product manufacturing (IMPLAN Sector 87).3
Data taken from the U.S. Department of Agriculture Eco-nomic Research Service (ERS) for 2014 for Tennessee dairyfarms were used to adjust input coefficient for the dairycattle and milk production sector. The ERS provides de-tailed input costs and net returns for major milk-produc-ing states based on the farm-level Agricultural ResourceManagement Survey and other data sources. The au-thors’ knowledge of dairy production practices andinput-models were used to assign cost values to appropri-ate economic sectors. The processing of margining is usedwhen appropriate, in that some values required the appli-cations of marketing margins (such as purchased feeds),while others (such as grazed feed) did not.4 Opportunitycosts in the data were treated as part of the return toowner-operators. Some ERS survey values were adjustedbased on knowledge of dairy farms in Tennessee; in par-ticular, capital recovery costs of machinery and equipmentwere adjusted downward (i.e., returns to other propertyincome were reduced in this IMPLAN sector). The resultwas a dairy cattle and milk production sector that moreclosely reflected practices and economic reality for Ten-nessee dairy farms than originally provided in the model.
Data taken from the Economic Census for Manufacturingfor dry, condensed and evaporated dairy product manu-facturing (U.S. Census Bureau, 2015); Casey’s study of theNevada milk plant; and most importantly, unpublished in-dustry sources, were employed as guides in estimatingsize of operation and key model coefficients (especiallywith regard to the consumption of fluid milk) for the dry,
condensed and evaporated dairy product manufacturing(87) sector in the hybrid IMPLAN model. An important el-ement is the level of shipments of fluid milk from localdairy farms to such an operation.
Model ResultsFour different economic impact scenarios were examinedin the model based on assumptions regarding fluid milksupplied to the plant. Tennessee is currently a milk deficitstate, where demand exceeds supply. Given our assump-tion of at least primary and perhaps exclusive supply ofin-state fluid milk for the plant, the plant could still resultin no net increase in sales by dairies in the state. For ex-ample, dairies in the state could supply the plant and out-side milk could flow into Tennessee to meet thatdiversion of Tennessee-supplied milk (the “No Increase inTennessee Milk Production Impact Scenario”). Alterna-tively, all of the milk supplied to the plant could comefrom increased milk production in the state (the “100 Per-cent of Plant Supply from Increased Tennessee Milk Pro-duction Impact Scenario”). The regional productioncoefficient (RPC) measures how much of regional supplygoes to meet regional demand for a given commodity.The pattern of consumption could follow that currentlyestimated for Tennessee by the RPC for dairies as foundin the state IMPLAN model (19.2 percent) (the “RPCBased Increase in Tennessee Milk Production Impact Sce-nario”). That is, milk production in Tennessee could in-crease by a level equal to 19.2 percent of the milksupplied to the plant.5 Finally, we examine an arbitrarymiddle-of-the-road impact scenario, where we assumethat half of the milk supplied to the plant comes from anincrease in Tennessee milk production (the “50 Percent ofPlant Supply from Increased Tennessee Milk ProductionImpact Scenario”). Under the “RPC Impact Scenario” andthe “50 Percent of Plant Supply from Increased TennesseeMilk Production Impact Scenario,” both the amount of
3 IMPLAN Sector 12 covers the North American Industrial Classification Sector (NAICS) 11212 and IMPLAN sector 87 covers NAICS 311514.
4 Margining is the process of applying margins that are the values of wholesale, transportation and retail trade services provided in deliveringcommodities from producers’ establishments to purchasers. The total margin is calculated as sales receipts less the cost of goods sold at the retaillevel and is distributed to the wholesale sector and appropriate retail and transportation sectors (Miller and Blair, 2009). So, for example, assumethe value for purchased feeds as $1 million and the retail margin was 40 percent, then assuming all in-region purchases the direct shock wouldbe $600,000 for the feed producing sector and $400,000 for the retail sector.
5 We are not saying that Tennessee milk production would increase by 19.2 percent; rather that 19.2 percent of what was supplied to the plantwould come from increased Tennessee milk production. Similar statements apply to the other two scenarios (i.e., the “50 Percent of Plant Supplyfrom Increased Tennessee Milk Production Impact Scenario” and the “100 Percent of Plant Supply from Increased Tennessee Milk Production Im-pact Scenario”) where Tennessee milk production is assumed to increase.
11
milk produced in Tennessee and the amount of milk importedinto the state from elsewhere would increase. Becauseof concerns regarding divulging sensitive information,model results are only reported at aggregate (one-digitNAICS) levels.
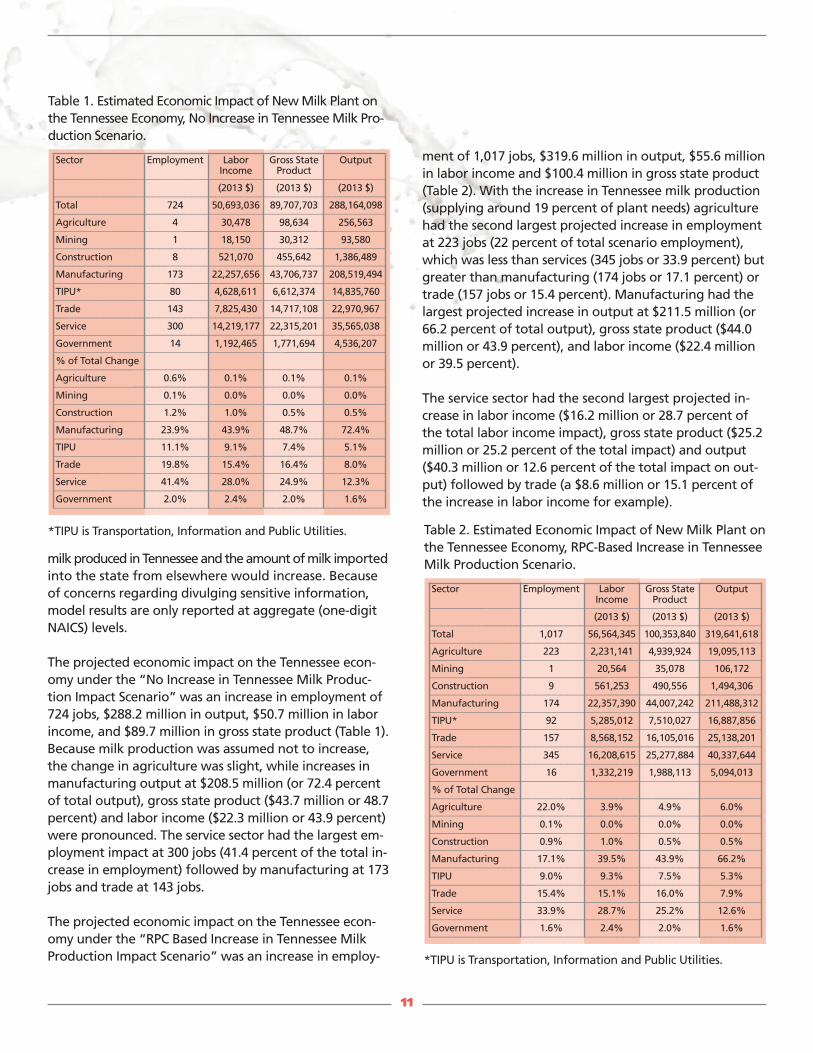
The projected economic impact on the Tennessee econ-omy under the “No Increase in Tennessee Milk Produc-tion Impact Scenario” was an increase in employment of724 jobs, $288.2 million in output, $50.7 million in laborincome, and $89.7 million in gross state product (Table 1).Because milk production was assumed not to increase,the change in agriculture was slight, while increases inmanufacturing output at $208.5 million (or 72.4 percentof total output), gross state product ($43.7 million or 48.7percent) and labor income ($22.3 million or 43.9 percent)were pronounced. The service sector had the largest em-ployment impact at 300 jobs (41.4 percent of the total in-crease in employment) followed by manufacturing at 173jobs and trade at 143 jobs.
The projected economic impact on the Tennessee econ-omy under the “RPC Based Increase in Tennessee MilkProduction Impact Scenario” was an increase in employ-
ment of 1,017 jobs, $319.6 million in output, $55.6 millionin labor income and $100.4 million in gross state product(Table 2). With the increase in Tennessee milk production(supplying around 19 percent of plant needs) agriculturehad the second largest projected increase in employmentat 223 jobs (22 percent of total scenario employment),which was less than services (345 jobs or 33.9 percent) butgreater than manufacturing (174 jobs or 17.1 percent) ortrade (157 jobs or 15.4 percent). Manufacturing had thelargest projected increase in output at $211.5 million (or66.2 percent of total output), gross state product ($44.0million or 43.9 percent), and labor income ($22.4 millionor 39.5 percent).
The service sector had the second largest projected in-crease in labor income ($16.2 million or 28.7 percent ofthe total labor income impact), gross state product ($25.2million or 25.2 percent of the total impact) and output($40.3 million or 12.6 percent of the total impact on out-put) followed by trade (a $8.6 million or 15.1 percent ofthe increase in labor income for example).
Table 2. Estimated Economic Impact of New Milk Plant onthe Tennessee Economy, RPC-Based Increase in TennesseeMilk Production Scenario.
*TIPU is Transportation, Information and Public Utilities.
___________________________________________________________________________________________________________________________________________________________________________________________________________________________________________________________________________________________________________________________________________________________________________________________________________________________________________________________________________________________________________________________________________________________________________________________________________________________________________________________________________________________________________________________________________________________________________________________________________________________ _________________________________________________________________________________________________________________________________________________________________________________________________________________________________________________________________________
Sector
Total
Agriculture
Mining
Construction
Manufacturing
TIPU*
Trade
Service
Government
% of Total Change
Agriculture
Mining
Construction
Manufacturing
TIPU
Trade
Service
Government
Employment
1,017
223
1
9
174
92
157
345
16
22.0%
0.1%
0.9%
17.1%
9.0%
15.4%
33.9%
1.6%
Labor Income
(2013 $)
56,564,345
2,231,141
20,564
561,253
22,357,390
5,285,012
8,568,152
16,208,615
1,332,219
3.9%
0.0%
1.0%
39.5%
9.3%
15.1%
28.7%
2.4%
Gross State Product
(2013 $)
100,353,840
4,939,924
35,078
490,556
44,007,242
7,510,027
16,105,016
25,277,884
1,988,113
4.9%
0.0%
0.5%
43.9%
7.5%
16.0%
25.2%
2.0%
Output
(2013 $)
319,641,618
19,095,113
106,172
1,494,306
211,488,312
16,887,856
25,138,201
40,337,644
5,094,013
6.0%
0.0%
0.5%
66.2%
5.3%
7.9%
12.6%
1.6%
Table 1. Estimated Economic Impact of New Milk Plant onthe Tennessee Economy, No Increase in Tennessee Milk Pro-duction Scenario.
*TIPU is Transportation, Information and Public Utilities.
___________________________________________________________________________________________________________________________________________________________________________________________________________________________________________________________________________________________________________________________________________________________________________________________________________________________________________________________________________________________________________________________________________________________________________________________________________________________________________________________________________________________________________________________________________________________________________________________________________________________ _________________________________________________________________________________________________________________________________________________________________________________________________________________________________________________________________________
Sector
Total
Agriculture
Mining
Construction
Manufacturing
TIPU*
Trade
Service
Government
% of Total Change
Agriculture
Mining
Construction
Manufacturing
TIPU
Trade
Service
Government
Employment
724
4
1
8
173
80
143
300
14
0.6%
0.1%
1.2%
23.9%
11.1%
19.8%
41.4%
2.0%
Labor Income
(2013 $)
50,693,036
30,478
18,150
521,070
22,257,656
4,628,611
7,825,430
14,219,177
1,192,465
0.1%
0.0%
1.0%
43.9%
9.1%
15.4%
28.0%
2.4%
Gross State Product
(2013 $)
89,707,703
98,634
30,312
455,642
43,706,737
6,612,374
14,717,108
22,315,201
1,771,694
0.1%
0.0%
0.5%
48.7%
7.4%
16.4%
24.9%
2.0%
Output
(2013 $)
288,164,098
256,563
93,580
1,386,489
208,519,494
14,835,760
22,970,967
35,565,038
4,536,207
0.1%
0.0%
0.5%
72.4%
5.1%
8.0%
12.3%
1.6%
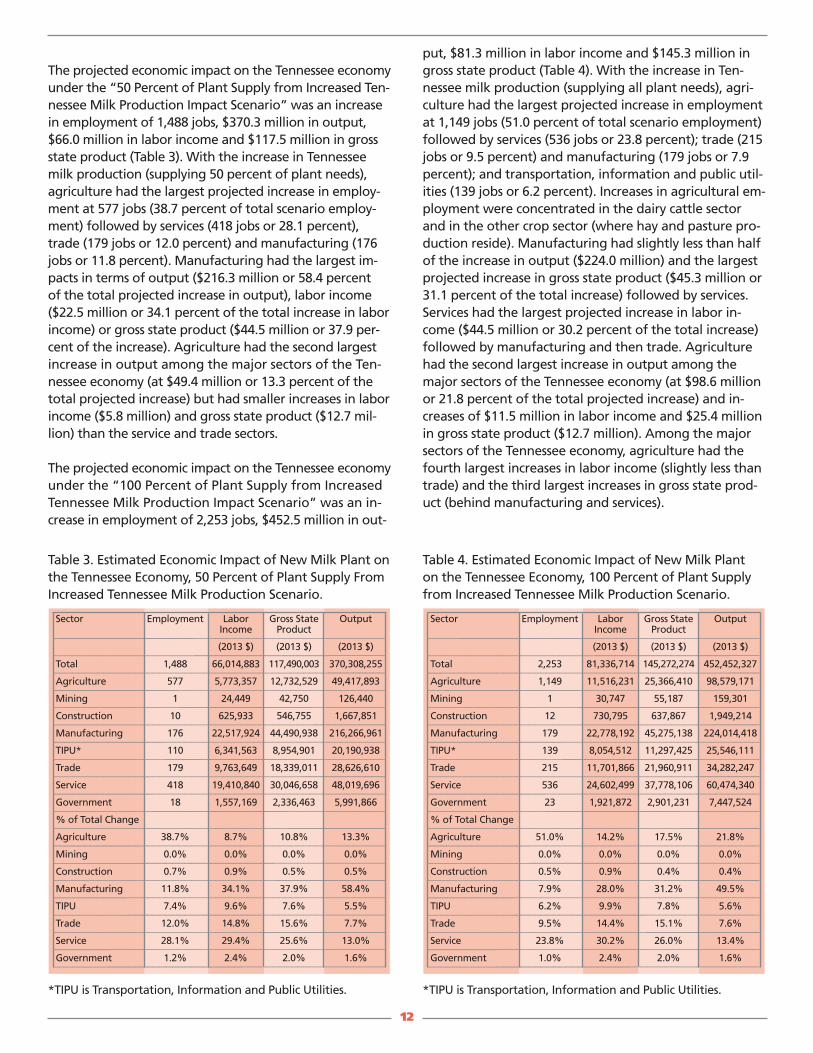
The projected economic impact on the Tennessee economyunder the “50 Percent of Plant Supply from Increased Ten-nessee Milk Production Impact Scenario” was an increasein employment of 1,488 jobs, $370.3 million in output,$66.0 million in labor income and $117.5 million in grossstate product (Table 3). With the increase in Tennesseemilk production (supplying 50 percent of plant needs),agriculture had the largest projected increase in employ-ment at 577 jobs (38.7 percent of total scenario employ-ment) followed by services (418 jobs or 28.1 percent),trade (179 jobs or 12.0 percent) and manufacturing (176jobs or 11.8 percent). Manufacturing had the largest im-pacts in terms of output ($216.3 million or 58.4 percent of the total projected increase in output), labor income($22.5 million or 34.1 percent of the total increase in laborincome) or gross state product ($44.5 million or 37.9 per-cent of the increase). Agriculture had the second largestincrease in output among the major sectors of the Ten-nessee economy (at $49.4 million or 13.3 percent of thetotal projected increase) but had smaller increases in laborincome ($5.8 million) and gross state product ($12.7 mil-lion) than the service and trade sectors.
The projected economic impact on the Tennessee economyunder the “100 Percent of Plant Supply from IncreasedTennessee Milk Production Impact Scenario” was an in-crease in employment of 2,253 jobs, $452.5 million in out-
12
Table 3. Estimated Economic Impact of New Milk Plant onthe Tennessee Economy, 50 Percent of Plant Supply FromIncreased Tennessee Milk Production Scenario.
*TIPU is Transportation, Information and Public Utilities.
___________________________________________________________________________________________________________________________________________________________________________________________________________________________________________________________________________________________________________________________________________________________________________________________________________________________________________________________________________________________________________________________________________________________________________________________________________________________________________________________________________________________________________________________________________________________________________________________________________________________ _________________________________________________________________________________________________________________________________________________________________________________________________________________________________________________________________________
Sector
Total
Agriculture
Mining
Construction
Manufacturing
TIPU*
Trade
Service
Government
% of Total Change
Agriculture
Mining
Construction
Manufacturing
TIPU
Trade
Service
Government
Employment
1,488
577
1
10
176
110
179
418
18
38.7%
0.0%
0.7%
11.8%
7.4%
12.0%
28.1%
1.2%
Labor Income
(2013 $)
66,014,883
5,773,357
24,449
625,933
22,517,924
6,341,563
9,763,649
19,410,840
1,557,169
8.7%
0.0%
0.9%
34.1%
9.6%
14.8%
29.4%
2.4%
Gross State Product
(2013 $)
117,490,003
12,732,529
42,750
546,755
44,490,938
8,954,901
18,339,011
30,046,658
2,336,463
10.8%
0.0%
0.5%
37.9%
7.6%
15.6%
25.6%
2.0%
Output
(2013 $)
370,308,255
49,417,893
126,440
1,667,851
216,266,961
20,190,938
28,626,610
48,019,696
5,991,866
13.3%
0.0%
0.5%
58.4%
5.5%
7.7%
13.0%
1.6%
Table 4. Estimated Economic Impact of New Milk Plant on the Tennessee Economy, 100 Percent of Plant Supplyfrom Increased Tennessee Milk Production Scenario.
*TIPU is Transportation, Information and Public Utilities.
___________________________________________________________________________________________________________________________________________________________________________________________________________________________________________________________________________________________________________________________________________________________________________________________________________________________________________________________________________________________________________________________________________________________________________________________________________________________________________________________________________________________________________________________________________________________________________________________________________________________ _________________________________________________________________________________________________________________________________________________________________________________________________________________________________________________________________________
Sector
Total
Agriculture
Mining
Construction
Manufacturing
TIPU*
Trade
Service
Government
% of Total Change
Agriculture
Mining
Construction
Manufacturing
TIPU
Trade
Service
Government
Employment
2,253
1,149
1
12
179
139
215
536
23
51.0%
0.0%
0.5%
7.9%
6.2%
9.5%
23.8%
1.0%
Labor Income
(2013 $)
81,336,714
11,516,231
30,747
730,795
22,778,192
8,054,512
11,701,866
24,602,499
1,921,872
14.2%
0.0%
0.9%
28.0%
9.9%
14.4%
30.2%
2.4%
Gross State Product
(2013 $)
145,272,274
25,366,410
55,187
637,867
45,275,138
11,297,425
21,960,911
37,778,106
2,901,231
17.5%
0.0%
0.4%
31.2%
7.8%
15.1%
26.0%
2.0%
Output
(2013 $)
452,452,327
98,579,171
159,301
1,949,214
224,014,418
25,546,111
34,282,247
60,474,340
7,447,524
21.8%
0.0%
0.4%
49.5%
5.6%
7.6%
13.4%
1.6%
put, $81.3 million in labor income and $145.3 million ingross state product (Table 4). With the increase in Ten-nessee milk production (supplying all plant needs), agri-culture had the largest projected increase in employmentat 1,149 jobs (51.0 percent of total scenario employment)followed by services (536 jobs or 23.8 percent); trade (215jobs or 9.5 percent) and manufacturing (179 jobs or 7.9percent); and transportation, information and public util-ities (139 jobs or 6.2 percent). Increases in agricultural em-ployment were concentrated in the dairy cattle sectorand in the other crop sector (where hay and pasture pro-duction reside). Manufacturing had slightly less than halfof the increase in output ($224.0 million) and the largestprojected increase in gross state product ($45.3 million or31.1 percent of the total increase) followed by services.Services had the largest projected increase in labor in-come ($44.5 million or 30.2 percent of the total increase)followed by manufacturing and then trade. Agriculturehad the second largest increase in output among themajor sectors of the Tennessee economy (at $98.6 millionor 21.8 percent of the total projected increase) and in-creases of $11.5 million in labor income and $25.4 millionin gross state product ($12.7 million). Among the majorsectors of the Tennessee economy, agriculture had thefourth largest increases in labor income (slightly less thantrade) and the third largest increases in gross state prod-uct (behind manufacturing and services).
Summary and Conclusions
Regional and local leaders are increasingly looking at agribusiness
processing as an economic growth option, and processing firms
are increasingly considering local sourcing of agricultural inputs.
A hybrid, IMPLAN-based model of the Tennessee economy is used
to examine the possible impact of a new milk processing plant on
the state economy. Assumptions regarding how much milk produc-
tion would increase in the state are important in driving model
results. The projected increases in total impact on employment
range from 724 jobs under the “No Increase in Tennessee Milk
Production Impact Scenario” to 2,253 jobs under the “100 Percent
of Plant Supply from Increased Tennessee Milk Production Impact
Scenario.” Increases under the former scenario in terms of output
exceed those under the latter by 57.0 percent ($452.5 million ver-
sus $288.2 million), while percentage increases in labor income
($81.3 million versus $50.7 million) and gross state product ($145.3
million versus $89.7 million) are in a similar vein. Even under the
scenario where the level of milk production does not increase, the
economic impact is sufficiently large to warrant investigation
by appropriate leaders regarding the economic feasibility of
such a plant.
13
ReferencesBarkley, D. and P. Wilson. 1995. “The Role of Nontraditional Agriculture in Rural Development.” Department ofAgricultural Economics, University of Wisconsin-Madison. Community Economics Newsletter. March, 221.
Cabrera, V.E., R. Hagevoort, D. Solı´s, R. Kirksey, and J. A. Diemer. 2008. “Economic Impact of Milk Production in theState of New Mexico.” Journal of Dairy Science. 91:2144–2150.
Carpio, C.E., D. W. Hughes and O. Isengildina. 2008. “Comprehensive Assessment of the South Carolina AgribusinessCluster.” Report Prepared for MarketSearch and Palmetto Institute, July
Casey, Dusty. 2013. “Economic Impact of Dairy Expansion in Churchill County through Value Chain Analysis.” Un-published Master’s Thesis, University of Nevada, Reno.
Economic Research Service. 2016. Annual Milk Cost of Production by State. Available athttp://www.ers.usda.gov/data-products/milk-cost-of-production-estimates.aspx (Accessed April 2016).
Horner, Joe and Ryan Milhollin. 2013. “Economic Contribution of the Missouri Dairy Product Manufacturing Indus-try.” Report Prepared for the Missouri Dairy Products Association, University of Missouri Extension, CommercialAgriculture Program, March.
Hughes, David W. and Kathryn Boys. 2015. “What We Know and Don’t Know About Local Food Systems and Eco-nomic Development.” Choices. 1st Quarter. http://www.choicesmagazine.org/choices-magazine/theme-articles/com-munity-economics-of-local-foods/what-we-know-and-dont-know-about-the-economic-development-benefits-of-local-food-systems
Hughes, David W. and Olga Isengildina-Massa. 2015. “Keeping Dollars Home: the Economic Impact of the Farmers’Markets and the South Carolina Locally Grown Campaign.” Food Policy. 54(1): 78-84.
Hughes, David W., Devin Swindall, Blake Lanford, and Emily Purcell. 2013. “Horry County Agribusiness StrategicPlan: Utilizing Local & Regional Asset.” Clemson Institute for Economic and Community Development, Clemson Uni-versity, Report Prepared for the Myrtle Beach Regional Economic Development Corporation. September.
Hughes, David W., Devin Swindall, Sarah Macdonald, and Emily Purcell. 2012. “Saluda County: Agribusiness Strate-gic Plan with an Emphasis on Industrial Park Development.” UCED Research Report 2011-03. University Center forEconomic Development & Clemson Institute for Economic and Community Development, Clemson University, Re-port Prepared for the Saluda County Economic Development Commission. September.
Hughes, David W., Devin Swindall, Olga Isengildina, Kathryn Boys, Blake Lanford, Sarah Macdonald, and MeghanHarper. 2011. “Barnwell County: Agribusiness Strategic Plan with an Emphasis on Industrial Park Development.”UCED Research Report 2011-03. University Center for Economic Development & Clemson Institute for Economic andCommunity Development, Clemson University, Report Prepared for the Barnwell County Economic DevelopmentCommission and the Lower Savannah Council of Governments. September.
Jensen, R.C. 1987. “On the Concept of Ready-Made Regional Input-Output Models.” Review of Regional Studies. 17: 20-25.
Miller, R. E., & Blair, P. D. (2009). Input-output analysis: Foundations and extensions Cambridge University Press, 2nd Edition.
Minnesota IMPLAN Group, Inc. 2000. IMPLAN Professional Version 2.0 User’s Guide, Analysis Guide and Data Guide.Stillwater, MN.
14
15
Moss, Jonathan, Kim Jensen, Burton English and Rob Holland. 2012. “The Tennessee Dairy Industry and Its Value-Added Opportunities.” UT Extension W284.
Neibergs, J. Shannon and Michael Brady. 2013. “2011 Economic Contribution Analysis of Washington Dairy Farmsand Dairy Processing: An Input-Output Analysis.” Farm Business Management Report, School of Economic Sciences,Washington State University Extension May.
Rephann, Terance. 2015. “The Economic Contribution of the Dairy Industry in Virginia.” Report.” Prepared for theVirginia State Dairymen’s Association, Weldon Cooper Center for Public Service, University of Virginia, September.
Sumner, Daniel A., Josué Medellín-Azuara and Eric Coughlin. 2015. “Contributions of the California Dairy Industryto the California Economy.” A Report for the California Milk Advisory Board, University of California Agricultural Is-sues Center, May 14.
U.S. Census Bureau. 2015. “EC1231SG2: Manufacturing Summary Series: General Summary: Industry Statistics forSubsectors and Industries by Employment Size: 2012, Dry, Condensed, and Evaporated Dairy Product Manufactur-ing, NAICS 311514.” Washington, DC. December 18.
West GR (2001). “Structural change and fundamental economic structure: The case of Australia”. Ch. 16 in: E. Dietzenbacher and M. Lahr (eds.) Input-output analysis: Frontiers and extensions. Palgrave, Basingtoke

TM
Programs in agriculture and natural resources, 4-H youth development, family and consumer sciences, and resourcedevelopment. University of Tennessee Institute of Agriculture, U.S. Department of Agriculture and county governments cooperating. UT Extension provides equal opportunities in programs and employment.
Related Documents