Histogram Analysis to Choose the Number of Clusters for K Means By: Matthew Fawcett Dept. of Computer Science and Engineering University of South Carolina

Histogram Analysis to Choose the Number of Clusters for K Means By: Matthew Fawcett Dept. of Computer Science and Engineering University of South Carolina.
Dec 17, 2015
Welcome message from author
This document is posted to help you gain knowledge. Please leave a comment to let me know what you think about it! Share it to your friends and learn new things together.
Transcript
Histogram Analysis to Choose the Number of Clusters for K Means
By: Matthew FawcettDept. of Computer Science and
EngineeringUniversity of South Carolina

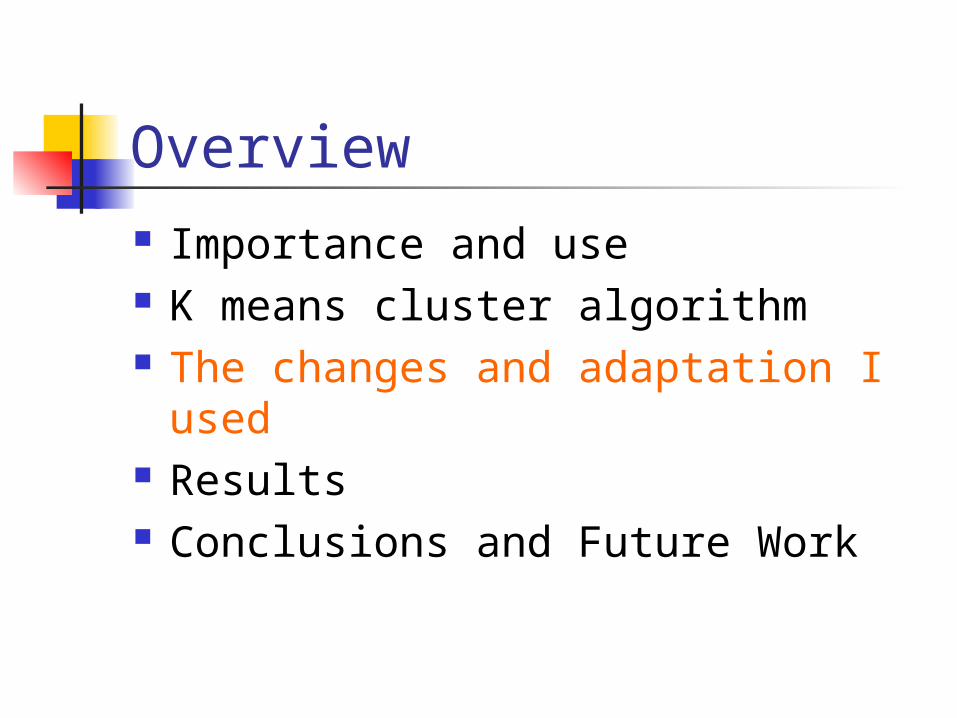
Overview Importance and use K means cluster algorithm The changes and adaptation I used Results Conclusions and Future Work

Importance The main reason for use in Medical
Imaging is for Segmentation. Other uses outside of the realms of
Image Processing(e.g. information retrieval)
Widespread algorithm
K Means Clustering Problem is that user doesn’t know
the optimal number of clusters to pick.
This is the problem I am trying to solve by using Histogram Analysis.
Histogram of the pixel intensity to find the optimal number of clusters for a picture.
Overview Importance and use K means cluster algorithm The changes and adaptation I used Results Conclusions and Future Work
Algorithm K means clusters is a very simple
algorithm First the user picks the number of
centers that he/she would like. Next the centers are chosen
randomly.
Algorithm I have read on different ways to
choose the centers. (e.g. pick the 2 farthest points away from each other.)
After the centers have been established then we check every other point with each of the centers and find the minimum distance.
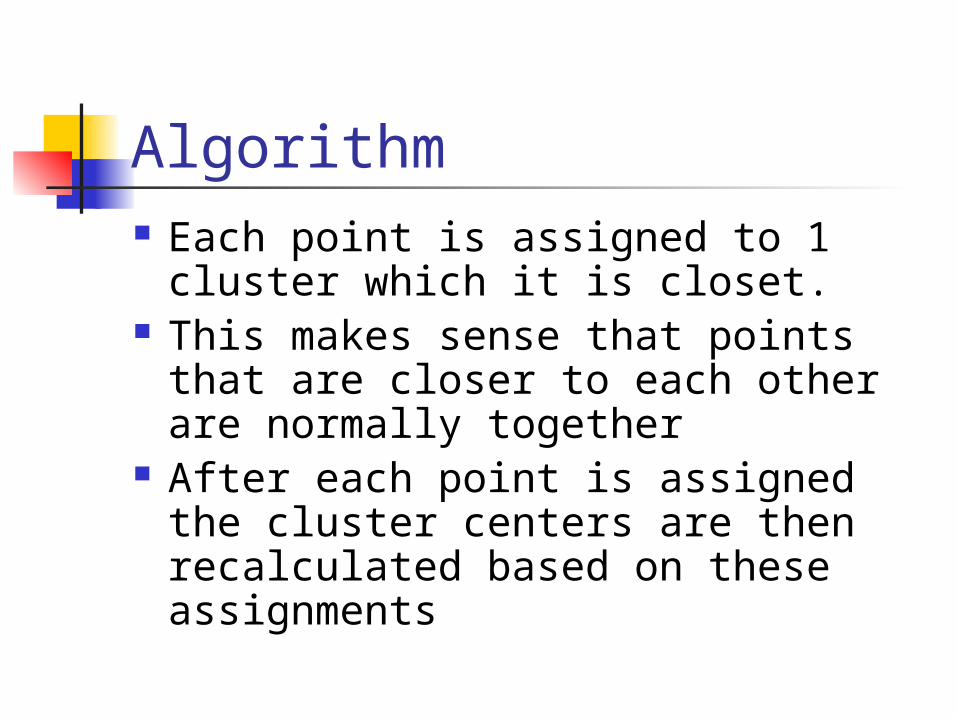
Algorithm Each point is assigned to 1 cluster
which it is closet. This makes sense that points that
are closer to each other are normally together
After each point is assigned the cluster centers are then recalculated based on these assignments
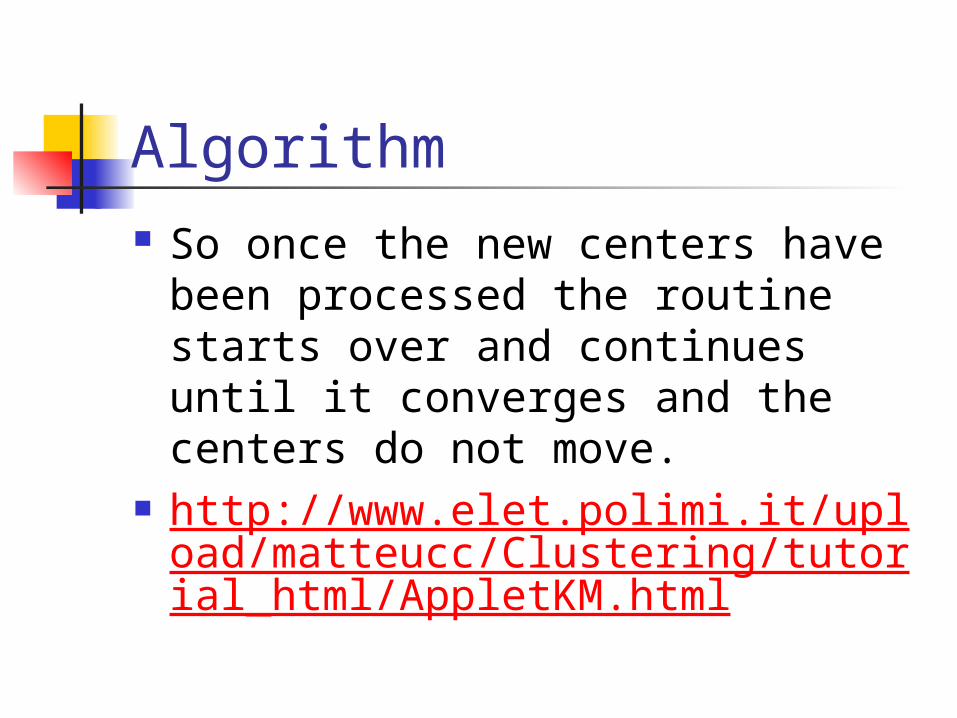
Algorithm So once the new centers have
been processed the routine starts over and continues until it converges and the centers do not move.
http://www.elet.polimi.it/upload/matteucc/Clustering/tutorial_html/AppletKM.html
Overview Importance and use K means cluster algorithm The changes and adaptation I used Results Conclusions and Future Work
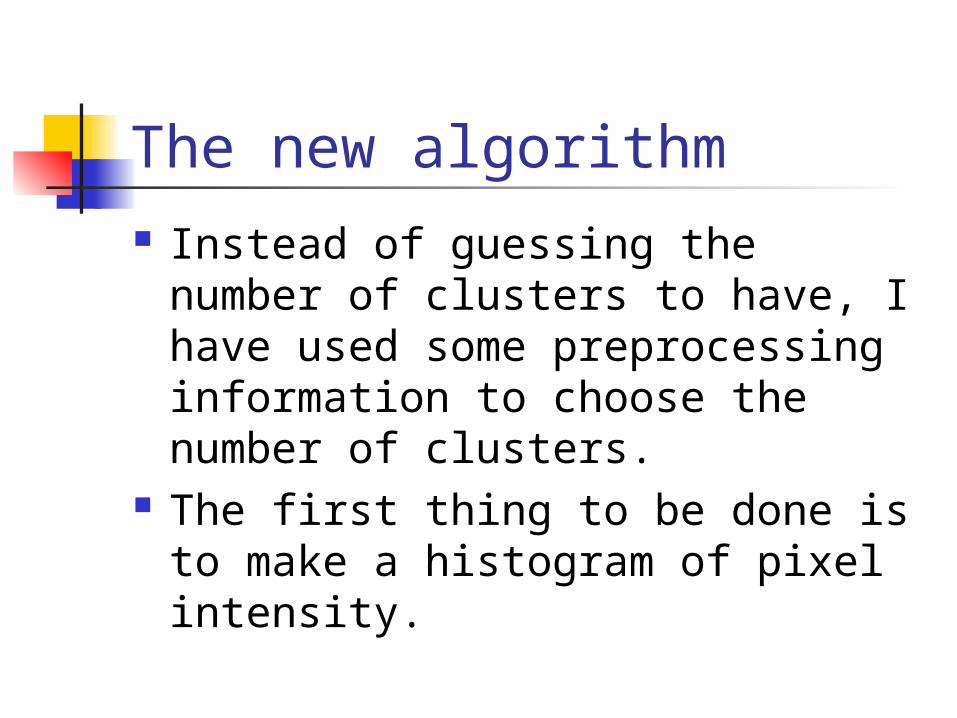
The new algorithm Instead of guessing the number of
clusters to have, I have used some preprocessing information to choose the number of clusters.
The first thing to be done is to make a histogram of pixel intensity.
Histogram The histogram will probably have
many peaks and valleys so the idea is to pick the correct number.
My idea was to basically count the peaks on the histogram.
However this can cause problems Any guesses?
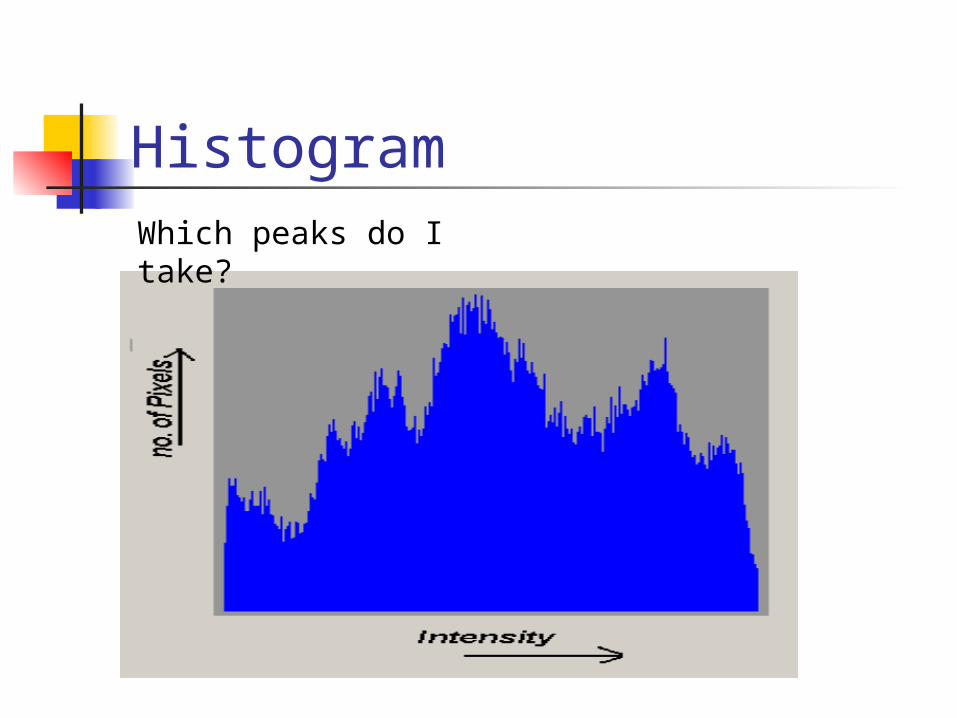
HistogramWhich peaks do I take?
Histogram I added a term called Threshold. The threshold term just determines the
cutoff point for a peak. For example: If the threshold is 150
then I only take peaks with 151 or more. The threshold I chose was the max color
which was 255 divided by the number of pixels which equaled to 64.
How about any other problems with a histogram?
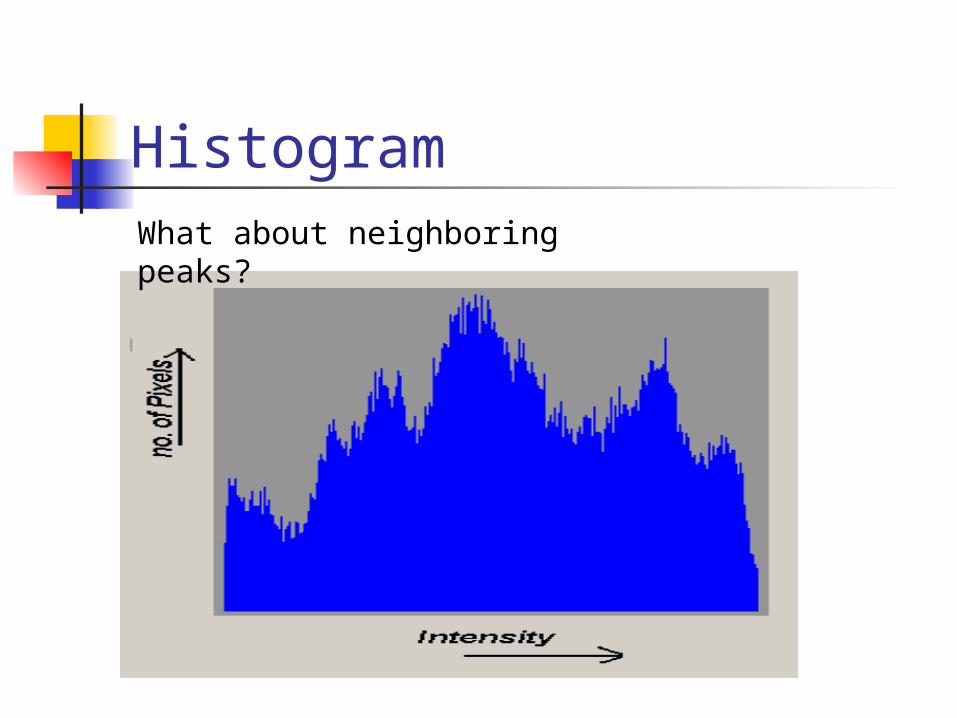
HistogramWhat about neighboring peaks?
Histogram I know introduce another term to my
work called span. Span basically covers the number of
pixels to the left and right of the current pixel.
For example if span was set to 3 then I would check 3 pixels to the left and 3 pixels to the right and then take the maxmium one over the threshold
Histogram The span guarantees that I don’t
have 2 pixels next to each other as 2 different centers in the picture.
This seems like a reasonable idea because pixels with the same intensity or near same intensity should share the same center and are probably close together.
Find Centers Based on this information I
determine the number of peaks above the threshold and no neighbors based on the span.
This the magic number I am using for the clusters by anglicizing the histogram of the pixel intensity.
Metric Now I have the number of centers(k) Start the k means algorithm Pick k center points at random. The metric I am using is the difference
in intensity. We take the absolute value of this to make sure it positive.
Assign each pixel to one of the clusters
Resign the cluster centers Now that we have all the pixels in a
cluster we recalculate the centers. Add up each pixel in each cluster and
divide by the number of pixels in the cluster and we get the new center.
Supposed to repeat this until it converges but here I just do this 25 times.
Overview Importance and use K means cluster algorithm The changes and adaptation I used Results Conclusions and Future Work
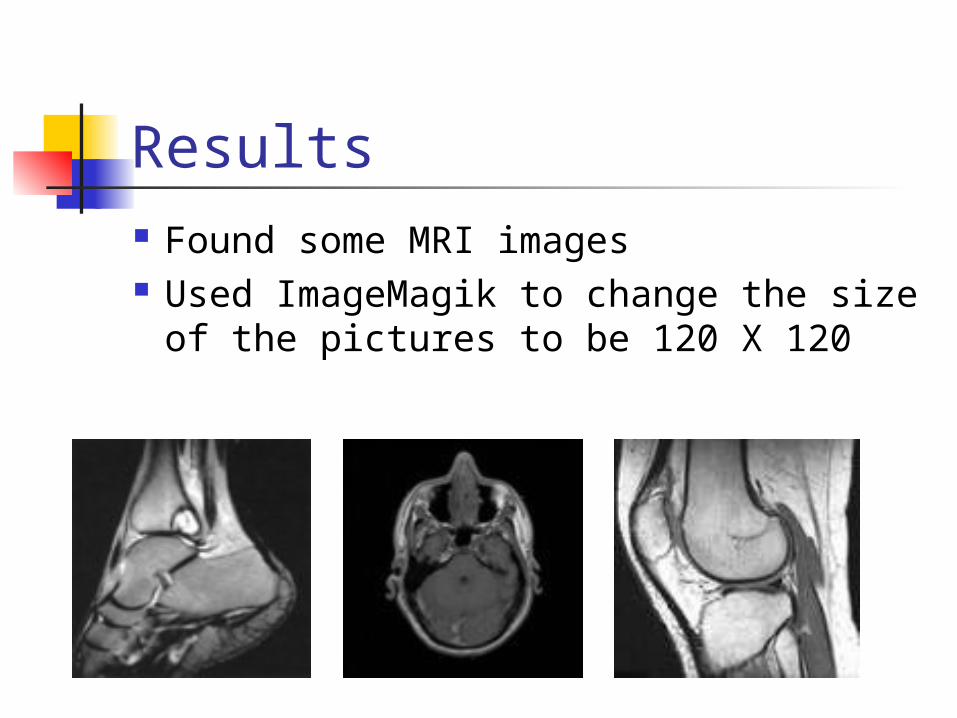
Results Found some MRI images Used ImageMagik to change the size
of the pictures to be 120 X 120
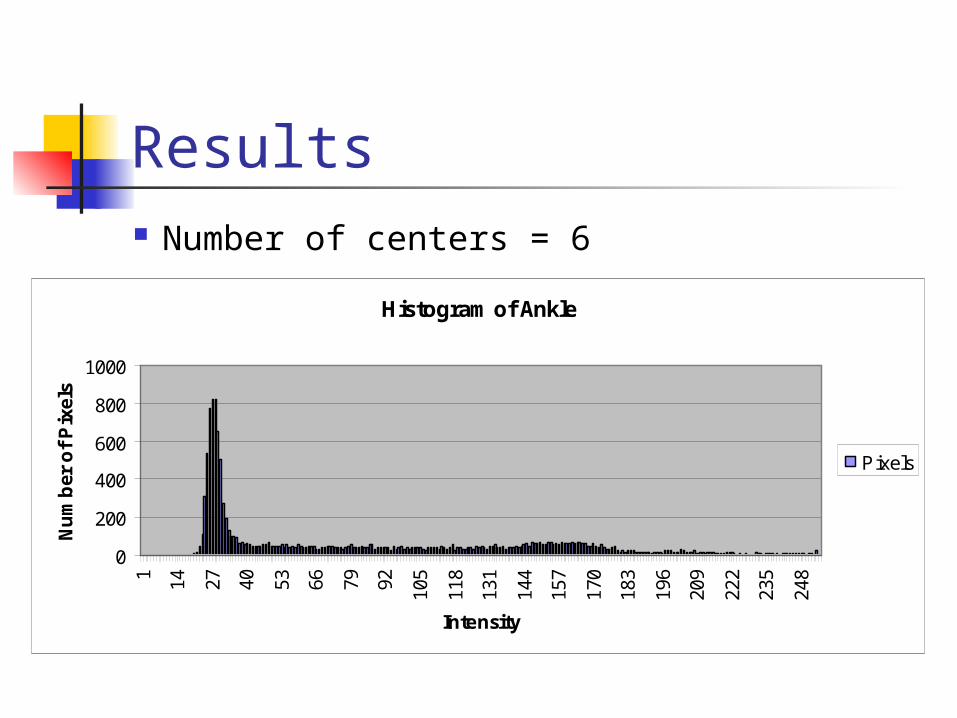
Results Number of centers = 6
Histogram of Ankle
0
200
400
600
800
1000
1 14 27 40 53 66 79 92 105
118
131
144
157
170
183
196
209
222
235
248
Intensity
Nu
mb
er o
f P
ixel
s
Pixels
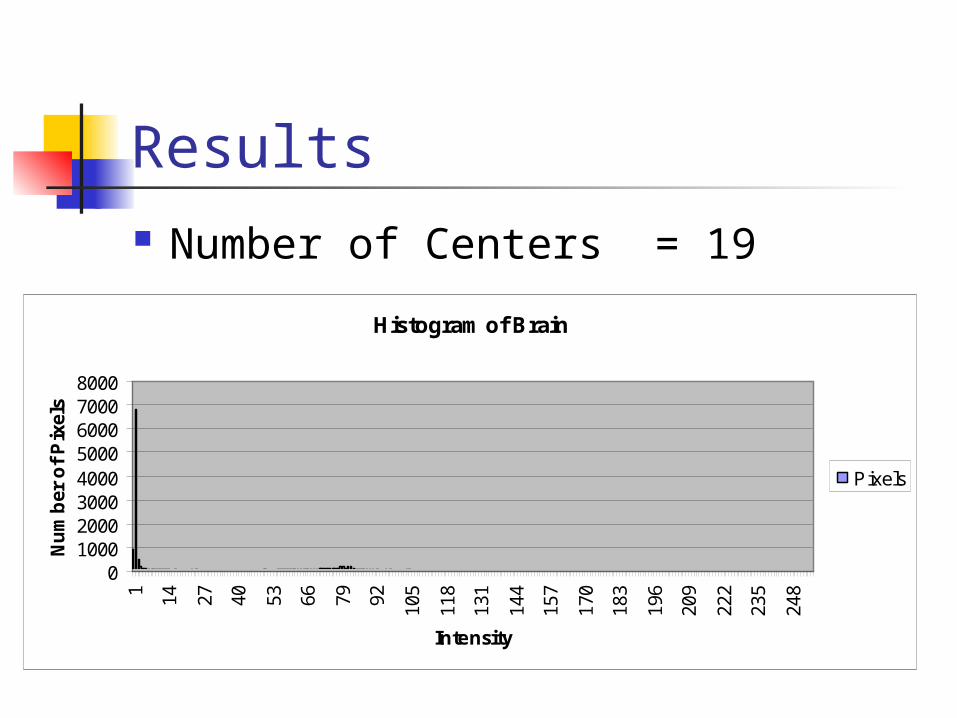
Results Number of Centers = 19
Histogram of Brain
010002000300040005000600070008000
1 14 27 40 53 66 79 92 105
118
131
144
157
170
183
196
209
222
235
248
Intensity
Nu
mb
er o
f P
ixel
s
Pixels

Results Number of Centers = 17
Histogram of Knee
0
100
200
300
400
500
1 14 27 40 53 66 79 92 105
118
131
144
157
170
183
196
209
222
235
248
Intensity
Nu
mb
er o
f P
ixel
s
Pixels
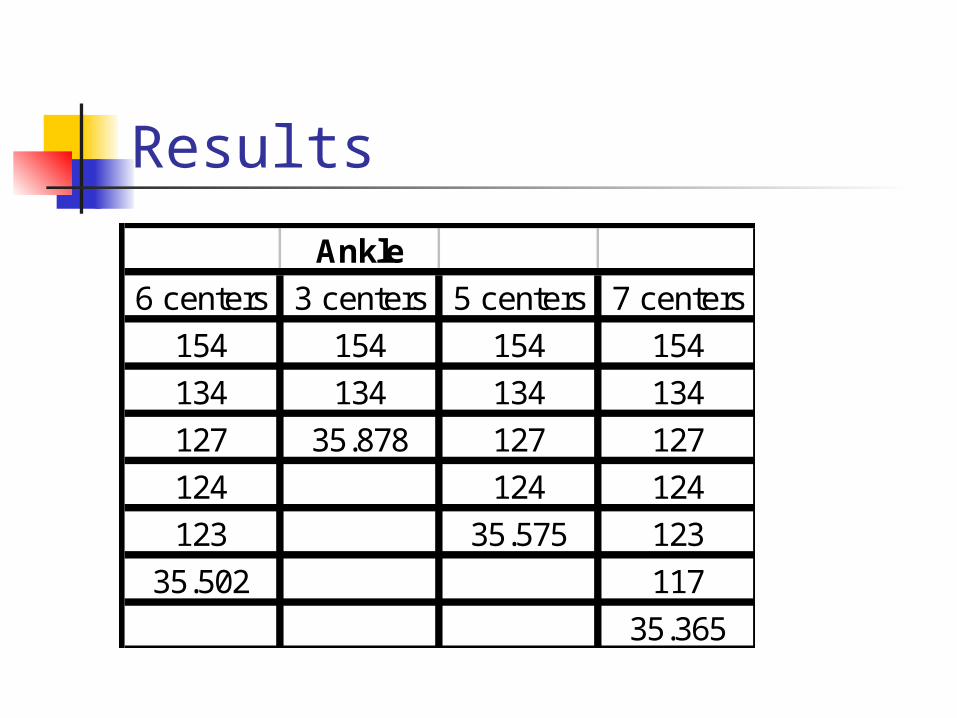
Results
Ankle
6 centers 3 centers 5 centers 7 centers
154 154 154 154
134 134 134 134
127 35.878 127 127
124 124 124
123 35.575 123
35.502 117
35.365

ResultsBrain
19 centers 3 centers 5 centers 7 centers
49.5 0.30079 49.1 76.72727
1.875 39.39565 28.94118 38.15385
84 76.82353 68.77778 6.87234
62 85.875 21
40 0.32958 102.5
45 57.6
43.5 0.052299
7.18919
79.6
0
34
39
15
21.66667
26.5
102.5
36.6
54
71.5

ResultsKnee
17 centers 3 centers 5 centers 7 centers
183.933 131.721 190.105 235
37.321 31.618 235 191.361
193.524 227.178 136.388 148.022
253.846 29.065 27.446
155.1 79.6 77.952
50.75 48.69
220.533 112.312
239.952
104.5
26.816
81.467
207.048
130.585
64.808
172.474
246.522
231.051
Results Want to compare the variance of
each cluster. The variance in each cluster should
be about the same.
Overview Importance and use K means cluster algorithm The changes and adaptation I used Results Conclusions and Future Work
Conclusions and Future Work A method to find the centers of the
clusters The parameters for threshold and
span Supersampling instead of using
just one pixel.
Related Documents