Highway 169 North Analysis Highway 169 Mobility Study Version 2.0 Minnesota Department of Transportation Prepared by: September 2016 SRF No. 8989

Welcome message from author
This document is posted to help you gain knowledge. Please leave a comment to let me know what you think about it! Share it to your friends and learn new things together.
Transcript

Highway 169 North Analysis
Highway 169 Mobility Study
Version 2.0
Minnesota Department of Transportation
Prepared by:
September 2016
SRF No. 8989
Table of Contents
Introduction ................................................................................................................. 1
Concept Development ............................................................................................... 3
Selecting Stations for Analysis ............................................................................................................ 3
Capital Cost Estimates ......................................................................................................................... 5
Operating Plan ...................................................................................................................................... 5
Ridership ................................................................................................................................................ 6
Technical Results ........................................................................................................ 8
Corridor Description ........................................................................................................................... 8
Operating Characteristics .................................................................................................................... 9
Capital Costs ......................................................................................................................................... 9
Operating and Maintenance Costs ................................................................................................... 10
Ridership .............................................................................................................................................. 10
Evaluation .................................................................................................................. 12
Evaluation Criteria ............................................................................................................................. 12
Evaluation Scoring Methodology .................................................................................................... 15
Threshold Methodology 1 ................................................................................................... 15
Threshold Methodology 2 ................................................................................................... 15
Threshold Methodology 3 ................................................................................................... 16
H:\Projects\8989\TP\Task 3\Tech Memo\2016 09 06 North 169 Tech Memo.docx
Highway 169 North Technical Report i SRF Consulting Group, Inc.
Introduction
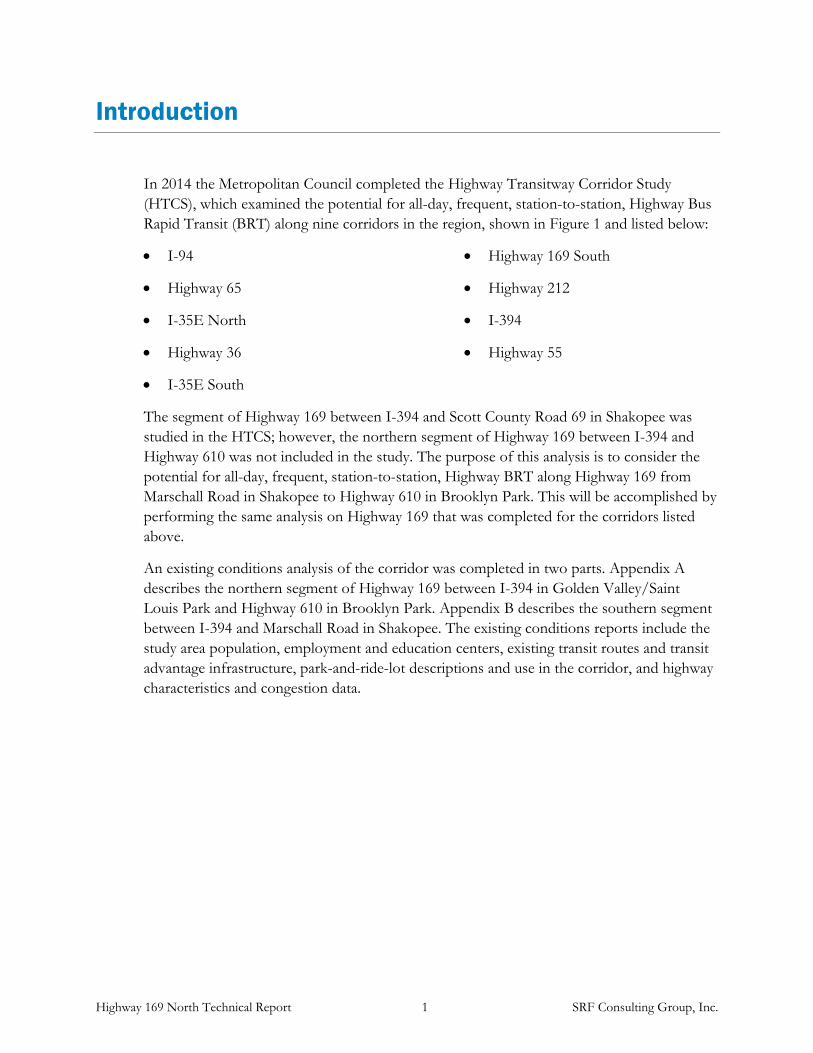
In 2014 the Metropolitan Council completed the Highway Transitway Corridor Study (HTCS), which examined the potential for all-day, frequent, station-to-station, Highway Bus Rapid Transit (BRT) along nine corridors in the region, shown in Figure 1 and listed below:
• I-94
• Highway 65
• I-35E North
• Highway 36
• I-35E South
• Highway 169 South
• Highway 212
• I-394
• Highway 55
The segment of Highway 169 between I-394 and Scott County Road 69 in Shakopee was studied in the HTCS; however, the northern segment of Highway 169 between I-394 and Highway 610 was not included in the study. The purpose of this analysis is to consider the potential for all-day, frequent, station-to-station, Highway BRT along Highway 169 from Marschall Road in Shakopee to Highway 610 in Brooklyn Park. This will be accomplished by performing the same analysis on Highway 169 that was completed for the corridors listed above.
An existing conditions analysis of the corridor was completed in two parts. Appendix A describes the northern segment of Highway 169 between I-394 in Golden Valley/Saint Louis Park and Highway 610 in Brooklyn Park. Appendix B describes the southern segment between I-394 and Marschall Road in Shakopee. The existing conditions reports include the study area population, employment and education centers, existing transit routes and transit advantage infrastructure, park-and-ride-lot descriptions and use in the corridor, and highway characteristics and congestion data.
Highway 169 North Technical Report 1 SRF Consulting Group, Inc.
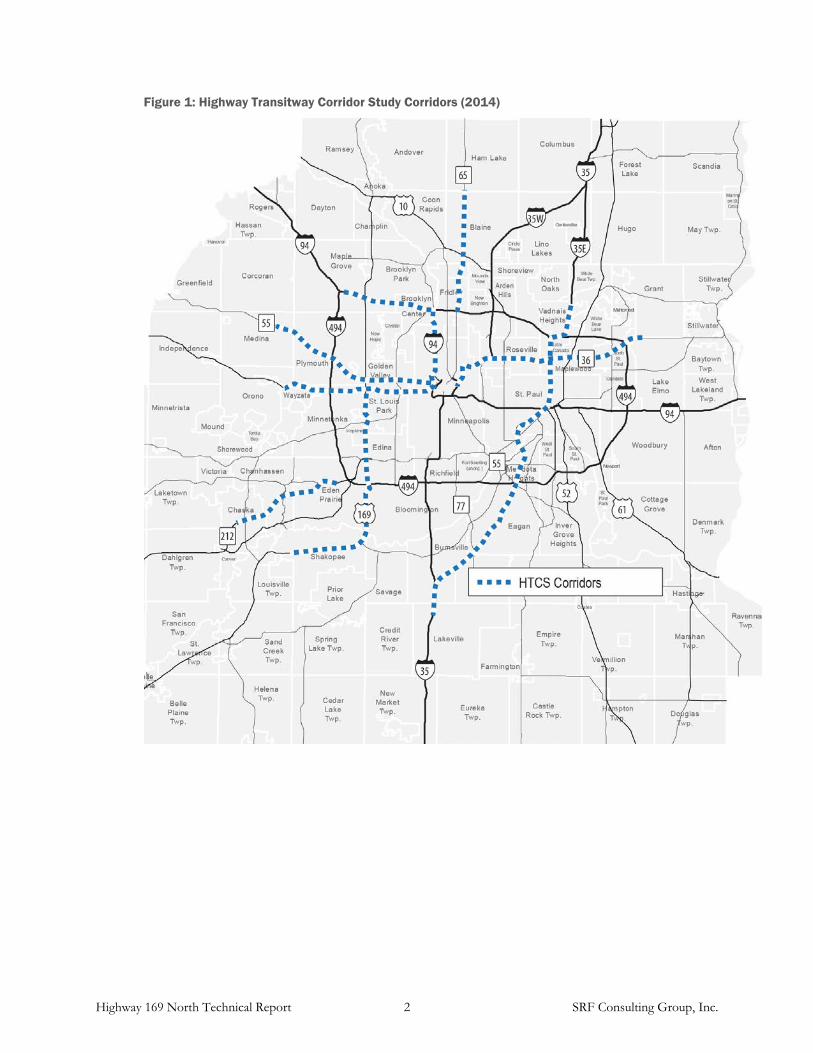
Figure 1: Highway Transitway Corridor Study Corridors (2014)
Highway 169 North Technical Report 2 SRF Consulting Group, Inc.

Concept Development
The concept development process for the Highway 169 corridor was consistent with the process for the original nine HTCS corridors. The purpose of concept development was to identify the costs and ridership of station-to-station BRT service. The methodology for estimating these costs and the ridership for the Highway 169 BRT service is briefly described in this section. For a more in-depth discussion of concept development please see the HTCS Final Report (under separate cover).
Selecting Stations for Analysis Station locations were selected at a meeting of corridor cities and stakeholder agencies. On August 2, 2016, representatives from the Cities of Golden Valley, Osseo, Brooklyn Park, and Plymouth, Hennepin and Scott Counties, as well as MnDOT, Metro Transit, Metropolitan Council, SouthWest Transit, Minnesota Valley Transit Authority, and Shakopee Mdewakanton Sioux Community were presented with an overview of the Highway 169 Mobility Study, a summary of the metrics generated for each corridor studied in the HTCS, and a draft alignment and station locations. It was determined that alignment and station locations south of I-394 would remained unchanged from those used in the HTCS in order to maintain comparability. The group discussed the potential BRT routing and station locations north of I-394, and arrived on a BRT alternative for analysis, as shown in Figure 2. A summary of the meeting is available in Appendix C.
Highway 169 North Technical Report 3 SRF Consulting Group, Inc.
Figure 2: Highway 169 BRT Alternative
Highway 169 North Technical Report 4 SRF Consulting Group, Inc.

Capital Cost Estimates Once the concept plan with alignment, station locations, and station types was defined for the corridor, capital costs were estimated. Capital cost estimates include the initial expenditure to build the system and typically include corridor construction, stations and technology systems, operations and maintenance facilities, vehicles, and right-of-way acquisition. Little additional right-of-way was required for stations. Concept plans assumed the service would run in mixed traffic, on bus only shoulders, or other existing transit advantage infrastructure, requiring little additional corridor infrastructure. However, some locations required improvements such as transit-only ramps to allow BRT vehicles to access station platforms, which contributed to construction costs.
“Soft costs” for items such as engineering, construction services, insurance, and owner’s costs, as well as contingencies for uncertainty in both the estimating process and the limited scope of this study were also included in the cost estimates.
Operating Plan The operating plan is focused on new Highway BRT station-to-station service along with some minor modifications to local and express routes to provide better connectivity to stations and eliminate redundancy. Span of service and frequency assumptions for Highway 169 BRT station-to-station service are consistent with the assumptions used in the HTCS, which in turn are generally consistent with the guidelines for Service Operations presented in the Regional Transitway Guidelines (February 2012, Metropolitan Council).
The analysis assumes that service would be operated seven days a week with a 16-hour span of service (for example 6 a.m. – 10 p.m.) on weekdays and Saturdays and 13 hours (for example 7 a.m. – 8 p.m.) on Sundays. It is assumed that service frequency would be every 15 minutes on weekdays and during the day on Saturdays, and every 30 minutes on Saturday evenings and Sundays. Existing express routes are generally assumed to remain in place in each corridor, which results in a combined frequency that exceeds the 10-minute peak period frequency guideline proposed in the Regional Transitways Guidelines. Highway BRT routes are assumed to stop at each proposed BRT station at all times throughout the day.
Both peak hour and off-peak period transit travel times for the corridor were estimated as follows:
• Station-to station travel times were based on assumed average peak and off-peak speed between each station (30 mph during peak periods; 45 mph during off-peak periods).
• BRT station-to-station service was assumed to use bus-only shoulder lanes during the peak periods.
• One minute of dwell time (i.e. the time spent loading and unloading passengers into and out of the transit vehicle) was assumed for each inline station stop.
Highway 169 North Technical Report 5 SRF Consulting Group, Inc.

• Five minutes of travel and dwell time was assumed for each offline station stop.
• Station-to-station travel times were compared to existing express route travel times to test for reasonableness.
Operating plans were developed for Highway 169 corridor using transit travel time estimates, service frequency assumptions, and typical layover time (i.e. a cushion of time at the end of a route that ensures on-time departure for the next trip and provides the driver a break between trips).
Operating and maintenance costs for each corridor were estimated using methodology defined for the HTCS, and the Robert Street, Nicollet-Central and Midtown Corridor Alternatives Analysis studies. Fiscal year (FY) 2011 Metro Transit cost data was used to develop unit costs and adjusted for inflation and to account for unique Highway BRT operations.
Ridership Forecast Year 2030 ridership was estimated for the corridor using the Twin Cities Regional Travel Demand Model. Ridership forecasts were based on land use and development assumptions consistent with the Metropolitan Council’s Regional Development Framework and local comprehensive plans as of January 2012. As part of the model validation process, the region was divided into study corridor or sub-corridor districts so mode choice and travel patterns could be analyzed.
The following set of ridership information was developed for the corridor:
• Corridor Bus Route Ridership: number of trips taken on local or express routes (but not BRT station-to-station route) in the study corridor; must use at least one non-downtown Highway BRT station and utilize a significant portion of the Highway BRT runningway.
• Highway BRT Station-to-Station Ridership: number of trips taken on the proposed Highway BRT all-day station-to-station route in the study corridor.
• Transitway Total: combined total of “corridor bus route ridership” and “highway BRT station-to-station” ridership.
• Percent Transit Reliant Ridership: percentage of “station-to-station” rides taken by persons from zero-car households.
• New Transit Riders: estimated number of new riders that would choose to use “highway BRT station-to-station” service rather than making a trip by automobile.
• Current Year Ridership with Build Alternative: estimated number of riders on “highway BRT station-to-station” service assuming all concept plan improvements were implemented in current year (2010 data).
Highway 169 North Technical Report 6 SRF Consulting Group, Inc.
Ridership estimates for the HTCS were modeled as a system, meaning the model assumed all ten corridors (i.e. all ten Highway BRT lines together) as opposed to individual corridors. For the purposes of this analysis, Highway 169 was added to this model as a tenth corridor, so that all results can be compared to the corridor-by-corridor results in the HTCS.
Highway 169 North Technical Report 7 SRF Consulting Group, Inc.

Technical Results
Corridor Description The Highway 169 corridor runs from Marschall Road in Shakopee to the Brooklyn Boulevard Station on the Blue Line LRT Extension. The corridor has 14 stations and is 31.0 miles long, as shown in Figure 3. The alternative would directly connect to the future American Boulevard Arterial BRT at Viking Drive, the METRO Green Line Extension at its Golden Triangle Station, and the METRO Blue Line Extension at its Brooklyn Boulevard Station. The concept includes the cost of a new park-and-ride at Pioneer Trail, and would serve existing Marschall Road, Seagate, and Southbridge park-and-rides.
Figure 3: Highway 169 BRT Alternative
Highway 169 North Technical Report 8 SRF Consulting Group, Inc.

Operating Characteristics These service adjustments do not represent actual recommendations of the study and would need to be explored in greater detail if this alternative progresses to a more detailed level of analysis. Please see Appendix D for the service plan.
Table 1: Operating Characteristics
Peak-Period End-to-End Travel Time 86 minutes
Off-Peak End-to-End Travel Time 64 minutes
Required Fleet 14 peak vehicles, 3 spare vehicles
Background Local and Express Bus Service Adjustments
• Routes 17, 615, 667, 668: Extend to serve TH 7 Station
• Routes 717, 791: Extend to serve 36th Ave. Station
• Routes 756, 793: Extend to serve Schmidt Lake Rd. Station
• Routes 670: Add stop at TH 7 Station • Route 795: Add stop at 13th Ave Station • Routes 690, 691: Shift service from
I-494 to Highway 169; add stop at Golden Triangle Station
• Routes 692, 699: Shift service from I-494 to Highway 169; add stop at Bren Rd. Station
Capital Costs Capital costs are measured in year 2013 construction dollars. Please see Appendix E for the full capital cost estimate.
Table 2: Capital Costs
Cost Categories Costs
Corridor Construction $229,000
BRT Stations $22,833,000
BRT Maintenance Facility $5,100,000
Right of Way $26,000
Vehicles $10,404,000
Soft Costs $8,554,000
25% Contingency $11,787,000 Corridor Total Cost $58,933,000
Highway 169 North Technical Report 9 SRF Consulting Group, Inc.

Operating and Maintenance Costs Operating and maintenance costs are measured in year 2013 dollars. Please see Appendix F for the full operations and maintenance costs.
Table 3: Operating and Maintenance Costs
Item Costs
Highway BRT Station-to-Station Service $9,447,400
Background Bus Changes (net) $106,100
Total Operating and Maintenance Cost Increase over No-Build $9,553,500
Ridership
Table 4: Ridership Forecast
Existing Service (2010) No Build (2030) 2030 Build Ridership
Corridor Bus Routes Corridor Bus Routes
Station-to-Station Service
Corridor Bus Routes(1)
Transitway Total
3,300 5,200 6,000 5,000 11,000
(1) Includes routes: 490, 680, 690, 692, 699, 742, and 793.
When estimating transitway ridership in the Twin Cities Region, two definitions for transitway are typically applied. The Federal Transit Administration’s guidance (August 2013) on New Starts/Small Starts evaluation defines transitway ridership as a trip on any route that uses a portion of the guideway. The Metropolitan Council’s Regional Transitway Guidelines states that BRT ridership includes both rides on station-to-station service and local or express service that utilize a defined transitway runningway for at least 50 percent of the route and use at least one non-downtown transitway station. The results of this ridership forecast reflect the Metropolitan Council’s method of transitway ridership forecasting.
Table 5: Ridership Types
Descriptor Data
Percent transit-reliant ridership (station-to-station service) 40%
Current-year ridership on station-to-station service with build alternative (2010)
4,100
New transit rides (2030) 2,200
The level of ridership activity at each proposed station location is shown in Table 6. Stations with less than 300 estimated riders per day were rated as ‘Low’ activity stations. Stations with 300 to 1,000 riders per day were rated as ‘Medium’ and stations with greater than 1,000 riders per day were rated as ‘High’ activity stations.
Highway 169 North Technical Report 10 SRF Consulting Group, Inc.

Table 6: Ridership by Station
Station Name Station Activity Low = fewer than 300 daily riders Medium = 300 – 1,000 daily riders High = more than 1,000 daily riders
Brooklyn Boulevard Blue Line LRT Extension Station
High
Brooklyn Boulevard Medium
Schmidt Lake Road Medium
36th Avenue Medium
13th Avenue Medium
Betty Crocker Drive Medium
TH 7 Medium
Bren Road Medium
Golden Triangle High
Viking Drive/ Washington Avenue
High
Pioneer Trail Medium
Southbridge Crossing Park-and-Ride
Medium
Seagate Technology Park-and-Ride
Low
Marschall Road Transit Station
Medium
Highway 169 North Technical Report 11 SRF Consulting Group, Inc.
Evaluation
Evaluation Criteria The HTCS used five goals to evaluate the corridors studied:
1. Provide mobility benefits and respond to trip patterns/needs and deficiencies for markets identified in the purpose and need
2. Provide affordable, effective transportation improvements 3. Meet 2030 Transportation Policy Plan ridership goals 4. Seamlessly integrate with existing systems and provide valuable regional connections 5. Support area development plan, forecast growth assignment, redevelopment
potential
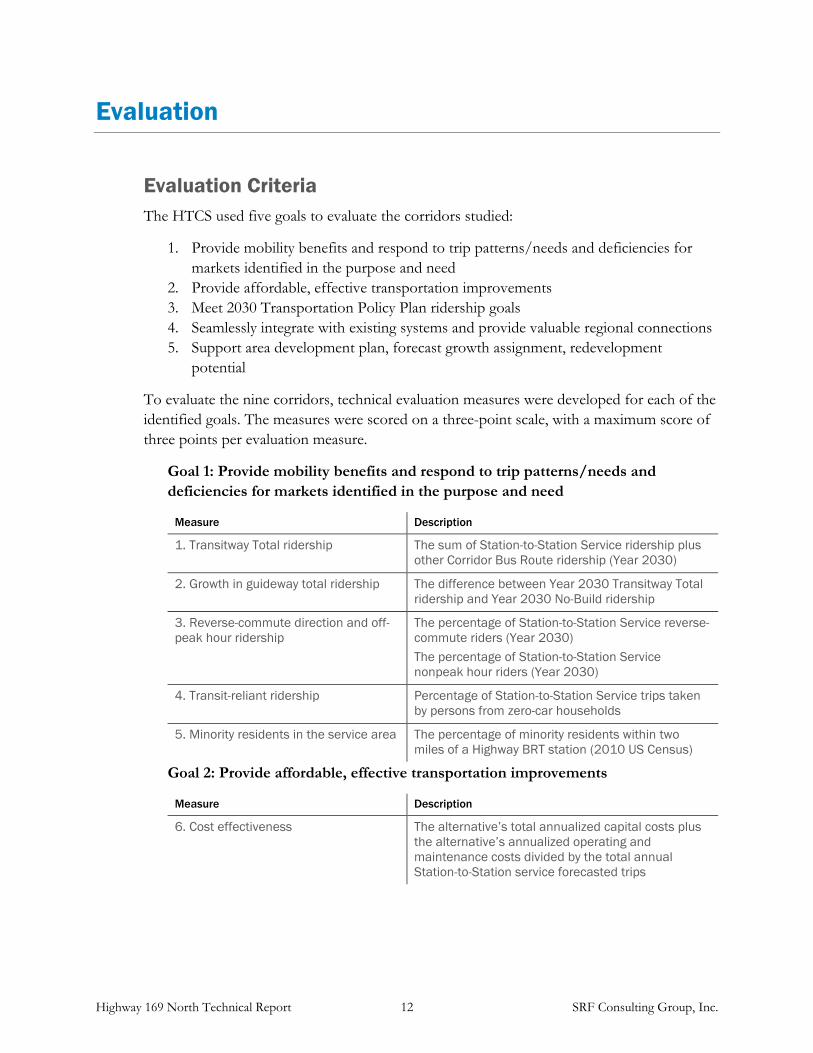
To evaluate the nine corridors, technical evaluation measures were developed for each of the identified goals. The measures were scored on a three-point scale, with a maximum score of three points per evaluation measure.
Goal 1: Provide mobility benefits and respond to trip patterns/needs and deficiencies for markets identified in the purpose and need
Measure Description
1. Transitway Total ridership The sum of Station-to-Station Service ridership plus other Corridor Bus Route ridership (Year 2030)
2. Growth in guideway total ridership The difference between Year 2030 Transitway Total ridership and Year 2030 No-Build ridership
3. Reverse-commute direction and off-peak hour ridership
The percentage of Station-to-Station Service reverse-commute riders (Year 2030) The percentage of Station-to-Station Service nonpeak hour riders (Year 2030)
4. Transit-reliant ridership Percentage of Station-to-Station Service trips taken by persons from zero-car households
5. Minority residents in the service area The percentage of minority residents within two miles of a Highway BRT station (2010 US Census)
Goal 2: Provide affordable, effective transportation improvements
Measure Description
6. Cost effectiveness The alternative’s total annualized capital costs plus the alternative’s annualized operating and maintenance costs divided by the total annual Station-to-Station service forecasted trips
Highway 169 North Technical Report 12 SRF Consulting Group, Inc.

Goal 3: Meet 2030 Transportation Policy Plan ridership goals
Measure Description
7. Station-to-Station service ridership The number of trips taken on a Highway BRT Station-to-Station Service route (Year 2030)
8. New transit riders The estimated number of new riders that would choose to use the Highway BRT service instead of making the trip with an automobile (Year 2030)
Goal 4: Seamlessly integrate with existing systems and provide valuable regional connections
Measure Description
9. Current year Station-to-Station Service ridership with the Build Alternative
The number of Station-to-Station Service trips taken on the Build Alternative if it was built in the current year
10. Connections to existing or planned high-frequency transitways
The number of times a Highway BRT corridor connects with an existing or planned high-frequency transitway
Goal 5: Support area development plan, forecast growth assignment, redevelopment potential
Measure Description
11. Forecast growth in population The forecasted percent change in population (2010– 2030) within two miles of a Highway BRT station location included for each corridor
12. Forecast growth in employment The forecasted percent change in employment (2010 – 2030) within two miles of a Highway BRT station location included for each corridor
Highway 169 North Technical Report 13 SRF Consulting Group, Inc.

Table 7: Evaluation Data Summary
Measure I-94 HWY 65 I-35E North HWY 36 I-35E South HWY 169 S HWY 212* I-394 HWY 55 HWY 169 N*
GO
AL 1
1. Transitway Total ridership (Year 2030) 13,700 1,200 3,400 11,400 5,700 12,000 3,800 14,400 8,300 11,000
2. Growth in guideway total ridership (from 2030 No Build to 2030 Build)
4,400 600 3,100 9,300 4,200 8,600 1,400 7,900 4,900 5,800
3. Off-peak hour ridership and reverse-commute direction (Year 2030)
35% 43% 12% 28% 37% 38% 45% 42% 45% 47%
4. Transit-reliant ridership (Year 2030) 45% 26% 35% 35% 38% 33% 29% 37% 43% 40%
5. Minority residents in the service area (US 2010 Census
52% 18% 46% 30% 21% 21% 17% 17% 32% 27%
GO
AL 2
6. Cost effectiveness ($2013) $5.12 $19.96 $6.81 $2.77 $8.50 $4.67 $18.36 $2.85 $7.13 $6.65
GO
AL 3
7. Station-to-Station Service ridership (Year 2030)
5,400 800 2,500 9,300 4,000 7,800 600 6,600 4,300 6,000
8. New transit riders (Year 2030) 1,400 700 500 1,300 1,200 2,000 300 1,600 1,300 2,200
GO
AL 4
9. 2010 Trips with the Build Alternative 2,600 400 1,300 5,200 2,500 4,600 400 3,600 3,000 4,100
10. Connections to existing or planned high-frequency transitways
1 1 0 2 3 2 1 0 3 3
GO
AL 5
11. Forecast growth in population 3% 8% 6% 9% 6% 15% 25% 7% 13% 20%
12. Forecast growth in employment 28% 14% 19% 13% 15% 19% 18% 8% 6% 24%
*Does not serve downtown Minneapolis directly
Highway 169 North Technical Report 14 SRF Consulting Group, Inc.
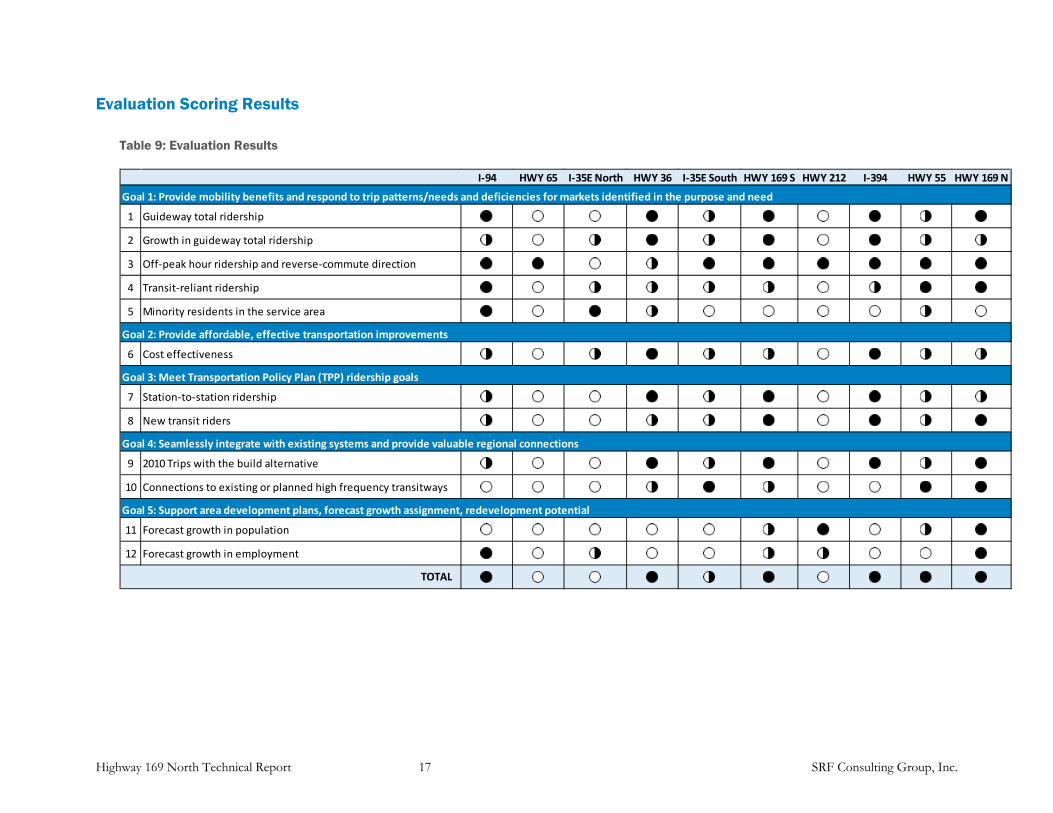
Evaluation Scoring Methodology Reviewers Note: Consistent with the methodology in the HTCS, the thresholds described above were used to generate one score (ranging from 1 to 3) for each of the 12 criteria for each corridor. The five project goals were weighted equally in the overall score for each corridor. While the PMT has reviewed the technical results of the Highway 169 analysis, they have not yet reviewed the evaluation methods described below, which generated the corridor scores shown in Table 9. The results of all evaluation measures were comparatively scored on a three-point scale by alternative (i.e., a total maximum score of three points per evaluation measure). However, three separate methodologies were used to set scoring thresholds. The three methodologies are described below.
Threshold Methodology 1
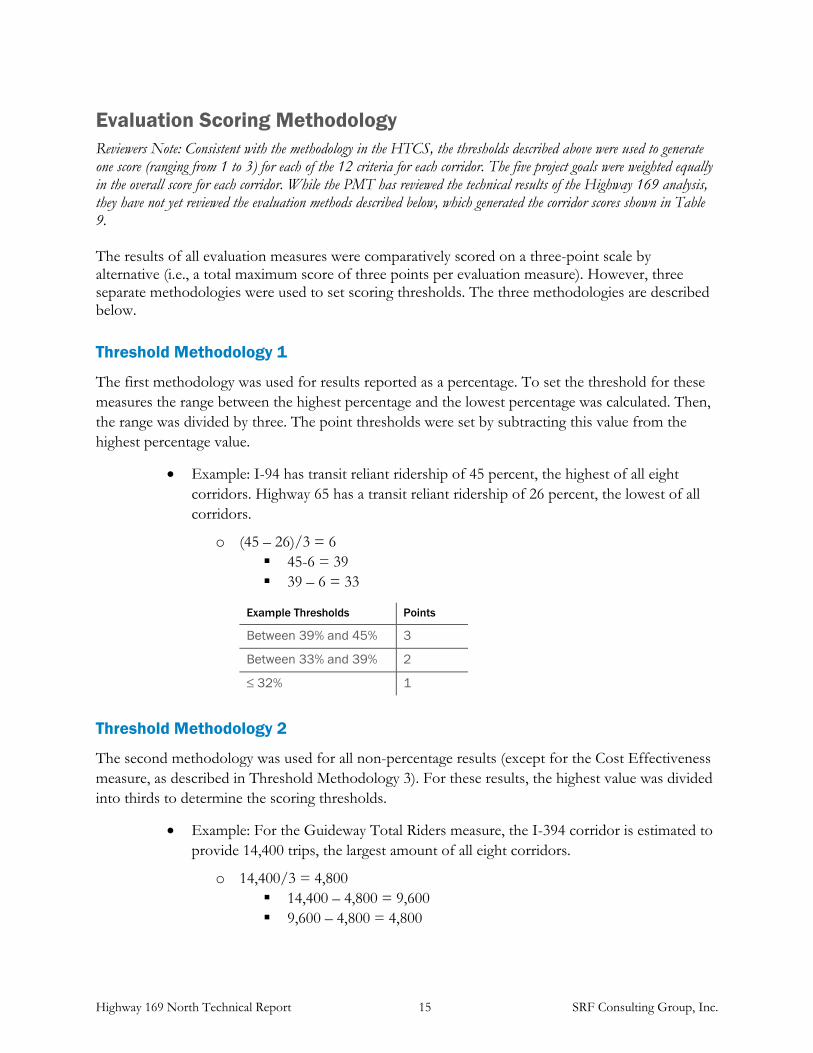
The first methodology was used for results reported as a percentage. To set the threshold for these measures the range between the highest percentage and the lowest percentage was calculated. Then, the range was divided by three. The point thresholds were set by subtracting this value from the highest percentage value.
• Example: I-94 has transit reliant ridership of 45 percent, the highest of all eight corridors. Highway 65 has a transit reliant ridership of 26 percent, the lowest of all corridors.
o (45 – 26)/3 = 6 45-6 = 39 39 – 6 = 33
Example Thresholds Points
Between 39% and 45% 3
Between 33% and 39% 2
≤ 32% 1
Threshold Methodology 2
The second methodology was used for all non-percentage results (except for the Cost Effectiveness measure, as described in Threshold Methodology 3). For these results, the highest value was divided into thirds to determine the scoring thresholds.
• Example: For the Guideway Total Riders measure, the I-394 corridor is estimated to provide 14,400 trips, the largest amount of all eight corridors.
o 14,400/3 = 4,800 14,400 – 4,800 = 9,600 9,600 – 4,800 = 4,800
Highway 169 North Technical Report 15 SRF Consulting Group, Inc.
Thresholds Points
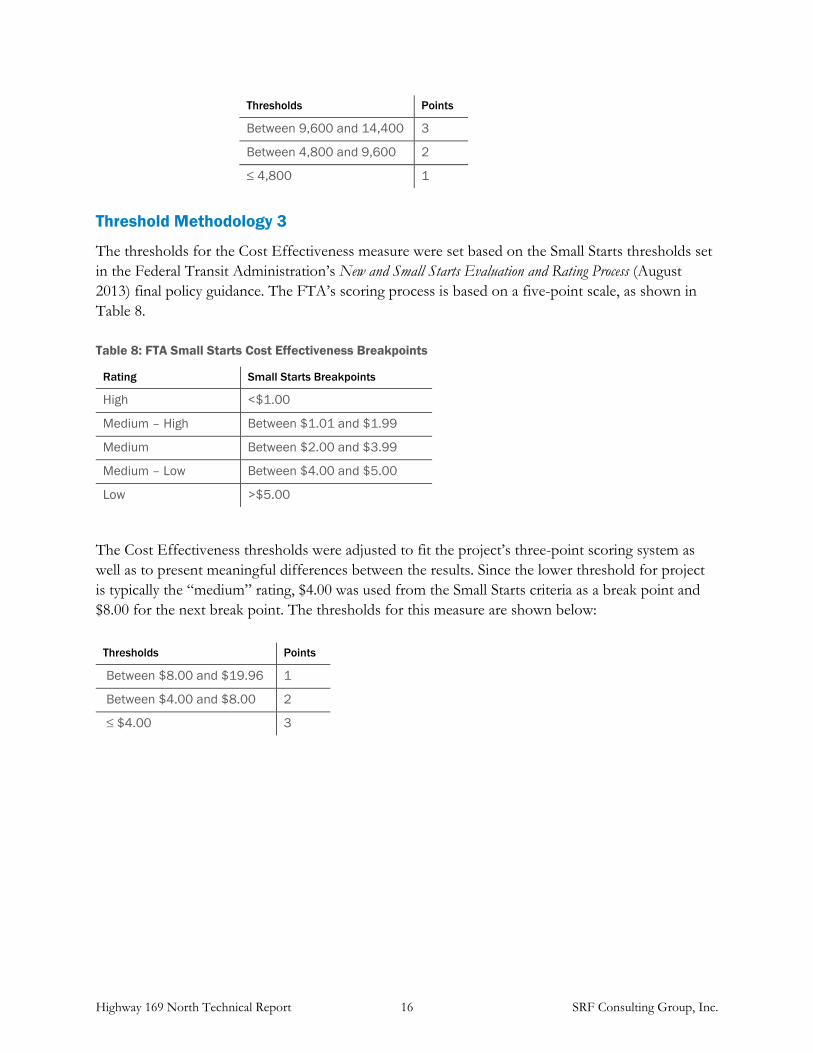
Between 9,600 and 14,400 3
Between 4,800 and 9,600 2
≤ 4,800 1
Threshold Methodology 3
The thresholds for the Cost Effectiveness measure were set based on the Small Starts thresholds set in the Federal Transit Administration’s New and Small Starts Evaluation and Rating Process (August 2013) final policy guidance. The FTA’s scoring process is based on a five-point scale, as shown in Table 8.
Table 8: FTA Small Starts Cost Effectiveness Breakpoints
Rating Small Starts Breakpoints
High <$1.00
Medium – High Between $1.01 and $1.99
Medium Between $2.00 and $3.99
Medium – Low Between $4.00 and $5.00
Low >$5.00
The Cost Effectiveness thresholds were adjusted to fit the project’s three-point scoring system as well as to present meaningful differences between the results. Since the lower threshold for project is typically the “medium” rating, $4.00 was used from the Small Starts criteria as a break point and $8.00 for the next break point. The thresholds for this measure are shown below:
Thresholds Points
Between $8.00 and $19.96 1
Between $4.00 and $8.00 2
≤ $4.00 3
Highway 169 North Technical Report 16 SRF Consulting Group, Inc.
Evaluation Scoring Results
Table 9: Evaluation Results
I-94 HWY 65 I-35E North HWY 36 I-35E South HWY 169 S HWY 212 I-394 HWY 55 HWY 169 N
1 Guideway total ridership
2 Growth in guideway total ridership
3 Off-peak hour ridership and reverse-commute direction
4 Transit-reliant ridership
5 Minority residents in the service area
6 Cost effectiveness
7 Station-to-station ridership
8 New transit riders
9 2010 Trips with the build alternative
10 Connections to existing or planned high frequency transitways
11 Forecast growth in population
12 Forecast growth in employment
TOTAL
Goal 5: Support area development plans, forecast growth assignment, redevelopment potential
Goal 1: Provide mobility benefits and respond to trip patterns/needs and deficiencies for markets identified in the purpose and need
Goal 2: Provide affordable, effective transportation improvements
Goal 3: Meet Transportation Policy Plan (TPP) ridership goals
Goal 4: Seamlessly integrate with existing systems and provide valuable regional connections
Highway 169 North Technical Report 17 SRF Consulting Group, Inc.

Based on the evaluation results, the ten HTCS corridors were placed into categories showing the potential feasibility of all-day, station-to-station BRT service, as shown in Table 10. The corridors identified in the “High” category represent those that had the highest technical score in the evaluation, strongly supporting the goals for the study. These corridors were: I-394, Highway 36, Highway 169 South, I-94, and Highway 55, and Highway 169.
Table 10: Potential for All-Day, Station-to-Station BRT Service
Potential Rating Corridors
High • Highway 36 • Highway 169 South • I-394 • I-94 • Highway 55 • Highway 169
Moderate • I-35E South
Low • Highway 65 • I-35W North • Highway 212
Highway 169 North Technical Report 18 SRF Consulting Group, Inc.
Appendix A
Existing Conditions: Highway 169 between I-394 and
TH 610
Version 1.0
Minnesota Department of Transportation
Prepared by:
August 2016
SRF No. 8989
Appendix A i SRF Consulting Group, Inc.
Table of Contents
Introduction ................................................................................................................. 1
Methodology and Existing Conditions ..................................................................... 2
Population Estimates ............................................................................................................................. 2
Methodology .............................................................................................................................. 2
Existing Conditions .................................................................................................................. 2
Employment Centers ............................................................................................................................. 4
Methodology .............................................................................................................................. 4
Existing Conditions .................................................................................................................. 4
Education Centers .................................................................................................................................. 4
Methodology .............................................................................................................................. 4
Existing Conditions .................................................................................................................. 4
Existing Transit Routes and Infrastructure ....................................................................................... 5
Methodology .............................................................................................................................. 5
Existing Conditions .................................................................................................................. 5
Highway Characteristics and Congestion Data ................................................................... 9
H:\Projects\8989\TP\Task 3\Tech Memo\Existing Conditions\2016 08 23 Appendix A 169 N Existing Conditions.docx
Appendix A 1 SRF Consulting Group, Inc.
Introduction
In 2014 the Metropolitan Council completed the Highway Transitway Corridor Study
(HTCS), which examined the potential for all-day, frequent, station-to-station, Highway Bus
Rapid Transit (BRT) along nine corridors in the region, shown in Error! Reference source
not found. and listed below:
I-94
Highway 65
I-35E North
Highway 36
I-35E South
Highway 169 South
Highway 212
I-394
Highway 55
The segment of Highway 169 between I-394 and Scott County Road 69 in Shakopee was
studied in the HTCS; however, the northern segment of Highway 169 between I-394 and
Highway 610 was not included in the study. The purpose of this analysis is to consider the
potential for all-day, frequent, station-to-station, Highway BRT along Highway 169 from
Marschall Road in Shakopee to Highway 610 in Brooklyn Park. This will be accomplished by
performing the same analysis on Highway 169 that was completed for the corridors listed
above.

Appendix A 2 SRF Consulting Group, Inc.
Methodology and Existing Conditions
The existing conditions analysis includes: population estimates; identification of employment
and education centers; existing transit routes and transit advantage infrastructure; park-and-
ride-lot descriptions and use in the corridor; and highway characteristics and congestion
data.
The existing conditions analysis presented in this technical memo is for the segment of
Highway 169 between I-394 and Highway 610. For the segment of Highway 169 south of
I-394, please see Appendix B: Existing Conditions and Market Analysis: Highway 169
between Highway 55 and Marschall Road.
Population Estimates
Methodology
Corridor population is defined as all persons living within two miles of all full-access local
interchanges along Highway 169 between I-394 and Highway 610. Full-access local
interchanges are those with roadways that intersect Highway 169 or I-394 and have entrance
and exit ramps in all directions. The number of persons living within two miles of these
interchanges was calculated at the US Census block level using 2010 US Decennial Census
data.
Existing Conditions
The Highway 169 study area extends approximately 14.1 miles north from I-394 to 101st
Avenue, which is located immediately north of the Highway 169/Highway 610 interchange.
It directly serves the cities of Golden Valley, Maple Grove, Brooklyn Park, Plymouth, New
Hope, Osseo, and Champlin. Approximately 139,000 persons and 57,000 households live
within two miles of a full access interchange in the Highway 169 North Corridor. Figure 1
shows the 169 North Corridor and surrounding communities, employment centers, and
education centers.

Appendix A 3 SRF Consulting Group, Inc.
Figure 1: Highway 169 North Study Area, Education Centers, and Employment Centers
Appendix A 4 SRF Consulting Group, Inc.
Employment Centers
Methodology
Corridor employment centers are defined as contiguous areas with 7,000 or more jobs and a
job density of ten or more jobs per acre. The Metropolitan Council used a combination of
2010 Quarterly Census of Employment and Wages (QCEW) data and the Metropolitan
Council’s Generalized Land Use boundaries to identify corridor employment centers. The
Council also classified each job center as a Metro Center, a Regional Center, or a Subregional
Center. Metro Centers have the most jobs and highest job densities and Subregional centers
have the fewest jobs.
Existing Conditions
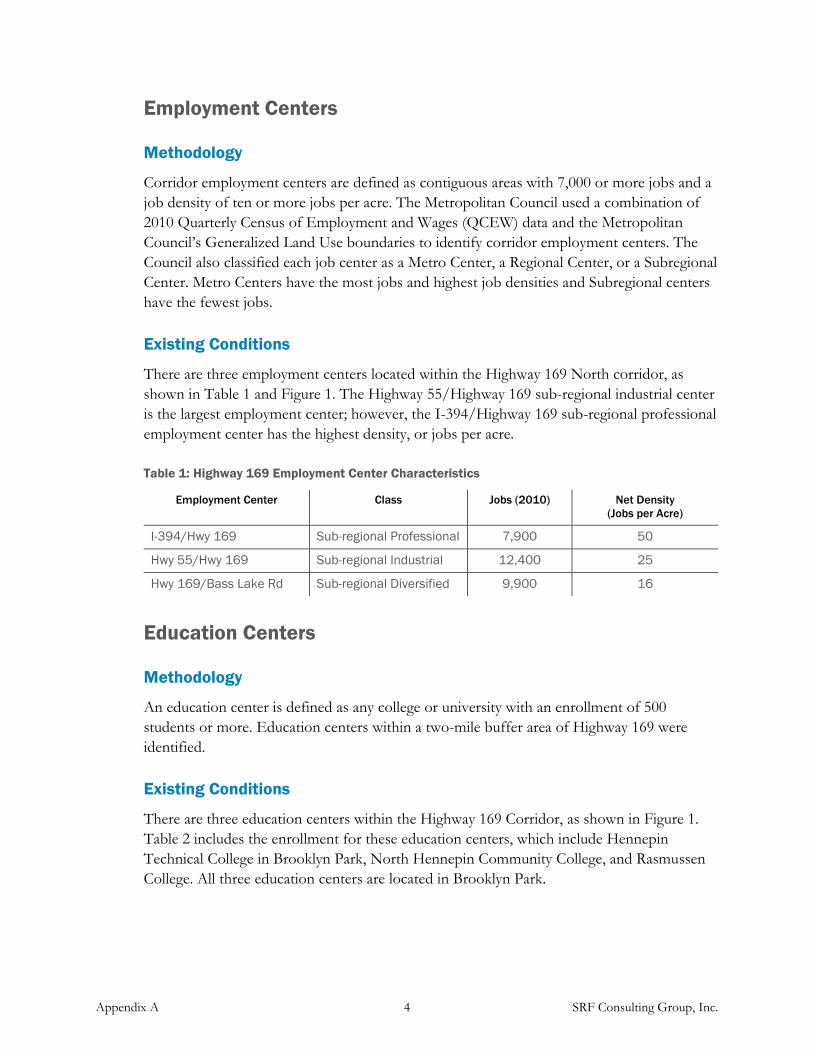
There are three employment centers located within the Highway 169 North corridor, as
shown in Table 1 and Figure 1. The Highway 55/Highway 169 sub-regional industrial center
is the largest employment center; however, the I-394/Highway 169 sub-regional professional
employment center has the highest density, or jobs per acre.
Table 1: Highway 169 Employment Center Characteristics
Employment Center Class Jobs (2010) Net Density
(Jobs per Acre)
I-394/Hwy 169 Sub-regional Professional 7,900 50
Hwy 55/Hwy 169 Sub-regional Industrial 12,400 25
Hwy 169/Bass Lake Rd Sub-regional Diversified 9,900 16
Education Centers
Methodology
An education center is defined as any college or university with an enrollment of 500
students or more. Education centers within a two-mile buffer area of Highway 169 were
identified.
Existing Conditions
There are three education centers within the Highway 169 Corridor, as shown in Figure 1.
Table 2 includes the enrollment for these education centers, which include Hennepin
Technical College in Brooklyn Park, North Hennepin Community College, and Rasmussen
College. All three education centers are located in Brooklyn Park.
Appendix A 5 SRF Consulting Group, Inc.
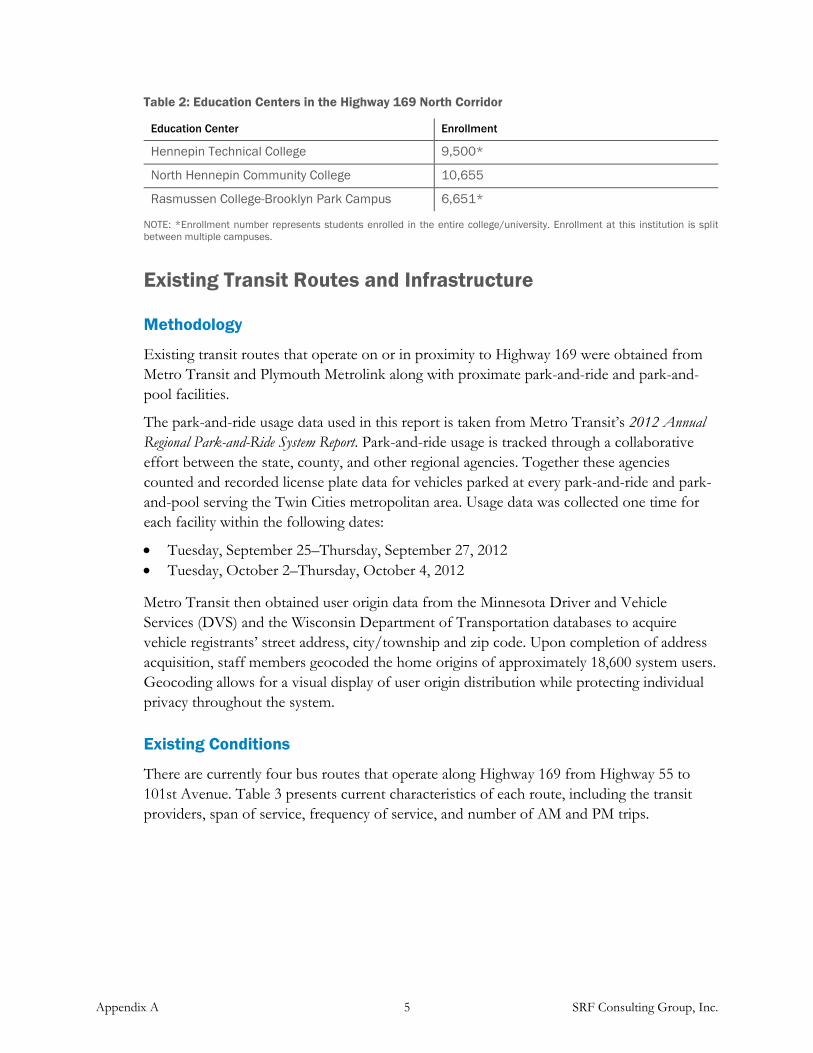
Table 2: Education Centers in the Highway 169 North Corridor
Education Center Enrollment
Hennepin Technical College 9,500*
North Hennepin Community College 10,655
Rasmussen College-Brooklyn Park Campus 6,651*
NOTE: *Enrollment number represents students enrolled in the entire college/university. Enrollment at this institution is split
between multiple campuses.
Existing Transit Routes and Infrastructure
Methodology
Existing transit routes that operate on or in proximity to Highway 169 were obtained from
Metro Transit and Plymouth Metrolink along with proximate park-and-ride and park-and-
pool facilities.
The park-and-ride usage data used in this report is taken from Metro Transit’s 2012 Annual
Regional Park-and-Ride System Report. Park-and-ride usage is tracked through a collaborative
effort between the state, county, and other regional agencies. Together these agencies
counted and recorded license plate data for vehicles parked at every park-and-ride and park-
and-pool serving the Twin Cities metropolitan area. Usage data was collected one time for
each facility within the following dates:
Tuesday, September 25–Thursday, September 27, 2012
Tuesday, October 2–Thursday, October 4, 2012
Metro Transit then obtained user origin data from the Minnesota Driver and Vehicle
Services (DVS) and the Wisconsin Department of Transportation databases to acquire
vehicle registrants’ street address, city/township and zip code. Upon completion of address
acquisition, staff members geocoded the home origins of approximately 18,600 system users.
Geocoding allows for a visual display of user origin distribution while protecting individual
privacy throughout the system.
Existing Conditions
There are currently four bus routes that operate along Highway 169 from Highway 55 to
101st Avenue. Table 3 presents current characteristics of each route, including the transit
providers, span of service, frequency of service, and number of AM and PM trips.
Appendix A 6 SRF Consulting Group, Inc.
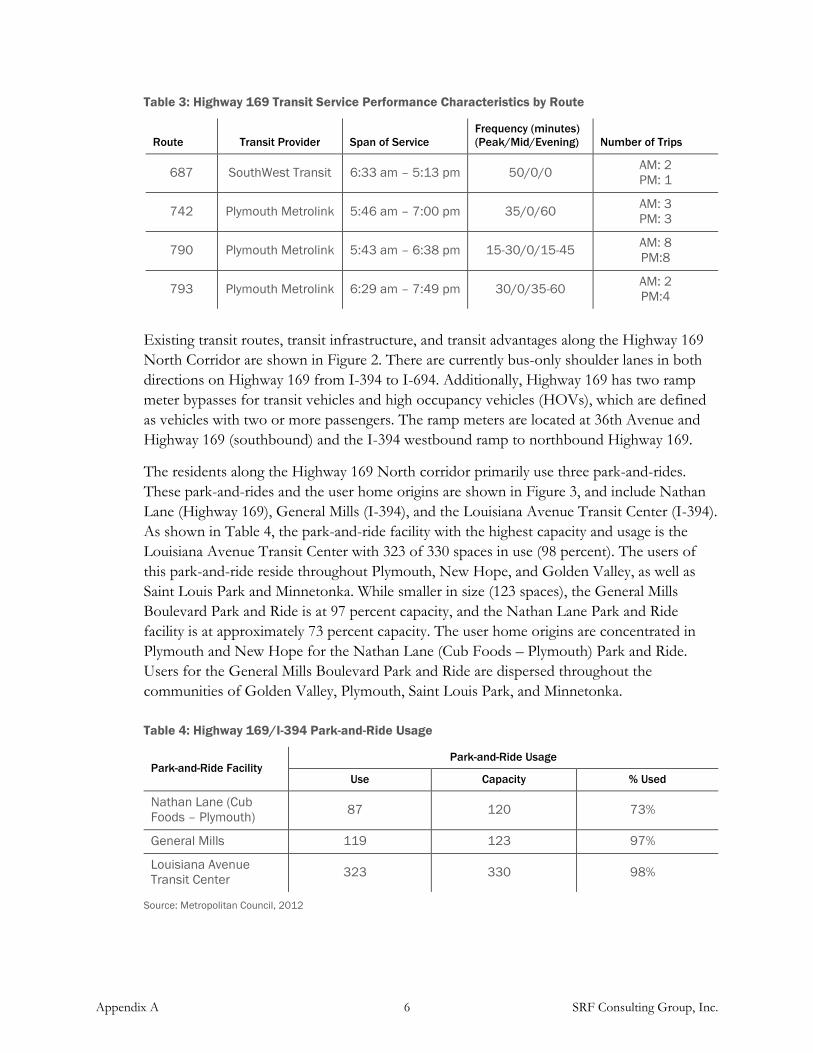
Table 3: Highway 169 Transit Service Performance Characteristics by Route
Route Transit Provider Span of Service
Frequency (minutes)
(Peak/Mid/Evening) Number of Trips
687 SouthWest Transit 6:33 am – 5:13 pm 50/0/0 AM: 2
PM: 1
742 Plymouth Metrolink 5:46 am – 7:00 pm 35/0/60 AM: 3
PM: 3
790 Plymouth Metrolink 5:43 am – 6:38 pm 15-30/0/15-45 AM: 8
PM:8
793 Plymouth Metrolink 6:29 am – 7:49 pm 30/0/35-60 AM: 2
PM:4
Existing transit routes, transit infrastructure, and transit advantages along the Highway 169
North Corridor are shown in Figure 2. There are currently bus-only shoulder lanes in both
directions on Highway 169 from I-394 to I-694. Additionally, Highway 169 has two ramp
meter bypasses for transit vehicles and high occupancy vehicles (HOVs), which are defined
as vehicles with two or more passengers. The ramp meters are located at 36th Avenue and
Highway 169 (southbound) and the I-394 westbound ramp to northbound Highway 169.
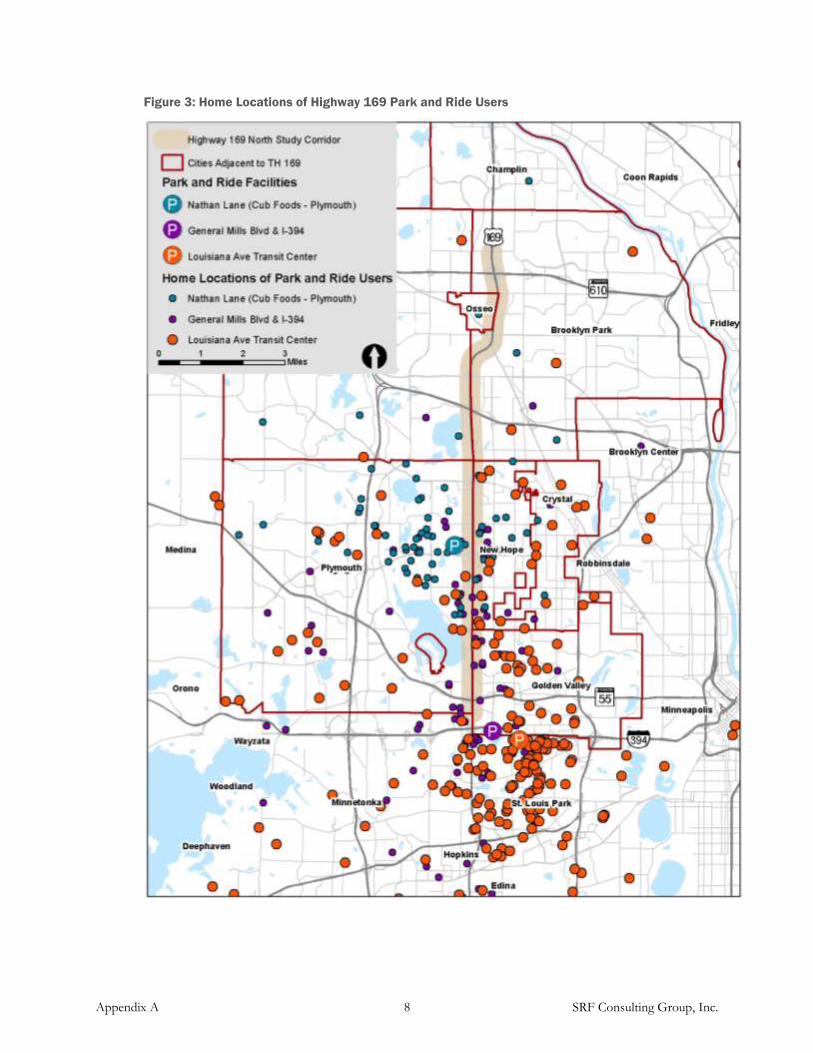
The residents along the Highway 169 North corridor primarily use three park-and-rides.
These park-and-rides and the user home origins are shown in Figure 3, and include Nathan
Lane (Highway 169), General Mills (I-394), and the Louisiana Avenue Transit Center (I-394).
As shown in Table 4, the park-and-ride facility with the highest capacity and usage is the
Louisiana Avenue Transit Center with 323 of 330 spaces in use (98 percent). The users of
this park-and-ride reside throughout Plymouth, New Hope, and Golden Valley, as well as
Saint Louis Park and Minnetonka. While smaller in size (123 spaces), the General Mills
Boulevard Park and Ride is at 97 percent capacity, and the Nathan Lane Park and Ride
facility is at approximately 73 percent capacity. The user home origins are concentrated in
Plymouth and New Hope for the Nathan Lane (Cub Foods – Plymouth) Park and Ride.
Users for the General Mills Boulevard Park and Ride are dispersed throughout the
communities of Golden Valley, Plymouth, Saint Louis Park, and Minnetonka.
Table 4: Highway 169/I-394 Park-and-Ride Usage
Park-and-Ride Facility Park-and-Ride Usage
Use Capacity % Used
Nathan Lane (Cub
Foods – Plymouth) 87 120 73%
General Mills 119 123 97%
Louisiana Avenue
Transit Center 323 330 98%
Source: Metropolitan Council, 2012

Appendix A 7 SRF Consulting Group, Inc.
Figure 2: Transit Routes, Transit Advantages, and Park-and-Ride Facilities
Appendix A 8 SRF Consulting Group, Inc.
Figure 3: Home Locations of Highway 169 Park and Ride Users
Appendix A 9 SRF Consulting Group, Inc.
Highway Characteristics and Congestion Data
Methodology
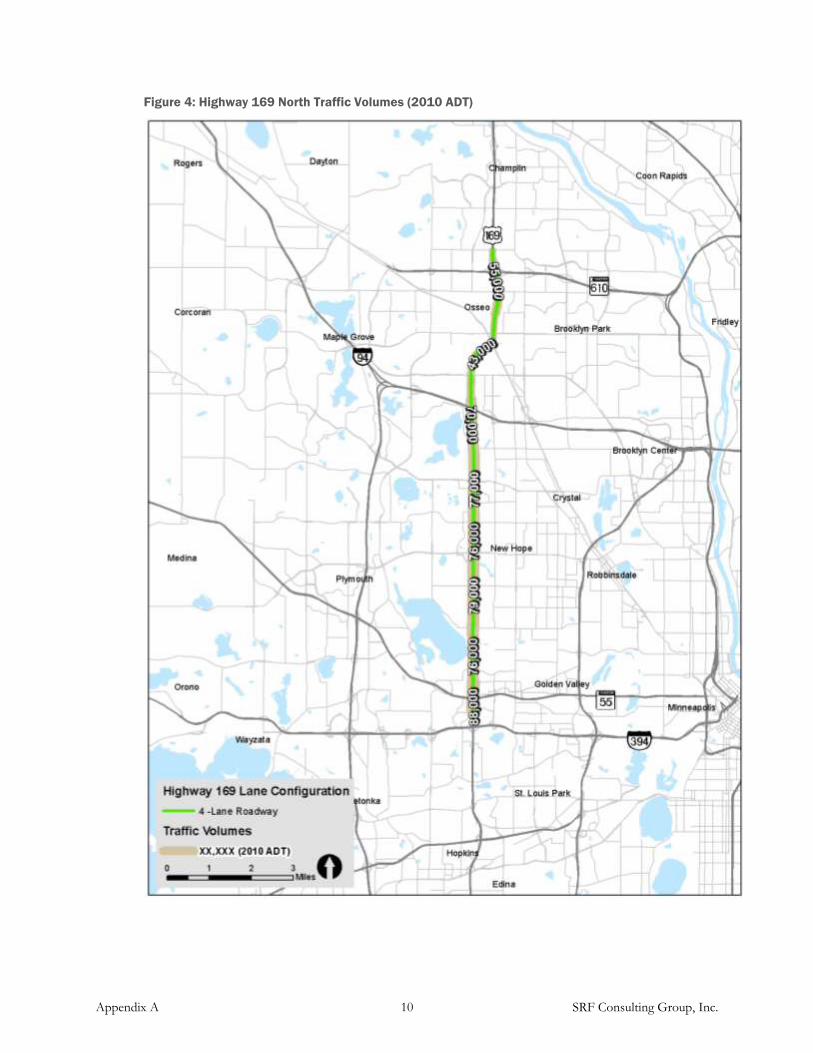
Roadway volume data was collected from MnDOT and reflects Average Daily Traffic
(ADT) from 2010.
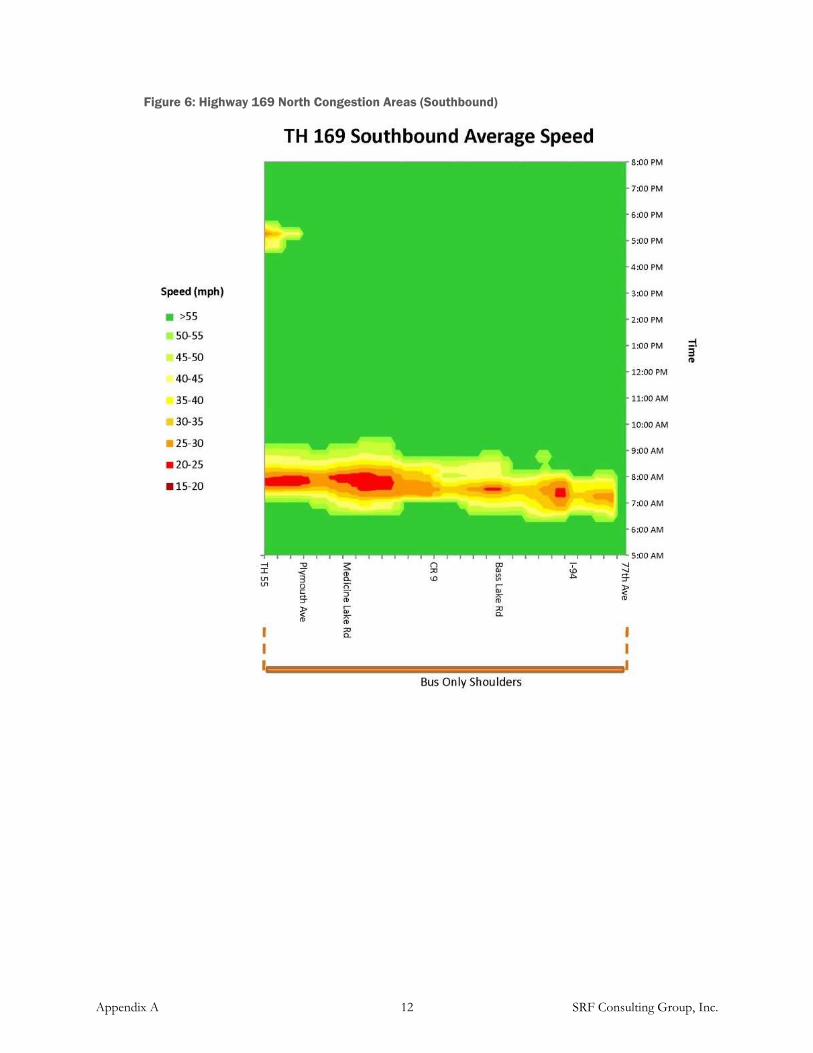
Congestion data for freeways in the Twin Cities metro area is collected by the Regional
Transportation Management Center (RTMC) via detectors embedded in the roadway. The
RTMC collects, evaluates, and archives detector data embedded in the mainline roadway
which covers approximately 90 percent of the Twin Cities metro area freeway system. The
data used in this report is from October 2012 and is representative of regular traffic patterns
in the corridor. The speed data ranges from 5:00 AM to 8:00 PM, aggregated into 15 minute
intervals.
Existing Conditions
Highway 169 is a four-lane divided arterial with a speed limit of 55 miles per hour through
the cities of Golden Valley, Maple Grove, Brooklyn Park, Plymouth, New Hope, Osseo, and
Champlin. The 2010 ADT for the Highway 169 North Corridor is displayed in Figure 4 and
ranges from 70,000 to 88,000 ADT between I-394 and I-694. Volumes drop to a range of
43,000 to 55,500 ADT north of I-694.
Northbound and southbound congestion areas for the Highway 169 North corridor are
shown in Figure 5 and Figure 6, respectively. In the northbound direction, moderate
congestion occurs between Highway 55 and Plymouth Avenue from 3:30 PM to 5:30 PM. In
the southbound direction, heavy congestion occurs between 36th Avenue and Highway 55
from 7:00 AM and 8:00 AM. There is also moderate congestion along the entire corridor
from 6:30 AM to 9:00 AM.
Appendix A 10 SRF Consulting Group, Inc.
Figure 4: Highway 169 North Traffic Volumes (2010 ADT)

Appendix A 11 SRF Consulting Group, Inc.
Figure 5: Highway 169 North Congestion Areas (Northbound)
Appendix A 12 SRF Consulting Group, Inc.
Figure 6: Highway 169 North Congestion Areas (Southbound)

Existing Conditions and Market
Analysis
Highway 169 Mobility Study
Version 2.0
Minnesota Department of Transportation
April 2016
SRF No. 8989
Existing Conditions & Market Analysis ii SRF Consulting Group, Inc. Highway 169 Mobility Study Minnesota Department of Transportation
Table of Contents
Introduction ................................................................................................................. 1
Project Background ................................................................................................................................ 1
Study Area Location and Demographics ............................................................................. 1
Transit Existing Conditions .................................................................................................... 1
Highway Operations Conditions ........................................................................................... 1
Market Analysis ......................................................................................................................... 2
Study Area Location and Demographics ................................................................ 4
Location .................................................................................................................................................... 4
Corridor Cities ........................................................................................................................... 4
Demographics ........................................................................................................................... 9
Existing Conditions ................................................................................................... 16
Transit ..................................................................................................................................................... 16
Transit Infrastructure ............................................................................................................. 16
Transit-Supportive Development Patterns ........................................................................ 22
Transit Providers and Service ............................................................................................... 22
Highway Operations ............................................................................................................................ 29
Physical Characteristics .......................................................................................................... 29
Traffic Characteristics ............................................................................................................ 29
Congestion Levels and Bottleneck Locations ................................................................... 37
Travel Time Reliability ........................................................................................................... 40
High Crash Areas .................................................................................................................... 43
Market Analysis ........................................................................................................ 47
Methodology .......................................................................................................................................... 47
Data Sources ............................................................................................................................ 47
Travel Pattern Investigation ............................................................................................................... 47
Figures
Figure 1: Highway 169 Mobility Study Area ...................................................................................... 3
Figure 2: Land Use in the Highway 169 Corridor ............................................................................ 7
Existing Conditions & Market Analysis iii SRF Consulting Group, Inc. Highway 169 Mobility Study Minnesota Department of Transportation
Figure 3: Major Employers in the Highway 169 Corridor .............................................................. 8
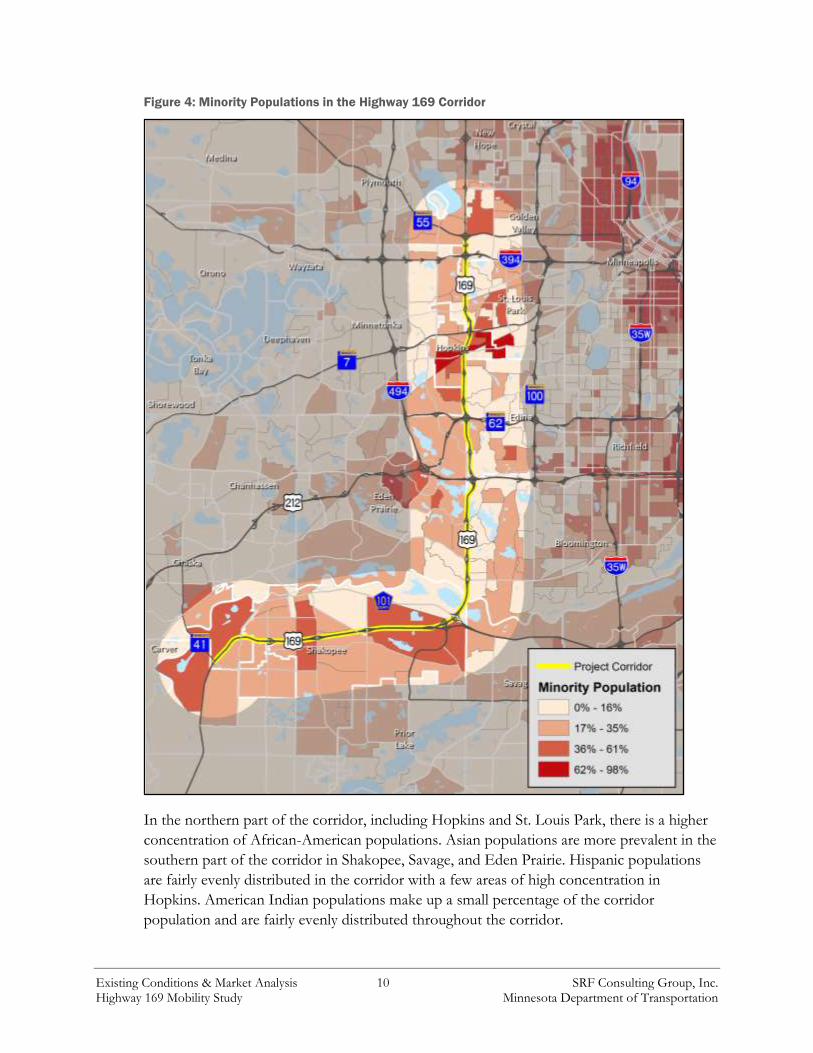
Figure 4: Minority Populations in the Highway 169 Corridor ..................................................... 10
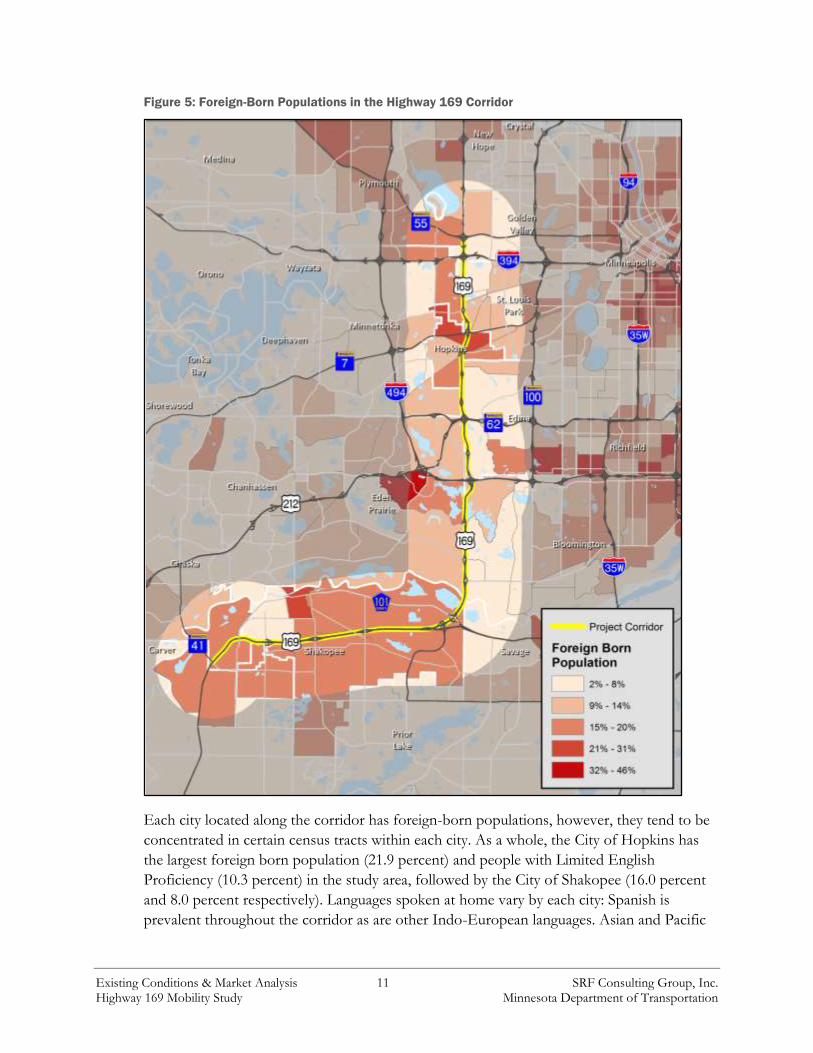
Figure 5: Foreign-Born Populations in the Highway 169 Corridor ............................................ 11
Figure 6: Languages Spoken in the Highway 169 Corridor .......................................................... 12
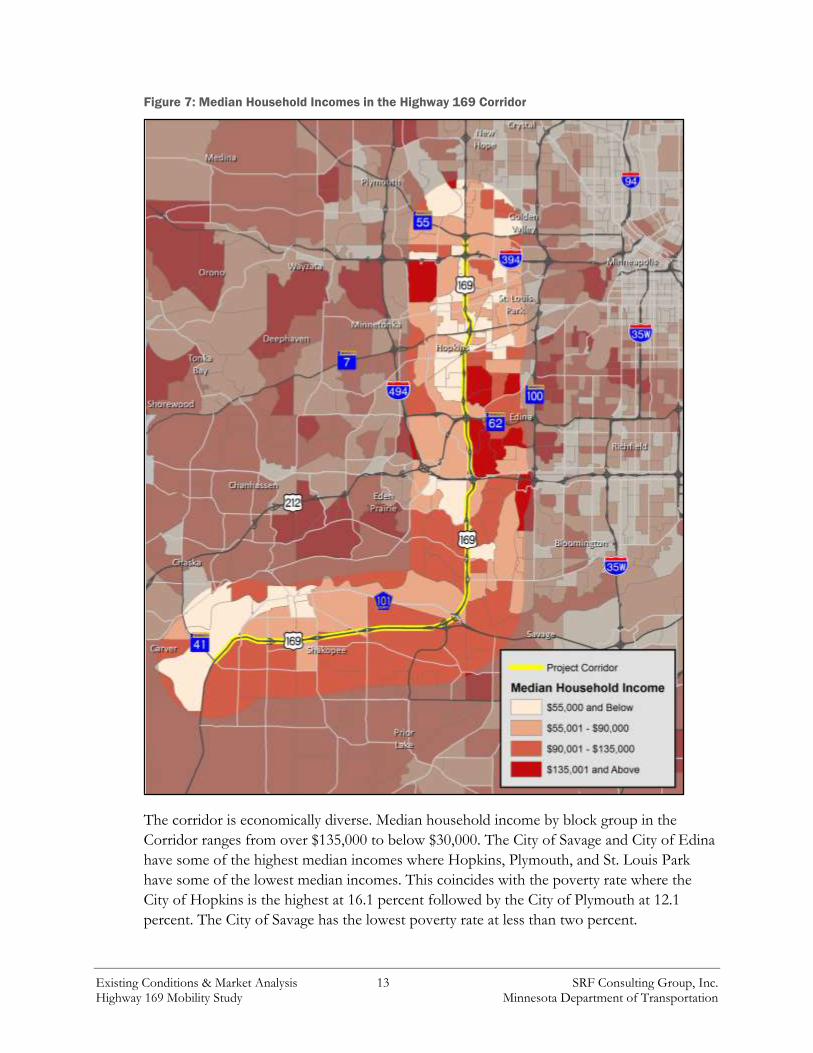
Figure 7: Median Household Incomes in the Highway 169 Corridor ........................................ 13
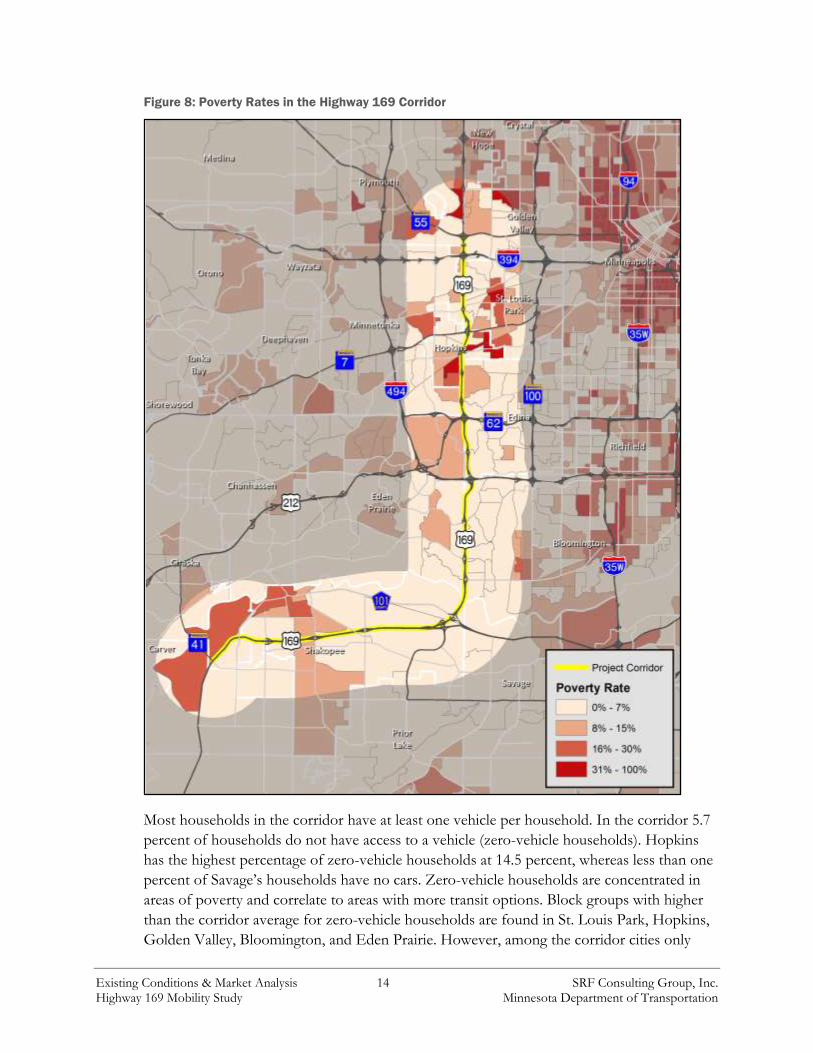
Figure 8: Poverty Rates in the Highway 169 Corridor................................................................... 14
Figure 9: Zero-Vehicle Households in the Highway 169 Corridor ............................................. 15
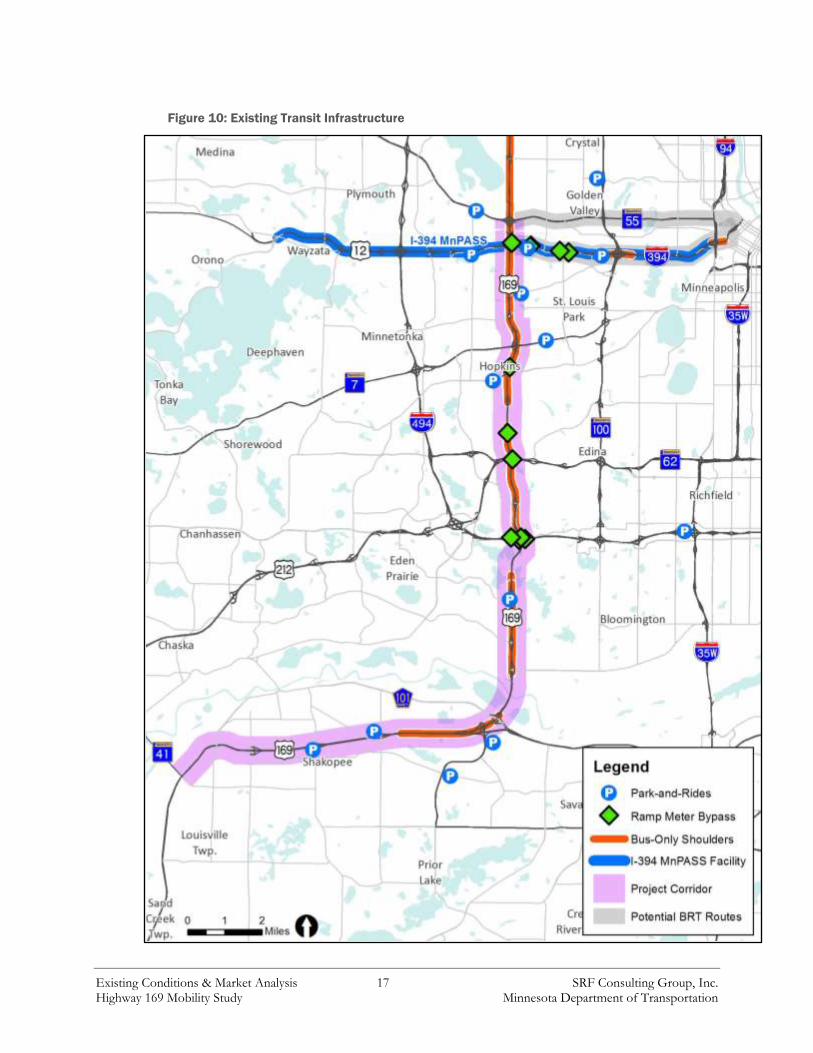
Figure 10: Existing Transit Infrastructure ........................................................................................ 17
Figure 11: Park-and-Ride User Home Locations ........................................................................... 21
Figure 12: Existing Public Transit Routes by Provider ................................................................. 27
Figure 13: A.M. Peak Hour Northbound Travel Pattern .............................................................. 49
Figure 14: A.M. Peak Hour Southbound Travel Pattern .............................................................. 49
Figure 15: P.M. Peak Hour Northbound Travel Pattern .............................................................. 50
Figure 16: P.M. Peak Hour Southbound Travel Pattern ............................................................... 50
Figure 17: Alternative Routes to Highway 169 Bloomington Ferry Bridge .............................. 51
Figure 18: Corridor Trip Clusters ...................................................................................................... 53
Tables
Table 1: Study Area Demographic Indicators ................................................................................... 9
Table 2: Highway 169, Highway 55, and I-394 Park-and-Ride 2015 Usage .............................. 19
Table 3: Regular Route Transit Service Characteristics ................................................................. 24
Table 4: Transit Routes that Cross Highway 169 or Operate Adjacent to the Corridor ........ 26
Table 5: Mystic Lake Casino Shuttle Routes ................................................................................... 28
Table 6: Traffic Characteristics – A.M. Peak Directional Split .................................................... 30
Table 7: Traffic Characteristics – P.M. Peak Directional Split ..................................................... 31
Table 8: Traffic Characteristics – Peak Hour Percentage of Daily Traffic – A.M./(P.M.)
Peaks ....................................................................................................................................................... 32
Table 9: Traffic Characteristics – A.M. Peak Volumes Approaching Capacity
(Volume/Capacity) ............................................................................................................................... 33
Table 10: Traffic Characteristics – P.M. Peak Volumes Approaching Capacity
(Volume/Capacity) ............................................................................................................................... 33
Table 11: Traffic Characteristics – Duration of Congested Conditions During A.M. Peak... 34
Table 12: Traffic Characteristics – Duration of Congested Conditions During P.M. Peak ... 34
Table 13: Traffic Characteristics – A.M. Peak Hour Start Time .................................................. 35
Table 14: Traffic Characteristics – P.M. Peak Hour Start Time .................................................. 36
Table 15: Share of Heavy Commercial Volumes on Highway 169 ............................................. 36
Table 16: Northbound Highway 169 Bottleneck Locations – A.M. Peak ................................. 38
Table 17: Southbound Highway 169 Bottleneck Locations – A.M. Peak .................................. 39
Table 18: Northbound Highway 169 Bottleneck Locations – P.M. Peak .................................. 39
Table 19: Southbound Highway 169 Bottleneck Locations – P.M. Peak .................................. 40
Table 20: Highway 169 Travel Time Reliability during the a.m. Peak Period (06:00 – 09:00) 42
Table 21: Highway 169 Travel Time Reliability during the P.M. Peak Period (3:00 – 6:00) .. 42
Existing Conditions & Market Analysis iv SRF Consulting Group, Inc. Highway 169 Mobility Study Minnesota Department of Transportation
Table 22: Highway 169 Crash Data (2010 – 2014) ......................................................................... 44
Table 23: Highway 169 Corridor Interchanges Included in MnDOT Top 200 Interchanges
Report for 2013 ..................................................................................................................................... 46
Table 24: Transitway Station Area Trip Travel Pattern ................................................................. 53
Table 25: Green Line and American Boulevard ABRT Trip Travel Patterns ........................... 54
H:\Projects\8989\TP\Task 1\Task 1.5 Existing Conditions & Market Analysis\2016 04 25 Existing Conditions & Market Analysis Memo.docx
Existing Conditions & Market Analysis 1 SRF Consulting Group, Inc. Highway 169 Mobility Study Minnesota Department of Transportation
Introduction
Project Background
The purpose of the Highway 169 Mobility Study is to develop and evaluate potential options
for improving transit and reducing congestion on Highway 169 between Shakopee and
Golden Valley. The study will focus on a constrained set of alternatives that includes
elements of highway bus rapid transit (BRT), MnPASS Express Lanes, and spot mobility
improvements such as the addition of auxiliary lanes or interchange modifications. These
improvements are intended to increase mobility, reliability, and safety through the study area.
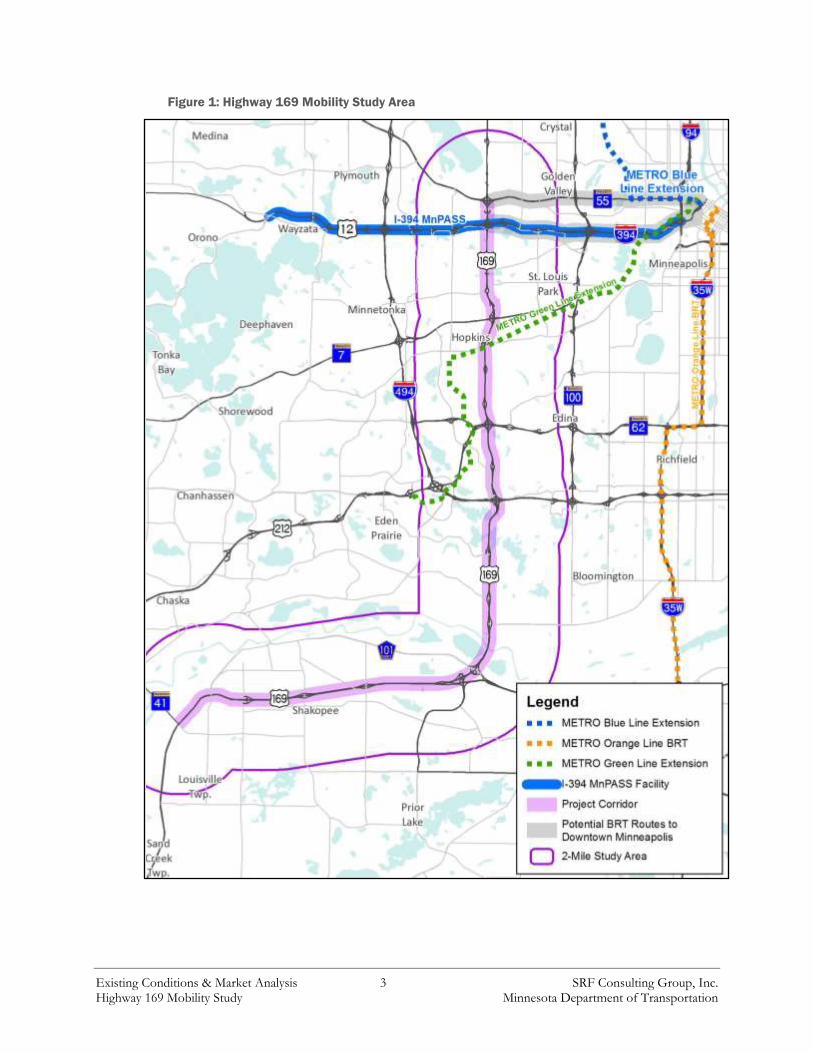
See Figure 1 for a map of the study area.
Within the broader study effort, the purpose of this existing conditions and market analysis
is to gain an understanding of how Highway 169 is currently used and how well it functions
for various users. The information documented in this memo will inform development of
highway BRT and MnPASS Express Lane elements, as well as spot mobility improvements
for analysis in this study.
The existing conditions and market analysis is divided into four parts: study area location and
demographics, transit conditions, highway operations conditions, and a market analysis.
Study Area Location and Demographics
The Highway 169 Corridor Study Area is a 23-mile segment from Highway 41 in Shakopee
to Highway 55 in Golden Valley. Located in the southwest quadrant of the Twin Cities
region, in the study area Highway 169 passes through Plymouth, Golden Valley, St. Louis
Park, Minnetonka, Hopkins, Edina, Eden Prairie, and Bloomington in Hennepin County,
and Savage and Shakopee in Scott County. The study area is composed of areas within two
miles of the corridor, and also includes part of the City of Prior Lake. The location and
demographics sections describe the land uses in the corridor, other major transportation
facilities, and demographics such as race, age, poverty status, education levels, median
household income, and zero-vehicle households.
Transit Existing Conditions
Highway BRT is being considered on Highway 169. The transit section of this existing
conditions memo describes transit service, performance, and facilities on Highway 169, as
well as on I-394 and Highway 55, which are the two BRT route options under consideration
from Highway 169 to downtown Minneapolis.
Highway Operations Conditions
MnPASS Express Lanes are also being considered on Highway 169, which if implemented
could be directly or indirectly connected to the existing MnPASS lane on I-394 or to

Existing Conditions & Market Analysis 2 SRF Consulting Group, Inc. Highway 169 Mobility Study Minnesota Department of Transportation
possible future MnPASS lanes on I-494 or Highway 62. However, this memo focuses solely
on the existing highway conditions on Highway 169. Traffic characteristics, congestion levels
and bottleneck locations, as well as travel time reliability and high crash locations are
discussed in the highway operations existing conditions analysis.
Market Analysis
The market analysis uses origin-destination data to describe travel patterns on Highway 169
and includes an analysis of trip clusters, ramp-to-ramp movements, and use of alternate
routes.
While this memo provides some general descriptions of the physical nature of the corridor,
physical components and constraints in the corridor will be described and analyzed fully in a
separate memo developed as part of the initial set of alternatives.
Existing Conditions & Market Analysis 3 SRF Consulting Group, Inc. Highway 169 Mobility Study Minnesota Department of Transportation
Figure 1: Highway 169 Mobility Study Area

Existing Conditions & Market Analysis 4 SRF Consulting Group, Inc. Highway 169 Mobility Study Minnesota Department of Transportation
Study Area Location and Demographics
Location
The Highway 169 Corridor Study Area runs from Highway 41 in Shakopee to Highway 55
in Golden Valley. This 23-mile stretch of Highway 169 is located in the southwest quadrant
of the Twin Cities region and passes through Plymouth, Golden Valley, St. Louis Park,
Minnetonka, Hopkins, Edina, Eden Prairie, and Bloomington in Hennepin County, and
Savage and Shakopee in Scott County. The study area is composed of areas within two
miles of the corridor, and also includes part of the City of Prior Lake. Highway 169 runs
north-south in Hennepin County and connects with Highways 55, 7, 62, 212, and
Interstates 394 and 494 in the study area. Highway 169 runs east-west in Scott County
where it connects with Highways 13 and 41. Highway 169 crosses a range of landscapes and
land uses that include employment-rich corporate campuses, industrial and warehouse
facilities, retail centers, single-family residential neighborhoods, clusters of apartment
buildings, and several prominent natural features. The highway crosses Bassett Creek,
Minnehaha Creek, Nine Mile Creek, Anderson Lakes Parks Reserve, and the Minnesota
River in the study area.
Please see Figure 1 for a map of the study area and Figure 2 for a map of land use in the
corridor. Figure 3 shows the locations of major employers near Highway 169.
In the study area Highway 169 is mostly four lanes wide (two lanes in each direction), though
there are multiple locations where the corridor is wider to accommodate auxiliary lanes near
interchanges. The Bloomington Ferry Bridge, one of the main connections between Scott
County and the rest of the metropolitan area, is six lanes wide. Space available for
transportation infrastructure varies throughout the corridor. The areas that are most
constrained have narrow shoulders (less than six feet wide) and retaining walls to allow for
frontage roads and interchange ramps.
Corridor Cities
Plymouth
The City of Plymouth is located in the northwest corner of the study area; Highway 169 is
the city’s eastern border. Highway 55 is a major highway that runs diagonally through the
city. There is a mix of land uses in the area around Highway 169 and Highway 55, including
retail, services, office, and multifamily residential, as well as open space surrounding Basset
Creek.
Existing Conditions & Market Analysis 5 SRF Consulting Group, Inc. Highway 169 Mobility Study Minnesota Department of Transportation
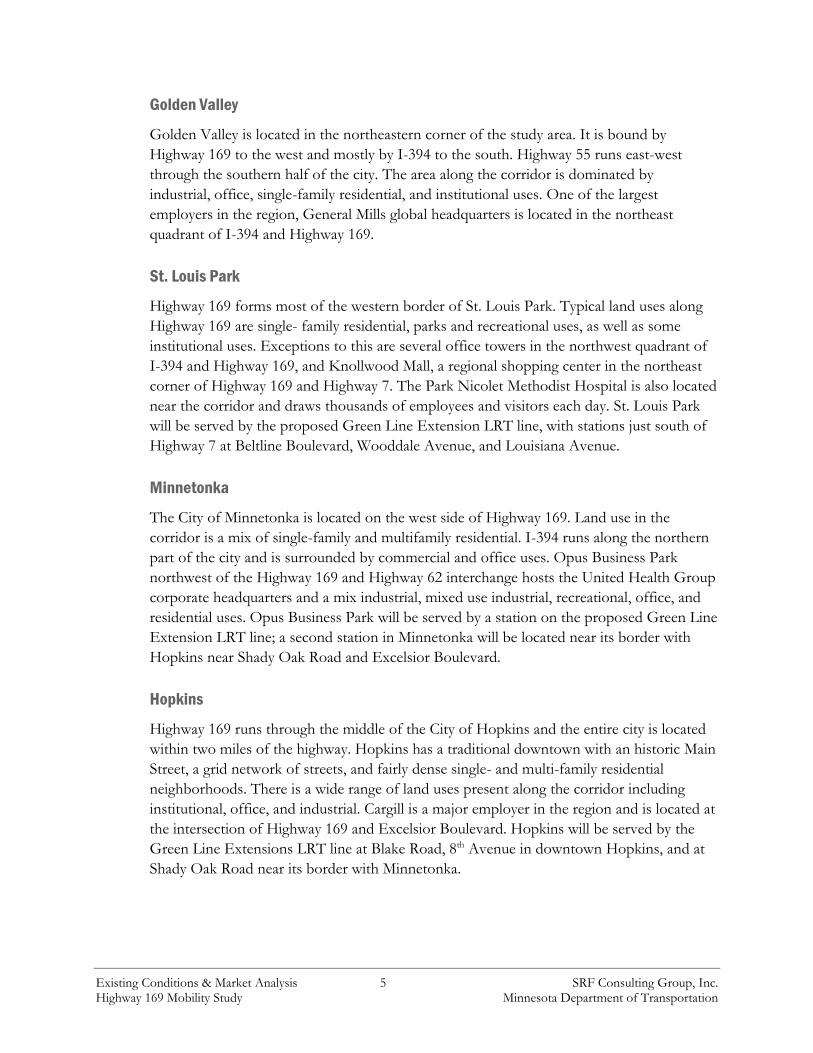
Golden Valley
Golden Valley is located in the northeastern corner of the study area. It is bound by
Highway 169 to the west and mostly by I-394 to the south. Highway 55 runs east-west
through the southern half of the city. The area along the corridor is dominated by
industrial, office, single-family residential, and institutional uses. One of the largest
employers in the region, General Mills global headquarters is located in the northeast
quadrant of I-394 and Highway 169.
St. Louis Park
Highway 169 forms most of the western border of St. Louis Park. Typical land uses along
Highway 169 are single- family residential, parks and recreational uses, as well as some
institutional uses. Exceptions to this are several office towers in the northwest quadrant of
I-394 and Highway 169, and Knollwood Mall, a regional shopping center in the northeast
corner of Highway 169 and Highway 7. The Park Nicolet Methodist Hospital is also located
near the corridor and draws thousands of employees and visitors each day. St. Louis Park
will be served by the proposed Green Line Extension LRT line, with stations just south of
Highway 7 at Beltline Boulevard, Wooddale Avenue, and Louisiana Avenue.
Minnetonka
The City of Minnetonka is located on the west side of Highway 169. Land use in the
corridor is a mix of single-family and multifamily residential. I-394 runs along the northern
part of the city and is surrounded by commercial and office uses. Opus Business Park
northwest of the Highway 169 and Highway 62 interchange hosts the United Health Group
corporate headquarters and a mix industrial, mixed use industrial, recreational, office, and
residential uses. Opus Business Park will be served by a station on the proposed Green Line
Extension LRT line; a second station in Minnetonka will be located near its border with
Hopkins near Shady Oak Road and Excelsior Boulevard.
Hopkins
Highway 169 runs through the middle of the City of Hopkins and the entire city is located
within two miles of the highway. Hopkins has a traditional downtown with an historic Main
Street, a grid network of streets, and fairly dense single- and multi-family residential
neighborhoods. There is a wide range of land uses present along the corridor including
institutional, office, and industrial. Cargill is a major employer in the region and is located at
the intersection of Highway 169 and Excelsior Boulevard. Hopkins will be served by the
Green Line Extensions LRT line at Blake Road, 8th Avenue in downtown Hopkins, and at
Shady Oak Road near its border with Minnetonka.

Existing Conditions & Market Analysis 6 SRF Consulting Group, Inc. Highway 169 Mobility Study Minnesota Department of Transportation
Edina
Highway 169 forms most of the western border of the City of Edina and Highway 62 runs
east-west through the city and connects with Highway 169. North of Highway 62 there is a
mix of land uses along the corridor including office, single-family residential, and
multifamily residential. Nine Mile Creek runs under Highway 169 from Minnetonka to
Edina. Adjacent is greenspace and wetland. Land uses south of Highway 62 along the
corridor are dominated by residential neighborhoods and institutional and recreational uses.
Eden Prairie
The City of Eden Prairie is mostly bound by Highway 169 on its eastern edge.. I-494 and
Highway 212 both intersect with Highway 169 near the Eden Prairie border. Highway 212
runs diagonally from Highway 169 until it intersects with Interstate 494 creating an area
called the Golden Triangle. This area is a mix of industrial uses, office, and open space and
is a regional jobs center because of its excellent freeway access. Emerson Electronics, and
Supervalu have corporate offices in the Golden Triangle. The Golden Triangle, the United
Health Group corporate campus at Highway 62 and Shady Oak Road, and SouthWest
Station will all be served by the proposed Green Line Extension LRT line. South of I-494
and Golden Triangle land use in Eden Prairie is mostly single-family residential, park land,
and water, with some small retail areas.
Bloomington
The City of Bloomington’s western edge is mostly bound by Highway 169. Land use along
the corridor is mostly single-family residential, with some green space and water bodies.
Along I-494 to the north is a mix of greenspace and industrial and office uses, and
industrial and multifamily uses line Old Shakopee Road near the corridor.
Savage
The City of Savage is located southeast of Highway 169 and connects to the corridor via
Highway 13 which runs east and west. Land uses near the corridor in Savage include
greenspace and industrial uses along the Minnesota River including machinery salvage and
repair businesses, as well as single family residential, and undeveloped land.
Shakopee
The City of Shakopee is located on the far southern portion of the corridor. Highway 169
runs through the middle of the city from the Bloomington Ferry Bridge over the Minnesota
River to Highway 41. Because the highway runs the length of the city, there is a wide range
of land uses adjacent to the corridor including greenspace, single- and multi- family
residential, retail, industrial, mixed-use industrial, undeveloped land, and some areas
classified as farm land. Major employers include Amazon, Seagate Technologies, Shutterfly,
Saint Francis Medical and Cancer Centers, and Saint Gertrude’s Health Center. Other

Existing Conditions & Market Analysis 7 SRF Consulting Group, Inc. Highway 169 Mobility Study Minnesota Department of Transportation
seasonal regional draws include Valley Fair Amusement Park, Canterbury Park, and the
Renaissance Festival.
Figure 2: Land Use in the Highway 169 Corridor

Existing Conditions & Market Analysis 8 SRF Consulting Group, Inc. Highway 169 Mobility Study Minnesota Department of Transportation
Figure 3: Major Employers in the Highway 169 Corridor
Employment Data Source: Corridor Cities and Metropolitan Council Transportation Analysis Zones

Existing Conditions & Market Analysis 9 SRF Consulting Group, Inc. Highway 169 Mobility Study Minnesota Department of Transportation
Demographics
A two-mile buffer around Highway 169 was drawn to summarize demographic trends in the
populations living closest to the highway. The corridor is populous; more than 215,000
people live within two miles of the corridor in 10 cities. The municipalities range in size
from Bloomington with approximately 85,000 residents, to just under 18,000 residents in
Hopkins. Overall, the corridor population is fairly wealthy, well educated, and somewhat
racially diverse.
Table 1 shows a range of demographic indicators by municipality. Note that the values in the
table reflect the populations in the study area, not the municipality as a whole, with the
exception of Hopkins, which is entirely within the study area. The Scott County cities in the
study area, Prior Lake, Savage and Shakopee, have high percentages of young people under
age 18 in the study area. Hopkins stands out in the corridor with the most racial diversity
and limited English proficiency among its population, and also has the highest percentage of
zero-vehicle households.
See Table 1 and Figure 4 through Figure 9 for details and maps.
Table 1: Study Area Demographic Indicators
City
Population
in the
Study Area
Percent
Minority
Percent
Foreign
Born
Percent
Limited
English
Proficiency
Percent
Zero-
Vehicle
Households
Percent
Under
Age 18
Percent
in
Poverty
Percent
without
High School
Education
Average of
Median
Household
Income
Bloomington 20,652 15.4% 7.9% 3.5% 3.4% 17.8% 4.4% 3.8% $88,477
Eden Prairie 27,488 27.4% 18.5% 6.5% 4.9% 25.6% 5.7% 4.3% $94,338
Edina 22,478 12.6% 9.5% 1.8% 3.0% 25.1% 4.3% 1.3% $118,572
Golden Valley 12,307 20.4% 8.3% 3.6% 5.7% 20.7% 9.0% 4.8% $78,736
Hopkins 17,909 42.2% 21.9% 10.3% 14.5% 23.8% 16.1% 8.8% $54,582
Minnetonka 25,423 17.9% 10.9% 4.4% 4.5% 17.5% 5.6% 2.9% $80,231
Plymouth 9,794 16.9% 10.9% 5.2% 5.4% 19.8% 12.1% 4.2% $75,935
Prior Lake 7,598 15.3% 4.8% 2.4% 5.1% 31.7% 4.3% 2.3% $110,903
Savage 5,486 18.8% 10.5% 6.8% 0.5% 34.6% 1.8% 3.5% $121,267
Shakopee 37,381 29.4% 16.0% 8.0% 4.1% 29.6% 7.3% 7.6% $72,360
St. Louis Park 29,578 22.2% 9.9% 3.8% 8.0% 19.3% 9.4% 5.4% $66,256
Corridor 216,094 22.9 12.1 5.3% 5.7% 23.4% 7.4% 4.7% 83,015
Seven-County
Metro Area 2,920,637 24.8% 11.0% 6.3% 8.2% 24.1% 11.1% 7.0% $68,183
Source: American Community Survey 2009-2014
Existing Conditions & Market Analysis 10 SRF Consulting Group, Inc. Highway 169 Mobility Study Minnesota Department of Transportation
Figure 4: Minority Populations in the Highway 169 Corridor
In the northern part of the corridor, including Hopkins and St. Louis Park, there is a higher
concentration of African-American populations. Asian populations are more prevalent in the
southern part of the corridor in Shakopee, Savage, and Eden Prairie. Hispanic populations
are fairly evenly distributed in the corridor with a few areas of high concentration in
Hopkins. American Indian populations make up a small percentage of the corridor
population and are fairly evenly distributed throughout the corridor.
Existing Conditions & Market Analysis 11 SRF Consulting Group, Inc. Highway 169 Mobility Study Minnesota Department of Transportation
Figure 5: Foreign-Born Populations in the Highway 169 Corridor
Each city located along the corridor has foreign-born populations, however, they tend to be
concentrated in certain census tracts within each city. As a whole, the City of Hopkins has
the largest foreign born population (21.9 percent) and people with Limited English
Proficiency (10.3 percent) in the study area, followed by the City of Shakopee (16.0 percent
and 8.0 percent respectively). Languages spoken at home vary by each city: Spanish is
prevalent throughout the corridor as are other Indo-European languages. Asian and Pacific

Existing Conditions & Market Analysis 12 SRF Consulting Group, Inc. Highway 169 Mobility Study Minnesota Department of Transportation
Island speaking populations are clustered on the south end of the corridor in Bloomington
and Shakopee and on the north end in St. Louis Park, Golden Valley, and Plymouth.
Figure 6: Languages Spoken in the Highway 169 Corridor
Existing Conditions & Market Analysis 13 SRF Consulting Group, Inc. Highway 169 Mobility Study Minnesota Department of Transportation
Figure 7: Median Household Incomes in the Highway 169 Corridor
The corridor is economically diverse. Median household income by block group in the
Corridor ranges from over $135,000 to below $30,000. The City of Savage and City of Edina
have some of the highest median incomes where Hopkins, Plymouth, and St. Louis Park
have some of the lowest median incomes. This coincides with the poverty rate where the
City of Hopkins is the highest at 16.1 percent followed by the City of Plymouth at 12.1
percent. The City of Savage has the lowest poverty rate at less than two percent.
Existing Conditions & Market Analysis 14 SRF Consulting Group, Inc. Highway 169 Mobility Study Minnesota Department of Transportation
Figure 8: Poverty Rates in the Highway 169 Corridor
Most households in the corridor have at least one vehicle per household. In the corridor 5.7
percent of households do not have access to a vehicle (zero-vehicle households). Hopkins
has the highest percentage of zero-vehicle households at 14.5 percent, whereas less than one
percent of Savage’s households have no cars. Zero-vehicle households are concentrated in
areas of poverty and correlate to areas with more transit options. Block groups with higher
than the corridor average for zero-vehicle households are found in St. Louis Park, Hopkins,
Golden Valley, Bloomington, and Eden Prairie. However, among the corridor cities only

Existing Conditions & Market Analysis 15 SRF Consulting Group, Inc. Highway 169 Mobility Study Minnesota Department of Transportation
Hopkins has a higher percentage of zero vehicle households than the regional average of 8.2
percent.
Figure 9: Zero-Vehicle Households in the Highway 169 Corridor

Existing Conditions & Market Analysis 16 SRF Consulting Group, Inc. Highway 169 Mobility Study Minnesota Department of Transportation
Existing Conditions
Transit
Transit Infrastructure
Existing transit infrastructure along the Highway 169, I-394, and Highway 55 corridors is
shown in Figure 10. This infrastructure includes facilities which provide a travel time
advantage to transit vehicles, as well as park-and-ride surface parking lots and ramps. Each
of these infrastructure components in the study area is described in additional detail below.
Transit Advantages
There are multiple types of transit advantages throughout the Highway 169 study area, as
well as on Highway 55 and I-394 between Highway 169 and downtown Minneapolis. This
infrastructure includes the MnPASS Express Lanes on I-394, bus-only shoulder lanes, and
ramp meter bypasses.
MnPASS
The I-394 MnPASS lane extends from I-494 to downtown Minneapolis and has two distinct
segments. The segment between Highway 169 and Highway 100 is an at-grade center lane in
each direction intended for use by transit vehicles, high-occupancy vehicles (HOVs) with
two or more passengers, and single-occupancy vehicles choosing to pay the posted fee via an
electronic fee system. East of Highway 100 to downtown Minneapolis, the MnPASS facility
transitions to two reversible lanes that are separated by jersey barriers and grade differences
from the general purpose lanes. There is currently no connection from Highway 169 directly
into the I-394 MnPASS lane.
Ramp Meter Bypasses
Throughout the corridors, there are 12 ramp meter bypasses where HOVs and transit
vehicles can bypass other vehicles waiting at ramp meters to efficiently enter the highway.
Ramp meter bypasses are operational at the following locations:
Entering Northbound
Highway 169
Entering
Eastbound I-394
Entering
Westbound I-394
Entering
Eastbound I-494
Entering
Westbound I-494
Bren Road
Excelsior Boulevard
Eastbound Highway
62/Highway 212
Westbound I-394
Northbound
Highway 169
General Mills
Boulevard
Louisiana
Avenue
Louisiana
Avenue
Northbound
Highway 169
Southbound
Highway 169
Northbound
Highway 169
Southbound
Highway 169
Existing Conditions & Market Analysis 17 SRF Consulting Group, Inc. Highway 169 Mobility Study Minnesota Department of Transportation
Figure 10: Existing Transit Infrastructure
Existing Conditions & Market Analysis 18 SRF Consulting Group, Inc. Highway 169 Mobility Study Minnesota Department of Transportation
Bus-Only Shoulders
As shown in Figure 10 Bus-only shoulders are located on both sides of Highway 169
throughout most of the corridor, with the exception of four segments: Londonderry
Road/Bren Road to 5th Street/Lincoln Drive, I-494 to Anderson Lakes Parkway, the
Minnesota River to Highway 101, and southwest of Old Brick Yard Road (County Highway
69) in Shakopee. A bus-only shoulder is also located on eastbound I-394 between Xenia
Avenue and Highway 100 where the standard MnPASS lane terminates and the reversible
MnPASS lane begins.
Park-and-Rides
The park-and-ride usage and home location data used in this report is from Metro Transit’s
2015 Annual Regional Park-and-Ride System Report. Park-and-ride usage is tracked through a
collaborative effort between the state, county, and other regional agencies. Together these
agencies counted and recorded license plate data for vehicles parked at every park-and-ride
and park-and-pool serving the Twin Cities metropolitan area. Usage data was collected one
time for each facility within the following dates:
Tuesday, September 29–Thursday, October 1, 2014
Tuesday, October 6–Thursday, October 8, 2014
Metro Transit then obtained user origin data from the Minnesota Driver and Vehicle
Services (DVS) and the Wisconsin Department of Transportation databases to acquire
vehicle registrants’ street address, city/township, and zip code. Upon completion of address
acquisition, Metro Transit staff geocoded the home origins of approximately 16,100 system
users. Geocoding allows for a visual display of user origin distribution while protecting
individual privacy throughout the system.
There are eight park-and-ride facilities adjacent to Highway 169. Additionally, there are three
facilities on I-394 between Highway 169 and downtown Minneapolis and two facilities on
Highway 55 between the same endpoints. An inventory of these 11 park-and-ride facilities
including the number of parking spaces (capacity), usage, and adjacent highway, is listed in
Table 2. Also included is an inventory of park-and-rides that, while not located on the
Highway 169 corridor, are served by routes that travel on Highway 169.

Existing Conditions & Market Analysis 19 SRF Consulting Group, Inc. Highway 169 Mobility Study Minnesota Department of Transportation
Table 2: Highway 169, Highway 55, and I-394 Park-and-Ride 2015 Usage
Source: Metropolitan Council 2015 Annual Regional Park-and-Ride System Report
The Southbridge Crossing facility and the Eagle Creek Transit Center on Highway 169 in
Shakopee have the largest capacity of all of the facilities along the corridors with 513 and 563
parking spaces, respectively. The Louisiana Avenue Transit Center on I-394 in Saint Louis
Park has the largest draw of users and operates at 99 percent of capacity.
Park-and-Ride Facility Park-and-Ride Usage
Usage Capacity % Used
Highway 169
Marschall Road 50 442 11%
Seagate Technology 4 82 5%
Southbridge Crossing 206 513 40%
Eagle Creek Transit Center 72 563 13%
Preserve Village Mall 17 50 34%
Hopkins Transit Center 37 52 71%
Cub Foods – Plymouth (Nathan
Lane) 31 120 26%
Westwood Lutheran Church 9 40 23%
I-394
General Mills 105 123 85%
Louisiana Avenue Transit Center 328 330 99%
Park Place 35 55 64%
Highway 55
Highway 100 and Duluth Street 70 50 140%
Station 73 (Highway 55 and
County Road 73) 150 288 52%
Other Park-and-Rides with Routes that Travel on Highway 169
Highway 7 and Texas Avenue 4 10 40%
Excelsior City Hall 11 20 55%
Highway 7 and Vine Hill Road 3 27 11%
Minnetonka Boulevard and
Steele Street 6 25 24%
Minnetonka Boulevard and
Baker Road 13 16 81%

Existing Conditions & Market Analysis 20 SRF Consulting Group, Inc. Highway 169 Mobility Study Minnesota Department of Transportation
The park-and-ride facility at Highway 100 and Duluth Street on Highway 55 in Golden Valley
is one of the smallest park and rides but has the greatest utilization rate of all facilities on the
corridors. Users regularly fill and exceed the capacity of this lot, which was at 140 percent
capacity in 2015. This can occur if users park on a street near a facility with no other apparent
nearby destinations, use an overflow lot, use a shared parking lot where available park-and-
ride spaces are not clearly marked, or use any other non-traditional parking arrangement.
Figure 11 shows the home locations for the park-and-ride users in the service area. This map
demonstrates that the park-and-ride users are dispersed throughout the adjacent and nearby
communities of the park-and-ride facility, including Plymouth, Golden Valley, Saint Louis
Park, Shakopee, Savage, and Prior Lake. Few users travel distances over ten miles to reach a
park-and-ride in the study area.

Existing Conditions & Market Analysis 21 SRF Consulting Group, Inc. Highway 169 Mobility Study Minnesota Department of Transportation
Figure 11: Park-and-Ride User Home Locations
Existing Conditions & Market Analysis 22 SRF Consulting Group, Inc. Highway 169 Mobility Study Minnesota Department of Transportation
Transit-Supportive Development Patterns
There are some conditions in the corridor cities that make it difficult to provide all-day
regular-route transit service:
Development patterns are lower density and destinations are spread out, so bus stops
are less likely to be convenient for pedestrians to access many destinations.
Even in concentrated areas there are few safe and efficient pedestrian connections
between potential station locations and nearby destinations; these connections are
typically addressed through local infrastructure investments.
Development patterns in some parts of the corridor are homogenous, generating
more homogeneous types of trips and concentrating demand at key destinations and
at specific times.
Street networks are often circuitous and disconnected making transit routing
inefficient, reducing the area and destinations served by a single transit stop, and
compromising the potential to serve additional destinations through connecting bus
service.
Parking is usually free and abundant, which reduces the attractiveness of transit.
As shown in the following section, transit service in the corridor is generally express bus
service used by riders who park in the corridor and ride to their destination in downtown
Minneapolis. While transit-friendly development patterns and bicycle and pedestrian
connections support express bus service, they are essential to attracting riders to all-day
regular-route and station-to-station service.
The range of potential development changes and actions that can be taken in tandem with
transit investments has the potential to improve non-automobile access to jobs and
destinations for both residents and employees in the corridor. Planning, infrastructure
investments, and new development patterns can make transit service viable in communities
with many of the barriers listed above. This will require a coordinated effort by the cities,
counties, MnDOT, and transit providers beyond just the scope of this study and subsequent
project recommendations.
Transit Providers and Service
Four transit providers operate fixed-route bus service through the Highway 169 corridor, as
well as on I-394 and Highway 55 between Highway 169 and downtown Minneapolis.
Existing bus service is express service that operates mainly between suburban park-and-ride
locations and downtown Minneapolis with few local stops. Bus routes in the corridor
generally route from suburban locations to downtown Minneapolis in the morning peak
period, and from downtown Minneapolis to the suburbs in the evening peak period. As
shown in Table 3, there are few reverse commute trips, there is very little mid-day service,
and there is no service on nights or weekends on the transit routes operating in the
corridors.

Existing Conditions & Market Analysis 23 SRF Consulting Group, Inc. Highway 169 Mobility Study Minnesota Department of Transportation
Additional information about the transit providers – Metro Transit, SouthWest Transit,
Plymouth Metrolink, and Minnesota Valley Transit Authority - is included below. A
summary of the existing transit service and providers on Highway 169, Highway 55, and I-
394 is included in Table 3. Transit routes by provider are displayed in Figure 12. Figure 12
also includes bus routes that cross Highway 169 or operate immediately adjacent to the
Highway, which are further described in Table 4.
Mystic Lake Casino and Land to Air Express also operate shuttle service in the study area, as
described below.
Metropolitan Council/Metro Transit
Metro Transit serves as a transportation resource for the Twin Cities, offering an integrated
network of buses, light rail, and commuter trains as well as resources for those who carpool,
vanpool, walk or bike. Metro Transit is an operating division of the Metropolitan Council. The
Metropolitan Council also provides fixed-route and dial-a-ride transit services with private
contractors. Together, they provide fixed route transit service in the study area on 18 express
and suburban local bus routes.
SouthWest Transit
SouthWest Transit is the transit agency serving the communities of Carver, Chaska,
Chanhassen, and Eden Prairie. SouthWest Transit provides express bus service connecting
these communities with downtown Minneapolis, and provides service connecting suburban
communities. SouthWest Transit operates five express and suburban local routes in the project
study area.
Plymouth Metrolink
Plymouth Metrolink is the public transit agency for the City of Plymouth. Plymouth Metrolink
provides express bus service connecting Plymouth to downtown Minneapolis, including
reverse-commute service. In the project study area, Plymouth Metrolink operates five express
and local bus routes.
MVTA
The Minnesota Valley Transit Authority (MVTA) is the public transportation agency for seven
suburban communities located approximately 15 miles south of Minneapolis and St. Paul:
Savage, Prior Lake, and Shakopee in Scott County and Apple Valley, Burnsville, Eagan, and
Rosemount in Dakota County. In the study area, MVTA operates three bus routes, including
suburban circulator service and express service.
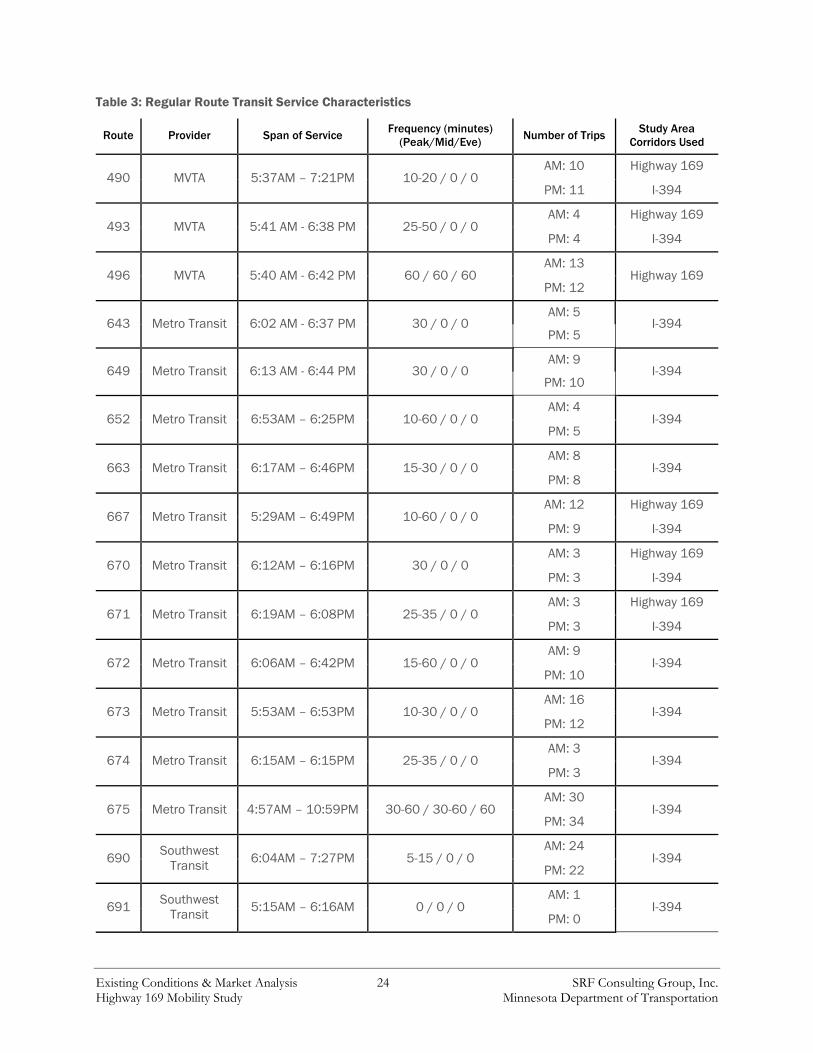
Existing Conditions & Market Analysis 24 SRF Consulting Group, Inc. Highway 169 Mobility Study Minnesota Department of Transportation
Table 3: Regular Route Transit Service Characteristics
Route Provider Span of Service Frequency (minutes)
(Peak/Mid/Eve) Number of Trips
Study Area
Corridors Used
490 MVTA 5:37AM – 7:21PM 10-20 / 0 / 0 AM: 10 Highway 169
PM: 11 I-394
493 MVTA 5:41 AM - 6:38 PM 25-50 / 0 / 0 AM: 4 Highway 169
PM: 4 I-394
496 MVTA 5:40 AM - 6:42 PM 60 / 60 / 60 AM: 13
Highway 169 PM: 12
643 Metro Transit 6:02 AM - 6:37 PM 30 / 0 / 0 AM: 5
I-394 PM: 5
649 Metro Transit 6:13 AM - 6:44 PM 30 / 0 / 0 AM: 9
I-394 PM: 10
652 Metro Transit 6:53AM – 6:25PM 10-60 / 0 / 0 AM: 4
I-394 PM: 5
663 Metro Transit 6:17AM – 6:46PM 15-30 / 0 / 0 AM: 8
I-394 PM: 8
667 Metro Transit 5:29AM – 6:49PM 10-60 / 0 / 0 AM: 12 Highway 169
PM: 9 I-394
670 Metro Transit 6:12AM – 6:16PM 30 / 0 / 0 AM: 3 Highway 169
PM: 3 I-394
671 Metro Transit 6:19AM – 6:08PM 25-35 / 0 / 0 AM: 3 Highway 169
PM: 3 I-394
672 Metro Transit 6:06AM – 6:42PM 15-60 / 0 / 0 AM: 9
I-394 PM: 10
673 Metro Transit 5:53AM – 6:53PM 10-30 / 0 / 0 AM: 16
I-394 PM: 12
674 Metro Transit 6:15AM – 6:15PM 25-35 / 0 / 0 AM: 3
I-394 PM: 3
675 Metro Transit 4:57AM – 10:59PM 30-60 / 30-60 / 60 AM: 30
I-394 PM: 34
690 Southwest
Transit 6:04AM – 7:27PM 5-15 / 0 / 0
AM: 24 I-394
PM: 22
691 Southwest
Transit 5:15AM – 6:16AM 0 / 0 / 0
AM: 1 I-394
PM: 0

Existing Conditions & Market Analysis 25 SRF Consulting Group, Inc. Highway 169 Mobility Study Minnesota Department of Transportation
Route Provider Span of Service Frequency (minutes)
(Peak/Mid/Eve) Number of Trips
Study Area
Corridors Used
692 Southwest
Transit 6:30AM – 6:07PM 15-25 / 0 / 0
AM: 4
PM: 5 I-394
698 Southwest
Transit 5:36AM – 10:39PM 30-60 / 60 / 30-60
AM: 13 I-394
PM: 20
699 Southwest
Transit 5:55AM – 6:41PM 10-20 / 0 / 0
AM: 11 I-394
PM: 11
705 Metro Transit 5:10 AM - 9:19 PM 60 / 60 / 60 AM: 14 Highway 169
PM: 17 I-394
742 Plymouth
Metrolink 5:46AM – 7:00PM 45-60 / 0 / 0
AM: 3 Highway 169
PM: 4 I-394
747 Plymouth
Metrolink 5:11AM – 6:10PM 25-30 / 0 / 0
AM: 8 I-394
PM: 9
755 Metro Transit 5:05 AM - 6:58 PM 30 / 0 / 0 AM: 12 Highway 169
PM: 13 Highway 55
756 Metro Transit 6:37AM – 5:49PM 25-35 / 0 / 0 AM: 3 Highway 169
PM: 3 I-394
772 Metro Transit 5:57AM – 6:31PM 20-30 / 0 / 0 AM: 6
I-394 PM: 5
774 Metro Transit 6:09PM -7:41PM 60 / 0 / 0 AM: 0
I-394 PM: 2
776 Metro Transit 5:25AM –6:58PM 15-30 / 0 / 0 AM: 7
I-394 PM: 7
777 Metro Transit 5:43AM – 6:48PM 25-30 / 0 / 0 AM:5
I-394 PM:5
790 Plymouth
Metrolink 5:43AM – 6:38PM 15-20 / 0 / 0
AM: 8 Highway 169
PM: 8 I-394
793 Plymouth
Metrolink 6:29AM – 7:49PM 30-60 / 0 / 0
AM: 2 Highway 169
PM: 4 I-394
795 Plymouth
Metrolink 12:11 PM- 2:58PM 0 / 120 / 0
AM: 0 I-394
PM: 2

Existing Conditions & Market Analysis 26 SRF Consulting Group, Inc. Highway 169 Mobility Study Minnesota Department of Transportation
Table 4: Transit Routes that Cross Highway 169 or Operate Adjacent to the Corridor
Route Provider Span of Service Frequency (minutes)
(Peak/Mid/Eve)
Number of
Trips
General Route in the
Corridor
9 Metro Transit 5:15AM – 1:40AM 15-20 / 30 / 30 45 in each
direction
Cedar Lake Road;
terminates at CR 73
12 Metro Transit 5:01AM – 12:37AM 15-20 / 30 / 30 24 in each
direction
Excelsior Blvd, Hopkins
Main Street; terminates
at Opportunity Partners
19 Metro Transit
2:30AM – 1:00AM 8-15 / 15 / 15-20 105 in each
direction
Highway 55 in
Minneapolis
46 Metro Transit 5:10AM – 10:48PM 15-30 / 30 / 30-
60
41 in each
direction
Lincoln Drive, Smetana
Road; terminates at
Opportunity Partners
615 Metro Transit 6:51AM – 7:43PM 60 / 60 / 60 12 in each
direction
2nd St NE, Hopkins Main
Street; terminates at
Ridgedale
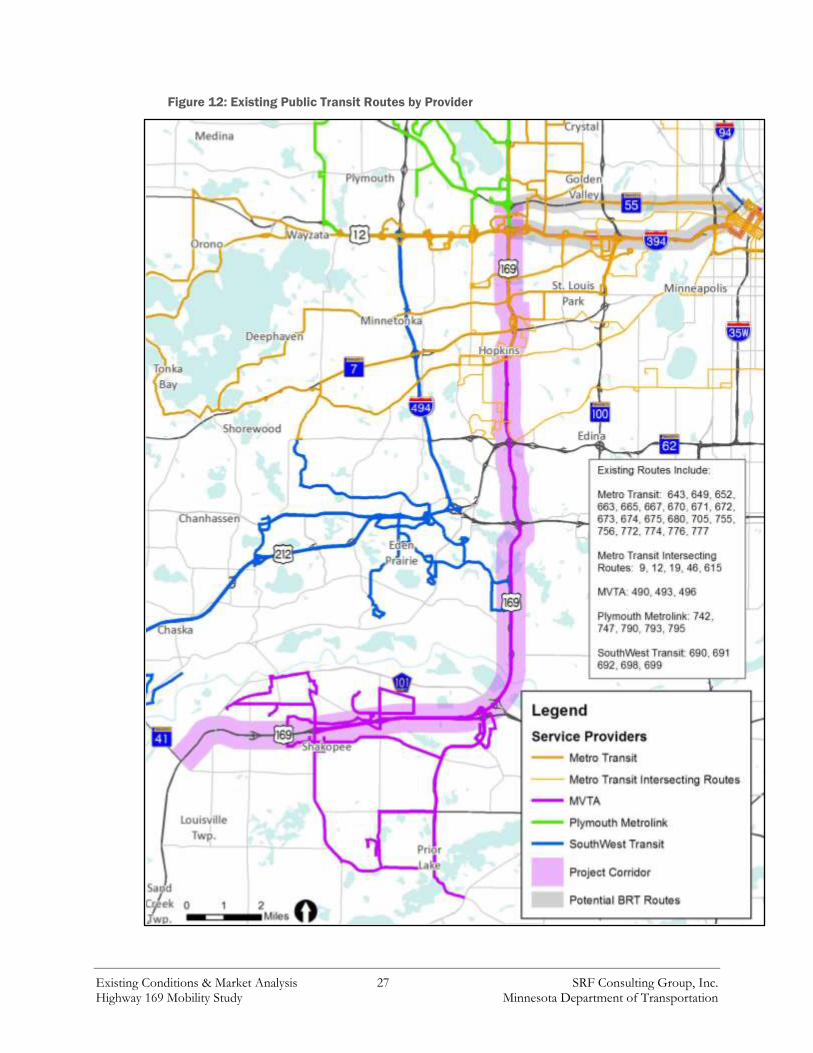
Existing Conditions & Market Analysis 27 SRF Consulting Group, Inc. Highway 169 Mobility Study Minnesota Department of Transportation
Figure 12: Existing Public Transit Routes by Provider

Existing Conditions & Market Analysis 28 SRF Consulting Group, Inc. Highway 169 Mobility Study Minnesota Department of Transportation
Mystic Lake Casino
Mystic Lake Casino offers free shuttle service to adults ages 18 and older with a valid driver’s
license or state identification card. The Casino operates 12 shuttle routes from various
locations throughout the Twin Cities, as well as from St. Cloud, Rochester, New Ulm and
their surrounding areas, as described in Table 5. All routes terminate at Mystic Lake Casino
Hotel in Prior Lake.
Table 5: Mystic Lake Casino Shuttle Routes
Shuttle Route Locations Served Frequency and Span of Service
1 Brooklyn Center, Robbinsdale, New Hope,
Golden Valley, St. Louis Park, Richfield,
Bloomington
One round trip daily
2 Shoreview, Roseville, Falcon Heights,
Minneapolis
Two round trips daily: morning
and evening
3 Brooklyn Park, Brooklyn Center, Minneapolis,
Hopkins
Two round trips daily: morning
and evening
4 St. Paul, South St. Paul, West St. Paul, Eagan,
Burnsville, Apple Valley
Two round trips daily: morning
and evening
5 Anoka, Blaine, Spring Lake Park, Fridley,
Columbia Heights, Minneapolis
Two round trips daily: morning
and evening
6 Maplewood, Little Canada, St. Paul Two round trips daily: morning
and evening
7 Minneapolis, Bloomington Two round trips daily: morning
and evening
8A New Ulm, Nicollet, North Mankato, St. Peter, Le
Sueur, Belle Plaine
One round trip daily
8C Rochester, Zumbrota, Faribault, Montgomery,
New Prague
One round trip daily
8D Cold Spring, Waite Park, St. Cloud, Monticello,
Buffalo, Rockford, Plymouth
One round trip daily
8E St. Cloud, Monticello, Buffalo, Rockford,
Plymouth
One round trip daily
9 Waseca, Owatonna, Faribault, Northfield, New
Prague
One round trip daily
Land to Air Express
Land to Air Express offers shuttle service between Mankato and St. Peter and the
Minneapolis-St. Paul Airport and downtown Minneapolis. Land to Air operates six route trips
on weekdays and three roundtrips on weekends.
Existing Conditions & Market Analysis 29 SRF Consulting Group, Inc. Highway 169 Mobility Study Minnesota Department of Transportation
Highway Operations
Physical Characteristics
Physical characteristics of Highway 169 were reviewed to identify potential obstacles to
implement changes to the corridor and guide the screening of alternatives considered. The
Highway 169 corridor varies in its design, width, and configuration throughout the study area.
The text that follows is a brief summary of the physical characteristics for the corridor.
Highway 169
The Highway 169 corridor is generally four lanes wide (two in each direction); however, there
are multiple locations where the corridor varies from this typical cross section. Extra lanes
(referred to as auxiliary lanes) exist near interchanges, shoulder widths vary between four and
twelve feet, and shoulders transition from an urban to a rural cross section without curb and
gutter south of Bren Road. Furthermore, a six lane bridge crossing the Minnesota River is one
of the main connections between Scott County and the rest of the metro area. Interchange
spacing in most of the Highway 169 corridor is not consistent with MnDOT freeway spacing
guidelines. Within the I-494/I-694 beltway, interchange spacing is recommended to be greater
than one mile; outside the beltway spacing is recommended at two miles or more. Between
Highway 62 and Highway 55 interchange spacing on Highway 169 ranges from quarter of a
mile to one mile, much closer together than the guidelines recommend.
Between Marschall Road and Bren Road, Highway 169 is divided primarily by a grassy median
with cable barriers. Between Highway 62/Highway 212 and Highway 7 and between
Minnetonka Boulevard and Highway 55, Highway 169 has a concrete median barrier.
Geometric and right-of-way (ROW) constraints vary throughout the corridor. The areas that
are most constrained have narrow shoulders (under six feet) and retaining walls to allow for
frontage roads and interchange ramps.
Traffic Characteristics
The Highway 169 corridor carries commuter-oriented traffic from southwestern Twin Cities
suburban communities to major employment centers in and near downtown Minneapolis,
commercial and industrial areas along Highway 169; and jobs at Eden Prairie Center. This
results in greater volumes of traffic in the northbound direction during the a.m. peak period
and in the southbound direction during the p.m. peak period. Reverse commuters travel in
the opposite direction to employment centers in Scott County. In addition, as one of the
major north-south connectors across the Minnesota River in the region, Highway 169
connects Scott County to region-wide destinations via major highways including I-494,
Highway 62, Highway 7, I-394 and Highway 55.
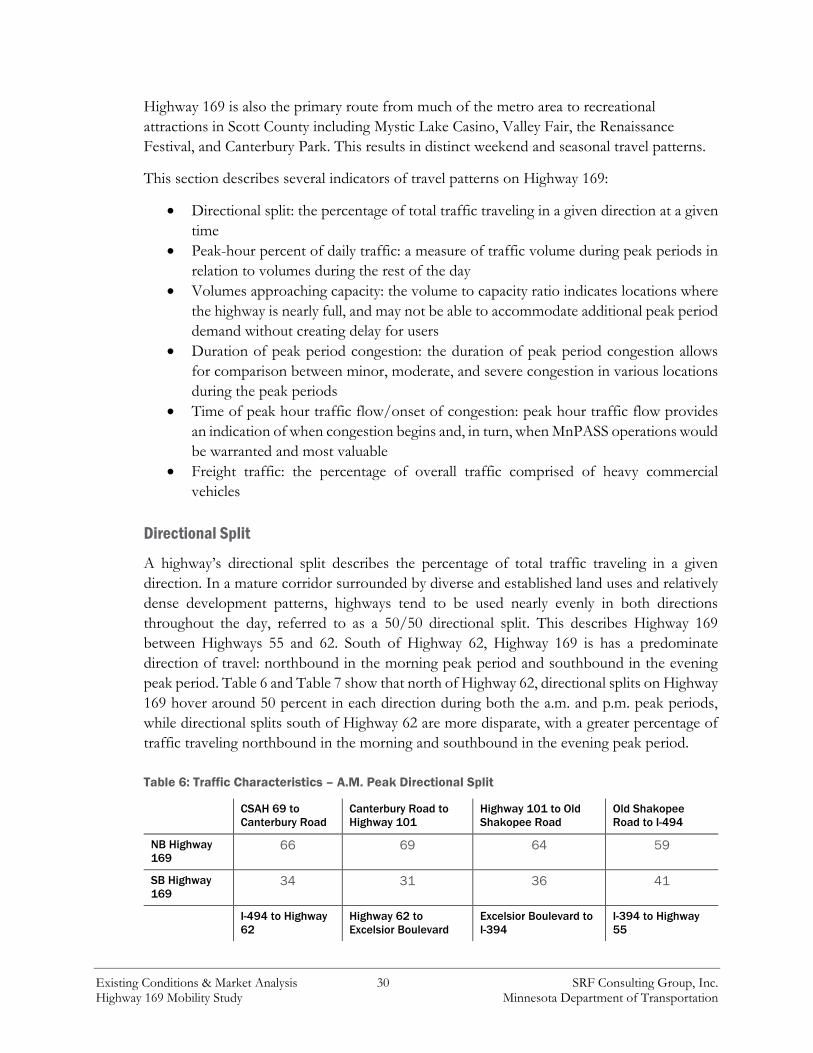
Existing Conditions & Market Analysis 30 SRF Consulting Group, Inc. Highway 169 Mobility Study Minnesota Department of Transportation
Highway 169 is also the primary route from much of the metro area to recreational
attractions in Scott County including Mystic Lake Casino, Valley Fair, the Renaissance
Festival, and Canterbury Park. This results in distinct weekend and seasonal travel patterns.
This section describes several indicators of travel patterns on Highway 169:
Directional split: the percentage of total traffic traveling in a given direction at a given
time
Peak-hour percent of daily traffic: a measure of traffic volume during peak periods in
relation to volumes during the rest of the day
Volumes approaching capacity: the volume to capacity ratio indicates locations where
the highway is nearly full, and may not be able to accommodate additional peak period
demand without creating delay for users
Duration of peak period congestion: the duration of peak period congestion allows
for comparison between minor, moderate, and severe congestion in various locations
during the peak periods
Time of peak hour traffic flow/onset of congestion: peak hour traffic flow provides
an indication of when congestion begins and, in turn, when MnPASS operations would
be warranted and most valuable
Freight traffic: the percentage of overall traffic comprised of heavy commercial
vehicles
Directional Split
A highway’s directional split describes the percentage of total traffic traveling in a given
direction. In a mature corridor surrounded by diverse and established land uses and relatively
dense development patterns, highways tend to be used nearly evenly in both directions
throughout the day, referred to as a 50/50 directional split. This describes Highway 169
between Highways 55 and 62. South of Highway 62, Highway 169 is has a predominate
direction of travel: northbound in the morning peak period and southbound in the evening
peak period. Table 6 and Table 7 show that north of Highway 62, directional splits on Highway
169 hover around 50 percent in each direction during both the a.m. and p.m. peak periods,
while directional splits south of Highway 62 are more disparate, with a greater percentage of
traffic traveling northbound in the morning and southbound in the evening peak period.
Table 6: Traffic Characteristics – A.M. Peak Directional Split
CSAH 69 to
Canterbury Road
Canterbury Road to
Highway 101
Highway 101 to Old
Shakopee Road
Old Shakopee
Road to I-494
NB Highway
169 66 69 64 59
SB Highway
169 34 31 36 41
I-494 to Highway
62
Highway 62 to
Excelsior Boulevard
Excelsior Boulevard to
I-394
I-394 to Highway
55

Existing Conditions & Market Analysis 31 SRF Consulting Group, Inc. Highway 169 Mobility Study Minnesota Department of Transportation
NB Highway
169 60 50 48 55
SB Highway
169 40 50 52 45
Table 7: Traffic Characteristics – P.M. Peak Directional Split
CSAH 69 to
Canterbury Road
Canterbury Road to
Highway 101
Highway 101 to Old
Shakopee Road
Old Shakopee
Road to I-494
NB Highway
169 33 38 36 36
SB Highway
169 67 62 64 64
I-494 to Highway
62
Highway 62 to
Excelsior Boulevard
Excelsior Boulevard to
I-394
I-394 to Highway
55
NB Highway
169 39 47 44 54
SB Highway
169 61 53 56 46
Peak-Hour Percent of Daily Traffic
Like the directional split indicator, peak-hour percent of daily traffic provides information
about the character of a corridor. In a mature corridor that is fully developed with a diversity
of land uses, like Highway 169 between Highways 62 and 55, highways are busy in both
directions all day. Traffic during the peak periods may be heaviest, but is not that much heavier
than during non-peak times. Peak-hour percentage of daily traffic tends to be higher in
developing corridors that have less diversity of land use, like Highway 169 south of Highway
62, because these corridors tend to have more residential land use that generates commuter
trips during the peak periods.
In less developed corridors the highway itself is less constrained and has less congestion, which
allows people to drive during the peak periods. In mature, congested corridors, drivers often
start their trips early or leave later in the morning or evening in order to avoid the worst
congestion. This spreads out the peak period and makes it more likely that the hour of the day
that sees the most traffic won’t be much greater than other times.
For the analysis of the percent of daily traffic that occurs during peak hours, Highway 169 was
divided into two segments.
South of Highway 62: This segment functions as a commuter corridor and peak-hour
percent of daily traffic ranges from nine to 11 percent in the peak direction
(northbound in the a.m.) and five to seven percent in the non-peak direction
(southbound in the a.m.).
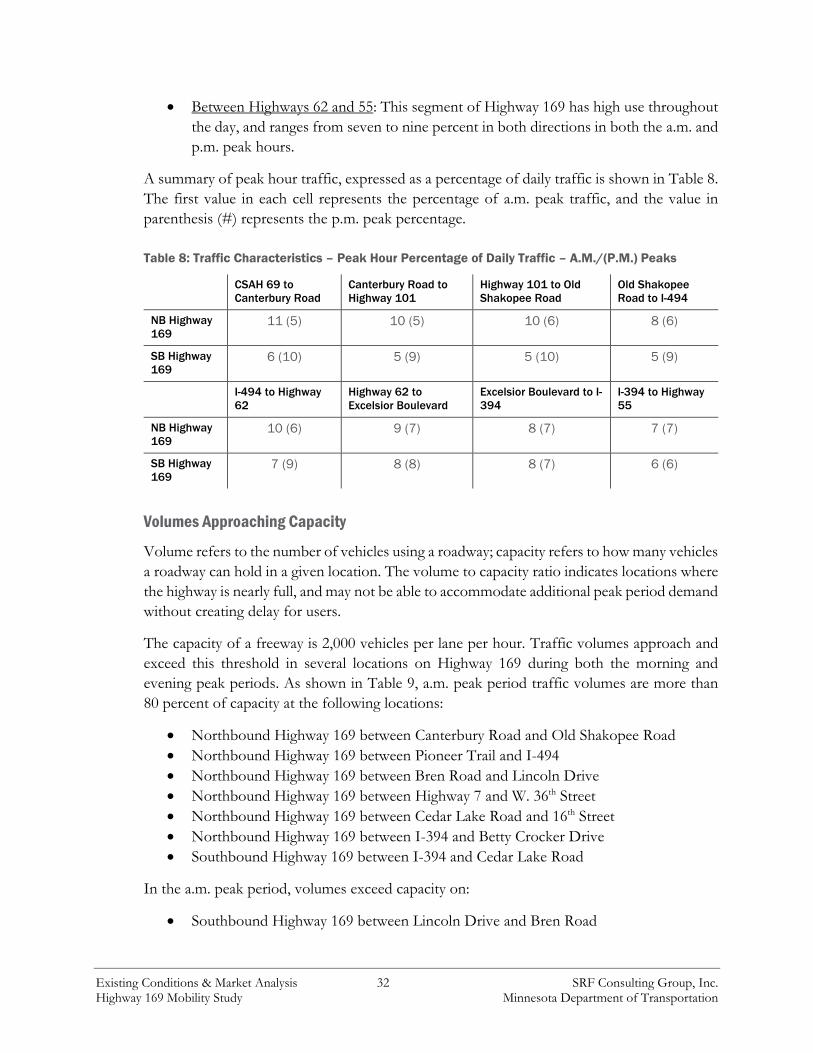
Existing Conditions & Market Analysis 32 SRF Consulting Group, Inc. Highway 169 Mobility Study Minnesota Department of Transportation
Between Highways 62 and 55: This segment of Highway 169 has high use throughout
the day, and ranges from seven to nine percent in both directions in both the a.m. and
p.m. peak hours.
A summary of peak hour traffic, expressed as a percentage of daily traffic is shown in Table 8.
The first value in each cell represents the percentage of a.m. peak traffic, and the value in
parenthesis (#) represents the p.m. peak percentage.
Table 8: Traffic Characteristics – Peak Hour Percentage of Daily Traffic – A.M./(P.M.) Peaks
CSAH 69 to
Canterbury Road
Canterbury Road to
Highway 101
Highway 101 to Old
Shakopee Road
Old Shakopee
Road to I-494
NB Highway
169 11 (5) 10 (5) 10 (6) 8 (6)
SB Highway
169 6 (10) 5 (9) 5 (10) 5 (9)
I-494 to Highway
62
Highway 62 to
Excelsior Boulevard
Excelsior Boulevard to I-
394
I-394 to Highway
55
NB Highway
169 10 (6) 9 (7) 8 (7) 7 (7)
SB Highway
169 7 (9) 8 (8) 8 (7) 6 (6)
Volumes Approaching Capacity
Volume refers to the number of vehicles using a roadway; capacity refers to how many vehicles
a roadway can hold in a given location. The volume to capacity ratio indicates locations where
the highway is nearly full, and may not be able to accommodate additional peak period demand
without creating delay for users.
The capacity of a freeway is 2,000 vehicles per lane per hour. Traffic volumes approach and
exceed this threshold in several locations on Highway 169 during both the morning and
evening peak periods. As shown in Table 9, a.m. peak period traffic volumes are more than
80 percent of capacity at the following locations:
Northbound Highway 169 between Canterbury Road and Old Shakopee Road
Northbound Highway 169 between Pioneer Trail and I-494
Northbound Highway 169 between Bren Road and Lincoln Drive
Northbound Highway 169 between Highway 7 and W. 36th Street
Northbound Highway 169 between Cedar Lake Road and 16th Street
Northbound Highway 169 between I-394 and Betty Crocker Drive
Southbound Highway 169 between I-394 and Cedar Lake Road
In the a.m. peak period, volumes exceed capacity on:
Southbound Highway 169 between Lincoln Drive and Bren Road

Existing Conditions & Market Analysis 33 SRF Consulting Group, Inc. Highway 169 Mobility Study Minnesota Department of Transportation
Table 9: Traffic Characteristics – A.M. Peak Volumes Approaching Capacity (Volume/Capacity)
CSAH 69 to
Canterbury Road
Canterbury Road to
Highway 101
Highway 101 to Old
Shakopee Road
Old Shakopee
Road to I-494
NB Highway
169 .67 .86 .82 .99
SB Highway
169 .30 .45 .47 .61
I-494 to Highway
62
Highway 62 to
Excelsior Boulevard
Excelsior Boulevard to I-
394
I-394 to Highway
55
NB Highway
169 .70 .92 .95 .82
SB Highway
169 .59 1.03 .92 .59
These locations correspond to congestion produced at bottlenecks observed on MnDOT’s
2014 Congestion Maps.
In the p.m. peak period, volumes are over 80 percent of capacity on:
Northbound Highway 169 between Bren Road and Lincoln Drive
Southbound Highway 169 between Lincoln Drive and Highway 62
Southbound Highway 169 between Pioneer Trail and CSAH 101
Southbound Highway 169 between CSAH 101 and Canterbury Road
In the p.m. peak period, volumes exceed capacity on:
Southbound Highway 169 between I-394 and Cedar Lake Road
Southbound Highway 169 between Anderson Lakes Pkwy and Pioneer Trail
Table 10: Traffic Characteristics – P.M. Peak Volumes Approaching Capacity (Volume/Capacity)
CSAH 69 to
Canterbury Road
Canterbury Road to
Highway 101
Highway 101 to Old
Shakopee Road
Old Shakopee
Road to I-494
NB Highway
169 .27 .44 .47 .65
SB Highway
169 .61 .83 .86 1.09
I-494 to Highway
62
Highway 62 to
Excelsior Boulevard
Excelsior Boulevard to
I-394
I-394 to Highway
55
NB Highway
169 .53 .86 .75 .69
SB Highway
169 .72 .89 1.00 .61
These locations correspond to congestion produced at bottlenecks observed on MnDOT’s
year 2014 Congestion Maps.

Existing Conditions & Market Analysis 34 SRF Consulting Group, Inc. Highway 169 Mobility Study Minnesota Department of Transportation
Duration of Peak Period Congestion
When congestion occurs, fewer cars can get through and drivers experience delay. Congestion
is something to be avoided, as it results in lost productivity and increased costs to drivers in
time lost, fuel consumed, and stress. Measuring the duration of peak period congestion allows
for comparison between minor, moderate, and severe congestion in various locations during
the peak periods.
The duration of peak period traffic congestion varies throughout the corridor. In the a.m. peak
period, northbound congestion is observed between Highway 101 and I-394 for one to three
hours. In the southbound direction, congestion extends from north of Highway 55 to
Excelsior Boulevard and lasts for one to two hours.
Traffic congestion in the p.m. peak hour is much greater. On northbound Highway 169,
congestion extends from Cedar Lake Road to Highway 55 for more than three hours, and
from Highway 62 to Cedar Lake Road for one to two hours. Southbound Highway 169
congestion also occurs for two to three hours between I-494 and south of Old Shakopee Road.
Southbound Highway 169 is also congested between Highway 55 and I-394 for one to two
hours during the p.m. peak.
Table 11: Traffic Characteristics – Duration of Congested Conditions During A.M. Peak
CSAH 69 to
Canterbury Road
Canterbury Road to
Highway 101
Highway 101 to Old
Shakopee Road
Old Shakopee
Road to I-494
NB Highway
169 - - 2-3 hours 1-2 hours
SB Highway
169 - - - -
I-494 to Highway
62
Highway 62 to
Excelsior Boulevard
Excelsior Boulevard to
I-394
I-394 to Highway
55
NB Highway
169 < 1 hour < 1 hour 1-2 hours -
SB Highway
169 - - 1-2 hours 1-2 hours
Table 12: Traffic Characteristics – Duration of Congested Conditions During P.M. Peak
CSAH 69 to
Canterbury Road
Canterbury Road to
Highway 101
Highway 101 to Old
Shakopee Road
Old Shakopee
Road to I-494
NB Highway
169 - - - -
SB Highway
169 - - < 1 hour 2-3 hours
I-494 to Highway
62
Highway 62 to
Excelsior Boulevard
Excelsior Boulevard to
I-394
I-394 to Highway
55
NB Highway
169 < 1 hour 1-2 hours > 3 hours > 3 hours
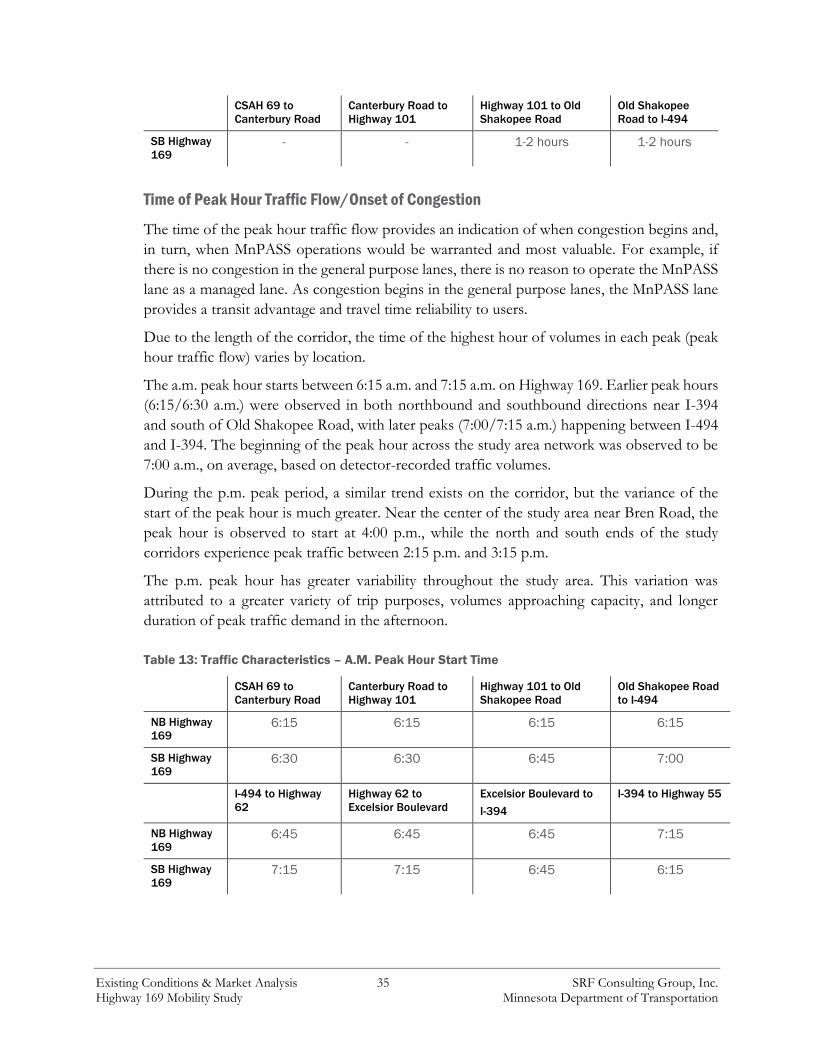
Existing Conditions & Market Analysis 35 SRF Consulting Group, Inc. Highway 169 Mobility Study Minnesota Department of Transportation
CSAH 69 to
Canterbury Road
Canterbury Road to
Highway 101
Highway 101 to Old
Shakopee Road
Old Shakopee
Road to I-494
SB Highway
169 - - 1-2 hours 1-2 hours
Time of Peak Hour Traffic Flow/Onset of Congestion
The time of the peak hour traffic flow provides an indication of when congestion begins and,
in turn, when MnPASS operations would be warranted and most valuable. For example, if
there is no congestion in the general purpose lanes, there is no reason to operate the MnPASS
lane as a managed lane. As congestion begins in the general purpose lanes, the MnPASS lane
provides a transit advantage and travel time reliability to users.
Due to the length of the corridor, the time of the highest hour of volumes in each peak (peak
hour traffic flow) varies by location.
The a.m. peak hour starts between 6:15 a.m. and 7:15 a.m. on Highway 169. Earlier peak hours
(6:15/6:30 a.m.) were observed in both northbound and southbound directions near I-394
and south of Old Shakopee Road, with later peaks (7:00/7:15 a.m.) happening between I-494
and I-394. The beginning of the peak hour across the study area network was observed to be
7:00 a.m., on average, based on detector-recorded traffic volumes.
During the p.m. peak period, a similar trend exists on the corridor, but the variance of the
start of the peak hour is much greater. Near the center of the study area near Bren Road, the
peak hour is observed to start at 4:00 p.m., while the north and south ends of the study
corridors experience peak traffic between 2:15 p.m. and 3:15 p.m.
The p.m. peak hour has greater variability throughout the study area. This variation was
attributed to a greater variety of trip purposes, volumes approaching capacity, and longer
duration of peak traffic demand in the afternoon.
Table 13: Traffic Characteristics – A.M. Peak Hour Start Time
CSAH 69 to
Canterbury Road
Canterbury Road to
Highway 101
Highway 101 to Old
Shakopee Road
Old Shakopee Road
to I-494
NB Highway
169 6:15 6:15 6:15 6:15
SB Highway
169 6:30 6:30 6:45 7:00
I-494 to Highway
62
Highway 62 to
Excelsior Boulevard
Excelsior Boulevard to
I-394
I-394 to Highway 55
NB Highway
169 6:45 6:45 6:45 7:15
SB Highway
169 7:15 7:15 6:45 6:15

Existing Conditions & Market Analysis 36 SRF Consulting Group, Inc. Highway 169 Mobility Study Minnesota Department of Transportation
Table 14: Traffic Characteristics – P.M. Peak Hour Start Time
CSAH 69 to
Canterbury Road
Canterbury Road to
Highway 101
Highway 101 to Old
Shakopee Road
Old Shakopee Road
to I-494
NB Highway
169 4:15 4:15 4:15 4:00
SB Highway
169 3:00 3:00 3:00 3:00
I-494 to Highway
62
Highway 62 to
Excelsior Boulevard
Excelsior Boulevard to
I-394
I-394 to Highway 55
NB Highway
169 3:45 3:45 3:00 2:15
SB Highway
169 3:30 3:45 3:45 3:00
Freight Traffic
To better understand use of Highway 169 by freight carriers, heavy commercial traffic counts
were reviewed for the study area. Heavy commercial traffic volumes are from the most recent
available data on the MnDOT Traffic Mapping Analysis Tool (Draft 2014). These volumes
are summarized in Table 15.
Available data suggests commercial vehicles comprise a significant percentage of traffic on
Highway 169, particularly on the segment south of the Minnesota River. Average weekday
commercial vehicle volumes along the Highway 169 corridor range from 3,000 to 6,000, while
the daily percentage of traffic ranges from 4.5 to 9.7 percent. Between I-494 and Highway 55
the percentage of commercial vehicles ranges from 4.5 to 5.3 percent, while volumes between
range from 6.2 to 9.7 percent from I-494 to Marschall Road.
Table 15: Share of Heavy Commercial Volumes on Highway 169
Roadway Percent Passenger Car Share
(volume)
Percent Heavy Commercial
Vehicle Share (volume)
CSAH 69 to
Canterbury Road 90.3%-92.6% (31,000-46,000) 7.4%–9.7% (3,000-3,400)
Canterbury Road to
Highway 101 93.4% (68,000) 6.6% (4,500)
Highway 101 to Old
Shakopee Road 93.8% (103,000) 6.2% (6,400)
Old Shakopee Road
to I-494 93.4%-93.8% (90,000-97,000) 6.2%-6.6% (5,900-6,000)
I-494 to Highway
62 94.7%-94.8% (64,000-66,000) 5.2%-5.3% (3,300-3,500)
Highway 62 to
Excelsior Boulevard 94.9%-95.1% (94,000-98,000) 4.9%-5.1% (4,800)
Excelsior Boulevard
to I-394 94.9%-95.0% (97,000-106,000) 5.0%-5.1% (4,900-5,300)

Existing Conditions & Market Analysis 37 SRF Consulting Group, Inc. Highway 169 Mobility Study Minnesota Department of Transportation
I-394 to Highway
55 94.5%-95.0% (94,000-107,000) 4.5%-5.0% (4,200-5,300)
Congestion Levels and Bottleneck Locations
This analysis provides a detailed look at specific locations in the corridor that might be
candidates for spot improvements. Bottlenecks are places where design, volume, or capacity
issues cause congestion. Six causes of congestion were identified along the study corridor:
Entering traffic
Ramp-to-ramp weaving
Substandard geometry
Exit ramp capacity
Lane drops
Mainline weaving
These causes of congestion can lead to bottlenecks. Table 16 through
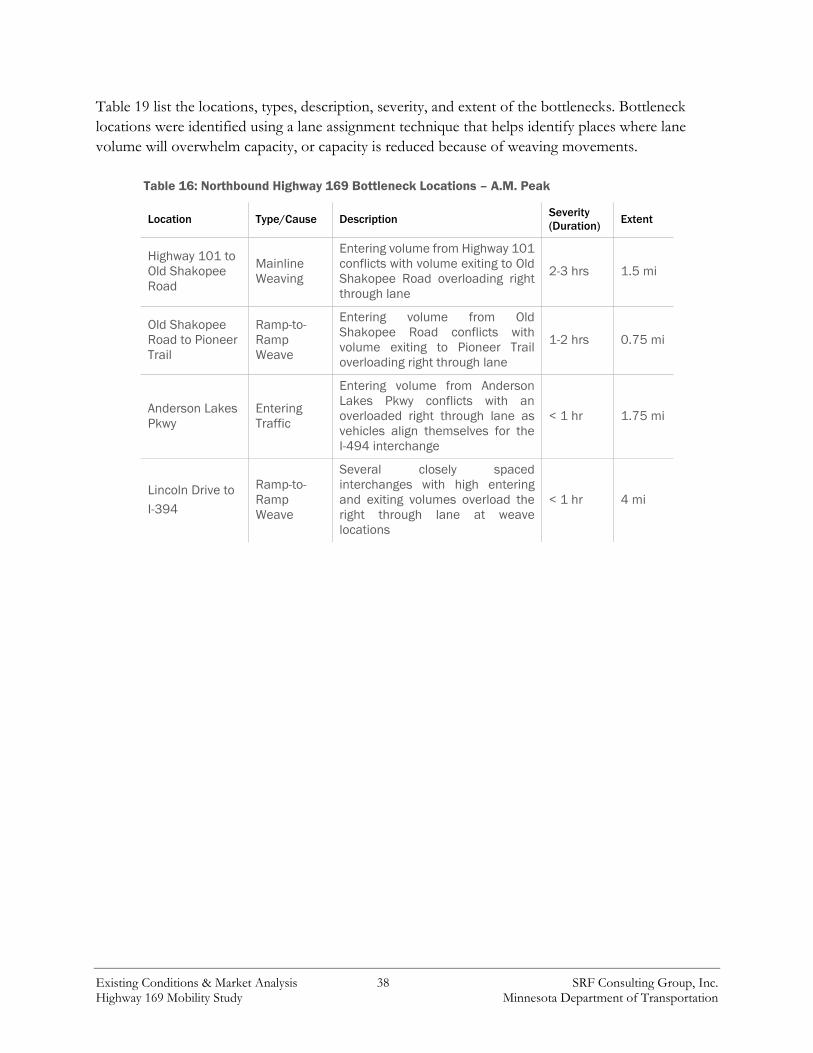
Existing Conditions & Market Analysis 38 SRF Consulting Group, Inc. Highway 169 Mobility Study Minnesota Department of Transportation
Table 19 list the locations, types, description, severity, and extent of the bottlenecks. Bottleneck
locations were identified using a lane assignment technique that helps identify places where lane
volume will overwhelm capacity, or capacity is reduced because of weaving movements.
Table 16: Northbound Highway 169 Bottleneck Locations – A.M. Peak
Location Type/Cause Description Severity
(Duration) Extent
Highway 101 to
Old Shakopee
Road
Mainline
Weaving
Entering volume from Highway 101
conflicts with volume exiting to Old
Shakopee Road overloading right
through lane
2-3 hrs 1.5 mi
Old Shakopee
Road to Pioneer
Trail
Ramp-to-
Ramp
Weave
Entering volume from Old
Shakopee Road conflicts with
volume exiting to Pioneer Trail
overloading right through lane
1-2 hrs 0.75 mi
Anderson Lakes
Pkwy
Entering
Traffic
Entering volume from Anderson
Lakes Pkwy conflicts with an
overloaded right through lane as
vehicles align themselves for the
I-494 interchange
< 1 hr 1.75 mi
Lincoln Drive to
I-394
Ramp-to-
Ramp
Weave
Several closely spaced
interchanges with high entering
and exiting volumes overload the
right through lane at weave
locations
< 1 hr 4 mi
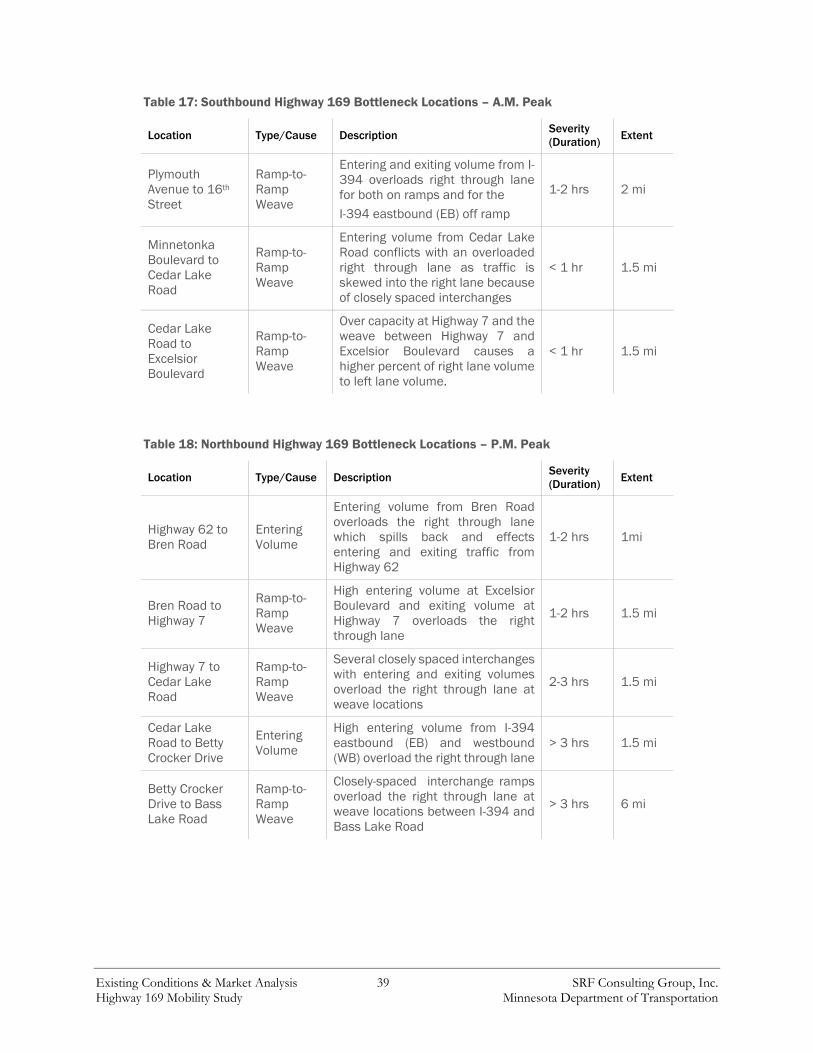
Existing Conditions & Market Analysis 39 SRF Consulting Group, Inc. Highway 169 Mobility Study Minnesota Department of Transportation
Table 17: Southbound Highway 169 Bottleneck Locations – A.M. Peak
Location Type/Cause Description Severity
(Duration) Extent
Plymouth
Avenue to 16th
Street
Ramp-to-
Ramp
Weave
Entering and exiting volume from I-
394 overloads right through lane
for both on ramps and for the
I-394 eastbound (EB) off ramp
1-2 hrs 2 mi
Minnetonka
Boulevard to
Cedar Lake
Road
Ramp-to-
Ramp
Weave
Entering volume from Cedar Lake
Road conflicts with an overloaded
right through lane as traffic is
skewed into the right lane because
of closely spaced interchanges
< 1 hr 1.5 mi
Cedar Lake
Road to
Excelsior
Boulevard
Ramp-to-
Ramp
Weave
Over capacity at Highway 7 and the
weave between Highway 7 and
Excelsior Boulevard causes a
higher percent of right lane volume
to left lane volume.
< 1 hr 1.5 mi
Table 18: Northbound Highway 169 Bottleneck Locations – P.M. Peak
Location Type/Cause Description Severity
(Duration) Extent
Highway 62 to
Bren Road
Entering
Volume
Entering volume from Bren Road
overloads the right through lane
which spills back and effects
entering and exiting traffic from
Highway 62
1-2 hrs 1mi
Bren Road to
Highway 7
Ramp-to-
Ramp
Weave
High entering volume at Excelsior
Boulevard and exiting volume at
Highway 7 overloads the right
through lane
1-2 hrs 1.5 mi
Highway 7 to
Cedar Lake
Road
Ramp-to-
Ramp
Weave
Several closely spaced interchanges
with entering and exiting volumes
overload the right through lane at
weave locations
2-3 hrs 1.5 mi
Cedar Lake
Road to Betty
Crocker Drive
Entering
Volume
High entering volume from I-394
eastbound (EB) and westbound
(WB) overload the right through lane
> 3 hrs 1.5 mi
Betty Crocker
Drive to Bass
Lake Road
Ramp-to-
Ramp
Weave
Closely-spaced interchange ramps
overload the right through lane at
weave locations between I-394 and
Bass Lake Road
> 3 hrs 6 mi
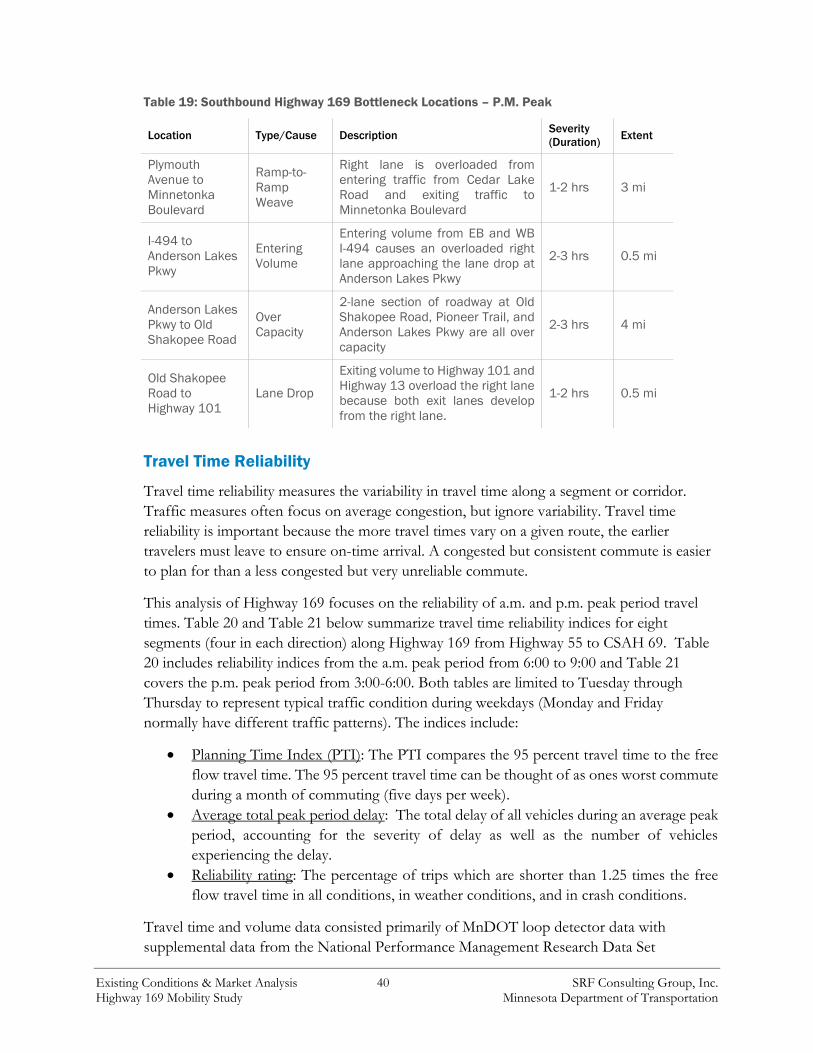
Existing Conditions & Market Analysis 40 SRF Consulting Group, Inc. Highway 169 Mobility Study Minnesota Department of Transportation
Table 19: Southbound Highway 169 Bottleneck Locations – P.M. Peak
Location Type/Cause Description Severity
(Duration) Extent
Plymouth
Avenue to
Minnetonka
Boulevard
Ramp-to-
Ramp
Weave
Right lane is overloaded from
entering traffic from Cedar Lake
Road and exiting traffic to
Minnetonka Boulevard
1-2 hrs 3 mi
I-494 to
Anderson Lakes
Pkwy
Entering
Volume
Entering volume from EB and WB
I-494 causes an overloaded right
lane approaching the lane drop at
Anderson Lakes Pkwy
2-3 hrs 0.5 mi
Anderson Lakes
Pkwy to Old
Shakopee Road
Over
Capacity
2-lane section of roadway at Old
Shakopee Road, Pioneer Trail, and
Anderson Lakes Pkwy are all over
capacity
2-3 hrs 4 mi
Old Shakopee
Road to
Highway 101
Lane Drop
Exiting volume to Highway 101 and
Highway 13 overload the right lane
because both exit lanes develop
from the right lane.
1-2 hrs 0.5 mi
Travel Time Reliability
Travel time reliability measures the variability in travel time along a segment or corridor.
Traffic measures often focus on average congestion, but ignore variability. Travel time
reliability is important because the more travel times vary on a given route, the earlier
travelers must leave to ensure on-time arrival. A congested but consistent commute is easier
to plan for than a less congested but very unreliable commute.
This analysis of Highway 169 focuses on the reliability of a.m. and p.m. peak period travel
times. Table 20 and Table 21 below summarize travel time reliability indices for eight
segments (four in each direction) along Highway 169 from Highway 55 to CSAH 69. Table
20 includes reliability indices from the a.m. peak period from 6:00 to 9:00 and Table 21
covers the p.m. peak period from 3:00-6:00. Both tables are limited to Tuesday through
Thursday to represent typical traffic condition during weekdays (Monday and Friday
normally have different traffic patterns). The indices include:
Planning Time Index (PTI): The PTI compares the 95 percent travel time to the free
flow travel time. The 95 percent travel time can be thought of as ones worst commute
during a month of commuting (five days per week).
Average total peak period delay: The total delay of all vehicles during an average peak
period, accounting for the severity of delay as well as the number of vehicles
experiencing the delay.
Reliability rating: The percentage of trips which are shorter than 1.25 times the free
flow travel time in all conditions, in weather conditions, and in crash conditions.
Travel time and volume data consisted primarily of MnDOT loop detector data with
supplemental data from the National Performance Management Research Data Set
Existing Conditions & Market Analysis 41 SRF Consulting Group, Inc. Highway 169 Mobility Study Minnesota Department of Transportation
(NPMRDS). Crash data came from the Minnesota Crash Mapping Analysis Tool
(MnCMAT) and weather data from the National Oceanic and Atmospheric Administration
(NOAA). The data was aggregated into 1- minute time intervals and analyzed using tools
developed through the Strategic Highway Research Program 2 (SHRP 2).

Existing Conditions & Market Analysis 42 SRF Consulting Group, Inc. Highway 169 Mobility Study Minnesota Department of Transportation
Table 20: Highway 169 Travel Time Reliability during the a.m. Peak Period (06:00 – 09:00)
PTI Delay
(hr) RR
Weather
RR
Crash
RR
Segment PTI
Delay
(hr) RR
Weather
RR
Crash
RR
1.72 69 89% 78% 50% 1.64 56 89% 72% 38%
1.48 26 91% 78% 47% 1.80 71 88% 68% 14%
1.05 3 99% 93% N/A 2.05 199 54% 37% 13%
1.22 16 95% 78% 47% 2.94 291 53% 36% 13%
Table 21: Highway 169 Travel Time Reliability during the P.M. Peak Period (3:00 – 6:00)
PTI Delay
(hr) RR
Weather
RR
Crash
RR
Segment PTI
Delay
(hr) RR
Weather
RR
Crash
RR
1.33 44 92% 77% 33% 3.42 446 41% 19% 16%
2.30 78 89% 75% 67% 2.20 136 76% 51% 8%
2.06 162 66% 51% 50% 1.00 2 100% 99% N/A
1.40 60 91% 81% 70% 1.30 39 95% 87% 50%
Notes: Date reflects Tuesday – Thursday conditions for a.m. and p.m. peak periods
Planning Time Index (PTI) = 𝑇𝑇95%
𝑇𝑇𝐹𝑟𝑒𝑒𝐹𝑙𝑜𝑤
Reliability Rating (RR) = 𝑇𝑟𝑖𝑝𝑠𝑇𝑇<1.25∗𝐹𝐹𝑇𝑇
𝑇𝑟𝑖𝑝𝑠𝑡𝑜𝑡𝑎𝑙
Delay is the total delay (for all vehicles) during an average peak period in hours
N/A = Insufficient Data to generate reliability measures
SB
B
B NB
Excelsior
Old Shakopee
CH 69
SB
NB
Excelsior
Old Shakopee
CH 69
Existing Conditions & Market Analysis 43 SRF Consulting Group, Inc. Highway 169 Mobility Study Minnesota Department of Transportation
The least reliable segments are italicized in Table 20 and Table 21. They include northbound
Highway 169 between County Highway 69 and Excelsior Boulevard in the a.m. peak period;
and in the p.m. peak period southbound between Excelsior Boulevard and Old Shakopee
Road and northbound between I-494 and Highway 55. These segments all experience large
amounts of delay and have reliability ratios below 70 percent. Crashes and weather
conditions lead to reliability ratios generally under 50 percent for these segments.
The Minnesota River crossing is a bottleneck for a.m. peak period traffic heading
northbound and for p.m. peak period traffic heading southbound. In addition, commuters
experience heavy congestion approaching Anderson Lakes Pkwy from the south during the
a.m. peak and approaching I-394 and Highway 55 from the south in the p.m. peak.
High Crash Areas
Crashes hurt people, cost money, and can disrupt highway operations, causing congestion.
MnDOT strives to increase safety and reduce the number of crashes on the highway system.
Crash patterns provide valuable insight into potential locations and types of projects that could
improve traffic flow and safety.
A safety analysis was performed on the Highway 169 corridor within the study area. The
Highway 169 corridor study area includes 24 interchanges, 11 of which are ranked in the top
200 statewide interchanges by crash cost in the 2013 MnDOT Interchange Crash Toolkit. Two of
these interchanges were in the top 50 highest crash cost interchanges.
The probability of crashes increases when congestion is present, driver confusion exists,
and/or driver expectancy is not met. Two individual safety assessments of the corridors were
completed using standard MnDOT reporting processes and covering crash data from the
calendar years 2010 to 2014; the Mainline Assessment assesses crash density (crashes per mile
per year) and crash rates, and the Interchange Assessment assess crash costs and crash rates.
Highway 169 Mainline Assessment
To evaluate the Highway 169 crash data and road characteristics, crashes were categorized into
interchange or mainline segment clusters. Interchange clusters included all crash data in the
interchange influence area including the freeway mainline, the ramps, and the ramp
intersections. Segment clusters included mainline crash data between interchanges and for
interchange clusters, where only the mainline crash data was included. The mainline
assessment included calculating crash density and crash rates.
To avoid skewed crash rates due to analyzing short segments, crash data was aggregated into
eight crash data segments along Highway 169. Table 22 provides a summary of the crash data
characteristics within each of the crash data segments.
Results of the mainline assessment indicate that four of the Highway 169 segments have a
crash rate greater than the average crash rate for segments with similar characteristics and two
of the segments have a crash rate greater than the critical crash rate (see Table 22, italicized).
It should be noted that a higher than average crash rate does not necessarily indicate a

Existing Conditions & Market Analysis 44 SRF Consulting Group, Inc. Highway 169 Mobility Study Minnesota Department of Transportation
significant crash problem. Therefore, the crash rates were compared to the critical crash rates
to determine the statistical significance of the above average crash rates. If the calculated crash
rate is below the critical crash rate, crashes that occurred are typically due to the random nature
of crashes and are not necessarily the result of a geometric design issue. However, a crash rate
that is greater than the critical crash rate indicates that there may be a geometric design or
other issues and warrants further review or mitigation.
Table 22: Highway 169 Crash Data (2010 – 2014)
Se
gm
en
t #
Segment
Extent
Le
ng
th
Free-way
Type To
tal
Cra
sh
es
AADT
Crash
Density
(Crashes/
Mi per Yr)
Crash Rate
(Crashes per
million VMT)
Crash Rate
vs Average
/ Critical
Crash Rate
1 I-394 through
Highway 55 1.2
4-Lane
Urban 296 87,000 49.3 1.55 > Critical
2
Excelsior
Boulevard to I-
394
3.4 4-Lane
Urban 383 78,000 22.5 0.79
> Average
< Critical
3
Highway 62 to
Excelsior
Boulevard
2.5 4-Lane
Urban 308 69,000 24.6 .98
> Average
< Critical
4 I-494 to
Highway 62 2.4
4-Lane
Urban 293 66,000 24.4 1.01 > Critical
5 Old Shakopee
Road to I-494 3.6
4-Lane
Urban 401 84,000 22.3 0.73 < Average
6
Highway 101
to Old
Shakopee
Road
1.4 6-Lane
Urban 170 89,000 24.3 0.75 < Average
7
Canterbury
Road to
Highway 101
3.3 4-Lane
Suburban 251 66,000 15.2 0.63 < Average
8
CSAH 69 to
Canterbury
Road
4.4 4-Lane
Suburban 191 38,000 8.7 0.63 < Average
(1) Source: MnDOT Metro Traffic MnCMAT
(2) AADT represents weighted average along segment
Existing Conditions & Market Analysis 45 SRF Consulting Group, Inc. Highway 169 Mobility Study Minnesota Department of Transportation
Interchange Assessment
The interchange assessment reviewed corridor mainline crashes within the 24 interchange
influence areas in the study area and included the freeway mainline, the ramps, and the ramp
intersections. The analyses used the standardized assessment zones within the 2013
Transportation Information Systems database Critical Intersections/Interchanges crash spreadsheet.
Table 23 identifies the 11 interchanges in the study area listed in the 2013 MnDOT Interchange
Crash Toolkit, which lists the top 200 highest-crash interchanges by crash cost. The collective
crash costs for the 11 interchanges amount to an average of $18.56 million dollars per year
from 2009-2013. Four interchanges within the study corridor have a crash rate greater than
the critical crash rate (see Table 23, italicized). These interchanges listed in order of greatest
crash cost were; I-494, CSAH 101, Canterbury Road, and CSAH 17.
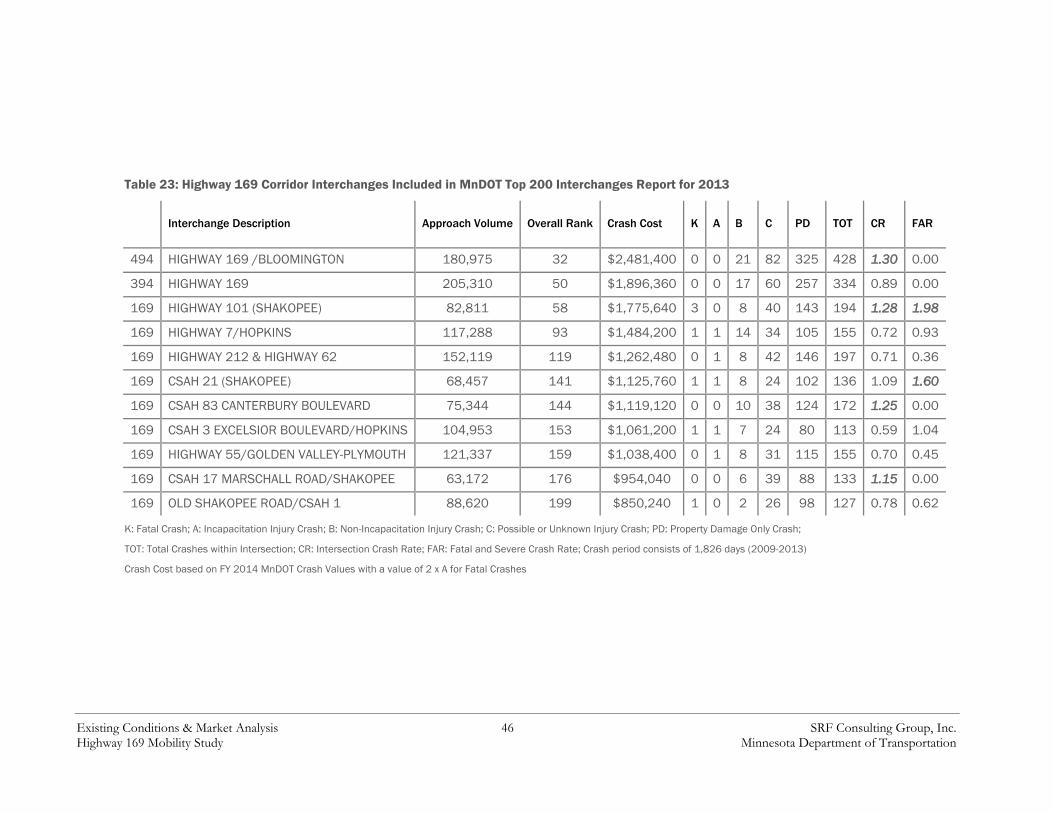
Existing Conditions & Market Analysis 46 SRF Consulting Group, Inc. Highway 169 Mobility Study Minnesota Department of Transportation
Table 23: Highway 169 Corridor Interchanges Included in MnDOT Top 200 Interchanges Report for 2013
Interchange Description Approach Volume Overall Rank Crash Cost K A B C PD TOT CR FAR
494 HIGHWAY 169 /BLOOMINGTON 180,975 32 $2,481,400 0 0 21 82 325 428 1.30 0.00
394 HIGHWAY 169 205,310 50 $1,896,360 0 0 17 60 257 334 0.89 0.00
169 HIGHWAY 101 (SHAKOPEE) 82,811 58 $1,775,640 3 0 8 40 143 194 1.28 1.98
169 HIGHWAY 7/HOPKINS 117,288 93 $1,484,200 1 1 14 34 105 155 0.72 0.93
169 HIGHWAY 212 & HIGHWAY 62 152,119 119 $1,262,480 0 1 8 42 146 197 0.71 0.36
169 CSAH 21 (SHAKOPEE) 68,457 141 $1,125,760 1 1 8 24 102 136 1.09 1.60
169 CSAH 83 CANTERBURY BOULEVARD 75,344 144 $1,119,120 0 0 10 38 124 172 1.25 0.00
169 CSAH 3 EXCELSIOR BOULEVARD/HOPKINS 104,953 153 $1,061,200 1 1 7 24 80 113 0.59 1.04
169 HIGHWAY 55/GOLDEN VALLEY-PLYMOUTH 121,337 159 $1,038,400 0 1 8 31 115 155 0.70 0.45
169 CSAH 17 MARSCHALL ROAD/SHAKOPEE 63,172 176 $954,040 0 0 6 39 88 133 1.15 0.00
169 OLD SHAKOPEE ROAD/CSAH 1 88,620 199 $850,240 1 0 2 26 98 127 0.78 0.62
K: Fatal Crash; A: Incapacitation Injury Crash; B: Non-Incapacitation Injury Crash; C: Possible or Unknown Injury Crash; PD: Property Damage Only Crash;
TOT: Total Crashes within Intersection; CR: Intersection Crash Rate; FAR: Fatal and Severe Crash Rate; Crash period consists of 1,826 days (2009-2013)
Crash Cost based on FY 2014 MnDOT Crash Values with a value of 2 x A for Fatal Crashes

Existing Conditions & Market Analysis 47 SRF Consulting Group, Inc. Highway 169 Mobility Study Minnesota Department of Transportation
Market Analysis
The INRIX origin-destination data provides information on travel behavior and travel
patterns that are difficult to observe from a single or even multiple locations. The data
provides general characteristics about trips using the corridor, variations on travel patterns
within the corridor, and patterns of trips that start or end near Highway 169. The data gives
some indication of how effective certain kinds of improvements or solutions may be and
where they could be located to optimally serve trips in the corridor.
Methodology
Data Sources
INRIX is a software/data company that provides historical and real-time traffic information,
traffic forecasts, travel times and traffic counts. The origin-destination (O-D) data provided
by INRIX indicate real-world traffic patterns along the Highway 169.
The time range of INRIX data used in this study is from February 2015 to April 2015. The
data include individual trip information such as providers, types of vehicle, trip origins, trip
destinations, etc. In addition, the detailed trip path was provided in the format of XY
coordinates and time. The time intervals were usually from 5 seconds to 3 minutes, giving
detailed accounts of trip destinations and travel times.
Using the INRIX data, several analyses were conducted to better understand the travel
patterns of the corridor, major origins and destinations, and station area activities. This could
facilitate modeling, validation and design of the proposed Highway 169 alternative
improvements under consideration.
Travel Pattern Investigation
The availability of traveler origin and destination data presents an opportunity to answer
detailed questions about current travel patterns around the Highway 169 study area. Analysis
of the data provides several types of information with application to the study:
Travel patterns trips on a given segment, such as the Bloomington Ferry Bridge, and
their origins and destinations in both directions and during peak and off-peak periods.
This information contributes to determination of appropriate managed lane or
transitway termini and validation of the traffic model’s prediction of zonal activity.
The number of drivers that are avoiding congestion on Highway 169 by using other
roads and highways, and which roads and highways these travelers use, which allows
for an estimate of potential trips attracted to Highway 169 if capacity was expanded.

Existing Conditions & Market Analysis 48 SRF Consulting Group, Inc. Highway 169 Mobility Study Minnesota Department of Transportation
On- and off-ramp travel patterns along Highway 169 in each direction during the
morning and afternoon peak periods. This information helps to identify segments of
Highway 169 with predominately longer trip lengths that may be appropriate for
managed lanes, or locations with large proportion of short trips traveling only a few
interchanges before exiting.
Locations where traveler destinations are clustered in the corridor and how many trips
are going to various locations. This information aids in refining proposed transitway
station locations and targeting project outreach.
Incoming and outgoing trips within a given distance of possible transitway station
locations, which help to determine the relationship between travel patterns and
proposed transitway station locations and refine station locations as appropriate.
Travel patterns along potential transit stations for Green Line and American
Boulevard Arterial BRT service that shows the relationship between travel patterns
and proposed transitways connecting to potential Highway 169 transit service.
Each of these data analyses is detailed in the following sections.
Travel Patterns using Bloomington Ferry Bridge
Figure 13Figure 14 show the travel pattern across the Bloomington Ferry Bridge for both
directions in the a.m. peak period. Of the trips using northbound Highway 169 at the bridge
during the a.m. peak hour, 39 percent are from the Highway 169 mainline and 53 percent are
merging trips from CSAH 21 and Highway 101 in the south, 6 percent are from Highway
101 to the north, and 2 percent are from other locations. North of the river, 32 percent of
trips are taking I-494 east and west to reach their final destinations while the majority (46
percent) stay on Highway 169 north of Highway 62. 18 percent of the trips end at other local
destinations along the corridor (referred to in the figures as the percent “remaining”).
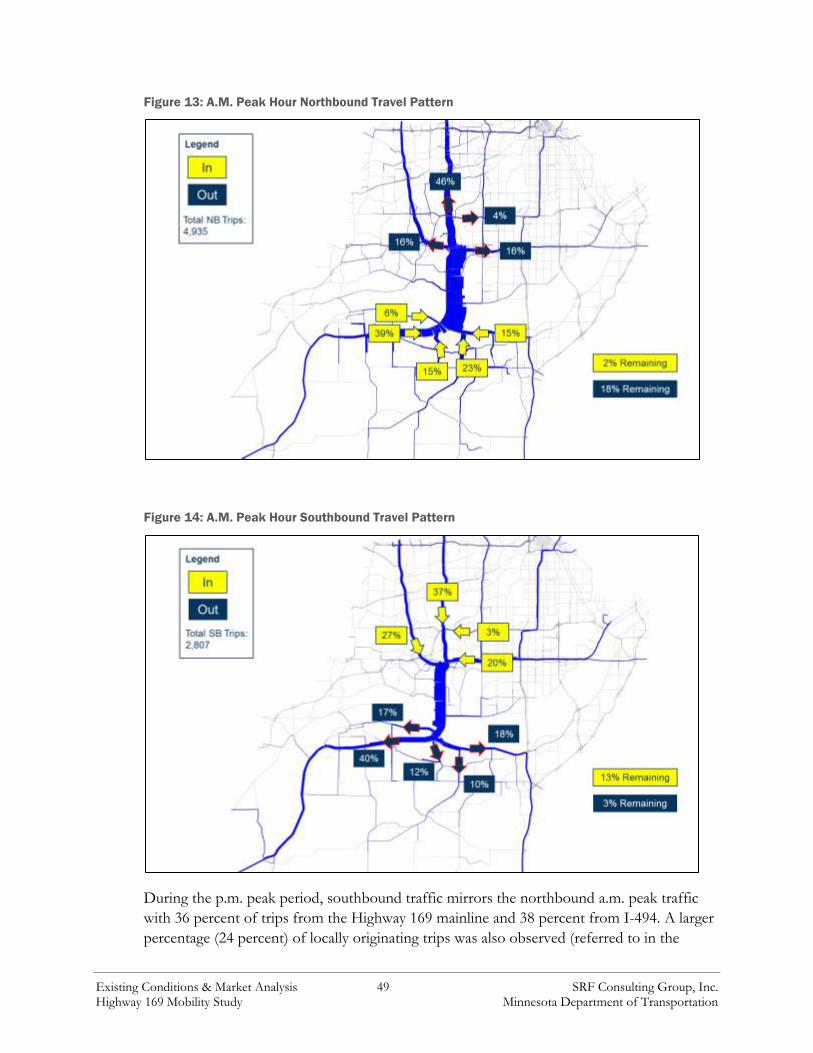
Existing Conditions & Market Analysis 49 SRF Consulting Group, Inc. Highway 169 Mobility Study Minnesota Department of Transportation
Figure 13: A.M. Peak Hour Northbound Travel Pattern
Figure 14: A.M. Peak Hour Southbound Travel Pattern
During the p.m. peak period, southbound traffic mirrors the northbound a.m. peak traffic
with 36 percent of trips from the Highway 169 mainline and 38 percent from I-494. A larger
percentage (24 percent) of locally originating trips was also observed (referred to in the

Existing Conditions & Market Analysis 50 SRF Consulting Group, Inc. Highway 169 Mobility Study Minnesota Department of Transportation
figures as the percent “remaining”). Once they pass the bridge, 38 percent of trips stay on
Highway 169 and 54 percent take Highway 13 and CSAH 21, as displayed in Figure 15 and
Figure 16.
Figure 15: P.M. Peak Hour Northbound Travel Pattern
Figure 16: P.M. Peak Hour Southbound Travel Pattern
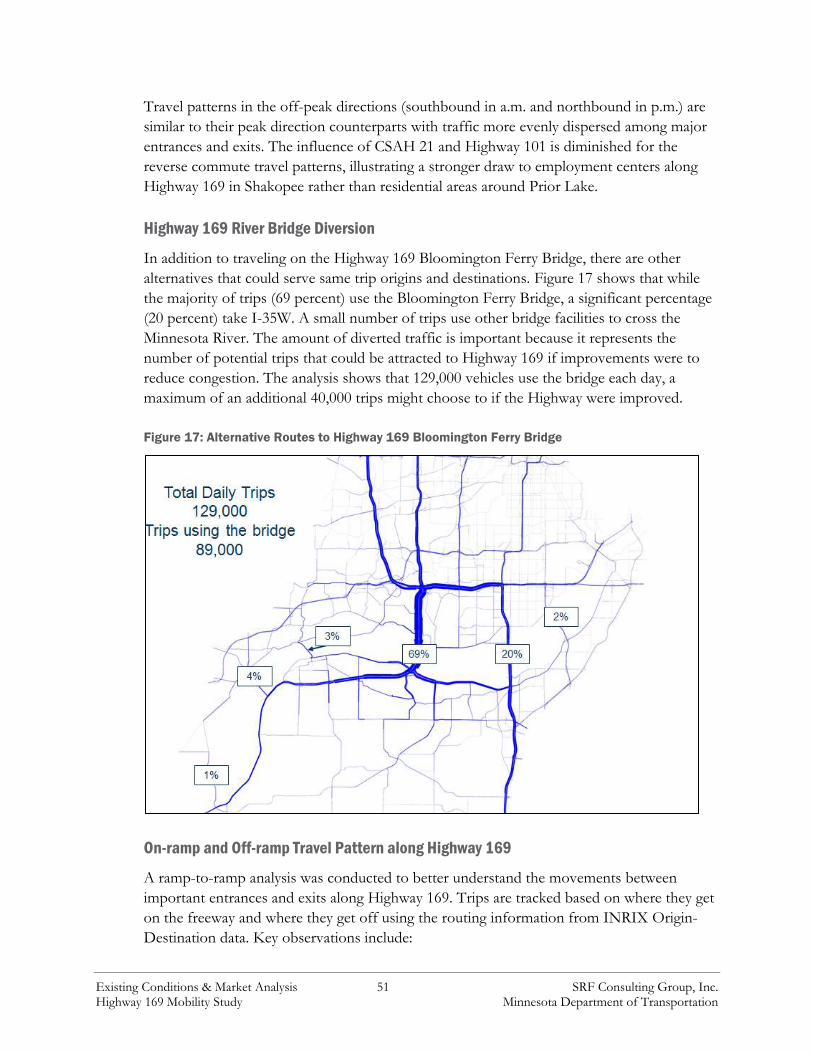
Existing Conditions & Market Analysis 51 SRF Consulting Group, Inc. Highway 169 Mobility Study Minnesota Department of Transportation
Travel patterns in the off-peak directions (southbound in a.m. and northbound in p.m.) are
similar to their peak direction counterparts with traffic more evenly dispersed among major
entrances and exits. The influence of CSAH 21 and Highway 101 is diminished for the
reverse commute travel patterns, illustrating a stronger draw to employment centers along
Highway 169 in Shakopee rather than residential areas around Prior Lake.
Highway 169 River Bridge Diversion
In addition to traveling on the Highway 169 Bloomington Ferry Bridge, there are other
alternatives that could serve same trip origins and destinations. Figure 17 shows that while
the majority of trips (69 percent) use the Bloomington Ferry Bridge, a significant percentage
(20 percent) take I-35W. A small number of trips use other bridge facilities to cross the
Minnesota River. The amount of diverted traffic is important because it represents the
number of potential trips that could be attracted to Highway 169 if improvements were to
reduce congestion. The analysis shows that 129,000 vehicles use the bridge each day, a
maximum of an additional 40,000 trips might choose to if the Highway were improved.
Figure 17: Alternative Routes to Highway 169 Bloomington Ferry Bridge
On-ramp and Off-ramp Travel Pattern along Highway 169
A ramp-to-ramp analysis was conducted to better understand the movements between
important entrances and exits along Highway 169. Trips are tracked based on where they get
on the freeway and where they get off using the routing information from INRIX Origin-
Destination data. Key observations include:

Existing Conditions & Market Analysis 52 SRF Consulting Group, Inc. Highway 169 Mobility Study Minnesota Department of Transportation
In the a.m. peak:
30 percent of the ramp-to-ramp trips travel along the segment of Highway 169 south
of I-494 (including I-494 ramps); 34 percent travel the segment north of Highway 62.
Heavy and balanced ramp to ramp movements are observed between I-494 and
Highway 101, meaning that a near equal number of vehicles are coming to and from
I-494 and Highway 101.
Heavy ramp-to-ramp movements are observed from/to I-394 and Highway 101 with
trips from I-394 almost double the opposite movement
15 percent of Highway 169 freeway traffic uses ramps next to each other
In the p.m. peak:
35 percent of the ramp-to-ramp trips travel along the segment of Highway 169 south
of I-494 (including I-494 ramps) and 32 percent travel the segment north of Highway
62.
Heavy ramp-to-ramp movements are observed from/to I-494 and Highway 101 with
trips from I-494 almost double the opposite movement
Heavy ramp-to-ramp movements are observed from/to I-394 and Highway 55 with
trips from I-394 almost double the opposite movement
17 percent of Highway 169 freeway traffic uses ramps next to each other
Very strong ramp movements are observed between Canterbury Road and CSAH 21
and from Bren Road to Highway 62 (both are adjacent interchanges)
Corridor Trip Cluster Analysis
A cluster analysis was conducted in ArcGIS based on the INRIX O-D data to identify key
destination locations within a half mile of Highway 169. The top five locations identified
include: Highway 41 intersection area, Canterbury Road interchange area, Anderson Lake
Pkwy interchange area, Valley View Road area, Excelsior Boulevard and Highway 7 area. See
Figure 18 where darker colors represent denser concentration of trips.
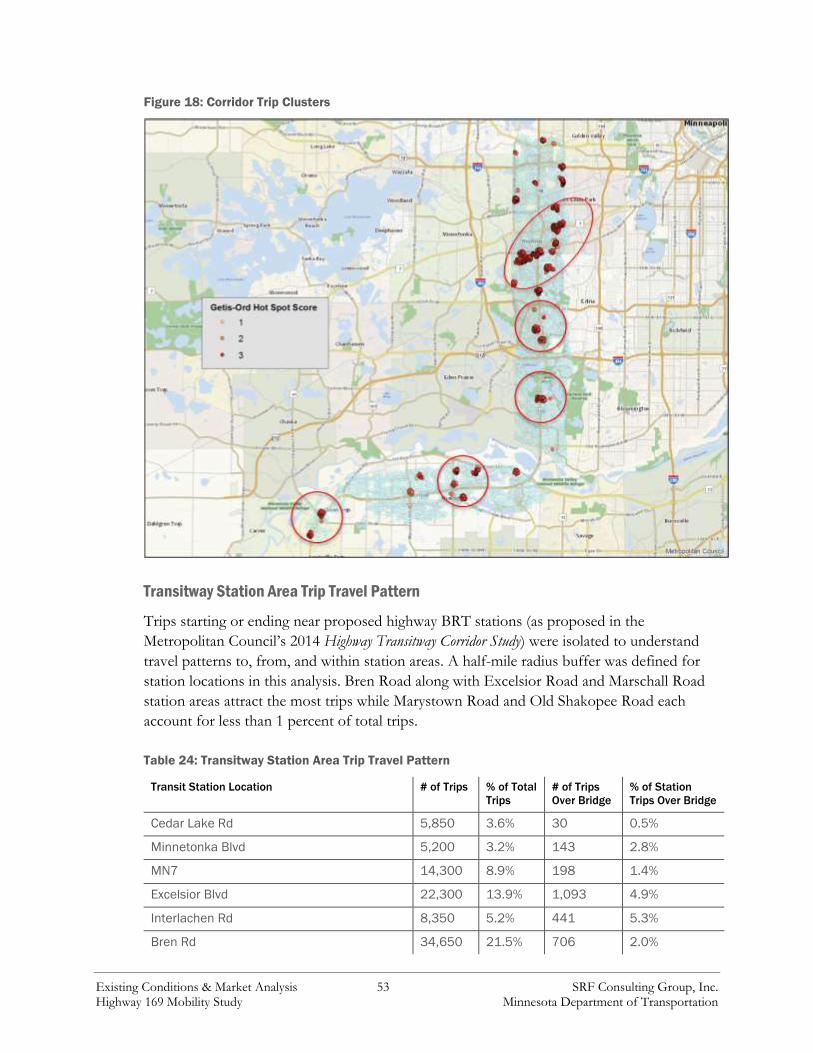
Existing Conditions & Market Analysis 53 SRF Consulting Group, Inc. Highway 169 Mobility Study Minnesota Department of Transportation
Figure 18: Corridor Trip Clusters
Transitway Station Area Trip Travel Pattern
Trips starting or ending near proposed highway BRT stations (as proposed in the
Metropolitan Council’s 2014 Highway Transitway Corridor Study) were isolated to understand
travel patterns to, from, and within station areas. A half-mile radius buffer was defined for
station locations in this analysis. Bren Road along with Excelsior Road and Marschall Road
station areas attract the most trips while Marystown Road and Old Shakopee Road each
account for less than 1 percent of total trips.
Table 24: Transitway Station Area Trip Travel Pattern
Transit Station Location # of Trips % of Total
Trips
# of Trips
Over Bridge
% of Station
Trips Over Bridge
Cedar Lake Rd 5,850 3.6% 30 0.5%
Minnetonka Blvd 5,200 3.2% 143 2.8%
MN7 14,300 8.9% 198 1.4%
Excelsior Blvd 22,300 13.9% 1,093 4.9%
Interlachen Rd 8,350 5.2% 441 5.3%
Bren Rd 34,650 21.5% 706 2.0%
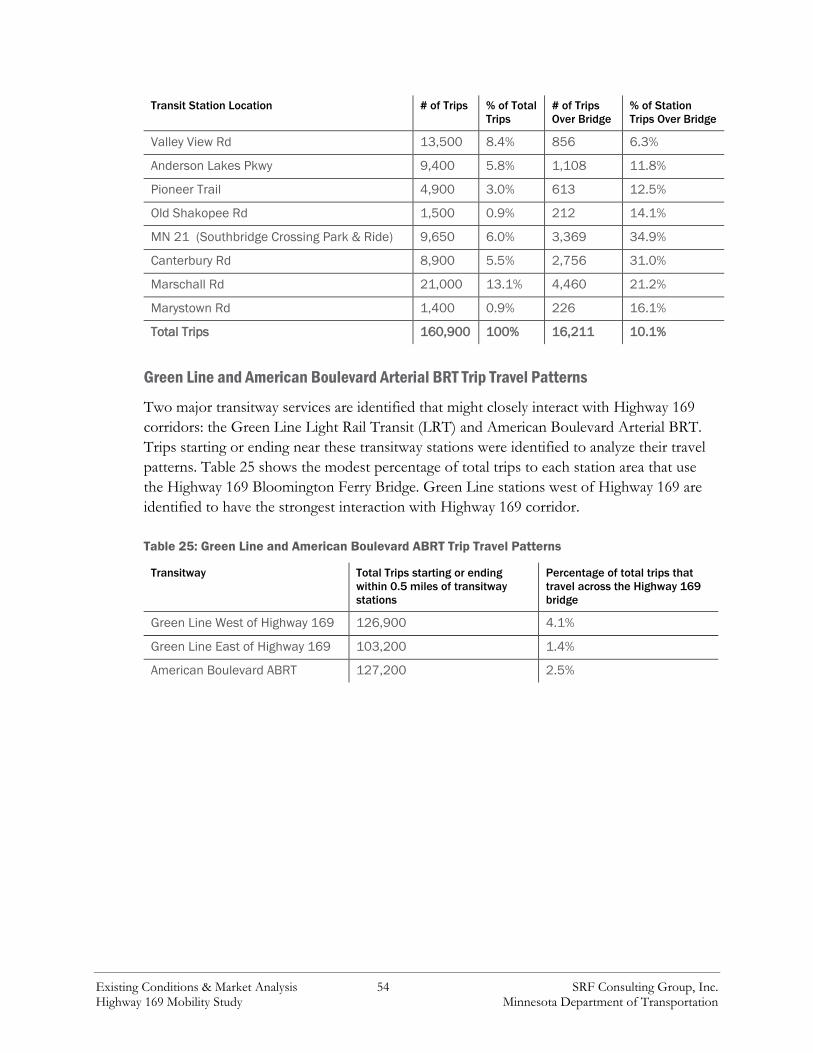
Existing Conditions & Market Analysis 54 SRF Consulting Group, Inc. Highway 169 Mobility Study Minnesota Department of Transportation
Transit Station Location # of Trips % of Total
Trips
# of Trips
Over Bridge
% of Station
Trips Over Bridge
Valley View Rd 13,500 8.4% 856 6.3%
Anderson Lakes Pkwy 9,400 5.8% 1,108 11.8%
Pioneer Trail 4,900 3.0% 613 12.5%
Old Shakopee Rd 1,500 0.9% 212 14.1%
MN 21 (Southbridge Crossing Park & Ride) 9,650 6.0% 3,369 34.9%
Canterbury Rd 8,900 5.5% 2,756 31.0%
Marschall Rd 21,000 13.1% 4,460 21.2%
Marystown Rd 1,400 0.9% 226 16.1%
Total Trips 160,900 100% 16,211 10.1%
Green Line and American Boulevard Arterial BRT Trip Travel Patterns
Two major transitway services are identified that might closely interact with Highway 169
corridors: the Green Line Light Rail Transit (LRT) and American Boulevard Arterial BRT.
Trips starting or ending near these transitway stations were identified to analyze their travel
patterns. Table 25 shows the modest percentage of total trips to each station area that use
the Highway 169 Bloomington Ferry Bridge. Green Line stations west of Highway 169 are
identified to have the strongest interaction with Highway 169 corridor.
Table 25: Green Line and American Boulevard ABRT Trip Travel Patterns
Transitway Total Trips starting or ending
within 0.5 miles of transitway
stations
Percentage of total trips that
travel across the Highway 169
bridge
Green Line West of Highway 169 126,900 4.1%
Green Line East of Highway 169 103,200 1.4%
American Boulevard ABRT 127,200 2.5%
Highway 169 Mobility Study
North BRT Analysis
Meeting Record
August 2, 2016 1:30 – 3:00 p.m.
SRF Consulting, Plymouth, MN
Attendees Cindy Sherman, City of Brooklyn Park
Chloe McGuire Brigl, City of Golden
Valley
Emily Goellner, City of Golden Valley
Jeff Oliver, City of Golden Valley
Nancy Abts, City of Osseo
Barbara Thomson, City of Plymouth
Joe Gladke, Hennepin County
Craig Lamothe, Metro Transit
Cole Hiniker, Metropolitan Council
Jen Lehmann, MVTA
Brad Larson, MnDOT
Angie Stenson, Scott County
Josh Johnson, Shakopee Mdewakanton Sioux
Community
Dave Jacobson, SouthWest Transit
Mona Elabbady, SRF
Paul Morris, SRF
Jake Knight, SRF
Summary of discussion outcomes
Limited value duplicating service north of the Blue Line Extension (BLE) Brooklyn Blvd
Station
Terminus for Highway 169 North BRT should be at the BLE Brooklyn Blvd Station,
providing connecting transit service
Propose a BRT station on Brooklyn Blvd, farside of Northland Dr N, to serve Hennepin
Technical College; the City of Brooklyn Park has already installed concrete pads at this
location in anticipation of future bus service
Eliminate proposed stations at Bass Lake Rd and Rockford Rd: interchange loops add
travel time; no connecting Metro Transit service west of Highway 169; excessive walk
distances
Proposed BRT stations at Schmidt Lake Rd and 36th Ave should move forward: with
diamond interchanges, they are simpler operationally and minimize travel time; they
serve large employers and transit-dependent populations
Proposed BRT station at 13th Ave should remain: simple from an operational standpoint,
and serves an affordable community that would benefit from service
Page 2
Proposed BRT station Betty Crocker Dr should remain: major center of employment, to
expand in the future; operationally challenging but critical to ridership
Stations moving forward as part of the alternative
Brooklyn Blvd @ BLE Station
Brooklyn Blvd @ Northland Dr
Hwy 169 @ Schmidt Lake Rd
Hwy 169 @ 36th Ave
Hwy 169@ 13th Ave
Hwy 169 @ Betty Crocker Dr
Previously determined stations on the southern half
Discussion notes
I. Projected ridership methodology
Josh Johnson: How might we best reflect major event/activity centers such as Mystic Lake and
Canterbury Park on the weekends?
Cole Hiniker: When annualized for transitways, a factor is applied to capture evening and
weekend and event characteristics such as a stadium. This should be further explored as part
of the ridership analysis since the 169 corridor has many events on evenings and weekends.
Dave Jacobson: What goes into the model?
Paul Morris: Based on the regional model; current and projected population, employment,
land use, mode choice, travel behavior, etc.
II. Terminus discussion
Josh Johnson: Brooklyn Park, Brooklyn Center, Minneapolis, and St. Paul are home to a significant
number of Mystic Lake employees. They do outreach in these communities seeking to fill positions
at or under the roughly $20/hour mark.
Joe Gladke: Balancing transit travel time and access is important. There seem to be a lot of stops – is
this turning into a regular fixed route?
Cole Hiniker: Clarified that this is a BRT/MnPass project; at this point, we are not considering any
additional modes (and their associated service frequencies).
Josh Johnson: Question about the full corridor travel time from Target complex to Marshall Rd;
worried about the number of stops.
Page 3
Dave Jacobson: Agree with Josh - needs to be a balance between the number of stops and run time in
order to maximize ridership.
Craig Lamothe:
Questioning the value of assuming ¼-mile walk radius – appropriate in this context? A
pedestrian attempting to cross Bass Lake or Rockford roads might be required to wait
several minutes. How does that influence the time or perceived time required to access the
station?
Very few will travel the length of the corridor
Important to consider connecting bus service
Dave Jacobson: Given the service assumptions, have you considered the number of passengers
needed to achieve a reasonable level of performance? Will the subsidy be outrageous?
Mona Elabbady: That has not been explored to date. Once an alignment, terminus, and
station locations are selected, we can run the ridership model to get a sense of what the
potential ridership may be.
Cindy Sherman:
Connections to Starlight Transit Center, given its role as a transit hub, is important
Are the connecting service plan assumptions of the Blue Line Extension (BLE) being
included in this analysis?
Mona Elabbady: Yes, connecting service will be an important aspect and we will use the
connecting service plan assumed as part of the BLE project.
Joe Gladke: At this stage, are we considering bus layover capacity constraints at stations with a lot of
connecting service, e.g. BLE stations?
Mona Elabbady: Not at this stage in the process – we need to know that it will work and that
there are feasible options, but not necessarily how exactly it will work. If this alternative is
deemed appropriate to move forward, these items will be looked at in greater detail.
Craig Lamothe: Utilizing the interchanges to provide access to offline station will require a lot of
time.
Cindy Sherman: In the future, the area surrounding the Target Campus will feature a grid street
system, be more dense and urban. But tying into the existing job density at 93rd is attractive, too.
Josh Johnson:
Why do we want to serve the Target campus all day if they primarily have first shift
employees? Is it a waste of service going all the way to Target?
At Mystic Lake, with first, second, and third shifts, we can get people to work, but have a
hard time providing service when they need to go home.
Page 4
Jen Lehman: There in not a one size fits all BRT – we learned this with the METRO Red Line. Why
are we restricting ourselves to one? Does this corridor need this level of service over that span?
Cole Hiniker: Project leaders have reiterated that this is a study of BRT and MnPASS
alternatives. Moreover, the regional guidelines now state that in order to be considered a
BRT, it must have the level of service like an LRT. In this policy framework, BRT is this
level of service.
Paul Morris: For the purposes of this study, at this point in the process, we are seeking an apples-to-
apples comparison with what was completed as part of the Highway Transitway Corridor Study. If
this alternative is deemed acceptable there will be in-depth technical analysis.
Cindy Sherman: 93rd would be a good terminus, with its employment density and residential mix.
Group conclusions:
Limited value duplicating service north of the BLE Brooklyn Blvd Station
Terminus should be at the BLE Brooklyn Blvd Station
There should be an additional BRT station on Brooklyn Blvd, farside of Northland Dr N, in
order to serve Hennepin Technical College
III. Stops in/near Plymouth and New Hope
Craig Lamothe:
Bass Lake Rd and Rockford Rd stations should be avoided; travel time penalty from
interchanges and offline stops is detrimental
Metro Transit bus service will not be able to connect to areas west of 169 – that’s Plymouth
Transit’s service area
Barbara Thomson: Near the proposed Schmidt Lake Rd station, St. Jude Medical Center to build
another 175,000 square feet of office space on site in the future.
Cole Hiniker: Would Plymouth Transit consider a north-south route running parallel and to the west
of Highway 169 in order to serve some of the destinations and connections at Bass Lake Rd and
Rockford Rd?
Dave Jacobson: Maybe, but not likely; Plymouth Transit is focused on east-west routes.
Group conclusions:
Schmidt Lake Rd and 36th Avenue are preferred BRT station locations; Bass Lake Rd and
Rockford Rd should not be included
Page 5
IV. Stops in/near Golden Valley and Plymouth
Jeff Oliver: General Mills plans to construct an additional two towers for office space on its existing
(southern) site, sometime in the future. The 13th Ave Station is a good potential site – within the
city’s most affordable neighborhood.
Jeff Oliver: General Mills (used to?) run shuttle service between its north and south campuses.
Group conclusions:
The proposed stations at 13th Ave and Betty Crocker Dr should remain as part of the
alternative

Appendix D – Operating Characteristics
HWY 169 N
Station to Station Service
Existing Corridor Services
Mar
sch
all R
d.
Seag
ate
Te
chn
olo
gy P
ark
& R
ide
Sou
thb
rid
ge C
ross
ing
P&
R
Pio
ne
er
Tr.
Vik
ing
Dr.
/ W
ash
ingt
on
Ave
.
Go
lde
n T
rian
gle
Sta
tio
n
Bre
n R
d.
W.
TH 7
Be
tty
Cro
cke
r D
r.
13
th A
ve.
36
th A
ve.
Sch
mid
t La
ke R
d.
Bro
okl
yn B
lvd
./N
ort
hla
nd
Dr.
Bro
okl
yn B
lvd
. B
lue
Lin
e
Exte
nsi
on
Sta
tio
n
Station Type offline offline offline offline inline inline inline inline inline inline inline inline inline inline
Incremental Distance (Miles) - 1.7 3.0 3.7 3.3 1.6 2.6 2.5 3.1 1.0 2.0 1.6 3.8 0.5
Cumulative Distance (Miles) - 1.7 4.7 8.4 11.7 13.3 15.9 18.4 21.5 22.5 24.5 26.1 29.9 30.4
Peak Period Times (Minutes)
Incremental Run Time - 8 11 12 8 4 6 6 7 3 5 4 9 2
Cumulative Run Time - 8 19 31 39 43 49 55 62 65 70 74 83 85
Midday Period Times (Minutes)
Incremental Run Time - 7 9 10 5 3 4 4 5 2 4 3 6 2
Cumulative Run Time - 7 16 26 31 34 38 42 47 49 53 56 62 64
Route
12 15-20 30 30 Minnetonka ● Minneapolis Local
497 60 60 60 Shakopee ● Shakopee Local
499 60 60 60 Shakopee ● ● ● Shakopee Local
705 60 60 60 Brooklyn Park ● ● St. Louis Park Local
723 30 30 60 Brooklyn Park ● Brooklyn Center Local
724 30 30 30 Brooklyn Park ● Minneapolis Local
146 15-30 0 0 Bloomington ● Minneapolis Limited
721 30 30 60 Brooklyn Park ● Minneapolis Limited
755 30 0 0 New Hope ● Minneapolis Limited
490 10-20 1 trip 1 trip Prior Lake ● ○ ○ ○ ○ Minneapolis Express
491 30 1 trip 1 trip Shakopee ● Minneapolis Express
492 60 0 0 Shakopee ● Minneapolis Express
493 15-25 1 trip 1 trip Shakopee ● Minneapolis Express
589 30 0 0 Bloomington ● Minneapolis Express
670 30 0 0 Excelsior ○ ○ ○ ○ ○ Minneapolis Express
675 15-30 30-60 60 Mound ● Minneapolis Express
687 1 trip 0 0 Chaska ○ ○ ○ Brooklyn Park Express
742 60 0 0 Plymouth ● ○ ● Minneapolis Express
756 30 0 0 New Hope ● Minneapolis Express
764 30 0 0 Brooklyn Park ● Minneapolis Express
790 15-30 0 0 Plymouth ○ ○ ● Minneapolis Express
793 30 0 0 Plymouth ● Minneapolis Express
795 0 120 0 Minneapolis ● Plymouth Express
Mar
sch
all R
d.
Seag
ate
Te
chn
olo
gy
P&
R
Sou
thb
rid
ge C
ross
ing
P&
R
(PK–MD–EVE)
● Station Served ○ Station Passed but Not Served
Pio
ne
er
Tr.
Vik
ing
Dr.
/Was
hin
gto
n
Ave
.
Go
lde
n T
rian
gle
Bre
n R
d.
W.
TH 7
Be
tty
Cro
cke
r D
r.
Frequency
Origin
Service
Type13
th A
ve.
36
th A
ve.
Sch
mid
t La
ke R
d.
Bro
okl
yn
Blv
d./
No
rth
lan
d D
r.
Bro
okl
yn B
lvd
. B
lue
Lin
e E
xte
nsi
on
Sta
tio
n
Destination

Proposed Corridor Services
Proposed Connecting Service Change Notes: 1. Routes 17, 615, 667, 668: Extend to serve TH 7 Station
2. Route 756, 793: Extend to serve Schmidt Lake Rd. Station
3. Routes 717, 791: Extend to serve 36th Ave. Station
4. Route 670: Add stop at TH 7 Station
5. Route 795: Add connections at 13th Ave. and 36th Ave. Stations
6. Routes 690, 691: Shift existing non-stop service off of I-494 to US 169, stop at Golden Triangle Station en route to Minneapolis
7. Routes 692, 699: Shift existing non-stop service off of I-494 to US 169, stop at Bren Station en route to Minneapolis
8. Routes 705, 723, 724: Increased frequency, proposed as part of expanded bus operations for Blue Line Extension
9. Route 712: New route proposed as part of expanded bus operations for Blue Line Extension
10. Route 720: New weekday only local crosstown route, proposed as part of expanded bus operations for Blue Line Extension
11. Route 745: New route proposed as part of expanded bus operations for Blue Line Extension
12. Route 746: New route proposed as part of expanded bus operations for Blue Line Extension
13. Route 764: Removed per bus operations plan for Blue Line Extension
14. Route 495: New local route beginning August 20, 2016 (MVTA)
15. American Blvd Arterial ABRT
16. Green Line Extension LRT
17. Blue Line Extension LRT
12 15-20 30 30 Minnetonka ● Minneapolis Local
17 10-20 30 30 St. Louis Park ● Minneapolis Local 1
495 60 60 60 Shakopee ● Bloomington Local 14
497 60 60 60 Shakopee ● Shakopee Local
499 60 60 60 Shakopee ● ● ● Shakopee Local
615 60 60 1 trip Minnetonka ● St. Louis Park Local 1
705 30 30 30 Brooklyn Park ● ● St. Louis Park Local 8
712 30 30 30 Plymouth ● Robbinsdale Local 9
717 60 60 60 Plymouth Brooklyn Center Local 3
720 30 30 30 Maple Grove ● ● Brooklyn Park Local 10
723 30 30 30 Brooklyn Park ● Brooklyn Center Local 8
724 15 15 15 Brooklyn Park ● Minneapolis Local 8
745 30 60 60 Plymouth ● Crystal Local 11
746 30 60 60 Plymouth ● Robbinsdale Local 12
791 30 0 2 trips Plymouth ● Plymouth Local 3
146 15-30 0 0 Bloomington ● Minneapolis Limited
721 30 30 60 Brooklyn Park ● Minneapolis Limited
755 30 0 0 New Hope ● Minneapolis Limited
490 10-20 1 trip 1 trip Prior Lake ● ○ ○ ○ ○ Minneapolis Express
491 30 1 trip 1 trip Shakopee ● Minneapolis Express
492 60 0 0 Shakopee ● Minneapolis Express
493 15-25 1 trip 1 trip Shakopee ● Minneapolis Express
589 30 0 0 Bloomington ● Minneapolis Express
667 30-60 0 0 Minnetonka ● Minneapolis Express 1
668 30 0 0 Hopkins ● Minneapolis Express 1
670 30 0 0 Excelsior ● Minneapolis Express 4
675 15-30 30-60 60 Mound ● Minneapolis Express
690 5-15 0 0 Eden Prairie ● ○ ○ Minneapolis Express 6
691 1 trip 0 0 Chaska ● ○ ○ Minneapolis Express 6
692 15-25 0 0 Chanhassen ○ ● ○ Minneapolis Express 7
699 10-20 0 0 Chaska ○ ● ○ Minneapolis Express 7
742 60 0 0 Plymouth ● ○ ● Minneapolis Express
756 30 0 0 New Hope ● ● Minneapolis Express 2
790 15-30 0 0 Plymouth ○ ○ ● Minneapolis Express
793 30 0 0 Plymouth ● ● Minneapolis Express 2
795 0 120 0 Minneapolis ● ● Plymouth Express 5
AMER.
ABRT15 15 15 Eden Prairie ●
Bloomington ABRT 15
GLE 10 10 15 Eden Prairie ● Minneapolis LRT 16
BLE 10 10 15 Minneapolis ● Brooklyn Park LRT 17
Change
NotesRoute
● Station Served ○ Station Passed but Not Served
DestinationBro
okl
yn
Blv
d./
No
rth
lan
d D
r.
Bro
okl
yn B
lvd
. B
lue
Lin
e E
xte
nsi
on
Sta
tio
n
(PK–MD–EVE)
Frequency
Go
lde
n T
rian
gle
Vik
ing
Dr.
/Was
hin
gto
n
Ave
.
Pio
ne
er
Tr.
Sou
thb
rid
ge C
ross
ing
P&
R
Bre
n R
d.
W.
TH 7
Be
tty
Cro
cke
r D
r.
13
th A
ve.
Service
TypeSch
mid
t La
ke R
d.
Seag
ate
Te
chn
olo
gy
P&
R
Mar
sch
all R
d.
Origin 36
th A
ve.
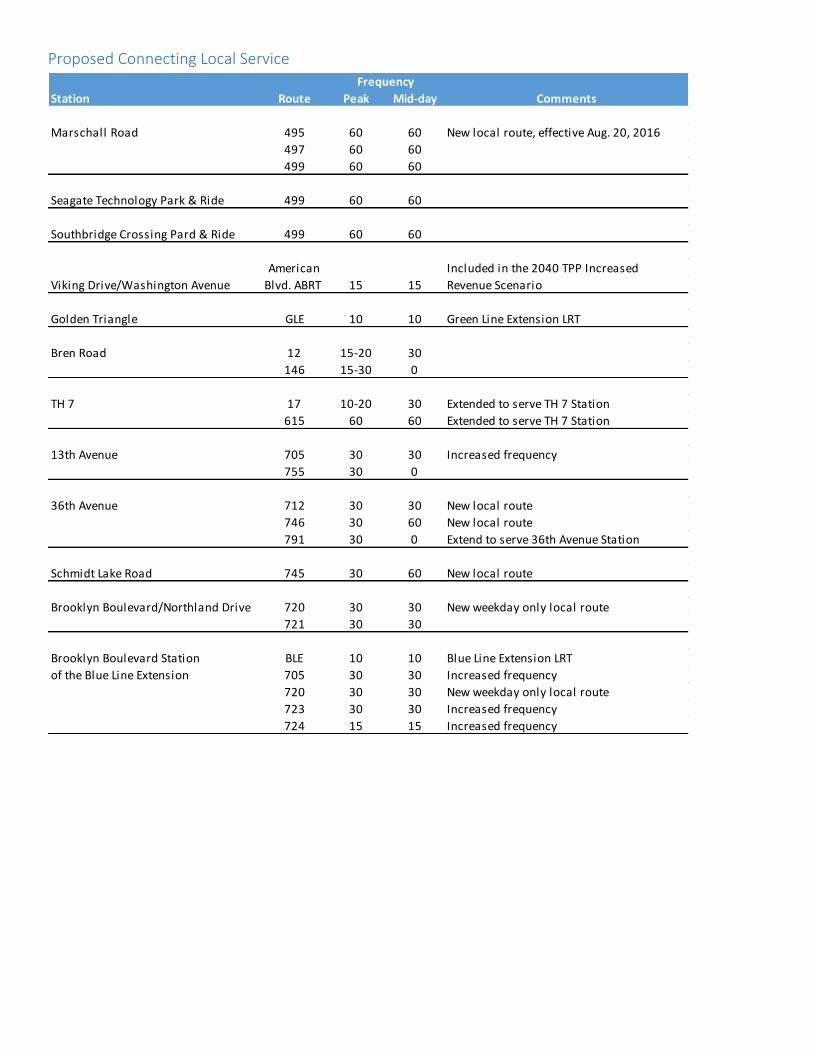
Proposed Connecting Local Service
Station Route Peak Mid-day Comments
Marschall Road 495 60 60 New local route, effective Aug. 20, 2016
497 60 60
499 60 60
Seagate Technology Park & Ride 499 60 60
Southbridge Crossing Pard & Ride 499 60 60
American Included in the 2040 TPP Increased
Viking Drive/Washington Avenue Blvd. ABRT 15 15 Revenue Scenario
Golden Triangle GLE 10 10 Green Line Extension LRT
Bren Road 12 15-20 30
146 15-30 0
TH 7 17 10-20 30 Extended to serve TH 7 Station
615 60 60 Extended to serve TH 7 Station
13th Avenue 705 30 30 Increased frequency
755 30 0
36th Avenue 712 30 30 New local route
746 30 60 New local route
791 30 0 Extend to serve 36th Avenue Station
Schmidt Lake Road 745 30 60 New local route
Brooklyn Boulevard/Northland Drive 720 30 30 New weekday only local route
721 30 30
Brooklyn Boulevard Station BLE 10 10 Blue Line Extension LRT
of the Blue Line Extension 705 30 30 Increased frequency
720 30 30 New weekday only local route
723 30 30 Increased frequency
724 15 15 Increased frequency
Frequency
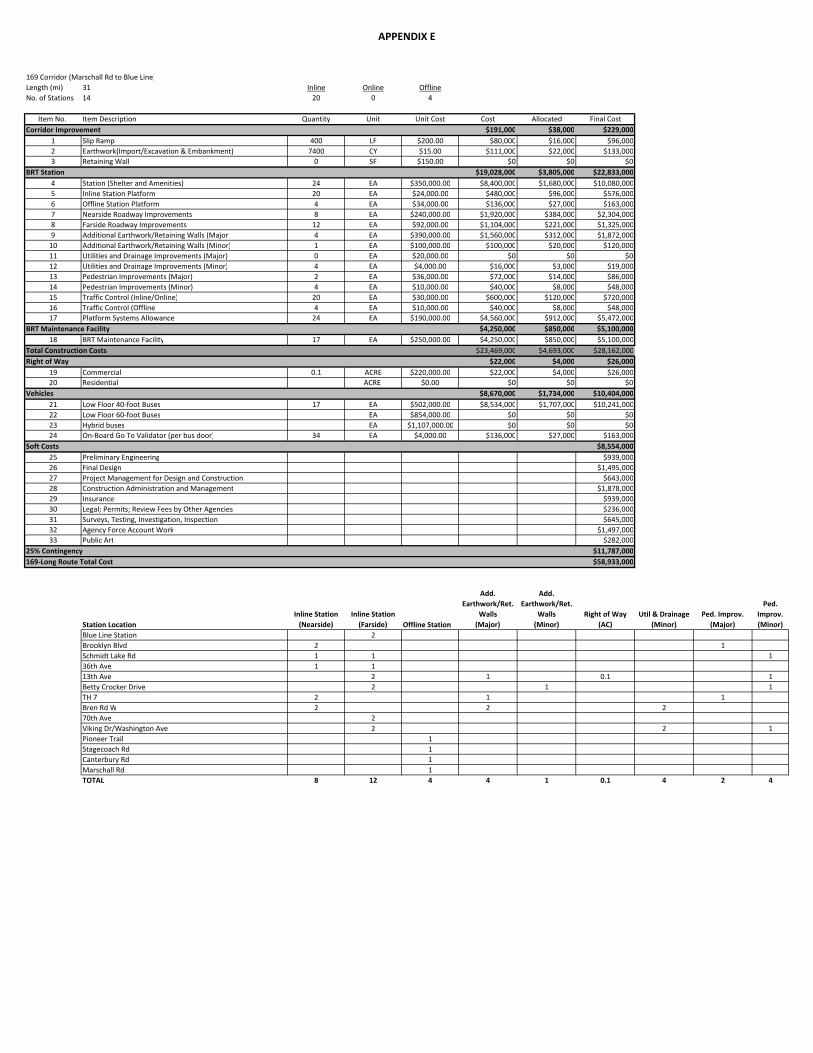
APPENDIX E
169 Corridor (Marschall Rd to Blue Line)
Length (mi) 31 Inline Online Offline
No. of Stations 14 20 0 4
Item No. Item Description Quantity Unit Unit Cost Cost Allocated Final Cost
Corridor Improvement $191,000 $38,000 $229,000
1 Slip Ramp 400 LF $200.00 $80,000 $16,000 $96,000
2 Earthwork(Import/Excavation & Embankment) 7400 CY $15.00 $111,000 $22,000 $133,000
3 Retaining Wall 0 SF $150.00 $0 $0 $0
BRT Station $19,028,000 $3,805,000 $22,833,000
4 Station (Shelter and Amenities) 24 EA $350,000.00 $8,400,000 $1,680,000 $10,080,000
5 Inline Station Platform 20 EA $24,000.00 $480,000 $96,000 $576,000
6 Offline Station Platform 4 EA $34,000.00 $136,000 $27,000 $163,000
7 Nearside Roadway Improvements 8 EA $240,000.00 $1,920,000 $384,000 $2,304,000
8 Farside Roadway Improvements 12 EA $92,000.00 $1,104,000 $221,000 $1,325,000
9 Additional Earthwork/Retaining Walls (Major) 4 EA $390,000.00 $1,560,000 $312,000 $1,872,000
10 Additional Earthwork/Retaining Walls (Minor) 1 EA $100,000.00 $100,000 $20,000 $120,000
11 Utilities and Drainage Improvements (Major) 0 EA $20,000.00 $0 $0 $0
12 Utilities and Drainage Improvements (Minor) 4 EA $4,000.00 $16,000 $3,000 $19,000
13 Pedestrian Improvements (Major) 2 EA $36,000.00 $72,000 $14,000 $86,000
14 Pedestrian Improvements (Minor) 4 EA $10,000.00 $40,000 $8,000 $48,000
15 Traffic Control (Inline/Online) 20 EA $30,000.00 $600,000 $120,000 $720,000
16 Traffic Control (Offline) 4 EA $10,000.00 $40,000 $8,000 $48,000
17 Platform Systems Allowance 24 EA $190,000.00 $4,560,000 $912,000 $5,472,000
BRT Maintenance Facility $4,250,000 $850,000 $5,100,000
18 BRT Maintenance Facility 17 EA $250,000.00 $4,250,000 $850,000 $5,100,000
$23,469,000 $4,693,000 $28,162,000
Right of Way $22,000 $4,000 $26,000
19 Commercial 0.1 ACRE $220,000.00 $22,000 $4,000 $26,000
20 Residential ACRE $0.00 $0 $0 $0
Vehicles $8,670,000 $1,734,000 $10,404,000
21 Low Floor 40‐foot Buses 17 EA $502,000.00 $8,534,000 $1,707,000 $10,241,000
22 Low Floor 60‐foot Buses EA $854,000.00 $0 $0 $0
23 Hybrid buses EA $1,107,000.00 $0 $0 $0
24 On‐Board Go To Validator (per bus door) 34 EA $4,000.00 $136,000 $27,000 $163,000
Soft Costs $8,554,000
25 Preliminary Engineering $939,000
26 Final Design $1,495,000
27 Project Management for Design and Construction $643,000
28 Construction Administration and Management $1,878,000
29 Insurance $939,000
30 Legal; Permits; Review Fees by Other Agencies $236,000
31 Surveys, Testing, Investigation, Inspection $645,000
32 Agency Force Account Work $1,497,000
33 Public Art $282,000
$11,787,000
$58,933,000
Station Location
Inline Station
(Nearside)
Inline Station
(Farside) Offline Station
Add.
Earthwork/Ret.
Walls
(Major)
Add.
Earthwork/Ret.
Walls
(Minor)
Right of Way
(AC)
Util & Drainage
(Minor)
Ped. Improv.
(Major)
Ped.
Improv.
(Minor)
Blue Line Station 2
Brooklyn Blvd 2 1
Schmidt Lake Rd 1 1 1
36th Ave 1 1
13th Ave 2 1 0.1 1
Betty Crocker Drive 2 1 1
TH 7 2 1 1
Bren Rd W 2 2 2
70th Ave 2
Viking Dr/Washington Ave 2 2 1
Pioneer Trail 1
Stagecoach Rd 1
Canterbury Rd 1
Marschall Rd 1
TOTAL 8 12 4 4 1 0.1 4 2 4
Total Construction Costs
25% Contingency
169‐Long Route Total Cost

Annual Operations & Maintenance Cost Estimates ($2013)
Transit Unit Cost HWY 169 N
Service Cost Drivers ($2012) ($2013)
Highway Peak Buses $36,330 14BRT Ann. Rev. Bus-Hr. $75.25 58,570Service Ann. Rev. Bus-Mi. (40') $3.05 1,289,100
Directional Stops $18,250 24On-line Stops with Elevators $20,000 0O&M Cost Estimate $9,447,400 CPI -2013 (1-year) inflation rate:
1.74%Background Change in Peak Buses $36,330 1Bus Change in Ann. Rev. Bus-Hr. $75.25 1,862Changes Change in Ann. Rev. Bus-Mi. (40') $3.05 -23,639
Change in O&M Cost (from Existing) $106,100
TOTAL CORRIDOR O&M COST ESTIMATE $9,553,500
Notes
1. In-line stations counted as two (one for each direction).2. No exclusive lane miles or TSP costs are included.3. All cost estimates assume 40' buses.4. HTCS service plans assume 16 hour span of service Mon-Sat, 13-hours on Sun.5. HCTS service plans assume 15-min. all-day service on weekdays and Saturdays, 30-min. on Sat. nights and Sundays.6. Costs for background bus changes are general.7. Unit costs consistent with those used in recent Metropolitan Council corridor studies (Robert St., Nicollet-Central, Midtown).8. Costs were converted from 2012 to 2013 dollars using the CPI-2013 1-year inflation rate of 1.74%

Operating Statistics
Time Travel Distance Headway Vehicles Daily Annual Buses AM PEAK MIDDAY PM PEAK EARLY EVE LATE EVE
Corridor From To Period Time (miles) Day AM Mid PM Eve Late Peak Total Rev.-Miles Rev-Hrs Rev.-Miles Rev.-Hrs AM Mid PM Eve Late AM Mid PM Eve Late Total Layover Cycle Layover Cycle Layover Cycle Layover Cycle Layover Cycle
HWY 169 N Peak 86 31.00 M-F 15 15 15 15 n/a 14.0 17.0 3,968 184 1,011,800 46,920 14.0 10.0 14.0 10.0 0.0 24 52 24 28 0 128 38.00 210.00 22.00 150.00 38.00 210.00 22.00 150.00 n/a n/aShakopee to Midday 64 31.00 Sat 15 15 15 30 n/a 3,534 144 183,800 7,500 10.0 10.0 10.0 5.5 0.0 24 52 24 14 0 114 22.00 150.00 22.00 150.00 22.00 150.00 37.00 165.00 n/a n/aBrooklyn Park Sun n/a 30 30 30 n/a 1,612 72 93,500 4,150 0.0 5.5 5.5 5.5 0.0 0 26 12 14 0 52 37.00 165.00 37.00 165.00 37.00 165.00 37.00 165.00 n/a n/a
14 17 1,289,100 58,570
One-way daily bus trips
Marschall Rd. Brooklyn Blvd. Station

Background Bus Service Changes (Order-of-Magnitude Estimates)
Corridor Background Bus Change Pk Buses Daily Hrs Daily Mi's. Ann. Hrs. Ann. Miles Comments
HWY 169 N Routes 17, 615,667,668: Extend to TH 7 Station 0 0 0 0 0 Assume cost neutralShakopee to Routes 717: Extend to serve 36th Ave. Station 1 3.5 48 884 12,240 Add 13 minutes, 3 miles to cycle; 16 daily cyclesBrooklyn Park Routes 791: Extend to serve 36th Ave. Station 0 0 0 0 0 Assume cost neutral.
Route 756: Extend to serve Schmidt Lake Rd. Station 0 0 4.2 0 1,071 Add 0.7 miles per trip, Route 793: Extend to serve Schmidt Lake Rd. Station 0 0 0 0 0 Assume cost neutralRoute 670: Add stop at TH 7 Station 0 0 0 0 0 Assume cost neutralRoute 795: Add stop at 13th Ave. Station 0 0 0 0 0 Assume cost neutralRoutes 690, 691, 692, 699: Shift service from I-494 to US 169 0 0 -172.5 0 -43,988 2.3 miles shorter, 75 daily tripsRoutes 690, 691: Add stop at Golden Triangle Station 0 4 27.6 978 7,038 Add 5 minues. 0.6 miles for 46 daily tripsRoutes 692, 699: add stop at Bren Rd. Station 0 0 0 0 0 Assume cost neutral
1 7 -93 1,862 -23,639
Note - changes in peak buses, annual revenue bus-hours and bus-miles of service estimated, based on estimated changes in daily trips, average route distance and average scheduled travel time.
Related Documents