AUTHORS Tucker F. Hentz Bureau of Economic Geology, John A. and Katherine G. Jackson School of Geosciences, University of Texas at Austin, Box X, University Station, Austin, Texas, 78713; [email protected] Tucker F. Hentz is a research associate at the Bureau of Economic Geology, University of Texas at Austin, which he joined in 1982. He graduated cum laude with a B.A. degree in geology from Franklin & Marshall College in 1977 and received his M.S. degree in geology from the University of Kansas in 1982. His research interests include the regional sequence stratigraphy of gas-bearing successions in the Anadarko basin, Rio Grande embayment, and Gulf Coast basin. Hongliu Zeng Bureau of Economic Geology, John A. and Katherine G. Jackson School of Geosciences, University of Texas at Austin, Box X, University Station, Austin, Texas, 78713 Hongliu Zeng has been a research scientist at the Bureau of Economic Geology, University of Texas at Austin, since 1997. His research interests include seismic sedimentology, seismic stratigraphy, and special seismic processing, applied to petroleum prospecting. He earned his B.S. (1982) and M.S. (1985) degrees in geology from the Petroleum University of China and his Ph.D. (1994) in geophysics from the University of Texas at Austin. ACKNOWLEDGEMENTS We acknowledge the significant research contributions to this study made by our colleagues, namely, Lesli J. Wood, L. Frank Brown Jr., Michael V. DeAngelo, Adrian C. Badescu, Cem O. Kilic ¸, and Claudia Rassi. John T. Ames and Jana S. Robinson prepared the figures under the direction of Joel L. Lardon. Susann V. Doenges copyedited the text prior to the submission of the revised draft. Peer reviews by William E. Galloway, James P. Rogers, and Peter K. Webb are greatly appreciated and have improved the manuscript. This article was prepared with the support of the U.S. Department of Energy (DOE) under Cooperative Agreement No. DE-FC26- 98FT40136, with Gary P. Sames as the project High-frequency Miocene sequence stratigraphy, offshore Louisiana: Cycle framework and influence on production distribution in a mature shelf province Tucker F. Hentz and Hongliu Zeng ABSTRACT The regressive Miocene succession of offshore Louisiana comprises 10 third-order sequences and no fewer than 58 fourth-order se- quences, which average approximately 1.1 and 0.19 m.y. in dura- tion, respectively, comparable to durations measured in the Gulf Coast Basin and basins worldwide. Upper lower to middle Miocene distal third-order sequences comprise mostly lowstand prograding- wedge, slope-fan, and basin-floor-fan deposits. In contrast, middle to upper Miocene medial sequences record progressively more landward systems tracts: (1) the lateral transition between on-shelf incised-valley fills and the proximal parts of basinward-thickening, lowstand pro- grading wedges and (2) cyclic on-shelf highstand and transgressive sys- tems tracts. Upper Miocene inner-shelf and marginal marine systems tracts and more abundant incised valleys dominate the thinner proxi- mal third-order sequences. This genetic framework has a major influence on hydrocarbon distribution. Although a strong structural-trapping component is present in the fields, more than 90% of cumulative production orig- inates where fourth-order systems tracts stack to form third-order lowstand systems tracts in all 10 third-order sequences. The devel- opment of a high-frequency sequence framework for the prolific Miocene succession and the discovery that hydrocarbons are pooled within the Miocene third-order lowstand systems tracts yield a focused model for the development of abundant undiscovered Miocene reserves in the mature northern Gulf of Mexico shelf province. Copyright #2003. The American Association of Petroleum Geologists. All rights reserved. Manuscript received December 10, 2001; provisional acceptance May 15, 2002; revised manuscript received September 20, 2002; final acceptance September 24, 2002. AAPG Bulletin, v. 87, no. 2 (February 2003), pp. 197–230 197

Welcome message from author
This document is posted to help you gain knowledge. Please leave a comment to let me know what you think about it! Share it to your friends and learn new things together.
Transcript
AUTHORS
Tucker F. Hentz � Bureau of EconomicGeology, John A. and Katherine G. JacksonSchool of Geosciences, University of Texas atAustin, Box X, University Station, Austin, Texas,78713; [email protected]
Tucker F. Hentz is a research associate at theBureau of Economic Geology, University ofTexas at Austin, which he joined in 1982. Hegraduated cum laude with a B.A. degree ingeology from Franklin & Marshall College in1977 and received his M.S. degree in geologyfrom the University of Kansas in 1982. Hisresearch interests include the regionalsequence stratigraphy of gas-bearingsuccessions in the Anadarko basin, RioGrande embayment, and Gulf Coast basin.
Hongliu Zeng � Bureau of EconomicGeology, John A. and Katherine G. JacksonSchool of Geosciences, University of Texasat Austin, Box X, University Station, Austin,Texas, 78713
Hongliu Zeng has been a research scientist atthe Bureau of Economic Geology, Universityof Texas at Austin, since 1997. His researchinterests include seismic sedimentology,seismic stratigraphy, and special seismicprocessing, applied to petroleum prospecting.He earned his B.S. (1982) and M.S. (1985)degrees in geology from the PetroleumUniversity of China and his Ph.D. (1994) ingeophysics from the University of Texas atAustin.
ACKNOWLEDGEMENTS
We acknowledge the significant researchcontributions to this study made by ourcolleagues, namely, Lesli J. Wood, L. FrankBrown Jr., Michael V. DeAngelo, Adrian C.Badescu, Cem O. Kilic, and Claudia Rassi. JohnT. Ames and Jana S. Robinson prepared thefigures under the direction of Joel L. Lardon.Susann V. Doenges copyedited the text prior tothe submission of the revised draft. Peer reviewsby William E. Galloway, James P. Rogers, andPeter K. Webb are greatly appreciated and haveimproved the manuscript.This article was prepared with the support ofthe U.S. Department of Energy (DOE) underCooperative Agreement No. DE-FC26-98FT40136, with Gary P. Sames as the project
High-frequency Miocenesequence stratigraphy, offshoreLouisiana: Cycle frameworkand influence on productiondistribution in a mature shelfprovinceTucker F. Hentz and Hongliu Zeng
ABSTRACT
The regressive Miocene succession of offshore Louisiana comprises
10 third-order sequences and no fewer than 58 fourth-order se-
quences, which average approximately 1.1 and 0.19 m.y. in dura-
tion, respectively, comparable to durations measured in the Gulf
Coast Basin and basins worldwide. Upper lower to middle Miocene
distal third-order sequences comprise mostly lowstand prograding-
wedge, slope-fan, and basin-floor-fan deposits. In contrast, middle to
upper Miocene medial sequences record progressively more landward
systems tracts: (1) the lateral transition between on-shelf incised-valley
fills and the proximal parts of basinward-thickening, lowstand pro-
grading wedges and (2) cyclic on-shelf highstand and transgressive sys-
tems tracts. Upper Miocene inner-shelf and marginal marine systems
tracts and more abundant incised valleys dominate the thinner proxi-
mal third-order sequences.
This genetic framework has a major influence on hydrocarbon
distribution. Although a strong structural-trapping component is
present in the fields, more than 90% of cumulative production orig-
inates where fourth-order systems tracts stack to form third-order
lowstand systems tracts in all 10 third-order sequences. The devel-
opment of a high-frequency sequence framework for the prolific
Miocene succession and the discovery that hydrocarbons are pooled
within the Miocene third-order lowstand systems tracts yield a
focused model for the development of abundant undiscovered
Miocene reserves in the mature northern Gulf of Mexico shelf
province.
Copyright #2003. The American Association of Petroleum Geologists. All rights reserved.
Manuscript received December 10, 2001; provisional acceptance May 15, 2002; revised manuscriptreceived September 20, 2002; final acceptance September 24, 2002.
AAPG Bulletin, v. 87, no. 2 (February 2003), pp. 197–230 197
198 High-Frequency Miocene Sequence Stratigraphy, Offshore Louisiana
INTRODUCTION
Siliciclastic Miocene strata are currently the most productive of
all chronostratigraphic units in the northern Gulf of Mexico’s outer
continental shelf, accounting for 40% of all hydrocarbons produced
and 40% of all remaining proved reserves. Most of these Miocene
resources (99% of cumulative production, 61% of remaining proved
reserves) are restricted to the present continental shelf (Crawford
et al., 2000), where the majority of active fields are considered
mature. These statistics indicate that significant potential exists
for interfield and intrafield development in the shelf area (<650 ft
[198 m] water depth). Moreover, deep Miocene strata (>15,000 ft
[4572 m] subsea) below established reservoirs in the shelf area
hold promise for additional resources. Only 5% of all wells drilled
on the Gulf of Mexico shelf have penetrated strata below 15,000
ft (4572 m), in which there is an estimated 10.5 tcf [297 billion
m3] of deep-gas recoverable resources (Minerals Management Ser-
vice, 2001).
With more than one-third of proven recoverable natural-gas
resources of the Gulf of Mexico remaining to be produced from
Miocene shelf-bound fields and the potential for new gas resources
from the deep Miocene, a need exists for a detailed stratal frame-
work to guide future exploration and production efforts on the
modern Gulf of Mexico shelf. Toward this end, we focus on the
low- and high-frequency (reservoir-scale) sequence stratigraphy of
most of the Miocene series (upper lower Miocene to Pliocene)
in the mature Starfak field (designated Vermilion Block 50 field
by the Minerals Management Service), nearby Tiger Shoal field,
and the surrounding 352-mi2 (911 km2) area of 3-D seismic cover-
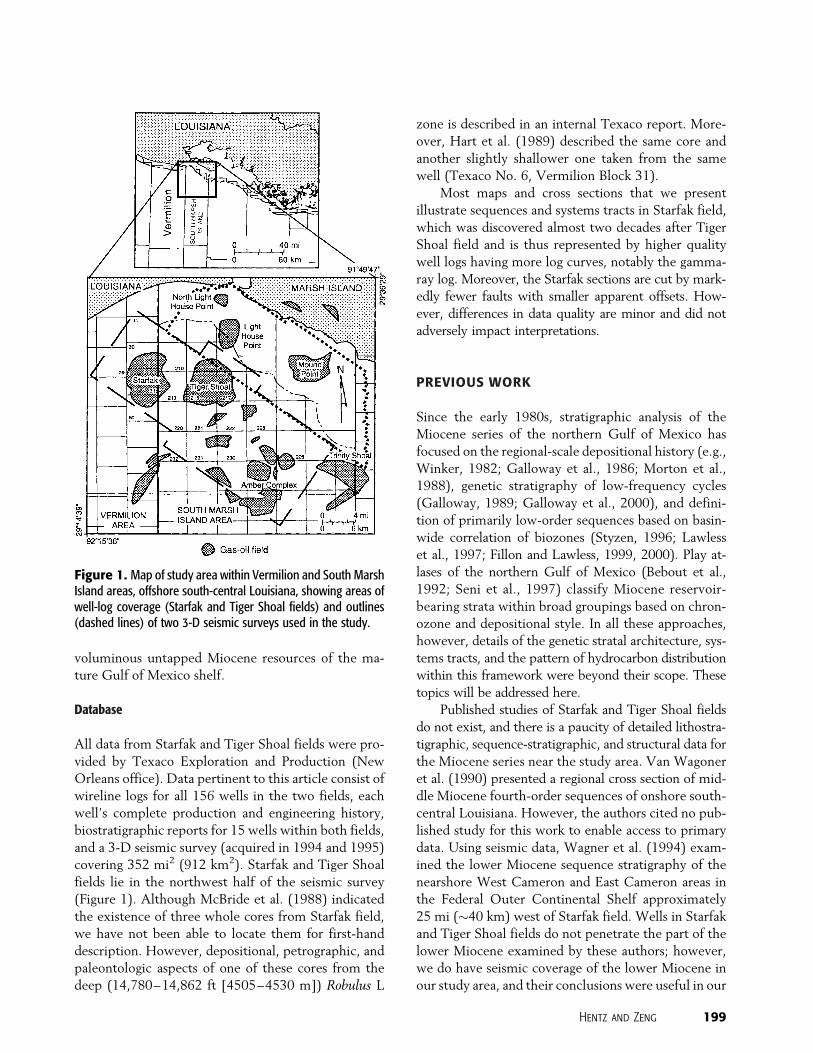
age (Figure 1). The approximately 10,000-ft-(�3048-m)-thick study
interval comprises siliciclastic marine and continental strata that
contain more than 60 distinct sandstone-body reservoirs distributed
throughout the section. Although abundant well-log and seismic
data that image the Miocene succession have been used for dec-
ades in the search for hydrocarbons in the Gulf of Mexico, we have
not encountered any published examinations of the high-frequency
sequence stratigraphy of the series (either local or regional) in
offshore Louisiana. Establishment of such a framework based on
both detailed well-log and advanced seismic visualization should be
a primary focus to effectively develop remaining resources in the
mature shelf areas of the Gulf of Mexico.
The objectives of this article are to (1) document the low- (third-
order) and high-frequency (fourth-order) sequence-stratigraphic
framework of the Miocene succession within the study area, pro-
viding a basis for the framework’s extrapolation into the extensive
Miocene play fairways surrounding the study area (Hunt and Bur-
gess, 1995; Seni et al., 1997) and into strata having potentially deep
(lower Miocene) production and (2) address the regional sequence-
stratigraphic context of resource distribution within the Miocene
succession in the field areas. The ultimate intent is to provide ex-
plorationists with additional tools and insight to help develop the
manager. However, any opinions, findings,conclusions, or recommendations expressedherein are those of the authors and do notnecessarily reflect the views of the DOE. As anindustry partner, Chevron-Texaco contributedthe well-log, production, and 3-D seismic data.Landmark Graphics Corporation providedsoftware for display of well-log correlations andinterpretation of seismic data via the LandmarkUniversity Grant Program. The Owen-CoatesFund of the Geology Foundation, University ofTexas at Austin, provided partial support ofpublication costs. This article was publishedwith the permission of the director of Bureau ofEconomic Geology, John A. and Katherine G.Jackson School of Geosciences, Universityof Texas at Austin.
voluminous untapped Miocene resources of the ma-
ture Gulf of Mexico shelf.
Database
All data from Starfak and Tiger Shoal fields were pro-
vided by Texaco Exploration and Production (New
Orleans office). Data pertinent to this article consist of
wireline logs for all 156 wells in the two fields, each
well’s complete production and engineering history,
biostratigraphic reports for 15 wells within both fields,
and a 3-D seismic survey (acquired in 1994 and 1995)
covering 352 mi2 (912 km2). Starfak and Tiger Shoal
fields lie in the northwest half of the seismic survey
(Figure 1). Although McBride et al. (1988) indicated
the existence of three whole cores from Starfak field,
we have not been able to locate them for first-hand
description. However, depositional, petrographic, and
paleontologic aspects of one of these cores from the
deep (14,780–14,862 ft [4505–4530 m]) Robulus L
zone is described in an internal Texaco report. More-
over, Hart et al. (1989) described the same core and
another slightly shallower one taken from the same
well (Texaco No. 6, Vermilion Block 31).
Most maps and cross sections that we present
illustrate sequences and systems tracts in Starfak field,
which was discovered almost two decades after Tiger
Shoal field and is thus represented by higher quality
well logs having more log curves, notably the gamma-
ray log. Moreover, the Starfak sections are cut by mark-
edly fewer faults with smaller apparent offsets. How-
ever, differences in data quality are minor and did not
adversely impact interpretations.
PREVIOUS WORK
Since the early 1980s, stratigraphic analysis of the
Miocene series of the northern Gulf of Mexico has
focused on the regional-scale depositional history (e.g.,
Winker, 1982; Galloway et al., 1986; Morton et al.,
1988), genetic stratigraphy of low-frequency cycles
(Galloway, 1989; Galloway et al., 2000), and defini-
tion of primarily low-order sequences based on basin-
wide correlation of biozones (Styzen, 1996; Lawless
et al., 1997; Fillon and Lawless, 1999, 2000). Play at-
lases of the northern Gulf of Mexico (Bebout et al.,
1992; Seni et al., 1997) classify Miocene reservoir-
bearing strata within broad groupings based on chron-
ozone and depositional style. In all these approaches,
however, details of the genetic stratal architecture, sys-
tems tracts, and the pattern of hydrocarbon distribution
within this framework were beyond their scope. These
topics will be addressed here.
Published studies of Starfak and Tiger Shoal fields
do not exist, and there is a paucity of detailed lithostra-
tigraphic, sequence-stratigraphic, and structural data for
the Miocene series near the study area. Van Wagoner
et al. (1990) presented a regional cross section of mid-
dle Miocene fourth-order sequences of onshore south-
central Louisiana. However, the authors cited no pub-
lished study for this work to enable access to primary
data. Using seismic data, Wagner et al. (1994) exam-
ined the lower Miocene sequence stratigraphy of the
nearshore West Cameron and East Cameron areas in
the Federal Outer Continental Shelf approximately
25 mi (�40 km) west of Starfak field. Wells in Starfak
and Tiger Shoal fields do not penetrate the part of the
lower Miocene examined by these authors; however,
we do have seismic coverage of the lower Miocene in
our study area, and their conclusions were useful in our
Hentz and Zeng 199
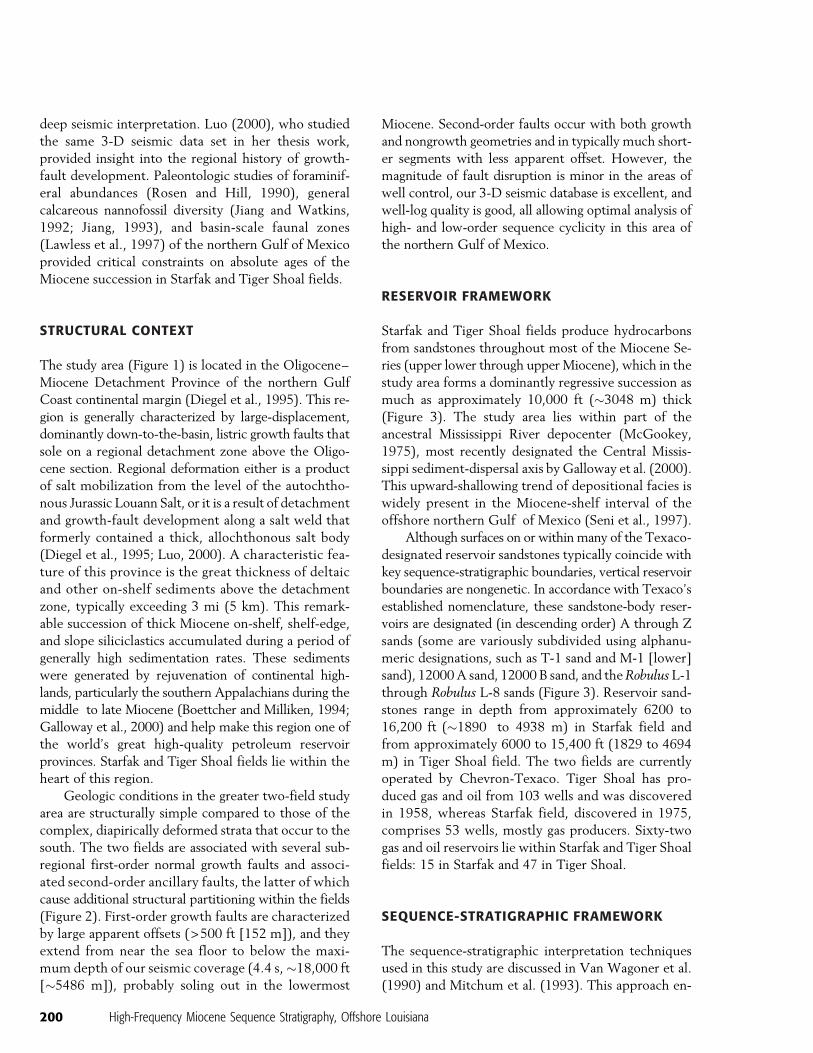
Figure 1. Map of study area within Vermilion and South MarshIsland areas, offshore south-central Louisiana, showing areas ofwell-log coverage (Starfak and Tiger Shoal fields) and outlines(dashed lines) of two 3-D seismic surveys used in the study.
deep seismic interpretation. Luo (2000), who studied
the same 3-D seismic data set in her thesis work,
provided insight into the regional history of growth-
fault development. Paleontologic studies of foraminif-
eral abundances (Rosen and Hill, 1990), general
calcareous nannofossil diversity (Jiang and Watkins,
1992; Jiang, 1993), and basin-scale faunal zones
(Lawless et al., 1997) of the northern Gulf of Mexico
provided critical constraints on absolute ages of the
Miocene succession in Starfak and Tiger Shoal fields.
STRUCTURAL CONTEXT
The study area (Figure 1) is located in the Oligocene–
Miocene Detachment Province of the northern Gulf
Coast continental margin (Diegel et al., 1995). This re-
gion is generally characterized by large-displacement,
dominantly down-to-the-basin, listric growth faults that
sole on a regional detachment zone above the Oligo-
cene section. Regional deformation either is a product
of salt mobilization from the level of the autochtho-
nous Jurassic Louann Salt, or it is a result of detachment
and growth-fault development along a salt weld that
formerly contained a thick, allochthonous salt body
(Diegel et al., 1995; Luo, 2000). A characteristic fea-
ture of this province is the great thickness of deltaic
and other on-shelf sediments above the detachment
zone, typically exceeding 3 mi (5 km). This remark-
able succession of thick Miocene on-shelf, shelf-edge,
and slope siliciclastics accumulated during a period of
generally high sedimentation rates. These sediments
were generated by rejuvenation of continental high-
lands, particularly the southern Appalachians during the
middle to late Miocene (Boettcher and Milliken, 1994;
Galloway et al., 2000) and help make this region one of
the world’s great high-quality petroleum reservoir
provinces. Starfak and Tiger Shoal fields lie within the
heart of this region.
Geologic conditions in the greater two-field study
area are structurally simple compared to those of the
complex, diapirically deformed strata that occur to the
south. The two fields are associated with several sub-
regional first-order normal growth faults and associ-
ated second-order ancillary faults, the latter of which
cause additional structural partitioning within the fields
(Figure 2). First-order growth faults are characterized
by large apparent offsets (>500 ft [152 m]), and they
extend from near the sea floor to below the maxi-
mum depth of our seismic coverage (4.4 s,�18,000 ft
[�5486 m]), probably soling out in the lowermost
Miocene. Second-order faults occur with both growth
and nongrowth geometries and in typically much short-
er segments with less apparent offset. However, the
magnitude of fault disruption is minor in the areas of
well control, our 3-D seismic database is excellent, and
well-log quality is good, all allowing optimal analysis of
high- and low-order sequence cyclicity in this area of
the northern Gulf of Mexico.
RESERVOIR FRAMEWORK
Starfak and Tiger Shoal fields produce hydrocarbons
from sandstones throughout most of the Miocene Se-
ries (upper lower through upper Miocene), which in the
study area forms a dominantly regressive succession as
much as approximately 10,000 ft (�3048 m) thick
(Figure 3). The study area lies within part of the
ancestral Mississippi River depocenter (McGookey,
1975), most recently designated the Central Missis-
sippi sediment-dispersal axis by Galloway et al. (2000).
This upward-shallowing trend of depositional facies is
widely present in the Miocene-shelf interval of the
offshore northern Gulf of Mexico (Seni et al., 1997).
Although surfaces on or within many of the Texaco-
designated reservoir sandstones typically coincide with
key sequence-stratigraphic boundaries, vertical reservoir
boundaries are nongenetic. In accordance with Texaco’s
established nomenclature, these sandstone-body reser-
voirs are designated (in descending order) A through Z
sands (some are variously subdivided using alphanu-
meric designations, such as T-1 sand and M-1 [lower]
sand), 12000A sand, 12000 B sand, and theRobulus L-1through Robulus L-8 sands (Figure 3). Reservoir sand-
stones range in depth from approximately 6200 to
16,200 ft (�1890 to 4938 m) in Starfak field and
from approximately 6000 to 15,400 ft (1829 to 4694
m) in Tiger Shoal field. The two fields are currently
operated by Chevron-Texaco. Tiger Shoal has pro-
duced gas and oil from 103 wells and was discovered
in 1958, whereas Starfak field, discovered in 1975,
comprises 53 wells, mostly gas producers. Sixty-two
gas and oil reservoirs lie within Starfak and Tiger Shoal
fields: 15 in Starfak and 47 in Tiger Shoal.
SEQUENCE-STRATIGRAPHIC FRAMEWORK
The sequence-stratigraphic interpretation techniques
used in this study are discussed in Van Wagoner et al.
(1990) and Mitchum et al. (1993). This approach en-
200 High-Frequency Miocene Sequence Stratigraphy, Offshore Louisiana
abled construction of a genetic context for all phases
of our study of the Miocene succession (Hentz et al.,
2000, 2001, 2002; Zeng et al., 2000, 2001a, b, c; Badescu
and Zeng, 2001; DeAngelo and Wood, 2001; Rassi and
Hentz, 2001; Zeng, 2001; Dutton and Hentz, 2002;
Rassi, 2002; Zeng and Wood, 2002). Moreover, it estab-
lishes the groundwork for investigations of reservoir-
specific attributes and the identification of previously
undetected hydrocarbon resources within the two-field
area, this study’s 3-D seismic volume, and adjacent on-
shelf areas.
Biostratigraphy
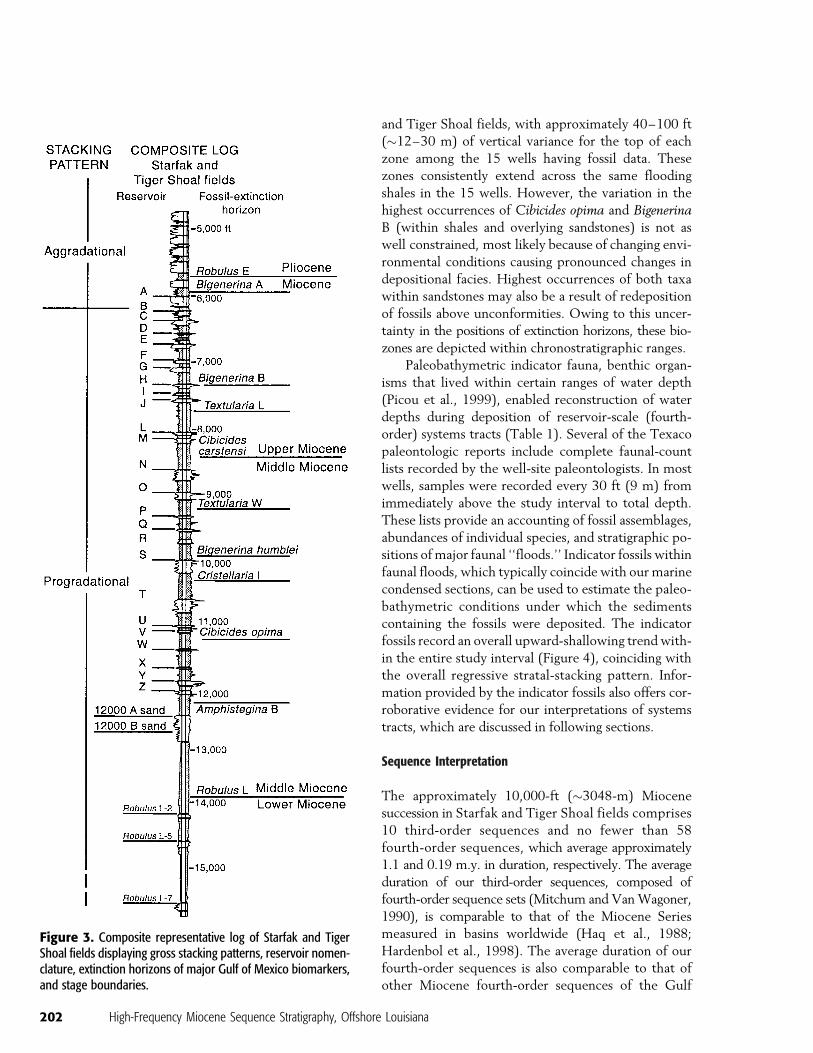
Faunal data from unpublished Texaco paleontologic
reports from 15 wells in both fields indicate that the
approximately 10,000-ft (�3048-m) section from the
oldest reservoir (RobulusL-8 sand) at the base of the studyinterval to the Pliocene/Miocene boundary just above
the uppermost reservoir (A sand) represents approxi-
mately 11.2 m.y. of deposition. The study interval
ranges in age from latest early Miocene (late Burdi-
galian, �17.3 Ma) to the end of the Miocene (early
Messinian, �6.1 Ma). We employ the Miocene stage
boundaries used by Texaco: the extinction horizons
of Robulus L (top of lower Miocene), Cibicidescarstensi (top of middle Miocene), and Robulus E (top
of upper Miocene) (R. G. Lytton III, 2001, personal
communication). Fourteen regional Gulf of Mexico
foraminiferal biozones (Picou et al., 1999) occur within
the study interval, ranging from the Cibicides 38 and
Robulus L zones (�16.5 Ma) to the Robulus E zone
(�6.1 Ma) at the top of the Miocene series. However,
lower Miocene strata in deep wells in nearby North
Light House Point and Mound Point fields (Figure 1)
record the regional Operculinoides zone (extinction hori-
zon of Robulus 54-B), the next oldest regional Gulf of
Mexico biozone (at �18.0 Ma), occurring at approx-
imately 600–700 ft (�183–213 m) below the base of
the deepest well-log section in the two study fields.
Ages of regional biozones in our study were initially
derived from Lawless et al. (1997), who used the time-
scale of Berggren et al. (1985); we converted these ages
to the revised chronology of Berggren et al. (1995).
In most instances, the top of each regional biozone
is chronostratigraphically well constrained in Starfak
Hentz and Zeng 201
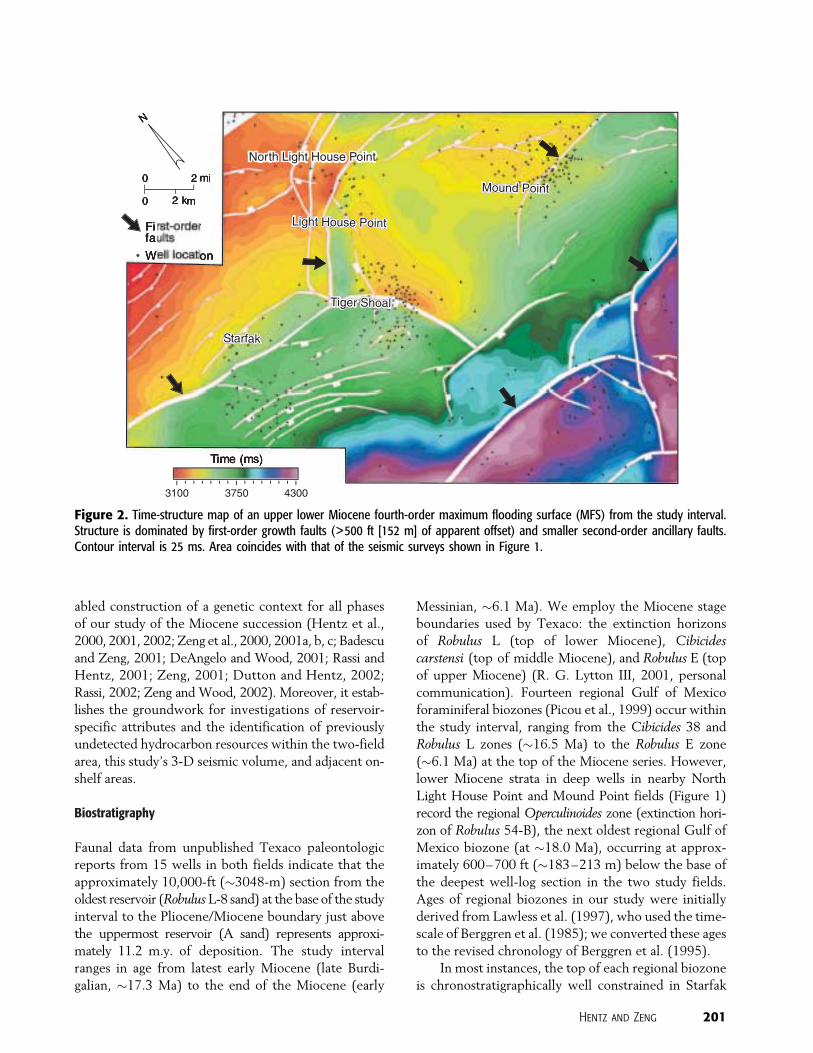
Figure 2. Time-structure map of an upper lower Miocene fourth-order maximum flooding surface (MFS) from the study interval.Structure is dominated by first-order growth faults (>500 ft [152 m] of apparent offset) and smaller second-order ancillary faults.Contour interval is 25 ms. Area coincides with that of the seismic surveys shown in Figure 1.
and Tiger Shoal fields, with approximately 40–100 ft
(�12–30 m) of vertical variance for the top of each
zone among the 15 wells having fossil data. These
zones consistently extend across the same flooding
shales in the 15 wells. However, the variation in the
highest occurrences of Cibicides opima and BigenerinaB (within shales and overlying sandstones) is not as
well constrained, most likely because of changing envi-
ronmental conditions causing pronounced changes in
depositional facies. Highest occurrences of both taxa
within sandstones may also be a result of redeposition
of fossils above unconformities. Owing to this uncer-
tainty in the positions of extinction horizons, these bio-
zones are depicted within chronostratigraphic ranges.
Paleobathymetric indicator fauna, benthic organ-
isms that lived within certain ranges of water depth
(Picou et al., 1999), enabled reconstruction of water
depths during deposition of reservoir-scale (fourth-
order) systems tracts (Table 1). Several of the Texaco
paleontologic reports include complete faunal-count
lists recorded by the well-site paleontologists. In most
wells, samples were recorded every 30 ft (9 m) from
immediately above the study interval to total depth.
These lists provide an accounting of fossil assemblages,
abundances of individual species, and stratigraphic po-
sitions ofmajor faunal ‘‘floods.’’ Indicator fossils within
faunal floods, which typically coincide with our marine
condensed sections, can be used to estimate the paleo-
bathymetric conditions under which the sediments
containing the fossils were deposited. The indicator
fossils record an overall upward-shallowing trend with-
in the entire study interval (Figure 4), coinciding with
the overall regressive stratal-stacking pattern. Infor-
mation provided by the indicator fossils also offers cor-
roborative evidence for our interpretations of systems
tracts, which are discussed in following sections.
Sequence Interpretation
The approximately 10,000-ft (�3048-m) Miocene
succession in Starfak and Tiger Shoal fields comprises
10 third-order sequences and no fewer than 58
fourth-order sequences, which average approximately
1.1 and 0.19 m.y. in duration, respectively. The average
duration of our third-order sequences, composed of
fourth-order sequence sets (Mitchum and VanWagoner,
1990), is comparable to that of the Miocene Series
measured in basins worldwide (Haq et al., 1988;
Hardenbol et al., 1998). The average duration of our
fourth-order sequences is also comparable to that of
other Miocene fourth-order sequences of the Gulf
202 High-Frequency Miocene Sequence Stratigraphy, Offshore Louisiana
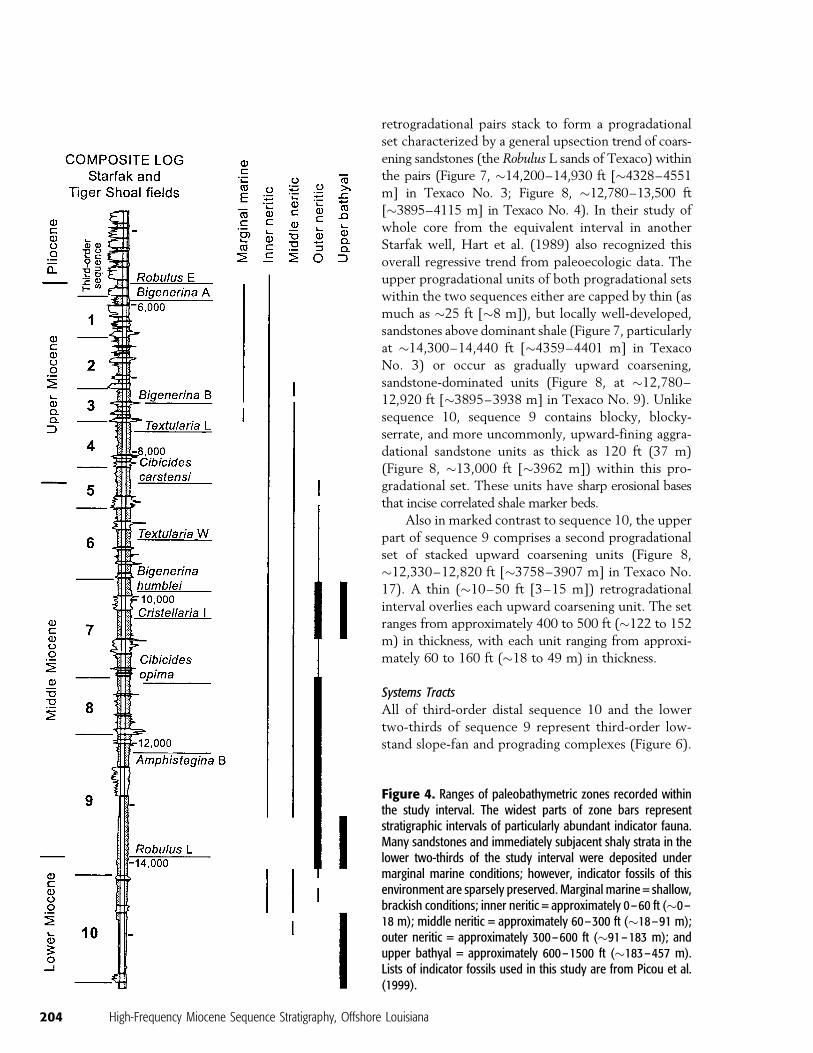
Figure 3. Composite representative log of Starfak and TigerShoal fields displaying gross stacking patterns, reservoir nomen-clature, extinction horizons of major Gulf of Mexico biomarkers,and stage boundaries.
Coast Basin (Van Wagoner et al., 1990). Because our
data set does not allow observation of the full shelf-to-
basin profile of the Miocene sequences, relative
positions of coastal onlap can only be inferred. How-
ever, the third-order sequences exhibit an upward-
thinning trend (Figure 5), the upsection occurrence of
progressively shallower water benthic-fossil assemblages
(Figure 4), decreasing fossil abundance and diversity
(Figure 5), and a generally upward thinning of lowstand
systems tracts, collectively indicating the progressive up-
section coastal offlap of the Miocene succession.
Conceptually, stratal stacking patterns within third-
order systems tracts vary relative to their position in the
shelf-to-basin depositional profile (Mitchum and Van
Wagoner, 1990; Mitchum et al., 1993). Furthermore,
these variations coincide with changes in stratal at-
tributes of the component fourth-order systems tracts.
Therefore, we subdivided the study interval into dis-
tal, medial, and proximal third-order sequences, based
on their relative positions in a generalized Miocene
shelf-to-basin depositional profile (Figure 6), to sys-
tematically document larger scale stratal and depo-
sitional trends within the approximately 10,000-ft
(�3048-m) study interval.
Distal Sequences (SB 10 to SB 8)
Stratal Characteristics
Third-order sequences 10 and 9 (lower and middle
Miocene) extend from sequence boundary (SB) 10
near the base of the study interval to SB 8, just above
the regional Amphistegina B biozone (Figures 7, 8).
The sequences are comparable in thickness, ranging
between approximately 1600 and 1800 ft (�488 and
548 m) respectively. Both sequences are characterized
by thick (as much as �1100 ft [�335 m]) shale-
dominated sections in their lower parts. These thick
basal shales contain periodic, interbedded shaly sand-
stones within thin zones of several tens of feet that
exhibit both upward-fining and upward coarsening
trends. The basal contact of sequence 10 differs from
that of sequence 9 by exhibiting thick (each as much
as �250 ft [�76.2 m]) single or multiple, blocky-
serrate, aggradational sandstone units that record little
or no incision (Figure 7, �15,700–15,900 ft [�4785–
4846 m] in Texaco No. 3).
In both sequences, the thick basal shale interval is
overlain by a series of interstratified upward coarsening,
progradational shale-and-sandstone units, totaling ap-
proximately 580–770 ft (�152–235 m), with each
unit as much as approximately 200 ft (�61 m)
thick. Thin (as much as �40 ft [�12 m]), typically
weakly developed retrogradational shale sections over-
lie the progradational units. These progradational-
Hentz and Zeng 203
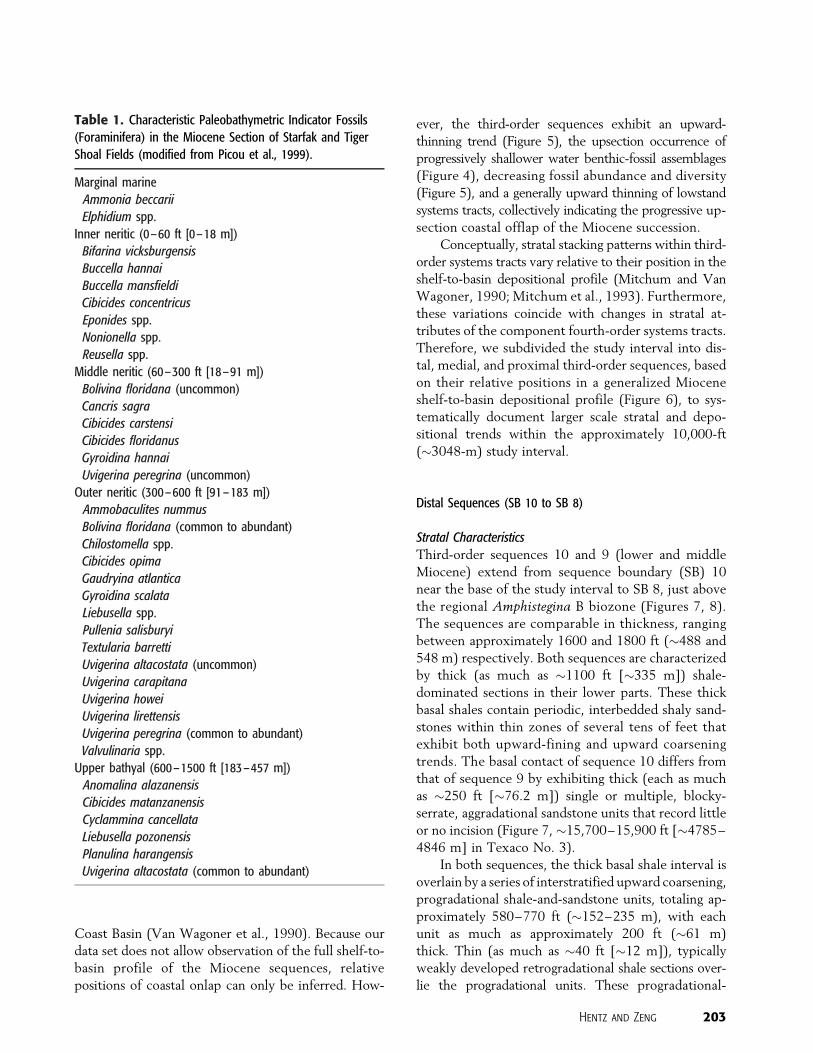
Table 1. Characteristic Paleobathymetric Indicator Fossils(Foraminifera) in the Miocene Section of Starfak and Tiger
Shoal Fields (modified from Picou et al., 1999).
Marginal marine
Ammonia beccarii
Elphidium spp.
Inner neritic (0–60 ft [0–18 m])
Bifarina vicksburgensis
Buccella hannai
Buccella mansfieldi
Cibicides concentricus
Eponides spp.
Nonionella spp.
Reusella spp.
Middle neritic (60–300 ft [18–91 m])
Bolivina floridana (uncommon)
Cancris sagra
Cibicides carstensi
Cibicides floridanus
Gyroidina hannai
Uvigerina peregrina (uncommon)
Outer neritic (300–600 ft [91–183 m])
Ammobaculites nummus
Bolivina floridana (common to abundant)
Chilostomella spp.
Cibicides opima
Gaudryina atlantica
Gyroidina scalata
Liebusella spp.
Pullenia salisburyi
Textularia barretti
Uvigerina altacostata (uncommon)
Uvigerina carapitana
Uvigerina howei
Uvigerina lirettensis
Uvigerina peregrina (common to abundant)
Valvulinaria spp.
Upper bathyal (600–1500 ft [183–457 m])
Anomalina alazanensis
Cibicides matanzanensis
Cyclammina cancellata
Liebusella pozonensis
Planulina harangensis
Uvigerina altacostata (common to abundant)
retrogradational pairs stack to form a progradational
set characterized by a general upsection trend of coars-
ening sandstones (the Robulus L sands of Texaco) within
the pairs (Figure 7, �14,200–14,930 ft [�4328–4551
m] in Texaco No. 3; Figure 8, �12,780–13,500 ft
[�3895–4115 m] in Texaco No. 4). In their study of
whole core from the equivalent interval in another
Starfak well, Hart et al. (1989) also recognized this
overall regressive trend from paleoecologic data. The
upper progradational units of both progradational sets
within the two sequences either are capped by thin (as
much as �25 ft [�8 m]), but locally well-developed,
sandstones above dominant shale (Figure 7, particularly
at �14,300–14,440 ft [�4359–4401 m] in Texaco
No. 3) or occur as gradually upward coarsening,
sandstone-dominated units (Figure 8, at �12,780–
12,920 ft [�3895–3938 m] in Texaco No. 9). Unlike
sequence 10, sequence 9 contains blocky, blocky-
serrate, and more uncommonly, upward-fining aggra-
dational sandstone units as thick as 120 ft (37 m)
(Figure 8, �13,000 ft [�3962 m]) within this pro-
gradational set. These units have sharp erosional bases
that incise correlated shale marker beds.
Also in marked contrast to sequence 10, the upper
part of sequence 9 comprises a second progradational
set of stacked upward coarsening units (Figure 8,
�12,330–12,820 ft [�3758–3907 m] in Texaco No.
17). A thin (�10–50 ft [3–15 m]) retrogradational
interval overlies each upward coarsening unit. The set
ranges from approximately 400 to 500 ft (�122 to 152
m) in thickness, with each unit ranging from approxi-
mately 60 to 160 ft (�18 to 49 m) in thickness.
Systems Tracts
All of third-order distal sequence 10 and the lower
two-thirds of sequence 9 represent third-order low-
stand slope-fan and prograding complexes (Figure 6).
204 High-Frequency Miocene Sequence Stratigraphy, Offshore Louisiana
Figure 4. Ranges of paleobathymetric zones recorded withinthe study interval. The widest parts of zone bars representstratigraphic intervals of particularly abundant indicator fauna.Many sandstones and immediately subjacent shaly strata in thelower two-thirds of the study interval were deposited undermarginal marine conditions; however, indicator fossils of thisenvironment are sparsely preserved. Marginal marine = shallow,brackish conditions; inner neritic = approximately 0–60 ft (�0–18 m); middle neritic = approximately 60–300 ft (�18–91 m);outer neritic = approximately 300–600 ft (�91–183 m); andupper bathyal = approximately 600–1500 ft (�183–457 m).Lists of indicator fossils used in this study are from Picou et al.(1999).
Basin-floor-fan sandstones also occur at the base of
sequence 10. Well-log expressions of these lowstand
divisions conform to those described in Mitchum et al.
(1990, 1993). Benthic paleofauna indicate that the
third-order lowstand systems tracts in the two sequences
represent overall upward-shallowing successions that
range from basin-floor and lower and upper slope
(upper bathyal) deposits at the base to inner-shelf
(marginal marine to middle-neritic) facies at the top
(Figures 4, 7, 8). The third-order SB of sequence 10
(Figure 7, at�15,760 ft [�4785m] in TexacoNo. 4 and
�15,890 ft [�4843 m] in Texaco No. 3) coincides
with the base of a thick blocky-serrate basin-floor-fan
sandstone deposited in an upper bathyal environment.
The base of another well-developed basin-floor-fan
sandstone approximately 150–200 ft (�46–61 m)
below SB 10 (Figure 7, at �16,150 ft [�4922 m] in
Texaco No. 3) in a few deep wells may represent
another third-order SB near the distal margin of an older
fan deposit.
The thick shale intervals in the lower parts of se-
quences 10 and 9 represent outer-neritic to upper bathy-
al (Figure 4) slope-fan deposits. Sandy zones within
them probably record midslope turbidites and shin-
gled turbidite channel/levee deposits that mark fourth-
order clinoform toes (Erskine and Vail, 1988) or fourth-
order basin-floor fans (Mitchum et al., 1993). We could
not systematically correlate possible fourth-order
sequence boundaries through the slope-fan deposits
where progradational intervals are not consistently well
defined. Mitchum and Van Wagoner (1990) proposed
that sequence boundaries are not easily recognized in
third-order slope fans because they have no shallow-
marine equivalents.
Fourth-order sequence boundaries of the sequence
10 prograding complex coincide with the bases of
upward coarsening, prograding-wedge sandstone/shale
units (top of sequence) deposited in marginal marine
to middle/outer-neritic environments. Hart et al. (1989)
noted a mix of terrestrial, estuarine, and marine paly-
nomorphs in whole cores from two of the fourth-
order prograding wedges in sequence 10 (second and
fifth wedges from the base in Figure 7). They inter-
preted the depositional setting of the sandstones as
outer-neritic shelf, possibly storm or deltaic deposits,
Hentz and Zeng 205
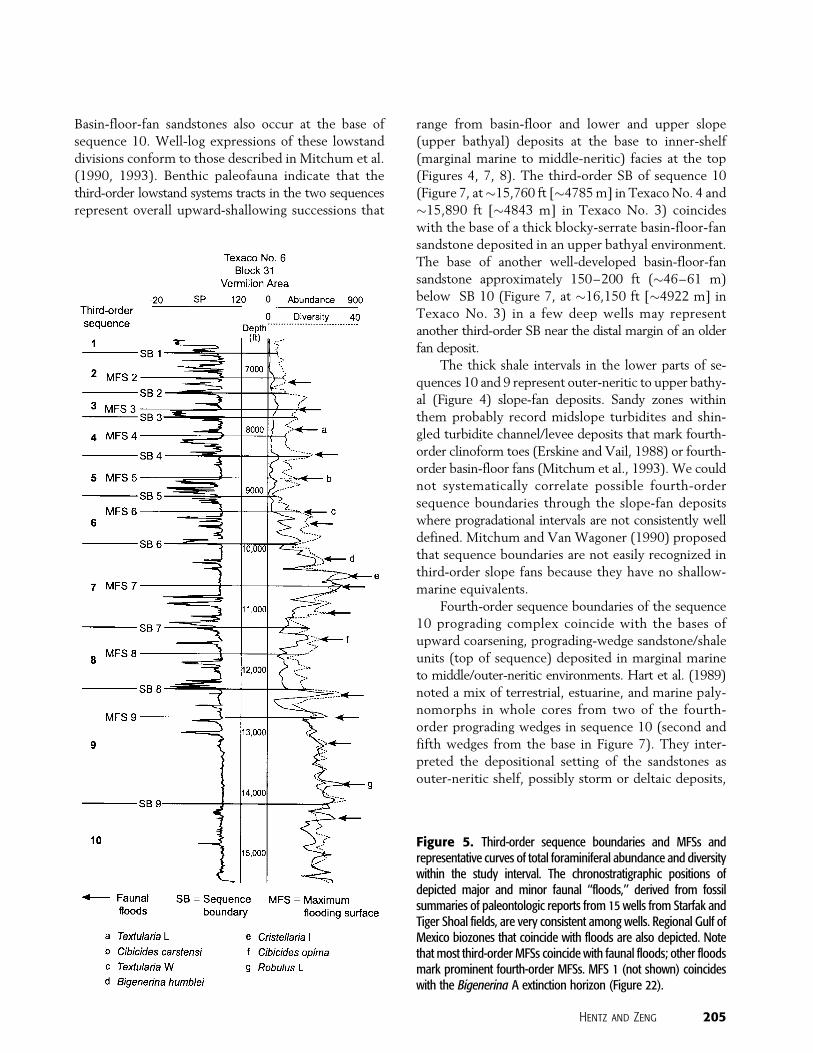
Figure 5. Third-order sequence boundaries and MFSs andrepresentative curves of total foraminiferal abundance and diversitywithin the study interval. The chronostratigraphic positions ofdepicted major and minor faunal ‘‘floods,’’ derived from fossilsummaries of paleontologic reports from 15 wells from Starfak andTiger Shoal fields, are very consistent among wells. Regional Gulf ofMexico biozones that coincide with floods are also depicted. Notethat most third-order MFSs coincide with faunal floods; other floodsmark prominent fourth-order MFSs. MFS 1 (not shown) coincideswith the Bigenerina A extinction horizon (Figure 22).
but inferred no sequence-stratigraphic context. An
internal Texaco report of the lower core from the
same well (interpreted in Dutton and Hentz, 2002)
ascribed a similar depositional/paleobathymetric set-
ting. We concur with a deltaic setting but conclude
that the progradational units represent a range of
marginal marine (sandy top) to possible middle-
neritic (shaly base) water depths. Seismic imaging of
the sandier upper parts of the prograding complexes
in distal and medial sequences by amplitude stratal
slicing (Zeng et al., 2001a) shows that fourth-order
wedges are as much as 10 mi (16 km) in strike width
and more than 3 mi (5 km) in the dip dimension
(Figure 9). Third-order prograding complexes (se-
quence sets) are only marginally wider along deposi-
tional strike (as much as approximately 12 mi [�19
km]), indicating focused lowstand deltaic deposition
within the third-order (1.1 m.y.) time frame. These
dimensions contrast markedly with the much greater
areal dimensions of the highstand deltas (discussed in
‘‘Medial Sequences’’).
The sequence 9 third-order prograding complex
contains inferred incised-valley fills (blocky sandstones)
and generally better developed fourth-order prograding-
wedge sandstones (than those in sequence 10) in the
upper part (Figures 8, 9). No basin-floor-fan sandstones
occur at the base of sequence 9. Moreover, unlike se-
quence 10, the upper third of sequence 9 comprises a
well-developed sequence set of fourth-order highstand
and transgressive systems tracts that represents the
third-order highstand systems tract, which was depos-
ited in marginal marine to outer-neritic water depths.
These features all indicate a more proximal position
for sequence 9 relative to that of sequence 10.
The inferred third-order transgressive systems tract
and the MFS of sequence 9 that coincides with a major
faunal flood (Figure 5) immediately overlie the third-
order lowstand systems tract (Figure 8). Relative to the
206 High-Frequency Miocene Sequence Stratigraphy, Offshore Louisiana
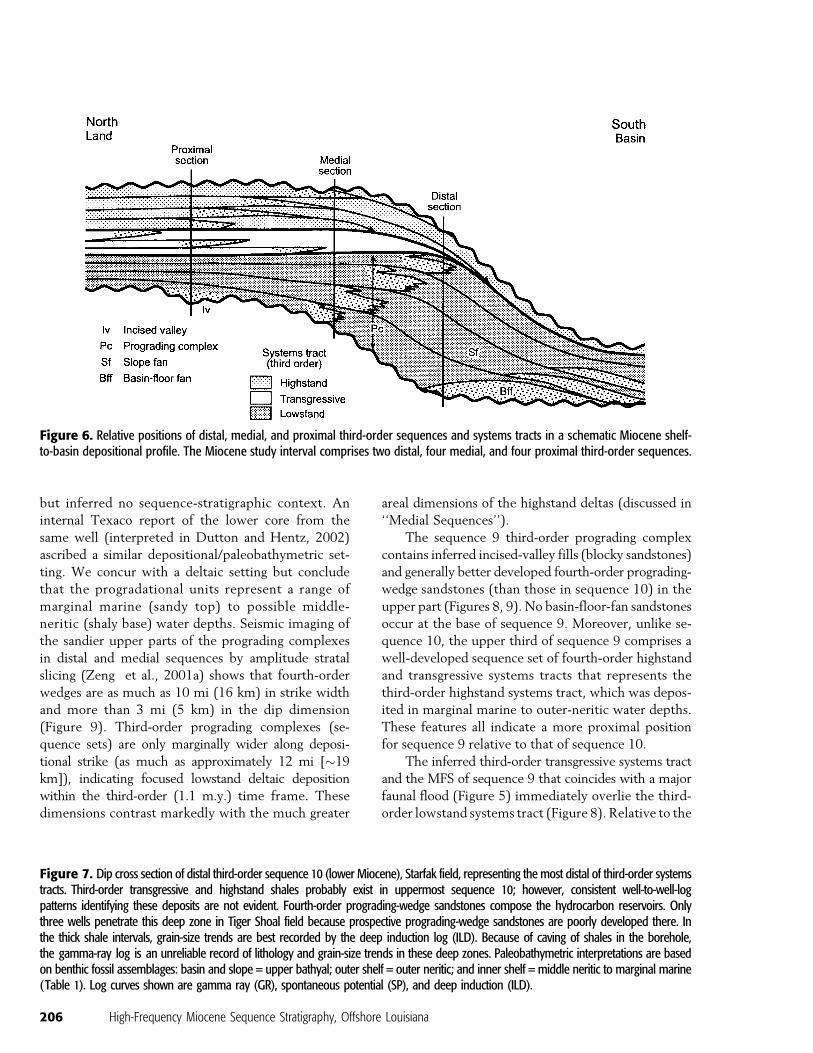
Figure 6. Relative positions of distal, medial, and proximal third-order sequences and systems tracts in a schematic Miocene shelf-to-basin depositional profile. The Miocene study interval comprises two distal, four medial, and four proximal third-order sequences.
Figure 7. Dip cross section of distal third-order sequence 10 (lower Miocene), Starfak field, representing the most distal of third-order systemstracts. Third-order transgressive and highstand shales probably exist in uppermost sequence 10; however, consistent well-to-well-logpatterns identifying these deposits are not evident. Fourth-order prograding-wedge sandstones compose the hydrocarbon reservoirs. Onlythree wells penetrate this deep zone in Tiger Shoal field because prospective prograding-wedge sandstones are poorly developed there. Inthe thick shale intervals, grain-size trends are best recorded by the deep induction log (ILD). Because of caving of shales in the borehole,the gamma-ray log is an unreliable record of lithology and grain-size trends in these deep zones. Paleobathymetric interpretations are basedon benthic fossil assemblages: basin and slope = upper bathyal; outer shelf = outer neritic; and inner shelf = middle neritic to marginal marine(Table 1). Log curves shown are gamma ray (GR), spontaneous potential (SP), and deep induction (ILD).
Hentz and Zeng 207
208 High-Frequency Miocene Sequence Stratigraphy, Offshore Louisiana
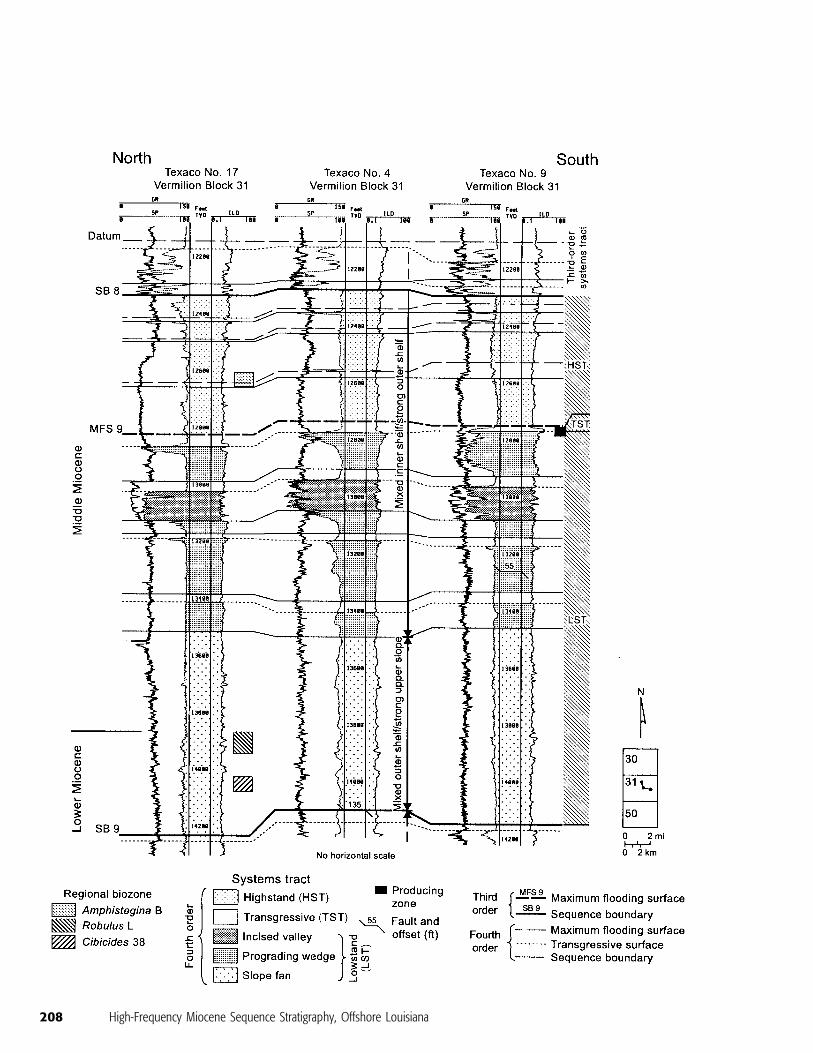
third-order transgressive systems tracts of most over-
lying, more proximal sequences, this unit is thin (as
much as 40 ft [12 m] thick) because of its distal
position. Although distal, shaly transgressive and high-
stand deposits probably overlie the lowstand prograd-
ing complex of sequence 10 (near SB 9), we could not
clearly identify them from thewell-log expression. Trans-
gressive systems tracts are expressed as a retrogradational
(upward-fining, upward-thinning) pattern on gamma-
ray, spontaneous-potential, and resistivity logs. The top
of the retrogradational log pattern commonly coincides
with a high-gamma-ray marker, the position of the MFS.
In the distal sequences, the transgressive systems tracts
are typically thin and shaly and cannot be confidently
distinguished from distal highstand deposits. Retro-
gradational log patterns of transgressive systems tracts
are more clearly discernible in the medial and proximal
sequences.
Medial Sequences (SB 8 to SB 4)
Stratal Characteristics
Medial third-order sequences 8 through 5 (middle to
upper Miocene, SB 8 to SB 4) range from approxi-
mately 600 to 1800 ft (�183 to 548m) in thickness and
extend from approximately 300 ft (�91 m) above the
regionalAmphistegina B biozone to approximately 75 ft
(�23 m) above the Cibicides inflata biozone (Figures
10–13). Each of the medial sequences comprises three
distinct stratigraphic divisions: (1) a lower succession of
two to five aggradational (�40–250 ft [�12–76 m]
thick) or progradational (�50–180 ft [�15–55 m]
thick) units; (2) an atypically thick (�70–190 ft [�21–
58 m]), upward-fining, retrogradational, shale-domi-
nated section in the middle; and (3) an upper section of
typically two to four (50–500 ft [15–152 m] thick)
mostly progradational units of thicker shales and sand-
stones. Progradational and aggradational units in the
lower and upper divisions are interstratified with thin-
ner (�15–50 ft [�5–15 m]) shaly retrogradational
intervals. Erosionally based blocky, blocky-serrate, and
upward-fining sandstone units (�40–250 ft [�12–76
m] thick) are more common in the lower succession,
whereas upward coarsening sandstone/shale units dom-
inate the upper division.
Unlike those of the distal successions, the basal
third-order sequence boundaries of themedial sequences
are locally marked by pronounced erosional contacts
overlain by these sharp-based aggradational sandstone
units. In other areas, the basal contacts are conformable,
correlating from erosional bases of the sandstone units
to the tops of upward coarsening progradational units.
In the lower two medial sequences, erosional contacts
also correlate with conformable to slightly erosional bases
of thick (as much as �250 ft [�76 m]), typically upward
coarsening intervals (only shown in Figure 11, e.g.,
�11,000–11,850 ft [�3353–3612 m] in Houston Oil
& Minerals No. 5). These progradational intervals
are restricted to the downdip part of the area of well
control, and their occurrence coincides with marked
thickening of the third-order sequence. They differ from
the progradational units in the updip areas by being
thicker and containing a higher percentage of sand-
stone, typically composing gradually upward coarsening,
sandstone-dominated units with no prominent shale
base. In marked contrast to the distal sequences, a thick
basal upper-bathyal to outer-neritic shale is not present
in the medial sequences.
Themiddle retrogradational unit only uncommon-
ly contains sandstone beds, which primarily occur in
wells from the updip (northern) parts of the sequences
(Figure 10, unit below MFS 8).
In the upper division, the progradational/retrogra-
dational pairs stack to form a progradational set char-
acterized by a general upsection trend of increasing
sandstone grain size, bed thickness, and number of
sandstone beds within the pairs.
Systems Tracts
The lower, middle, and upper stratigraphic divisions of
the medial sequences represent third-order lowstand,
transgressive, and highstand systems tracts, respective-
ly, that accumulated in upper slope/outer shelf to flu-
vial environments in marine water depths that ranged
from upper bathyal to marginal marine, as indicated by
fossil data (Figures 4, 10–13). Two to five relatively
thin (�75–100 ft [�23–30 m]) closely spaced fourth-
order sequences form the lowstand systems tract. The
third-order lowstand systems tract is overlain by the
third-order transgressive systems tract, an atypically
Hentz and Zeng 209
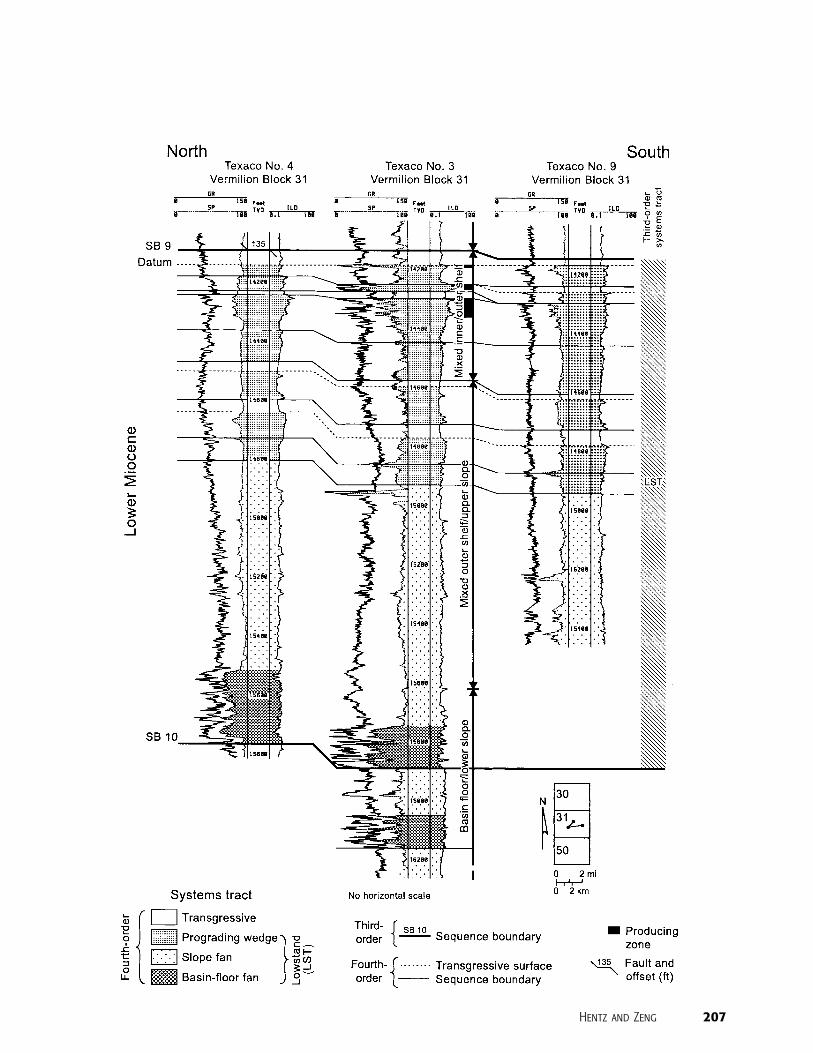
Figure 8. Dip cross section of distal third-order sequence 9 (lower and middle Miocene), Starfak field. Producing zones occur in fourth-order prograding-wedge and incised-valley-fill sandstones of the third-order lowstand systems tract. Biozone ‘‘boxes’’ record verticalvariance for the top of each zone among the wells with fossil data. Paleobathymetric interpretations are based on benthic fossilassemblages: upper slope = upper bathyal; outer shelf = outer neritic; and inner shelf = middle neritic to marginal marine (Table 1).
thick, shale-dominated retrogradational interval. The
upper division, two to four fourth-order highstand sys-
tems tracts (locally incised by valley fills and interstra-
tified with thin transgressive systems tracts) composing
a progradational sequence set, forms the third-order
highstand systems tract.
The third-order lowstand systems tracts in the
lower two medial sequences 8 and 7 record the transi-
tion from upper-slope, proximal parts of fourth-order
prograding wedges (downdip) to the on-shelf parts of
fourth-order highstand deposits locally incised by valley
fills that are equivalent to the wedges (updip). This
210 High-Frequency Miocene Sequence Stratigraphy, Offshore Louisiana
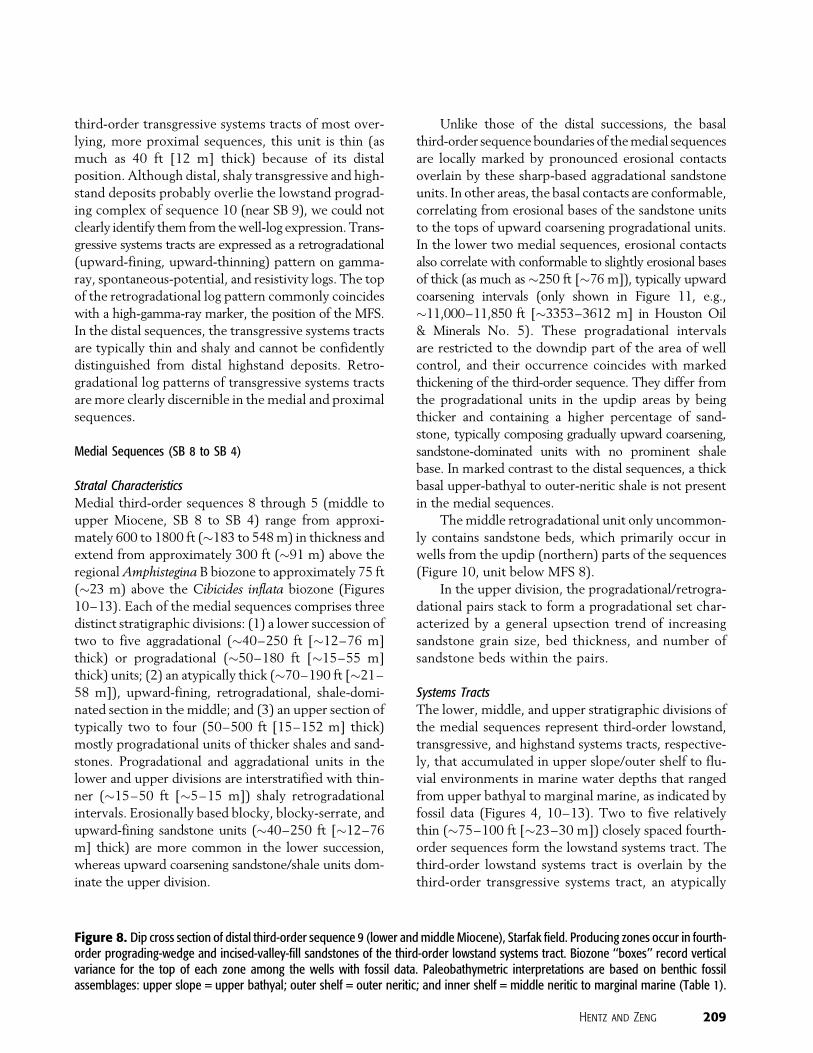
Figure 9. Amplitude stratal slice and well-log expression of the uppermost fourth-order prograding wedge in sequence 9 (Figure 8).Well 1 (Texaco No. 6, Vermilion Block 31,�12,700–13,050 ft [�3871–3978 m]) captures the log expression of the margin of the wedge,whereas wells 2 and 4 (Texaco No. 8, Vermilion Block 31,�12,700–13,000 ft [�3871–3962 m], and Houston Oil & Minerals No. B-2(4),Vermilion Block 50,�12,900–13,300 ft [�3932–4054m]) exhibit the sandier accumulations within the central part. Well 3 (Houston Oil& Minerals No. E-1(9), Vermilion Block 50, �12,850–13,200 ft [�3917–4023 m]) probably represents fluvial deposition within anincised valley (sharp-based blocky-serrate sandstone) concurrent with wedge progradation, followed by estuarine and bay-head delta(retrogradational middle part and upper progradational sandstone, respectively) deposition. Imaging of the distal parts of most wedgesis limited by the southwestern boundary of the 3-D seismic data volume. Relief on the first-order growth fault just north of the wedgeprobably formed the exposed shelf edge below which relative sea level fell during lowstand deltaic deposition.
Hentz
andZeng
211
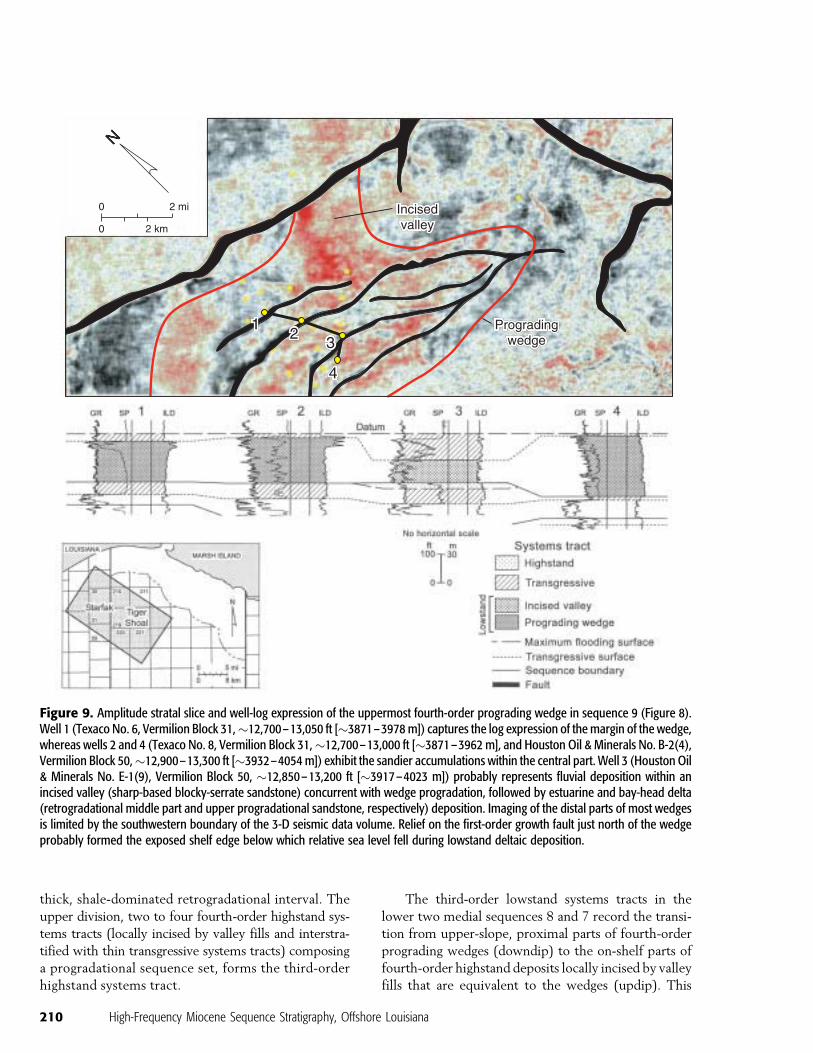
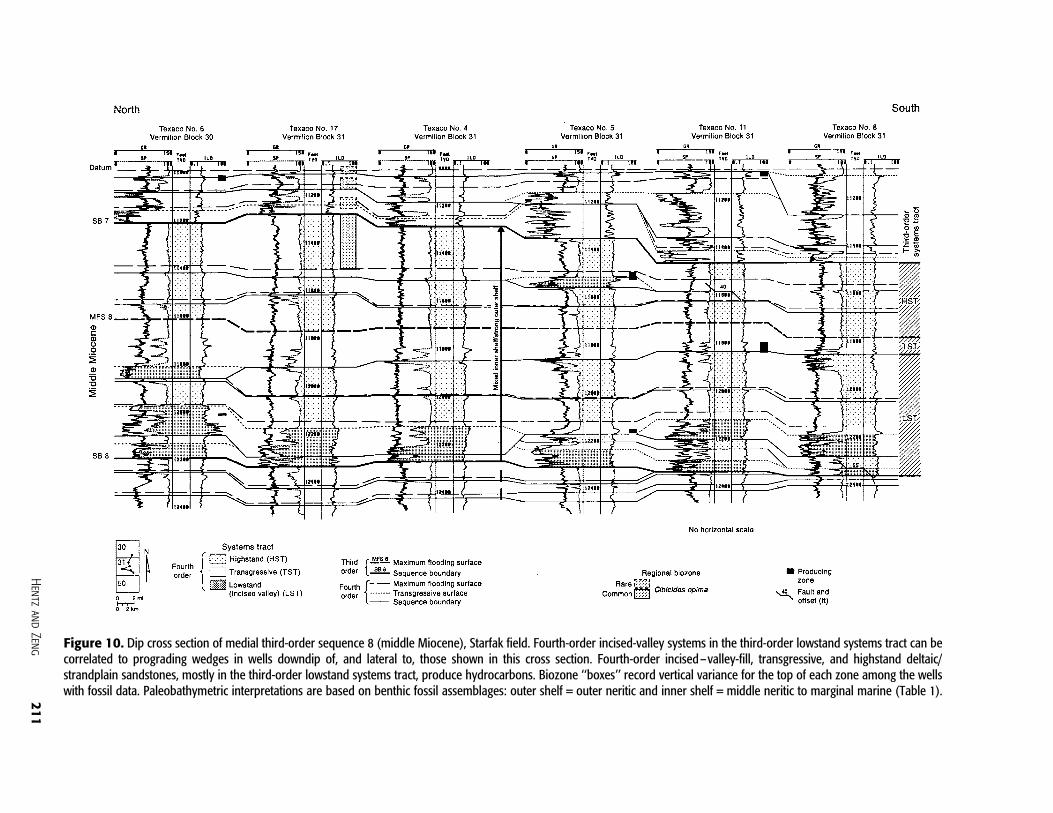
Figure 10. Dip cross section of medial third-order sequence 8 (middle Miocene), Starfak field. Fourth-order incised-valley systems in the third-order lowstand systems tract can becorrelated to prograding wedges in wells downdip of, and lateral to, those shown in this cross section. Fourth-order incised–valley-fill, transgressive, and highstand deltaic/strandplain sandstones, mostly in the third-order lowstand systems tract, produce hydrocarbons. Biozone ‘‘boxes’’ record vertical variance for the top of each zone among the wellswith fossil data. Paleobathymetric interpretations are based on benthic fossil assemblages: outer shelf = outer neritic and inner shelf = middle neritic to marginal marine (Table 1).
212
High-Frequency
Miocene
SequenceStratigraphy,
Offshore
Louisiana
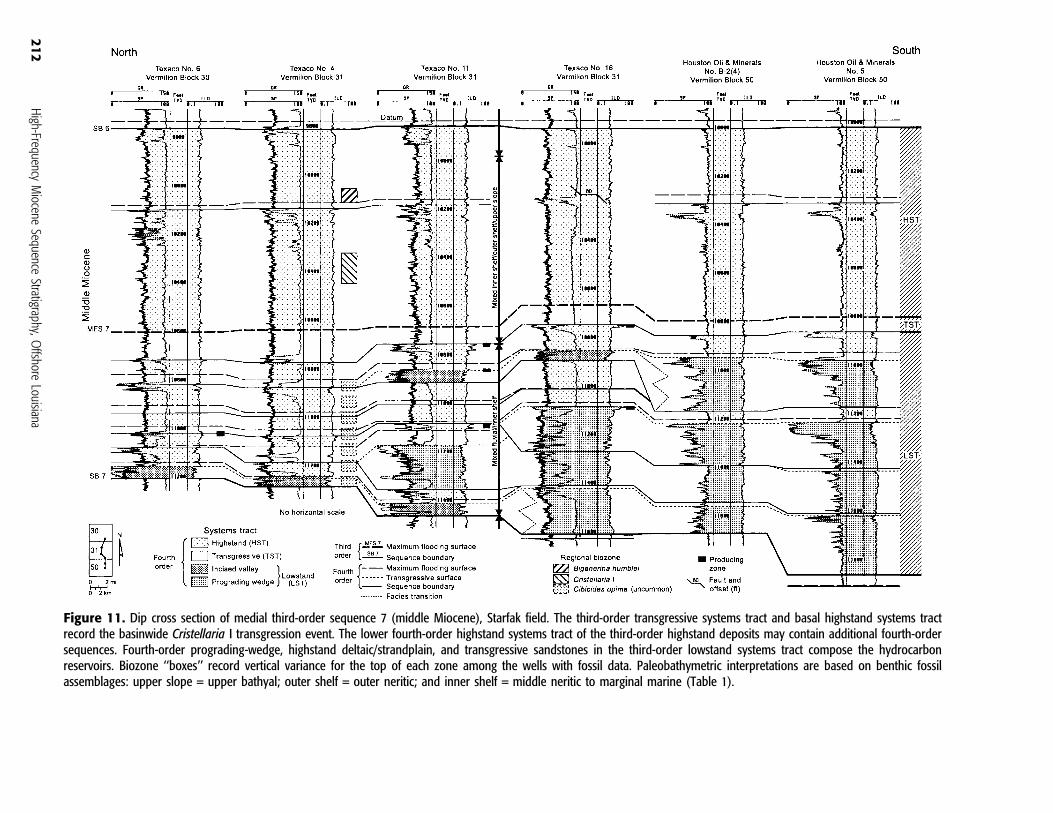
Figure 11. Dip cross section of medial third-order sequence 7 (middle Miocene), Starfak field. The third-order transgressive systems tract and basal highstand systems tractrecord the basinwide Cristellaria I transgression event. The lower fourth-order highstand systems tract of the third-order highstand deposits may contain additional fourth-ordersequences. Fourth-order prograding-wedge, highstand deltaic/strandplain, and transgressive sandstones in the third-order lowstand systems tract compose the hydrocarbonreservoirs. Biozone ‘‘boxes’’ record vertical variance for the top of each zone among the wells with fossil data. Paleobathymetric interpretations are based on benthic fossilassemblages: upper slope = upper bathyal; outer shelf = outer neritic; and inner shelf = middle neritic to marginal marine (Table 1).
Hentz
andZeng
213
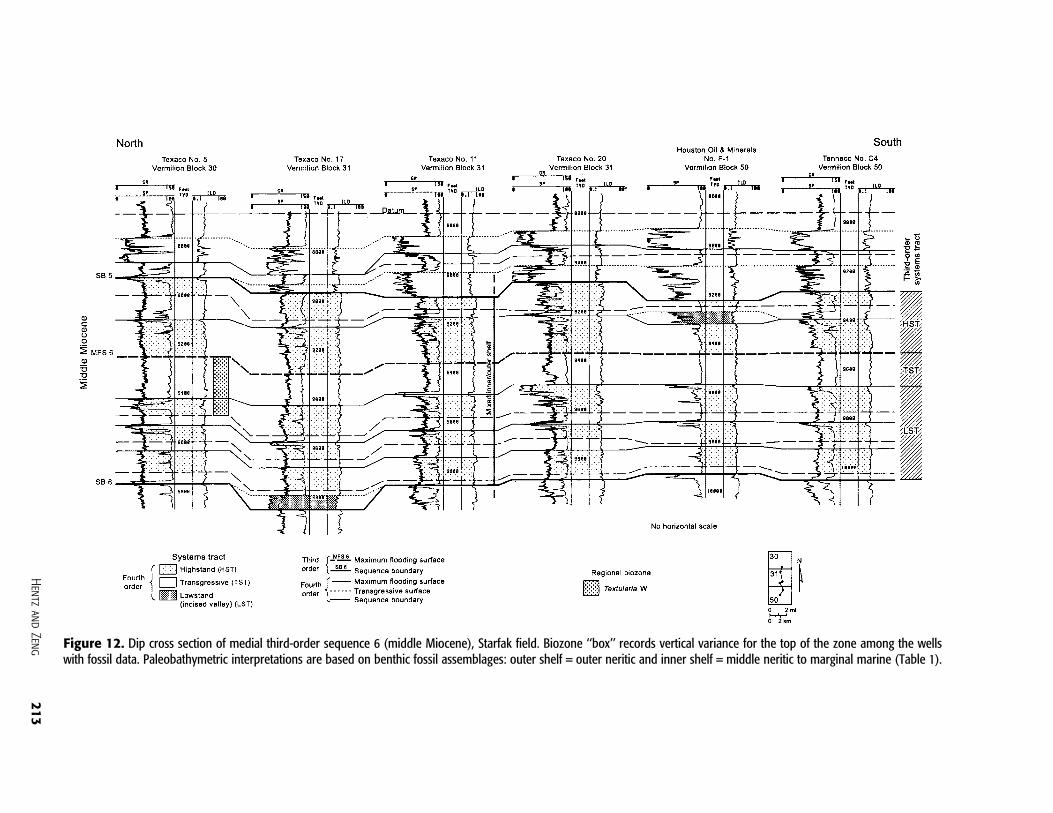
Figure 12. Dip cross section of medial third-order sequence 6 (middle Miocene), Starfak field. Biozone ‘‘box’’ records vertical variance for the top of the zone among the wellswith fossil data. Paleobathymetric interpretations are based on benthic fossil assemblages: outer shelf = outer neritic and inner shelf = middle neritic to marginal marine (Table 1).
214
High-Frequency
Miocene
SequenceStratigraphy,
Offshore
Louisiana
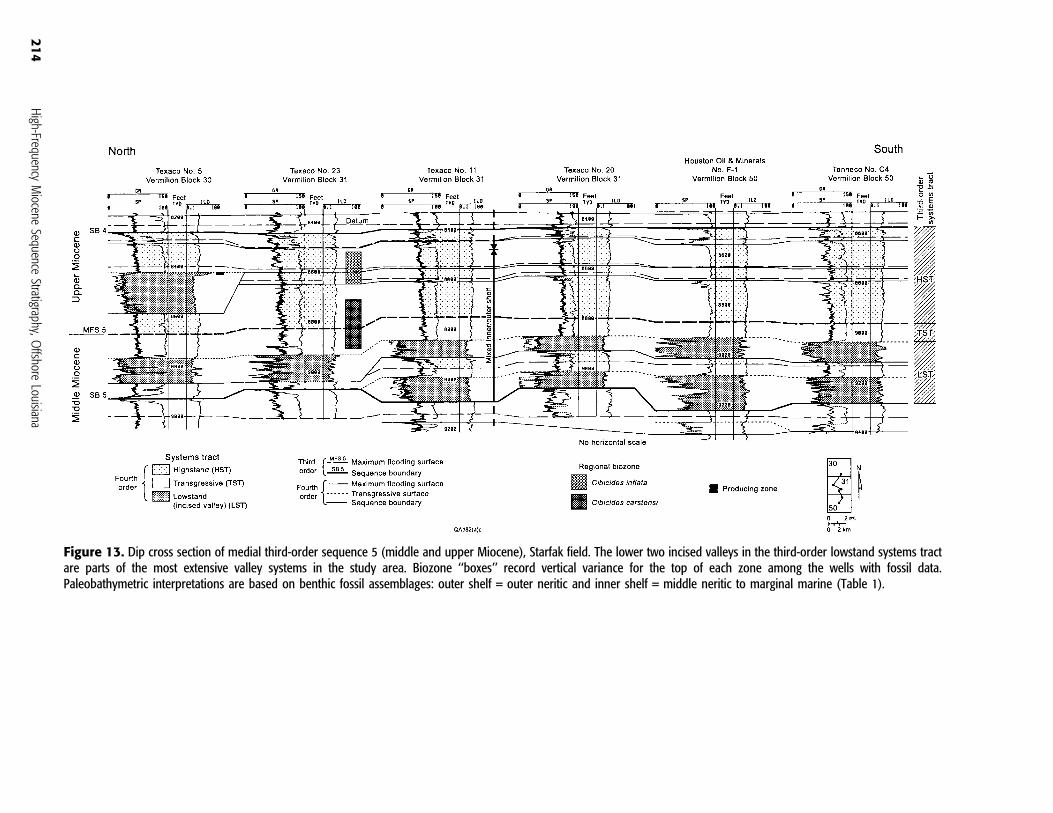
Figure 13. Dip cross section of medial third-order sequence 5 (middle and upper Miocene), Starfak field. The lower two incised valleys in the third-order lowstand systems tractare parts of the most extensive valley systems in the study area. Biozone ‘‘boxes’’ record vertical variance for the top of each zone among the wells with fossil data.Paleobathymetric interpretations are based on benthic fossil assemblages: outer shelf = outer neritic and inner shelf = middle neritic to marginal marine (Table 1).
Hentz and Zeng 215
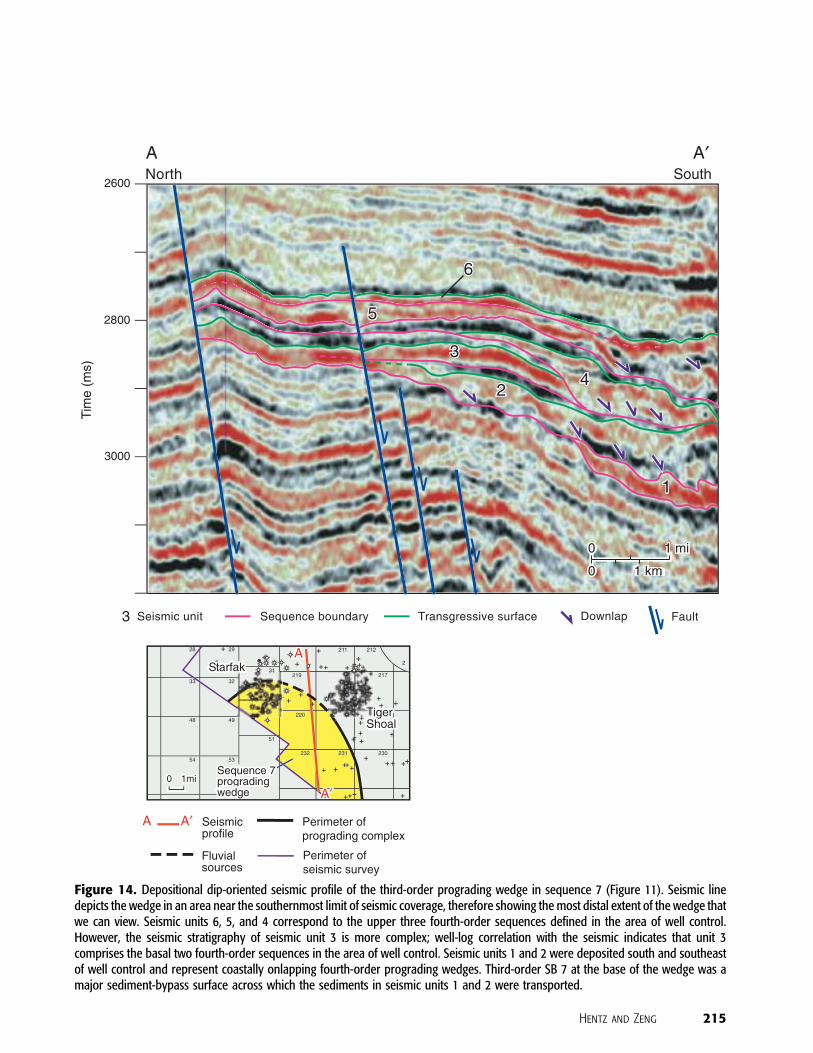
Figure 14. Depositional dip-oriented seismic profile of the third-order prograding wedge in sequence 7 (Figure 11). Seismic linedepicts the wedge in an area near the southernmost limit of seismic coverage, therefore showing the most distal extent of the wedge thatwe can view. Seismic units 6, 5, and 4 correspond to the upper three fourth-order sequences defined in the area of well control.However, the seismic stratigraphy of seismic unit 3 is more complex; well-log correlation with the seismic indicates that unit 3comprises the basal two fourth-order sequences in the area of well control. Seismic units 1 and 2 were deposited south and southeastof well control and represent coastally onlapping fourth-order prograding wedges. Third-order SB 7 at the base of the wedge was amajor sediment-bypass surface across which the sediments in seismic units 1 and 2 were transported.
transition is captured in sequences 7 (Figures 11, 14)
and 8, although it is present in sequence 8 in wells
downdip of, and lateral to, those shown in Figure 10.
These third-order proximal prograding complexes rep-
resent a continuation of the overall upsection offlapping
trend beginning with the distalmost lowstand depos-
its of sequence 10.
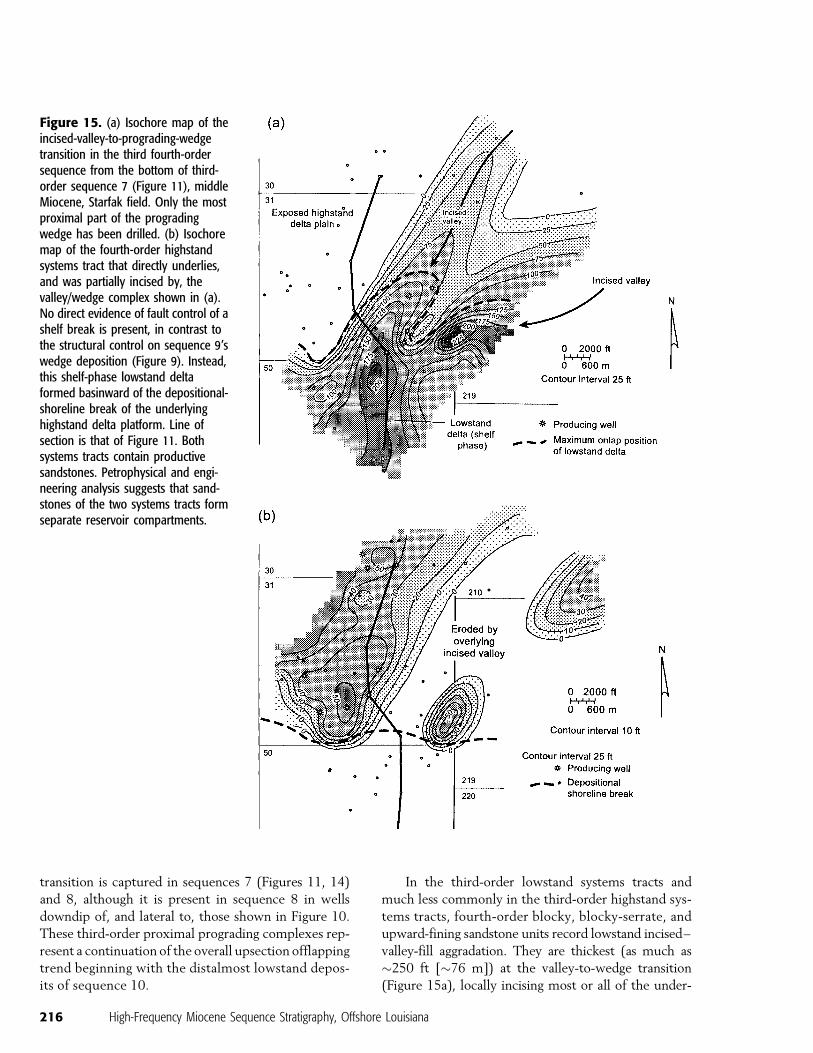
In the third-order lowstand systems tracts and
much less commonly in the third-order highstand sys-
tems tracts, fourth-order blocky, blocky-serrate, and
upward-fining sandstone units record lowstand incised–
valley-fill aggradation. They are thickest (as much as
�250 ft [�76 m]) at the valley-to-wedge transition
(Figure 15a), locally incising most or all of the under-
216 High-Frequency Miocene Sequence Stratigraphy, Offshore Louisiana
Figure 15. (a) Isochore map of theincised-valley-to-prograding-wedgetransition in the third fourth-ordersequence from the bottom of third-order sequence 7 (Figure 11), middleMiocene, Starfak field. Only the mostproximal part of the progradingwedge has been drilled. (b) Isochoremap of the fourth-order highstandsystems tract that directly underlies,and was partially incised by, thevalley/wedge complex shown in (a).No direct evidence of fault control of ashelf break is present, in contrast tothe structural control on sequence 9’swedge deposition (Figure 9). Instead,this shelf-phase lowstand deltaformed basinward of the depositional-shoreline break of the underlyinghighstand delta platform. Line ofsection is that of Figure 11. Bothsystems tracts contain productivesandstones. Petrophysical and engi-neering analysis suggests that sand-stones of the two systems tracts formseparate reservoir compartments.
lying highstand systems tract (Figure 15b). In this tran-
sitional zone, the log facies of fourth-order incised-
valley sandstones locally depict an aggradational pattern
at the base of the unit and a progradational log trend at
the top (e.g., at�11,200 ft [�3413m] in TexacoNo. 16
[Figure 11] and Figure 9, well 3). These log character-
istics suggest fluvial deposition within an incised valley
concurrent with wedge progradation in this transitional
zone, followed by deposition of a sandy bayhead delta
during the subsequent transgressive phase. Because of
the general difficulty of systematically correlating in-
ferred thin bayhead-delta deposits within individual
valley fills, we did not attempt precise correlation of
these facies to differentiate true lowstand strata from
overlying transgressive sediments in valley fills. How-
ever, these upper progradational sandstone units occur
within correlated valley fills in updip wells, supporting
inferred bayhead-delta deposition of the transgressive
systems tract. Valley-fill channels (�40–250 ft [�12–
76m] thick) range between <0.5 and >5mi (0.8 and 8
km, respectively) in width; one or both margins of the
largest valleys cannot be resolved in our seismic vol-
ume, and maximum widths therefore cannot be mea-
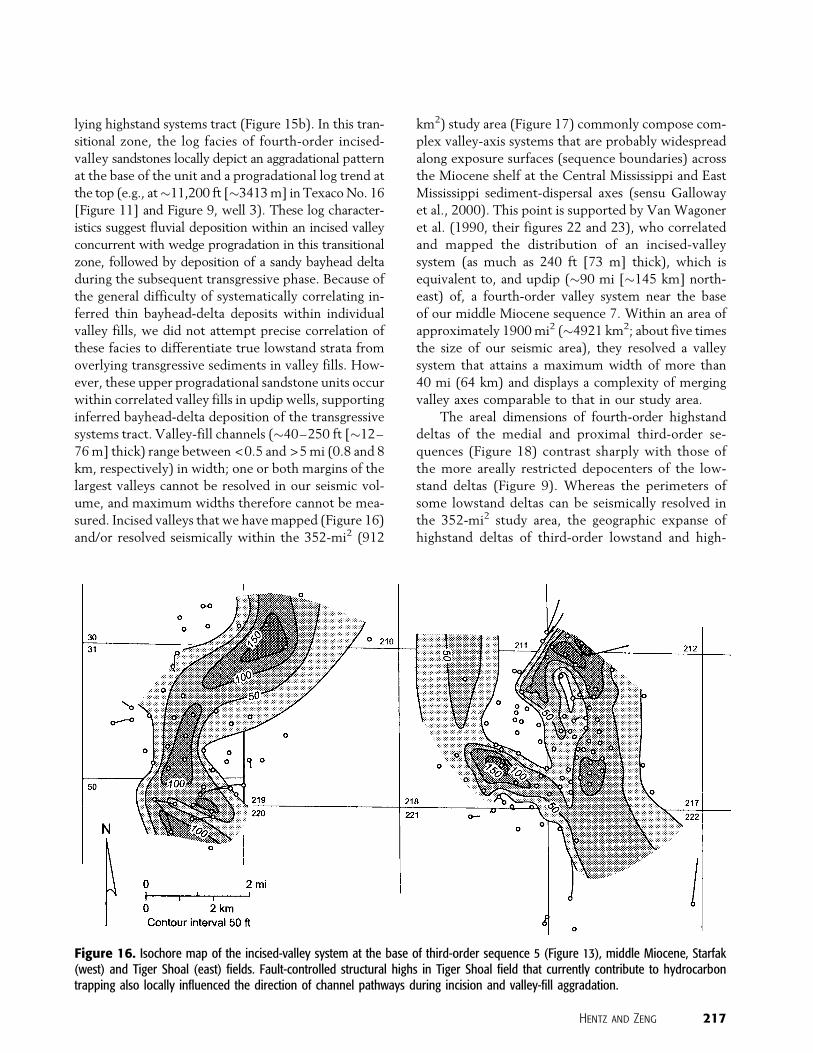
sured. Incised valleys that we havemapped (Figure 16)
and/or resolved seismically within the 352-mi2 (912
km2) study area (Figure 17) commonly compose com-
plex valley-axis systems that are probably widespread
along exposure surfaces (sequence boundaries) across
the Miocene shelf at the Central Mississippi and East
Mississippi sediment-dispersal axes (sensu Galloway
et al., 2000). This point is supported by Van Wagoner
et al. (1990, their figures 22 and 23), who correlated
and mapped the distribution of an incised-valley
system (as much as 240 ft [73 m] thick), which is
equivalent to, and updip (�90 mi [�145 km] north-
east) of, a fourth-order valley system near the base
of our middle Miocene sequence 7. Within an area of
approximately 1900mi2 (�4921 km2; about five times
the size of our seismic area), they resolved a valley
system that attains a maximum width of more than
40 mi (64 km) and displays a complexity of merging
valley axes comparable to that in our study area.
The areal dimensions of fourth-order highstand
deltas of the medial and proximal third-order se-
quences (Figure 18) contrast sharply with those of
the more areally restricted depocenters of the low-
stand deltas (Figure 9). Whereas the perimeters of
some lowstand deltas can be seismically resolved in
the 352-mi2 study area, the geographic expanse of
highstand deltas of third-order lowstand and high-
Hentz and Zeng 217
Figure 16. Isochore map of the incised-valley system at the base of third-order sequence 5 (Figure 13), middle Miocene, Starfak(west) and Tiger Shoal (east) fields. Fault-controlled structural highs in Tiger Shoal field that currently contribute to hydrocarbontrapping also locally influenced the direction of channel pathways during incision and valley-fill aggradation.
218 High-Frequency Miocene Sequence Stratigraphy, Offshore Louisiana
N
IncisedIncisedIncisedvalleyvalleyvalley
Del atataaplain
DistributaryDistributaryDistributarychannelchannelchannel
DeltaDeltaDeltaplainplainplain
DistributaryDistributaryDistributarychannelchannelchannel
1 22
3
44
0
0
2 mi
2 km
(a)
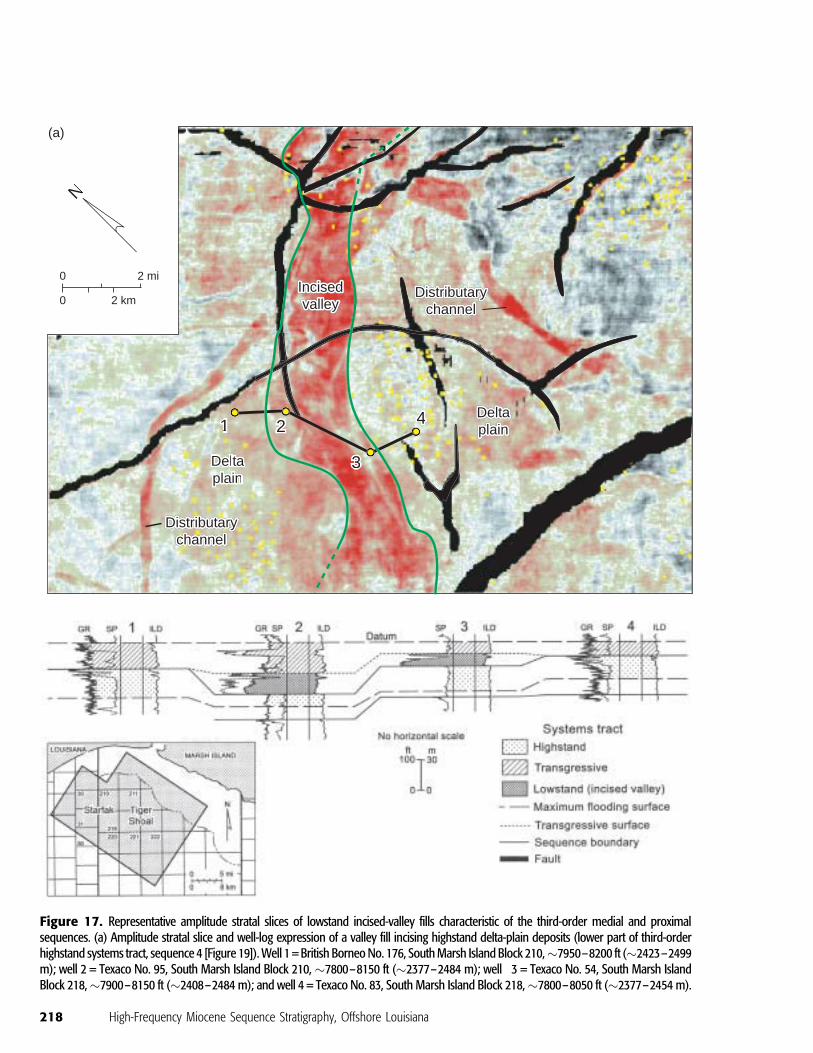
Figure 17. Representative amplitude stratal slices of lowstand incised-valley fills characteristic of the third-order medial and proximalsequences. (a) Amplitude stratal slice and well-log expression of a valley fill incising highstand delta-plain deposits (lower part of third-orderhighstand systems tract, sequence 4 [Figure 19]).Well 1 = British BorneoNo. 176, SouthMarsh Island Block 210,�7950–8200 ft (�2423–2499m); well 2 = Texaco No. 95, South Marsh Island Block 210,�7800–8150 ft (�2377–2484 m); well 3 = Texaco No. 54, South Marsh IslandBlock 218,�7900–8150 ft (�2408–2484 m); and well 4 = Texaco No. 83, South Marsh Island Block 218,�7800–8050 ft (�2377–2454 m).
Hentz and Zeng 219
444SPSPSP
N
111
222 333444
0
0
2 mi
2 km
IncisedIncisedIncisedvalleyvalleyvalley
InterdeltaicInterdeltaicInterdeltaicshelfshelfshelf
InterdeltaicInterdeltaicInterdeltaicshelfshelfshelf
(b)
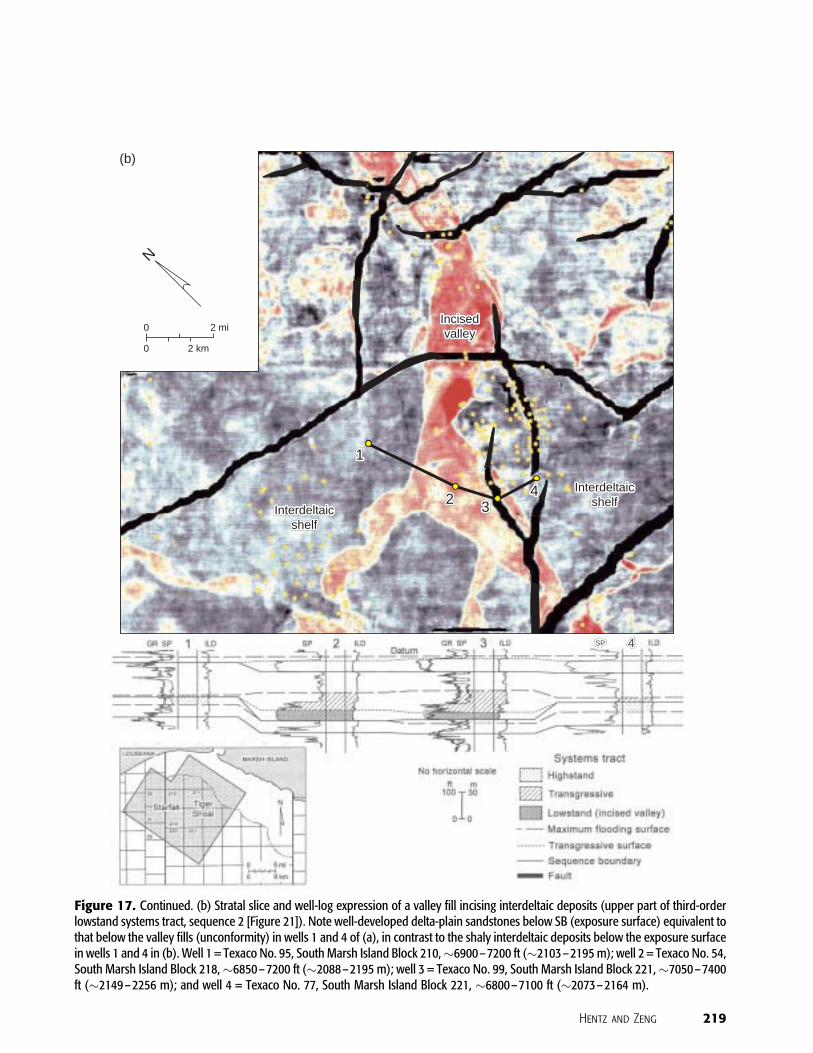
Figure 17. Continued. (b) Stratal slice and well-log expression of a valley fill incising interdeltaic deposits (upper part of third-orderlowstand systems tract, sequence 2 [Figure 21]). Note well-developed delta-plain sandstones below SB (exposure surface) equivalent tothat below the valley fills (unconformity) in wells 1 and 4 of (a), in contrast to the shaly interdeltaic deposits below the exposure surfacein wells 1 and 4 in (b). Well 1 = Texaco No. 95, South Marsh Island Block 210,�6900–7200 ft (�2103–2195 m); well 2 = Texaco No. 54,South Marsh Island Block 218,�6850–7200 ft (�2088–2195 m); well 3 = Texaco No. 99, South Marsh Island Block 221,�7050–7400ft (�2149–2256 m); and well 4 = Texaco No. 77, South Marsh Island Block 221, �6800–7100 ft (�2073–2164 m).

stand systems tracts greatly exceeds that of our study
area. Typically, only one or two distributary lobes of a
highstand delta can be resolved in stratal slices (Figure
18), and only part of a single lobe occurs inmaps of the
areas of well control. The smaller areal dimensions of
the lowstand deltas are consistent with more focused
sedimentation via the funneling effect of feeder in-
cised valleys (Posamentier and Vail, 1988).
The third-order transgressive systems tracts in
the medial sequences are thicker and more easily re-
solved on well logs than those of the distal sequences. In
depositional-dip profile, the third-order transgressive
systems tracts decrease in thickness and contain fewer
progradational sandstones (of very thin fourth-order sys-
tems tracts) distally over a distance of 2–4 mi (3–6 km;
best shown in Figure 10), reflecting retrogradation and
increasing distance from sediment-source areas. Four of
the five third-order MFSs in the medial sequences coin-
cide with major faunal floods (Figure 5) recorded in
the associated marine condensed sections. The excep-
tion, the MFS of sequence 8, occurs at the base of a
broad faunal peak.
The fourth-order sequences that compose the third-
order transgressive systems tracts in our 10 sequences
are generally very thin (�35 ft [11 m]), shaly, and diffi-
cult to correlate regionally. Therefore, we did not delin-
eate these high-frequency sequences within the third-
order transgressive systems tracts on our cross sections.
However, the retrogradational pattern of the higher
order, sandstone-bearing sequences is quite evident in
depositional-dip-oriented cross sections that transect
presumed sand depocenters (e.g., Figure 10).
Proximal Sequences (SB 4 to SB 0)
Stratal Characteristics
Proximal third-order sequences 4 through 1 (upper
Miocene, SB 4 to SB 0) extend from approximately 75 ft
(�23 m) above the Cibicides inflata regional biozone
to approximately 150 ft (�46 m) above the BigenerinaA biozone (Figures 19–22). These proximal sequences
are the thinnest of all 10 third-order sequences, rang-
ing between approximately 375 and 700 ft (�114 and
213 m) respectively, in thickness. Like the medial
220 High-Frequency Miocene Sequence Stratigraphy, Offshore Louisiana
000
000 5 mi5 mi5 km
N
Fault Distributary system
3 mi000
000 5 mi5 mi5 km
N
Fault Distributary system
3 mi
Figure 18. Representative amplitude stratal slice of part of a digitate highstand delta system (upper part of third-order highstandsystems tract, sequence 4 [Figure 19]) characteristic of the third-order medial and proximal sequences. Note probablesyndepositional fault control of the western distributary system. Area coincides with that of the seismic surveys shown in Figure 1.
Hentz
andZeng
221
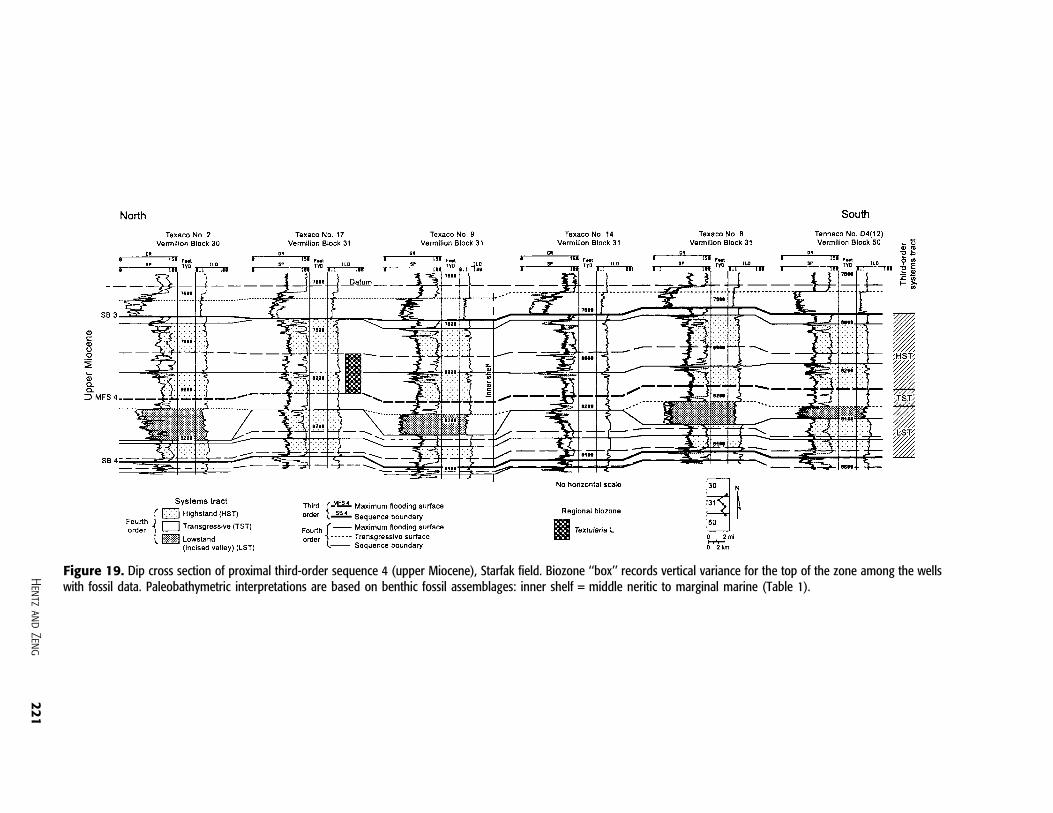
Figure 19. Dip cross section of proximal third-order sequence 4 (upper Miocene), Starfak field. Biozone ‘‘box’’ records vertical variance for the top of the zone among the wellswith fossil data. Paleobathymetric interpretations are based on benthic fossil assemblages: inner shelf = middle neritic to marginal marine (Table 1).
222
High-Frequency
Miocene
SequenceStratigraphy,
Offshore
Louisiana
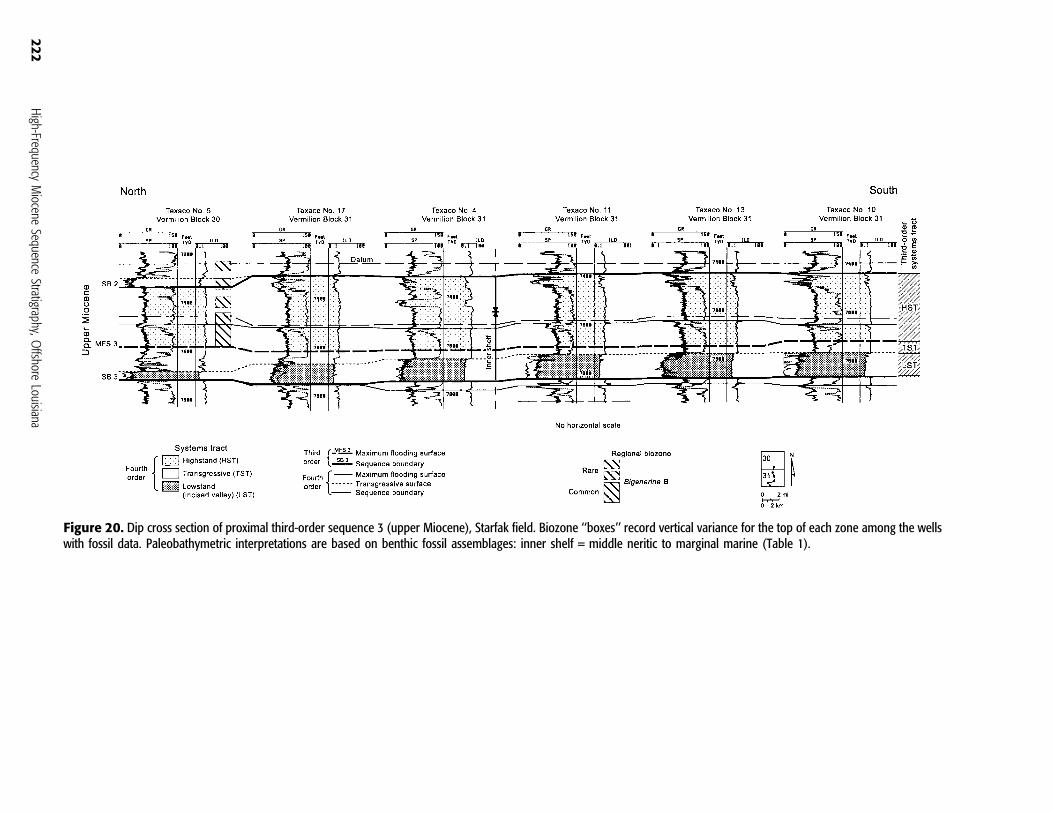
Figure 20. Dip cross section of proximal third-order sequence 3 (upper Miocene), Starfak field. Biozone ‘‘boxes’’ record vertical variance for the top of each zone among the wellswith fossil data. Paleobathymetric interpretations are based on benthic fossil assemblages: inner shelf = middle neritic to marginal marine (Table 1).

Hentz
andZeng
223
Figure 21. Dip cross section of proximal third-order sequence 2 (upper Miocene), Starfak field. Biozone ‘‘boxes’’ record vertical variance for the top of each zone among the wellswith fossil data. Paleobathymetric interpretations are based on benthic fossil assemblages: inner shelf = middle neritic to marginal marine (Table 1).
224
High-Frequency
Miocene
SequenceStratigraphy,
Offshore
Louisiana
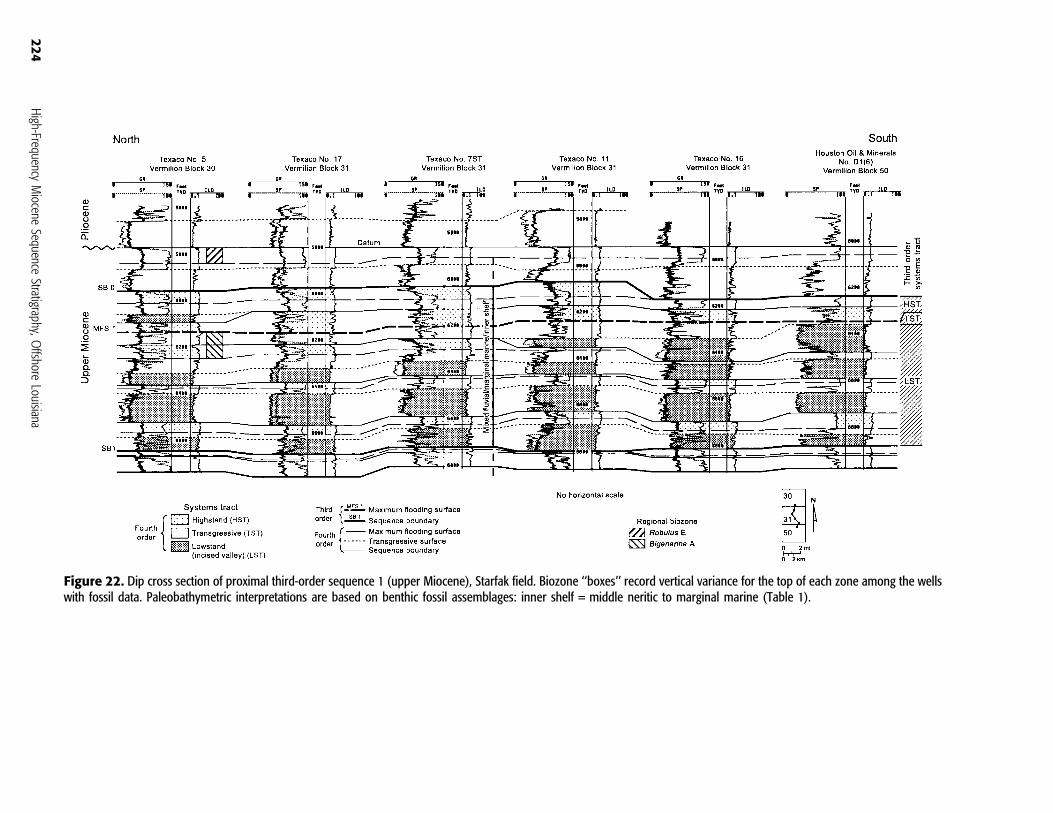
Figure 22. Dip cross section of proximal third-order sequence 1 (upper Miocene), Starfak field. Biozone ‘‘boxes’’ record vertical variance for the top of each zone among the wellswith fossil data. Paleobathymetric interpretations are based on benthic fossil assemblages: inner shelf = middle neritic to marginal marine (Table 1).
sequences, each of the proximal sequences comprises
three stratigraphic divisions: (1) a lower succession of
one to three aggradational (�40–130 ft [�12–40 m]
thick) or progradational (�25–80 ft [�8–24 m]
thick) units; (2) a locally thick (�35–70 ft [�11–21
m]), upward-fining, retrogradational, shale-dominated
section in the middle; and (3) an upper section of
typically two to five (�30–200 ft [�9–61 m] thick)
mostly progradational units of thicker shales and
sandstones. Progradational and aggradational units in
the lower and upper divisions are interstratified with
thinner (�10–70 ft [�3–21 m]) retrogradational
intervals. However, the proximal sequences are differ-
entiated from the medial ones by having a higher
proportion of blocky and blocky-serrate aggradational
sandstones and thinner progradational units that
contain a higher percentage of sandstone. The retro-
gradational units in the lower and upper divisions also
contain a higher percentage of sandstone than those in the
medial sequences but are of comparable thickness.
Systems Tracts
The lower, middle, and upper stratigraphic divisions of
the proximal sequences represent third-order lowstand,
transgressive, and highstand systems tracts, respective-
ly. These systems tracts accumulated in water environ-
ments shallower than those of the medial sequences:
inner-shelf to fluvial settings in marine water depths
that ranged from middle neritic to marginal marine,
as indicated by fossil data (Figures 4, 19–22). One to
three relatively thin (�75–130 ft [�23–40 m]) closely
spaced fourth-order sequences form the third-order
lowstand systems tract. The third-order lowstand sys-
tems tract is overlain by the third-order transgressive
systems tract. The upper division, two to five fourth-
order highstand systems tracts (locally incised by valley
fills and interstratified with thin transgressive systems
tracts) composing a progradational sequence set, forms
the third-order highstand systems tract. The more abun-
dant valley-fill sandstone units commonly incise the sepa-
rate progradational and retrogradational units that
best define the cyclic stratal patterns within the third-
order sequences, making the defining of these proximal
third-order sequences more challenging, especially in se-
quence 1 (Figure 22).
In the area of well-log control and within the area
of seismic coverage, the proximal sequences show mi-
nimal variation in overall thickness or stratal-stacking
patterns (‘‘railroad tracks’’ on seismic profiles). No
lowstand prograding complexes can be resolved either
on seismic or well logs in the downdip parts of the
study area. In the lower Pliocene succession above se-
quence 1, incised-valley sandstones compose an upward-
increasing percentage of the section, grading to stacked
fluvial channel fills, and thin and volumetrically minor
overbank and marine-flood shales in a dominantly
coastal-plain setting (Zeng et al., 2001a). Third-order
MFSs generally coincide with regional faunal-abundance
peaks (Figure 5).
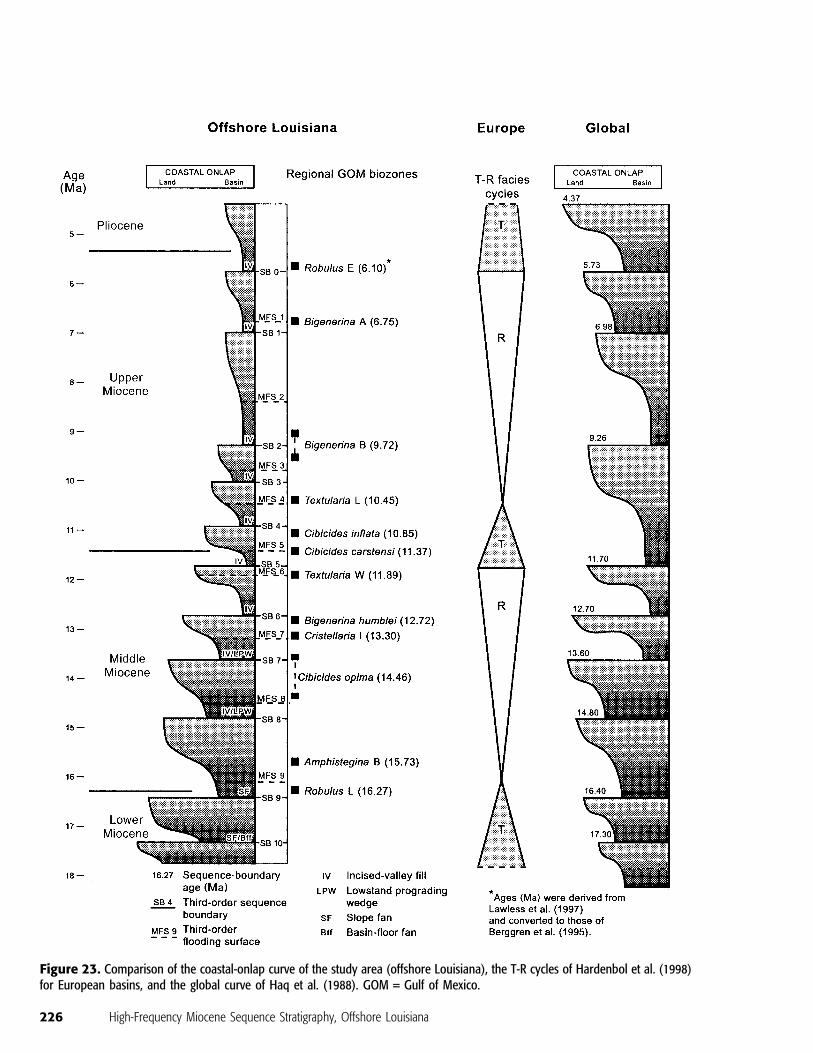
Correlation with Eustatic Cyclicity
Although biostratigraphic data show that the abso-
lute ages of our third-order sequence boundaries ap-
proximately coincide with those defined by Haq et al.
(1988), updated with the revised chronology of Berg-
gren et al. (1995), the third-order cyclicity interpreted
in our study differs from that represented in Haq’s
generalized (global) coastal-onlap curve (Figure 23).
Whereas the Haq curve shows transgressive trends
in the upper lower to lower middle Miocene and
throughout the upper Miocene, we observe prominent
regressive signatures in the study area during these pe-
riods. In fact, our entire study interval is a regressive
succession at the third-order scale. The study area lies
within the Miocene Central Mississippi sediment-
dispersal axis (Galloway et al., 2000). Therefore, the
difference between the ‘‘average’’ global pattern and
that of offshore Louisiana is best explained by the
basin-specific effects of generally high sediment flux
throughout the Miocene in the vicinity of the ancestral
Mississippi delta.
In contrast to the global third-order sequences of
Haq et al. (1988), we identified three third-order cy-
cles between 11.70 and 9.26 Ma a time interval of
2.44 m.y. that Haq et al. (1988) identified as rep-
resenting one third-order cycle (Figure 23). Styzen
(1996) also concluded that there are multiple cycles
within this time range, although he did not differen-
tiate between third- and fourth-order sequences. How-
ever, the duration of one of his four cycles (�0.9 m.y.)
within this time range is comparable to the duration
of Haq’s shorter term Miocene third-order sequences
(0.9 m.y.), using the updated chronology of Berggren
et al. (1995). Therefore, Styzen’s cycle boundaries of
the 11.70- to 9.26-Ma period probably record at least
two third-order sequences.
Our inferred coastal-onlap trend for most of the
Miocene of offshore Louisiana more closely coincides
with observations presented by Hardenbol et al. (1998)
for Miocene strata in European basins. In the same
time interval, they differentiated parts, or all, of three
Hentz and Zeng 225
226 High-Frequency Miocene Sequence Stratigraphy, Offshore Louisiana
Figure 23. Comparison of the coastal-onlap curve of the study area (offshore Louisiana), the T-R cycles of Hardenbol et al. (1998)for European basins, and the global curve of Haq et al. (1988). GOM = Gulf of Mexico.
low-order transgressive-regressive (T-R) facies cycles (Fig-
ure 23), which coincide with third-order sequence sets.
As in our study interval, long-duration regressive periods
dominate. However, unlike offshore Louisiana, the Eu-
ropean Miocene regressive succession is punctuated by
relatively short-lived but significant (second-order?)
transgressive events. The differences among these three
cycle schemes probably lie in basin-specific variations in
the interaction of eustasy, sediment supply, and subsi-
dence, which control stacking trends of third-order se-
quences (Hardenbol et al., 1998).
RELATION OF PRODUCTION TOSYSTEMS TRACTS
Within individual fourth-order systems tracts of
Starfak and Tiger Shoal fields, hydrocarbons have
been produced from inferred lowstand incised-valley
fills, deltaic/strandplain sandstones of late highstand
systems tracts, deltaic sandstones of late lowstand
prograding wedges, and transgressive bayhead deltaic
sandstones. However, calculation of the vertical distri-
bution of production in Starfak and Tiger Shoal fields
indicates that the vast majority of gas and oil produc-
tion is from the third-order lowstand systems tracts at
the bases of the third-order cycles (Figure 24).
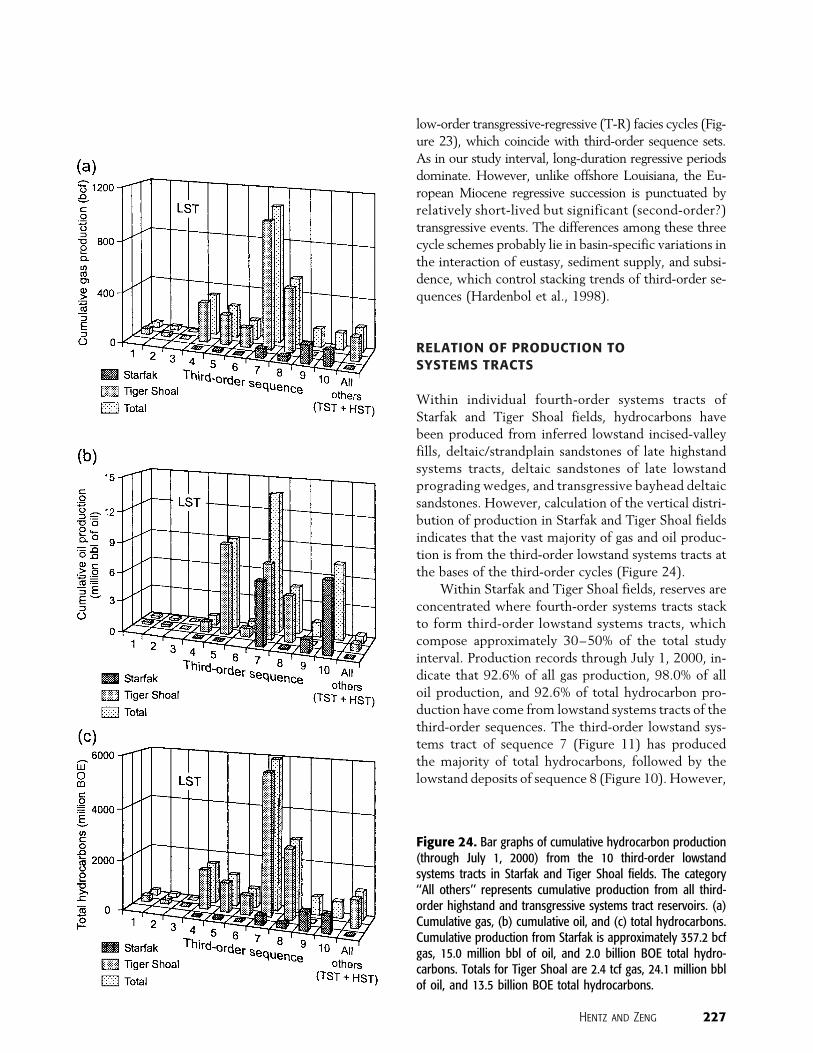
Within Starfak and Tiger Shoal fields, reserves are
concentrated where fourth-order systems tracts stack
to form third-order lowstand systems tracts, which
compose approximately 30–50% of the total study
interval. Production records through July 1, 2000, in-
dicate that 92.6% of all gas production, 98.0% of all
oil production, and 92.6% of total hydrocarbon pro-
duction have come from lowstand systems tracts of the
third-order sequences. The third-order lowstand sys-
tems tract of sequence 7 (Figure 11) has produced
the majority of total hydrocarbons, followed by the
lowstand deposits of sequence 8 (Figure 10). However,
Hentz and Zeng 227
Figure 24. Bar graphs of cumulative hydrocarbon production(through July 1, 2000) from the 10 third-order lowstandsystems tracts in Starfak and Tiger Shoal fields. The category‘‘All others’’ represents cumulative production from all third-order highstand and transgressive systems tract reservoirs. (a)Cumulative gas, (b) cumulative oil, and (c) total hydrocarbons.Cumulative production from Starfak is approximately 357.2 bcfgas, 15.0 million bbl of oil, and 2.0 billion BOE total hydro-carbons. Totals for Tiger Shoal are 2.4 tcf gas, 24.1 million bblof oil, and 13.5 billion BOE total hydrocarbons.
the prograding-wedge sandstones of sequence 10 (Fig-
ure 7), which are deep targets, have only recently been
developed and are currently primary prospect targets.
Although a dominant structural-trapping component
is present in the fields (DeAngelo and Wood, 2001),
most of the resource distribution can be predicted by
understanding its context within a framework of key
sequence-stratigraphic surfaces. These key surfaces have
a strong control on hydrocarbon distribution.
Hydrocarbons are dominantly distributed in third-
order lowstand systems tracts because these intervals
have optimal reservoir-quality and seal juxtapositions.
Miocene shales of the northern Gulf of Mexico are
generally believed not to be source rocks; the pre-
sumed primary source rocks for Miocene reservoirs of
offshore Louisiana are shales of the Paleocene Midway,
and Eocene Wilcox and Sparta formations (Nehring,
1991). Most reservoirs occur within the third-order
lowstand systems tracts for several reasons, consid-
ered collectively:
� Prominent shales of the third-order slope fans and
third-order transgressive and highstand systems tracts
create thick regional hydrocarbon seals over reser-
voirs within the third-order lowstand systems tracts
(e.g., Figures 7, 8 [slope fans], 11 [transgressive and
highstand systems tracts]).� These thick sealing shales above and below the pro-
ductive zones minimize the risk of cross-fault jux-
taposition of lowstand reservoir sandstones against
third-order highstand sandstones that can act as points
of leakage.� The common juxtaposition of thick incised-valley
sandstones against neritic to shallow-marine shales
from lowstand incision (e.g., Figure 13, Texaco No. 5
well, valley fill incised into middle-neritic shales
containing Cibicides carstensi [Table 1]) creates lateral
and upper seals at valley margins (e.g., Bowen et al.,
1993).� The areally restricted distribution of commonly
thick, stacked, deltaic-wedge sandstones within
slope and basinal shales creates ideal conditions for
potential hydrocarbon migration and stratigraphic
entrapment.
Based on these observations and rationale, we think
that there are significant untapped hydrocarbon accu-
mulations in nonstructural traps within the study area.
Moreover, hydrocarbon concentrations most likely oc-
cur in third-order systems tracts comprising both non-
structured and structured Miocene strata in adjacent
on-shelf regions of the northern Gulf of Mexico. This
pattern of resource distribution keyed to third-order
lowstand systems tracts serves as a guide for more re-
gional resource development. Inspection of limited
well-log data from surrounding Miocene shelf fields
(Light House Point, Mound Point, and South Marsh
Island Block 236 [Amber Complex]) indicates that our
sequence-stratigraphic framework of the Miocene se-
ries can be tied to these areas (Figure 1). We expect
that the framework can be readily applied to other
surrounding offshore fields, especially if supported by
sufficient well-log and paleontologic data to reinforce
correlation confidence.
CONCLUSIONS
We have developed a high-resolution sequence-strati-
graphic framework of most of the Miocene succession
in the vicinity of Starfak andTiger Shoal fields, offshore
Louisiana (Vermilion and South Marsh Island areas).
Well-log, paleontologic, and seismic data indicate that
the approximately 10,000-ft (�3048-m) regressive
study interval grades upward from distal-lowstand
basin-floor, slope-fan, and prograding-complex facies;
through the lateral transition from prograding com-
plexes to lowstand, highstand, and transgressive on-
shelf deposits; and into proximal sequences deposited in
mostly nearshore environments. These facies compose
systems tracts within 10 third-order sequences and at
least 58 fourth-order sequences ranging in age from
the late Burdigalian (�17.3 Ma) to the early Messi-
nian (�6.1 Ma), a span of �11.2 m.y. The details of
this framework provide a basis for its extrapolation
into the extensive shelf-bound Miocene play fairways
surrounding the study area and into potentially pro-
ductive, deeper lower Miocene strata. For example,
amplitude stratal slices of intervals keyed to the frame-
work can image depositional geomorphology, poten-
tial trap locations, and sandstone concentrations of
reservoir-scale systems tracts outside the areas of well
control. Biostratigraphic data provide critical con-
straints on absolute age of the key chronostratigraph-
ic surfaces and sequences, enabling comparison with
published eustatic curves. The chronology of third-order
sequences generally coincideswith that of theHaq curve.
However, Miocene coastal-onlap patterns of third-order
sequences of offshore Louisiana deviate with the global
‘‘average’’ patterns of Haq and the T-R cycles of Eu-
ropean basins because of sediment-supply and subsidence
variations in the Gulf Coast basin.
228 High-Frequency Miocene Sequence Stratigraphy, Offshore Louisiana
A full range of systems tracts and depositional
facies occur in the Miocene interval, and hydrocarbons
have been produced from sandstone reservoirs within
all fourth-order systems tracts. However, reserves are
highly concentrated where the reservoir-scale fourth-
order systems tracts stack to form third-order lowstand
systems tracts, which compose approximately 30–
50% of the succession. Within the two fields, greater
than 90% of all gas and oil has been produced from
third-order lowstand systems tracts. Although a domi-
nant structural-trapping component is present in the
fields, the sequence-stratigraphic context of reservoirs
is an important indicator of resource-distribution pat-
terns. The differentiation of high-frequency sequences
and systems tracts within the developmentally mature
Miocene succession of the study area and the obser-
vation that hydrocarbons are vastly concentrated with-
in the Miocene third-order lowstand systems tracts
provide an impetus for development of new Miocene
hydrocarbon reserves bothwithin the study area and in
other mature and unexplored Miocene strata of the
northern Gulf of Mexico shelf province. Extrapolation
of key sequence-stratigraphic surfaces that bound the
third-order lowstand systems tracts from the fields
throughout the 3-D seismic volume and into surround-
ing areas is an effective first step in defining the regional
distribution of these proven hydrocarbon pools.
REFERENCES CITED
Badescu, A. C., and H. L. Zeng, 2001, Integrating 3-D seismic,sequence stratigraphy, and reservoir properties to enhancesecondary gas recovery of two major Miocene Gulf of Mexicooffshore fields (abs.): AAPG Annual Meeting Program, v. 10,p. A10.
Bebout, D. G., W. A. White, C. M. Garrett Jr., and T. F. Hentz,eds., 1992, Atlas of major central and eastern Gulf Coast gasreservoirs: University of Texas at Austin, Bureau of EconomicGeology, 88 p.
Berggren, W. A., D. V. Kent, and J. A. Van Couvering, 1985,Neogene chronology and chronostratigraphy, in N. J. Snelling,ed., The chronology of the geologic record: Geologic SocietyMemoir 10, p. 211–260.
Berggren, W. A., D. V. Kent, C. C. Swisher III, and M.-P. Aubrey,1995, A revised Cenozoic geochronology and chronostratigra-phy, in W. A. Berggren, D. V. Kent, M.-P. Aubry, and J.Hardenbol, eds., Geochronology, time scales and global strati-graphic correlation: SEPM Special Publication 54, p. 129–212.
Boettcher, S. S., and K. L. Milliken, 1994, Mesozoic–Cenozoicunroofing of the southern Appalachian basin: apatite fissiontrack evidence from Middle Pennsylvanian sandstones: Journalof Geology, v. 102, p. 655–663.
Bowen, D. W., P. Weimer, and A. J. Scott, 1993, The relativesuccess of siliciclastic sequence stratigraphic concepts inexploration: examples from incised valley fill and turbidite
systems reservoirs, in P. Weimer and H. Posamentier, eds.,Siliciclastic sequence stratigraphy: recent developments andapplications: AAPG Memoir 58, p. 15–42.
Crawford, T. G., B. J. Bascle, C. J. Kinler, M. T. Prendergast, andK. M. Ross, 2000, Outer continental shelf estimated oil and gasreserves, Gulf of Mexico, December 31, 1998: MineralsManagement Service, U.S. Department of the Interior, OCSReport MMS 2000-069, 26 p.
DeAngelo, M. V., and L. J. Wood, 2001, 3-D seismic detection ofundrilled prospective areas in a mature province, South MarshIsland, Gulf of Mexico: Leading Edge, v. 20, p. 1282–1292.
Diegel, F. A., J. F. Karlo, D. C. Schuster, R. C. Shoup, and P. R.Tauvers, 1995, Cenozoic structural evolution and tectono-stratigraphic framework of the northern Gulf Coast continen-tal margin, in M. P. A. Jackson, D. G. Roberts, and S. Snelson,eds., Salt tectonics: a global perspective: AAPG Memoir 65,p. 109–151.
Dutton, S. P., and T. F. Hentz, 2002, Reservoir quality of lowerMiocene sandstones in lowstand prograding wedge successions,Vermilion Block 31, offshore Louisiana: Gulf Coast Associa-tion of Geological Societies Transactions, v. 52, p. 217–228.
Erskine, R. D., and P. R. Vail, 1988, Seismic stratigraphy of theExmouth Plateau, in A. W. Bally, ed., Atlas of seismicstratigraphy: AAPG Studies in Geology 27, v. 2, p. 163–173.
Fillon, R. H., and P. N. Lawless, 1999, Paleocene– lower Miocenesequences in the northern Gulf: progradational slope salt-basindeposition and diminishing slope-bypass deposition in thedeep basin: Gulf Coast Association of Geological SocietiesTransactions, v. 49, p. 224–241.
Fillon, R. H., and P. N. Lawless, 2000, Lower Miocene–earlyPliocene deposystems in the Gulf of Mexico: regional sequencerelationships: Gulf Coast Association of Geological SocietiesTransactions, v. 50, p. 411–428.
Galloway, W. E., 1989, Genetic stratigraphic sequences in basinanalysis, II, application to northwest Gulf of Mexico basin:AAPG Bulletin, v. 73, p. 143–154.
Galloway, W. E., L. A. Jirik, R. A. Morton, and J. R. DuBar, 1986,Lower Miocene (Fleming) depositional episode of the Texascoastal plain and continental shelf: structural framework,facies, and hydrocarbon resources: University of Texas atAustin, Bureau of Economic Geology Report of Investigations150, 50 p.
Galloway, W. E., P. E. Ganey-Curry, X. Li, and R. T. Buffler, 2000,Cenozoic depositional history of the Gulf of Mexico basin:AAPG Bulletin, v. 84, p. 1743–1774.
Haq, B. U., J. Hardenbol, and P. R. Vail, 1988, Mesozoic andCenozoic chronostratigraphy and cycles of sea-level change,in C. K. Wilgus, C. A. Ross, H. Posamentier, and C. G. St.C. Kendall, eds., Sea-level changes: an integrated approach:SEPM Special Publication 42, p. 71–108.
Hardenbol, J., J. Thierry, M. B. Farley, T. Jacquin, P.-C. deGraciansky, and P. R. Vail, 1998, Mesozoic and Cenozoicsequence chronostratigraphic framework of European basins,in P.-C. de Graciansky, J. Hardenbol, T. Jacquin, and P. R.Vail, eds., Mesozoic and Cenozoic sequence stratigraphy ofEuropean basins: SEPM Special Publication 60, p. 3–13.
Hart, G. F., R. E. Ferrell Jr., D. R. Lowe, and A. E. Lenoir, 1989,Shelf sandstones of the Robulus L zone, offshore Louisiana, inR. A. Morton and D. Nummedal, eds., Shelf sedimentation,shelf sequences and related hydrocarbon accumulation: GulfCoast Section SEPM, 7th Annual Research ConferenceProceedings, p. 117–141.
Hentz, T. F., H. L. Zeng, and C. O. Kilic, 2000, Sequencestratigraphy, depositional framework, and resource potential ofmature gas reservoirs, Miocene of offshore Louisiana (abs.):AAPG Annual Meeting, CD-ROM.
Hentz and Zeng 229
Hentz, T. F., H. L. Zeng, L. J. Wood, A. C. Badescu, C. Rassi, andC. O. Kilic, 2001, Controls on hydrocarbon distributionwithin a sequence-stratigraphic framework: a case study fromthe Miocene of offshore Louisiana (abs.): AAPG AnnualMeeting Program, v. 10, p. A86.
Hentz, T. F., H. L. Zeng, and L. J. Wood, 2002, Sequence stratig-raphy and hydrocarbon distribution of Miocene plays: a casestudy from Starfak and Tiger Shoal fields, offshore Louisiana(abs.): AAPG Annual Meeting Program, v. 11, p. A76–A77.
Hunt, J. L., Jr., and G. Burgess, 1995, Depositional styles fromMiocene through Pleistocene in the north-central Gulf ofMexico: an historical reconstruction: Gulf Coast Association ofGeological Societies Transactions, v. 45, p. 275–284.
Jiang, M. M., 1993, Miocene sequence biostratigraphy of thenorthern Gulf of Mexico: Gulf Coast Association of GeologicalSocieties Transactions, v. 43, p. 137–143.
Jiang,M.M., and J. S.Watkins, 1992, Floral pulses, foraminiferal peaksand inferred sequences in the Miocene of the northern Gulf ofMexico: Marine and Petroleum Geology, v. 9, p. 608–622.
Lawless, P. N., R. H. Fillon, and R. G. Lytton III, 1997, Gulf ofMexico Cenozoic biostratigraphic, lithostratigraphic, andsequence stratigraphic event chronology: Gulf Coast Associa-tion of Geological Societies Transactions, v. 47, p. 271–282.
Luo, X., 2000, 3D seismic interpretation of central offshoreLouisiana, Gulf of Mexico: M.S. thesis, Baylor University,Waco, Texas, 72 p.
McBride, E. F., L. S. Land, T. N. Diggs, and L. E. Mack, 1988,Petrography, stable isotope geochemistry and diagenesis ofMiocene sandstones, Vermilion Block 31, offshore Louisiana:Gulf Coast Association of Geological Societies Transactions,v. 38, p. 513–523.
McGookey, D. P., 1975, Gulf Coast Cenozoic sediments andstructures: an excellent example of extra-continental sedimen-tation: Gulf Coast Association of Geological Societies Transac-tions, v. 25, p. 104–120.
Minerals Management Service, 2001, The promise of deep gas inthe Gulf of Mexico: Minerals Management Service, U.S.Department of the Interior, OCS Report MMS 2001-037, 4 p.
Mitchum, R. M., and J. C. Van Wagoner, 1990, High-frequencysequences and eustatic cycles in the Gulf of Mexico basin, inJ. M. Armentrout and B. F. Perkins, eds., Sequence stratig-raphy as an exploration tool: concepts and practices in the GulfCoast: Gulf Coast Section SEPM, 11th Annual ResearchConference Proceedings, p. 257–267.
Mitchum, R. M., J. B. Sangree, P. R. Vail, and W. W. Wornardt,1990, Sequence stratigraphy in Late Cenozoic expandedsections, Gulf of Mexico, in J. M. Armentrout and B. F. Perkins,eds., Sequence stratigraphy as an exploration tool: concepts andpractices in the Gulf Coast: Gulf Coast Section SEPM, 11thAnnual Research Conference Proceedings, p. 237–256.
Mitchum,R.M., J. B. Sangree, P. R.Vail, andW.W.Wornardt, 1993,Recognizing sequences and systems tracts fromwell logs, seismicdata, and biostratigraphy: examples from the Late Cenozoic ofthe Gulf of Mexico, in P. Weimer and H. Posamentier, eds.,Siliciclastic sequence stratigraphy: recent developments andapplications: AAPG Memoir 58, p. 163–197.
Morton, R. A., L. A. Jirik, andW. E. Galloway, 1988,Middle–upperMiocene depositional sequences of the Texas coastal plain andcontinental shelf: geologic framework, sedimentary facies, andhydrocarbon plays: University of Texas at Austin, Bureau ofEconomic Geology Report of Investigations 174, 40 p.
Nehring, R., 1991, Oil and gas resources, in A. Salvador, ed., TheGulf of Mexico basin: Geological Society of America, Decadeof North American geology, v. J, p. 445–494.
Picou, E. B., Jr., B. F. Perkins, N. C. Rosen, and M. J. Nault, eds.,1999, Gulf of Mexico basin biostratigraphic index microfossils:
a geoscientist’s guide, foraminifers and nannofossils, Oligocenethrough Pleistocene: Gulf Coast Section SEPM Foundation,Parts I and II, 215 p.
Posamentier, H. W., and P. R. Vail, 1988, Eustatic controls onclastic deposition, II, sequence and systems tract models, inC. K. Wilgus, C. A. Ross, H. Posamentier, and C. G. St. C.Kendall, eds., Sea-level changes: an integrated approach: SEPMSpecial Publication 42, p. 125–154.
Rassi, C., 2002, Predicting reservoir performance through sequencestratigraphy— a viable approach? (abs.): AAPG AnnualConvention, Official Program, v. 11, p. A145.
Rassi, C., and T. F. Hentz, 2001, Production prediction andreservoir characterization of systems tracts of fourth-ordersequences in the Miocene offshore Louisiana (abs.): AAPGAnnual Meeting Program, v. 10, p. A164.
Rosen, R. N., and W. A. Hill, 1990, Biostratigraphic application toPliocene–Miocene sequence stratigraphy of the western andcentral Gulf of Mexico and its integration to lithostratigraphy:Gulf Coast Association of Geological Societies Transactions,v. 40, p. 737–743.
Seni, S. J., T. F. Hentz, W. R. Kaiser, and E. G. Wermund Jr., eds.,1997, Atlas of northern Gulf of Mexico gas and oil reservoirs:volume 1. Miocene and older reservoirs: University of Texas atAustin, Bureau of Economic Geology, 199 p.
Styzen, M. J., compiler, 1996, A chart in two sheets of the LateCenozoic chronostratigraphy of the Gulf of Mexico: GulfCoast Section SEPM Foundation.
Van Wagoner, J. C., R. M. Mitchum, K. M. Campion, and V. D.Rahmanian, 1990, Siliciclastic sequence stratigraphy in welllogs, cores, and outcrops: concepts for high-resolutioncorrelation of time and facies: AAPG Methods in ExplorationSeries 7, 55 p.
Wagner, J. B., B. M. Kofron, R. W. Morin, D. W. Ford, V. R.Mathur, and R. T. Mauro, 1994, A sequence stratigraphicanalysis of the lower Miocene, West and East Cameron areas,Gulf of Mexico, in P. Weimer, A. H. Bouma, and B. F. Perkins,eds., Submarine fans and turbidite systems: sequence stratig-raphy, reservoir architecture and production characteristics,Gulf of Mexico and international: Gulf Coast Section SEPM,15th Annual Research Conference Proceedings, p. 357–372.
Winker, C. D., 1982, Cenozoic shelf margins, northwestern Gulf ofMexico: Gulf Coast Association of Geological SocietiesTransactions, v. 32, p. 427–448.
Zeng, H. L., 2001, From seismic stratigraphy to seismic sedimen-tology: a sensible transition: Gulf Coast Association ofGeological Societies Transactions, v. 51, p. 413–420.
Zeng, H. L., and L. J. Wood, 2002, Using quantitative seismicsedimentology to predict reservoir architecture and lithology: aGulf Coast Miocene–Pliocene example (abs.): AAPG AnnualMeeting Program, v. 11, p. A197.
Zeng, H. L., T. F. Hentz, and L. J. Wood, 2000, Three-dimensionalseismic facies imaging by stratal slicing of Miocene–Pleistocenesediments in the greater Vermilion Block 50-Tiger Shoal fieldarea, offshore Louisiana (abs.): AAPG Annual Meeting Pro-gram, v. 9, p. A165.
Zeng, H. L., T. F. Hentz, and L. J. Wood, 2001a, Stratal slicing ofMiocene–Pliocene sediments inVermilion Block 50-Tiger Shoalarea, offshore Louisiana: Leading Edge, v. 20, p. 408–418.
Zeng, H. L., T. F. Hentz, and L. J. Wood, 2001b, 3-D seismicexpression of high-frequency sequence stratigraphy in Vermil-ion Block 50-Tiger Shoal area, offshore Louisiana (abs.):AAPG Annual Meeting Program, v. 10, p. A224–A225.
Zeng, H. L., L. J. Wood, and T. F. Hentz, 2001c, Seismicsedimentology by stratal slicing of fluvial and shallow-marinedepositional systems in Pliocene, offshore Louisiana: AAPGAnnual Meeting Program, v. 10, p. A224.
230 High-Frequency Miocene Sequence Stratigraphy, Offshore Louisiana
Related Documents