Quanser NI-ELVIS Trainer (QNET) Series: QNET Experiment #05: HVAC System Identification Heating, Ventilation, and Air Conditioning Trainer (HVACT) Student Manual

Welcome message from author
This document is posted to help you gain knowledge. Please leave a comment to let me know what you think about it! Share it to your friends and learn new things together.
Transcript
Quanser NI-ELVIS Trainer (QNET) Series:
QNET Experiment #05:HVAC SystemIdentification
Heating, Ventilation, and AirConditioning Trainer (HVACT)
Student Manual
System Identification Laboratory Manual
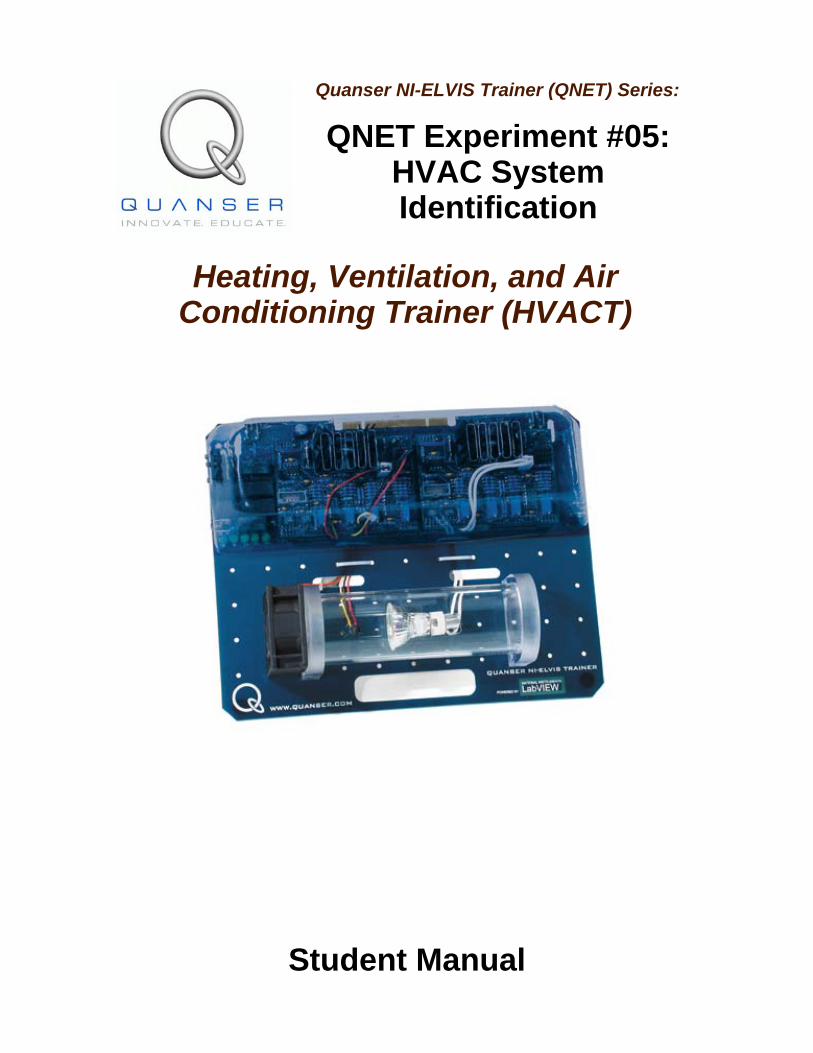
Table of Contents1. Laboratory Objectives.........................................................................................................12. References............................................................................................................................13. HVAC Plant Presentation....................................................................................................1
3.1. Component Nomenclature...........................................................................................13.2. HVAC Plant Description.............................................................................................2
4. Pre-Lab Assignments...........................................................................................................34.1. Pre-Lab Assignment #1: Open-Loop Modelling.........................................................34.2. Pre-Lab Assignment #2: Estimating The Heater Gain And Time Constant................44.3. Pre-Lab Assignment #3: Estimating The Blower Gain And Time Constant...............7
5. In-Lab Session...................................................................................................................105.1. System Hardware Configuration................................................................................105.2. Software User-Interface.............................................................................................105.3. Estimate The Heater Steady-State Gain And Time Constant....................................115.4. Estimate The Blower Steady-State Gain And Time Constant...................................155.5. Estimate The Heater And Blower Deadband Voltages..............................................18
Document Number: 576 Revision: 01 Page: i
System Identification Laboratory Manual
1. Laboratory ObjectivesThe objective of this experiment is to run open-loop tests on a Heating, Ventilation, and AirConditioning (HVAC) plant in order to gain insights in the effects of heat radiation. Thesystem dynamics are studied by collecting measurements that are used to perform systemidentification. The obtained model is required to design closed-loop controllers insubsequent experiments.
Regarding Gray Boxes:
Gray boxes present in the instructor manual are not intended for the students as theyprovide solutions to the pre-lab assignments and contain typical experimental resultsfrom the laboratory procedure.
2. References[1] NI-ELVIS User Manual.[2] QNET-HVACT User Manual.
3. HVAC Plant Presentation
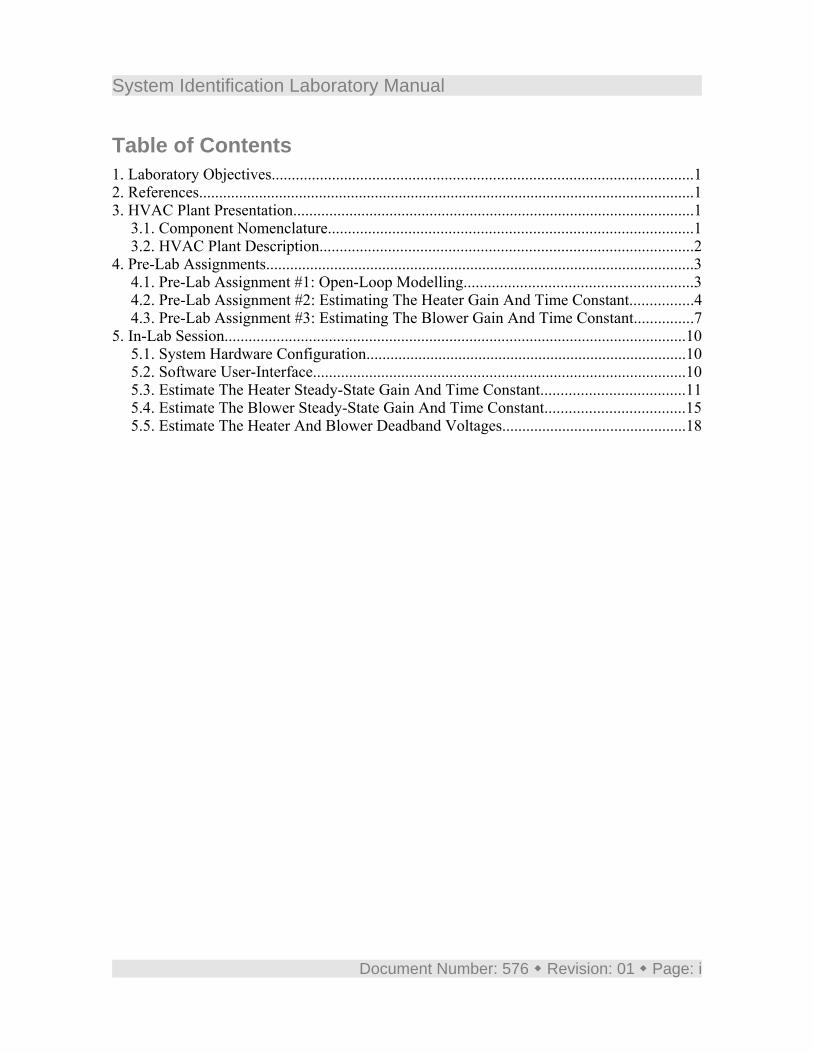
3.1. Component NomenclatureAs a quick nomenclature, Table 1, below, provides a list of the principal elementscomposing the Heating, Ventilation, and Air Conditioning (HVAC) Trainer system. Everyelement is located and identified, through a unique identification (ID) number, on theHVAC plant represented in Figure 1, below.
ID # Description ID # Description1 Heater / Halogen Lamp 2 Blower / Fan
3 Temperature Sensor 4 Chamber / DuctTable 1 HVAC Component Nomenclature
Document Number: 576 Revision: 01 Page: 1
System Identification Laboratory Manual
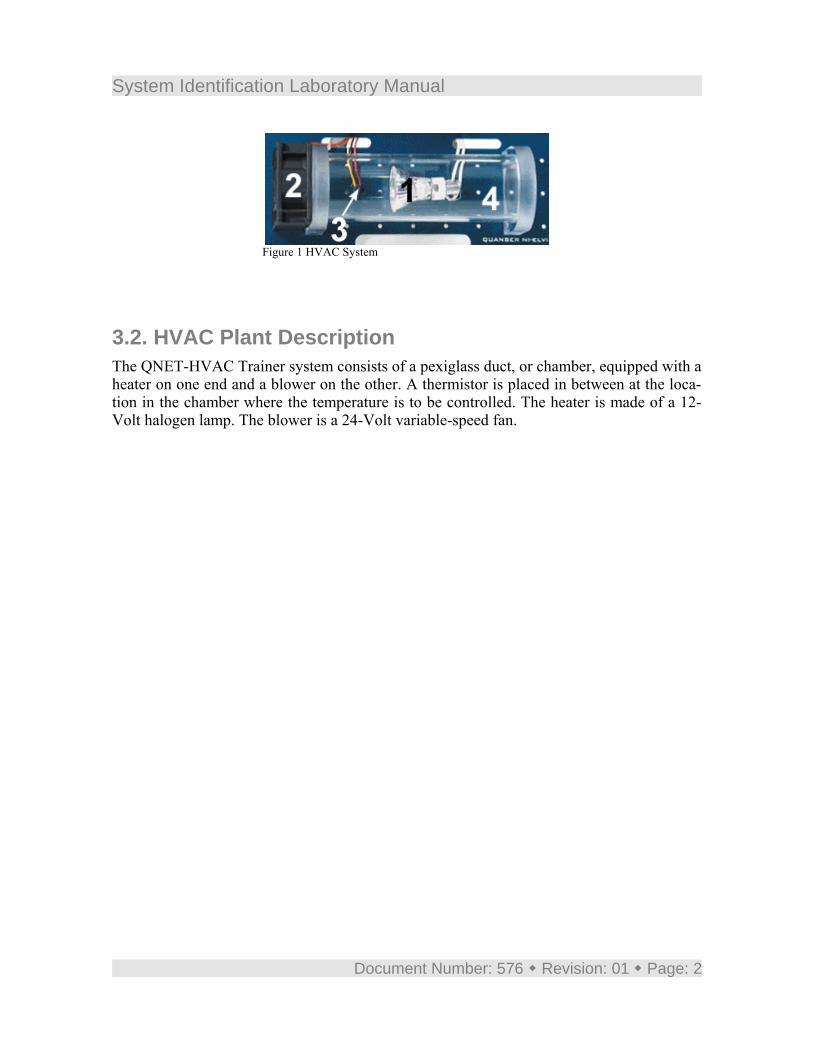
Figure 1 HVAC System
3.2. HVAC Plant DescriptionThe QNET-HVAC Trainer system consists of a pexiglass duct, or chamber, equipped with aheater on one end and a blower on the other. A thermistor is placed in between at the loca-tion in the chamber where the temperature is to be controlled. The heater is made of a 12-Volt halogen lamp. The blower is a 24-Volt variable-speed fan.
Document Number: 576 Revision: 01 Page: 2
System Identification Laboratory Manual
4. Pre-Lab AssignmentsThis section must be read, understood, and performed before you go to the laboratorysession.
4.1. Pre-Lab Assignment #1: Open-Loop ModellingThe HVAC plant consists of two inputs, namely the heater and blower voltages, for oneoutput, the chamber temperature.
The system thermal resistance and capacitance are not known. Additionally, the heater andblower heatflow rate constants are also unknown. Therefore, system identification isrequired to model the dynamics of the plant.
The thermodynamics theory shows that the behaviour of space heating can be approximatedby the following first-order transfer function, Gh(s), from heater voltage to chambertemperature difference:
= ( )Gh s⎛
⎝⎜⎜⎜
⎞
⎠⎟⎟⎟
= ∆ ( )Tc s
( )Vh sKss_h
+ τh s 1 [1]
where the difference with a constant ambient temperature is defined as: = ∆ Tc − Tc Ta [2]
Likewise, it can also be shown that the chamber cooling dynamics due to air blowing can beapproximated by the following simple-lag Laplace transfer function, Gb(s), from blowervoltage to chamber temperature difference:
= ( )Gb s⎛
⎝⎜⎜⎜
⎞
⎠⎟⎟⎟
= ∆ ( )Tc s
( )Vb s −Kss_b
+ τb s 1 [3]
The HVAC model parameters and variables are defined in Table 2, below.Symbol Description Unit
Ta Ambient Temperature (Outside the Chamber) ºCTc Chamber Air Temperature ºC∆Tc Chamber Temperature Difference ºCVh Heater Input Voltage V
Document Number: 576 Revision: 01 Page: 3
System Identification Laboratory Manual
Symbol Description UnitVb Blower Input Voltage V
Kss_h Heater Open-Loop Steady-State Gain ºC/Vτh Heater Open-Loop Time Constant s
Kss_b Blower Open-Loop Steady-State Gain ºC/Vτb Blower Open-Loop Time Constant ss Laplace Operator rad/st Continuous Time s
Table 2 HVAC Model Nomenclature
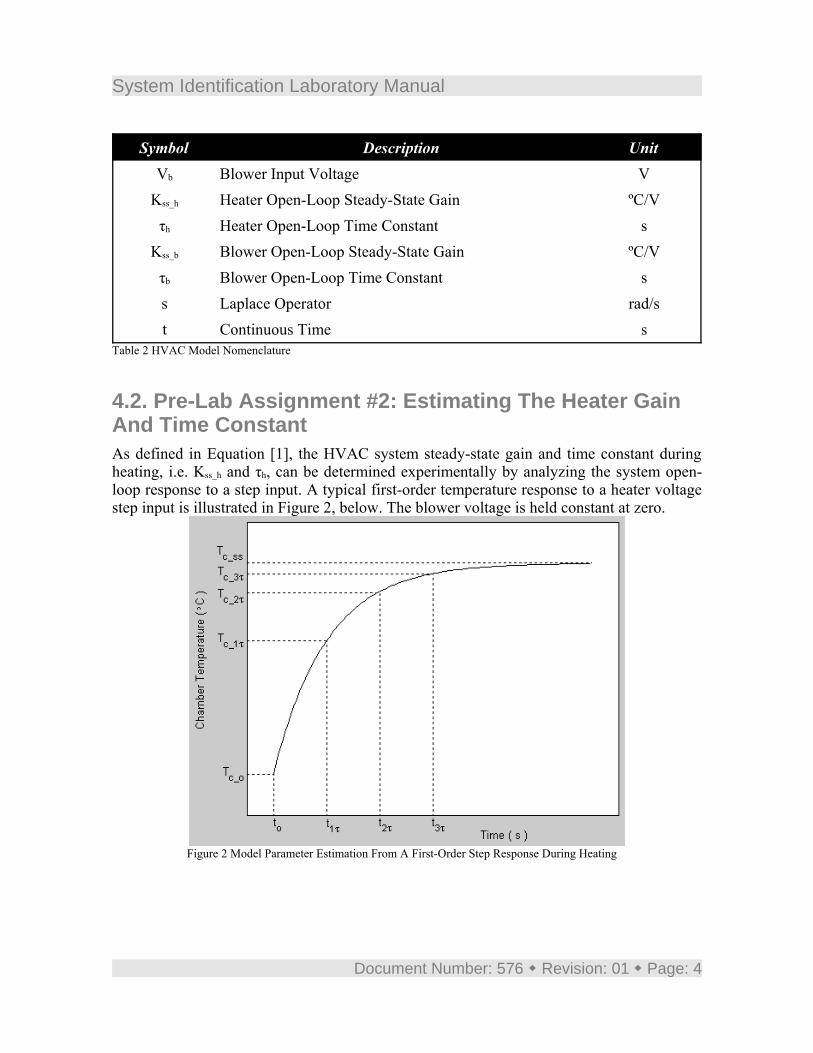
4.2. Pre-Lab Assignment #2: Estimating The Heater GainAnd Time ConstantAs defined in Equation [1], the HVAC system steady-state gain and time constant duringheating, i.e. Kss_h and τh, can be determined experimentally by analyzing the system open-loop response to a step input. A typical first-order temperature response to a heater voltagestep input is illustrated in Figure 2, below. The blower voltage is held constant at zero.
Figure 2 Model Parameter Estimation From A First-Order Step Response During Heating
Document Number: 576 Revision: 01 Page: 4
System Identification Laboratory Manual
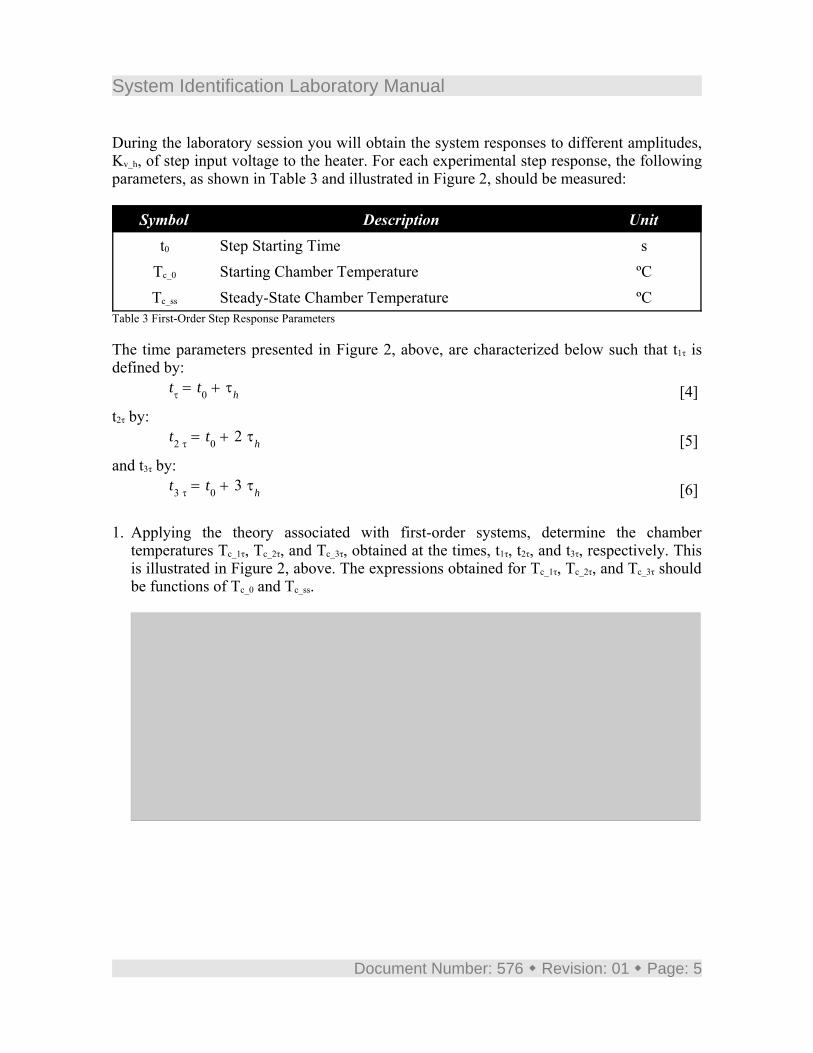
During the laboratory session you will obtain the system responses to different amplitudes,Kv_h, of step input voltage to the heater. For each experimental step response, the followingparameters, as shown in Table 3 and illustrated in Figure 2, should be measured:
Symbol Description Unitt0 Step Starting Time s
Tc_0 Starting Chamber Temperature ºCTc_ss Steady-State Chamber Temperature ºC
Table 3 First-Order Step Response Parameters
The time parameters presented in Figure 2, above, are characterized below such that t1τ isdefined by:
= tτ + t0 τh [4]t2τ by:
= t2 τ + t0 2 τh [5]and t3τ by:
= t3 τ + t0 3 τh [6]
1. Applying the theory associated with first-order systems, determine the chambertemperatures Tc_1τ, Tc_2τ, and Tc_3τ, obtained at the times, t1τ, t2τ, and t3τ, respectively. Thisis illustrated in Figure 2, above. The expressions obtained for Tc_1τ, Tc_2τ, and Tc_3τ shouldbe functions of Tc_0 and Tc_ss.
Solution:Typically, the time response of a first-order system subject to a step input of size Kv_h
can be described as follows (if t ≥ t0):
[s1]
where the steady-state value can be expressed as:[s2]
Document Number: 576 Revision: 01 Page: 5
System Identification Laboratory Manual
Solution (continued):Therefore according to Equation [s1], the chamber temperature Tc_1τ obtained at time t= t1τ, i.e. Tc( t1τ ), can be determined as follows:
[s3]
Likewise the chamber temperature Tc_2τ obtained at time t = t2τ, i.e. Tc( t2τ ), can beexpressed as:
[s4]
Lastly, the chamber temperature Tc_3τ obtained at time t = t3τ, i.e. Tc( t3τ ), can bedetermined as:
[s5]
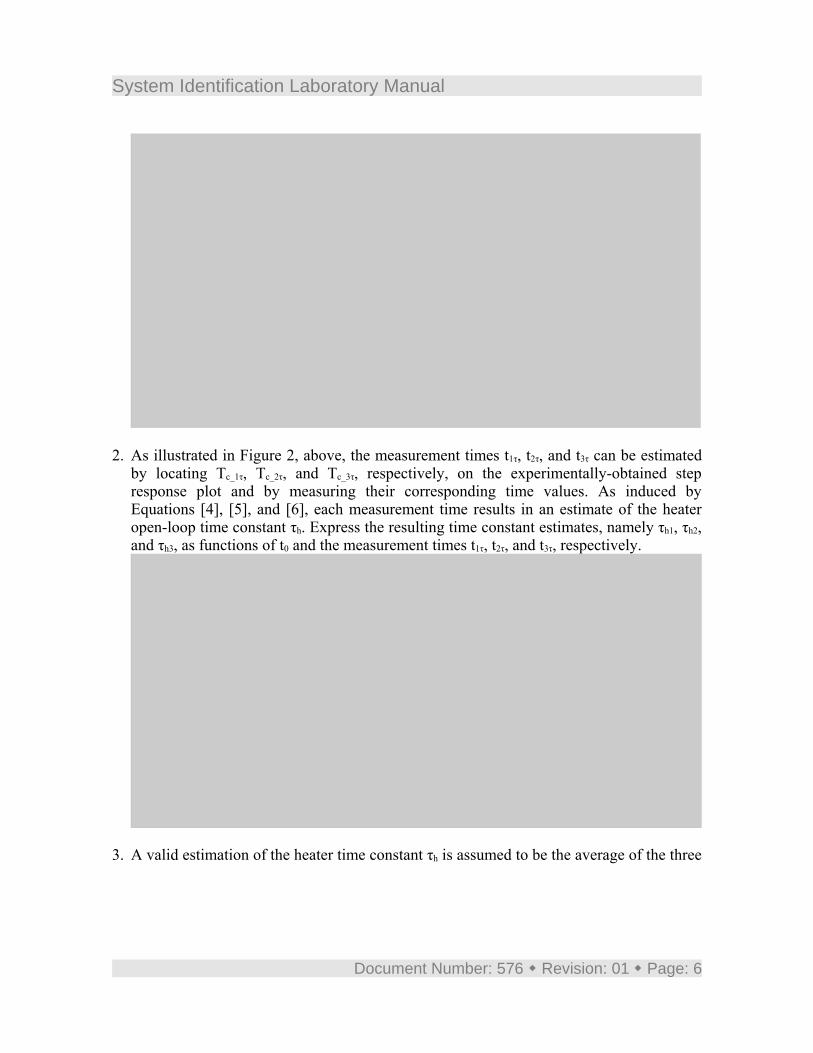
2. As illustrated in Figure 2, above, the measurement times t1τ, t2τ, and t3τ can be estimatedby locating Tc_1τ, Tc_2τ, and Tc_3τ, respectively, on the experimentally-obtained stepresponse plot and by measuring their corresponding time values. As induced byEquations [4], [5], and [6], each measurement time results in an estimate of the heateropen-loop time constant τh. Express the resulting time constant estimates, namely τh1, τh2,and τh3, as functions of t0 and the measurement times t1τ, t2τ, and t3τ, respectively.
Solution:Using Equation [4], the first estimate of τh, i.e. τh1, can be expressed as follows:
[s6]
Likewise using Equation [5], the second estimate of τh, i.e. τh2, can be calculated by thefollowing:
[s7]
Lastly using Equation [6], the third estimate of τh, i.e. τh3, can be determined such as:
[s8]
3. A valid estimation of the heater time constant τh is assumed to be the average of the three
Document Number: 576 Revision: 01 Page: 6
System Identification Laboratory Manual
previously-obtained estimates τh1, τh2, and τh3. Determine the expression for τh as afunction of τh1, τh2, and τh3.
Solution:Taking the arithmetic mean of τh1, τh2, and τh3 results to the following estimate for theheater open-loop time constant:
[s9]
4. Finally determine the expression for Kss_h as a function of Kv_h, Tc_0, and Tc_ss.
Solution:Using Equation [s2], the heater steady-state gain can be calculated according to:
[s10]
4.3. Pre-Lab Assignment #3: Estimating The Blower GainAnd Time ConstantAs defined in Equation [3], the HVAC system steady-state gain and time constant duringblowing, i.e. Kss_b and τb, can also be determined experimentally by analyzing the systemopen-loop response to a step input. A typical first-order temperature response to a blowervoltage step input is illustrated in Figure 3, below. The heater voltage is held constant atzero.
Document Number: 576 Revision: 01 Page: 7
System Identification Laboratory Manual
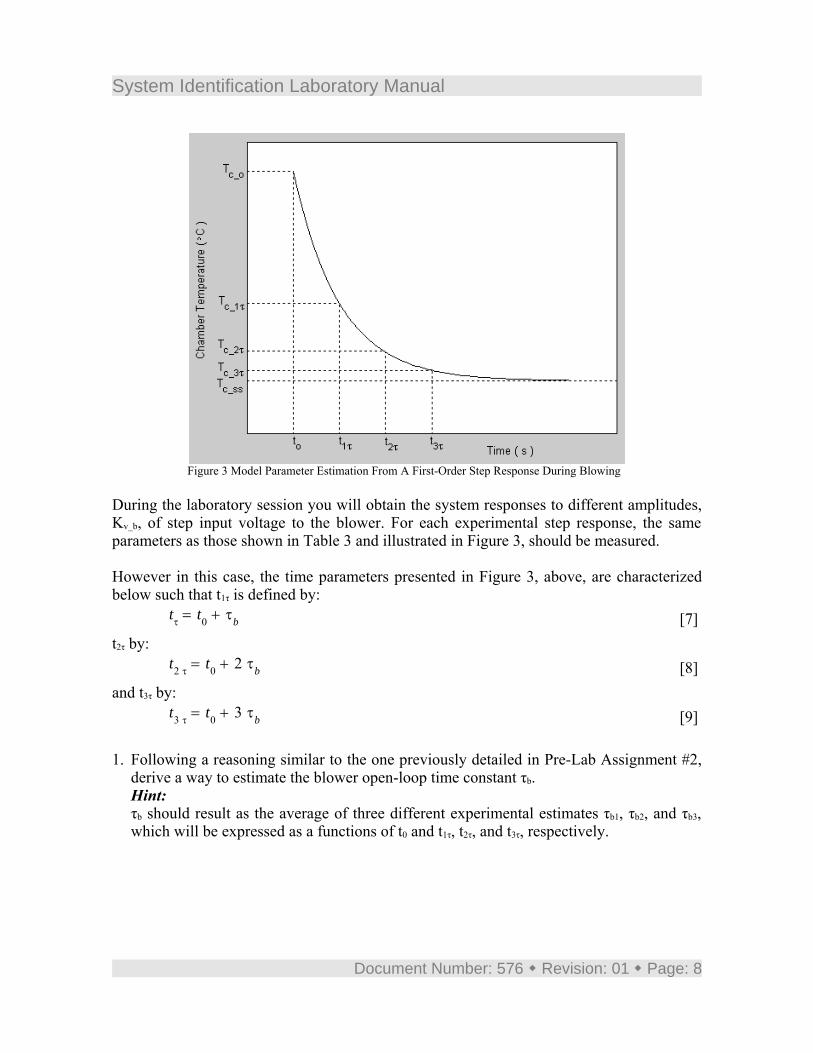
Figure 3 Model Parameter Estimation From A First-Order Step Response During Blowing
During the laboratory session you will obtain the system responses to different amplitudes,Kv_b, of step input voltage to the blower. For each experimental step response, the sameparameters as those shown in Table 3 and illustrated in Figure 3, should be measured.
However in this case, the time parameters presented in Figure 3, above, are characterizedbelow such that t1τ is defined by:
= tτ + t0 τb [7]t2τ by:
= t2 τ + t0 2 τb [8]and t3τ by:
= t3 τ + t0 3 τb [9]
1. Following a reasoning similar to the one previously detailed in Pre-Lab Assignment #2,derive a way to estimate the blower open-loop time constant τb.Hint:τb should result as the average of three different experimental estimates τb1, τb2, and τb3,which will be expressed as a functions of t0 and t1τ, t2τ, and t3τ, respectively.
Document Number: 576 Revision: 01 Page: 8

System Identification Laboratory Manual
Solution:In agreement with Equation [3], the time response of a first-order system subject to astep input of size Kv_b can be described as follows (if t ≥ t0):
[s11]
where the steady-state temperature value can be expressed as:[s12]
As described in Pre-Lab Assignment #2, calculating the chamber temperatures Tc_1τ,Tc_2τ, and Tc_3τ, obtained at the times, t1τ, t2τ, and t3τ, leads to Equations [s3], [s4], and[s5], respectively. Then reporting Tc_1τ, Tc_2τ, and Tc_3τ on the experimentally-obtainedstep response plot, as illustrated in Figure 3 above, gives an estimation of themeasurement times t1τ, t2τ, and t3τ, respectively.
Then using Equation [7], the first time constant estimate, τb1, is given by:[s13]
Likewise using Equation [8], the second time constant estimate, τb2, can be expressedas follows:
[s14]
Lastly using Equation [9], the third estimate of τb, τb3, can be determined such as:
[s15]
Taking the arithmetic mean of τb1, τb2, and τb3 results to the following final estimate forthe blower open-loop time constant:
[s16]
Document Number: 576 Revision: 01 Page: 9
System Identification Laboratory Manual
2. Finally derive an expression for Kss_b as a function of Kv_b, Tc_0, and Tc_ss.
Solution:Using Equation [s12], the blower steady-state gain can be calculated according to:
[s17]
5. In-Lab Session
5.1. System Hardware ConfigurationThis in-lab session is performed using the NI-ELVIS system equipped with a QNET-HVACT board and the Quanser Virtual Instrument (VI) controller fileQNET_HVAC_Lab_05_Sys_ID.vi. Please refer to Reference [2] for the setup and wiringinformation required to carry out the present control laboratory. Reference [2] also providesthe specifications and a description of the main components composing your system.
Before beginning the lab session, ensure the system is configured as follows: QNET HVACT module is connected to the ELVIS. ELVIS Communication Switch is set to BYPASS. DC power supply is connected to the QNET HVAC Trainer module. The 4 LEDs +B, +15V, -15V, +5V on the QNET module should be ON.
5.2. Software User-InterfacePlease follow the steps described below:
Step 1. Read through Section 5.1 and go through the setup guide in Reference [2].Step 2. Open the VI controller QNET_HVAC_Lab_05_Sys_ID.vi shown in Figure 4. The
default sampling rate for the implemented digital controller is 350 Hz. However, youcan adjust it to your system's computing power. Please refer to Reference [1] for acomplete system's description. The chamber temperature, directly sensed by thethermistor, is plotted on a chart as well as displayed in a Numeric Indicator and aThermometer located in the Temperature (degC) front panel box. The values are indegrees Celsius. Run the LabVIEW VI (Ctrl+R) to initialize the open-loop controller.At this point both heater and blower voltages (i.e. Vh and Vb) are set to zero and the
Document Number: 576 Revision: 01 Page: 10
System Identification Laboratory Manual
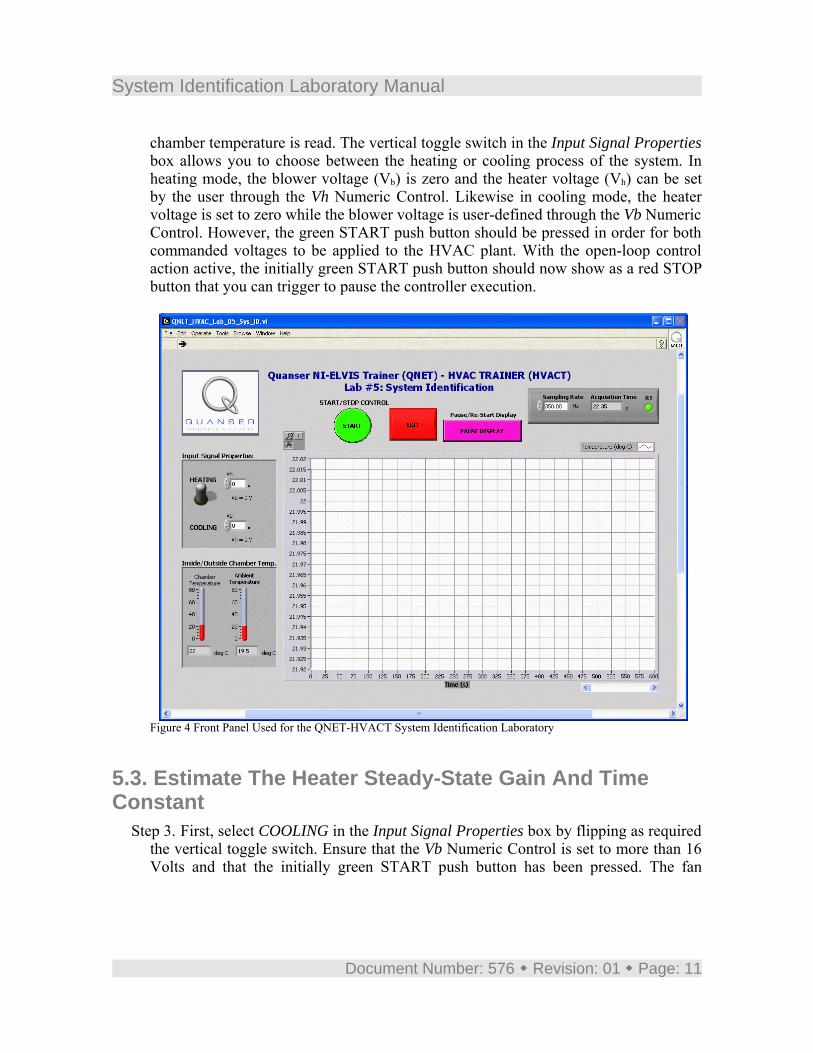
chamber temperature is read. The vertical toggle switch in the Input Signal Propertiesbox allows you to choose between the heating or cooling process of the system. Inheating mode, the blower voltage (Vb) is zero and the heater voltage (Vh) can be setby the user through the Vh Numeric Control. Likewise in cooling mode, the heatervoltage is set to zero while the blower voltage is user-defined through the Vb NumericControl. However, the green START push button should be pressed in order for bothcommanded voltages to be applied to the HVAC plant. With the open-loop controlaction active, the initially green START push button should now show as a red STOPbutton that you can trigger to pause the controller execution.
Figure 4 Front Panel Used for the QNET-HVACT System Identification Laboratory
5.3. Estimate The Heater Steady-State Gain And TimeConstant
Step 3. First, select COOLING in the Input Signal Properties box by flipping as requiredthe vertical toggle switch. Ensure that the Vb Numeric Control is set to more than 16Volts and that the initially green START push button has been pressed. The fan
Document Number: 576 Revision: 01 Page: 11
System Identification Laboratory Manual
should now blow in order to initialize the system by bringing the chamber to ambienttemperature.
Step 4. Click on the red STOP button to stop the blowing once a steady-statetemperature has been reached. Let the chamber air settle for about 20 seconds andreach ambient temperature.
Step 5. Then, select HEATING in the Input Signal Properties box by flipping the toggleswitch. Set the Vh Numeric Control to 1.5 Volts. Clear the chart by right clicking on itand selecting the Clear Chart context menu item. You can now start the step inputtest by pressing the green START push button, which will apply the desired voltagesto the system. The halogen lamp should now be heating proportionally to Vh and thechamber temperature should be rising. The settling time should be less than 600seconds, so that the complete step response fits within the chart time scale. At thispoint, also stop the heater by pressing the red STOP button. DO NOT press EXIT anddo not stop the VI.
Step 6. Make a screen capture of the obtained step response plot once the response hasreached steady-state and join a printout to your report. Your actual response shouldlook similar to the theoretical temperature heating plot presented in Figure 2.
Document Number: 576 Revision: 01 Page: 12
System Identification Laboratory Manual
Solution:A typical open-loop temperature heating step response is shown in Figure 5, below.It has been obtained for a heater input voltage step of 3 Volts.
Figure 5 Heating Step: Vh = 3 V
Step 7. Determine the characteristics of the obtained step response plot by using theGraph Palette located on top of the Chart top left corner. Fill up the following table(i.e. Table 4) by measuring the required data points from the actual plot and bycarrying out the estimation procedure detailed in Pre-Lab Assignment #2. In Table 4,the first line presents the data from Step #1, which corresponds to a heater inputvoltage of 1.5 Volts (i.e. Kv_h). The second line of Table 4 is for an input step of 3.0Volts, which is called Step #2. Determine the corresponding estimates for the heatersteady-state gain, Kss_h, and time constant, τh.
Document Number: 576 Revision: 01 Page: 13
System Identification Laboratory Manual
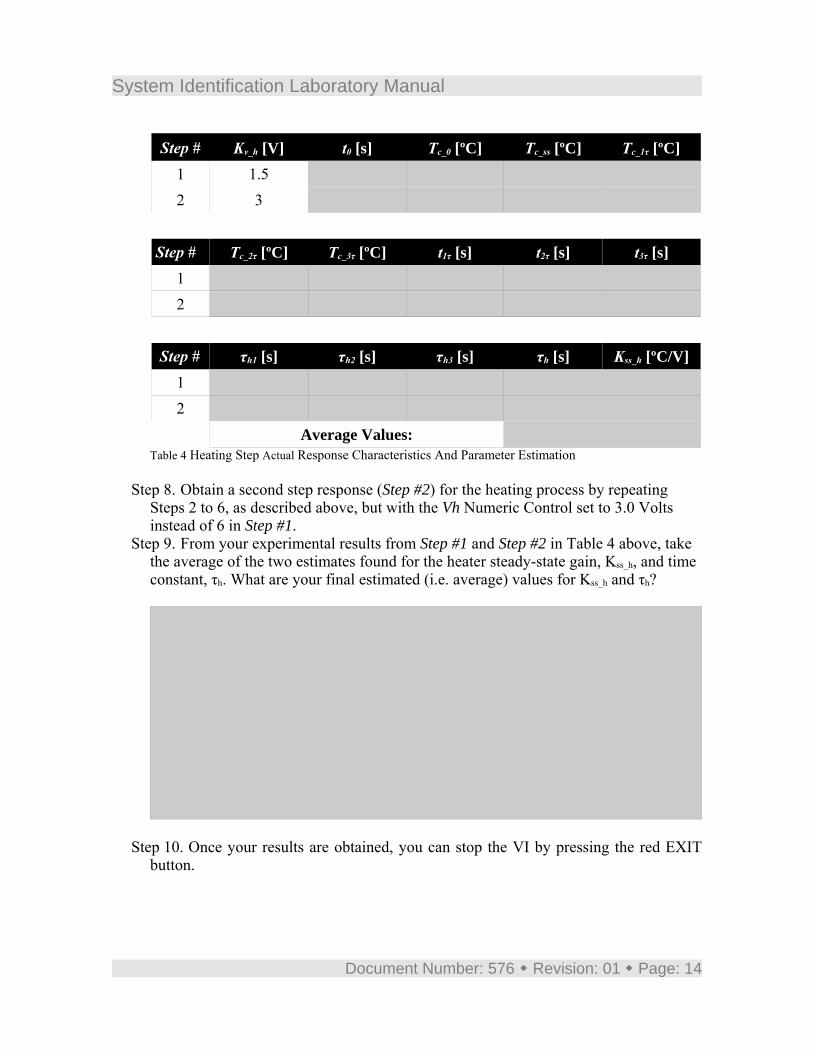
Step # Kv_h [V] t0 [s] Tc_0 [ºC] Tc_ss [ºC] Tc_1τ [ºC]1 1.5 125.0 15.8 38.2 29.92 3 5.0 20.5 65.0 48.5
Step # Tc_2τ [ºC] Tc_3τ [ºC] t1τ [s] t2τ [s] t3τ [s]1 35.1 37.1 325.0 438.0 480.02 58.8 62.8 145.0 290.0 378.0
Step # τh1 [s] τh2 [s] τh3 [s] τh [s] Kss_h [ºC/V]1 200.0 156.5 118.3 158.3 14.92 140.0 142.5 124.3 135.6 14.8
Average Values: 146.9 14.9Table 4 Heating Step Actual Response Characteristics And Parameter Estimation
Step 8. Obtain a second step response (Step #2) for the heating process by repeatingSteps 2 to 6, as described above, but with the Vh Numeric Control set to 3.0 Voltsinstead of 6 in Step #1.
Step 9. From your experimental results from Step #1 and Step #2 in Table 4 above, takethe average of the two estimates found for the heater steady-state gain, Kss_h, and timeconstant, τh. What are your final estimated (i.e. average) values for Kss_h and τh?
Solution:Averaging the values found in Step #1 and Step #2 for Kss_h leads to the followingfinal estimate for the heater steady-state gain:
.[s18]
Averaging the values found in Step #1 and Step #2 for τh leads to the followingfinal estimate for the heater time constant:
. [s19]
Step 10. Once your results are obtained, you can stop the VI by pressing the red EXITbutton.
Document Number: 576 Revision: 01 Page: 14
System Identification Laboratory Manual
5.4. Estimate The Blower Steady-State Gain And TimeConstant
Step 11. Select HEATING in the Input Signal Properties box by flipping as required thevertical toggle switch. Set the Vh Numeric Control to 4.0 Volts. Start the LabVIEWVI (Ctrl+R) if it has been stopped and ensure that the initially green START pushbutton has been pressed. The halogen lamp should now be on and heat up the insideof the chamber. This raises the chamber temperature and initializes the system beforethe cooling step.
Step 12. Monitor the heating the chamber on the front panel. Be prepared to toggle theswitch to COOLING once the chamber temperature is above 60 degrees Celsius. Thiswill stop heating and start blowing/cooling step test. However beforehand, ensure thatthe Vb Numeric Control is first set to 14 Volts.
Step 13. Once the temperature is above 60 °C, first clear the chart by right clicking on itand selecting the Clear Chart context menu item. Then select COOLING in the InputSignal Properties box by flipping the toggle switch. The open-loop step input test isnow started, by applying the desired voltages, Vb and Vh, to the system. The fanshould now be blowing proportionally to Vb and the chamber temperature should bedropping. The settling time should be less than 600 seconds, so that the complete stepresponse fits within the chart time scale. At this point, also stop the blower bypressing the red STOP button. DO NOT press EXIT and do not stop the VI.
Step 14. Make a screen capture of the obtained step response plot once the response hasreached steady-state, which should be around ambient temperature, and join a printoutto your report. Your actual response should look similar to the theoretical temperaturecooling plot presented in Figure 3.
Document Number: 576 Revision: 01 Page: 15
System Identification Laboratory Manual
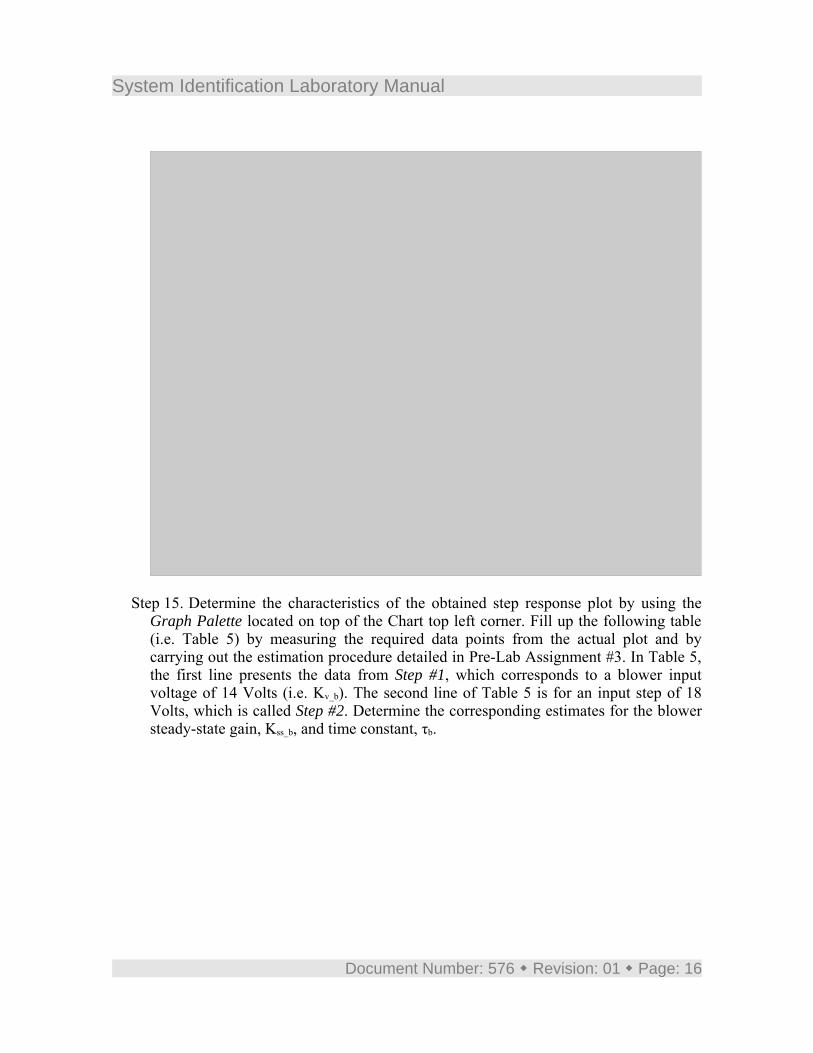
Solution:A typical open-loop temperature cooling step response is shown in Figure 6, below.It has been obtained for a blower input voltage step of 18 Volts.
Figure 6 Cooling Step: Vb = 18 V
Step 15. Determine the characteristics of the obtained step response plot by using theGraph Palette located on top of the Chart top left corner. Fill up the following table(i.e. Table 5) by measuring the required data points from the actual plot and bycarrying out the estimation procedure detailed in Pre-Lab Assignment #3. In Table 5,the first line presents the data from Step #1, which corresponds to a blower inputvoltage of 14 Volts (i.e. Kv_b). The second line of Table 5 is for an input step of 18Volts, which is called Step #2. Determine the corresponding estimates for the blowersteady-state gain, Kss_b, and time constant, τb.
Document Number: 576 Revision: 01 Page: 16

System Identification Laboratory Manual
Step # Kv_b [V] t0 [s] Tc_0 [ºC] Tc_ss [ºC] Tc_1τ [ºC]1 14 5.0 61.5 25.3 38.72 18 0.5 62.5 20.3 35.9
Step # Tc_2τ [ºC] Tc_3τ [ºC] t1τ [s] t2τ [s] t3τ [s]1 30.4 27.1 30.0 80.0 162.02 26.2 22.4 18.0 39.0 75.0
Step # τb1 [s] τb2 [s] τb3 [s] τb [s] Kss_b [ºC/V]1 25.0 37.5 52.3 38.3 2.62 17.5 19.3 24.8 20.5 2.3
Average Values: 29.4 2.5Table 5 Blowing Step Actual Response Characteristics And Parameter Estimation
Step 16. Obtain a second step response (Step #2) for the blowing process by repeatingSteps 10 to 14, as described above, but with the Vb Numeric Control set to 18 Voltsinstead of 6 in Step #1.
Step 17. From your experimental results from Step #1 and Step #2 in Table 5 above, takethe average of the two estimates found for the blower steady-state gain, Kss_b, and timeconstant, τb. What are your final estimated (i.e. average) values for Kss_b and τb?
Solution:Averaging the values found in Step #1 and Step #2 for Kss_b leads to the followingfinal estimate for the blower steady-state gain:
.[s20]
Averaging the values found in Step #1 and Step #2 for τb leads to the following finalestimate for the blower time constant:
. [s21]
Step 18. Once your results are obtained, you can stop the VI by pressing the red EXITbutton.
Document Number: 576 Revision: 01 Page: 17
System Identification Laboratory Manual
5.5. Estimate The Heater And Blower Deadband VoltagesStep 19. Let us define Vh_off and Vb_off the heater and blower positive (i.e. upper limit)
deadband voltages, respectively. Deadband, or deadzone, is chiefly due tononlinearity in the system such as static friction, or electrical offset, and the like.
Step 20. To determine Vh_off experimentally, select HEATING in the Input SignalProperties box by flipping as required the vertical toggle switch and set the VhNumeric Control to 0 Volts to start. Start the LabVIEW VI (Ctrl+R) if it has beenstopped and ensure that the initially green START push button has been pressed. Bothhalogen lamp and fan should be off as their respective input voltages, Vh and Vb, areset to zero. Now slowly increase Vh, by steps of 0.1 Volts, until the halogen lampfilament becomes on and turns orange. You can do so by using theincrement/decrement button on the left side of the Vh Numeric Control. Wait for afew seconds between two increment steps to let the heater settle at the new inputvoltage. Stop incrementing as soon as the bulb starts switching on.
Step 21. What is your measured heater deadband voltage?
Solution:The measured heater deadband voltage, Vh_off, should be close to:
Step 22. To determine Vb_off experimentally, set the Vb Numeric Control in the InputSignal Properties box to 0 Volts and flip the toggle switch to COOLING. Start theLabVIEW VI (Ctrl+R) if it has been stopped and ensure that the initially greenSTART push button has been pressed. Both halogen lamp and fan should be off astheir respective input voltages, Vh and Vb, are set to zero. Now slowly increase Vb, bysteps of 0.1 Volts, until the fan starts to turn. You can do so by using theincrement/decrement button on the left side of the Vb Numeric Control. Wait for afew seconds between two increment steps to let the fan settle at the new input voltage.Stop incrementing as soon as the fan has started.
Document Number: 576 Revision: 01 Page: 18
System Identification Laboratory Manual
Step 23. What is your measured blower deadband voltage?
Solution:The measured blower deadband voltage, Vb_off, should be close to:
.
Step 24. Both Vh_off and Vb_off could be used in a control system scheme for deadbandcompensation.
Step 25. Shut off the PROTOTYPING POWER BOARD switch and the SYSTEMPOWER switch at the back of the ELVIS unit. Unplug the module AC cord. Finally,stop the VI by pressing the red EXIT button.
Step 26. Before leaving the laboratory session, ensure that you have all the experimentalresults required for your lab report
Document Number: 576 Revision: 01 Page: 19
Related Documents