Research paper Heap leaching. Computer simulation as an alternative technology I.N. Groznov a,b, * a Gold Mining Holding “Seligdar”, Aldan, the Republic of Sakha (Yakutia), 678900 Russia b Institute for Energy Problems of Chemical Physics, RussianAcademy of Science, 38 Leninsky prosp. Bld.2, Moscow, 119334 Russia Received 5 May 2015; accepted 17 June 2015 Available online 22 July 2015 Abstract The article discusses the possibility of reducing environmental risks and resources by finding ways to optimize technology solutions with a computer program that simulates the heap leaching process. It is shown that the main role in the design and operational control plays simulation and an understanding of the structure and movement of the concentration fronts of substances – leaching participants within the heap. The examples of process control by conventional technological parameters – density of irrigation, fineness crushing or agglomeration bulk and height of the heap – show the attainability a significant reduction in of leaching time and as a result, reducing consumption of energy, water and sodium cyanide. The latter is a major threat to the environment. © 2015Tomsk Polytechnic University. Production and hosting by Elsevier B.V.This is an open access article under the CC BY-NC-ND license (http://creativecommons.org/licenses/by-nc-nd/4.0/). Peer review under responsibility of Tomsk Polytechnic University. Keywords: Heap leaching; Computer simulation; Alternative technology 1. Introduction. Statement of the problem Heap leaching of precious metals from low-grade ores is highly resource- and energy-intensive process. Lots of heap leaching occupies dozens and sometimes hundreds of hectares of land. In the reverse process at the same time there are hundreds of thousands of cubic meters of toxic sodium cyanide solution. This circumstance represents a significant threat to the environment. Engineering measures taken to protect and prevent possible risks do not eliminate completely the cases of defeat on the surrounding countryside and surface and ground water [1,2]. Reducing the potential risks is achievable with decreasing volumes in circulation solutions that must lead to significant energy savings and reduced consumption of sodium cyanide per unit of output. Searching for opportunities to optimize the heap leaching process by conscious choice of control models can play a significant role in solving the problem of reducing envi- ronmental risks and resource. Heap management is performed in two stages. In the first stage of design as a result of preliminary laboratory and some- times semiindustrial study of the properties of ore and on the basis of gained experience designers the requirements for the ore fractional composition and the heap geometric parameters are formed. We do not consider here the economic component of the design process, although it also plays a very important role in the choice of a particular technological solution. After the formation the heap enters a stage of irrigation and metal recovery. The current process control practice of the heap leaching of gold is to regulate the flow of the working solution at the pH and concentration of sodium cyanide and density irrigation. The result is a change of gold concentration in the pregnant solutions arising from the heap. The experience gained by the technologist allows partially to optimize the process for product cost and other economic and technological indicators. The search for formal criteria to achieve the optimal parameters is an important task of the entire heap leaching technology [3,4]. An optimization problem may be well solved in the presence of a formalized numerical model of the process. Currently, there are different approaches to the creation of numerical models [5–8]. However, the achieved level of formalization of the problem does not allow technologists to obtain fairly complete and comprehensible description of percolation and chemical pro- cesses within the heap using existing approaches and software. The principal drawback of the existing models is a complete lack of information on the state of the heap and current distri- bution of substances – participants’ cyanidation in the inner * Institute for energy problems of chemical physics, Russian Academy of science. 38 Leninsky prosp. Bld.2, Moscow, 119334 Russia. E-mail address: [email protected]. http://dx.doi.org/10.1016/j.reffit.2015.07.002 2405-6537/© 2015Tomsk Polytechnic University. Production and hosting by Elsevier B.V.This is an open access article under the CC BY-NC-ND license (http://creativecommons.org/licenses/by-nc-nd/4.0/). Peer review under responsibility of Tomsk Polytechnic University. Available online at www.sciencedirect.com Resource-Efficient Technologies 1 (2015) 3–9 www.elsevier.com/locate/reffit HOSTED BY ScienceDirect

Welcome message from author
This document is posted to help you gain knowledge. Please leave a comment to let me know what you think about it! Share it to your friends and learn new things together.
Transcript
Research paper
Heap leaching. Computer simulation as an alternative technologyI.N. Groznov a,b,*
a Gold Mining Holding “Seligdar”, Aldan, the Republic of Sakha (Yakutia), 678900 Russiab Institute for Energy Problems of Chemical Physics, Russian Academy of Science, 38 Leninsky prosp. Bld.2, Moscow, 119334 Russia
Received 5 May 2015; accepted 17 June 2015
Available online 22 July 2015
Abstract
The article discusses the possibility of reducing environmental risks and resources by finding ways to optimize technology solutions with acomputer program that simulates the heap leaching process. It is shown that the main role in the design and operational control plays simulationand an understanding of the structure and movement of the concentration fronts of substances – leaching participants within the heap. Theexamples of process control by conventional technological parameters – density of irrigation, fineness crushing or agglomeration bulk and heightof the heap – show the attainability a significant reduction in of leaching time and as a result, reducing consumption of energy, water and sodiumcyanide. The latter is a major threat to the environment.© 2015 Tomsk Polytechnic University. Production and hosting by Elsevier B.V. This is an open access article under the CC BY-NC-ND license(http://creativecommons.org/licenses/by-nc-nd/4.0/). Peer review under responsibility of Tomsk Polytechnic University.
Keywords: Heap leaching; Computer simulation; Alternative technology
1. Introduction. Statement of the problem
Heap leaching of precious metals from low-grade ores ishighly resource- and energy-intensive process. Lots of heapleaching occupies dozens and sometimes hundreds of hectares ofland. In the reverse process at the same time there are hundredsof thousands of cubic meters of toxic sodium cyanide solution.This circumstance represents a significant threat to theenvironment. Engineering measures taken to protect and preventpossible risks do not eliminate completely the cases of defeat onthe surrounding countryside and surface and ground water [1,2].
Reducing the potential risks is achievable with decreasingvolumes in circulation solutions that must lead to significantenergy savings and reduced consumption of sodium cyanide perunit of output. Searching for opportunities to optimize the heapleaching process by conscious choice of control models canplay a significant role in solving the problem of reducing envi-ronmental risks and resource.
Heap management is performed in two stages. In the firststage of design as a result of preliminary laboratory and some-times semiindustrial study of the properties of ore and on the
basis of gained experience designers the requirements for theore fractional composition and the heap geometric parametersare formed. We do not consider here the economic componentof the design process, although it also plays a very importantrole in the choice of a particular technological solution.
After the formation the heap enters a stage of irrigation andmetal recovery. The current process control practice of the heapleaching of gold is to regulate the flow of the working solution atthe pH and concentration of sodium cyanide and densityirrigation. The result is a change of gold concentration in thepregnant solutions arising from the heap. The experience gainedby the technologist allows partially to optimize the process forproduct cost and other economic and technological indicators.
The search for formal criteria to achieve the optimal parametersis an important task of the entire heap leaching technology [3,4].
An optimization problem may be well solved in the presenceof a formalized numerical model of the process. Currently, thereare different approaches to the creation of numerical models[5–8]. However, the achieved level of formalization of theproblem does not allow technologists to obtain fairly completeand comprehensible description of percolation and chemical pro-cesses within the heap using existing approaches and software.
The principal drawback of the existing models is a completelack of information on the state of the heap and current distri-bution of substances – participants’ cyanidation in the inner
* Institute for energy problems of chemical physics, Russian Academy ofscience. 38 Leninsky prosp. Bld.2, Moscow, 119334 Russia.
E-mail address: [email protected].
http://dx.doi.org/10.1016/j.reffit.2015.07.0022405-6537/© 2015 Tomsk Polytechnic University. Production and hosting by Elsevier B.V. This is an open access article under the CC BY-NC-ND license(http://creativecommons.org/licenses/by-nc-nd/4.0/). Peer review under responsibility of Tomsk Polytechnic University.
Available online at www.sciencedirect.com
Resource-Efficient Technologies 1 (2015) 3–9www.elsevier.com/locate/reffit
H O S T E D BY
ScienceDirect
layers of the heap. Experiments on the columns 10–12 m heightallow us to obtain the uninformative distribution of substancesin the end of the leaching cycle, but do not allow to monitor thesituation in real time. For this reason, the information receivedin such a way has very limited application and may not bepractically used for designing or controlling the actual heap.Consequently, in the current literature the question of the inter-nal state and the distribution of chemicals within the heap is notconsidered due to the lack of approaches to solve the problem.But this very information is necessary for cost-effective andresource-saving solutions search.
The software simulating the heap leaching process consid-ered in this paper may help to overcome such difficulties. Thisprocess is similar in the form to the movement of the trailingedge in the frontal chromatography by washing the chromato-graphic column from the sorbed substance. Such a view makesit possible to understand essentially the process of leaching,although the precise description of the expenditure of sodiumcyanide within the heap has some specific features that do notadequately develop this analogy further.
2. Results
2.1. Description of mathematical models and software
Heap is considered as granular medium with a flow passagebetween the pieces of ore and non-flowing channels insidepieces of rock or agglomerates. Block of hydrodynamic equa-tions is based on the well-known and fairly comprehensive vanGenuhten [9] model, which allows to simulate flows in granularmedia in both saturated and unsaturated mode. This model issupplemented by equations describing the kinetics of the inter-action of cyanide solutions with gold and impurity metalsabsorbing sodium cyanide as it flows through the ore layersand the equations of exchange solutes between flowing andnonflowing channels, carried out mainly by diffusion. Thus, theprogramme skeleton has more than a dozen of partial differen-tial equations and equations of exchange. With the increasingcomplexity of the fractional composition of the ore or thenumber of irrigated tiers or heaps at the same time the numberof solved equations has grown significantly, but, nevertheless, ithas a little effect on the duration of the simulation. The simplestmodel of the heap having single fraction in one layer iscalculated on a standard PC within minutes. Calculation ofmore complex multi-tiered and multifractional model may takehours.
The programme menu is made in Russian.The model of single heap or complex flowsheet is created
from separate blocks, allowing designer to collect sophisticatedvariants site heap leaching like in tinker toys. Each heap mayconsist of a set of fractions that differ in their kinetic andhydrodynamic parameters, gold content and exchange constantbetween the flowing and unflowing areas. Heaps can be irri-gated in parallel or in series, which allow to carry out simula-tion of recirculating irrigation regime or multi-tiered pile withconsistent showering on the upper tiers as mining lower.
Here the monitor displayes in the real-time distributioncurves within the heap of sodium cyanide and leachable gold
inside of agglomerates in the solid phase and passed into thesolution, and solutions for flow and stagnant zones separately.
There is a continuous calculation of solutions casted on abunch in terms of volume and sodium cyanide weight andcyanide solution in heap and their output from the heap. Alsothe balance of gold is estimated and this information is alsoavailable in real time.
This information allows to search for a targeted technologi-cal solution that reduce the consumption of water, electricity,sodium cyanide and critically reduces the cyanidation time andrelated environmental risks.
2.2. Physics of the leaching. Movement ofconcentration fronts
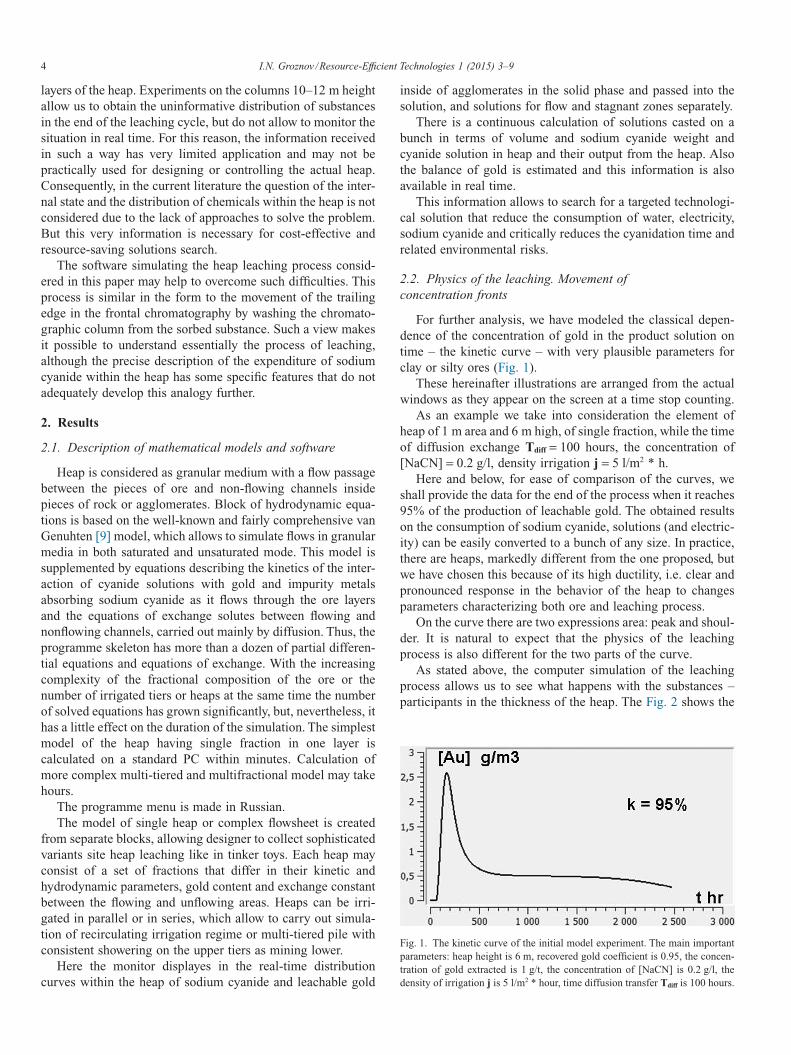
For further analysis, we have modeled the classical depen-dence of the concentration of gold in the product solution ontime – the kinetic curve – with very plausible parameters forclay or silty ores (Fig. 1).
These hereinafter illustrations are arranged from the actualwindows as they appear on the screen at a time stop counting.
As an example we take into consideration the element ofheap of 1 m area and 6 m high, of single fraction, while the timeof diffusion exchange Tdiff = 100 hours, the concentration of[NaCN] = 0.2 g/l, density irrigation j = 5 l/m2 * h.
Here and below, for ease of comparison of the curves, weshall provide the data for the end of the process when it reaches95% of the production of leachable gold. The obtained resultson the consumption of sodium cyanide, solutions (and electric-ity) can be easily converted to a bunch of any size. In practice,there are heaps, markedly different from the one proposed, butwe have chosen this because of its high ductility, i.e. clear andpronounced response in the behavior of the heap to changesparameters characterizing both ore and leaching process.
On the curve there are two expressions area: peak and shoul-der. It is natural to expect that the physics of the leachingprocess is also different for the two parts of the curve.
As stated above, the computer simulation of the leachingprocess allows us to see what happens with the substances –participants in the thickness of the heap. The Fig. 2 shows the
Fig. 1. The kinetic curve of the initial model experiment. The main importantparameters: heap height is 6 m, recovered gold coefficient is 0.95, the concen-tration of gold extracted is 1 g/t, the concentration of [NaCN] is 0.2 g/l, thedensity of irrigation j is 5 l/m2 * hour, time diffusion transfer Tdiff is 100 hours.
4 I.N. Groznov /Resource-Efficient Technologies 1 (2015) 3–9
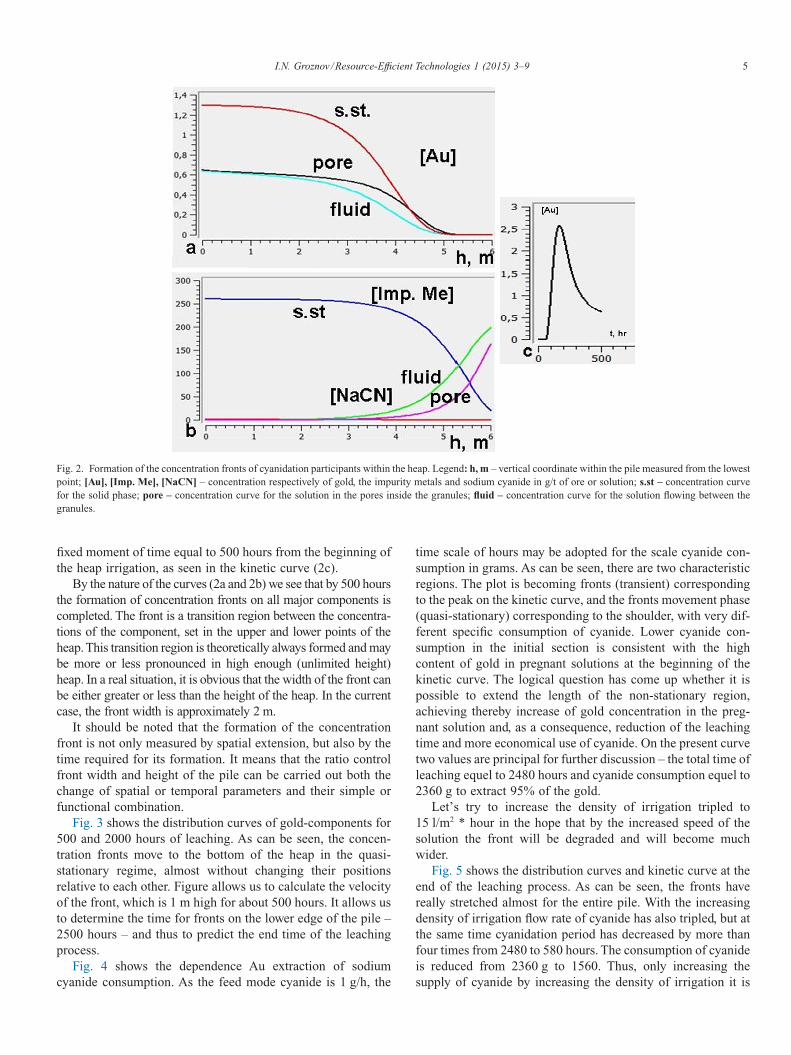
fixed moment of time equal to 500 hours from the beginning ofthe heap irrigation, as seen in the kinetic curve (2c).
By the nature of the curves (2a and 2b) we see that by 500 hoursthe formation of concentration fronts on all major components iscompleted. The front is a transition region between the concentra-tions of the component, set in the upper and lower points of theheap. This transition region is theoretically always formed and maybe more or less pronounced in high enough (unlimited height)heap. In a real situation, it is obvious that the width of the front canbe either greater or less than the height of the heap. In the currentcase, the front width is approximately 2 m.
It should be noted that the formation of the concentrationfront is not only measured by spatial extension, but also by thetime required for its formation. It means that the ratio controlfront width and height of the pile can be carried out both thechange of spatial or temporal parameters and their simple orfunctional combination.
Fig. 3 shows the distribution curves of gold-components for500 and 2000 hours of leaching. As can be seen, the concen-tration fronts move to the bottom of the heap in the quasi-stationary regime, almost without changing their positionsrelative to each other. Figure allows us to calculate the velocityof the front, which is 1 m high for about 500 hours. It allows usto determine the time for fronts on the lower edge of the pile –2500 hours – and thus to predict the end time of the leachingprocess.
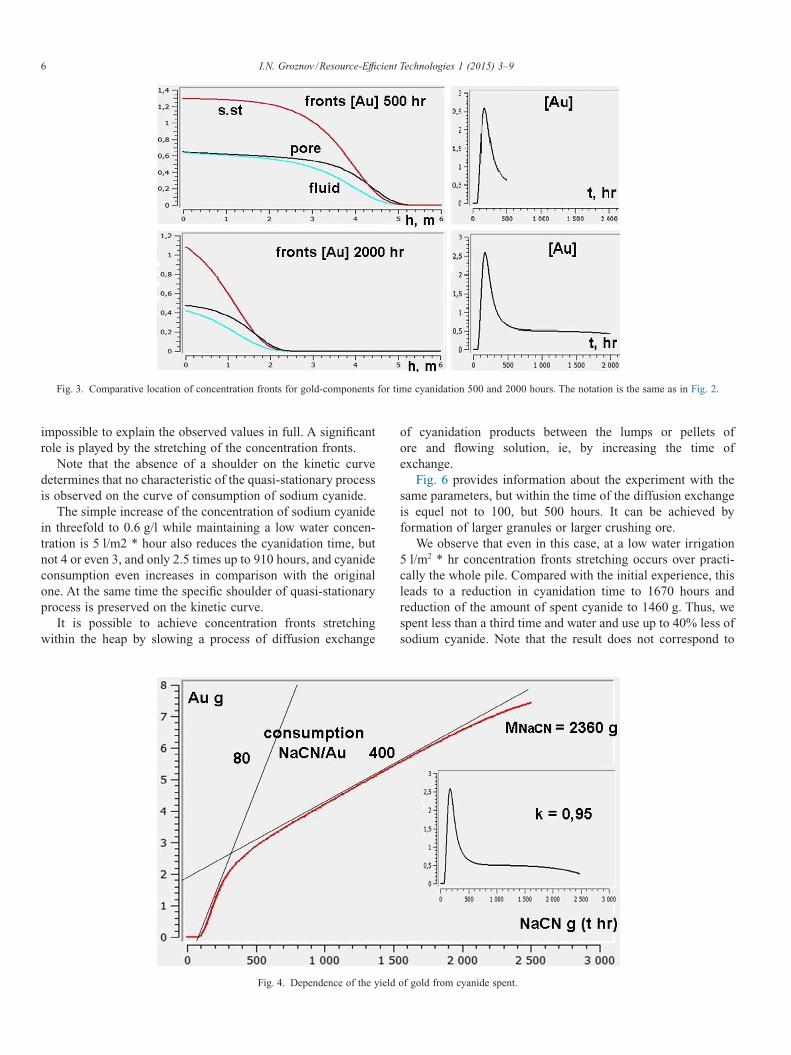
Fig. 4 shows the dependence Au extraction of sodiumcyanide consumption. As the feed mode cyanide is 1 g/h, the
time scale of hours may be adopted for the scale cyanide con-sumption in grams. As can be seen, there are two characteristicregions. The plot is becoming fronts (transient) correspondingto the peak on the kinetic curve, and the fronts movement phase(quasi-stationary) corresponding to the shoulder, with very dif-ferent specific consumption of cyanide. Lower cyanide con-sumption in the initial section is consistent with the highcontent of gold in pregnant solutions at the beginning of thekinetic curve. The logical question has come up whether it ispossible to extend the length of the non-stationary region,achieving thereby increase of gold concentration in the preg-nant solution and, as a consequence, reduction of the leachingtime and more economical use of cyanide. On the present curvetwo values are principal for further discussion – the total time ofleaching equel to 2480 hours and cyanide consumption equel to2360 g to extract 95% of the gold.
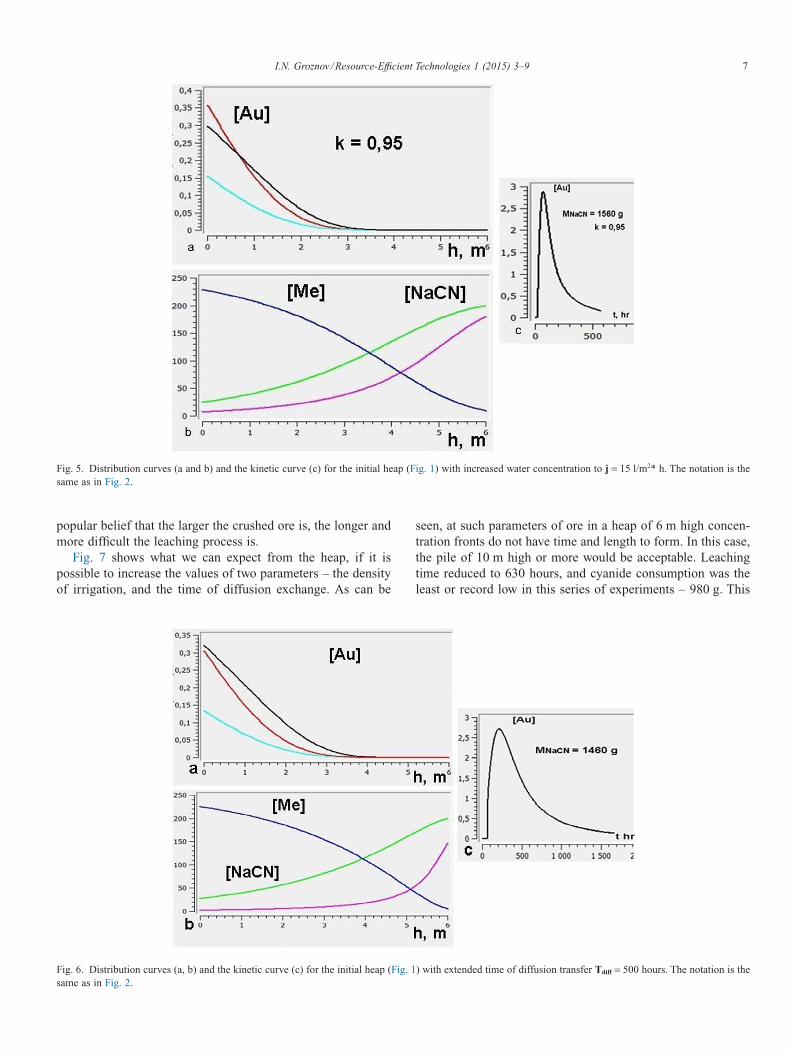
Let’s try to increase the density of irrigation tripled to15 l/m2 * hour in the hope that by the increased speed of thesolution the front will be degraded and will become muchwider.
Fig. 5 shows the distribution curves and kinetic curve at theend of the leaching process. As can be seen, the fronts havereally stretched almost for the entire pile. With the increasingdensity of irrigation flow rate of cyanide has also tripled, but atthe same time cyanidation period has decreased by more thanfour times from 2480 to 580 hours. The consumption of cyanideis reduced from 2360 g to 1560. Thus, only increasing thesupply of cyanide by increasing the density of irrigation it is
Fig. 2. Formation of the concentration fronts of cyanidation participants within the heap. Legend: h, m – vertical coordinate within the pile measured from the lowestpoint; [Au], [Imp. Me], [NaCN] – concentration respectively of gold, the impurity metals and sodium cyanide in g/t of ore or solution; s.st – concentration curvefor the solid phase; pore – concentration curve for the solution in the pores inside the granules; fluid – concentration curve for the solution flowing between thegranules.
5I.N. Groznov /Resource-Efficient Technologies 1 (2015) 3–9
impossible to explain the observed values in full. A significantrole is played by the stretching of the concentration fronts.
Note that the absence of a shoulder on the kinetic curvedetermines that no characteristic of the quasi-stationary processis observed on the curve of consumption of sodium cyanide.
The simple increase of the concentration of sodium cyanidein threefold to 0.6 g/l while maintaining a low water concen-tration is 5 l/m2 * hour also reduces the cyanidation time, butnot 4 or even 3, and only 2.5 times up to 910 hours, and cyanideconsumption even increases in comparison with the originalone. At the same time the specific shoulder of quasi-stationaryprocess is preserved on the kinetic curve.
It is possible to achieve concentration fronts stretchingwithin the heap by slowing a process of diffusion exchange
of cyanidation products between the lumps or pellets ofore and flowing solution, ie, by increasing the time ofexchange.
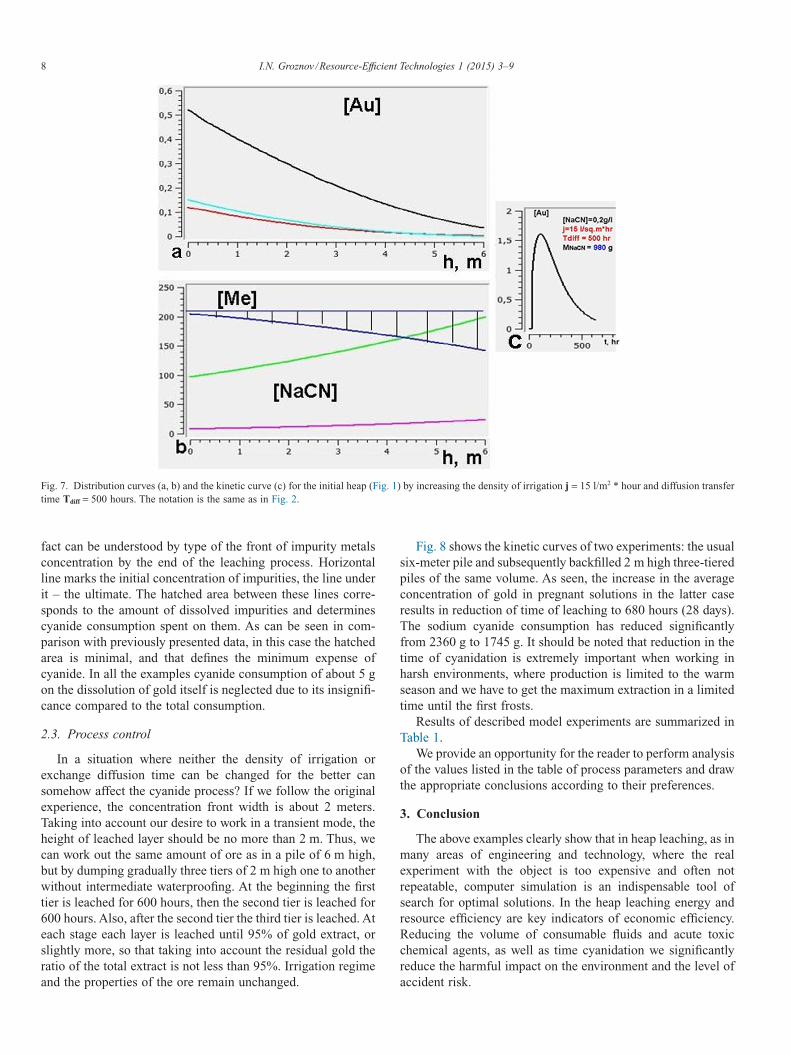
Fig. 6 provides information about the experiment with thesame parameters, but within the time of the diffusion exchangeis equel not to 100, but 500 hours. It can be achieved byformation of larger granules or larger crushing ore.
We observe that even in this case, at a low water irrigation5 l/m2 * hr concentration fronts stretching occurs over practi-cally the whole pile. Compared with the initial experience, thisleads to a reduction in cyanidation time to 1670 hours andreduction of the amount of spent cyanide to 1460 g. Thus, wespent less than a third time and water and use up to 40% less ofsodium cyanide. Note that the result does not correspond to
Fig. 3. Comparative location of concentration fronts for gold-components for time cyanidation 500 and 2000 hours. The notation is the same as in Fig. 2.
Fig. 4. Dependence of the yield of gold from cyanide spent.
6 I.N. Groznov /Resource-Efficient Technologies 1 (2015) 3–9
popular belief that the larger the crushed ore is, the longer andmore difficult the leaching process is.
Fig. 7 shows what we can expect from the heap, if it ispossible to increase the values of two parameters – the densityof irrigation, and the time of diffusion exchange. As can be
seen, at such parameters of ore in a heap of 6 m high concen-tration fronts do not have time and length to form. In this case,the pile of 10 m high or more would be acceptable. Leachingtime reduced to 630 hours, and cyanide consumption was theleast or record low in this series of experiments – 980 g. This
Fig. 5. Distribution curves (a and b) and the kinetic curve (c) for the initial heap (Fig. 1) with increased water concentration to j = 15 l/m2* h. The notation is thesame as in Fig. 2.
Fig. 6. Distribution curves (a, b) and the kinetic curve (c) for the initial heap (Fig. 1) with extended time of diffusion transfer Tdiff = 500 hours. The notation is thesame as in Fig. 2.
7I.N. Groznov /Resource-Efficient Technologies 1 (2015) 3–9
fact can be understood by type of the front of impurity metalsconcentration by the end of the leaching process. Horizontalline marks the initial concentration of impurities, the line underit – the ultimate. The hatched area between these lines corre-sponds to the amount of dissolved impurities and determinescyanide consumption spent on them. As can be seen in com-parison with previously presented data, in this case the hatchedarea is minimal, and that defines the minimum expense ofcyanide. In all the examples cyanide consumption of about 5 gon the dissolution of gold itself is neglected due to its insignifi-cance compared to the total consumption.
2.3. Process control
In a situation where neither the density of irrigation orexchange diffusion time can be changed for the better cansomehow affect the cyanide process? If we follow the originalexperience, the concentration front width is about 2 meters.Taking into account our desire to work in a transient mode, theheight of leached layer should be no more than 2 m. Thus, wecan work out the same amount of ore as in a pile of 6 m high,but by dumping gradually three tiers of 2 m high one to anotherwithout intermediate waterproofing. At the beginning the firsttier is leached for 600 hours, then the second tier is leached for600 hours. Also, after the second tier the third tier is leached. Ateach stage each layer is leached until 95% of gold extract, orslightly more, so that taking into account the residual gold theratio of the total extract is not less than 95%. Irrigation regimeand the properties of the ore remain unchanged.
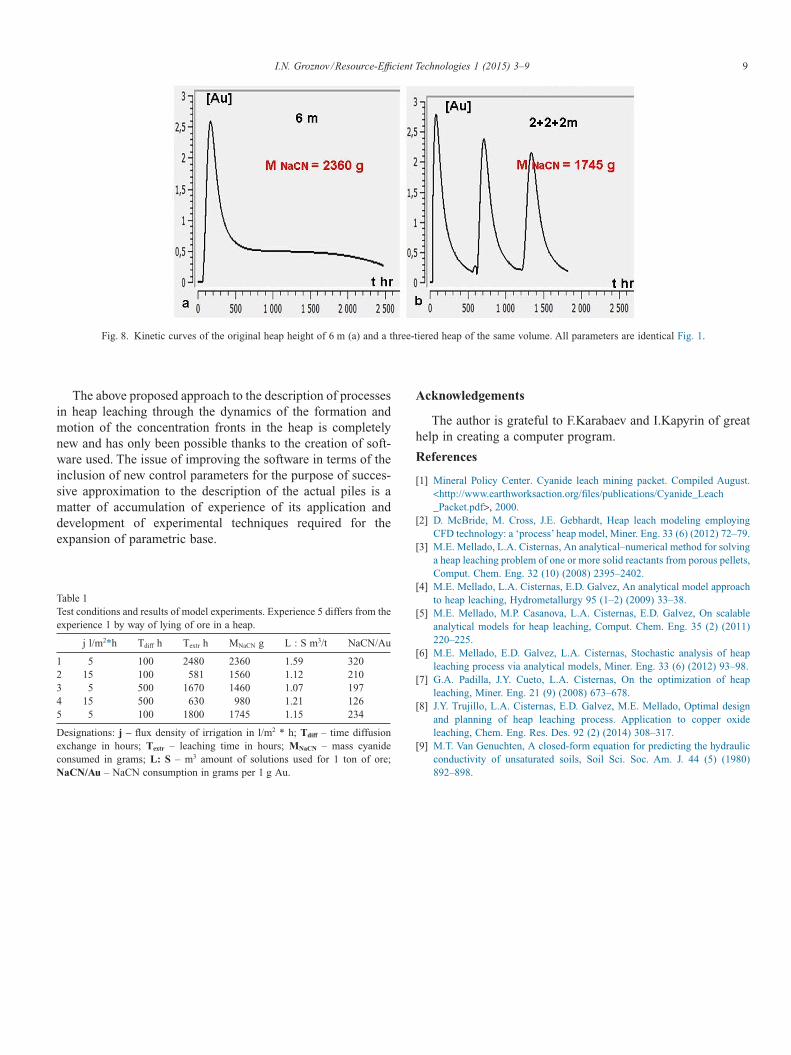
Fig. 8 shows the kinetic curves of two experiments: the usualsix-meter pile and subsequently backfilled 2 m high three-tieredpiles of the same volume. As seen, the increase in the averageconcentration of gold in pregnant solutions in the latter caseresults in reduction of time of leaching to 680 hours (28 days).The sodium cyanide consumption has reduced significantlyfrom 2360 g to 1745 g. It should be noted that reduction in thetime of cyanidation is extremely important when working inharsh environments, where production is limited to the warmseason and we have to get the maximum extraction in a limitedtime until the first frosts.
Results of described model experiments are summarized inTable 1.
We provide an opportunity for the reader to perform analysisof the values listed in the table of process parameters and drawthe appropriate conclusions according to their preferences.
3. Conclusion
The above examples clearly show that in heap leaching, as inmany areas of engineering and technology, where the realexperiment with the object is too expensive and often notrepeatable, computer simulation is an indispensable tool ofsearch for optimal solutions. In the heap leaching energy andresource efficiency are key indicators of economic efficiency.Reducing the volume of consumable fluids and acute toxicchemical agents, as well as time cyanidation we significantlyreduce the harmful impact on the environment and the level ofaccident risk.
Fig. 7. Distribution curves (a, b) and the kinetic curve (c) for the initial heap (Fig. 1) by increasing the density of irrigation j = 15 l/m2 * hour and diffusion transfertime Tdiff = 500 hours. The notation is the same as in Fig. 2.
8 I.N. Groznov /Resource-Efficient Technologies 1 (2015) 3–9
The above proposed approach to the description of processesin heap leaching through the dynamics of the formation andmotion of the concentration fronts in the heap is completelynew and has only been possible thanks to the creation of soft-ware used. The issue of improving the software in terms of theinclusion of new control parameters for the purpose of succes-sive approximation to the description of the actual piles is amatter of accumulation of experience of its application anddevelopment of experimental techniques required for theexpansion of parametric base.
Acknowledgements
The author is grateful to F.Karabaev and I.Kapyrin of greathelp in creating a computer program.
References
[1] Mineral Policy Center. Cyanide leach mining packet. Compiled August.<http://www.earthworksaction.org/files/publications/Cyanide_Leach_Packet.pdf>, 2000.
[2] D. McBride, M. Cross, J.E. Gebhardt, Heap leach modeling employingCFD technology: a ‘process’ heap model, Miner. Eng. 33 (6) (2012) 72–79.
[3] M.E. Mellado, L.A. Cisternas, An analytical–numerical method for solvinga heap leaching problem of one or more solid reactants from porous pellets,Comput. Chem. Eng. 32 (10) (2008) 2395–2402.
[4] M.E. Mellado, L.A. Cisternas, E.D. Galvez, An analytical model approachto heap leaching, Hydrometallurgy 95 (1–2) (2009) 33–38.
[5] M.E. Mellado, M.P. Casanova, L.A. Cisternas, E.D. Galvez, On scalableanalytical models for heap leaching, Comput. Chem. Eng. 35 (2) (2011)220–225.
[6] M.E. Mellado, E.D. Galvez, L.A. Cisternas, Stochastic analysis of heapleaching process via analytical models, Miner. Eng. 33 (6) (2012) 93–98.
[7] G.A. Padilla, J.Y. Cueto, L.A. Cisternas, On the optimization of heapleaching, Miner. Eng. 21 (9) (2008) 673–678.
[8] J.Y. Trujillo, L.A. Cisternas, E.D. Galvez, M.E. Mellado, Optimal designand planning of heap leaching process. Application to copper oxideleaching, Chem. Eng. Res. Des. 92 (2) (2014) 308–317.
[9] M.T. Van Genuchten, A closed-form equation for predicting the hydraulicconductivity of unsaturated soils, Soil Sci. Soc. Am. J. 44 (5) (1980)892–898.
Fig. 8. Kinetic curves of the original heap height of 6 m (a) and a three-tiered heap of the same volume. All parameters are identical Fig. 1.
Table 1Test conditions and results of model experiments. Experience 5 differs from theexperience 1 by way of lying of ore in a heap.
j l/m2*h Tdiff h Textr h MNaCN g L : S m3/t NaCN/Au
1 5 100 2480 2360 1.59 3202 15 100 581 1560 1.12 2103 5 500 1670 1460 1.07 1974 15 500 630 980 1.21 1265 5 100 1800 1745 1.15 234
Designations: j – flux density of irrigation in l/m2 * h; Tdiff – time diffusionexchange in hours; Textr – leaching time in hours; MNaCN – mass cyanideconsumed in grams; L: S – m3 amount of solutions used for 1 ton of ore;NaCN/Au – NaCN consumption in grams per 1 g Au.
9I.N. Groznov /Resource-Efficient Technologies 1 (2015) 3–9
Related Documents