Health Consultation Anniston PCB Air Sampling ANNISTON PCB SITE ANNISTON, CALHOUN COUNTY, ALABAMA EPA FACILITY ID: ALD000400123 FEBRUARY 4, 2015 U.S. DEPARTMENT OF HEALTH AND HUMAN SERVICES Agency for Toxic Substances and Disease Registry Division of Community Health Investigations Atlanta, Georgia 30333

Welcome message from author
This document is posted to help you gain knowledge. Please leave a comment to let me know what you think about it! Share it to your friends and learn new things together.
Transcript
Health Consultation
Anniston PCB Air Sampling
ANNISTON PCB SITE
ANNISTON CALHOUN COUNTY ALABAMA
EPA FACILITY ID ALD000400123
FEBRUARY 4 2015
US DEPARTMENT OF HEALTH AND HUMAN SERVICES
Agency for Toxic Substances and Disease Registry
Division of Community Health Investigations
Atlanta Georgia 30333
Health Consultation A Note of Explanation
A health consultation is a verbal or written response from ATSDR or ATSDRrsquos
Cooperative Agreement Partners to a specific request for information about health risks
related to a specific site a chemical release or the presence of hazardous material In
order to prevent or mitigate exposures a consultation may lead to specific actions such
as restricting use of or replacing water supplies intensifying environmental sampling
restricting site access or removing the contaminated material
In addition consultations may recommend additional public health actions such as
conducting health surveillance activities to evaluate exposure or trends in adverse health
outcomes conducting biological indicators of exposure studies to assess exposure and
providing health education for health care providers and community members This
concludes the health consultation process for this site unless additional information is
obtained by ATSDR or ATSDRrsquos Cooperative Agreement Partner which in the
Agencyrsquos opinion indicates a need to revise or append the conclusions previously issued
You May Contact ATSDR Toll Free at
1-800-CDC-INFO
or
Visit our Home Page at httpwwwatsdrcdcgov
HEALTH CONSULTATION
Anniston PCB Air Sampling
ANNISTON PCB SITE
ANNISTON CALHOUN COUNTY ALABAMA
EPA FACILITY ID ALD000400123
Prepared By
Public Health Service
Agency for Toxic Substances and Disease Registry (ATSDR)
Division of Community Health Investigations
Central Branch
Contents
Acronyms iv
Summary v
Statement of Issues 1
Background 1
Description of Sampling and Analysis 2
Meteorological Data 2
Sample Results and Screening 3
Discussion 5
Public Health Implications 6
Child Health Considerations 7
Conclusions and Recommendations 8
References 9
Prepared by 11
Figure 1 Locations of PCB Air Sampling Stations and Meteorological Station 3
Table 1 Results of June 25-27 2013 Anniston PCB Air Sampling (in ngm3) 4
Table 2 Comparison of June 2013 PCB Sampling to Other PCB Sampling Results 7
iii
Acronyms
ATSDR = Agency for Toxic Substances and Disease Registry
CREG = Cancer Risk Evaluation Guide
CV = Comparison Value
EPA = United States Environmental Protection Agency
ngm3
= nanograms per cubic meter of air
PCB = Polychlorinated Biphenyl
micro gcum = micrograms per cubic meter
iv
Summary
The Public Health Issues
The United States Environmental Protection Agency (EPA) Region IV requested that the Agency
for Toxic Substances and Disease Registry (ATSDR) evaluate air data collected at the perimeter
of a former polychlorinated biphenyl (PCB) manufacturing facility in Anniston Alabama on
June 25-27 2013 This health consultation evaluates the ambient air PCB data collected by the
EPA on those days In the past Anniston-area community members have posed questions and
voiced concerns regarding PCB levels in their air (ATSDR 2003)
Conclusion
On the basis of the data reviewed and if the sampling on June 25-27 2013 is representative of
typical conditions ATSDR concludes that concentrations of PCBs in air at the F I and J
sampling stations were low and are not expected to result in an increased cancer risk or other
harmful health effects in people living in the neighborhoods outside the perimeter of the former
PCB manufacturing facility
Basis of Conclusion
The estimated cancer risk based upon the maximum total PCBs detected in air on June 25-27 -6 -6 -4
2013 is 19 x 10 This estimated risk is within EPArsquos target risk range of 1 x 10 to 1 x 10
Overall the June 2013 PCB sample results represent an estimated insignificant to slight increase
in cancer risk
Limitations
The data set is limited to two 24-hour samples taken at each of the three sampling locations (plus
one duplicate) While of high quality these are not enough data to make a statistically-relevant
conclusion about the site unless they are taken together with previous datasets
Recommendations
ATSDR recommends that periodic seasonal air sampling is conducted for PCBs in residential
areas surrounding the Solutia Inc facility to better determine community exposures
For More Information
If you have concerns about your health you should contact your health care provider For
questions or comments related to this Public Health Consultation please call ATSDR at 1-800shy
CDC-INFO
v
Statement of Issues
The United States Environmental Protection Agency (EPA) Region IV requested that the Agency
for Toxic Substances and Disease Registry (ATSDR) evaluate environmental data collected June
25-27 2013 in Anniston Alabama This health consultation discusses the ambient air
polychlorinated biphenyl (PCB) data collected by the EPA on those days In the past Annistonshy
area community members posed questions and voiced concerns regarding PCB levels in their air
(ATSDR 2003)
Background
Between the early 1930s and the early 1970s polychlorinated biphenyls (PCBs) were
manufactured in Anniston AL (ATSDR 2006) The term PCB refers to any of the 209
configurations of organochlorides with one to ten chlorine atoms attached to a molecule
composed of two benzene rings (ldquobiphenylrdquo) PCBs were widely used as coolant fluids in
transformers capacitors and electric motors The Solutia facility in Anniston Alabama is one
of two facilities in the United States that manufactured PCBs (US EPA 2013a) The
manufacturing process included on-site burial of PCB-waste materials and consequent releases
of PCBs to the environment (ATSDR 2006) The Solutia Anniston plant (also called the
Anniston Polychlorinated Biphenyl (PCB) Site) is located about one mile west of downtown
Anniston and occupies 70 acres of land The site is bounded to the east and west by residential
properties to the south by US Highway 202 and north by the Norfolk Southern and Erie
railroads Manufacture of PCBs ceased in 1971 in Anniston (US EPA 2013a) The site has been
investigated by the US Environmental Protection Agency (EPA) the Alabama Department of
Public Health (ADPH) and the Alabama Department of Environmental Management (ADEM)
(US EPA 2013a) The Agency for Toxic Substances and Disease Registry (ATSDR) also
completed several assessments of site-related contamination in Anniston Alabama1
Because PCBs are often discussed in different ways three definitions of PCBs are provided here
Aroclor congener number and congener class (or homolog) A PCB Aroclor is a name given to
formerly commercial PCB products Aroclors were named according to the different percentages
of chlorine by weight that the PCB mixture contained For example Aroclor 1242 contained
approximately 42 percent chlorine by weight A PCB congener number refers to the specific
location(s) of the chlorine(s) on the biphenyl molecule From one to ten chlorines can be found
on a biphenyl structure For example PCB congener number 28 is a trichlorinated biphenyl with
chlorines attached at the 2 4 and 4 locations on the biphenyl carbons There are a total of 209
possible congener numbers Finally PCB congener numbers can be grouped into congener
classes (mono-through deca-) by number of chlorines and these are known as homologs For
1 ATSDRrsquos previous work in Anniston Alabama is available at
httpwwwatsdrcdcgovHACPHAHCPHAaspState=AL
1
example PCBs with congener numbers 4 through 15 each have two chlorine atoms these 12
congeners make up the dichlorobiphenyl congener or homolog class It should be noted that
individual Aroclors were made up of varying amounts of PCBs by congener class For example
Aroclor 1242 contained varying amounts of mono-through hexa-PCB congener classes (ATSDR
2000)
Description of Sampling and Analysis
EPA Region IV collected 24-hour air samples on two days in June 2013 at three locations
(Stations F2 I and J) on the Solutia Inc property boundaries Figure 1 displays the locations of
both the EPA air sampling stations and the meteorological station (see section below) Sampling
Station F is located north east of the site Station I is located southwest of the Solutia Inc site
and Station J is located north of the site Station F is located near a school Station I is located
near private residences and Station J is located on Solutia-owned property (US EPA 2013b) It
should be noted that these are the same station locations EPA used for sampling in October 2012
(ATSDR 2013)
The EPA collected 24-hour samples in accordance with EPA Method TO-4A and a contract
laboratory analyzed the samples using a gas chromatograph (GC) with an electron capture
detector (ECD) as described in EPA Method TO-4A (US EPA 2013b) Eight samples were
collected including those samples needed for quality assurance and quality control purposes
Duplicate samples were taken at Sampling Station J and a field blank was collected on the first
day Samples were analyzed for PCB congener numbers 1 through 209 and for PCBs by
congener class mono- through deca-PCBs
Meteorological Data
The EPA set up a temporary station to collect meteorological data for the two sampling periods
(see Figure 1) The first meteorological sampling period was from June 25 2013 910 am until
June 26 2013 1100 am The second meteorological sampling period was from June 26 2013
922 am until 1111 am on June 27 2013 It did not rain during the sampling period Wind
speed varied from 04 to 57 miles per hour with occasional gusts up to 13 miles per hour during
the first sampling period and from 35 to 81 miles per hour with occasional gusts up to 22 miles
per hour during the second sampling period During the first sampling period the wind direction
was variable and during the second sampling period the wind was primarily out of the southeast
(US EPA 2013b) It is worth noting the wind direction during the June 2013 sampling period
was different from the wind directions reported during previous sampling periods During
EPArsquos October 2012 sampling for PCBs in Anniston air the wind direction was from the east
and northeast while EPArsquos June 2000 sampling for PCBs in Anniston air the wind direction was
2 Sample Station F was also used in the EPArsquos June 2000 sampling of PCBrsquos in Anniston air The other two stations
were not
2
primarily from the southwest (ATSDR 2003) Similarly Hermanson et al notes the wind in
Anniston typically comes from the south southwest (Hermanson et al 2003) Therefore the
wind directions on June 25-27 2013 may not be typical of the Anniston area
Figure 1 Locations of PCB Air Sampling Stations and Meteorological Station
Anniston Alabama June 25-27 2013
Met Site = Location of temporary meteorological station
Source US EPA 2013b
Sample Results and Screening
The sample results are presented in Table 1 by total PCBs and PCB class Table 1 also shows
ATSDRrsquos comparison value for PCBs in air
Comparison Values (CVs) are chemical and media-specific concentrations in air soil and
drinking water that are used by ATSDR health assessors and others to identify environmental
contaminants at hazardous waste sites that require further evaluation CVs are conservative and
non-site specific CVs are based on health guidelines with uncertainty factors applied to ensure
that they are adequately protective of public health
3
Table 1 Results of June 25-27 2013 Anniston PCB Air Sampling (in ngm3)
Analyte Field Blank
ngm3
Station F
ngm3
Station I
ngm3
Station J
ngm3
Station J
Duplicate
ngm3
Station F
ngm3
Station I
ngm3
Station J
ngm3
Station J
Duplicate
ngm3
CV
ngm3
Sample Date 6252013 6252013 6252013 6252013 6252013 6262013 6262013 6262013 6262013 (CREG)
Monochlorobiphenyl
(Total) lt000025U 016 023 13 14 019 0022 18 19
Dichlorobiphenyl
(Total) 0026 073 25 36 37 13 034 54 55
Trichlorobiphenyl
(Total) 0017 097 36 46 46 17 047 69 71
Tetrachlorobiphenyl
(Total) 0017 071 13 27 24 097 038 36 30
Pentachlorobiphenyl
(Total) 001 03 02 064 064 035 0066 086 08
Hexachlorobiphenyl
(Total) 0012 012 0066 022 022 014 0035 0032 03
Heptachlorobiphenyl
(Total) 00012 0031 0013 0059 0058 0033 00085 0079 0077
Octachlorobiphenyl
(Total) lt000025 U 00062 00035 00077 00077 00069 00038 0015 0014
Nonachlorobiphenyl
(Total) lt000025 U 00014 lt00012 U 00032 00033 00018 00013 0003 00031
Total PCBs 0084 30 8 13 13 47 13 19 19 10
ngm3 = nanograms per cubic meter
CV = Comparison Value
CREG = Cancer Risk Evaluation Guide
U = The analyte was not detected at or above the reporting limit
Source US EPA 2013b
4
The comparison of environmental data with ATSDR CVs is one of the first steps in the public
health assessment process The results of this screening step give health assessors an
understanding of the priority contaminants at a site When a contaminant is detected at a
concentration less than its respective CVs exposure is not expected to result in health effects
and it is not considered further as part of the public health assessment process It should be noted
that contaminants detected at concentrations that exceed their respective CVs do not necessarily
represent a health threat Instead the results of the CV screening identify those contaminants that
warrant a more detailed site-specific evaluation to determine whether health effects may occur
CVs are not intended to be used as environmental clean-up levels
CVs can be based on either carcinogenic or non-carcinogenic effects but no ATSDR or EPA
CVs exist for the non-carcinogenic effects of PCBs in air Therefore Table 1 shows the Cancer
Risk Evaluation Guide (CREG) developed by ATSDR for PCBs in air Cancer Risk Evaluation
Guides (CREGs) are media-specific comparison values that are used to identify concentrations of
cancer-causing substances that are unlikely to result in a significant increase of cancer rates in an
exposed population ATSDR develops CREGs using EPArsquos cancer slope factor or inhalation unit
risk a target risk level (10-6
) and default exposure assumptions The inhalation unit risk is the
quantitative estimate in terms of risk per micro gcum air breathed Furthermore CREGs account for
a lifetime exposure (70 years) Only Station J on June 25-27 2013 had a total PCB concentration
above the CREG
At Station J there was good agreement between the sampling duplicates each day and between
the sampling days (See Table 1) Station F had the lowest average concentration of PCBs of the
three sampling stations which could be because it was not downwind of the site on either
sampling day Station F could also be located in an area of low PCB concentrations as it had the
lowest concentrations in 2012 as well Station I had the most variation between the sampling
days (see Table 1) but this could be explained by the variable wind direction on June 25 and the
wind direction out of the southeast on June 26 The average concentrations for Station I on both
days however were below the comparison value for PCBs in air
Low levels of PCBs were detected in the field blanks but the EPA considers this ldquotypical for air
samples analyzed by this methodologyrdquo (US EPA 2013b) Moreover the levels detected in the
field blanks are at least an order of magnitude below the levels detected in the samples
Discussion
In general airborne PCB levels in the US appear to be decreasing over time with higher levels
being detected in urban areas than in rural locations (ATSDR 2000) For example in June 1996
atmospheric concentrations of total PCBs measured in urban and rural locations in Baltimore
Maryland were 04-34 and 002-03 ngm3 respectively (ATSDR 2000 Offenberg and Baker
1999) Additionally several studies have indicated that indoor air concentrations of PCBs are
generally greater than outdoor concentrations (ATSDR 2000)
5
Public Health Implications
PCBs have been associated with several adverse noncancerous health effects in humans and
animals including liver thyroid dermal and ocular changes immunological alterations
neurodevelopmental changes reduced birth weight and reproductive effects Studies attempting
to show the same health effects in humans that have been observed in animals have generally
been inconclusive (ATSDR 2000 2003) Additionally most studies documenting the
noncancerous health effects of PCBs consider exposure to PCBs by ingestion rather than
inhalation Many studies also considered the noncancerous health effects from exposure to
commercially available mixtures of PCBs which typically are not the same as mixtures of PCBs
in the environment ATSDR has not derived a CV for noncancerous health effects for PCBs in
air due to lack of adequate data in humans and animals However it is worth noting the animal
studies available involve concentrations of PCBs in air of 9000-8600000 ngm3 levels far
above the concentrations shown in Table 1 (ATSDR 2000) Studies of workers exposed to PCBs
also typically involved concentrations much higher than those in Anniston (ATSDR 2000) and
the National Institute of Occupational Safety and Healthrsquos Recommended Exposure Limit3
for
workers is 1000 ngm3
(NIOSH 2007) The results from the June 2013 sampling are orders of
magnitude below this recommended limit for workers
As seen in Table 1 ATSDRrsquos CREG for PCBs in air was exceeded on June 25 and June 26
2013 at Station J Therefore ATSDR calculated an estimated cancer risk from breathing PCBs at
this location Estimated cancer risks are calculated by multiplying the concentration of a
substance in air by that substancersquos inhalation unit risk (ATSDR 2005) EPArsquos inhalation unit -4 -7
risk for PCBs is 1 x 10 per microgram per cubic meter or 1 x 10 per nanogram per cubic
meter based on liver tumors in rats exposed to PCBs (US EPA 1997) Therefore the estimated -6 -7 3
cancer risk for Station J based upon the June 25 2013 sample result is 13 x 10 (1 x 10 ngm
x 13 ngm3
= 13 x 10-6
) The estimated cancer risk for Station J based upon the June 26 2013 -6 -7 3 3 -6
sample result is 19 x 10 (1 x 10 ngm x 19 ngm = 19 x 10 )
It should be noted that sampling results taken over a longer period of time would better represent
long-term cancer risk exposure Short-term exposure to carcinogens is an area of considerable
debate and research however it is generally believed that any exposure factors that are less than
what was used for the calculations will significantly decrease the calculated risk (eg exposed
for a shorter time period exposed to lower concentrations exposed less frequently during the
time period etc) Nevertheless the estimated cancer risk based upon the maximum total PCB -6 -4
concentration falls within EPArsquos target range of 1 x 10 to 1 x 10
A key limitation of the data reviewed for this consultation is that it only involved two days of
sampling in June 2013 and two of the sampling stations (Stations F and I) would not have been
downwind of the site on either day ATSDRrsquos previous health consultation of PCBs in Anniston
air noted the general trend of PCB concentrations as being higher in the spring and summer
3 The Recommended Exposure Limit is for a 10 hour time weighted average exposure
6
months than in the winter and fall months (ATSDR 2003) However this trend is not seen at all
Anniston locations (ATSDR 2003 Hermanson et al 2003) PCB concentrations in October
2012 were lower than PCB concentrations in June 2013 for Stations F and J but not for Station I
(ATSDR 2013 US EPA 2013b) Additionally the results of the June 2013 sampling can be
compared to earlier results of PCB air sampling in Anniston as well as the results of PCB air
sampling in other areas of the country Table 2 shows these comparisons
Table 2 Comparison of June 2013 PCB Sampling to Other PCB Sampling Results
Sample Location Date Range of Total PCB Concentrations
(ngm3)
Anniston AL EPA samples Station F June 2013 30-47
Anniston AL EPA samples Station I June 2013 13-80
Anniston AL EPA samples Station J June 2013 13-19
Anniston AL EPA samples Station F Oct 2012 17-18
Anniston AL EPA samples Station I Oct 2012 88-25
Anniston AL EPA samples Station J Oct 2012 73-82
Anniston AL EPA samples June 2000 02 -162
Anniston AL Mars Hill Station 1997-1998 87-82
Anniston AL Carter Street Station 1997-1998 11-39
Hudson Falls and Fort Edward NY 2000-2002 010-40
Glen Falls NY 2000-2002 008-24
Baltimore MD urban area 1996 04-34
Baltimore MD rural area 1996 002-03
New Brunswick NJ urban area 1997 01-32
half of analytical quantitation limit
ngm3
= nanograms per cubic meter
Sources ATSDR 2000 2003 Brunciak et al 1999 Hermanson et al 2003 Palmer et al 2008 Offenberg and
Baker 1999 US EPA 2013a 2013b
As shown in Table 2 the results of the June 2013 PCB sampling are consistent with the PCB
levels previously seen in Anniston The sampling results from Station F for both days and Station
I on day 2 (see Table 1) are similar to other urban areas in the country The sample results from
Stations I (on day 1) and J on both days are higher than other urban areas but not higher than
some of the previous sample results from the Anniston area
Child Health Considerations
In communities faced with air water or food contamination the many physical differences
between children and adults demand special emphasis Children could be at greater risk than
adults from certain kinds of exposure to hazardous substances Children play outdoors and
sometimes engage in hand-to-mouth behaviors that increase their exposure potential Children
are shorter than adults this means they breathe dust soil and vapors closer to the ground A
childrsquos lower body weight and higher intake rate results in a greater dose of hazardous substance
per unit of body weight If toxic exposure levels are high enough during critical growth stages
the developing body systems of children can sustain permanent damage Finally children are
dependent on adults for access to housing for access to medical care and for risk identification
7
Thus adults need as much information as possible to make informed decisions regarding their
childrenrsquos health
Several studies have reported that low-level PCB exposure during fetal or neonatal development
can affect the infants neurobehavioral development (Jacobson et al 1990 Rogan and Gladden
1996) However several limitations of these studies have been noted (1) possible exposure to
other neurotoxic chemicals besides PCBs (eg dioxins mercury lead or organochlorine
pesticides) that may have contributed to the effects (2) inadequate control for confounding
socioeconomic variables such as maternal smoking alcohol and other drug use and (3)
inadequate control for maternal birth weight and nonspontaneous deliveries (Schantz 1997
Segal 1996) In addition to these methodological limitations different studies have measured
different neurobehavioral endpoints thus impeding comparisons between studies
Therefore these studies suggest but do not conclusively prove an association between prenatal
or neonatal exposures to PCBs and neurobehavioral and developmental effects in young
children Furthermore these studies involved exposures to PCBs primarily through ingestion
rather than inhalation It also should be noted that ATSDR CREGs (Cancer Risk Evaluation
Guides) apply to lifetime exposures so no childhood-specific CREGs exist
Conclusions and Recommendations
Conclusions
On the basis of the data reviewed and if the sampling on June 25 and June 26 2013 were
representative of typical conditions ATSDR concludes that concentrations of PCBs in air at the
F I and J sampling stations were low and are not expected to result in an increased cancer risk
or other harmful health effects in people living in the neighborhoods outside the perimeter of the
former PCB manufacturing facility
Recommendations
ATSDR recommends that periodic seasonal air sampling is conducted for PCBs in residential
areas surrounding the Solutia Inc facility to better determine community exposures
Public Health Action Plan
ATSDR will continue to evaluate PCB ambient air data from Anniston Alabama as needed
8
References
Agency for Toxic Substances and Disease Registry (ATSDR) 2000 Toxicological profile for
polychlorinated biphenyls (PCBs) Atlanta US Department of Health and Human Services Nov
Available online at httpwwwatsdrcdcgovToxProfilestpaspid=142amptid=26
Agency for Toxic Substances and Disease Registry (ATSDR) 2003 Anniston PCB Air
Sampling Anniston PCB Site (Monsanto Company) Anniston Calhoun County Alabama EPA
Facility ID ALD000400123 Atlanta US Department of Health and Human Services
December Available online at
httpwwwatsdrcdcgovHACphaAnnistonPCBSiteAnnistonPCBSiteHC12182003pdf
Agency for Toxic Substances and Disease Registry (ATSDR) 2005 Public health assessment
guidance manual Atlanta US Department of Health and Human Services Available online at
httpwwwatsdrcdcgovHACPHAManualtochtml
Agency for Toxic Substances and Disease Registry (ATSDR) 2006 Updated Assessment of
PCB Exposures in AnnistonAL Anniston PCB Site Anniston Calhoun County Alabama EPA
Facility ID ALD00409048 Atlanta US Department of Health and Human Services October
Available online at
httpwwwatsdrcdcgovHACphaAnnistonPCBSiteHC101606AnnistonPCBSiteHC101606p
df
Agency for Toxic Substances and Disease Registry (ATSDR) 2013 Anniston PCB Air
Sampling Anniston PCB Site (Monsanto Company) Anniston Calhoun County Alabama EPA
Facility ID ALD000400123 Atlanta US Department of Health and Human Services
September Available online at
httpwwwatsdrcdcgovHACphaAnnistonPCBSiteAirSamplingAnnistonPCBSiteAirSamplin
gHC09302013_508pdf
Brunciak PA Lavorgna CL Nelson ED et al 1999 Trends and dynamics of persistent organic
pollutants in the coastal atmosphere of the mid-Atlantic states Prepr Ext Abst Div Environ
Chem Am Chem Soc 39(1)64-67
Hermanson MH Scholten CA Compher K 2003 Variable Air Temperature Response of Gas-
Phase Atmospheric Polychlorinated Biphenyls near a Former Manufacturing Facility
Environmental Science and Technology 37(18) 4038-4042
Jacobson JL Jacobson SW Humphrey HEB1990 Effects of in utero exposure to
polychlorinated biphenyls and related contaminants on cognitive function in young children
Journal of Pediatrics 11638-45
9
National Institute of Occupational Safety and Health (NIOSH) 2007 NIOSH Pocket Guide to
Chemical Hazards US Department of Health and Human Services Publication No 2005-149
September Available online at httpwwwcdcgovnioshdocs2005-149pdfs2005-149pdf
Offenberg JH Baker JE 1999 Influence of Baltimores urban atmosphere on organic
contaminants over the northern Chesapeake Bay J Air Waste Manage Assoc 49959-965
Palmer PM Belanger EE Wilson LR Hwang SA Narang RS Gomez MI et al 2008 Outdoor
Air PCB Concentrations in Three Communities Along the Upper Hudson River New York
Archives of Environmental Contamination and Toxicology 54363-371
Rogan WJ Gladen BC 1996 Study of human lactation for effects of environmental
contaminants the North Carolina breast milk and formula project and some other ideas
Environmental Health Perspectives 60 215-221
Schantz SL 1997 Developmental neurotoxicity of PCBs in humans What do we know and
where do we go from here Neurotoxicology and Teratology 18 339-362
Segal RF 1996 Epidemiological and laboratory evidence of PCB-induced neurotoxicity Critical
Reviews in Toxicology 26 709-737
US Environmental Protection Agency (US EPA) 1997 Toxicological Review of
Polychlorinated Biphenyls (PCBs) (CASRN 1336-36-3) in support of summary information on
the Integrated Risk Information System (IRIS) Washington DC
httpwwwepagovirissubst0294htm
US Environmental Protection Agency (US EPA) 2013a Anniston PCB Air Study Anniston
Calhoun County Alabama October 23-25 2012 EPA Region 4 Science and Ecosystem Support
DivisionReport Date March 2013
US Environmental Protection Agency (US EPA) 2013b Anniston PCB Air Study Anniston
Calhoun County Alabama June 25-27 2013 EPA Region 4 Science and Ecosystem Support
Division Report Date October 2013
10
Prepared by
Timothy R Pettifor
Environmental Health Scientist
Central Branch
Division of Community Health Investigations
Deborah Burgin PhD
Toxicologist
Office of the Director
Division of Community Health Investigations
11
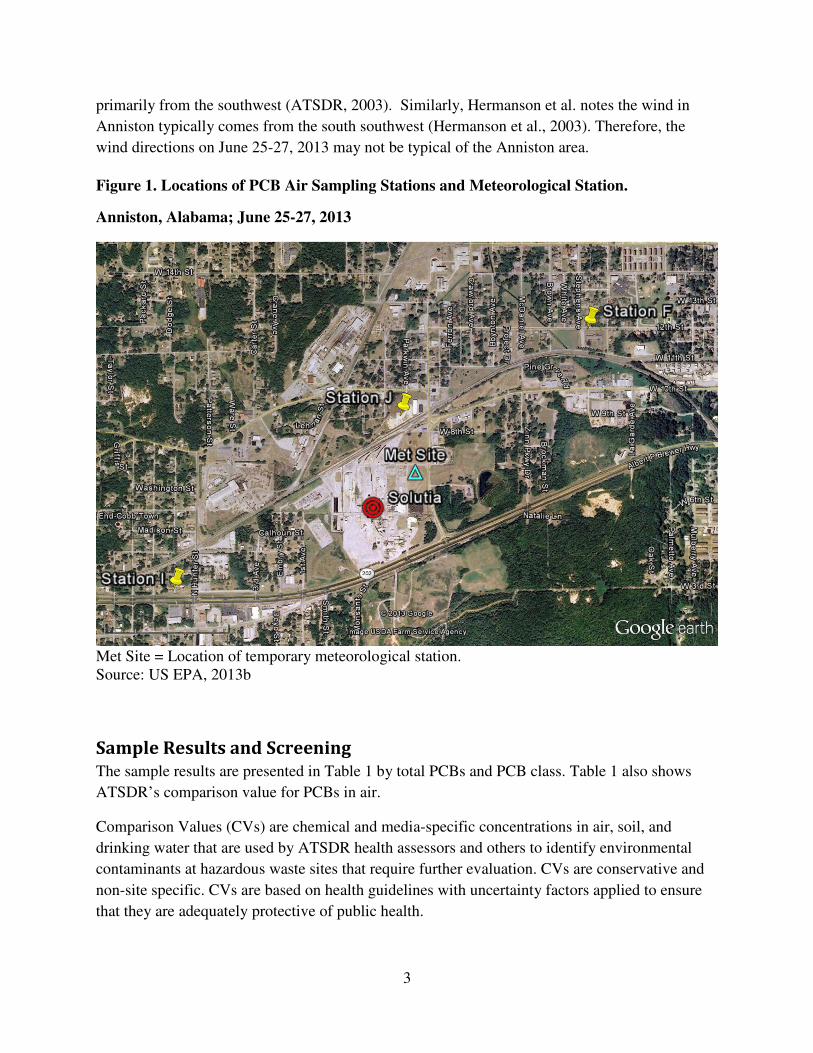
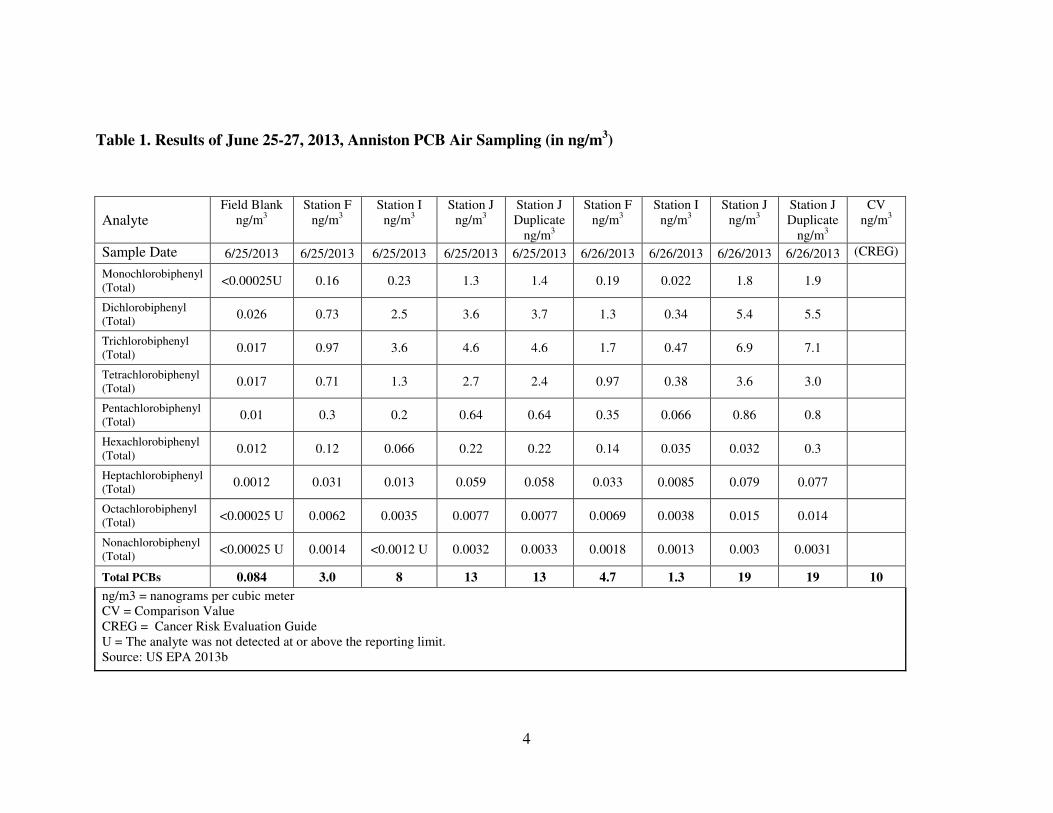
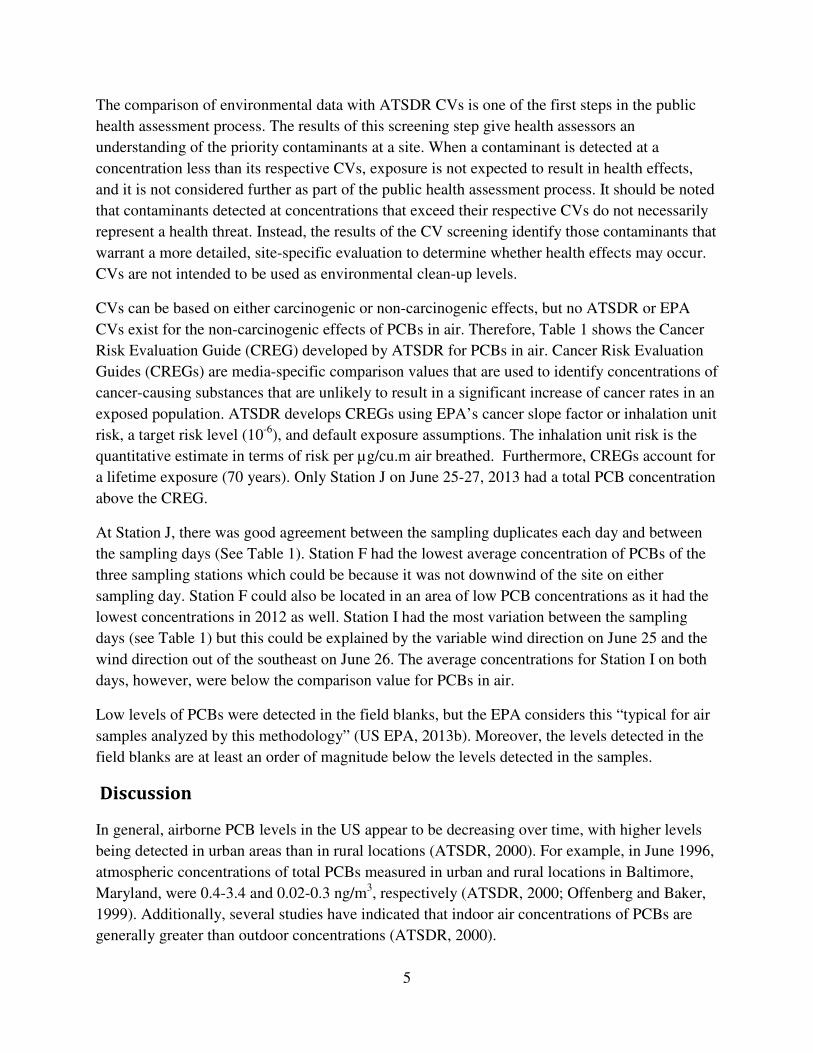
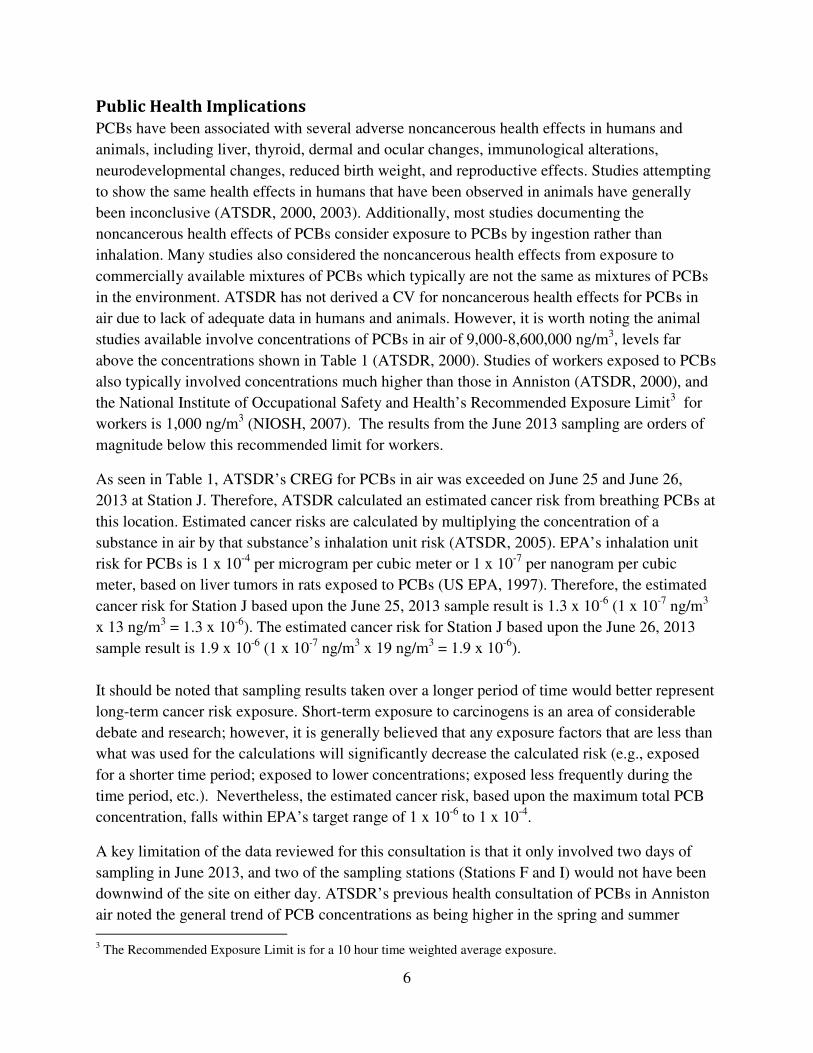
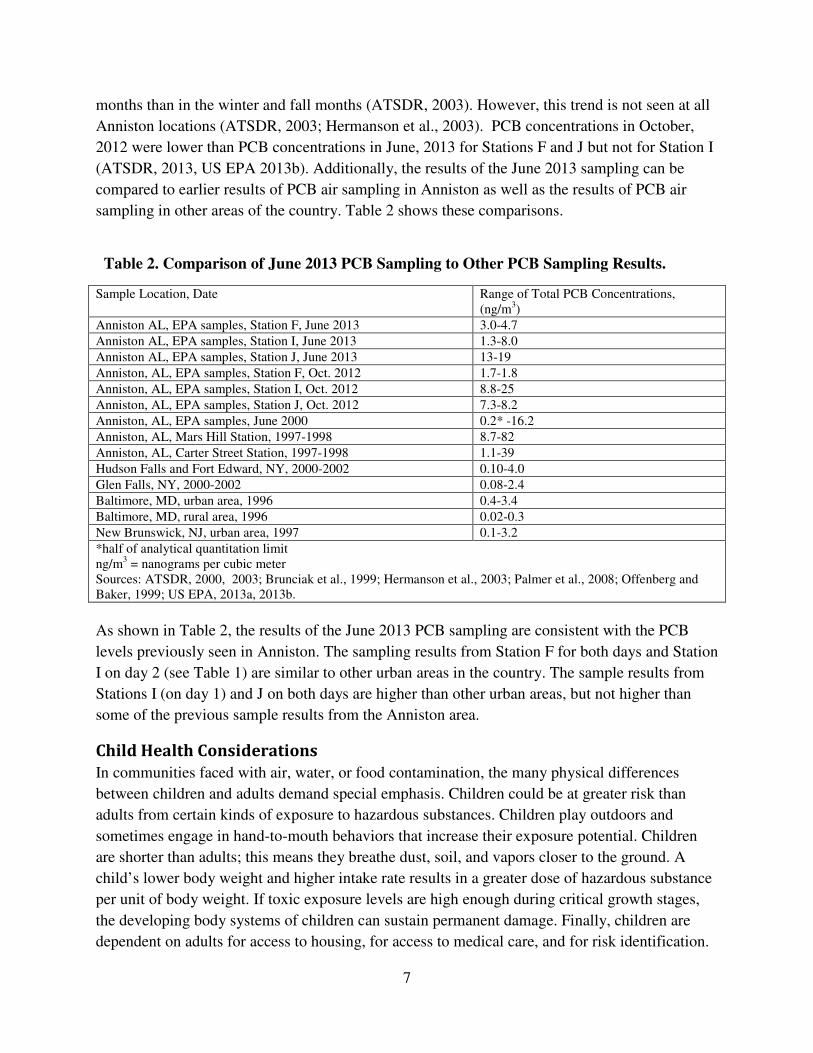
Prepared by
Timothy R Pettifor
Environmental Health Scientist
Central Branch
Division of Community Health Investigations
Deborah Burgin PhD
Toxicologist
Office of the Director
Division of Community Health Investigations
11
Related Documents