Growth performance and feed utilization of Nile tilapia Oreochromis niloticus (Linnaeus, 1758) and tilapia galilae Sarotherodon galilaeus (Linnaeus, 1758) fingerlings fed plant protein-based diets Asraf Mohamed A-S Goda 1 , M E Wafa 1 , E R El-Haroun 2,3 & M A Kabir Chowdhury 2,4 1 Fish Nutrition Research Laboratory, National Institute of Oceanography and Fisheries (NIOF), Cairo, Egypt 2 Animal Production Department, Faculty of Agriculture, Cairo University, Cairo, Egypt 3 Fish Nutrition Research Laboratory, Animal and Poultry Science, OntarioAgriculture College, Guelph University, Guelph, Ontario, Canada 4 World Fish Center, Batu Maung, Bayan Lepas, Penang, Malaysia Correspondence: A M A-S Goda, 28 Niseem Asaad Street-Medan El-Afdal-Shobra, Cairo, Egypt. E-mail: [email protected] Abstract This study was designed to determine the e¡ect of complete substitution of ¢sh meal (FM) by three plant protein sources including extruded soybean meal (SBM), extruded full-fat soybean (FFSB) and corn gluten meal (CGM) on growth and feed utilization of Nile tilapia Oreochromis niloticus and tilapia galilae Sarothrodon galilaeus. Four isonitrogenous of crude protein (ca. 28.0%) and isocaloric (ca.19 MJ kg 1 ) ex- perimental diets were formulated. The control diet (diet 1) was prepared with FM as the main protein sources. Diets 2^4, each FM control diet, were com- pletely substituted with SBM (diet 2), FFSB (diet 3) and CGM (diet 4). L-lysine and DL-methionine were added to plant protein diets to cover the nutritional requirements of tilapia. Each treatment was allocated to three net pens and fed for 17 weeks. Nile tilapia fed the control diet showed signi¢cantly higher ( P 0.05) values for ¢nal body weight (FBW), feed intake (FI), weight gain (WG) and speci¢c growth rate (SGR), whereas ¢sh fed the diet with CGM achieved the lowest values. Tilapia galilae fed SBM diet recorded the highest ( P 0.05) values for growth performance. Better feed conversion ratio (FCR) for both Oreochromis niloticus and Sarothrodon galilaeus was observed when ¢sh were fed SBM diet, whereas the worse FCR was recorded for FFSB diet. Feed utilization parameters including protein pro- ductive value (PPV), fat retention (FR) and energy retention (ER) showed signi¢cant di¡erences ( P 0.05) for both the species fed di¡erent dietary protein sources. The present results suggest that, for Nile tilapia, both SBM and FFSB supplemented with DL-methionine and L-lysine can completely replace dietary FM. Meanwhile, S. galilaeus fed SBM diet ex- hibited comparable growth and feed utilization with those ¢sh fed a ¢sh-meal-based diet. Keywords: corn gluten meal, ¢sh meal, full-fat soybean, soybean meal, Nile tilapia, tilapia galilae Introduction Recently, ¢sh meal (FM) has become the most expen- sive protein ingredients in aquaculture feeds. Many developing countries have realized that, in the long run, they will be unable to a¡ord FM as a major pro- tein source in aquafeeds. Currently, one of the chal- lenges that ¢sh nutritionists face is to partially or totally replace FM with less expensive, untraditional animal and/or plant protein sources. Many studies have shown considerable success in partially repla- cing FM with soybean meal (SBM) and other soybean products in diets for various ¢sh species (Davis, Jirsa & Arnold 1995; Olli, Krogdahl & Vabeno 1995; Boo- nyaratpalin, Suraneiranat & Tunpibal 1998; Quartar- aro, Allan & Bell1998; Arndt, Hardy, Sugiura & Dong 1999; Herna Ł ndez, Mart|¤nez, Jover & Garc|¤a Garc|¤a Aquaculture Research, 2007, 38, 827^837 doi: 10.1111/j.1365-2109.2007.01731.x r 2007 The Authors Journal Compilation r 2007 Blackwell Publishing Ltd 827

Welcome message from author
This document is posted to help you gain knowledge. Please leave a comment to let me know what you think about it! Share it to your friends and learn new things together.
Transcript
Growth performance and feed utilization of Nile tilapia
Oreochromis niloticus (Linnaeus, 1758) and tilapia
galilae Sarotherodon galilaeus (Linnaeus, 1758)
fingerlings fed plant protein-based diets
Asraf Mohamed A-S Goda1, M E Wafa1, E R El-Haroun2,3 & M A Kabir Chowdhury2,4
1Fish Nutrition Research Laboratory, National Institute of Oceanography and Fisheries (NIOF), Cairo, Egypt2Animal Production Department, Faculty of Agriculture, Cairo University, Cairo, Egypt3Fish Nutrition Research Laboratory, Animal and Poultry Science, OntarioAgriculture College, Guelph University, Guelph,
Ontario, Canada4World Fish Center, Batu Maung, Bayan Lepas, Penang, Malaysia
Correspondence: A M A-S Goda, 28 Niseem Asaad Street-Medan El-Afdal-Shobra, Cairo, Egypt. E-mail: [email protected]
Abstract
This study was designed to determine the e¡ect ofcomplete substitutionof ¢shmeal (FM) by three plantprotein sources including extruded soybean meal(SBM), extruded full-fat soybean (FFSB) and corngluten meal (CGM) on growth and feed utilization ofNile tilapia Oreochromis niloticus and tilapia galilaeSarothrodon galilaeus. Four isonitrogenous of crudeprotein (ca.28.0%) and isocaloric (ca.19MJ kg�1) ex-perimental diets were formulated. The control diet(diet 1) was prepared with FM as the main proteinsources. Diets 2^4, each FM control diet, were com-pletely substituted with SBM (diet 2), FFSB (diet 3)and CGM (diet 4). L-lysine and DL-methionine wereadded to plant protein diets to cover the nutritionalrequirements of tilapia. Each treatment was allocatedto three net pens and fed for 17 weeks. Nile tilapiafed the control diet showed signi¢cantly higher(P � 0.05) values for ¢nal body weight (FBW), feedintake (FI), weight gain (WG) and speci¢c growthrate (SGR), whereas ¢sh fed the diet with CGMachieved the lowest values. Tilapia galilae fed SBMdiet recorded the highest (P � 0.05) values forgrowth performance. Better feed conversion ratio(FCR) for both Oreochromis niloticus and Sarothrodongalilaeus was observed when ¢sh were fed SBM diet,whereas the worse FCR was recorded for FFSB diet.Feed utilization parameters including protein pro-ductive value (PPV), fat retention (FR) and energy
retention (ER) showed signi¢cant di¡erences(P � 0.05) for both the species fed di¡erent dietaryprotein sources. The present results suggest that, forNile tilapia, both SBM and FFSB supplemented withDL-methionine and L-lysine can completely replacedietary FM. Meanwhile, S. galilaeus fed SBM diet ex-hibited comparable growth and feed utilization withthose ¢sh fed a ¢sh-meal-based diet.
Keywords: corn gluten meal, ¢sh meal, full-fatsoybean, soybean meal, Nile tilapia, tilapia galilae
Introduction
Recently, ¢sh meal (FM) has become the most expen-sive protein ingredients in aquaculture feeds. Manydeveloping countries have realized that, in the longrun, they will be unable to a¡ord FM as a major pro-tein source in aquafeeds. Currently, one of the chal-lenges that ¢sh nutritionists face is to partially ortotally replace FM with less expensive, untraditionalanimal and/or plant protein sources. Many studieshave shown considerable success in partially repla-cing FMwith soybeanmeal (SBM) and other soybeanproducts in diets for various ¢sh species (Davis, Jirsa& Arnold 1995; Olli, Krogdahl & Vabeno 1995; Boo-nyaratpalin, Suraneiranat & Tunpibal1998; Quartar-aro, Allan & Bell1998; Arndt, Hardy, Sugiura & Dong1999; HernaŁ ndez, Mart|¤ nez, Jover & Garc|¤ a Garc|¤ a
Aquaculture Research, 2007, 38, 827^837 doi:10.1111/j.1365-2109.2007.01731.x
r 2007 TheAuthorsJournal Compilationr 2007 Blackwell Publishing Ltd 827
2007). Other studies showed that higher inclusion le-vels of solvent-extracted soybeanand full-fat soybean(FFSB) meals reduce growth performance and feedutilization (Riche,Trottier, Ku & Garling 2001; Riche& Garling Jr 2004). Meanwhile, some authors re-ported that total replacement is possible (Shiau,Kwok, Hwang, Chen, & Lee 1989; El-Saidy & Gaber1997, 2002; Muzinic, Thompson, Metts, Dasgupta &Webster 2006; Goda, El-Haroun & Chowdhury2007). These con£icting results may attribute to thevariation of environmental culture conditions (e.g.controlled laboratory conditions vs. pond cultureconditions), water quality (e.g. green water ponds vs.clear water in glass aquaria or ¢breglass tanks), sali-nity and feed processing (pelleted vs. extruded) (Ta-con, 1996; Mendoza, De Dios,Vazquez, Cruz, Ricque,Aguilera & Montemayor 2001; Chowdhury,Yi, Lin &El-Haroun 2006; Amaya, Davis & Rouse 2007).Egyptian aquaculture has developed rapidly in re-
cent years. Tilapia is one of the most widely culturedspecies in Egypt. The total aquaculture production oftilapia increased from 24916metric tonnes in 1990to 486000metric tonnes year�1 (General Authorityfor Fish Resources Development 2006) and ac-counted for 55% of the total production (876000me-tric tonnes year�1). In Egypt, a growing number offarmers are adopting intensive culture technology,increasing the demand for high-quality tilapia feed.At present, the high-quality commercial tilapia feedsalmost entirely depend on FM as their major proteinsource. This dependency has been driving the feedprice unreachable to small farmers as the interna-tional market price of FM has almost doubled in thepast few years. A priorityarea of research in aquacul-ture nutrition is the reduction and possible elimina-tion of FM and ¢sh oil from practical diets (Craig2004). Tilapia species are mainly herbivores and om-nivores and can satisfy up to 50% of their amino acidrequirement from natural food if available in inten-sive farming system (Chowdhury et al. 2006;Chowdhury, Bose, Bureau &Dey (in press)). Samocha,Davis, Saoud and De Bault (2004) reported thatthe use of plant protein ingredient in tilapiadiets helps the nutritionists to reduce the cost of ¢shproduction.Among the plant protein sources considered in
aquaculture diets, SBM is the most widely used in-gredient. It has been preferentially used for replace-ment of FM due to its high-protein content, relativelywell-balanced amino acid pro¢le, reasonable priceand steady supply (Storebakken, Shearer & Roem2000). Another soybean product commonly referred
to as FFSB is produced by the heat treatment of wholesoybeans. This product has a crude protein content ofapproximately 38% (as-fed basis) and a lipid content ofapproximately 18%, providing high levels of linoleicand linolenic acids (Lim & Akiyama 1992). Corngluten meal (CGM), the product that remains afterthe extraction of starch from corn, is anothercommercially available plant-based product. Besidesits high-protein content, CGM is low in ¢bre, has noantinutritional factors and an adequate indispensableamino acid pro¢le except for its content for arginineand lysine (Amerio, Vignali, Castelli, Fiorentini &Tibaldi1998).In Egypt, the most economically important species
of tilapia are Oreochromis niloticus, O. aureus and Sar-othrodon galilaeus (FAO 2004). The choice of speciesfor culture depends mainly on fry and ¢ngerlingavailability, growth rate and environmental toler-ance. Nile tilapia has the highest growth rate underwarm water temperature. Tilapia O. aureus growsnearly as fast as O. niloticus, whereas S. galilaeusgrows at the slowest rate underwarmwater tempera-ture and especially under Egyptian production con-ditions, but this species with O. aureus has thegreatest cold tolerance (Rakocy 1989). Under Egyp-tian production conditions, relatively little researchhas been focused on dietary requirements of S. gali-laeus due to the slow growth rate and uneconomicculture of this strain using diet with FM comparedwith the O. niloticus or O. aureus.This study was designed to investigate the e¡ect of
complete substitution of dietary FM with three plantprotein sources (SBM, FFSB and CGM) on growthperformance and feed utilization of Nile tilapia O. ni-loticus and tilapia galilae S. galilaeus ¢ngerlings.
Materials and methods
Experimental ¢sh and culture techniques
The experiment was conducted at the ExperimentalFish Farm at El-Kanater El-Khayria, National Insti-tute of Oceanography and Fisheries (NIOF), DeltaBarrage, Kalubiya Governorate, Egypt. Nile tilapia O.niloticus and tilapia galilae S. galilaeus were obtainedfrom El-Kanater El-Khayria, Fish Research StationFarm (¢ngerlings size were production by naturalspawning of these ¢sh farm breeders stock) andstocked into four (42m3) cement ponds (two pondsfor each tilapia species). Each cement pond wasdivided into six equal parts by nettings (7m3 each)and stocked with 70 ¢sh (stocking density
Plant protein-based diets for tilapia ¢ngerlings AMA-S Goda et al. Aquaculture Research, 2007, 38, 827^837
r 2007 TheAuthors828 Journal Compilationr 2007 Blackwell Publishing Ltd, Aquaculture Research, 38, 827^837
10 ¢shm�3). The average initial body weight was32.3 � 1.1and 31.2 � 1.8 g for O. niloticus and S. gali-laeus, respectively. The ¢sh from each tilapia specieswere divided into 12 groups with three replicates ineach diet. Fish were acclimatized to experimentalconditions for 2 weeks before the start of the experi-ment. Fish were fed a commercial tilapia diet (Zoo-Control Company, 6 October City, Cairo, Egypt)during this period. The actual experimental periodextended for 17 weeks (119 days). Concrete net penswere supplied with freshwater from the Darawa Irri-gation Baranch of Kalubiya Governorate, Egypt, witha turnover rate of 0.3m3 day�1pond�1, and ¢shwereheldunder natural light conditions (12:12 h light:darkschedule). From each experimental treatment, ¢shwere weighed collectively every 2 weeks, and theamount of daily diet was adjusted accordingly. How-ever, at the beginning of the experiment,10 ¢sh fromeach species were anaesthetized with t-amyl alcohol,sacri¢ced and used for assessment of the initialproximate body composition. In addition, at theend of the experimental trial, six ¢sh from eachexperimental treatments of both tilapia speciesgroup were used to assess the ¢nal proximate bodycomposition.
Experimental diets
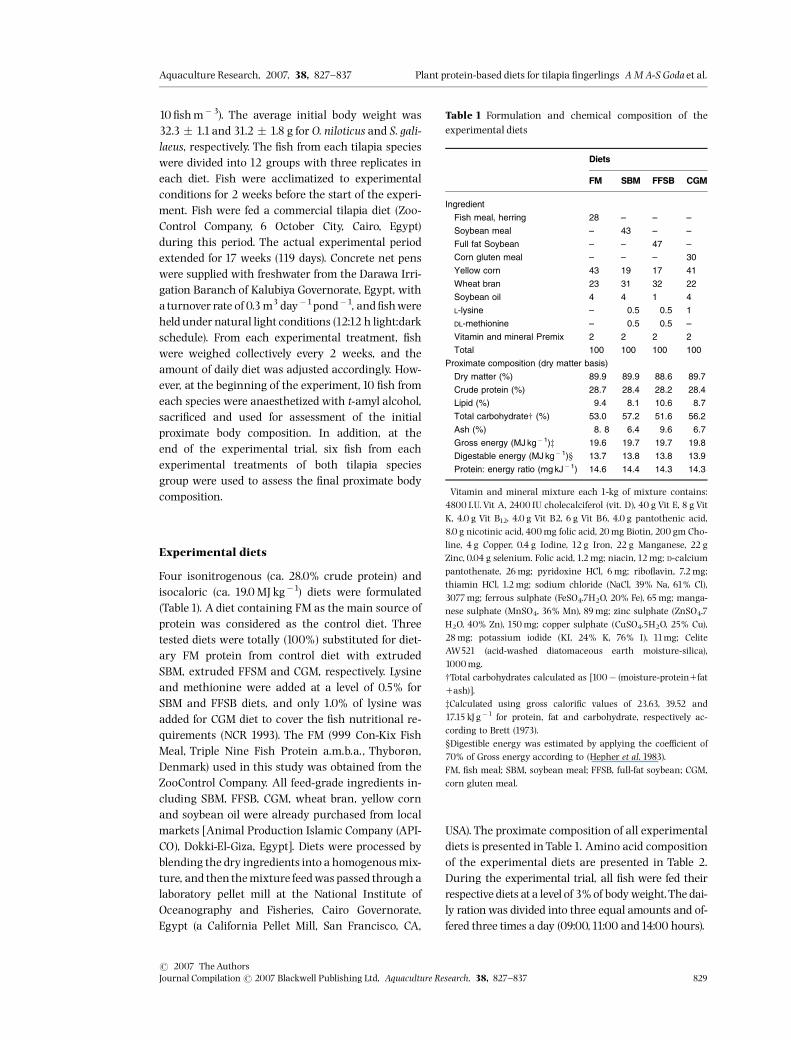
Four isonitrogenous (ca. 28.0% crude protein) andisocaloric (ca. 19.0MJ kg�1) diets were formulated(Table1). A diet containing FM as the main source ofprotein was considered as the control diet. Threetested diets were totally (100%) substituted for diet-ary FM protein from control diet with extrudedSBM, extruded FFSM and CGM, respectively. Lysineand methionine were added at a level of 0.5% forSBM and FFSB diets, and only 1.0% of lysine wasadded for CGM diet to cover the ¢sh nutritional re-quirements (NCR 1993). The FM (999 Con-Kix FishMeal, Triple Nine Fish Protein a.m.b.a., Thybor�n,Denmark) used in this study was obtained from theZooControl Company. All feed-grade ingredients in-cluding SBM, FFSB, CGM, wheat bran, yellow cornand soybean oil were already purchased from localmarkets [Animal Production Islamic Company (API-CO), Dokki-El-Giza, Egypt]. Diets were processed byblending the dry ingredients into a homogenousmix-ture, and then themixture feedwas passed throughalaboratory pellet mill at the National Institute ofOceanography and Fisheries, Cairo Governorate,Egypt (a California Pellet Mill, San Francisco, CA,
USA). The proximate composition of all experimentaldiets is presented inTable1. Amino acid compositionof the experimental diets are presented in Table 2.During the experimental trial, all ¢sh were fed theirrespective diets at a level of 3% of bodyweight.The dai-ly rationwas divided into three equal amounts and of-fered three times a day (09:00,11:00 and14:00 hours).
Table 1 Formulation and chemical composition of theexperimental diets
Diets
FM SBM FFSB CGM
Ingredient
Fish meal, herring 28 – – –
Soybean meal – 43 – –
Full fat Soybean – – 47 –
Corn gluten meal – – – 30
Yellow corn 43 19 17 41
Wheat bran 23 31 32 22
Soybean oil 4 4 1 4
L-lysine – 0.5 0.5 1
DL-methionine – 0.5 0.5 –
Vitamin and mineral Premix� 2 2 2 2
Total 100 100 100 100
Proximate composition (dry matter basis)
Dry matter (%) 89.9 89.9 88.6 89.7
Crude protein (%) 28.7 28.4 28.2 28.4
Lipid (%) 9.4 8.1 10.6 8.7
Total carbohydratew (%) 53.0 57.2 51.6 56.2
Ash (%) 8. 8 6.4 9.6 6.7
Gross energy (MJ kg� 1)z 19.6 19.7 19.7 19.8
Digestable energy (MJ kg� 1)‰ 13.7 13.8 13.8 13.9
Protein: energy ratio (mg kJ�1) 14.6 14.4 14.3 14.3
�Vitamin and mineral mixture each 1-kg of mixture contains:4800 I.U. Vit A, 2400 IU cholecalciferol (vit. D), 40 g Vit E, 8 g VitK, 4.0 g Vit B12, 4.0 g Vit B2, 6 g Vit B6, 4.0 g pantothenic acid,8.0 g nicotinic acid, 400mg folic acid, 20mg Biotin, 200 gm Cho-line, 4 g Copper, 0.4 g Iodine, 12 g Iron, 22 g Manganese, 22 gZinc, 0.04 g selenium. Folic acid, 1.2mg; niacin,12mg; D-calciumpantothenate, 26mg; pyridoxine HCl, 6mg; ribo£avin, 7.2mg;thiamin HCl, 1.2mg; sodium chloride (NaCl, 39% Na, 61% Cl),3077mg; ferrous sulphate (FeSO4.7H2O, 20% Fe), 65mg; manga-nese sulphate (MnSO4, 36% Mn), 89mg; zinc sulphate (ZnSO4.7H2O, 40% Zn), 150mg; copper sulphate (CuSO4.5H2O, 25% Cu),28mg; potassium iodide (KI, 24% K, 76% I), 11mg; CeliteAW521 (acid-washed diatomaceous earth moisture-silica),1000mg.wTotal carbohydrates calculated as [100� (moisture-protein1fat1ash)].zCalculated using gross calori¢c values of 23.63, 39.52 and17.15 kJg�1 for protein, fat and carbohydrate, respectively ac-cording to Brett (1973).‰Digestible energy was estimated by applying the coe⁄cient of70% of Gross energy according to (Hepher et al. 1983).FM, ¢sh meal; SBM, soybean meal; FFSB, full-fat soybean; CGM,corn gluten meal.
Aquaculture Research, 2007, 38, 827^837 Plant protein-based diets for tilapia ¢ngerlings AMA-S Goda et al.
r 2007 TheAuthorsJournal Compilationr 2007 Blackwell Publishing Ltd, Aquaculture Research, 38, 827^837 829
Water quality
Water-quality parameters, such as temperature,dissolved oxygen (DO), pH and ammonia, weremonitored to ensure that water quality remained wellwithin the limits recommended for the ¢sh. Watertemperaturewas recorded daily usingamercury ther-mometer suspended at 30 cm depth. Dissolved oxygenwas measured usingYSI model 56 oxygen meter (Yel-low Springs Instrument,Yellow Springs, OH, USA) andpH using a pH metre (Orion pH meter, Abilene, TX,USA). Ammonia and alkalinity were measured atweekly intervals according toAPHA, AWWA&WPCF(1989).
Analytical methods
The chemical composition of ¢sh and diets sampleswas determined according to procedures of AOAC(1995). Analyses of samples were made on dry matterbasis after drying the samples in an oven (105 1C) for24 h. Ash content was measured using incinerationat 550 1C for 12 h, crude protein using the micro-Kjeldhal method, N% � 6.25 (using a Kjeltech autoa-nalyzer, Model 1030,Tecator, H˛gan�s, Sweden), andcrude fat was measured using Soxhlet extractionwith diethyl ether (40^60 1C). Gross energy (GE) con-tent of diet and carcass samples was calculated ac-cording to gross caloric values of Brett (1973) byapplying the factor 23.6,39.5 and17.2 kJg�1of crudeprotein, crude fat and total carbohydrate, respec-tively. The digestible energy (DE) was estimated byapplying the coe⁄cient of 70% to convert deter-
mined GE to DE according to Hepher, Liao, Chengand Haseih (1983).
Growth indices
Weight gain (WG), speci¢c growth rate (SGR), feedconversion ratio (FCR), protein productive value(PPV), fat retention (FR) and energy retention (ER)were calculated using the following equations:
WG ¼Final bodyweight ðgÞ� Initial bodyweight ðgÞ
SGR ¼ ½ðln FBW� ln IBWÞ � 100� period�1
where FBW is ¢nal body weight (g); IBW is initialbody weight (g); ln5natural logarithmic.
FCR ¼ Feed intake ðgÞ=Weight gain ðgÞ
PPV ¼½Retained protein ðgÞ=Protein intake ðgÞ�� 100
FR ¼ ½Retained fat ðgÞ=Fat intake ðgÞ� � 100
ER ¼½Retained energy ðkJÞ=Energy intake ðkJÞ�� 100
Statistical analysis
The data for each tilapia species were separatelyanalysed by ANOVA using MSTAT-C version 4 software(MSTAT-C 1987). Duncan’s multiple range test wasused to compare di¡erences between individualmeans when signi¢cant ANOVA F-values were deter-mined (Duncan1955).Treatment e¡ects were consid-ered signi¢cant at (P � 0.05).
Results
Over the17-week feeding period, no signi¢cant di¡er-ences were observed in the water-quality indices be-tween the experimental treatments. The water-quality parameters were within the acceptable rangefor both tilapia species (Hepher & Pruginin1981).Thewater temperature ranged from 23.8 to 28.5 � 0.8 1C,DO from 5.0 to 6.0 � 0.9mg L�1, pH from 7.0 to8.1 � 0.5, ammonia from 0.23 to 0.32 � 0.04mg L�1
and alkalinity from177 to182mg L�1.The results of the ¢nal body weight (FBW), WG,
feed intake (FI), SGR and FCR for two tilapia species,are presented inTable 3 and Figs1^3. Nile tilapia fed
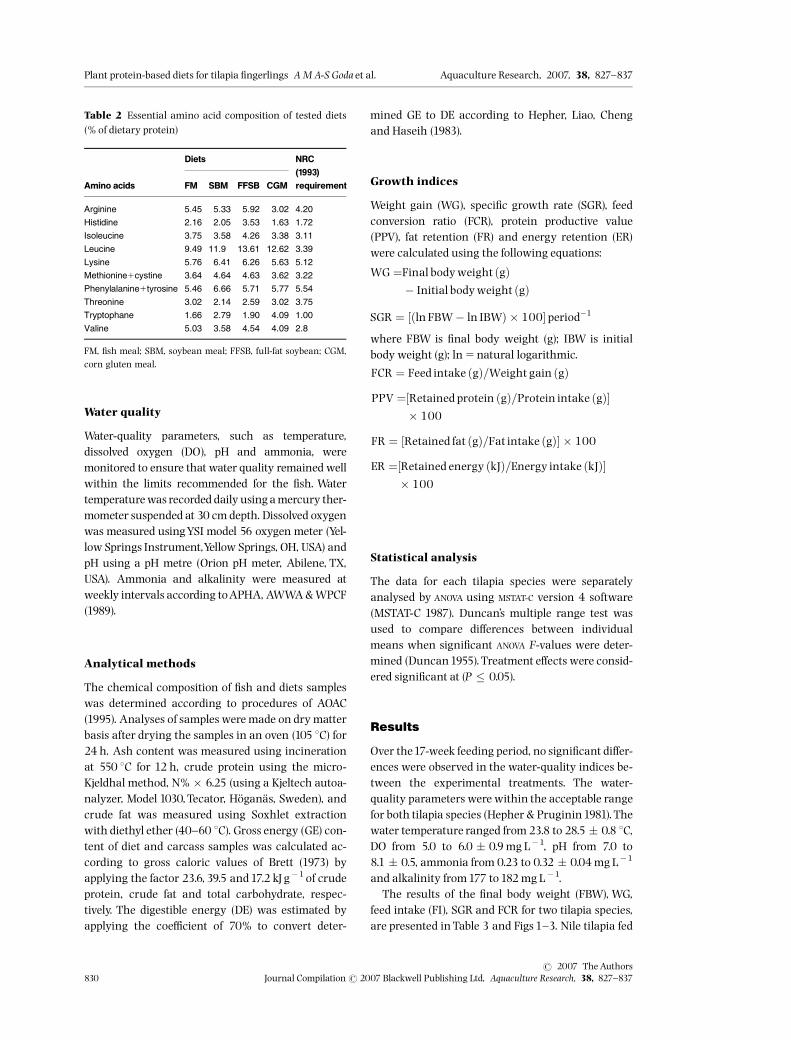
Table 2 Essential amino acid composition of tested diets(% of dietary protein)
Amino acids
Diets NRC(1993)requirementFM SBM FFSB CGM
Arginine 5.45 5.33 5.92 3.02 4.20
Histidine 2.16 2.05 3.53 1.63 1.72
Isoleucine 3.75 3.58 4.26 3.38 3.11
Leucine 9.49 11.9 13.61 12.62 3.39
Lysine 5.76 6.41 6.26 5.63 5.12
Methionine1cystine 3.64 4.64 4.63 3.62 3.22
Phenylalanine1tyrosine 5.46 6.66 5.71 5.77 5.54
Threonine 3.02 2.14 2.59 3.02 3.75
Tryptophane 1.66 2.79 1.90 4.09 1.00
Valine 5.03 3.58 4.54 4.09 2.8
FM, ¢sh meal; SBM, soybean meal; FFSB, full-fat soybean; CGM,corn gluten meal.
Plant protein-based diets for tilapia ¢ngerlings AMA-S Goda et al. Aquaculture Research, 2007, 38, 827^837
r 2007 TheAuthors830 Journal Compilationr 2007 Blackwell Publishing Ltd, Aquaculture Research, 38, 827^837
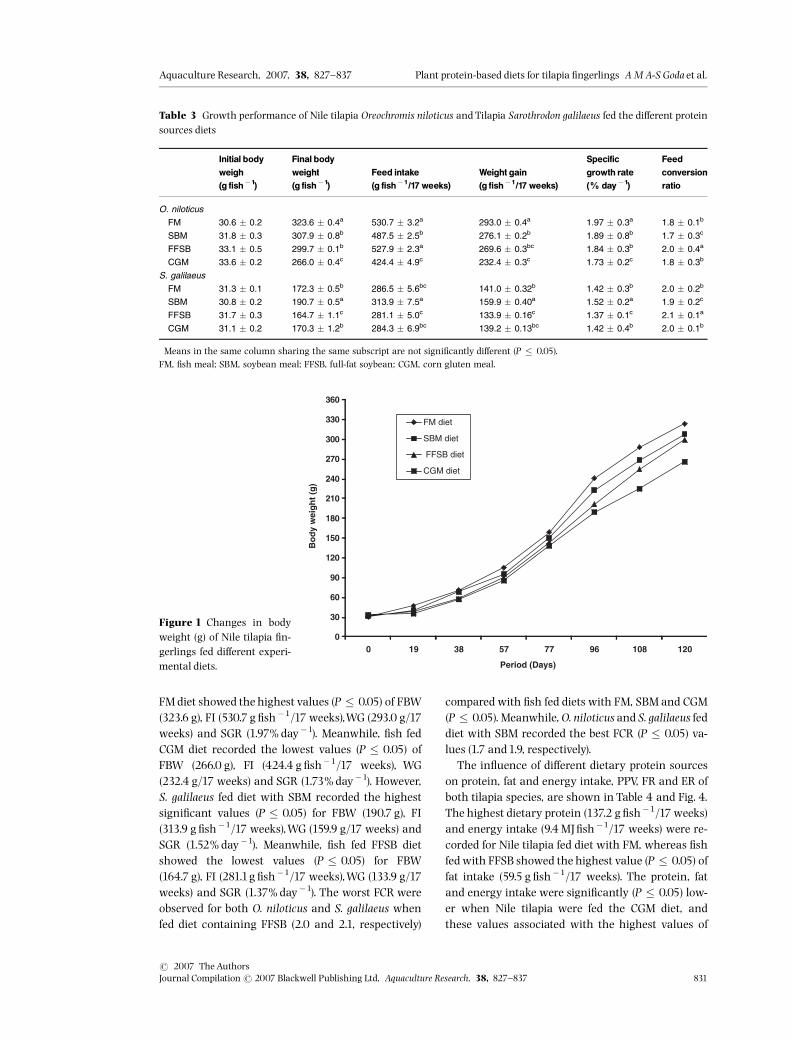
FM diet showed the highest values (P � 0.05) of FBW(323.6 g), FI (530.7 g ¢sh�1/17 weeks),WG (293.0 g/17weeks) and SGR (1.97% day�1). Meanwhile, ¢sh fedCGM diet recorded the lowest values (P � 0.05) ofFBW (266.0 g), FI (424.4 g ¢sh�1/17 weeks), WG(232.4 g/17 weeks) and SGR (1.73% day�1). However,S. galilaeus fed diet with SBM recorded the highestsigni¢cant values (P � 0.05) for FBW (190.7 g), FI(313.9 g ¢sh�1/17 weeks),WG (159.9 g/17 weeks) andSGR (1.52% day�1). Meanwhile, ¢sh fed FFSB dietshowed the lowest values (P � 0.05) for FBW(164.7 g), FI (281.1g ¢sh�1/17 weeks),WG (133.9 g/17weeks) and SGR (1.37% day�1). The worst FCR wereobserved for both O. niloticus and S. galilaeus whenfed diet containing FFSB (2.0 and 2.1, respectively)
compared with ¢sh fed diets with FM, SBM and CGM(P � 0.05). Meanwhile,O. niloticus and S. galilaeus feddiet with SBM recorded the best FCR (P � 0.05) va-lues (1.7 and1.9, respectively).The in£uence of di¡erent dietary protein sources
on protein, fat and energy intake, PPV, FR and ER ofboth tilapia species, are shown in Table 4 and Fig. 4.The highest dietary protein (137.2 g ¢sh�1/17 weeks)and energy intake (9.4MJ¢sh�1/17 weeks) were re-corded for Nile tilapia fed diet with FM, whereas ¢shfed with FFSB showed the highest value (P � 0.05) offat intake (59.5 g ¢sh�1/17 weeks). The protein, fatand energy intake were signi¢cantly (P � 0.05) low-er when Nile tilapia were fed the CGM diet, andthese values associated with the highest values of
Table 3 Growth performance of Nile tilapia Oreochromis niloticus and Tilapia Sarothrodon galilaeus fed the di¡erent proteinsources diets�
Initial bodyweigh(g fish�1)
Final bodyweight(g fish�1)
Feed intake(g fish�1/17 weeks)
Weight gain(g fish�1/17 weeks)
Specificgrowth rate(% day�1)
Feedconversionratio
O. niloticus
FM 30.6 � 0.2 323.6 � 0.4a 530.7 � 3.2a 293.0 � 0.4a 1.97 � 0.3a 1.8 � 0.1b
SBM 31.8 � 0.3 307.9 � 0.8b 487.5 � 2.5b 276.1 � 0.2b 1.89 � 0.8b 1.7 � 0.3c
FFSB 33.1 � 0.5 299.7 � 0.1b 527.9 � 2.3a 269.6 � 0.3bc 1.84 � 0.3b 2.0 � 0.4a
CGM 33.6 � 0.2 266.0 � 0.4c 424.4 � 4.9c 232.4 � 0.3c 1.73 � 0.2c 1.8 � 0.3b
S. galilaeus
FM 31.3 � 0.1 172.3 � 0.5b 286.5 � 5.6bc 141.0 � 0.32b 1.42 � 0.3b 2.0 � 0.2b
SBM 30.8 � 0.2 190.7 � 0.5a 313.9 � 7.5a 159.9 � 0.40a 1.52 � 0.2a 1.9 � 0.2c
FFSB 31.7 � 0.3 164.7 � 1.1c 281.1 � 5.0c 133.9 � 0.16c 1.37 � 0.1c 2.1 � 0.1a
CGM 31.1 � 0.2 170.3 � 1.2b 284.3 � 6.9bc 139.2 � 0.13bc 1.42 � 0.4b 2.0 � 0.1b
�Means in the same column sharing the same subscript are not signi¢cantly di¡erent (P � 0.05).FM, ¢sh meal; SBM, soybean meal; FFSB, full-fat soybean; CGM, corn gluten meal.
0
30
60
90
120
150
180
210
240
270
300
330
360
0 19 38 57 77 96 108 120
Period (Days)
Bo
dy
wei
gh
t (g
)
FM diet
SBM diet
FFSB diet
CGM diet
Figure 1 Changes in bodyweight (g) of Nile tilapia ¢n-gerlings fed di¡erent experi-mental diets.
Aquaculture Research, 2007, 38, 827^837 Plant protein-based diets for tilapia ¢ngerlings AMA-S Goda et al.
r 2007 TheAuthorsJournal Compilationr 2007 Blackwell Publishing Ltd, Aquaculture Research, 38, 827^837 831
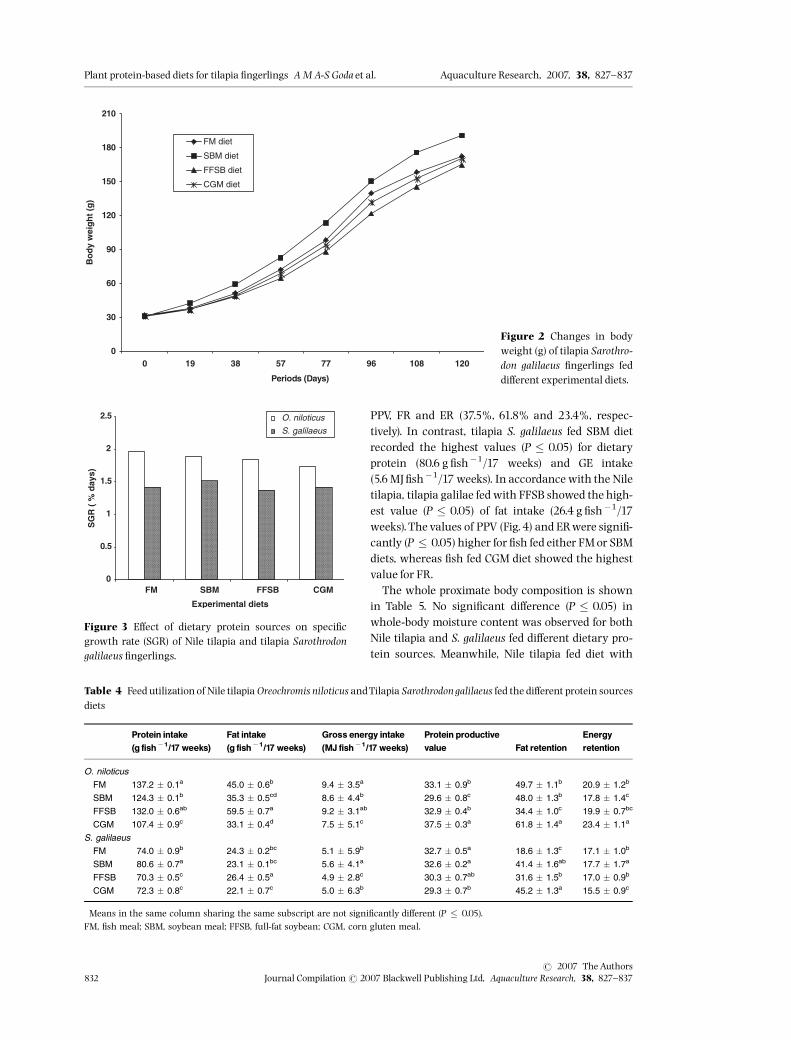
PPV, FR and ER (37.5%, 61.8% and 23.4%, respec-tively). In contrast, tilapia S. galilaeus fed SBM dietrecorded the highest values (P � 0.05) for dietaryprotein (80.6 g ¢sh�1/17 weeks) and GE intake(5.6MJ¢sh�1/17 weeks). In accordance with the Niletilapia, tilapia galilae fed with FFSB showed the high-est value (P � 0.05) of fat intake (26.4 g ¢sh�1/17weeks).The values of PPV (Fig.4) and ERwere signi¢-cantly (P � 0.05) higher for ¢sh fed either FMor SBMdiets, whereas ¢sh fed CGM diet showed the highestvalue for FR.The whole proximate body composition is shown
in Table 5. No signi¢cant di¡erence (P � 0.05) inwhole-body moisture content was observed for bothNile tilapia and S. galilaeus fed di¡erent dietary pro-tein sources. Meanwhile, Nile tilapia fed diet with
0
30
60
90
120
150
180
210
0 19 38 57 77 96 108 120
Periods (Days)
Bo
dy
wei
gh
t (g
)
FM diet
SBM diet
FFSB diet
CGM diet
Figure 2 Changes in bodyweight (g) of tilapia Sarothro-don galilaeus ¢ngerlings feddi¡erent experimental diets.
0
0.5
1
1.5
2
2.5
FM SBM FFSB CGM
Experimental diets
SG
R (
% d
ays)
O. niloticus
S. galilaeus
Figure 3 E¡ect of dietary protein sources on speci¢cgrowth rate (SGR) of Nile tilapia and tilapia Sarothrodongalilaeus ¢ngerlings.
Table 4 Feed utilizationof Nile tilapia Oreochromis niloticus andTilapia Sarothrodon galilaeus fed the di¡erent protein sourcesdiets�
Protein intake(g fish�1/17 weeks)
Fat intake(g fish�1/17 weeks)
Gross energy intake(MJ fish�1/17 weeks)
Protein productivevalue Fat retention
Energyretention
O. niloticus
FM 137.2 � 0.1a 45.0 � 0.6b 9.4 � 3.5a 33.1 � 0.9b 49.7 � 1.1b 20.9 � 1.2b
SBM 124.3 � 0.1b 35.3 � 0.5cd 8.6 � 4.4b 29.6 � 0.8c 48.0 � 1.3b 17.8 � 1.4c
FFSB 132.0 � 0.6ab 59.5 � 0.7a 9.2 � 3.1ab 32.9 � 0.4b 34.4 � 1.0c 19.9 � 0.7bc
CGM 107.4 � 0.9c 33.1 � 0.4d 7.5 � 5.1c 37.5 � 0.3a 61.8 � 1.4a 23.4 � 1.1a
S. galilaeus
FM 74.0 � 0.9b 24.3 � 0.2bc 5.1 � 5.9b 32.7 � 0.5a 18.6 � 1.3c 17.1 � 1.0b
SBM 80.6 � 0.7a 23.1 � 0.1bc 5.6 � 4.1a 32.6 � 0.2a 41.4 � 1.6ab 17.7 � 1.7a
FFSB 70.3 � 0.5c 26.4 � 0.5a 4.9 � 2.8c 30.3 � 0.7ab 31.6 � 1.5b 17.0 � 0.9b
CGM 72.3 � 0.8c 22.1 � 0.7c 5.0 � 6.3b 29.3 � 0.7b 45.2 � 1.3a 15.5 � 0.9c
�Means in the same column sharing the same subscript are not signi¢cantly di¡erent (P � 0.05).FM, ¢sh meal; SBM, soybean meal; FFSB, full-fat soybean; CGM, corn gluten meal.
Plant protein-based diets for tilapia ¢ngerlings AMA-S Goda et al. Aquaculture Research, 2007, 38, 827^837
r 2007 TheAuthors832 Journal Compilationr 2007 Blackwell Publishing Ltd, Aquaculture Research, 38, 827^837
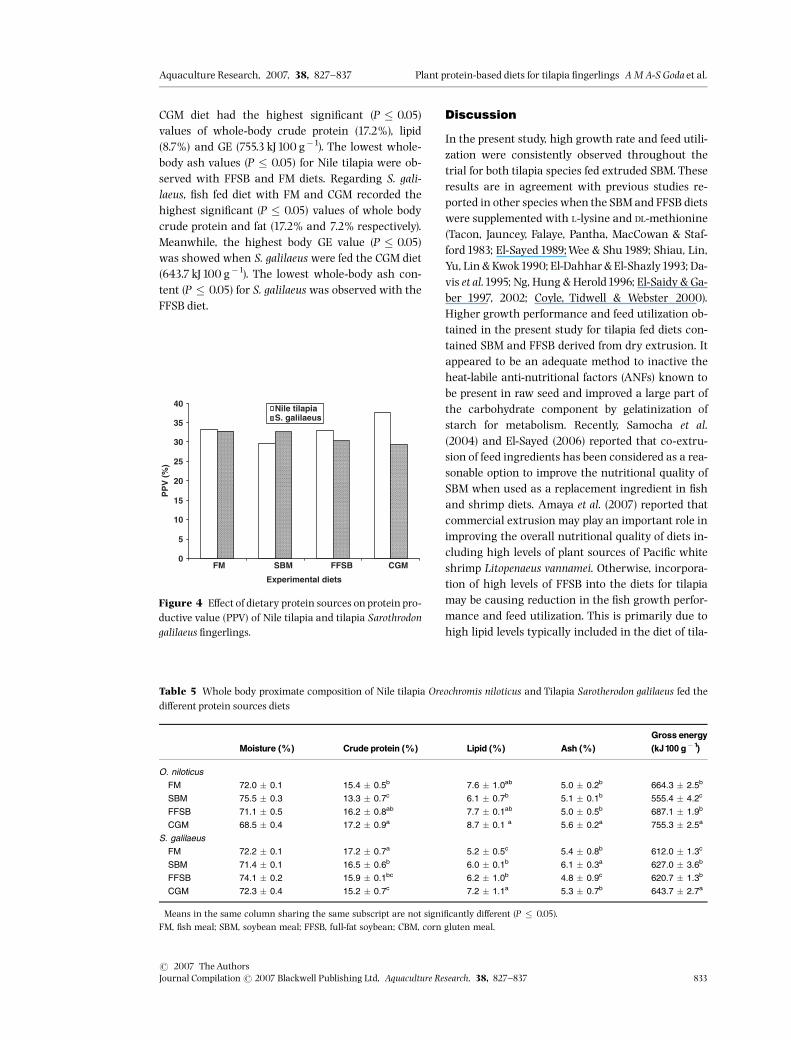
CGM diet had the highest signi¢cant (P � 0.05)values of whole-body crude protein (17.2%), lipid(8.7%) and GE (755.3 kJ100 g�1). The lowest whole-body ash values (P � 0.05) for Nile tilapia were ob-served with FFSB and FM diets. Regarding S. gali-laeus, ¢sh fed diet with FM and CGM recorded thehighest signi¢cant (P � 0.05) values of whole bodycrude protein and fat (17.2% and 7.2% respectively).Meanwhile, the highest body GE value (P � 0.05)was showed when S. galilaeus were fed the CGM diet(643.7 kJ100 g�1). The lowest whole-body ash con-tent (P � 0.05) for S. galilaeus was observed with theFFSB diet.
Discussion
In the present study, high growth rate and feed utili-zation were consistently observed throughout thetrial for both tilapia species fed extruded SBM. Theseresults are in agreement with previous studies re-ported in other species when the SBMand FFSB dietswere supplemented with L-lysine and DL-methionine(Tacon, Jauncey, Falaye, Pantha, MacCowan & Staf-ford1983; El-Sayed1989;Wee & Shu1989; Shiau, Lin,Yu, Lin & Kwok1990; El-Dahhar & El-Shazly1993; Da-vis et al.1995; Ng, Hung & Herold1996; El-Saidy & Ga-ber 1997, 2002; Coyle, Tidwell & Webster 2000).Higher growth performance and feed utilization ob-tained in the present study for tilapia fed diets con-tained SBM and FFSB derived from dry extrusion. Itappeared to be an adequate method to inactive theheat-labile anti-nutritional factors (ANFs) known tobe present in raw seed and improved a large part ofthe carbohydrate component by gelatinization ofstarch for metabolism. Recently, Samocha et al.(2004) and El-Sayed (2006) reported that co-extru-sion of feed ingredients has been considered as a rea-sonable option to improve the nutritional quality ofSBM when used as a replacement ingredient in ¢shand shrimp diets. Amaya et al. (2007) reported thatcommercial extrusion may play an important role inimproving the overall nutritional quality of diets in-cluding high levels of plant sources of Paci¢c whiteshrimp Litopenaeus vannamei. Otherwise, incorpora-tion of high levels of FFSB into the diets for tilapiamay be causing reduction in the ¢sh growth perfor-mance and feed utilization. This is primarily due tohigh lipid levels typically included in the diet of tila-
0
5
10
15
20
25
30
35
40
FM SBM FFSB CGM
Experimental diets
PP
V (
%)
Nile tilapiaS. galilaeus
Figure 4 E¡ect of dietary protein sources on protein pro-ductive value (PPV) of Nile tilapia and tilapia Sarothrodongalilaeus ¢ngerlings.
Table 5 Whole body proximate composition of Nile tilapia Oreochromis niloticus and Tilapia Sarotherodon galilaeus fed thedi¡erent protein sources diets�
Moisture (%) Crude protein (%) Lipid (%) Ash (%)Gross energy(kJ100 g�1)
O. niloticus
FM 72.0 � 0.1 15.4 � 0.5b 7.6 � 1.0ab 5.0 � 0.2b 664.3 � 2.5b
SBM 75.5 � 0.3 13.3 � 0.7c 6.1 � 0.7b 5.1 � 0.1b 555.4 � 4.2c
FFSB 71.1 � 0.5 16.2 � 0.8ab 7.7 � 0.1ab 5.0 � 0.5b 687.1 � 1.9b
CGM 68.5 � 0.4 17.2 � 0.9a 8.7 � 0.1 a 5.6 � 0.2a 755.3 � 2.5a
S. galilaeus
FM 72.2 � 0.1 17.2 � 0.7a 5.2 � 0.5c 5.4 � 0.8b 612.0 � 1.3c
SBM 71.4 � 0.1 16.5 � 0.6b 6.0 � 0.1b 6.1 � 0.3a 627.0 � 3.6b
FFSB 74.1 � 0.2 15.9 � 0.1bc 6.2 � 1.0b 4.8 � 0.9c 620.7 � 1.3b
CGM 72.3 � 0.4 15.2 � 0.7c 7.2 � 1.1a 5.3 � 0.7b 643.7 � 2.7a
�Means in the same column sharing the same subscript are not signi¢cantly di¡erent (P � 0.05).FM, ¢sh meal; SBM, soybean meal; FFSB, full-fat soybean; CBM, corn gluten meal.
Aquaculture Research, 2007, 38, 827^837 Plant protein-based diets for tilapia ¢ngerlings AMA-S Goda et al.
r 2007 TheAuthorsJournal Compilationr 2007 Blackwell Publishing Ltd, Aquaculture Research, 38, 827^837 833
pia when used high replacement levels (410%) ofFFSB. Lim (2002) reported that tilapia do not tolerateas high a dietary lipid as other ¢sh (carp, trout andcat¢sh) that utilize oil supplements quickly ande⁄ciently. Chou and Shiau (1996) reported that 5%dietary lipid appeared to be su⁄cient to meet mini-mal requirement of juvenile tilapia hybrid O.niloticus � O. aureus. Several hypotheses might ex-plain the poor tilapia utilization of lipids, for exampleweak lipase system in tilapia or de¢cient absorptionmechanisms (Hanley1991).The present results showed that both Nile tilapia
and tilapia galilae fed CGM recorded the lowest va-lues of WG and SGR compared with ¢sh-meal-baseddiet. These results suggest that the decrease in ¢shperformance indices may attribute to more limitingamino acid than lysine in CGM diets. Calculated ami-no acid indicated that the diet containing CGM wasde¢cient in arginine, histidine and threonine com-pared with the ¢sh requirement (NRC 1993). It ap-pears that de¢ciency of these amino acids could beresponsible for the lower performance of ¢sh fedCGM diet compared with control FM diet. Otherwise,D’Mello (1993) reported that amino acid imbalance inCGM had been found to be involved in reducing FIand growth performance in higher vertebrates. Thisalso possibly caused a reduction of FI in spite of thepresence of inosine known to be a gustatory feedingstimulant in turbot Scophthalmus maximus (Mitchell& Mackie 1983). However, the data agree with the¢nding of Pereira and Oliva-Teles (2003) who re-ported that signi¢cant decreases were found for bothgrowth rate and feed utilization with the highest re-placement level (80%) of dietary FM by CGM for gilt-head sea bream Sparus aurata (L.) this reduction wasmost likely due to a dietary amino acid imbalance.Growth indices of O. niloticuswere better than that
of S. galilaeus. It should be noted that the FBW,WG,SGR, FCR and ER of Nile tilapia in the present studyare better than those of the S. galilaeus and may bedue to the di¡erences in feeding habits and nutri-tional requirements between the two species. Likeother ¢lter-feeding ¢sh, S. galilaeus consumes bothphytoplankton and zooplankton (Trewavas 1973).Hambright, Blumenshine and Shapiro (2002) re-ported that in natural environmental condition(Lakes), most of the annual net growth for S. galilaeusoccurred during spring. Periods of negative growthoccurred during late summer early fall, probably be-cause of high water temperatures (approaching30 1C) and relatively low plankton biomass. Similarto the ¢ndings of this study, Bishei and Khalil (1997)
and Kheir andMohammed (2001) reported that therewas lower growth potential of S. galilaeus cultured inearthen ponds than that of O. niloticus when fed dietwith 30% CP. This may be due to scarcity of phyto-plankton and planktonic crustaceans in the rearingponds, which are the main natural food for S. gali-laeus and also that O. niloticus feed on the arti¢cialfeed more vigorously than S. galilaeus do.Concerning proximate whole-body composition,
crude protein, lipid and GE contents of Nile tilapiafed diet with CGM were higher compared with otherplant protein sources. Meanwhile, the highest bodyprotein content was observed for S. galilaeus when¢sh fed FM diet. The highest lipid and GE contentswere recorded for ¢sh fed CGM. These results agreedwith the ¢ndings of El-Saidy and Gaber (2003) andAbdelghany (2003). In this study, the lowest ash con-tent was observed with diet containing FFSM forboth tilapia species. Elangovanand Shim (2000) havereported a signi¢cant reduction of ash content in ¢shfed with SBM, presumably related to the presence ofphytic acid, which reduces the availability of severalminerals such as calcium, magnesium, zinc, iron andphosphorus (Lanari, D’Agro & Turri 1998; Storebak-ken, Shearer & Roem1998). The same trend was ob-served by HernaŁ ndez et al. (2007) for sharpsnoutseabream (Diplodus puntazzo).The processing and drying techniques for soybean
in the last few years have been immensely improved.Modern processing technologies have overcomemanyof the obstacles andANFs inmost plant proteinsources (Oliva-Teles, Gouveia, Gomes & Rema 1994),not only by denaturing ANFs and solvent extractingmuch of the unsuitable lipid, but also by improving alarge part of the carbohydrate component bygelatini-zation of starch in the SBM and FFSB that increasedthe availability of total dietary GE for metabolism for¢sh. This study showed that this technology has im-proved the suitability of SBM and FFSB as plant pro-tein ingredients for tilapia species. Moreover, the costof protein ingredients is an important considerationwhen formulating diets for ¢sh. In Egypt, Herring FMcosts approximately 9000 Egyptian pounds (LE) -metric tonnes�1 ($US 1579), SBM (feed grade) costsapproximately 1520 LE metric tonnes�1 ($US 267),FFSB (feed grade) costs 1800 LE metric tonnes�1
($US 314) and CGM (feed grade) costs approximately2700 LE metric tonnes�1 ($US 470). However, mostof the studies have evaluated FM substituted in tila-pia feeds from biological or nutritional viewpoints.Little attention has been paid to the economic analy-sis of these protein sources. Only a few studies have
Plant protein-based diets for tilapia ¢ngerlings AMA-S Goda et al. Aquaculture Research, 2007, 38, 827^837
r 2007 TheAuthors834 Journal Compilationr 2007 Blackwell Publishing Ltd, Aquaculture Research, 38, 827^837
been considering economic bene¢t of replacing FM,and these indicating that the unconventional proteinsources were more economical compared with FM.The advantage of using plant alternative proteinsources in tilapia species diets lies not necessarily intheir nutrient composition, but in their local avail-ability and low prices.
Conclusion
The present data con¢rmed that Nile tilapia is able toutilize plant-based diets, either SBM or FFSB as amain source of dietary protein superior to the FM,evenat the total replacement levels. Meanwhile, S. ga-lilaeus obtained higher growth and appeared to uti-lize SBM diet more e⁄ciently as a main proteinsource than FMand FFSB. Otherwise, for both tilapiaspecies, CGM as a sole source of protein needs to besupplemented with three limiting amino acids (argi-nine, histidine and threonine) at a higher replace-ment level, and this deserves further analyses.
Acknowledgments
The authors thank Prof Dr Ragab Abdel Regal andProf Dr MamdouhT. Kheir for his assistance.We alsothankMrMohamed A. Mansour, the Director of Zoo-Control Company,6 October City, Cairo Governorate,Egypt and Prof Dr Osama El-Husseiny, the chairmenof Animal Production Islamic Company (APICO),Dokki-El-Giza, Egypt, for the ingredients used in thisstudy. Furthermore, the authors express their sincerethanks to the Animal Production Department, Fa-culty of Agriculture, Cairo University, Egypt, for pro-viding technical laboratory and National Institute ofOceanography and Fisheries for providing the place.
References
AbdelghanyA.E. (2003) Replacement of herring ¢shmeal bysoybean £our in practical diets for red tilapia,Oreochromisniloticus � O. mossambicus, grown in concrete tanks.Journal of Applied Aquaculture14,69^87.
Amaya E.A., Davis D.A. & Rouse D.B. (2007) Replacementof ¢sh meal in practical diets for the Paci¢c white shrimp(Litopenaeus vannamei) reared under pond conditions.Aquaculture 262,393^401.
Amerio M.,Vignali C., Castelli L., Fiorentini L. & Tibaldi E.(1998) Vegetable protein sources, protein evaluationindexes and ‘ideal protein’ of sea bream (Sparus aurata).RivistaTaliana di Acquacoltura 33,135^145.
AOAC. (1995) O⁄cial Methods of Analysis of AOAC Interna-tional.Vol. I. Agriculture Chemicals; Contaminants, Drugs,16th edn. AOAC International, Arlington,VA, USA.
APHA, AWWA &WPCF (1989) Standard Methods for the Ex-
amination of Water and Wastewater, 17th edn. AmericanPublic Health Association, AmericanWaterWorks Asso-ciation andWater Pollution Control Federation,Washing-ton, DC, USA.
Arndt R.E., Hardy R.W., Sugiura S.H. & Dong F.M. (1999) Ef-
fects of heat treatment and substitution level on palatabil-ity and nutritional value of soy defatted £our in feeds forCoho salmon, Oncorhynchus kisutch. Aquaculture 180,129^145.
Bishei H.M. & Khalil M.T. (1997) Freshwater ¢shes of Egypt.Egyptian Environmental A¡airs Agency (EEAA), Depart-ment of Nature Protection Publication of National Biodi-versity Unit No.9.
Boonyaratpalin M., Suraneiranat P. & Tunpibal T. (1998) Re-placement of ¢sh meal with various types of soybeanproducts in diets for Asian seabass, Lates calcarifer. Aqua-culture161,67^78.
Brett J.R. (1973) Energy expenditure of Sockeye salmon On-
corhynchus nerka, during sustained performance. Journalof the Fisheries Research Board of Canada 30,1799^1809.
Chou B.S. & Shiau S.Y. (1996) Optimal dietary lipid level forgrowth of Juvenile hybrid tilapiaOreochromis niloticus �Oreochromis aureus. Aquaculture143,185^195.
Chowdhury M.A.K., Bose M.L., Bureau D.P. & Dey M.M. (inpress) Relevance of identifying locally available feed in-gredients to small-scale Nile tilapia (Oreochromis niloticus
L.) aquaculture. Aquaculture Economics and Management.Chowdhury M.A.K.,Yi Y., Lin C.K. & El-Haroun E.R. (2006)E¡ect of salinity on carrying capacity of adult Niletilapia, Oreochromis niloticus L. in recirculating systems.Aquaculture Research 37,1627^1635.
Coyle S.D., Tidwell J.H. & Webster C.D. (2000) Response oflarge mouth bassMicropterus salmoides to dietary supple-mentation of lysine, methionine, and highly unsaturatedfatty acids. Journal of the World Aquaculture Society 31,89^95.
Craig S.R. 2004 Organic agricultural feed. Aqua Feeds:Formulation and Beyond1,11^13.
Davis D.A., Jirsa D. & Arnold C.R. (1995) Evaluation of soy-
bean proteins as replacement for menhaden ¢sh meal inpractical diets for the red drum Sciaenops ocellatus. Journalof theWorld Aquaculture Society 26, 48^58.
Duncan D.B. (1955) Multiple ranges and multiple T-test.
Biometrics11,1^42.D’Mello J.P. (1993) Amino acid supplementation to cereal-based diets for non-ruminants. Animal Feed Science andTechnology 45,1^18.
Elangovan A. & Shim K.F. (2000) The in£uence of replacing¢sh meal partially in the diet with soybean meal ongrowth and body composition of juvenile tin foil barb(Barbodes altus). Aquaculture189,133^144.
Aquaculture Research, 2007, 38, 827^837 Plant protein-based diets for tilapia ¢ngerlings AMA-S Goda et al.
r 2007 TheAuthorsJournal Compilationr 2007 Blackwell Publishing Ltd, Aquaculture Research, 38, 827^837 835
El-DahharA.A. & El-Shazly K. (1993) E¡ect of essential ami-no acids (methionine and lysine) and treated oil in¢sh diet on growth performance and feed utilization ofNile tilapia, Oreochromis niloticus (L.). Aquaculture FishManagement 24,731^739.
El-Saidy D.M.S. & Gaber M.M.A. (1997) Total replacement of¢sh meal by soybean meal, with various percentages ofsupplemental L-methionine, in diets for Nile tilapiaOreochromis niloticus fry. Annals of Agriculture Science,
Moshtohor 35,1223^1238.El-Saidy D.M.S.D. & Gaber M.M.A. (2002) Complete replace-
ment of ¢sh meal by soybean meal with dietary L-lysinesupplementation for Nile tilapia Oreochromis niloticus (L.)¢ngerlings. Journal of the World Aquaculture Society 33,297^306.
El-Saidy D.M.S.D. & Gaber M.M.A. (2003) Replacement of¢sh mealwith amixture of di¡erent plant protein sourcesin juvenile Nile tilapia, Oreochromis niloticus (L.) diets.
Aquaculture Research 34,1119^1127.El-Sayed A.M. (1989) Evaluationof semi puri¢ed test diets for
Tilapia zilli ¢ngerlings. Journal of the World AquacultureSociety 20, 240^244.
El-Sayed A.M. (2006) Tilapia Culture. CABI Publishers,Wallingford, UK.
FAO. (2004) Food and agricultural organization ¢sherystatistics. Aquaculture production at: http: www.
faostat.fao.org/faostat./notes/units-e.htmlGeneral Authority for Fish Resources Development (2006)
Statistical analysis of total aquaculture production in Egypt.Ministry of Agriculture, Cairo, Egypt (Arabic edition).
Goda A.M., El-Haroun E.R. & Chowdhury M.A.K. (2007) Ef-fect of totallyor partially replacing of ¢shmeal byalterna-tive protein sources on growth of African cat¢sh Clariasgariepinus (Burchell, 1822) reared in concrete tanks.Aquaculture Research 38, 279^287.
Hambright K.D., Blumenshine S.C. & Shapiro J. (2002) Can¢lter-feeding ¢shes improve water quality in lakes?Freshwater Biology 47,1^10.
Hanley F.A. (1991) E¡ects of feeding supplementary dietscontaining varying levels of lipid on growth, food conver-sion, and body composition of Nile tilapia Oreochromisniloticus. Aquaculture 93,323^334.
Hepher B. & PrugininY. (1981) Commercial Fish Farm. John
Wiley and Sons Press, NewYork, USA.Hepher B., Liao I.C., Cheng S.H. & Haseih C.S. (1983) Food
utilization by red tilapia. E¡ect of diet composition, feed-ing level and temperature on utilization e⁄ciency for
maintenance and growth. Aquaculture 32, 255^272.HernaŁ ndez M.D., Mart|¤ nez F.J., Jover M. & Garc|¤ a Garc|¤ a B.
(2007) E¡ects of partial replacement of ¢sh meal by soy-bean meal in sharpsnout seabream (Diplodus puntazzo)
diet. Aquaculture 263,159^167.Kheir M.T. &Mohammed R.A. (2001) Growth of Oreochromis
niloticus L. and Sarothrodon galilaeus (Linnaeus, 1758)raised on an arti¢cial feed at di¡erent feeding rates. Jour-
nal Egypt Germany Society Zoology (Vertebrate, Anatomyand Embryology) 36,13^25.
Lanari D., D’Agro E. & Turri C. (1998) Use of nonlinearregression to evaluate the e¡ects of phytase enzymetreatment of plant protein diets for rainbow trout (Oncor-hynchus mykiss). Aquaculture161,345^356.
LimC. (2002)Nutrient requirements of tilapias. AquaticAnimalHealth Research Laboratory, USDA-ARS, Auburn, AL, USA.
Lim C. & Akiyama D.M. (1992) Full-fat soybean mealutilization by ¢sh. Asian Fisheries Science 5,181^197.
Mendoza R., De DiosA.,Vazquez C., Cruz E., Ricque D., Agui-lera C. &Montemayor J. (2001) Fishmeal replacement withfeather enzymatic hydrolyzates co-extruded with soya-bean meal in practical diets for the Paci¢c white shrimp(Litopenaeus vannamei). Aquaculture Nutrition 7,143^151.
Mitchell A.I. &MackieA.M. (1983) Binding of [14C] inosine togustatory tissues of the turbot, Scophthalmus maximus.Comparative Biochemistry and Physiology (A. Physiology)75, 471^474.
MSTAT Version 4. (1987) Software Program for the Design andAnalysis of Agronomic Research Experiments. MichiganUniversity, Michigan, USA.
Muzinic L.A., Thompson K.R., Metts L.S., Dasgupta S. &Webster C.D. (2006) Use of turkeymeal as partial and totalreplacement of ¢sh meal in practical diets for sunshinebass (Morone chrysops � Morone saxatilis) grown intanks. Aquaculture Nutrition12,71^81.
NRC (1993)Nutrient Requirements of Fish. National AcademyPress,Washington, DC, USA.
NgW.K., Hung S.O. & Herold M.A. (1996) Poor utilization ofdietary free amino acids by white sturgeon. Fish Physiol-ogy and Biochemistry15,131^142.
Oliva-Teles A., Gouveia A.J., Gomes E.F. & Rema P. (1994)The e¡ect of di¡erent processing treatments on soybeanutilization by rainbow trout, Oncorhynchus mykiss.Aquaculture124,343^349.
Olli J.J., Krogdahl A. & VabenoA. (1995) Dehulled solvent ex-tracted soybean meal as a protein source in diets forAtlantic salmon, Salmo salar (L.). Aquaculture Research26,167^174.
PereiraT.G. & Oliva-Teles A. (2003) Evaluation of corn glutenmeal as a protein source in diets for gilthead sea bream(Sparus aurata L.) juveniles. Aquaculture Research 34,1111^1117.
Quartararo N., Allan G.L. & Bell J.D. (1998) Replacement of¢sh meal in diets for Australian snapper, Pagrus auratus.Aquaculture166, 279^295.
Rakocy J.E. (1989) Tank Culture of Tilapia. Southern RegionalAquaculture Center (SRAC), SRAC Publication No. 282California, USA.
Riche M. & Garling D.L. Jr. (2004) E¡ect of phytic acidon growth and nitrogen retention in tilapia Oreochromisniloticus (L.). Aquaculture Nutrition10,389^400.
Riche M.,Trottier N.L., Ku P.K. & Garling D.L. (2001) Appar-ent digestibility of crude protein and apparent availabilityof individual amino acids in tilapia (Oreochromis niloticus)
Plant protein-based diets for tilapia ¢ngerlings AMA-S Goda et al. Aquaculture Research, 2007, 38, 827^837
r 2007 TheAuthors836 Journal Compilationr 2007 Blackwell Publishing Ltd, Aquaculture Research, 38, 827^837
fed phytase pretreated soybean meal diets. Fish Physiol-
ogy and Biochemistry 25,181^194.Samocha M.S., Davis D.A., Saoud I.P. & De Bault K. (2004)
Substitution of ¢sh meal by co-extruded soybean
poultry by-product meal in practical diets for the paci¢c
white shrimp, Litopenaeus vannamei. Aquaculture 231,197^203.
Shiau S., Kwok C., Hwang J., Chen C. & Lee S. (1989) Replace-
ment of ¢shmeal with soybean meal in male tilapia
(Oreochromis niloticus � O. aureus) ¢ngerling diets at a
suboptimal protein level. Journal of theWorld Aquaculture
Society 20, 230^235.Shiau S., Lin S.,Yu S., Lin A. & Kwok C. (1990) Defatted and
full-fat soybeanmeal as partial replacements for ¢shmeal
in tilapia (Oreochromis niloticus � O. aureus) diets at low
protein level. Aquaculture 86, 401^407.StorebakkenT., Shearer K.D. & Roem A.J. (1998) Availability
of protein, phosphorus and other elements in ¢sh meal,
soy-protein concentrate and phytase-treated soy-protein-
concentrate-based diets to Atlantic salmon Salmo salar.
Aquaculture161,365^379.Storebakken T., Shearer K.D. & Roem A.J. (2000) Growth,
uptake, and retention of nitrogen and phosphorus, and
absorption of other minerals in Atlantic salmon Salmosalar fed diets with ¢sh meal and soy-protein concentrateas the main sources of protein. Aquaculture Nutrition 6,103^108.
Tacon A.G.J. (1996) Nutritional studies in crustaceansand the problems of applying research ¢ndings topractical farming systems. Aquaculture Nutrition 1, 165^174.
Tacon A.G.J., Jauncey K., FalayeA., Pantha M., MacCowan I.& Sta¡ord E.A. (1983) The use of meat and bone meal, hy-drolyzed feather meal and soybean meal in practical fryand ¢ngerling diets for Oreochromis niloticus. In Proceed-ing of the International Symposium on Tilapia in Aquacul-ture, (ed. by J. Fishelson & Z.Yaron), pp. 356^365. Tel AvivUniversity Press,Tel Aviv, Israel.
Trewavas E. (1973) On the cichlid ¢shes of the genus Pelma-tochromis with proposal of new genus for P. congicus; onthe relationships between Pelmatochromis and Tilapiaand the recognition of Sarotherodon as a distinct genus.Bulletin of the British Museum (Natural History). Zoology25,3^26.
Wee K.L. & Shu S.W. (1989) The nutritive value of boiled fullfat soybean in pelleted feed for Nile tilapia. Aquaculture81,303^314.
Aquaculture Research, 2007, 38, 827^837 Plant protein-based diets for tilapia ¢ngerlings AMA-S Goda et al.
r 2007 TheAuthorsJournal Compilationr 2007 Blackwell Publishing Ltd, Aquaculture Research, 38, 827^837 837
Related Documents