GROUND WATER STUDIES OF CHICKBALLAPUR DISTRICT - KARNATAKA AND WATER LEVEL MAPPING USING GIS SAFARUDHEEN P.A 2013255017 ANNA UNIVERSITY CHENNAI

Ground water studies of chickballapur district karnataka
Jul 19, 2015
Welcome message from author
This document is posted to help you gain knowledge. Please leave a comment to let me know what you think about it! Share it to your friends and learn new things together.
Transcript
GROUND WATER STUDIES OF
CHICKBALLAPUR DISTRICT -
KARNATAKA AND WATER
LEVEL MAPPING USING GIS
SAFARUDHEEN P.A
2013255017
ANNA UNIVERSITY
CHENNAI


ABOUT THE TOTAL PROJECT
Recreating the old ecological conditions of Chikaballapur district of Karnataka.
Multi task – Social workers, Agricultural and other Engineers, Geologists, Hydro geologists…..
STAGES
SOCIAL MINGLING
PUBLIC PARTICIPATION
PLANTATION
GEOLOGICAL STUDIES
GEOPHYSICAL AND GEOCHEMICAL STUDIES
HYDROGEOLOGICAL STUDIES
MAPPING
PLANNING AND MANAGEMENT
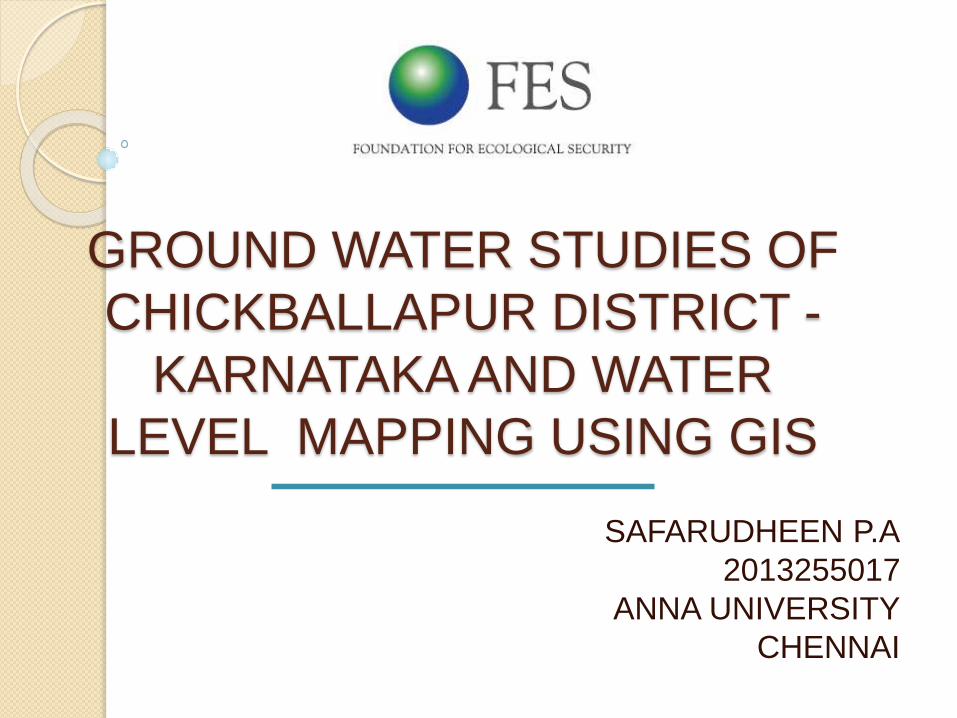
Chikaballapur Project Area

Chikaballapur is a district in the state of Karnataka.
Total area 4210 km²,56 km north of Bengaluru.
Topography of the area is almost plain with some
undulations in south-west, west and north. Average
elevation 903m, highest elevation 920m ( centre of
Nandi hill), and lowest elevation 887m above MSL
Entire drainage flow is towards north-east from south
and west of the area. Average annual rainfall 715mm (
June to October).
North Pinakani (North pennar river) originates from
Nandi hills in Chikaballapur taluk and flows in
Chikaballapur and Gowribidanur taluks for about 55
kms.

The local geology of the area falls under Dharwar Stratigraphy. The entire area sits on the Peninsular Gneissic complex as a basement which is overlain by sub recent lateritic material.
Chikaballapur - no water for Domestic and agricultural purposes. Polluted ground water.
Reasons – Subsurface geological conditions, environmental and climatic conditions, the crops used in this area.
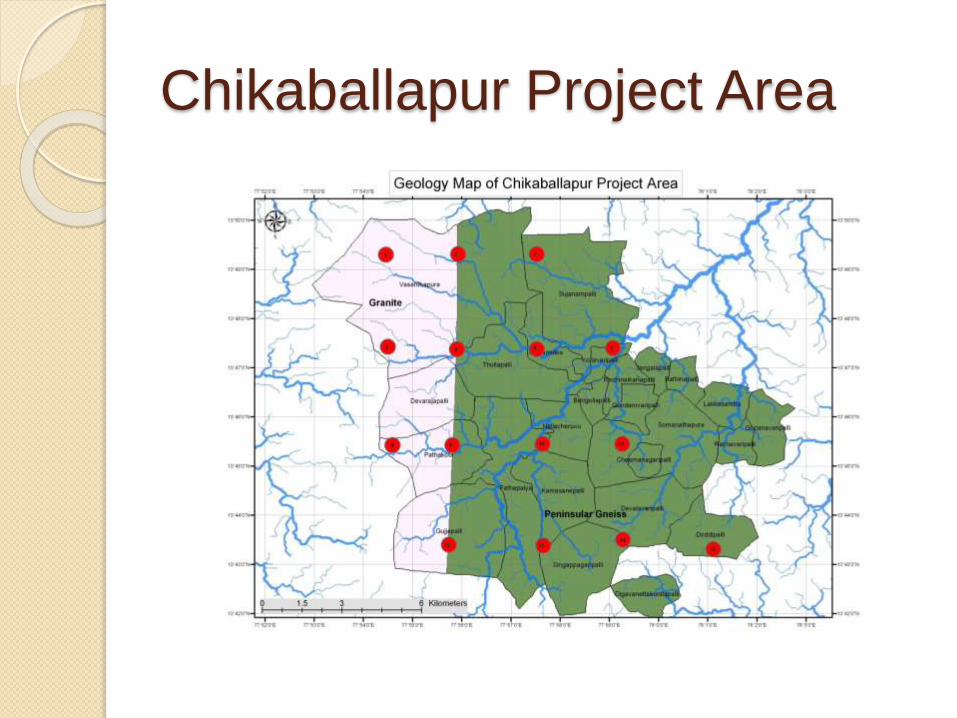
Hot Mantle—generate magma (average > 40 km depth)
Crust
Atmosphere
SCHEMATIC DIAGRAM FOR DYKE GENERATION
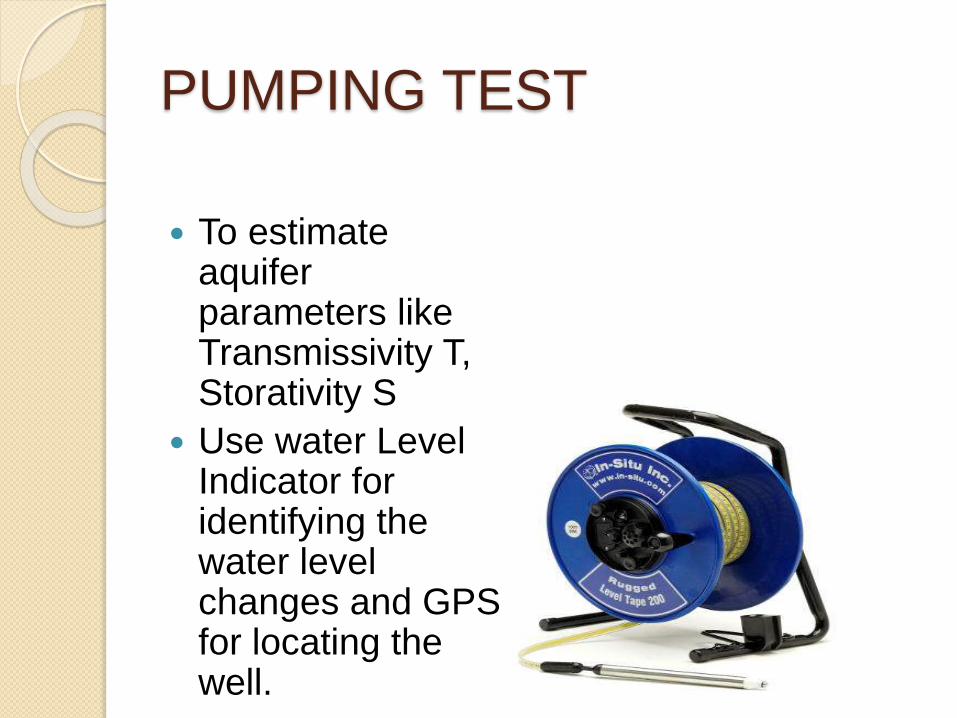
PUMPING TEST
To estimate aquifer parameters like Transmissivity T, Storativity S
Use water Level Indicator for identifying the water level changes and GPS for locating the well.
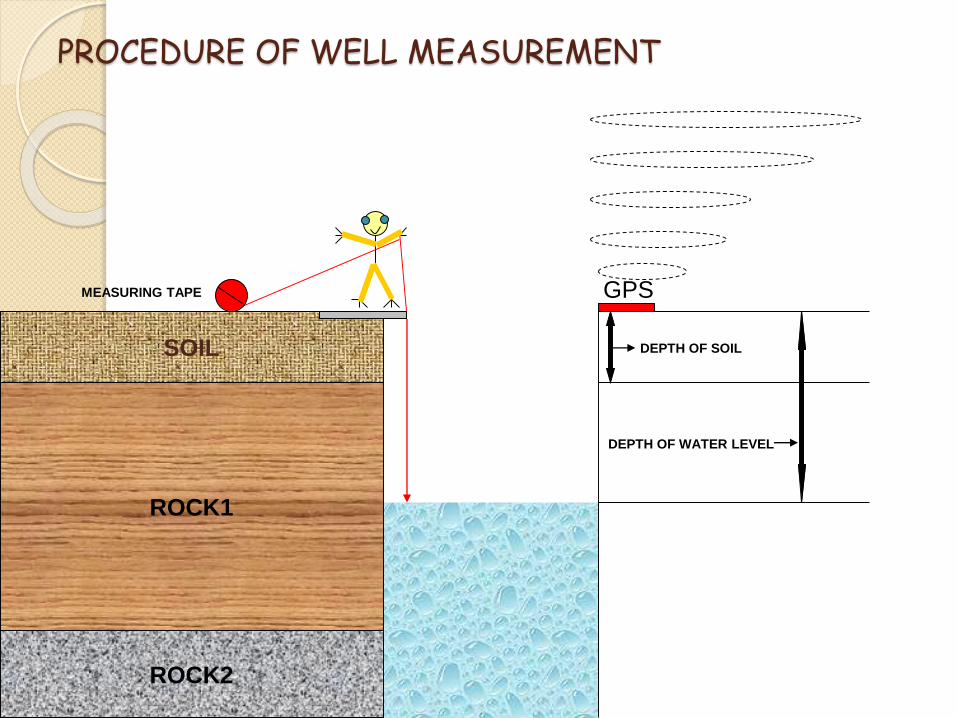
PROCEDURE OF WELL MEASUREMENT
SOIL
ROCK1
ROCK2
DEPTH OF SOIL
DEPTH OF WATER LEVEL
GPSMEASURING TAPE

PROCEDURE
Take GPS reading and
measure the radius of
the well
Measure the static
water level and start
pumping the well
Measure drawdown
and recovery in the
pumping well with time.
Relation among
discharge, drawdown
and time help to
determine aquifer
parameters.
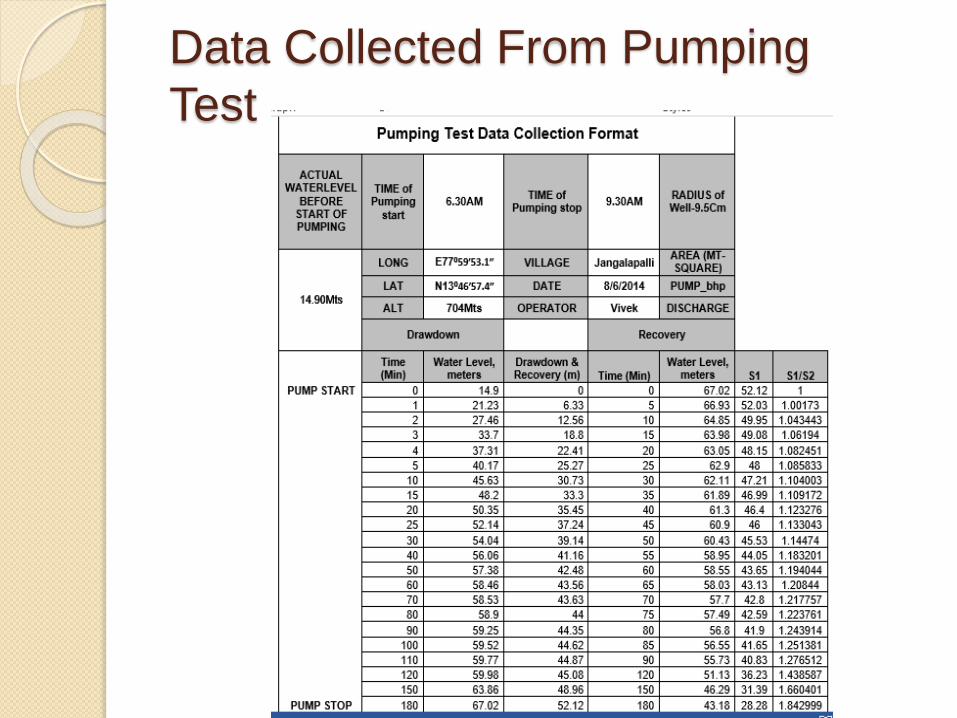
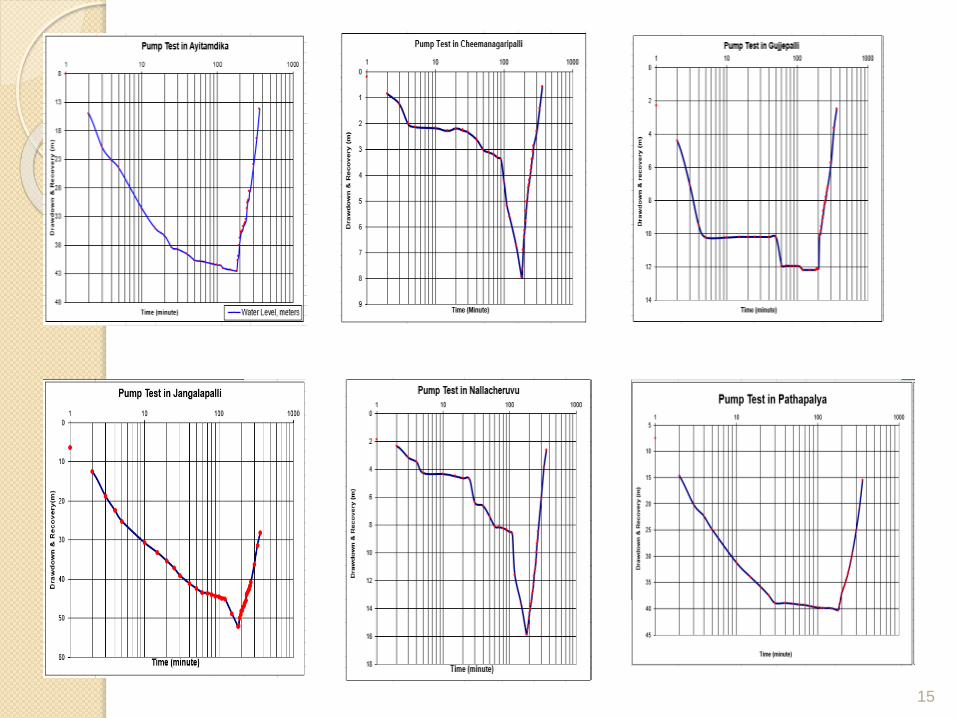
Data Collected From Pumping
Test
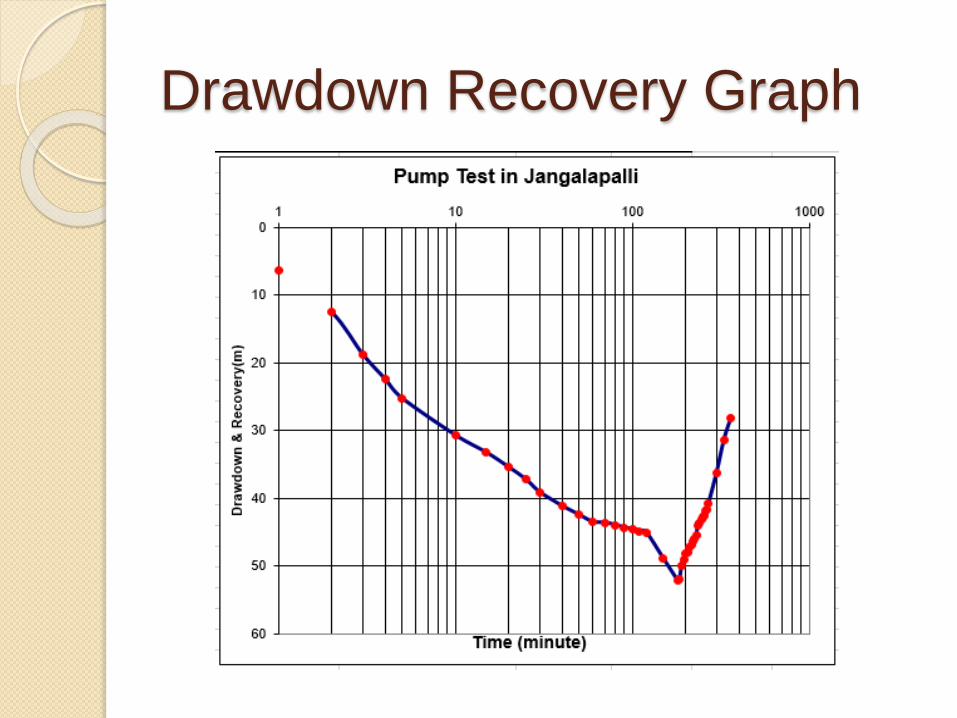
Drawdown Recovery Graph
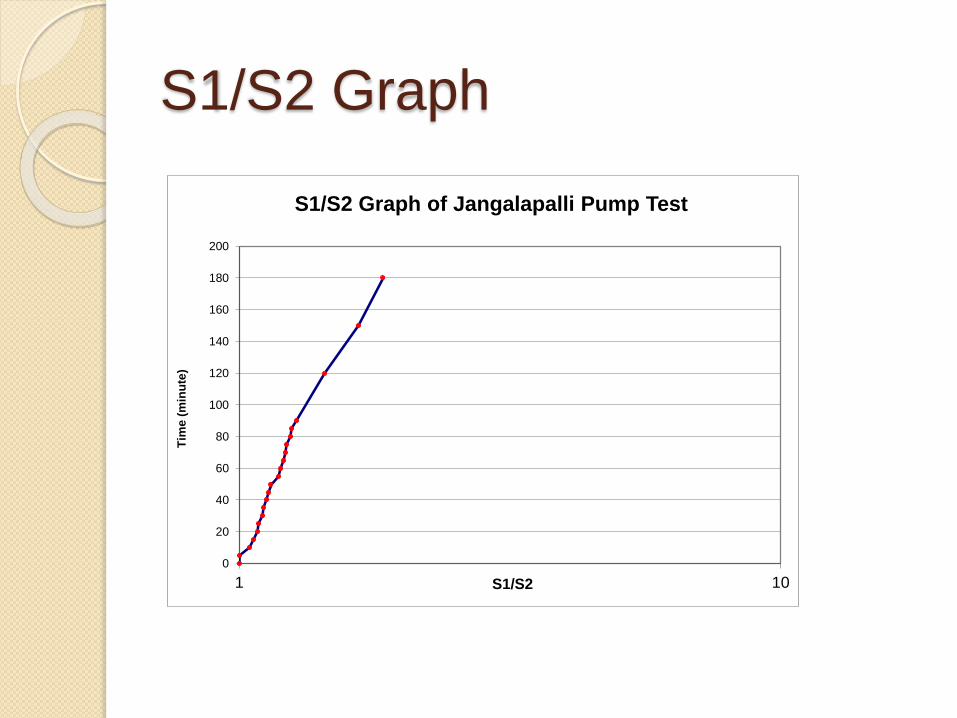
S1/S2 Graph
0
20
40
60
80
100
120
140
160
180
200
1 10
Tim
e (
min
ute
)
S1/S2
S1/S2 Graph of Jangalapalli Pump Test
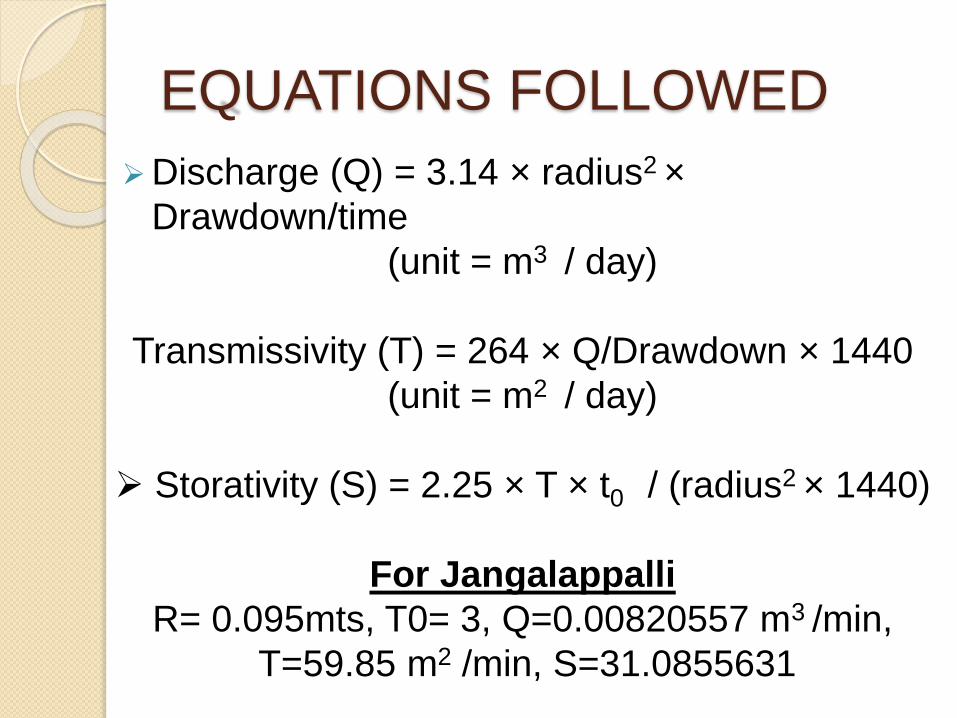
EQUATIONS FOLLOWED
Discharge (Q) = 3.14 × radius2 ×
Drawdown/time
(unit = m3 / day)
Transmissivity (T) = 264 × Q/Drawdown × 1440
(unit = m2 / day)
Storativity (S) = 2.25 × T × t0 / (radius2 × 1440)
For Jangalappalli
R= 0.095mts, T0= 3, Q=0.00820557 m3 /min,
T=59.85 m2 /min, S=31.0855631
15

PREPERATION OF WATER TABLE
MAP
GPS is used for locating well in the
field and static water level indicator is
for identifying the water level of the
well.
Put the collected data into the GIS
software
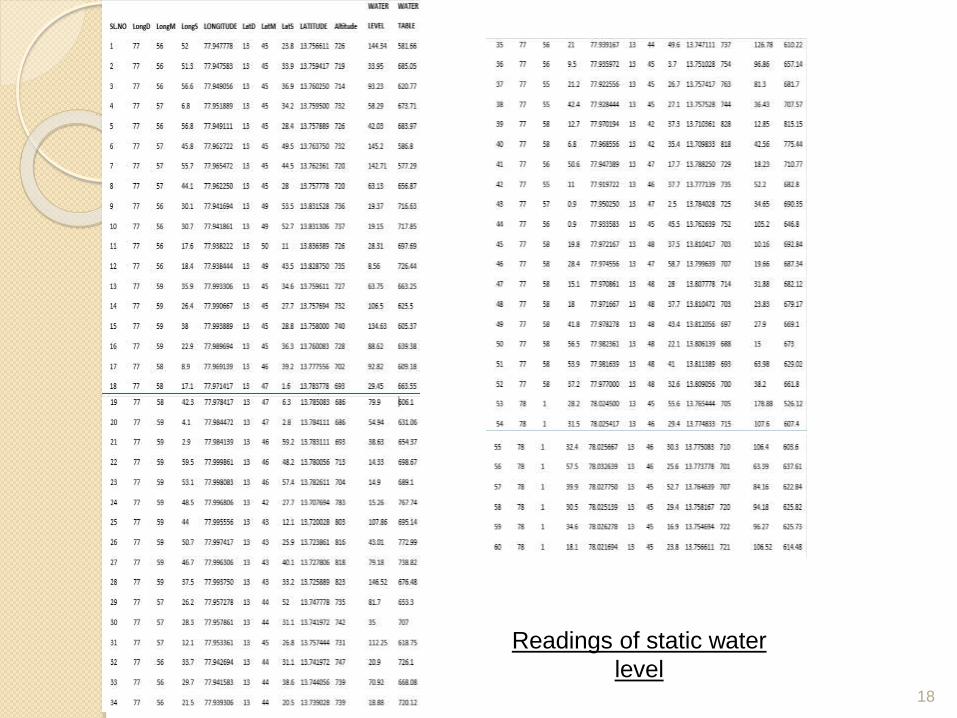
Readings of static water
level18
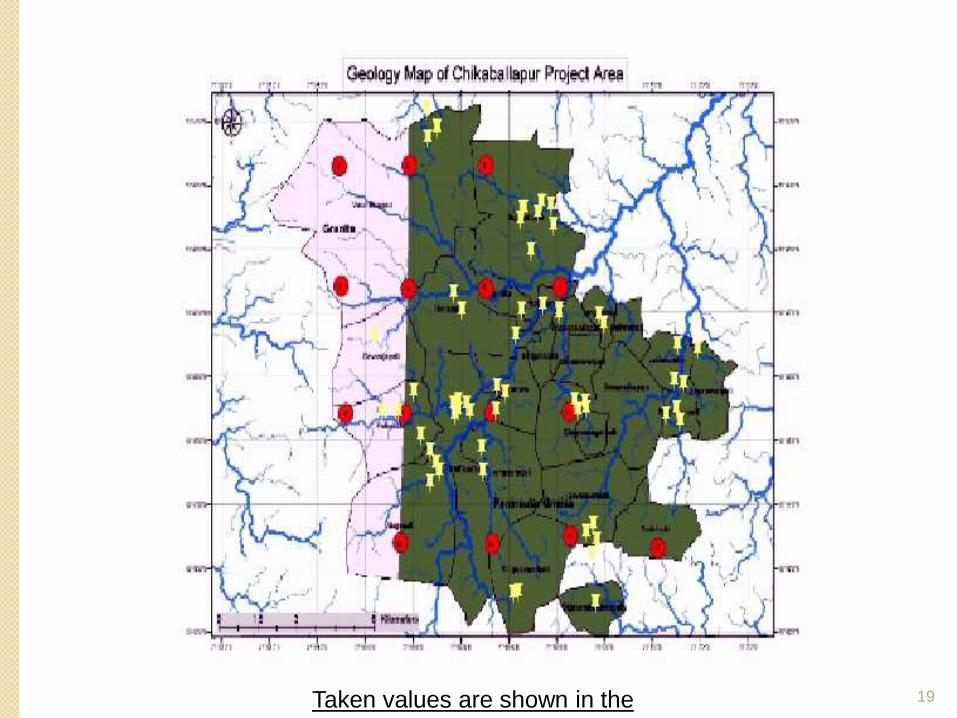
Taken values are shown in the
map
19
20
× × ×
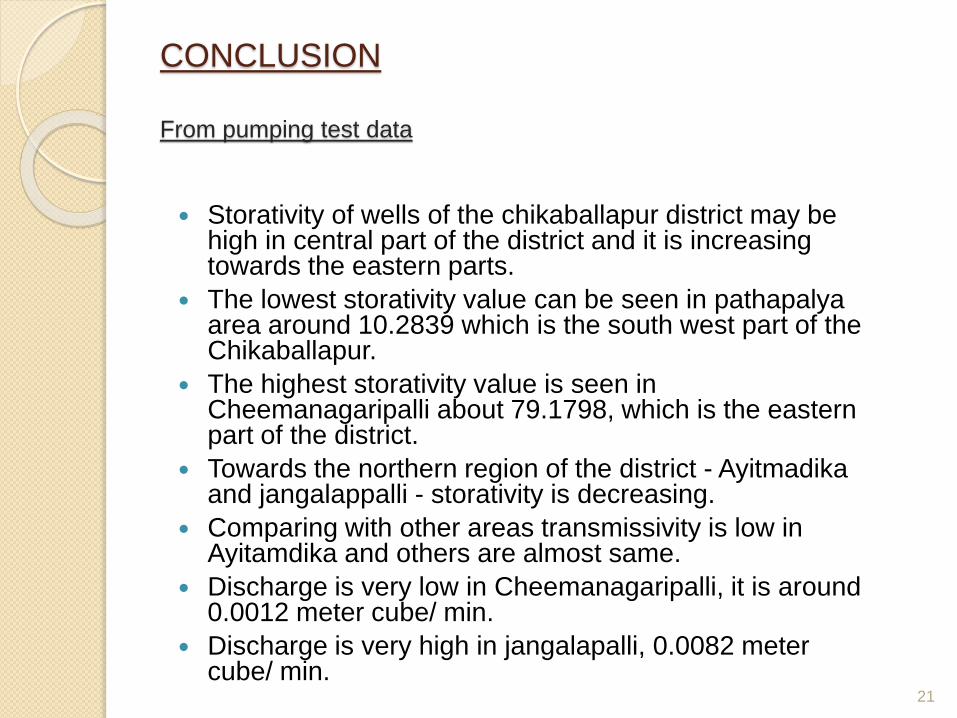
CONCLUSION
From pumping test data
Storativity of wells of the chikaballapur district may be high in central part of the district and it is increasing towards the eastern parts.
The lowest storativity value can be seen in pathapalya area around 10.2839 which is the south west part of the Chikaballapur.
The highest storativity value is seen in Cheemanagaripalli about 79.1798, which is the eastern part of the district.
Towards the northern region of the district - Ayitmadika and jangalappalli - storativity is decreasing.
Comparing with other areas transmissivity is low in Ayitamdika and others are almost same.
Discharge is very low in Cheemanagaripalli, it is around 0.0012 meter cube/ min.
Discharge is very high in jangalapalli, 0.0082 meter cube/ min.
21
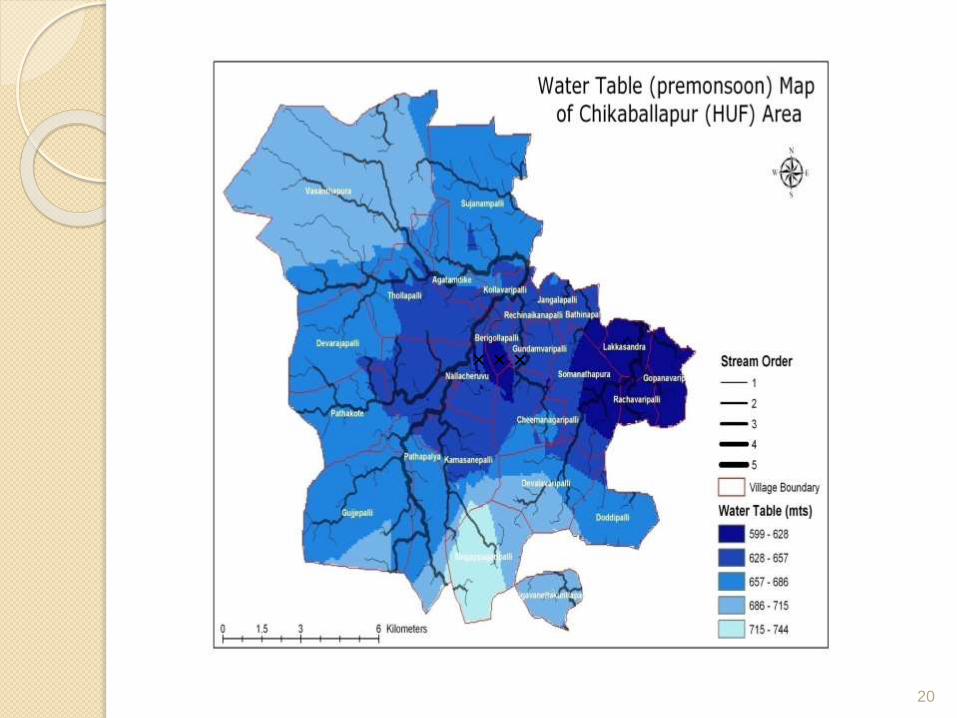
The amount of water is very high in the southern part of the Chikaballapur district.
In the singappagaripalli region the water table shows highest level as 715- 744 meters.
In the middle part and the eastern part of the map shows very lower level of water table.
Berigollapalli, Lakkasandra, Gopanavaripalli and Rachavaripalli villages shows water table between 599 and 628 meters.
22
FROM THE MAP

THANK YOU...
23
Related Documents