DOT/FAA/AR-01/63 Office of Aviation Research Washington, D.C. 20591 Ground and Flight Testing of a Boeing 737 Center Wing Fuel Tank Inerted With Nitrogen-Enriched Air Michael Burns William M. Cavage Federal Aviation Administration William J. Hughes Technical Center Airport and Aircraft Safety Research and Development Division Atlantic City International Airport, NJ 08405 August 2001 Final Report This document is available to the U.S. public Through the National Technical Information Service (NTIS), Springfield, Virginia 22161. U.S. Department of Transportation Federal Aviation Administration

Welcome message from author
This document is posted to help you gain knowledge. Please leave a comment to let me know what you think about it! Share it to your friends and learn new things together.
Transcript
DOT/FAA/AR-01/63 Office of Aviation Research Washington, D.C. 20591
Ground and Flight Testing of a Boeing 737 Center Wing Fuel Tank Inerted With Nitrogen-Enriched Air Michael Burns William M. Cavage Federal Aviation Administration William J. Hughes Technical Center Airport and Aircraft Safety Research and Development Division Atlantic City International Airport, NJ 08405 August 2001 Final Report This document is available to the U.S. public Through the National Technical Information Service (NTIS), Springfield, Virginia 22161.
U.S. Department of Transportation Federal Aviation Administration
NOTICE
This document is disseminated under the sponsorship of the U.S. Department of Transportation in the interest of information exchange. The United States Government assumes no liability for the contents or use thereof. The United States Government does not endorse products or manufacturers. Trade or manufacturer's names appear herein solely because they are considered essential to the objective of this report. This document does not constitute FAA certification policy. Consult your local FAA aircraft certification office as to its use. This report is available at the Federal Aviation Administration William J. Hughes Technical Center's Full-Text Technical Reports page: actlibrary.tc.faa.gov in Adobe Acrobat portable document format (PDF).
Technical Report Documentation Page 1. Report No. DOT/FAA/AR-01/63
2. Government Accession No. 3. Recipient's Catalog No.
4. Title and Subtitle GROUND AND FLIGHT TESTING OF A BOEING 737 CENTER WING
5. Report Date August 2001
FUEL TANK INERTED WITH NITROGEN-ENRICHED AIR 6. Performing Organization Code AAR-422
7. Author(s) Michael Burns and William M. Cavage
8. Performing Organization Report No. DOT/FAA/AR-01/63
9. Performing Organization Name and Address Federal Aviation Administration William J. Hughes Technical Center Airport and Aircraft Safety
10. Work Unit No. (TRAIS)
Research and Development Division Fire Safety Section, AAR-422 Atlantic City International Airport, NJ 08405
11. Contract or Grant No.
12. Sponsoring Agency Name and Address U.S. Department of Transportation Federal Aviation Administration
13. Type of Report and Period Covered
Final Report
Office of Aviation Research Washington, DC 20591
14. Sponsoring Agency Code
ANM-100 15. Supplementary Notes 16. Abstract A series of aircraft flight and ground tests were performed by the Federal Aviation Administration (FAA) and the Boeing Company to evaluate the effectiveness of ground-based inerting (GBI) as a means of reducing the flammability of fuel tanks in the commercial transport fleet. Boeing made available a model 737-700 for modification and testing. A nitrogen-enriched air (NEA) distribution manifold, designed, built, and installed by Boeing, allowed for deposit of the ground-based NEA into the center wing tank (CWT). The fuel tank was instrumented with gas sample tubing and thermocouples to allow for a measurement of fuel tank inerting and heating during the testing. The FAA developed an in-flight gas-sampling system, integrated with eight oxygen analyzers, to continuously monitor the ullage oxygen concentration at eight different locations. Other data such as fuel load, air speed, altitude, and similar flight parameters were made available from the aircraft data bus. A series of ten tests were performed (five flight, five ground) under different ground and flight conditions to demonstrate the ability of GBI to reduce fuel tank flammability. The CWT was inerted with NEA to approximately 8% oxygen concentration by volume for each test. The aircraft condition was then set (fuel load, wind condition, and flight condition), and the oxygen concentration in the CWT was continuously monitored. Results showed that, under quiescent conditions, the oxygen concentration in the fuel tank remained somewhat constant, keeping the CWT inert (below 10 to 12% oxygen by volume) for relatively long periods of time. However, due to the cross venting configuration of Boeing aircraft, certain wind conditions created cross venting within the CWT which allowed for significant increases in the oxygen concentration. Some flight conditions also contributed to cross venting and created high oxygen concentrations within the fuel tank. A modification to the vent system prevented cross flow within the CWT and created a significant increase in the amount of the time the tank remained below 10% oxygen, even at low to moderate fuel loads. 17. Key Words Nitrogen-enriched air, Ullage washing, Volume flow rate, Fuel tank inerting, Oxygen concentration, Total hydrocarbon
18. Distribution Statement This Document is available to the public through the National Technical Information Service (NTIS), Springfield, Virginia 22161
19. Security Classif. (of this report) Unclassified
20. Security Classif. (of this page) Unclassified
21. No. of Pages 34
22. Price
Form DOT F 1700.7 (8-72) Reproduction of completed page authorized
TABLE OF CONTENTS
Page EXECUTIVE SUMMARY vii 1. INTRODUCTION 1
1.1 Background 1 1.2 Ground-Based Inerting 1 1.3 Scope 2
2 EQUIPMENT AND PROCEDURES 2
2.1 Equipment 2 2.1.1 Test Specimen 2
2.1.1.1 Air Cycle Machines 3 2.1.1.2 Nitrogen-Enriched Air Distribution Manifold 3
2.1.2 Instrumentation and Data Acquisition 4
2.1.2.1 Oxygen Analysis System 4 2.1.2.2 Thermocouple Locations 7 2.1.2.3 Other Available Data 7 2.1.2.4 Data Acquisition System 7
2.1.3 Nitrogen-Enriched Air Generator 7
2.2 Test Procedures 9
2.2.1 Ground Testing 9 2.2.2 Flight Testing 9
3. ANALYSIS 10
3.1 Data Analysis 10 3.1.1 Time 10 3.1.2 Nitrogen-Enriched Air Oxygen Concentration 11
3.2 Inerting Solutions 11
3.2.1 Exact Solution 11 3.2.2 Empirical Solution 12
iii
4. DISCUSSION OF RESULTS 12
4.1 Ground Testing 12 4.1.1 Center Wing Tank Ullage Washing 13 4.1.2 Wind Effects 16
4.1.3 Fuel Load Effects 16
4.2 Flight Testing 20 4.2.1 Center Wing Tank Cross-Venting Effect 20 4.2.2 Fuel Effects at Altitude 22
5. SUMMARY 27
6. REFERENCES 27
LIST OF FIGURES Figure Page 1 Boeing 737-700 Aircraft 3
2 Boeing 737-700 CWT Plan View 3
3 Schematic of Onboard Oxygen Analysis System 5
4 Industrial NEA Generator Used for the GBI Testing 8
5 Flow-Regulating Cart Used to Dispense NEA for the GBI Testing 8
6 Illustration of Inflow Outflow Model With Perfect Mixing 11
7 Ground Test 1�Ullage Washing Average Oxygen Concentration Data 14
8 Ground Test 1�Nondimenstional Ullage-Washing Data 14
9 Ground Test 2�Ullage Washing Average Oxygen Concentration Data 15
10 Ground Test 2�Nondimenstional Ullage-Washing Data 15
11 Calm Winds CWT NEA Dispersion Data 17
12 Simulated High Winds CWT NEA Dispersion Average Bay Data 17
iv
13 Simulated High Winds CWT NEA Dispersion Individual Port Data 18
14 Comparison of NEA Dispersion for Two Wind Conditions 18
15 Twenty-Percent Fuel Load NEA Dispersion Data�Fueled After Inerting 19
16 Eighty-Percent Fuel Load NEA Dispersion Data� Fueled After Inerting 19
17 Zero Fuel Load Flight Test NEA Dispersion Data With Cross-Venting Configuration 21
18 Zero Fuel Load Flight Test NEA Dispersion Data Without Cross Venting 21
19 Average CWT O2 Concentration Increase Comparison Plot for Both Cross-Vented and No Cross-Flow Flights 22
20 Twenty-Percent Fuel Load Flight Test NEA Dispersion Data Without Cross Venting 23
21 Forty-Percent Fuel Load Flight Test NEA Dispersion Data Without Cross Venting 24
22 Eighty-Percent Fuel Load Flight Test NEA Dispersion Data Without Cross Venting 24
23 Average CWT O2 Concentration Increase Comparison Plot for Different Fuel Loads for Entire Flight 25
24 Change in Average CWT O2 Concentration Comparison Plot for Different Fuel Loads During Cruise 26
25 Change in Average CWT O2 Concentration Comparison Plot for Different Fuel Loads During Climb 26
LIST OF TABLES
Table Page 1 Summary of Ground Tests 9 2 Summary of Flight Tests 10
v/vi
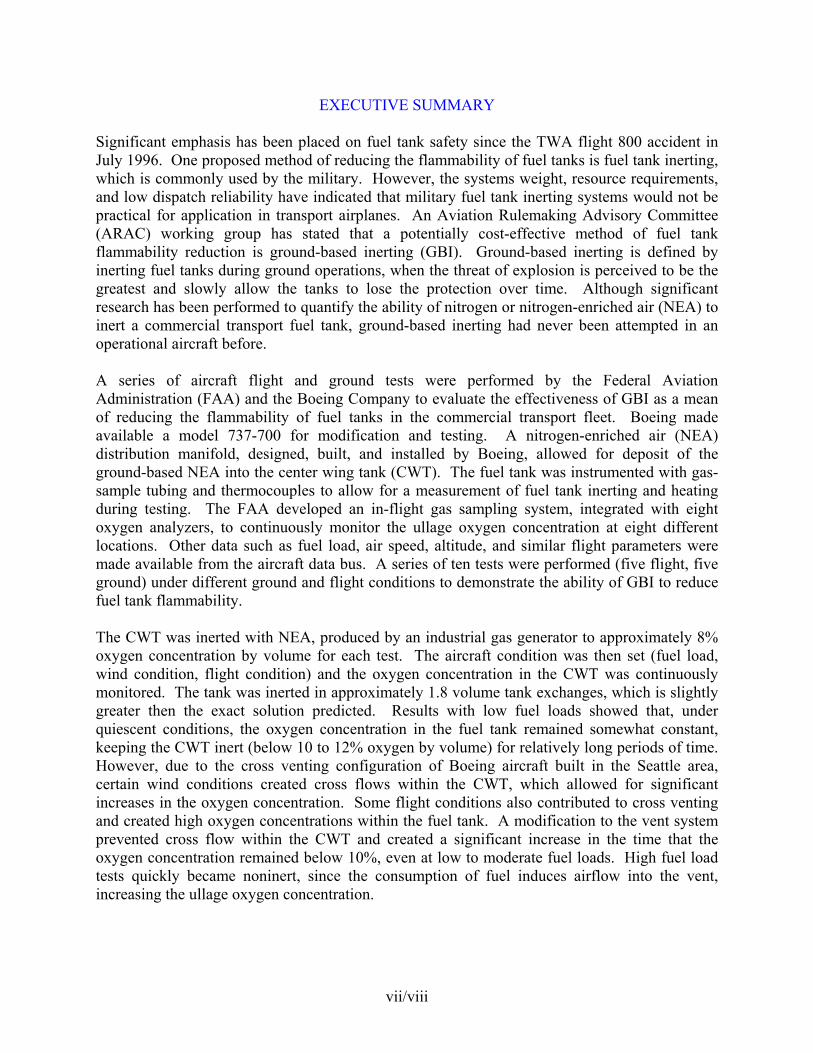
EXECUTIVE SUMMARY Significant emphasis has been placed on fuel tank safety since the TWA flight 800 accident in July 1996. One proposed method of reducing the flammability of fuel tanks is fuel tank inerting, which is commonly used by the military. However, the systems weight, resource requirements, and low dispatch reliability have indicated that military fuel tank inerting systems would not be practical for application in transport airplanes. An Aviation Rulemaking Advisory Committee (ARAC) working group has stated that a potentially cost-effective method of fuel tank flammability reduction is ground-based inerting (GBI). Ground-based inerting is defined by inerting fuel tanks during ground operations, when the threat of explosion is perceived to be the greatest and slowly allow the tanks to lose the protection over time. Although significant research has been performed to quantify the ability of nitrogen or nitrogen-enriched air (NEA) to inert a commercial transport fuel tank, ground-based inerting had never been attempted in an operational aircraft before. A series of aircraft flight and ground tests were performed by the Federal Aviation Administration (FAA) and the Boeing Company to evaluate the effectiveness of GBI as a mean of reducing the flammability of fuel tanks in the commercial transport fleet. Boeing made available a model 737-700 for modification and testing. A nitrogen-enriched air (NEA) distribution manifold, designed, built, and installed by Boeing, allowed for deposit of the ground-based NEA into the center wing tank (CWT). The fuel tank was instrumented with gas-sample tubing and thermocouples to allow for a measurement of fuel tank inerting and heating during testing. The FAA developed an in-flight gas sampling system, integrated with eight oxygen analyzers, to continuously monitor the ullage oxygen concentration at eight different locations. Other data such as fuel load, air speed, altitude, and similar flight parameters were made available from the aircraft data bus. A series of ten tests were performed (five flight, five ground) under different ground and flight conditions to demonstrate the ability of GBI to reduce fuel tank flammability. The CWT was inerted with NEA, produced by an industrial gas generator to approximately 8% oxygen concentration by volume for each test. The aircraft condition was then set (fuel load, wind condition, flight condition) and the oxygen concentration in the CWT was continuously monitored. The tank was inerted in approximately 1.8 volume tank exchanges, which is slightly greater then the exact solution predicted. Results with low fuel loads showed that, under quiescent conditions, the oxygen concentration in the fuel tank remained somewhat constant, keeping the CWT inert (below 10 to 12% oxygen by volume) for relatively long periods of time. However, due to the cross venting configuration of Boeing aircraft built in the Seattle area, certain wind conditions created cross flows within the CWT, which allowed for significant increases in the oxygen concentration. Some flight conditions also contributed to cross venting and created high oxygen concentrations within the fuel tank. A modification to the vent system prevented cross flow within the CWT and created a significant increase in the time that the oxygen concentration remained below 10%, even at low to moderate fuel loads. High fuel load tests quickly became noninert, since the consumption of fuel induces airflow into the vent, increasing the ullage oxygen concentration.
vii/viii
1. INTRODUCTION.
1.1 BACKGROUND.
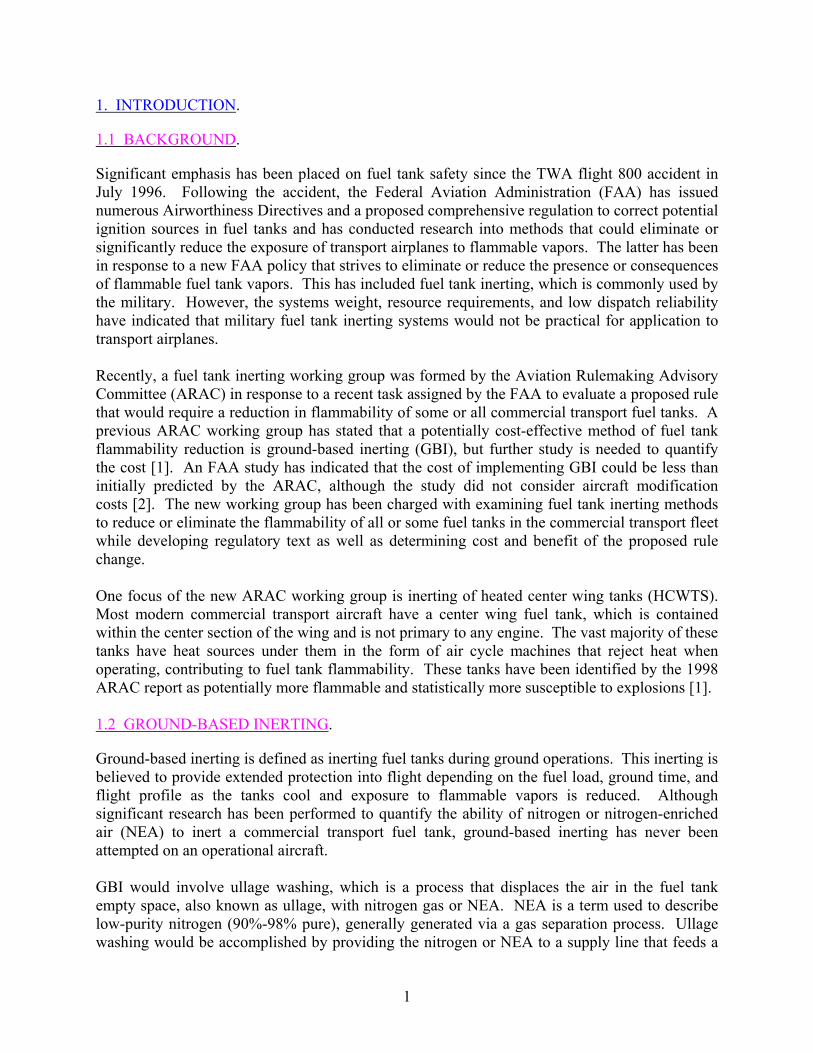
Significant emphasis has been placed on fuel tank safety since the TWA flight 800 accident in July 1996. Following the accident, the Federal Aviation Administration (FAA) has issued numerous Airworthiness Directives and a proposed comprehensive regulation to correct potential ignition sources in fuel tanks and has conducted research into methods that could eliminate or significantly reduce the exposure of transport airplanes to flammable vapors. The latter has been in response to a new FAA policy that strives to eliminate or reduce the presence or consequences of flammable fuel tank vapors. This has included fuel tank inerting, which is commonly used by the military. However, the systems weight, resource requirements, and low dispatch reliability have indicated that military fuel tank inerting systems would not be practical for application to transport airplanes. Recently, a fuel tank inerting working group was formed by the Aviation Rulemaking Advisory Committee (ARAC) in response to a recent task assigned by the FAA to evaluate a proposed rule that would require a reduction in flammability of some or all commercial transport fuel tanks. A previous ARAC working group has stated that a potentially cost-effective method of fuel tank flammability reduction is ground-based inerting (GBI), but further study is needed to quantify the cost [1]. An FAA study has indicated that the cost of implementing GBI could be less than initially predicted by the ARAC, although the study did not consider aircraft modification costs [2]. The new working group has been charged with examining fuel tank inerting methods to reduce or eliminate the flammability of all or some fuel tanks in the commercial transport fleet while developing regulatory text as well as determining cost and benefit of the proposed rule change. One focus of the new ARAC working group is inerting of heated center wing tanks (HCWTS). Most modern commercial transport aircraft have a center wing fuel tank, which is contained within the center section of the wing and is not primary to any engine. The vast majority of these tanks have heat sources under them in the form of air cycle machines that reject heat when operating, contributing to fuel tank flammability. These tanks have been identified by the 1998 ARAC report as potentially more flammable and statistically more susceptible to explosions [1]. 1.2 GROUND-BASED INERTING.
Ground-based inerting is defined as inerting fuel tanks during ground operations. This inerting is believed to provide extended protection into flight depending on the fuel load, ground time, and flight profile as the tanks cool and exposure to flammable vapors is reduced. Although significant research has been performed to quantify the ability of nitrogen or nitrogen-enriched air (NEA) to inert a commercial transport fuel tank, ground-based inerting has never been attempted on an operational aircraft. GBI would involve ullage washing, which is a process that displaces the air in the fuel tank empty space, also known as ullage, with nitrogen gas or NEA. NEA is a term used to describe low-purity nitrogen (90%-98% pure), generally generated via a gas separation process. Ullage washing would be accomplished by providing the nitrogen or NEA to a supply line that feeds a
1
simple fuel tank inerting manifold. Air, and particularly oxygen, readily dissolve in fuel. When a commercial transport airplane takes off after fueling, the resulting decrease in fuel tank pressure allows some of the air to escape solution and enter the ullage space of the fuel tank. Since oxygen dissolves more readily than nitrogen in fuel, this can increase the oxygen concentration of the fuel tank significantly, although the total amount of gas evolving from the fuel is small. The resultant effect is higher ullage oxygen concentrations for both inerted and noninerted fuel tanks, particularly for tanks that are mostly full. 1.3 SCOPE.
This report documents a series of tests performed in conjunction with the Boeing Company on a model 737-700 designed to demonstrate the ability of GBI to inert and continuously provide protection to a commercial transport airplane center wing fuel tank (CWT). The tank was inerted with NEA generated on-site via a gas separation process, using hollow fiber membrane (HFM) technology [3]. The fuel tank was instrumented to continuously monitor the oxygen concentration at eight different locations in the tank. Additional instrumentation allowed for correlation of parameters with the increase in oxygen concentration in the CWT. Five ground and five flight tests were performed to highlight the effects of high winds, fuel load, ascent, and descent as well as the cross-venting configuration. 2. EQUIPMENT AND PROCEDURES.
The testing was performed in conjunction with the Boeing Company, using a production aircraft. Boeing personnel provided all aircraft engineering, modification, support personnel, and equipment. The primary responsibility of the FAA was to develop a test plan with the Boeing Company and to provide the instrumentation to measure oxygen concentration at eight locations in the CWT throughout the pressure and temperature regime of the testing. 2.1 EQUIPMENT.
2.1.1 Test Specimen.
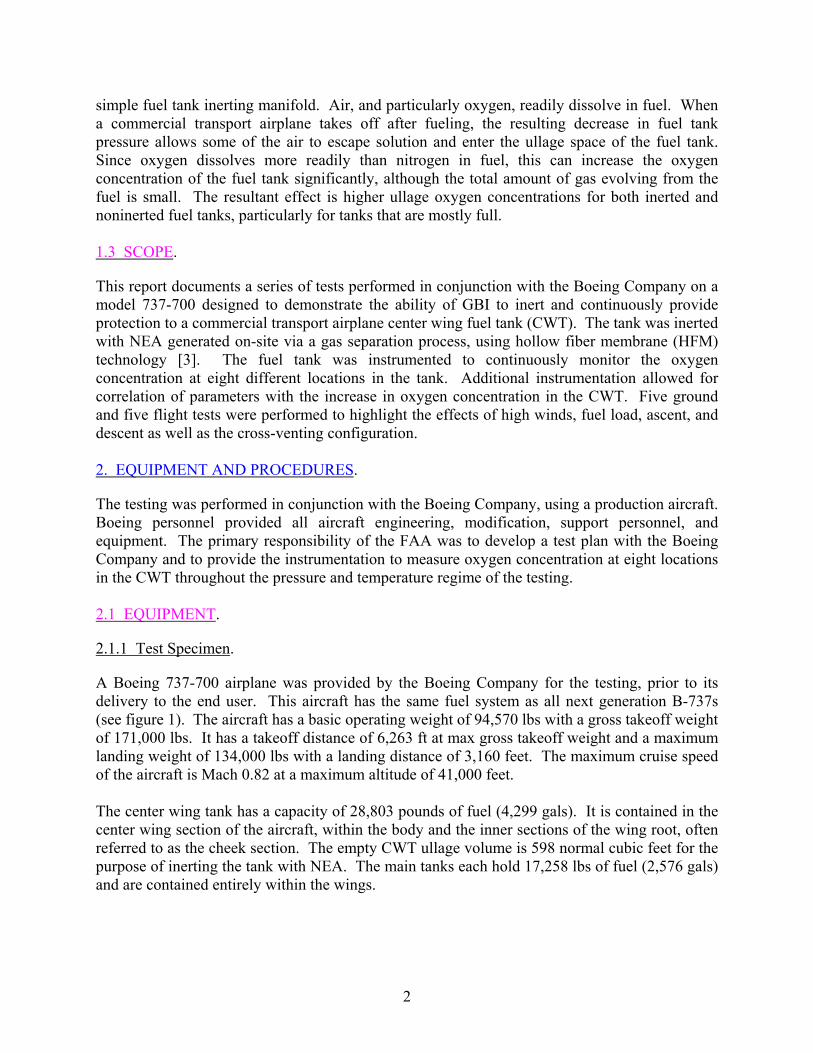
A Boeing 737-700 airplane was provided by the Boeing Company for the testing, prior to its delivery to the end user. This aircraft has the same fuel system as all next generation B-737s (see figure 1). The aircraft has a basic operating weight of 94,570 lbs with a gross takeoff weight of 171,000 lbs. It has a takeoff distance of 6,263 ft at max gross takeoff weight and a maximum landing weight of 134,000 lbs with a landing distance of 3,160 feet. The maximum cruise speed of the aircraft is Mach 0.82 at a maximum altitude of 41,000 feet. The center wing tank has a capacity of 28,803 pounds of fuel (4,299 gals). It is contained in the center wing section of the aircraft, within the body and the inner sections of the wing root, often referred to as the cheek section. The empty CWT ullage volume is 598 normal cubic feet for the purpose of inerting the tank with NEA. The main tanks each hold 17,258 lbs of fuel (2,576 gals) and are contained entirely within the wings.
2
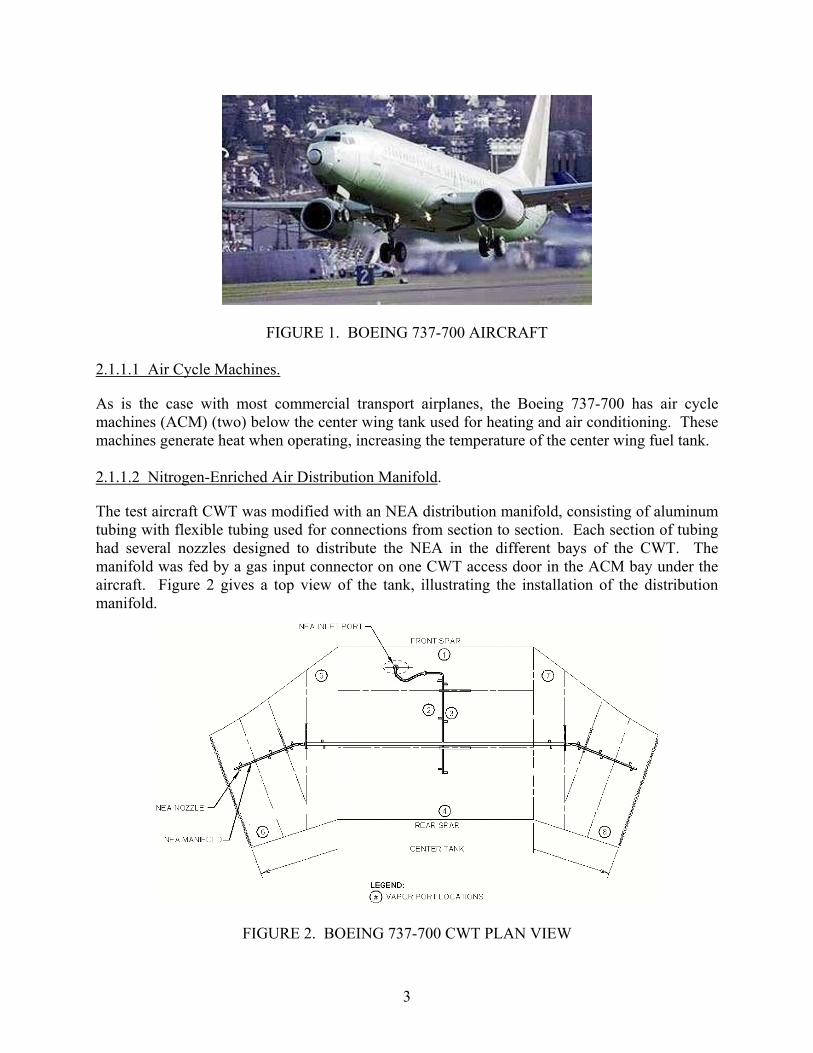
FIGURE 1. BOEING 737-700 AIRCRAFT 2.1.1.1 Air Cycle Machines.
As is the case with most commercial transport airplanes, the Boeing 737-700 has air cycle machines (ACM) (two) below the center wing tank used for heating and air conditioning. These machines generate heat when operating, increasing the temperature of the center wing fuel tank. 2.1.1.2 Nitrogen-Enriched Air Distribution Manifold.
The test aircraft CWT was modified with an NEA distribution manifold, consisting of aluminum tubing with flexible tubing used for connections from section to section. Each section of tubing had several nozzles designed to distribute the NEA in the different bays of the CWT. The manifold was fed by a gas input connector on one CWT access door in the ACM bay under the aircraft. Figure 2 gives a top view of the tank, illustrating the installation of the distribution manifold.
FIGURE 2. BOEING 737-700 CWT PLAN VIEW
3
2.1.2 Instrumentation and Data Acquisition.
The Boeing Company provided the data acquisition system and most instrumentation. This minimized time for test setup and configuration as the Boeing personnel were familiar with this test equipment. FAA, Fire Safety Section personnel at the William J. Hughes Technical Center provided the eight-channel onboard oxygen analysis system (OBOAS). 2.1.2.1 Oxygen Analysis System.
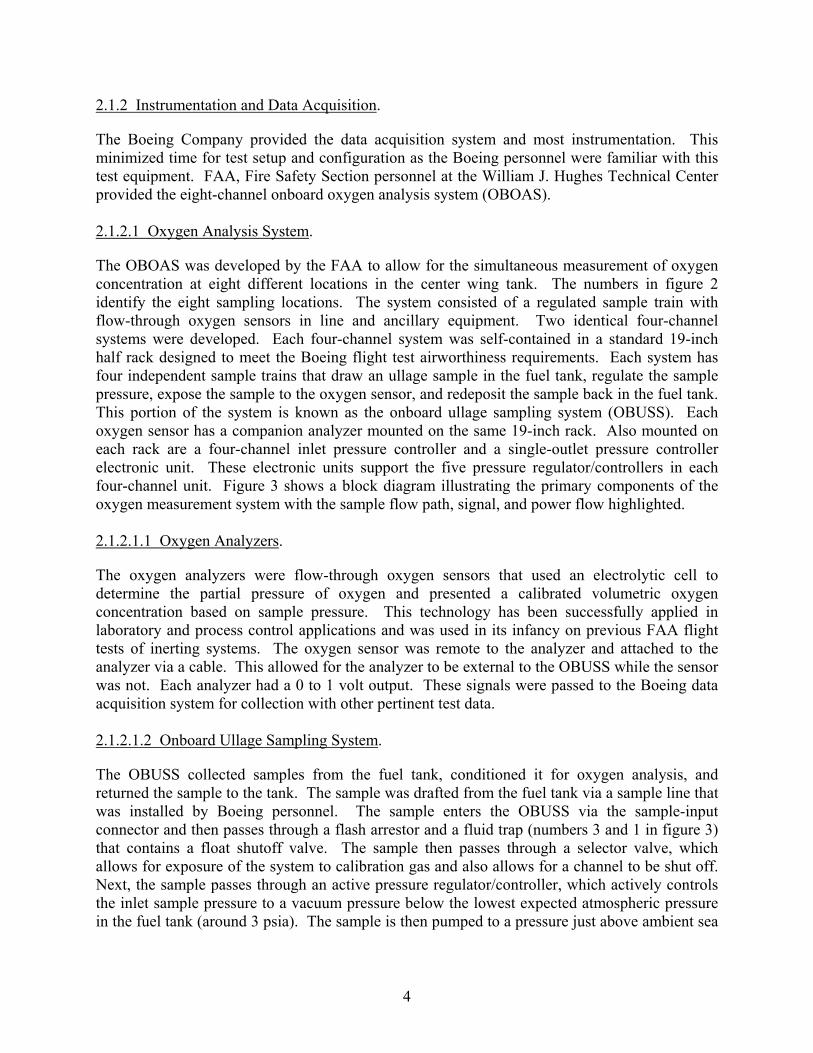
The OBOAS was developed by the FAA to allow for the simultaneous measurement of oxygen concentration at eight different locations in the center wing tank. The numbers in figure 2 identify the eight sampling locations. The system consisted of a regulated sample train with flow-through oxygen sensors in line and ancillary equipment. Two identical four-channel systems were developed. Each four-channel system was self-contained in a standard 19-inch half rack designed to meet the Boeing flight test airworthiness requirements. Each system has four independent sample trains that draw an ullage sample in the fuel tank, regulate the sample pressure, expose the sample to the oxygen sensor, and redeposit the sample back in the fuel tank. This portion of the system is known as the onboard ullage sampling system (OBUSS). Each oxygen sensor has a companion analyzer mounted on the same 19-inch rack. Also mounted on each rack are a four-channel inlet pressure controller and a single-outlet pressure controller electronic unit. These electronic units support the five pressure regulator/controllers in each four-channel unit. Figure 3 shows a block diagram illustrating the primary components of the oxygen measurement system with the sample flow path, signal, and power flow highlighted. 2.1.2.1.1 Oxygen Analyzers.
The oxygen analyzers were flow-through oxygen sensors that used an electrolytic cell to determine the partial pressure of oxygen and presented a calibrated volumetric oxygen concentration based on sample pressure. This technology has been successfully applied in laboratory and process control applications and was used in its infancy on previous FAA flight tests of inerting systems. The oxygen sensor was remote to the analyzer and attached to the analyzer via a cable. This allowed for the analyzer to be external to the OBUSS while the sensor was not. Each analyzer had a 0 to 1 volt output. These signals were passed to the Boeing data acquisition system for collection with other pertinent test data. 2.1.2.1.2 Onboard Ullage Sampling System.
The OBUSS collected samples from the fuel tank, conditioned it for oxygen analysis, and returned the sample to the tank. The sample was drafted from the fuel tank via a sample line that was installed by Boeing personnel. The sample enters the OBUSS via the sample-input connector and then passes through a flash arrestor and a fluid trap (numbers 3 and 1 in figure 3) that contains a float shutoff valve. The sample then passes through a selector valve, which allows for exposure of the system to calibration gas and also allows for a channel to be shut off. Next, the sample passes through an active pressure regulator/controller, which actively controls the inlet sample pressure to a vacuum pressure below the lowest expected atmospheric pressure in the fuel tank (around 3 psia). The sample is then pumped to a pressure just above ambient sea
4
5
FI
GU
RE
3. S
CH
EMA
TIC
OF
ON
BO
AR
D O
XY
GEN
AN
ALY
SIS
SYST
EM
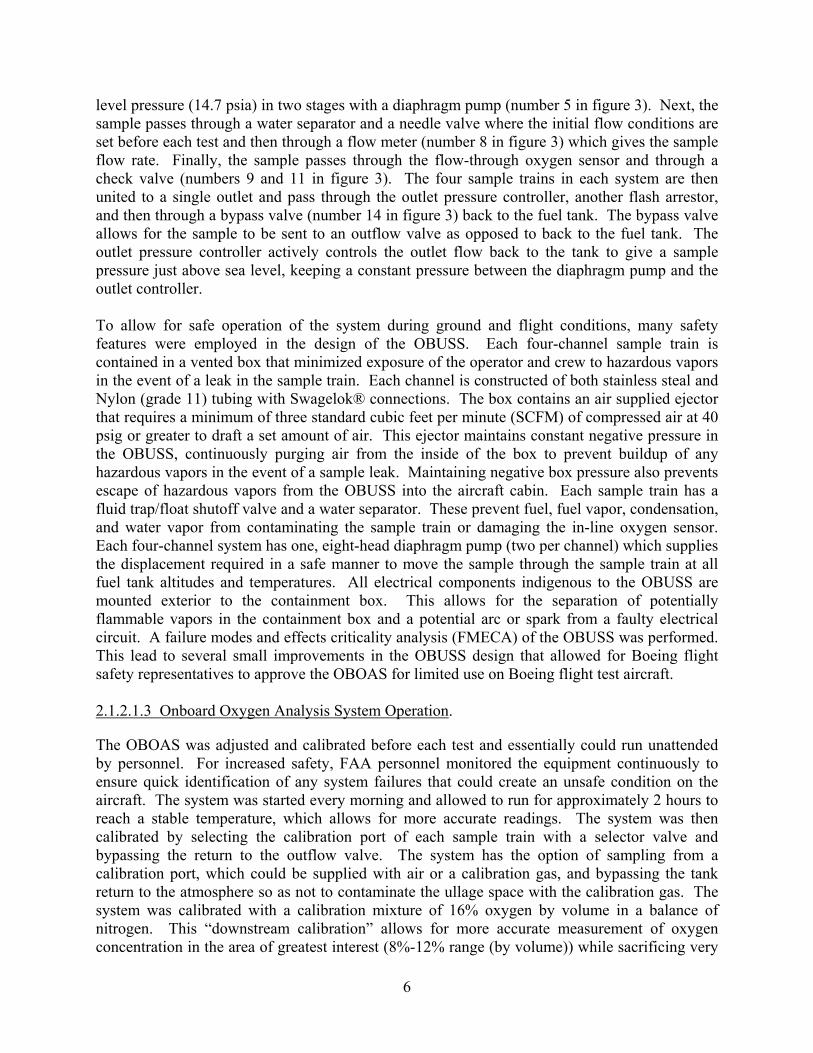
level pressure (14.7 psia) in two stages with a diaphragm pump (number 5 in figure 3). Next, the sample passes through a water separator and a needle valve where the initial flow conditions are set before each test and then through a flow meter (number 8 in figure 3) which gives the sample flow rate. Finally, the sample passes through the flow-through oxygen sensor and through a check valve (numbers 9 and 11 in figure 3). The four sample trains in each system are then united to a single outlet and pass through the outlet pressure controller, another flash arrestor, and then through a bypass valve (number 14 in figure 3) back to the fuel tank. The bypass valve allows for the sample to be sent to an outflow valve as opposed to back to the fuel tank. The outlet pressure controller actively controls the outlet flow back to the tank to give a sample pressure just above sea level, keeping a constant pressure between the diaphragm pump and the outlet controller. To allow for safe operation of the system during ground and flight conditions, many safety features were employed in the design of the OBUSS. Each four-channel sample train is contained in a vented box that minimized exposure of the operator and crew to hazardous vapors in the event of a leak in the sample train. Each channel is constructed of both stainless steal and Nylon (grade 11) tubing with Swagelok® connections. The box contains an air supplied ejector that requires a minimum of three standard cubic feet per minute (SCFM) of compressed air at 40 psig or greater to draft a set amount of air. This ejector maintains constant negative pressure in the OBUSS, continuously purging air from the inside of the box to prevent buildup of any hazardous vapors in the event of a sample leak. Maintaining negative box pressure also prevents escape of hazardous vapors from the OBUSS into the aircraft cabin. Each sample train has a fluid trap/float shutoff valve and a water separator. These prevent fuel, fuel vapor, condensation, and water vapor from contaminating the sample train or damaging the in-line oxygen sensor. Each four-channel system has one, eight-head diaphragm pump (two per channel) which supplies the displacement required in a safe manner to move the sample through the sample train at all fuel tank altitudes and temperatures. All electrical components indigenous to the OBUSS are mounted exterior to the containment box. This allows for the separation of potentially flammable vapors in the containment box and a potential arc or spark from a faulty electrical circuit. A failure modes and effects criticality analysis (FMECA) of the OBUSS was performed. This lead to several small improvements in the OBUSS design that allowed for Boeing flight safety representatives to approve the OBOAS for limited use on Boeing flight test aircraft. 2.1.2.1.3 Onboard Oxygen Analysis System Operation.
The OBOAS was adjusted and calibrated before each test and essentially could run unattended by personnel. For increased safety, FAA personnel monitored the equipment continuously to ensure quick identification of any system failures that could create an unsafe condition on the aircraft. The system was started every morning and allowed to run for approximately 2 hours to reach a stable temperature, which allows for more accurate readings. The system was then calibrated by selecting the calibration port of each sample train with a selector valve and bypassing the return to the outflow valve. The system has the option of sampling from a calibration port, which could be supplied with air or a calibration gas, and bypassing the tank return to the atmosphere so as not to contaminate the ullage space with the calibration gas. The system was calibrated with a calibration mixture of 16% oxygen by volume in a balance of nitrogen. This �downstream calibration� allows for more accurate measurement of oxygen concentration in the area of greatest interest (8%-12% range (by volume)) while sacrificing very
6
little accuracy at ambient (20.9%). Each sample train selector valve was then turned to sample input and outflow was redirected back to the tank. 2.1.2.2 Thermocouple Locations.
Thermocouples were located in and around the CWT to allow for measurement of temperature. Temperature was measured at each sample location to provide knowledge of the flammability of the sample location. The outside air temperature was also measured to provide information on the external aircraft conditions. 2.1.2.3 Other Available Data.
Data from the aircraft data bus was made available for purposes of the testing. Ground tests used fuel quantity to verify the test condition fuel load. Flight tests also stored airspeed, altitude, and Mach number in addition to heading data that was deemed useful in determining flight conditions. During ground testing, a mobile ground weather station was used to obtain temperature, wind speed, and wind direction. 2.1.2.4 Data Acquisition System.
The data acquisition system used was designed, built, and certified by Boeing for the purposes of flight test and evaluation. It was a multiplexed data system that uses data modulation to create a data stream for storage or discrimination. The system was integrated with the aircraft ARINC bus to obtain aircraft data in parallel with all installed sensors. The data was stored on tape and also displayed via an analysis computer that discriminated the essential signals to allow for real-time display of data. The oxygen analyzer output was digitally filtered before being stored on tape to reduce high frequency noise evident in the signal. The source and path of this noise is still unknown. 2.1.3 Nitrogen-Enriched Air Generator.
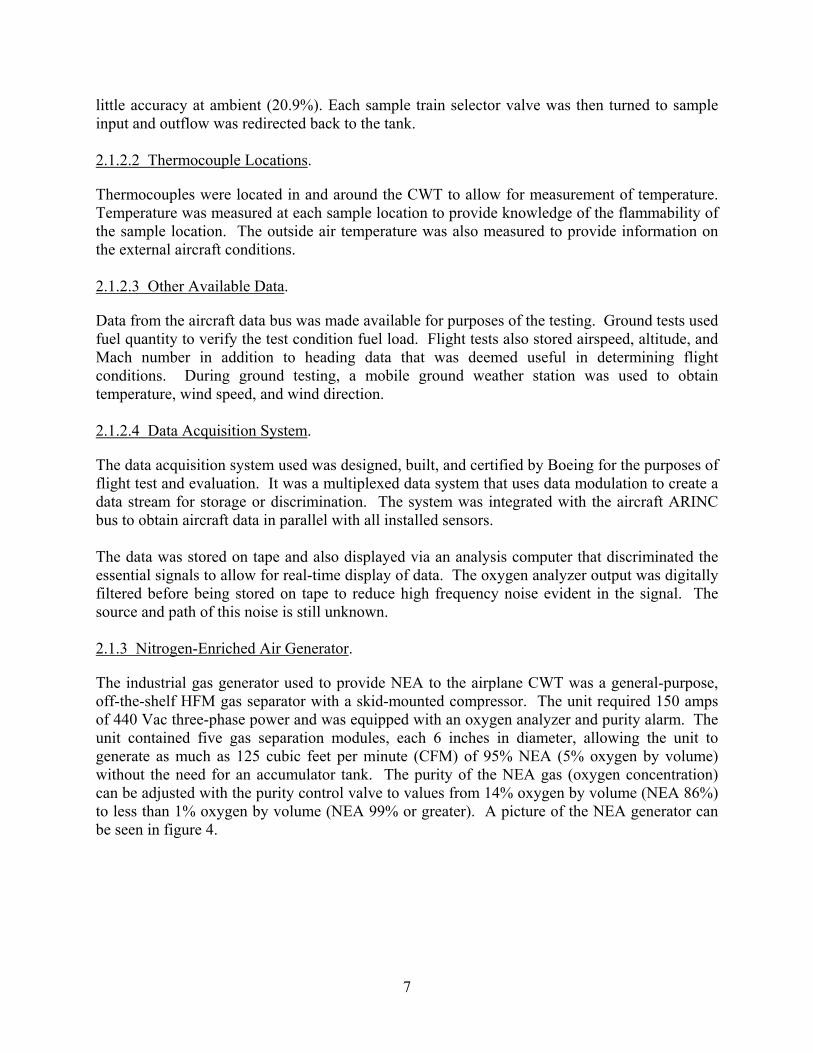
The industrial gas generator used to provide NEA to the airplane CWT was a general-purpose, off-the-shelf HFM gas separator with a skid-mounted compressor. The unit required 150 amps of 440 Vac three-phase power and was equipped with an oxygen analyzer and purity alarm. The unit contained five gas separation modules, each 6 inches in diameter, allowing the unit to generate as much as 125 cubic feet per minute (CFM) of 95% NEA (5% oxygen by volume) without the need for an accumulator tank. The purity of the NEA gas (oxygen concentration) can be adjusted with the purity control valve to values from 14% oxygen by volume (NEA 86%) to less than 1% oxygen by volume (NEA 99% or greater). A picture of the NEA generator can be seen in figure 4.
7
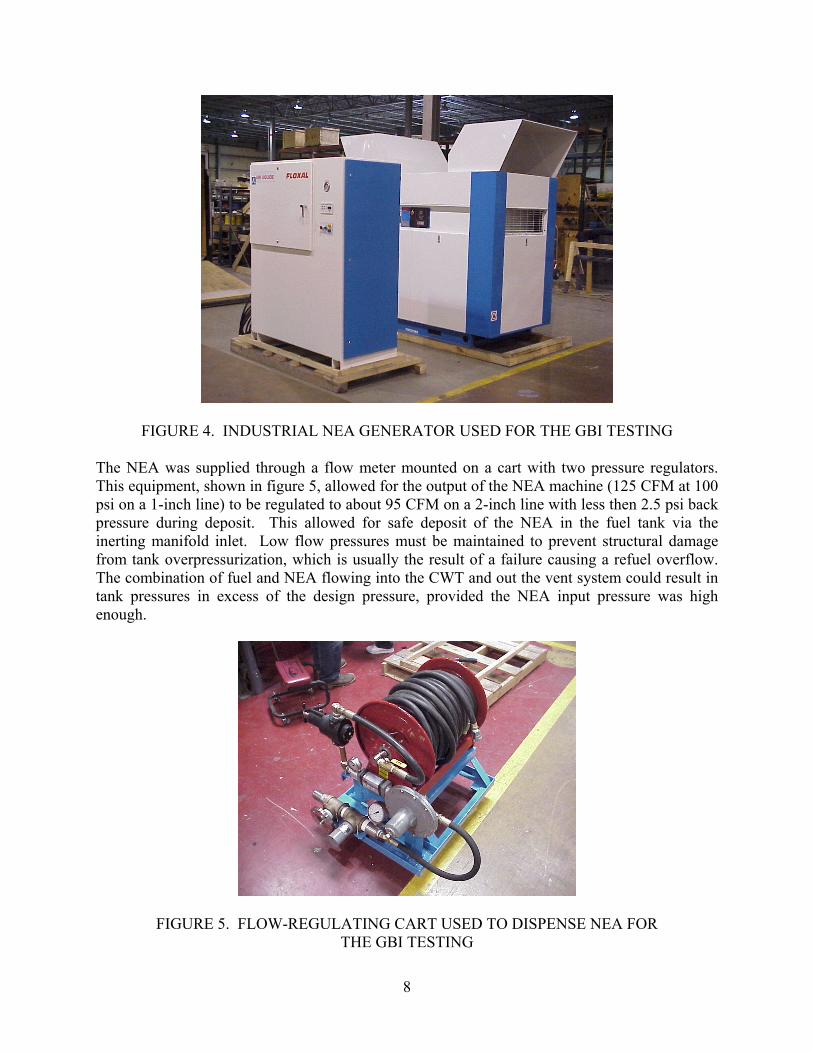
FIGURE 4. INDUSTRIAL NEA GENERATOR USED FOR THE GBI TESTING The NEA was supplied through a flow meter mounted on a cart with two pressure regulators. This equipment, shown in figure 5, allowed for the output of the NEA machine (125 CFM at 100 psi on a 1-inch line) to be regulated to about 95 CFM on a 2-inch line with less then 2.5 psi back pressure during deposit. This allowed for safe deposit of the NEA in the fuel tank via the inerting manifold inlet. Low flow pressures must be maintained to prevent structural damage from tank overpressurization, which is usually the result of a failure causing a refuel overflow. The combination of fuel and NEA flowing into the CWT and out the vent system could result in tank pressures in excess of the design pressure, provided the NEA input pressure was high enough.
FIGURE 5. FLOW-REGULATING CART USED TO DISPENSE NEA FOR THE GBI TESTING
8
2.2 TEST PROCEDURES.
All tests were performed at King County International Airport in Seattle, Washington. The planned testing consisted of five ground tests and four to five flight tests. The option of eliminating cross venting from the tank was left open in case undesirable results were obtained in the first flight test. This provided for the reiteration of the first flight test and thus created a total of five flight tests. Before each test began, the NEA generator was reconfigured to supply ambient air to the aircraft fuel tank, allowing the tank to be purged and ensuring a consistent initial oxygen concentration (approximately 20.9% oxygen by volume). At the start of each test, the data acquisition system was started and the NEA was directed into the tank. The tank was considered ready for testing when all sensors read approximately 8% oxygen concentration by volume. Next, the auxiliary power unit (APU) was started, ground power was switched off, and the air cycle machines were started. Lastly, the aircraft was operated in accordance with the test plan. 2.2.1 Ground Testing.
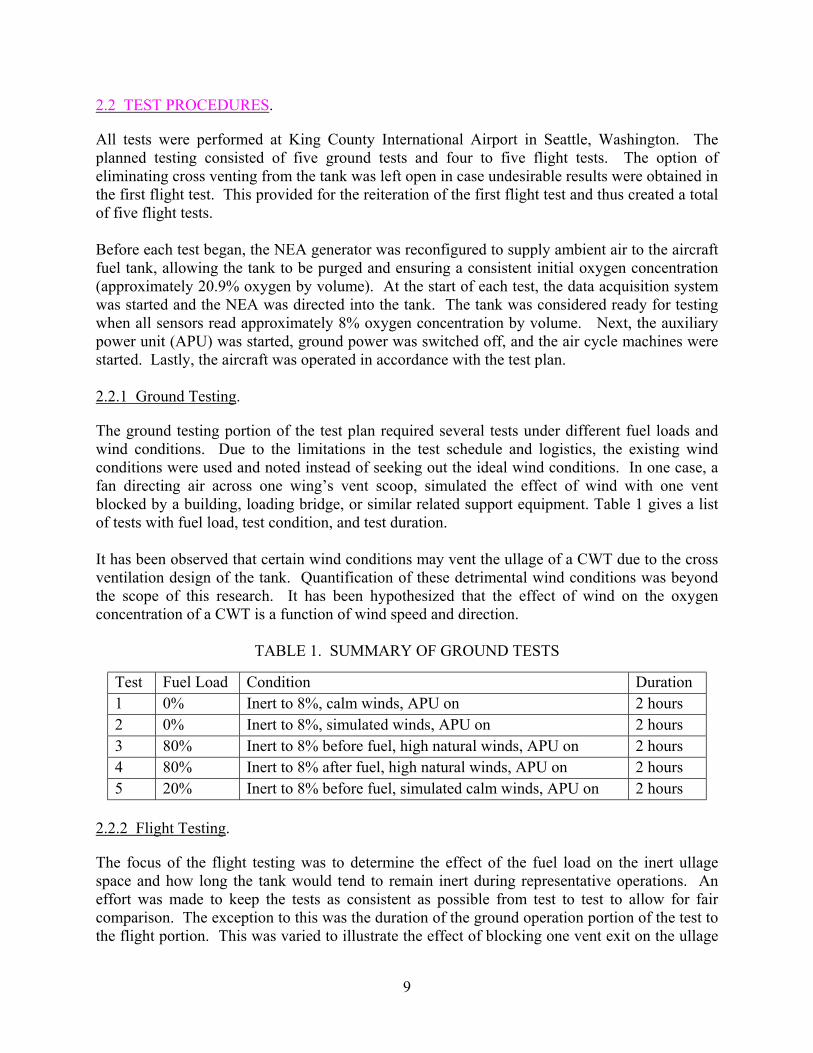
The ground testing portion of the test plan required several tests under different fuel loads and wind conditions. Due to the limitations in the test schedule and logistics, the existing wind conditions were used and noted instead of seeking out the ideal wind conditions. In one case, a fan directing air across one wing�s vent scoop, simulated the effect of wind with one vent blocked by a building, loading bridge, or similar related support equipment. Table 1 gives a list of tests with fuel load, test condition, and test duration. It has been observed that certain wind conditions may vent the ullage of a CWT due to the cross ventilation design of the tank. Quantification of these detrimental wind conditions was beyond the scope of this research. It has been hypothesized that the effect of wind on the oxygen concentration of a CWT is a function of wind speed and direction.
TABLE 1. SUMMARY OF GROUND TESTS
Test Fuel Load Condition Duration 1 0% Inert to 8%, calm winds, APU on 2 hours 2 0% Inert to 8%, simulated winds, APU on 2 hours 3 80% Inert to 8% before fuel, high natural winds, APU on 2 hours 4 80% Inert to 8% after fuel, high natural winds, APU on 2 hours 5 20% Inert to 8% before fuel, simulated calm winds, APU on 2 hours
2.2.2 Flight Testing.
The focus of the flight testing was to determine the effect of the fuel load on the inert ullage space and how long the tank would tend to remain inert during representative operations. An effort was made to keep the tests as consistent as possible from test to test to allow for fair comparison. The exception to this was the duration of the ground operation portion of the test to the flight portion. This was varied to illustrate the effect of blocking one vent exit on the ullage
9
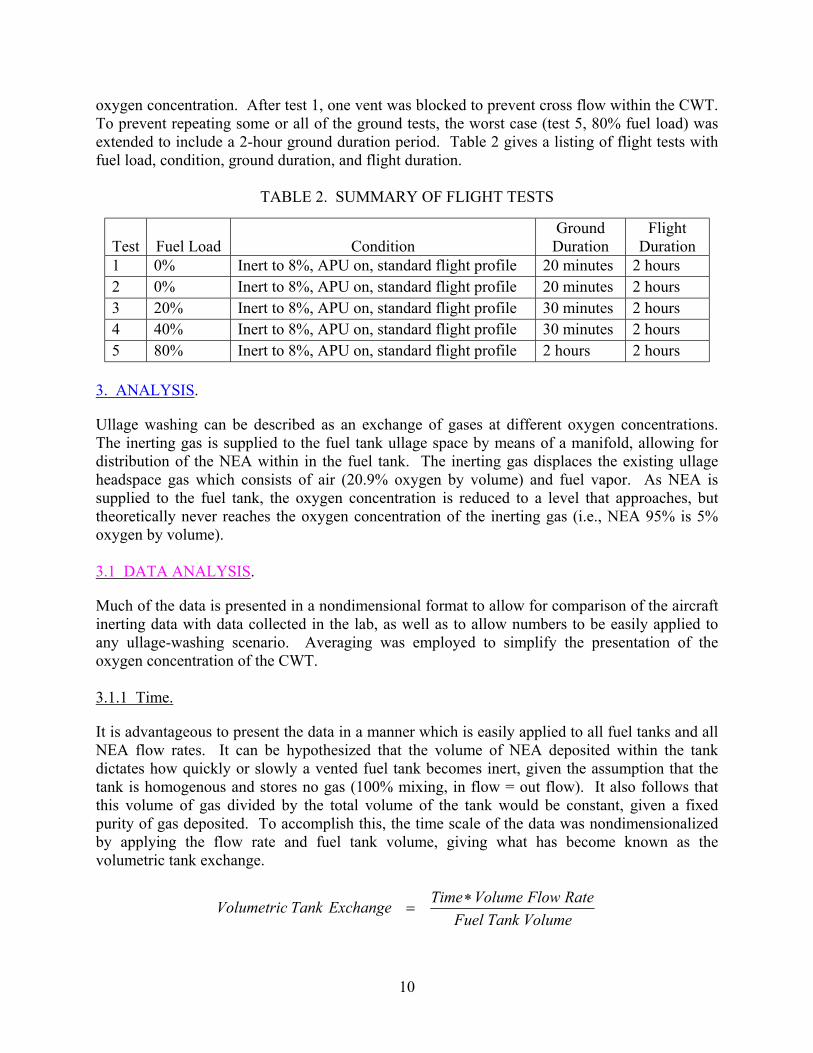
oxygen concentration. After test 1, one vent was blocked to prevent cross flow within the CWT. To prevent repeating some or all of the ground tests, the worst case (test 5, 80% fuel load) was extended to include a 2-hour ground duration period. Table 2 gives a listing of flight tests with fuel load, condition, ground duration, and flight duration.
TABLE 2. SUMMARY OF FLIGHT TESTS
Test
Fuel Load
Condition
Ground Duration
Flight Duration
1 0% Inert to 8%, APU on, standard flight profile 20 minutes 2 hours 2 0% Inert to 8%, APU on, standard flight profile 20 minutes 2 hours 3 20% Inert to 8%, APU on, standard flight profile 30 minutes 2 hours 4 40% Inert to 8%, APU on, standard flight profile 30 minutes 2 hours 5 80% Inert to 8%, APU on, standard flight profile 2 hours 2 hours
3. ANALYSIS.
Ullage washing can be described as an exchange of gases at different oxygen concentrations. The inerting gas is supplied to the fuel tank ullage space by means of a manifold, allowing for distribution of the NEA within in the fuel tank. The inerting gas displaces the existing ullage headspace gas which consists of air (20.9% oxygen by volume) and fuel vapor. As NEA is supplied to the fuel tank, the oxygen concentration is reduced to a level that approaches, but theoretically never reaches the oxygen concentration of the inerting gas (i.e., NEA 95% is 5% oxygen by volume). 3.1 DATA ANALYSIS.
Much of the data is presented in a nondimensional format to allow for comparison of the aircraft inerting data with data collected in the lab, as well as to allow numbers to be easily applied to any ullage-washing scenario. Averaging was employed to simplify the presentation of the oxygen concentration of the CWT. 3.1.1 Time.
It is advantageous to present the data in a manner which is easily applied to all fuel tanks and all NEA flow rates. It can be hypothesized that the volume of NEA deposited within the tank dictates how quickly or slowly a vented fuel tank becomes inert, given the assumption that the tank is homogenous and stores no gas (100% mixing, in flow = out flow). It also follows that this volume of gas divided by the total volume of the tank would be constant, given a fixed purity of gas deposited. To accomplish this, the time scale of the data was nondimensionalized by applying the flow rate and fuel tank volume, giving what has become known as the volumetric tank exchange.
VolumeTankFuelRateFlowVolumeTimeExchangeTankVolumetric ∗
=
10
This conversion allows for meaningful comparisons of data from different experiments with different tank sizes and flow rates. 3.1.2 Nitrogen-Enriched Air Oxygen Concentration.
In an effort to compare the data with previously acquired ullage washing data, it was desired to present the inerting data by nondimensionalizing the measured tank oxygen concentration in terms of inerting gas purity. The described theory states that the tank oxygen concentration is brought to the purity of the inerting gas over time by simply displacing the ullage space gas. This implies that the ratio of the difference between the oxygen concentration of air (ambient conditions) and the ullage in time and air and the NEA gas purity being added to the tank have a constant relationship, given a fixed volume of gas deposited. This can be described by the following relationship for the nondimensional factor referred to as the tank inerting ratio.
][][
][][
22
22
NEAAmb
ullageAmb
OOOORatioInertingTank
−
−=
where:
AmbO2 = Oxygen concentration of ambient air
NEAO2 = Oxygen concentration of inerting gas (NEA)
UllageO2 = Oxygen concentration of the ullage (function of time) 3.2 INERTING SOLUTIONS.
3.2.1 Exact Solution.
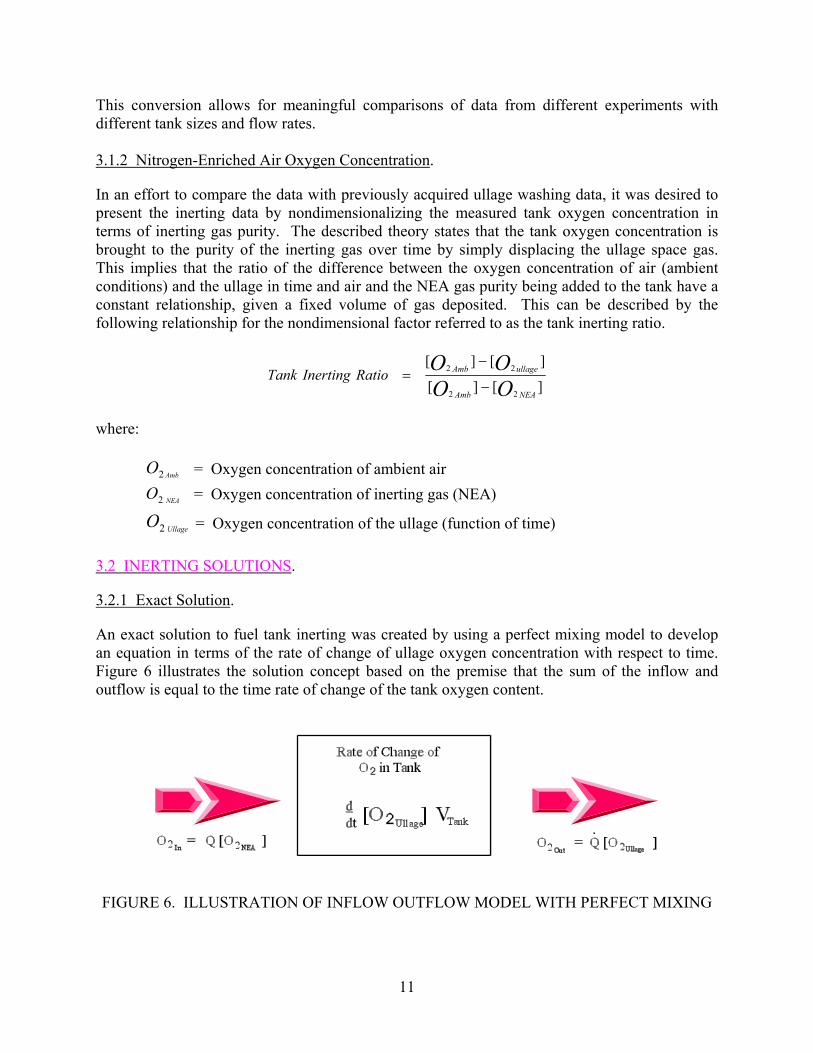
An exact solution to fuel tank inerting was created by using a perfect mixing model to develop an equation in terms of the rate of change of ullage oxygen concentration with respect to time. Figure 6 illustrates the solution concept based on the premise that the sum of the inflow and outflow is equal to the time rate of change of the tank oxygen content.
FIGURE 6. ILLUSTRATION OF INFLOW OUTFLOW MODEL WITH PERFECT MIXING
11
Application of this concept gives the following simplification.
dtV
Qdxx Tank
&=−
1
where: x = [O2 NEA] � [O2] The solution of this equation can be manipulated to allow for comparison of the exact solution to existing nondimensional experimental data. This was determined to be the following:
Tank
NEAAmb
Amb VQteOO
tOO −−=−
−1
)(
22
22
This simply states that the tank inerting ratio is equal to 1 minus e to the negative volumetric tank exchange. This equation allows for comparison of the exact solution with data that has been nondimensionalized in accordance with section 3.1. The complete solution had been developed by Dr. Richard Lyon and Constantine Sarkos and is given in an appendix A of reference 3. 3.2.2 Empirical Solution.
The nondimensional methods described in section 3.1 allow for the creation of an empirical curve based on previously acquired inerting data for different purities and flow rates of NEA. An empirical relationship between volumetric tank exchange and inerting ratio had been developed with previous ullage-washing experiments performed by the FAA. These experiments quantified the amount of NEA needed at a given purity level (oxygen concentration) to inert a rectangular tank, with one NEA nozzle and one vent, of any volume. This empirical relationship assumes a fourth-order polynomial curve fit [3]. The equation is given below.
0.0121 -1.0873x + 0.5275x - 0.1345x + 0.0145x- = Ratio InertingTank 234 In this equation, x is the volumetric tank exchange. 4. DISCUSSION OF RESULTS.
The discussion of results was split into ground testing and flight testing. This data describes inerting of an operational aircraft in a flight test environment. 4.1 GROUND TESTING.
The ground testing data focuses on three distinct research areas. The first is to validate the amount of NEA required to inert a compartmentalized CWT to 8% oxygen concentration. The second is to examine the qualitative effects of wind and simulated crosswind on an inert CWT. The last is to examine the quantitative effects of fuel load on an inert ullage during ground operations.
12
The data is generally presented in terms of an average of the three primary areas of the CWT, the center body section, the left cheek, and the right cheek. The center body section of the center wing fuel tank is the area of the tank contained within the fuselage area of the aircraft that has three spanwise bays with a total of four sample ports. One sample port within the center body section was considered redundant (port 2) as it resided very close to a second sample port (port 3); therefore, three ports were used when calculating the average oxygen concentration of the center bay area of the CWT. The left and right cheek areas are areas of the CWT that are within the wing hub area. Each cheek area contains five bays of differing orientation to the wing cord with two sample ports used to calculate the average oxygen concentration. These areas consistently exhibited different behaviors, indicating very little ullage gas interaction between the three areas, while the sample ports within these areas consistently behaved similarly to one another. For this reason, the data is often presented in terms of the average oxygen concentration in the three areas described. 4.1.1 Center Wing Tank Ullage Washing.
Before each test, the CWT of the test article was inerted to the desired oxygen concentration (8% oxygen by volume), to the best ability of the test team, using the NEA generator via the NEA distribution manifold installed in the tank. The initial test resulted in the CWT being inerted to a much lower oxygen concentration than desired due to the lag in the sampling system. Eventually, fuel clogged portions of the distribution manifold and equal distribution of NEA to each fuel tank bay became impossible. The distribution manifold used flexible hose to extend from bay to bay, which allowed for fuel to collect. A more advanced design would minimize low points and provide for proper draining to prevent this. At that point, to obtain the desired oxygen concentration in the fuel tank ullage, it was washed unevenly with NEA 92.5% for an extended period until all oxygen analyzers read approximately 8% oxygen. Figure 7 gives a plot of average oxygen concentration versus time during ground test 1. This graph also has a line of constant 8% oxygen concentration highlighting when each tank area reached the desired inert level. In this case, it was for an empty tank (0% fuel) with 95% NEA at a flow rate of 90 CFM. This data was nondimensionalized in the manner outlined in section 3.1 and is given figure 7. In figure 8, the inerting data are compared with the exact and empirical solutions identified in section 3.2. Figure 8 illustrates a volumetric tank exchange (VTE) of 1.75 required to achieve the desired inerting ratio, which is slightly greater then the theoretical value given by the exact solution of 1.7 and significantly greater then the empirical relationship that results in a VTE of 1.5. Ground test 2 ullage-washing data are presented in figures 9 and 10, which are similar to ground test 1. For the second ground test, it was approximated that the correct volume of NEA was calculated that would be required to inert the tank to 8% oxygen concentration, and that amount of NEA 95% was supplied to the distribution manifold at 90 CFM. However, figure 10 illustrates a VTE of approximately 1.85. The discrepancy between these two tests is most likely due to limitations in flow rate and oxygen analyzer accuracy.
13
0
5
10
15
20
25
0 2 4 6 8 10 12 14 16
Time (minutes)
Oxy
gen
Con
cent
ratio
n (%
Vol
)
18
Average Center Bay Average Left Cheek Average Right Cheek
Empty CWT 90 CFM, 95% NEA
8% Line
FIGURE 7. GROUND TEST 1�ULLAGE WASHING AVERAGE OXYGEN CONCENTRATION DATA
0
0.1
0.2
0.3
0.4
0.5
0.6
0.7
0.8
0.9
1
0 0.5 1 1.5 2 2.5
Volumetric Tank Exchange
Iner
ting
Rat
io
3
Measured Data Exact Solution Empirical Equation
Empty CWT 90 CFM, 95% NEA
Inerting Target = 0.81
FIGURE 8. GROUND TEST 1�NONDIMENSTIONAL ULLAGE-WASHING DATA
14
0
5
10
15
20
25
0 2 4 6 8 10 12
Time (minutes)
Oxy
gen
Con
cent
ratio
n (%
Vol
)
14
Average Center Bay Average Left Cheek Average Right Cheek
Empty CWT 90 CFM, 95% NEA
8% Line
FIGURE 9. GROUND TEST 2�ULLAGE WASHING AVERAGE OXYGEN CONCENTRATION DATA
0
0.1
0.2
0.3
0.4
0.5
0.6
0.7
0.8
0.9
1
0 0.5 1 1.5 2 2.5
Volumetric Tank Exchange
Iner
ting
Rat
io
Measured Data Exact Solution Empirical Equation
Empty CWT 90 CFM, 95% NEA
Inerting Target = 0.81
FIGURE 10. GROUND TEST 2�NONDIMENSTIONAL ULLAGE-WASHING DATA
15
Both figures 7 and 9 illustrate that the manifold was not completely balanced given the flow conditions of the test. The oxygen concentration of the cheeks decreased at a faster rate, resulting in an uneven distribution of NEA. The outflow of the tank is through the vent system ports which are located in each cheek area. This had the effect of decreasing the efficiency of the inerting process by a small factor from the theoretical solution. The FAA empirical data illustrates a greater efficiency of inerting. This is most likely due to the accuracy of the oxygen analyzer used for the testing, but more information is needed to validate or refute the FAA empirical data illustrating a VTE of 1.5 is required to inert a fuel tank ullage to an 8% oxygen concentration with NEA 95%. 4.1.2 Wind Effects.
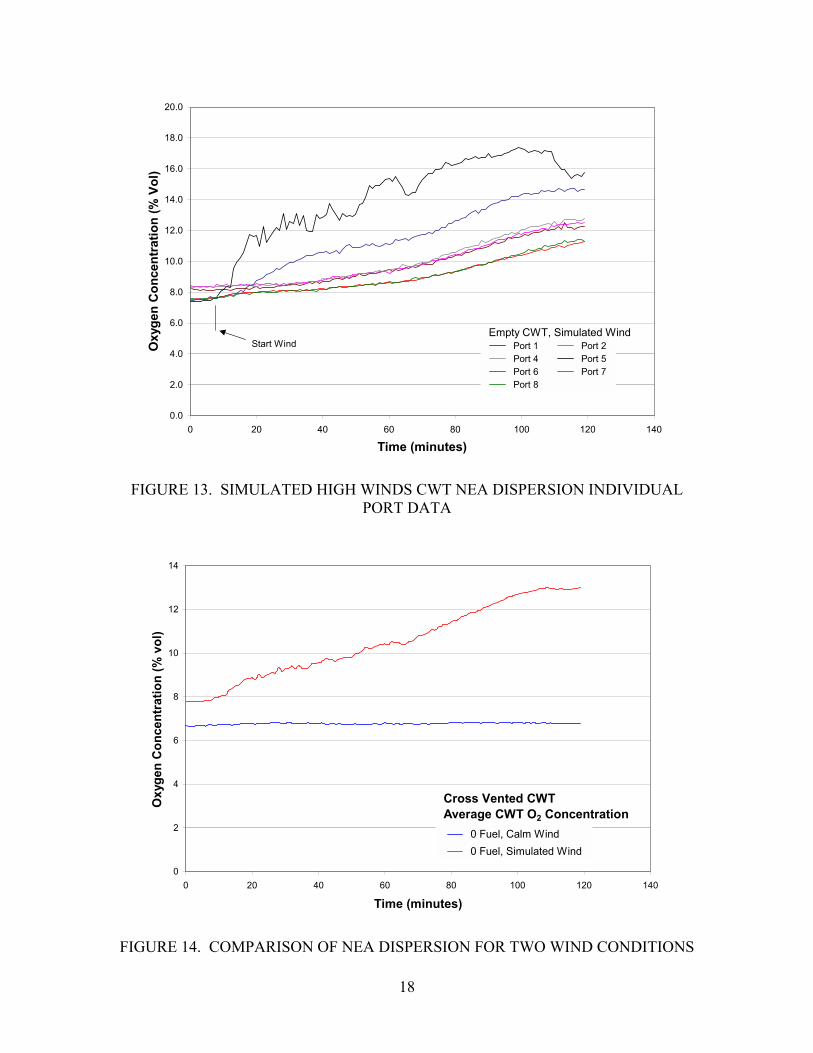
To examine the effect of wind on the ability of the CWT to remain inert, the tank was inerted on two different occasions with zero fuel load and allowed to sit on condition for 2 hours. As previously discussed, the condition consisted of remaining parked at the test location with the air cycle machines running for 2 hours. One test was with quiescent wind conditions while the other test had a fan blowing over the right wing vent only, to simulate a crosswind effecting only one vent. This created a differential pressure between the CWT wing vents to determine the effect on the ullage oxygen concentration. The results of the quiescent and simulated crosswind tests are seen in figures 11 and 12, respectively. These illustrate that under quiescent conditions the NEA dispersed very little (not measurable); however, the simulated crosswind had a profound effect on the average oxygen concentration of the left cheek area, which is where the right wing vent opens to the CWT. The average oxygen concentration in the left cheek reached 10% in less than 20 minutes, illustrating a need to limit cross venting of a CWT under some conditions of GBI for aircraft with cross-vented fuel tanks. Figure 13 gives the oxygen concentration data from the seven port locations used to calculate the average values, further highlighting the need to limit cross venting. This graph shows that the port closest to the vent exit (5) reached 10% in less than 15 minutes, only 6 minutes after the simulated wind began. Figure 14 compares the overall average CWT oxygen concentration for both wind conditions, illustrating the profound effect of the simulated crosswind. 4.1.3 Fuel Load Effects.
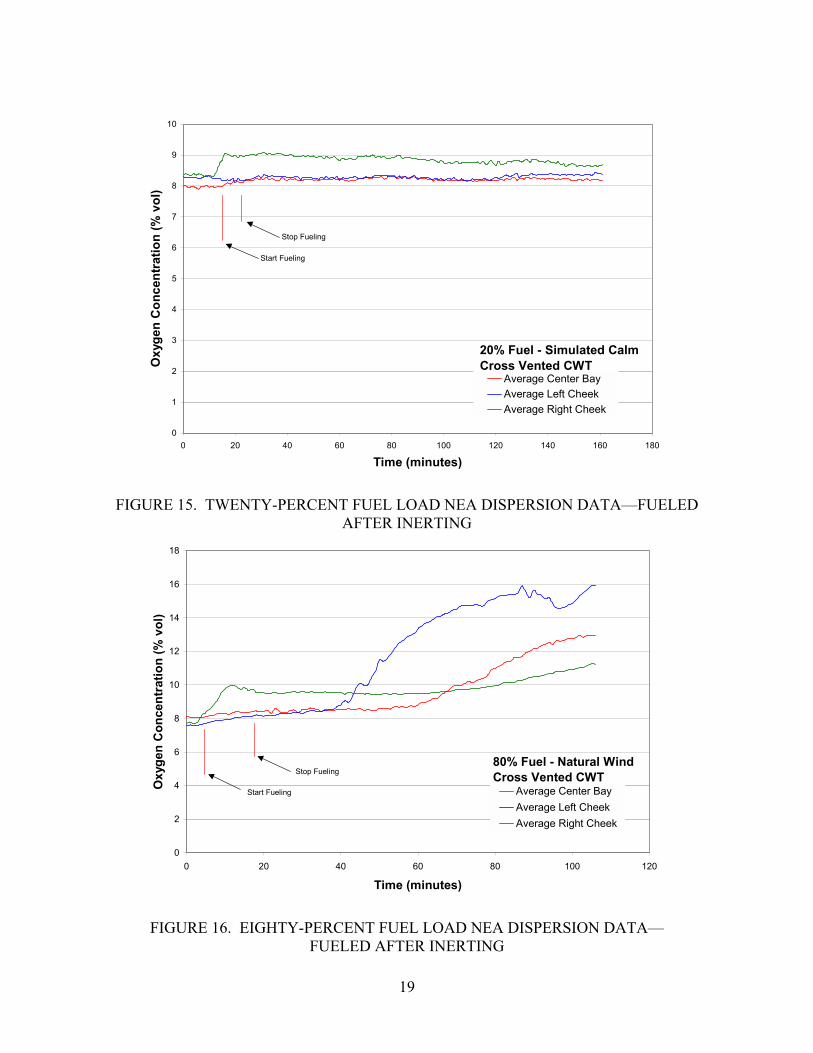
To determine the effect of fuel loads on an inert ullage during ground operations, the CWT was inerted twice to 8% oxygen concentration and then loaded with fuel to 20% and 80%, respectively. The aircraft remained on condition (packs running) for 1.5 to 2 hours. The average oxygen concentration for the three CWT areas is presented for the 20% and 80% fuel case in figures 15 and 16, respectively.
16
0
1
2
3
4
5
6
7
8
0 20 40 60 80 100 120 140
Time (minutes)
Oxy
gen
Con
cent
ratio
n (%
vol
)
Average Center BayAverage Left CheekAverage Right Cheek
Zero Fuel - Calm DayCross Vented CWT
FIGURE 11. CALM WINDS CWT NEA DISPERSION DATA
0
2
4
6
8
10
12
14
16
18
0 20 40 60 80 100 120 140
Time (minutes)
Oxy
gen
Con
cent
ratio
n (%
vol
)
Average Center BayAverage Left CheekAverage Right Cheek
Zero Fuel - Simulated WindCross Vented CWT
FIGURE 12. SIMULATED HIGH WINDS CWT NEA DISPERSION AVERAGE BAY DATA
17
0.0
2.0
4.0
6.0
8.0
10.0
12.0
14.0
16.0
18.0
20.0
0 20 40 60 80 100 120 140
Time (minutes)
Oxy
gen
Con
cent
ratio
n (%
Vol
)
Port 1 Port 2 Port 4 Port 5 Port 6 Port 7 Port 8
Empty CWT, Simulated WindStart Wind
FIGURE 13. SIMULATED HIGH WINDS CWT NEA DISPERSION INDIVIDUAL PORT DATA
0
2
4
6
8
10
12
14
0 20 40 60 80 100 120 140
Time (minutes)
Oxy
gen
Conc
entra
tion
(% v
ol)
0 Fuel, Calm Wind 0 Fuel, Simulated Wind
Cross Vented CWTAverage CWT O2 Concentration
FIGURE 14. COMPARISON OF NEA DISPERSION FOR TWO WIND CONDITIONS
18
0
1
2
3
4
5
6
7
8
9
10
0 20 40 60 80 100 120 140 160 180
Time (minutes)
Oxy
gen
Con
cent
ratio
n (%
vol
)
Average Center BayAverage Left CheekAverage Right Cheek
20% Fuel - Simulated CalmCross Vented CWT
Start Fueling
Stop Fueling
FIGURE 15. TWENTY-PERCENT FUEL LOAD NEA DISPERSION DATA�FUELED AFTER INERTING
0
2
4
6
8
10
12
14
16
18
0 20 40 60 80 100
Time (minutes)
Oxy
gen
Con
cent
ratio
n (%
vol
)
120
Average Center BayAverage Left CheekAverage Right Cheek
80% Fuel - Natural WindCross Vented CWT
Start Fueling
Stop Fueling
FIGURE 16. EIGHTY-PERCENT FUEL LOAD NEA DISPERSION DATA� FUELED AFTER INERTING
19
The effect of fueling on the inert ullage space was substantial but did not cause the average oxygen concentration in any of the three main areas of the tank to increase significantly above 10% oxygen by volume. The 80% fuel case had the highest increase in oxygen concentration with the 20% fuel case having about half the effect. The increase in oxygen concentration was attributed to dissolved gases being released from the fuel during refueling, but more information and testing is needed to validate this hypothesis. During the ground condition, the 20% fuel load case illustrates no significant effect of the fuel on the ullage oxygen concentration after refueling. The effect of the higher fuel load on the inert ullage for the 80% fuel case cannot be determined, as high winds caused a rapid increase in oxygen concentration that would far overshadow any effect the fuel would have displayed. The 80% fuel case was repeated, except the fuel was loaded before the ullage was inerted. The inerting of the previously fueled tank presented no unique problems; however, again, high winds prevented visualizing any effect of the fuel load on the tank oxygen concentration.
4.2 FLIGHT TESTING.
The flight testing data focuses on two distinct research areas. The first is to validate the assumption that the CWT cross-vented configuration of most Boeing aircraft will not allow for proper dispersion of the NEA during normal flight operations. The second is to quantify the effects of fuel load on the inert ullage during normal flight operations. The data is generally presented in terms of an average of the three primary areas of the CWT and the flight profile data to illustrate takeoff, ascent, cruise, and descent. Comparison plots are also presented that highlight a specific effect such as the effect of fuel load as it pertains to climb or fuel burn at cruise. 4.2.1 Center Wing Tank Cross-Venting Effect.
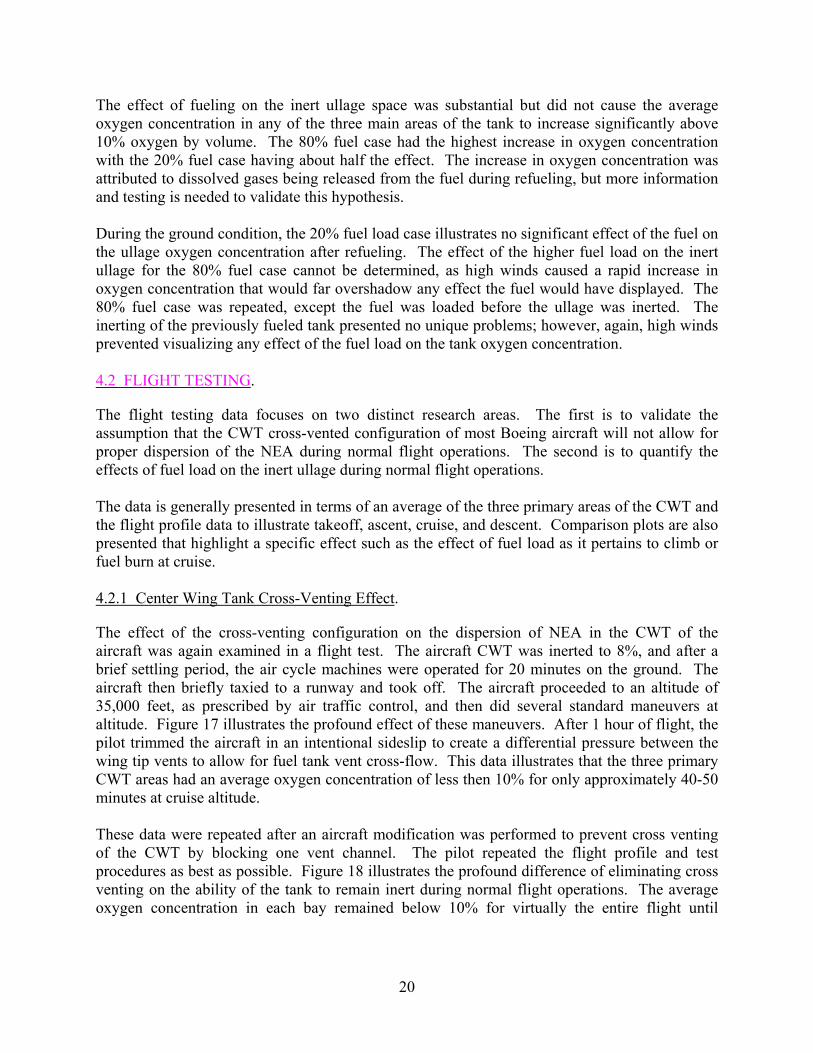
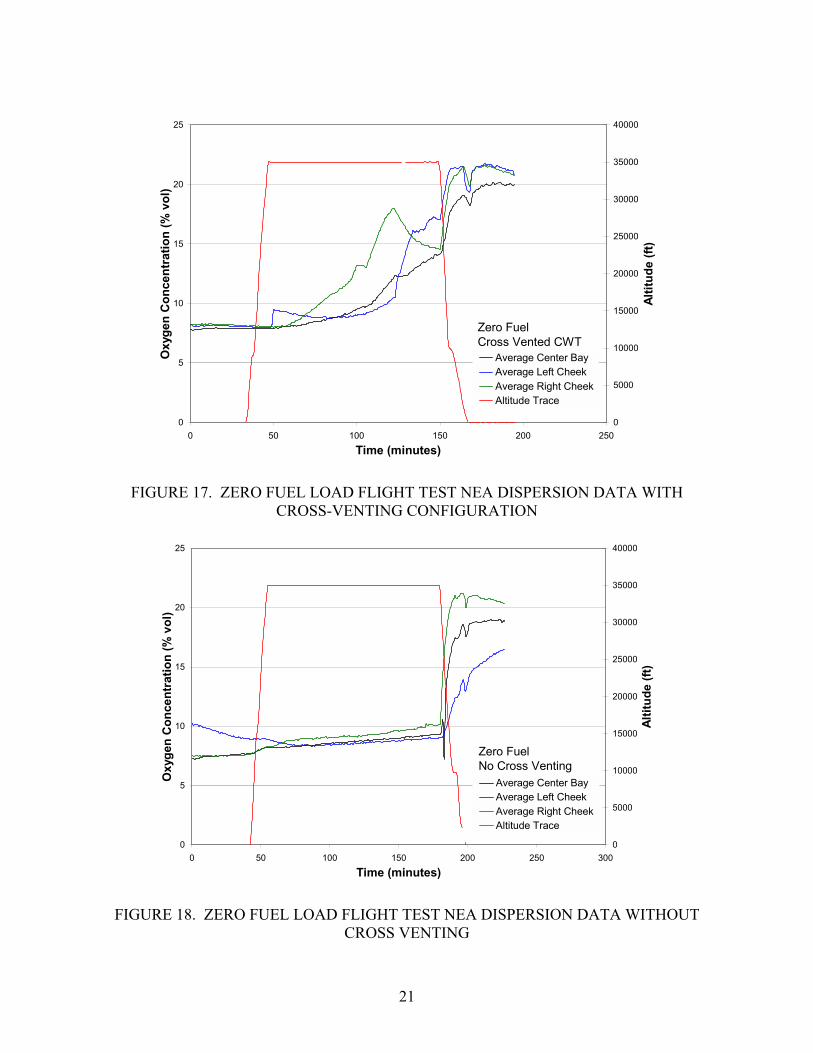
The effect of the cross-venting configuration on the dispersion of NEA in the CWT of the aircraft was again examined in a flight test. The aircraft CWT was inerted to 8%, and after a brief settling period, the air cycle machines were operated for 20 minutes on the ground. The aircraft then briefly taxied to a runway and took off. The aircraft proceeded to an altitude of 35,000 feet, as prescribed by air traffic control, and then did several standard maneuvers at altitude. Figure 17 illustrates the profound effect of these maneuvers. After 1 hour of flight, the pilot trimmed the aircraft in an intentional sideslip to create a differential pressure between the wing tip vents to allow for fuel tank vent cross-flow. This data illustrates that the three primary CWT areas had an average oxygen concentration of less then 10% for only approximately 40-50 minutes at cruise altitude. These data were repeated after an aircraft modification was performed to prevent cross venting of the CWT by blocking one vent channel. The pilot repeated the flight profile and test procedures as best as possible. Figure 18 illustrates the profound difference of eliminating cross venting on the ability of the tank to remain inert during normal flight operations. The average oxygen concentration in each bay remained below 10% for virtually the entire flight until
20
0
5
10
15
20
25
0 50 100 150 200 250
Time (minutes)
Oxy
gen
Con
cent
ratio
n (%
vol
)
0
5000
10000
15000
20000
25000
30000
35000
40000
Altit
ude
(ft)
Average Center BayAverage Left CheekAverage Right CheekAltitude Trace
Zero FuelCross Vented CWT
FIGURE 17. ZERO FUEL LOAD FLIGHT TEST NEA DISPERSION DATA WITH CROSS-VENTING CONFIGURATION
0
5
10
15
20
25
0 50 100 150 200 250 300
Time (minutes)
Oxy
gen
Con
cent
ratio
n (%
vol
)
0
5000
10000
15000
20000
25000
30000
35000
40000
Altit
ude
(ft)
Average Center BayAverage Left CheekAverage Right CheekAltitude Trace
Zero FuelNo Cross Venting
FIGURE 18. ZERO FUEL LOAD FLIGHT TEST NEA DISPERSION DATA WITHOUT CROSS VENTING
21
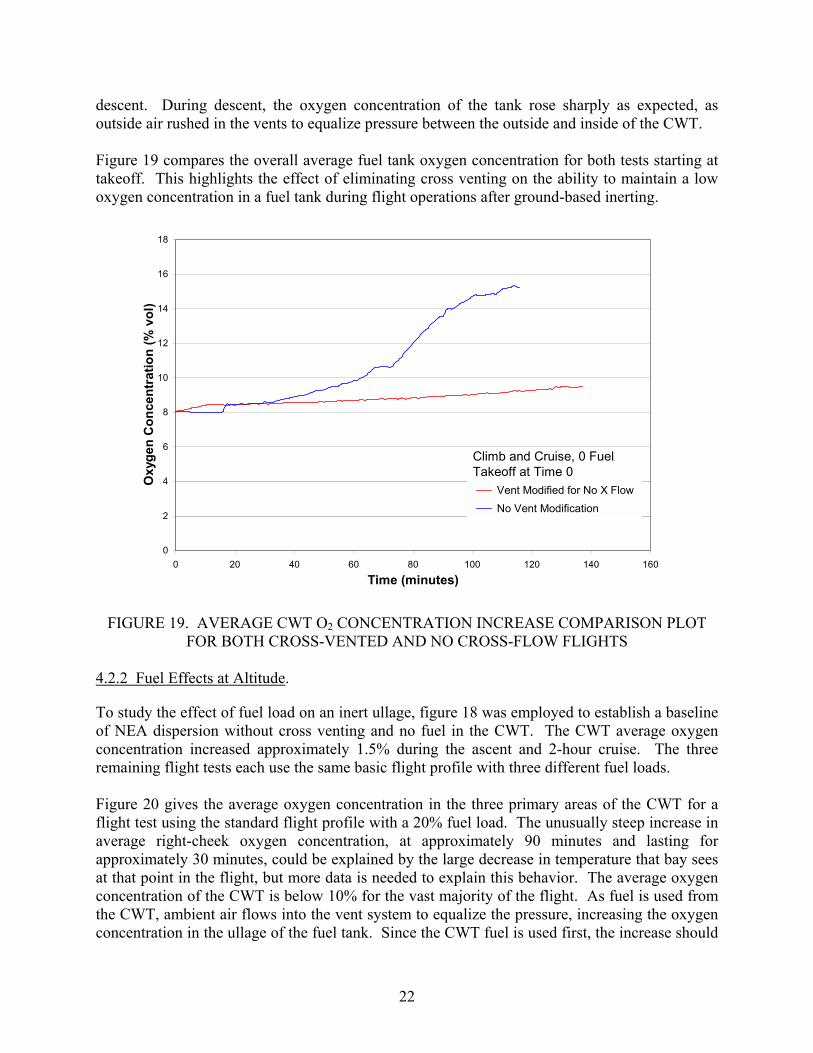
descent. During descent, the oxygen concentration of the tank rose sharply as expected, as outside air rushed in the vents to equalize pressure between the outside and inside of the CWT. Figure 19 compares the overall average fuel tank oxygen concentration for both tests starting at takeoff. This highlights the effect of eliminating cross venting on the ability to maintain a low oxygen concentration in a fuel tank during flight operations after ground-based inerting.
0
2
4
6
8
10
12
14
16
18
0 20 40 60 80 100 120 140 160
Time (minutes)
Oxy
gen
Con
cent
ratio
n (%
vol
)
Vent Modified for No X Flow No Vent Modification
Climb and Cruise, 0 Fuel Takeoff at Time 0
FIGURE 19. AVERAGE CWT O2 CONCENTRATION INCREASE COMPARISON PLOT FOR BOTH CROSS-VENTED AND NO CROSS-FLOW FLIGHTS
4.2.2 Fuel Effects at Altitude.
To study the effect of fuel load on an inert ullage, figure 18 was employed to establish a baseline of NEA dispersion without cross venting and no fuel in the CWT. The CWT average oxygen concentration increased approximately 1.5% during the ascent and 2-hour cruise. The three remaining flight tests each use the same basic flight profile with three different fuel loads. Figure 20 gives the average oxygen concentration in the three primary areas of the CWT for a flight test using the standard flight profile with a 20% fuel load. The unusually steep increase in average right-cheek oxygen concentration, at approximately 90 minutes and lasting for approximately 30 minutes, could be explained by the large decrease in temperature that bay sees at that point in the flight, but more data is needed to explain this behavior. The average oxygen concentration of the CWT is below 10% for the vast majority of the flight. As fuel is used from the CWT, ambient air flows into the vent system to equalize the pressure, increasing the oxygen concentration in the ullage of the fuel tank. Since the CWT fuel is used first, the increase should
22
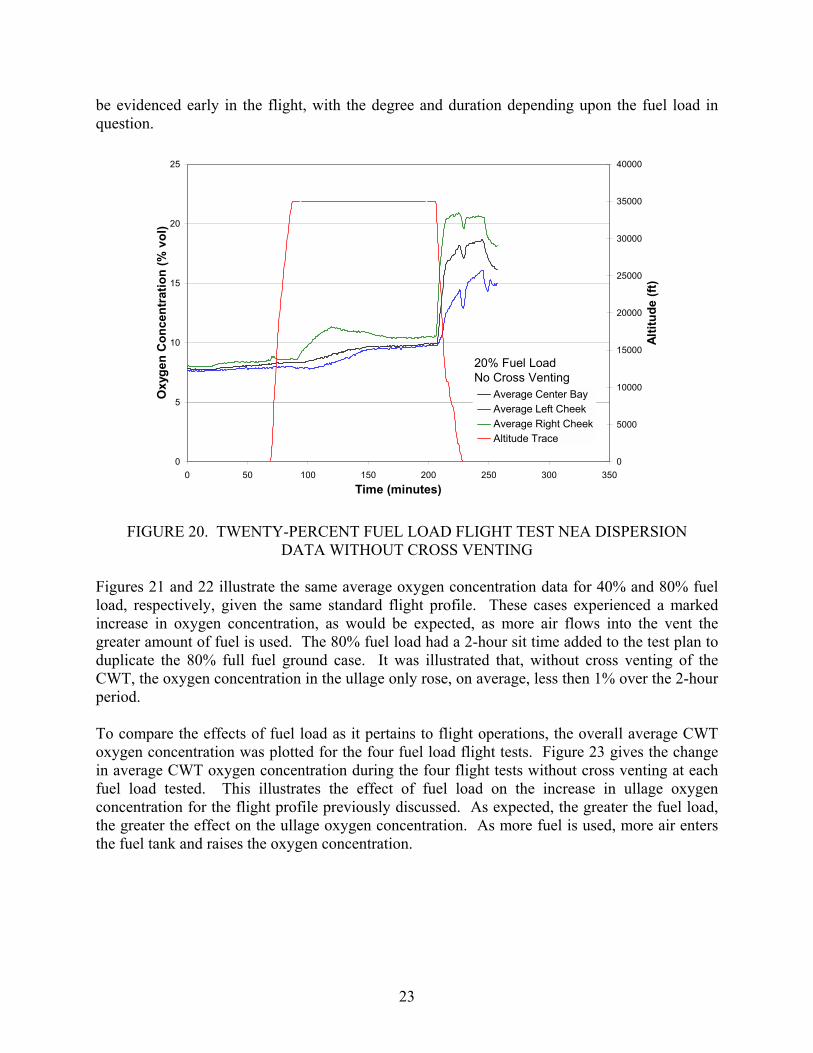
be evidenced early in the flight, with the degree and duration depending upon the fuel load in question.
0
5
10
15
20
25
0 50 100 150 200 250 300 350Time (minutes)
Oxy
gen
Con
cent
ratio
n (%
vol
)
0
5000
10000
15000
20000
25000
30000
35000
40000
Altit
ude
(ft)
Average Center BayAverage Left CheekAverage Right CheekAltitude Trace
20% Fuel LoadNo Cross Venting
FIGURE 20. TWENTY-PERCENT FUEL LOAD FLIGHT TEST NEA DISPERSION DATA WITHOUT CROSS VENTING
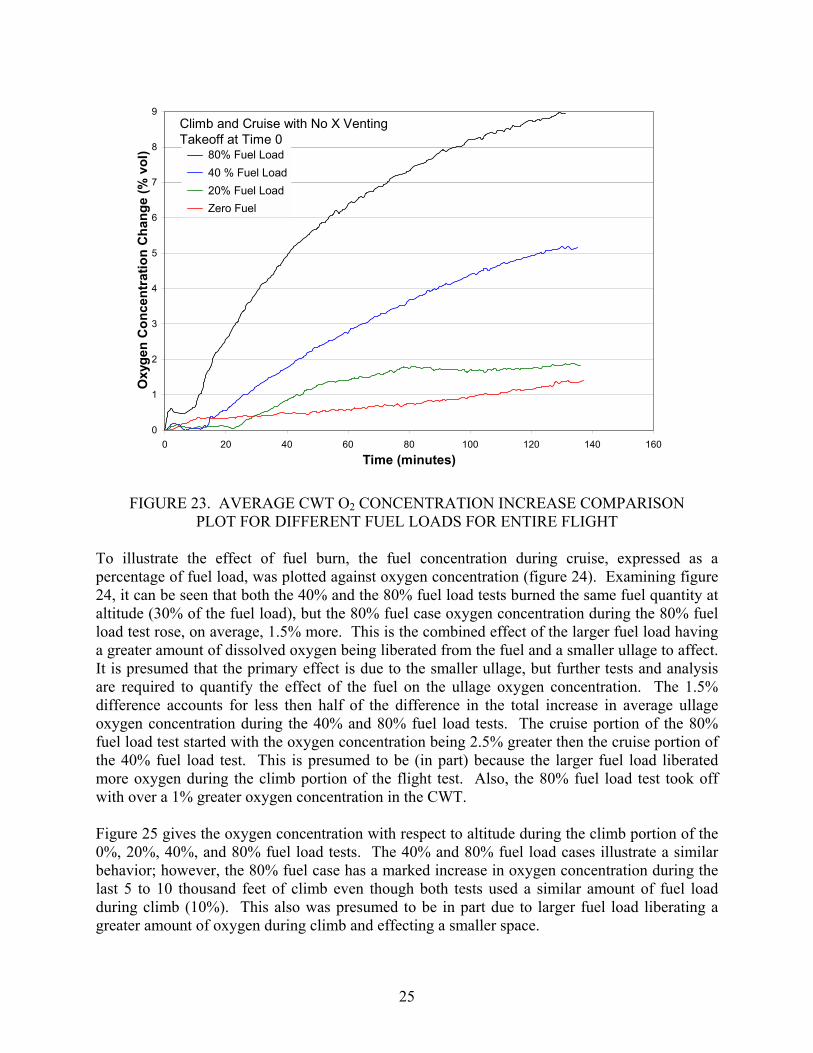
Figures 21 and 22 illustrate the same average oxygen concentration data for 40% and 80% fuel load, respectively, given the same standard flight profile. These cases experienced a marked increase in oxygen concentration, as would be expected, as more air flows into the vent the greater amount of fuel is used. The 80% fuel load had a 2-hour sit time added to the test plan to duplicate the 80% full fuel ground case. It was illustrated that, without cross venting of the CWT, the oxygen concentration in the ullage only rose, on average, less then 1% over the 2-hour period. To compare the effects of fuel load as it pertains to flight operations, the overall average CWT oxygen concentration was plotted for the four fuel load flight tests. Figure 23 gives the change in average CWT oxygen concentration during the four flight tests without cross venting at each fuel load tested. This illustrates the effect of fuel load on the increase in ullage oxygen concentration for the flight profile previously discussed. As expected, the greater the fuel load, the greater the effect on the ullage oxygen concentration. As more fuel is used, more air enters the fuel tank and raises the oxygen concentration.
23

0
5
10
15
20
25
0 50 100 150 200 250 300
Time (minutes)
Oxy
gen
Con
cent
ratio
n (%
vol
)
0
5000
10000
15000
20000
25000
30000
35000
40000
Altit
ude
(ft)
Average Center BayAverage Left CheekAverage Right CheekAltitude Trace
40% Fuel LoadNo Cross Venting
FIGURE 21. FORTY-PERCENT FUEL LOAD FLIGHT TEST NEA DISPERSION DATA WITHOUT CROSS VENTING
0
5
10
15
20
25
0 50 100 150 200 250 300 350
Time (minutes)
Oxy
gen
Con
cent
ratio
n (%
vol
)
0
5000
10000
15000
20000
25000
30000
35000
40000
Altit
ude
(ft)
Average Center BayAverage Left CheekAverage Right CheekAltitude Trace
80% Fuel LoadNo Cross Venting
FIGURE 22. EIGHTY-PERCENT FUEL LOAD FLIGHT TEST NEA DISPERSION DATA WITHOUT CROSS VENTING
24
0
1
2
3
4
5
6
7
8
9
0 20 40 60 80 100 120 140 160
Time (minutes)
Oxy
gen
Con
cent
ratio
n C
hang
e (%
vol
) 80% Fuel Load 40 % Fuel Load 20% Fuel Load Zero Fuel
Climb and Cruise with No X VentingTakeoff at Time 0
FIGURE 23. AVERAGE CWT O2 CONCENTRATION INCREASE COMPARISON PLOT FOR DIFFERENT FUEL LOADS FOR ENTIRE FLIGHT
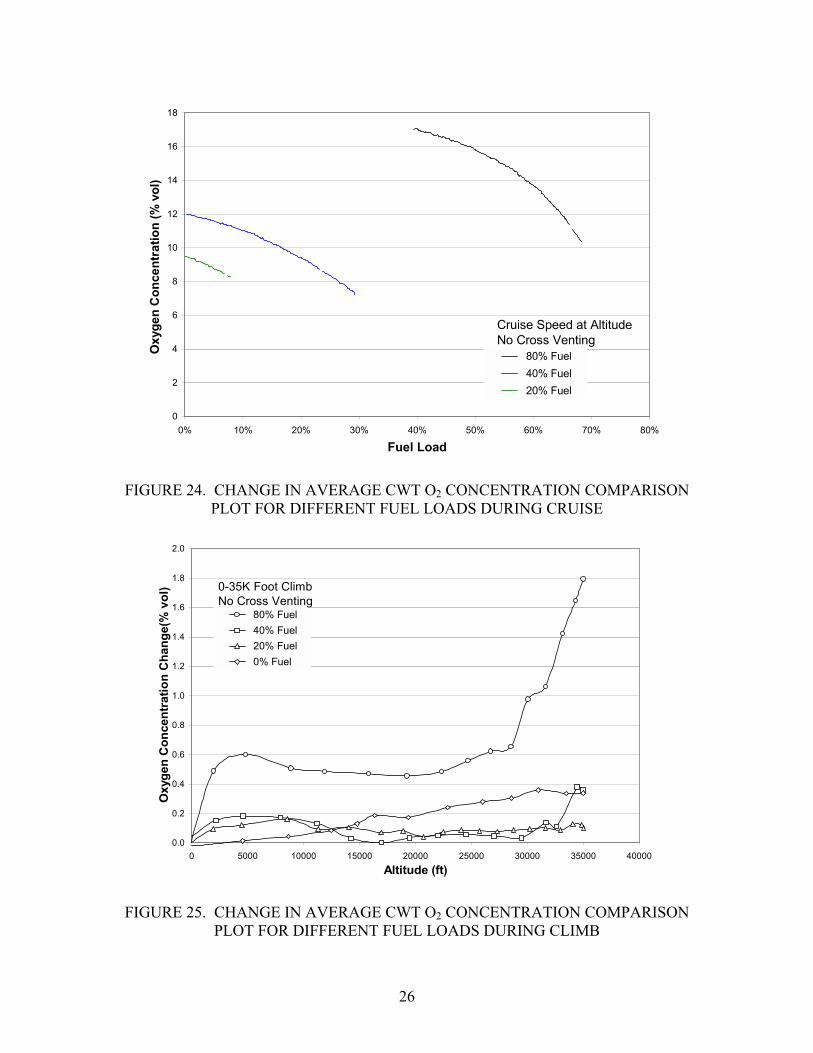
To illustrate the effect of fuel burn, the fuel concentration during cruise, expressed as a percentage of fuel load, was plotted against oxygen concentration (figure 24). Examining figure 24, it can be seen that both the 40% and the 80% fuel load tests burned the same fuel quantity at altitude (30% of the fuel load), but the 80% fuel case oxygen concentration during the 80% fuel load test rose, on average, 1.5% more. This is the combined effect of the larger fuel load having a greater amount of dissolved oxygen being liberated from the fuel and a smaller ullage to affect. It is presumed that the primary effect is due to the smaller ullage, but further tests and analysis are required to quantify the effect of the fuel on the ullage oxygen concentration. The 1.5% difference accounts for less then half of the difference in the total increase in average ullage oxygen concentration during the 40% and 80% fuel load tests. The cruise portion of the 80% fuel load test started with the oxygen concentration being 2.5% greater then the cruise portion of the 40% fuel load test. This is presumed to be (in part) because the larger fuel load liberated more oxygen during the climb portion of the flight test. Also, the 80% fuel load test took off with over a 1% greater oxygen concentration in the CWT. Figure 25 gives the oxygen concentration with respect to altitude during the climb portion of the 0%, 20%, 40%, and 80% fuel load tests. The 40% and 80% fuel load cases illustrate a similar behavior; however, the 80% fuel case has a marked increase in oxygen concentration during the last 5 to 10 thousand feet of climb even though both tests used a similar amount of fuel load during climb (10%). This also was presumed to be in part due to larger fuel load liberating a greater amount of oxygen during climb and effecting a smaller space.
25
0
2
4
6
8
10
12
14
16
18
0% 10% 20% 30% 40% 50% 60% 70% 80%
Fuel Load
Oxy
gen
Con
cent
ratio
n (%
vol
)
80% Fuel 40% Fuel 20% Fuel
Cruise Speed at AltitudeNo Cross Venting
FIGURE 24. CHANGE IN AVERAGE CWT O2 CONCENTRATION COMPARISON PLOT FOR DIFFERENT FUEL LOADS DURING CRUISE
0.0
0.2
0.4
0.6
0.8
1.0
1.2
1.4
1.6
1.8
2.0
0 5000 10000 15000 20000 25000 30000 35000 40000Altitude (ft)
Oxy
gen
Con
cent
ratio
n C
hang
e(%
vol
)
80% Fuel 40% Fuel 20% Fuel 0% Fuel
0-35K Foot ClimbNo Cross Venting
FIGURE 25. CHANGE IN AVERAGE CWT O2 CONCENTRATION COMPARISON PLOT FOR DIFFERENT FUEL LOADS DURING CLIMB
26

5. SUMMARY.
Ground-based inerting was successfully executed on a Boeing 737-700 in a flight test environment. The CWT was inerted with 95% NEA, using approximately 1.8 tank volume exchanges of inerting gas, also known as the volumetric tank exchange (VTE). During quiescent wind ground tests and the ground test without CWT cross venting, the ullage oxygen concentration was relatively stable. The small increases measured would have allowed the average tank oxygen concentration to remain below 10% for over 4 hours, even with a fuel load of 80%. Simulated and real-wind conditions created rapid increases in oxygen concentration in the CWT. However, with the installation of a device to prevent cross venting of the tank, the wind effects on these test points were eliminated. Flight tests with and without cross venting highlight this profound effect on fuel tank inerting in flight. During a flight test with no fuel and a cross-vented center wing tank, the average ullage oxygen concentration remained below 10% for about 1 hour of flight and local oxygen concentrations rose above 10% in less then 45 minutes. With cross venting eliminated, under the same test scenario, the average oxygen concentration was maintained below 10% through the entire cruise portion of the flight. Increased fuel loads had a negative effect on the time the average oxygen concentration of the tank remained below 10%. While the 20% fuel load test remained below 10% oxygen for the entire cruise portion of the flight test, the 80% fuel load remained below 10% for less than 15 minutes. As expected, during descent air entering the center wing tank to equalize pressure, created large and immediate increases in ullage oxygen concentration. 6. REFERENCES.
1. �Fuel Tank Harmonization Working Group Final Report,� Aviation Rulemaking Advisory Committee, July 1998.
2. Cavage, William, �The Cost of Implementing Ground-Based Fuel Tank Inerting in the
Commercial Fleet,� DOT/FAA/AR-00/19, May 2000. 3. Burns, Michael and Cavage, William M., �Inerting of a Vented Aircraft Fuel Tank Test
Article With Nitrogen-Enriched Air,� DOT/FAA/AR-01/6, April 2001.
27/28
Related Documents