Goodness of Fit Test for Proportions of Multinomial Population •Chi-square distribution •Hypotheses test/Goodness of fit test

Welcome message from author
This document is posted to help you gain knowledge. Please leave a comment to let me know what you think about it! Share it to your friends and learn new things together.
Transcript
Goodness of Fit Test for Proportions of Multinomial Population
•Chi-square distribution
•Hypotheses test/Goodness of fit test
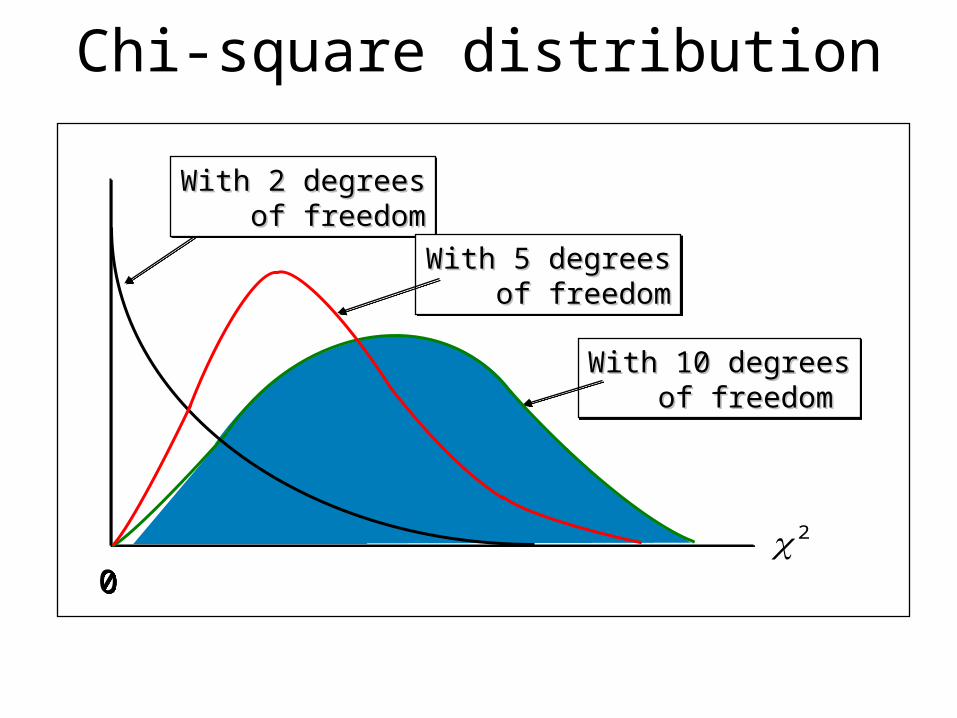
Chi-square distribution
00
With 2 degreesWith 2 degrees of freedomof freedomWith 2 degreesWith 2 degrees of freedomof freedom
With 5 degreesWith 5 degrees of freedomof freedomWith 5 degreesWith 5 degrees of freedomof freedom
With 10 degreesWith 10 degrees of freedomof freedomWith 10 degreesWith 10 degrees of freedomof freedom
2
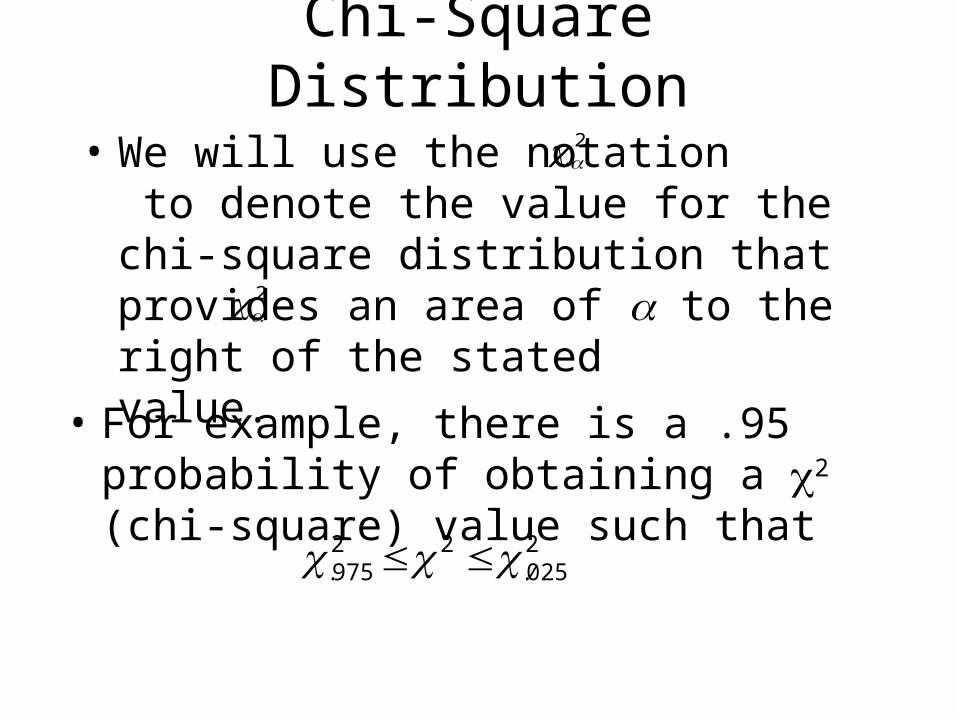
Chi-Square Distribution
• For example, there is a .95 probability of obtaining a 2 (chi-square) value such that
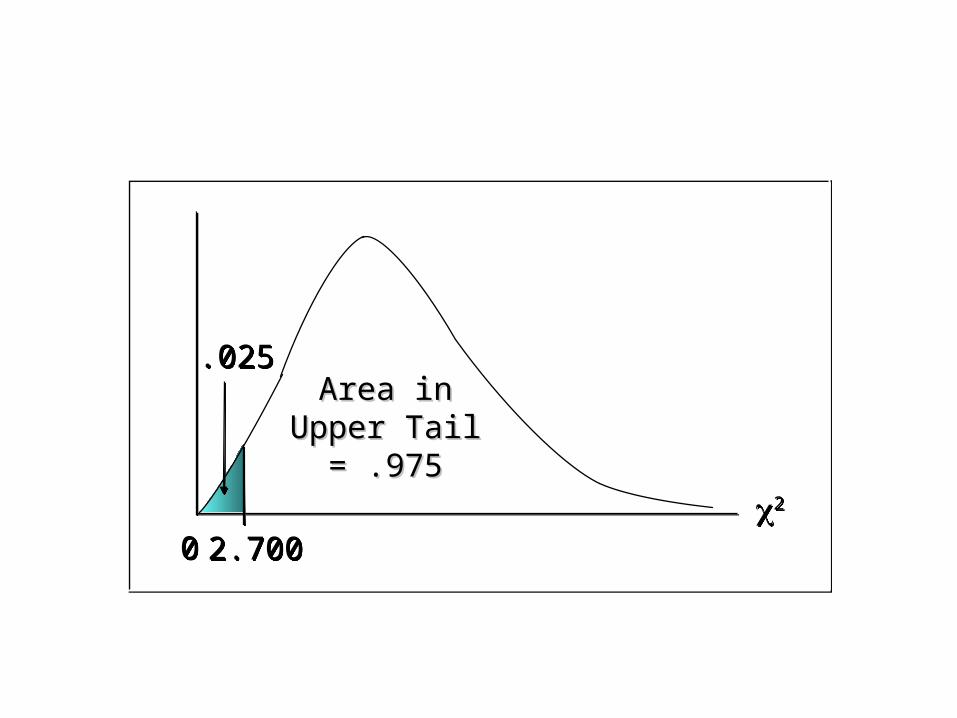
• We will use the notation to denote the value for the chi-square distribution that provides an area of to the right of the stated value.
2
2
2025.
22975.
Degrees
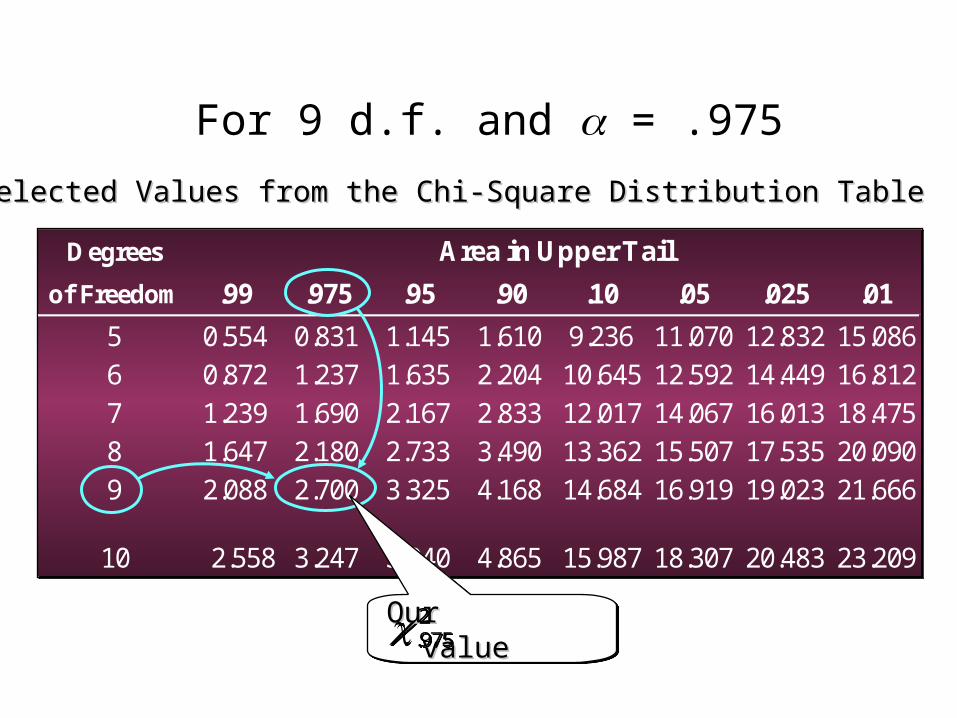
of Freedom .99 .975 .95 .90 .10 .05 .025 .01
5 0.554 0.831 1.145 1.610 9.236 11.070 12.832 15.0866 0.872 1.237 1.635 2.204 10.645 12.592 14.449 16.8127 1.239 1.690 2.167 2.833 12.017 14.067 16.013 18.4758 1.647 2.180 2.733 3.490 13.362 15.507 17.535 20.0909 2.088 2.700 3.325 4.168 14.684 16.919 19.023 21.666
10 2.558 3.247 3.940 4.865 15.987 18.307 20.483 23.209
Area in Upper TailDegrees
of Freedom .99 .975 .95 .90 .10 .05 .025 .01
5 0.554 0.831 1.145 1.610 9.236 11.070 12.832 15.0866 0.872 1.237 1.635 2.204 10.645 12.592 14.449 16.8127 1.239 1.690 2.167 2.833 12.017 14.067 16.013 18.4758 1.647 2.180 2.733 3.490 13.362 15.507 17.535 20.0909 2.088 2.700 3.325 4.168 14.684 16.919 19.023 21.666
10 2.558 3.247 3.940 4.865 15.987 18.307 20.483 23.209
Area in Upper Tail
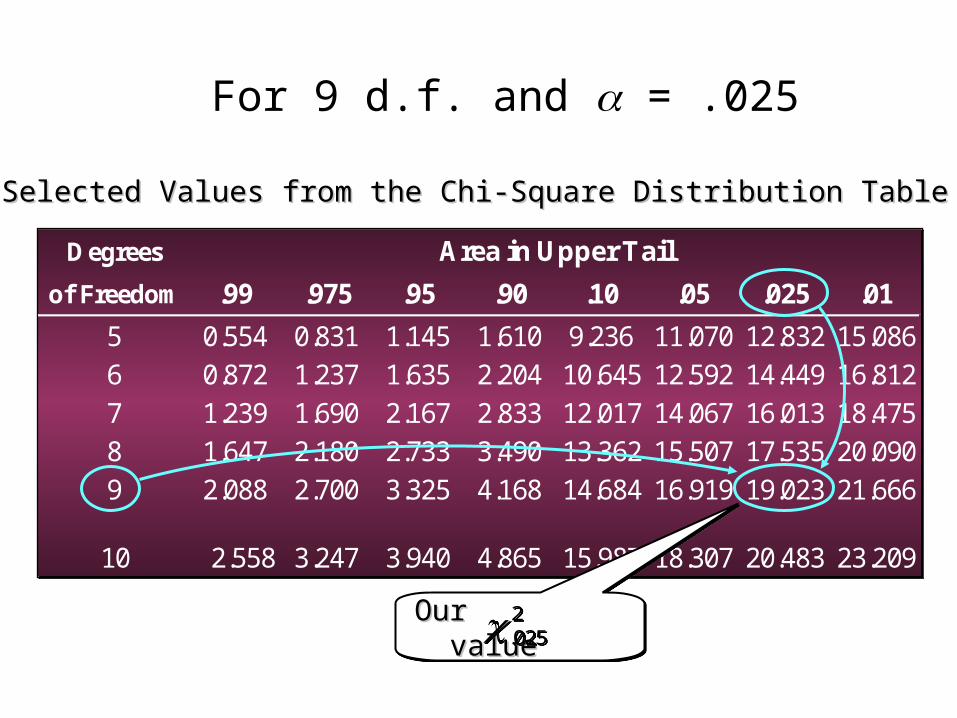
Selected Values from the Chi-Square Distribution TableSelected Values from the Chi-Square Distribution Table
Our Our value value
Our Our value value
2.9752.975
For 9 d.f. and = .975
22
00
.025.025Area inArea in
Upper TailUpper Tail= .975= .975
2.7002.700
Degrees
of Freedom .99 .975 .95 .90 .10 .05 .025 .01
5 0.554 0.831 1.145 1.610 9.236 11.070 12.832 15.0866 0.872 1.237 1.635 2.204 10.645 12.592 14.449 16.8127 1.239 1.690 2.167 2.833 12.017 14.067 16.013 18.4758 1.647 2.180 2.733 3.490 13.362 15.507 17.535 20.0909 2.088 2.700 3.325 4.168 14.684 16.919 19.023 21.666
10 2.558 3.247 3.940 4.865 15.987 18.307 20.483 23.209
Area in Upper TailDegrees
of Freedom .99 .975 .95 .90 .10 .05 .025 .01
5 0.554 0.831 1.145 1.610 9.236 11.070 12.832 15.0866 0.872 1.237 1.635 2.204 10.645 12.592 14.449 16.8127 1.239 1.690 2.167 2.833 12.017 14.067 16.013 18.4758 1.647 2.180 2.733 3.490 13.362 15.507 17.535 20.0909 2.088 2.700 3.325 4.168 14.684 16.919 19.023 21.666
10 2.558 3.247 3.940 4.865 15.987 18.307 20.483 23.209
Area in Upper Tail
Selected Values from the Chi-Square Distribution TableSelected Values from the Chi-Square Distribution Table
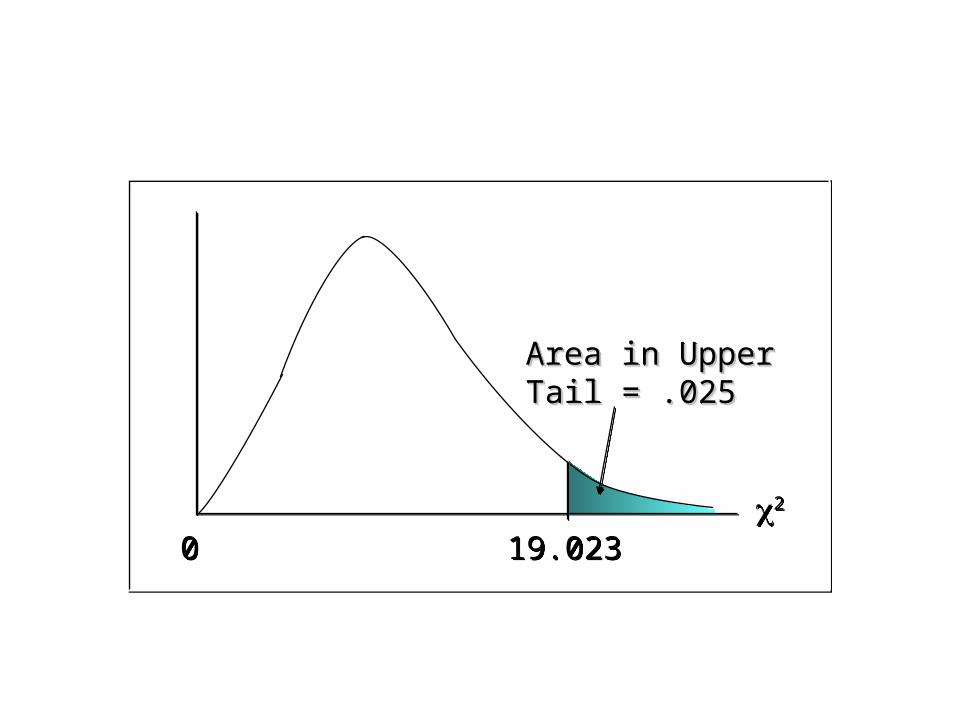
For 9 d.f. and = .025
Our Our value value
Our Our value value 2
.025 2
.025
22
00 19.02319.023
Area in UpperArea in UpperTail = .025Tail = .025Area in UpperArea in UpperTail = .025Tail = .025
Degrees
of Freedom .99 .975 .95 .90 .10 .05 .025 .01
5 0.554 0.831 1.145 1.610 9.236 11.070 12.832 15.0866 0.872 1.237 1.635 2.204 10.645 12.592 14.449 16.8127 1.239 1.690 2.167 2.833 12.017 14.067 16.013 18.4758 1.647 2.180 2.733 3.490 13.362 15.507 17.535 20.0909 2.088 2.700 3.325 4.168 14.684 16.919 19.023 21.666
10 2.558 3.247 3.940 4.865 15.987 18.307 20.483 23.209
Area in Upper TailDegrees
of Freedom .99 .975 .95 .90 .10 .05 .025 .01
5 0.554 0.831 1.145 1.610 9.236 11.070 12.832 15.0866 0.872 1.237 1.635 2.204 10.645 12.592 14.449 16.8127 1.239 1.690 2.167 2.833 12.017 14.067 16.013 18.4758 1.647 2.180 2.733 3.490 13.362 15.507 17.535 20.0909 2.088 2.700 3.325 4.168 14.684 16.919 19.023 21.666
10 2.558 3.247 3.940 4.865 15.987 18.307 20.483 23.209
Area in Upper Tail
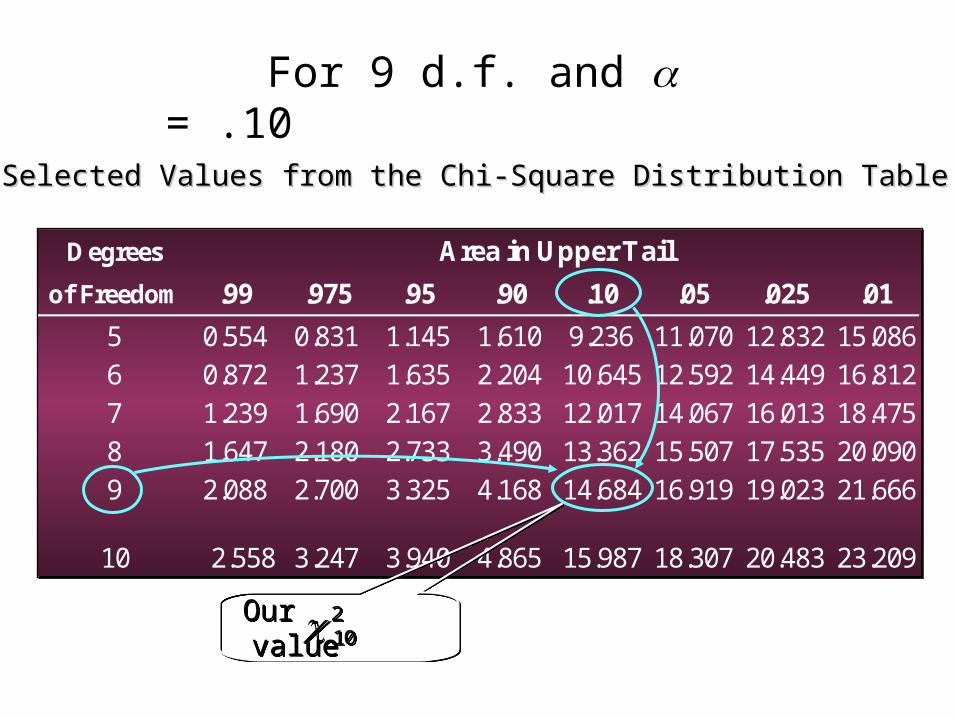
Selected Values from the Chi-Square Distribution TableSelected Values from the Chi-Square Distribution Table
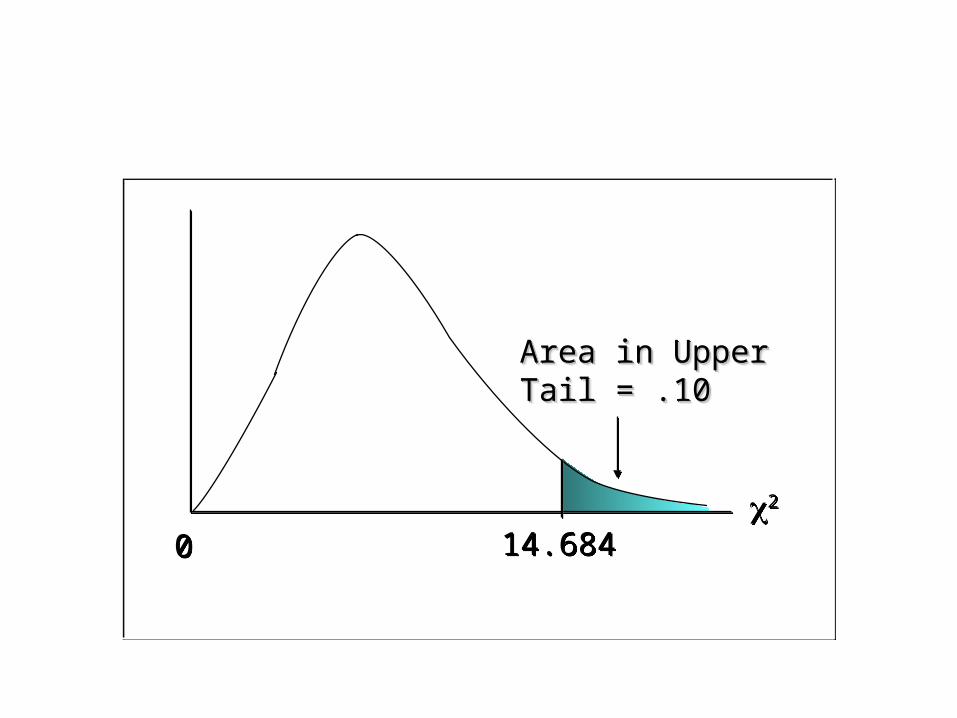
For 9 d.f. and = .10
Our value Our value
2.10 2.10
22
00 14.68414.684
Area in UpperArea in UpperTail = .10Tail = .10Area in UpperArea in UpperTail = .10Tail = .10
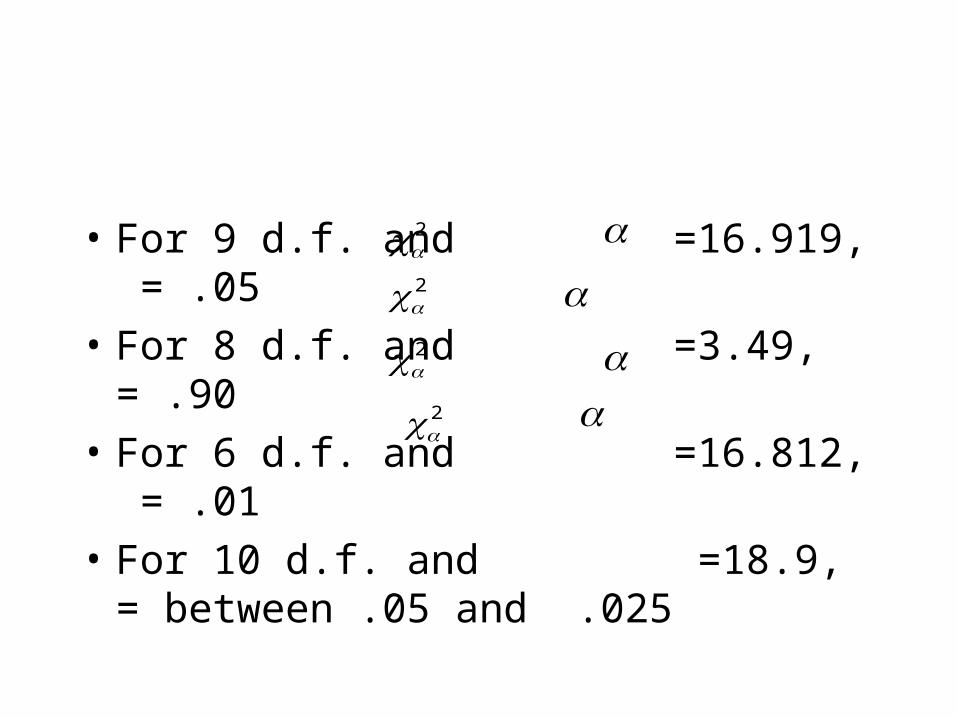
• For 9 d.f. and =16.919, = .05
• For 8 d.f. and =3.49, = .90
• For 6 d.f. and =16.812, = .01
• For 10 d.f. and =18.9, = between .05 and .025
2 22
2
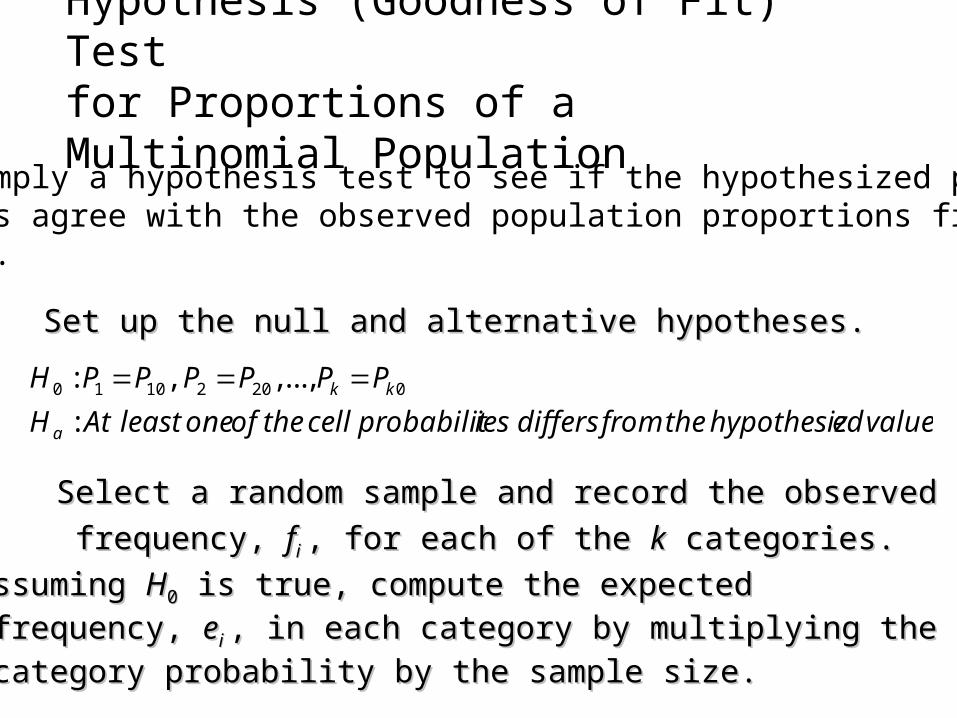
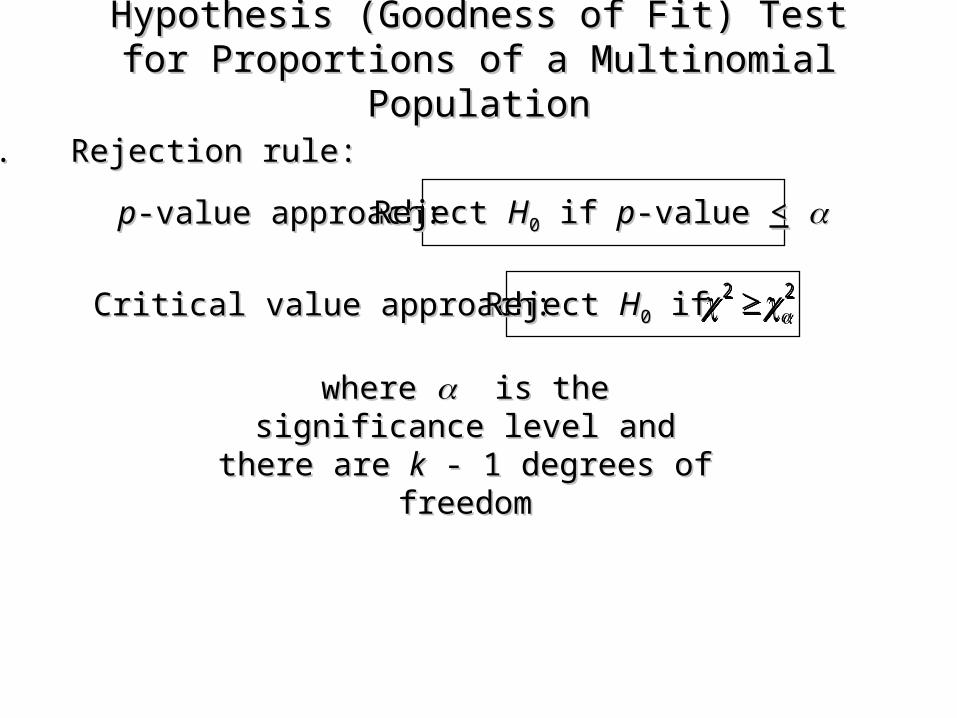
Hypothesis (Goodness of Fit) Testfor Proportions of a Multinomial Population
1. Set up the null and alternative hypotheses.1. Set up the null and alternative hypotheses.
2. Select a random sample and record the observed2. Select a random sample and record the observed
frequency, frequency, ffi i , for each of the , for each of the kk categories. categories.
3. Assuming 3. Assuming HH00 is true, compute the expected is true, compute the expected frequency, frequency, eei i , in each category by multiplying the, in each category by multiplying the category probability by the sample size.category probability by the sample size.
This is simply a hypothesis test to see if the hypothesized populationproportions agree with the observed population proportions from our sample.
valueedhypothesizthefromdiffersiesprobabilitcelltheofoneleastAtH
PPPPPPH
a
kk
:
,...,,: 02021010
Hypothesis (Goodness of Fit) TestHypothesis (Goodness of Fit) Testfor Proportions of a Multinomial for Proportions of a Multinomial
PopulationPopulation
22
1
( )f ee
i i
ii
k2
2
1
( )f ee
i i
ii
k
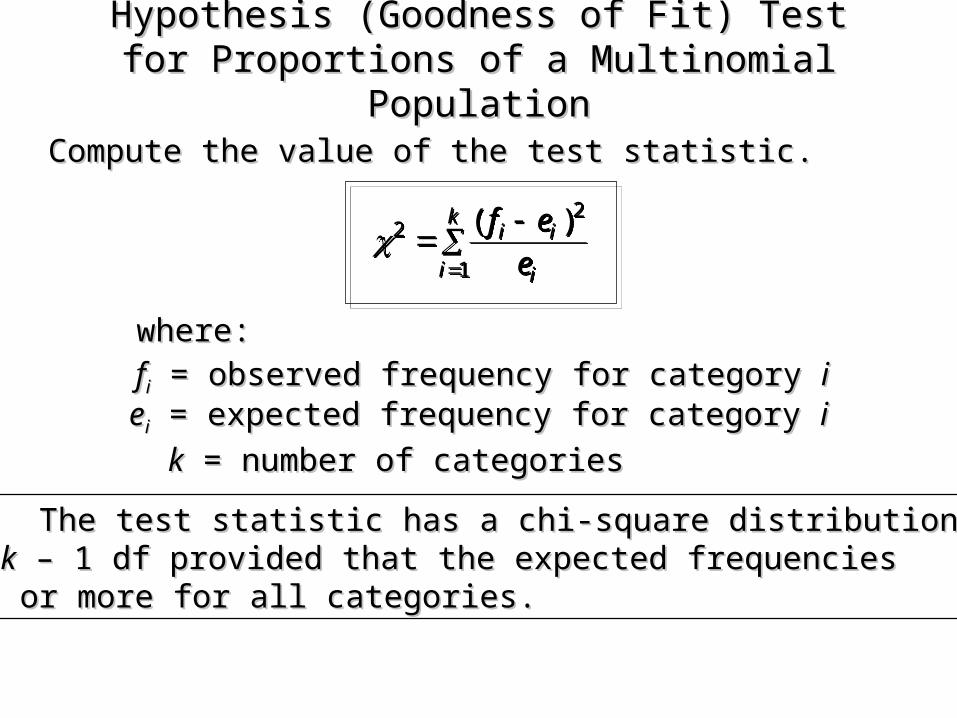
4. Compute the value of the test statistic.4. Compute the value of the test statistic.
Note: The test statistic has a chi-square distributionNote: The test statistic has a chi-square distributionwith with kk – 1 df provided that the expected frequencies – 1 df provided that the expected frequenciesare 5 or more for all categories.are 5 or more for all categories.
ffii = observed frequency for category = observed frequency for category iieeii = expected frequency for category = expected frequency for category ii
kk = number of categories = number of categories
where:where:
Hypothesis (Goodness of Fit) TestHypothesis (Goodness of Fit) Testfor Proportions of a Multinomial for Proportions of a Multinomial
PopulationPopulation
where where is the significance is the significance level andlevel and
there are there are kk - 1 degrees of - 1 degrees of freedomfreedom
pp-value approach:-value approach:
Critical value approach:Critical value approach:
Reject Reject HH00 if if pp-value -value <<
5. Rejection rule:5. Rejection rule:
2 2 2 2 Reject Reject HH00 if if
Multinomial Distribution Goodness of Fit Test
• Example: Finger Lakes Homes (A) Finger Lakes Homes manufacturesFinger Lakes Homes manufactures
four models of prefabricated homes,four models of prefabricated homes,
a two-story colonial, a log cabin, aa two-story colonial, a log cabin, a
split-level, and an A-frame. To helpsplit-level, and an A-frame. To help
in production planning, managementin production planning, management
would like to determine if previous would like to determine if previous
customer purchases indicate that therecustomer purchases indicate that there
is a preference in the style selected.is a preference in the style selected.
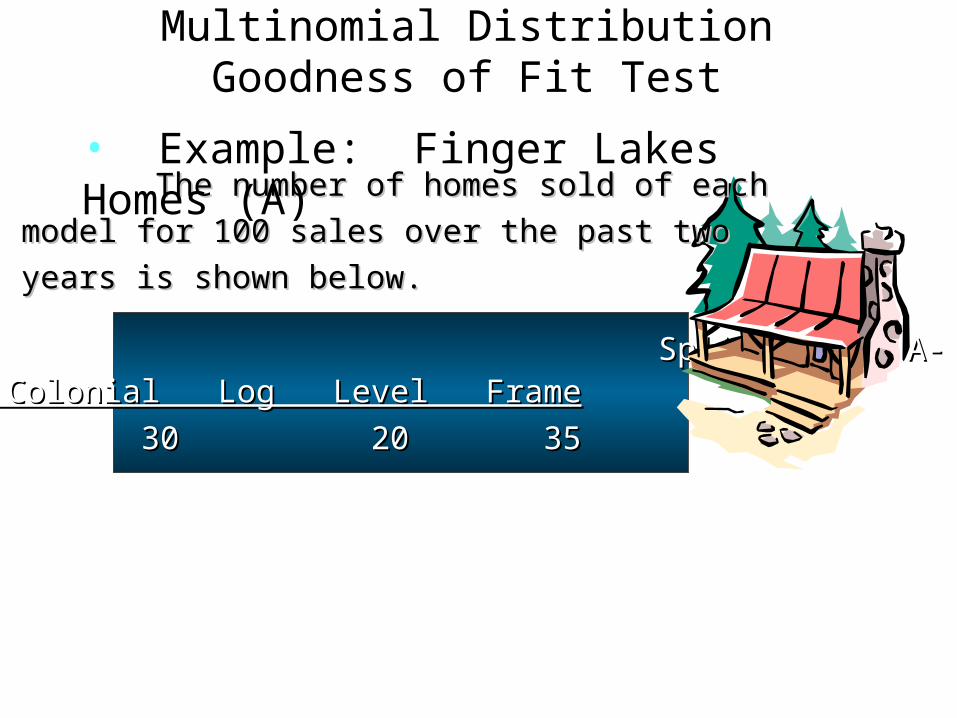
Split- A-Split- A-Model Colonial Log Level FrameModel Colonial Log Level Frame
# Sold# Sold 30 20 35 15 30 20 35 15
The number of homes sold of eachThe number of homes sold of each
model for 100 sales over the past twomodel for 100 sales over the past two
years is shown below.years is shown below.
Multinomial Distribution Goodness of Fit Test
• Example: Finger Lakes Homes (A)
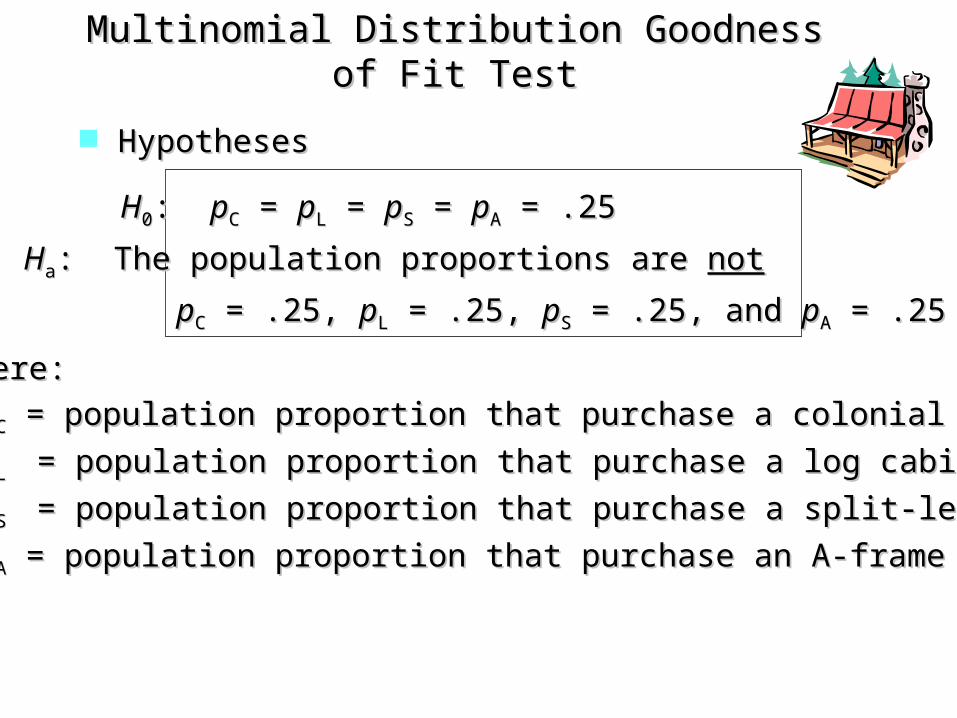
HypothesesHypotheses
Multinomial Distribution Goodness of Fit Multinomial Distribution Goodness of Fit TestTest
where:where:
ppCC = population proportion that purchase a colonial = population proportion that purchase a colonial
ppL L = population proportion that purchase a log cabin = population proportion that purchase a log cabin
ppS S = population proportion that purchase a split-level = population proportion that purchase a split-level
ppAA = population proportion that purchase an A-frame = population proportion that purchase an A-frame
HH00: : ppCC = = ppLL = = ppSS = = ppAA = .25 = .25
HHaa: The population proportions are : The population proportions are notnot
ppCC = .25, = .25, ppLL = .25, = .25, ppSS = .25, and = .25, and ppAA = .25 = .25
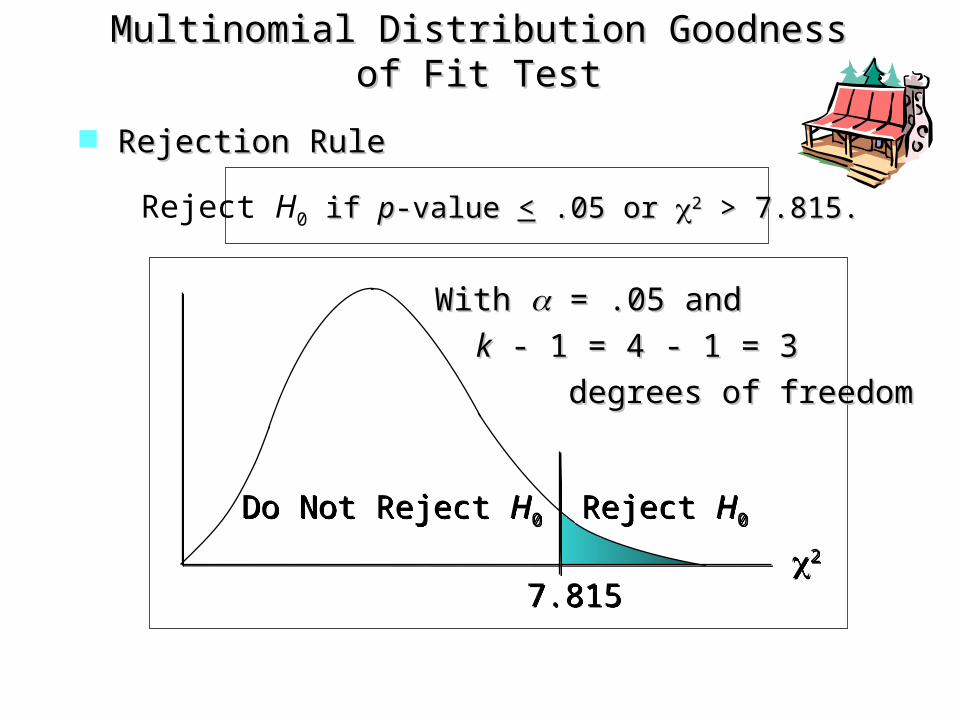
Rejection RuleRejection Rule
22
7.815 7.815
Do Not Reject H0Do Not Reject H0 Reject H0Reject H0
Multinomial Distribution Goodness of Fit Multinomial Distribution Goodness of Fit TestTest
With With = .05 and = .05 and
kk - 1 = 4 - 1 = 3 - 1 = 4 - 1 = 3
degrees of freedomdegrees of freedom
Reject H0 if if pp-value -value << .05 or .05 or 22 > 7.815. > 7.815.
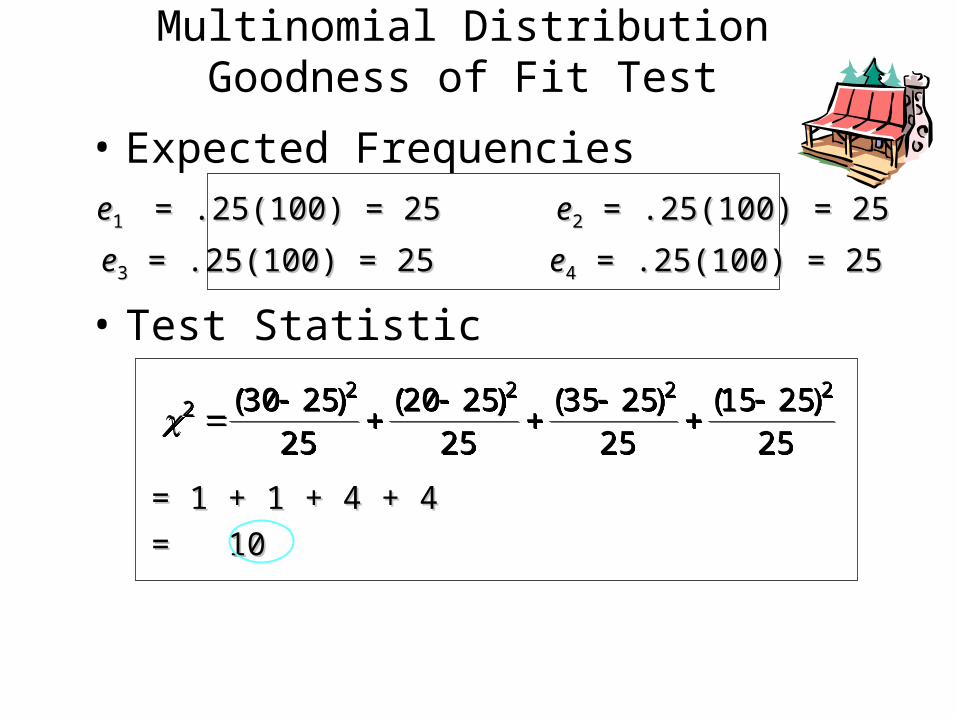
• Expected Frequencies
• Test Statistic
22 2 2 230 25
2520 25
2535 25
2515 25
25
( ) ( ) ( ) ( )22 2 2 230 25
2520 25
2535 25
2515 25
25
( ) ( ) ( ) ( )
Multinomial Distribution Goodness of Fit Test
ee1 1 = .25(100) = 25 = .25(100) = 25 ee22 = .25(100) = 25 = .25(100) = 25
ee33 = .25(100) = 25 = .25(100) = 25 ee44 = .25(100) = 25 = .25(100) = 25
= 1 + 1 + 4 + 4 = 1 + 1 + 4 + 4
= 10= 10
Multinomial Distribution Goodness of Fit Test
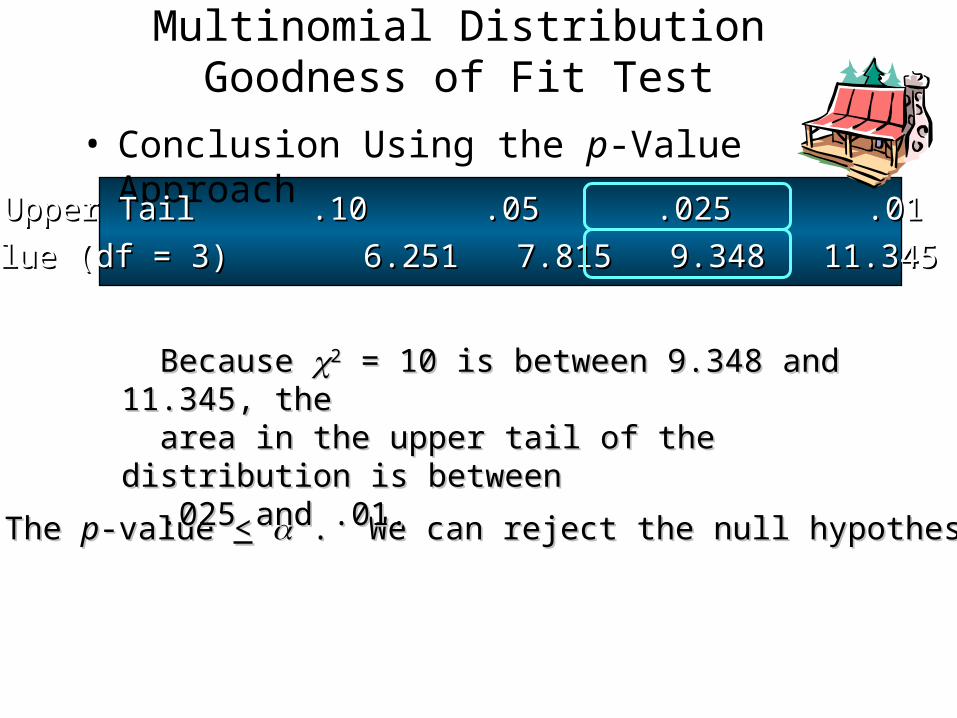
• Conclusion Using the p-Value Approach
The The pp-value -value << . We can reject the null hypothesis. . We can reject the null hypothesis.
Because Because 22 = 10 is between 9.348 and 11.345, = 10 is between 9.348 and 11.345, thethe area in the upper tail of the distribution is area in the upper tail of the distribution is betweenbetween .025 and .01..025 and .01.
Area in Upper Tail .10 .05 .025 .01 .005Area in Upper Tail .10 .05 .025 .01 .005
22 Value (df = 3) 6.251 7.815 9.348 11.345 12.838 Value (df = 3) 6.251 7.815 9.348 11.345 12.838
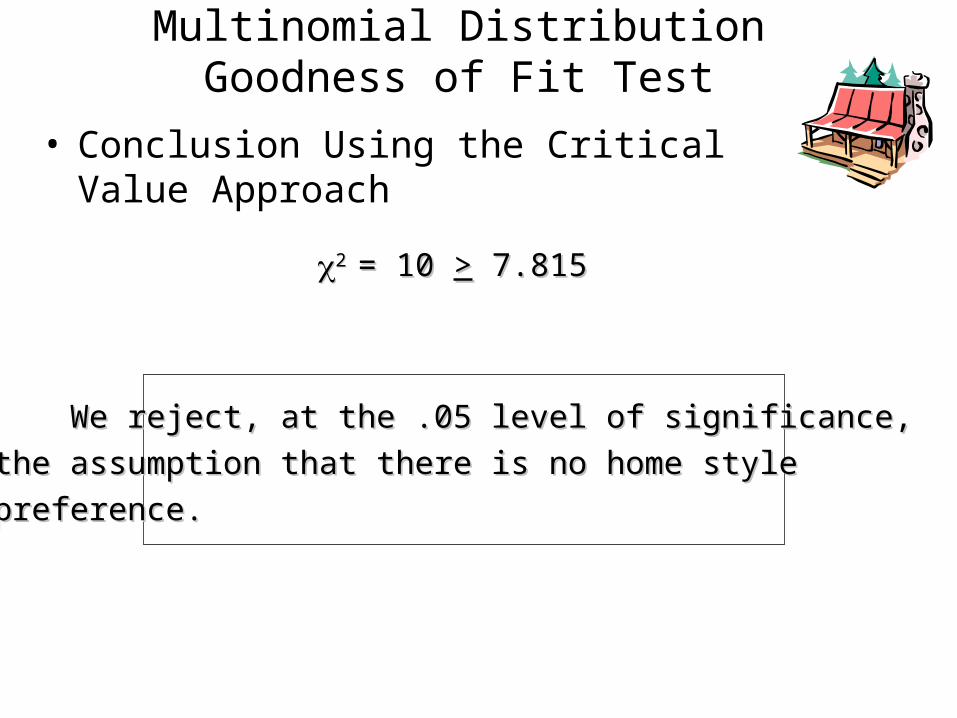
• Conclusion Using the Critical Value Approach
Multinomial Distribution Goodness of Fit Test
We reject, at the .05 level of significance,We reject, at the .05 level of significance,
the assumption that there is no home stylethe assumption that there is no home style
preference.preference.
2 2 = 10 = 10 >> 7.815 7.815
Related Documents