GGP Part II May 26, 2010 Pershing Square Capital Management, L.P.

GGP Ackman Presentation Ira Sohn Conf 5-26-10
Nov 18, 2014
Welcome message from author
This document is posted to help you gain knowledge. Please leave a comment to let me know what you think about it! Share it to your friends and learn new things together.
Transcript
GGP Part IIMay 26, 2010
Pershing Square Capital Management, L.P.
1
Disclaimer
The analyses and conclusions of Pershing Square Capital Management, L.P. ("Pershing Square") contained in this presentation are based on publicly available information. Pershing Square recognizes that there may be confidential information in the possession of the companies discussed in the presentation that could lead these companies to disagree with Pershing Square’s conclusions. This presentation and the information contained herein is not a recommendation or solicitation to buy or sell any securities.
The analyses provided may include certain statements, estimates and projections prepared with respect to, among other things, the historical and anticipated operating performance of the companies, access to capital markets and the values of assets and liabilities. Such statements, estimates, and projections reflect various assumptions by Pershing Square concerning anticipated results that are inherently subject to significant economic, competitive, and other uncertainties and contingencies and have been included solely for illustrative purposes. No representations, express or implied, are made as to the accuracy or completeness of such statements, estimates or projections or with respect to any other materials herein.
Pershing Square manages funds that are in the business of actively trading – buying and selling –securities and financial instruments. In particular, funds managed by Pershing Square and its affiliates have invested in long and short positions of certain mall REITs, including long debt and equity positions in General Growth Properties Inc. and other commitments to recapitalize that company. Pershing Square may currently or in the future change its position regarding any of the securities it owns. Pershing Square reserves the right to buy, sell, cover or otherwise change the form of its investment in any company for any reason. Pershing Square hereby disclaims any duty to provide any updates or changes to the analyses contained here including, without limitation, the manner or type of any Pershing Square investment.
2
Pershing Square Capital Management, L.P.
At Last Year’s Ira Sohn Conference, We Delivered a 67-page Presentation on General Growth Entitled:
2
The Buck’s Rebound Begins HereMay 27, 2009
3
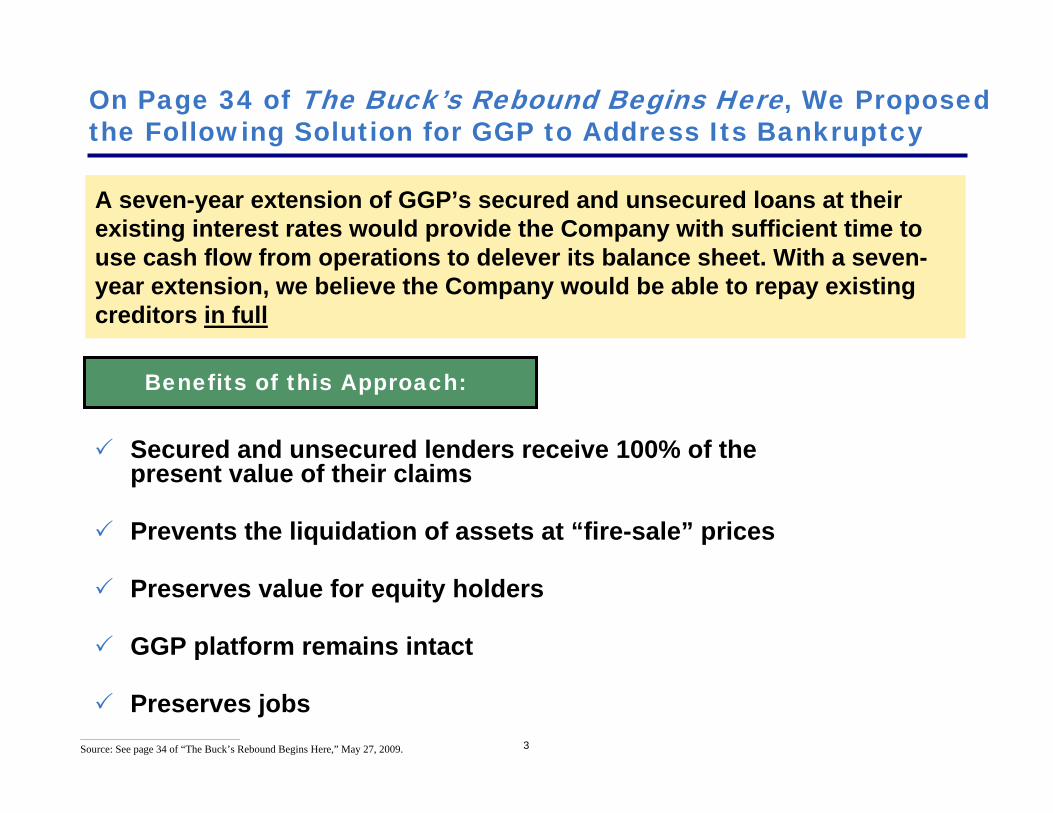
On Page 34 of The Buck’s Rebound Begins Here, We Proposed the Following Solution for GGP to Address Its Bankruptcy
A seven-year extension of GGP’s secured and unsecured loans at their existing interest rates would provide the Company with sufficient time to use cash flow from operations to delever its balance sheet. With a seven-year extension, we believe the Company would be able to repay existing creditors in full
Benefits of this Approach:
Secured and unsecured lenders receive 100% of the present value of their claims
Prevents the liquidation of assets at “fire-sale” prices
Preserves value for equity holders
GGP platform remains intact
Preserves jobs________________________________________________
Source: See page 34 of “The Buck’s Rebound Begins Here,” May 27, 2009.
4
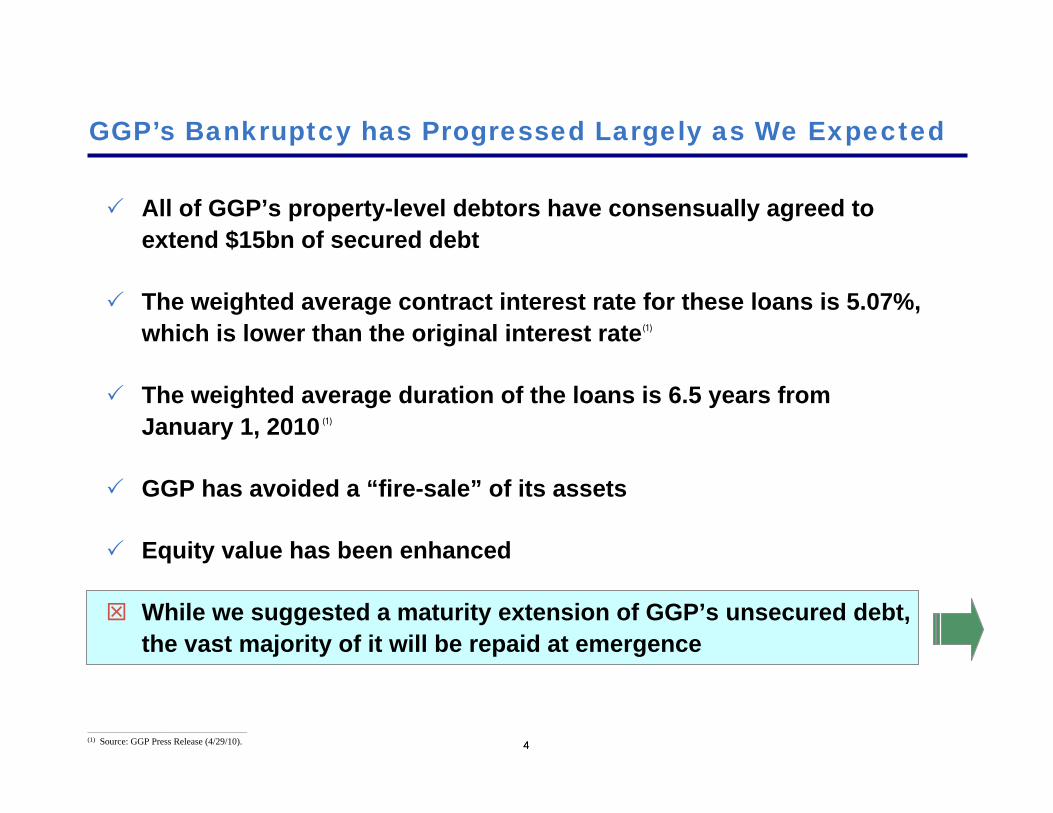
All of GGP’s property-level debtors have consensually agreed to extend $15bn of secured debt
The weighted average contract interest rate for these loans is 5.07%, which is lower than the original interest rate
The weighted average duration of the loans is 6.5 years from January 1, 2010
GGP has avoided a “fire-sale” of its assets
Equity value has been enhanced
While we suggested a maturity extension of GGP’s unsecured debt, the vast majority of it will be repaid at emergence
4
GGP’s Bankruptcy has Progressed Largely as We Expected
(1)
(1)
________________________________________________(1) Source: GGP Press Release (4/29/10).
55
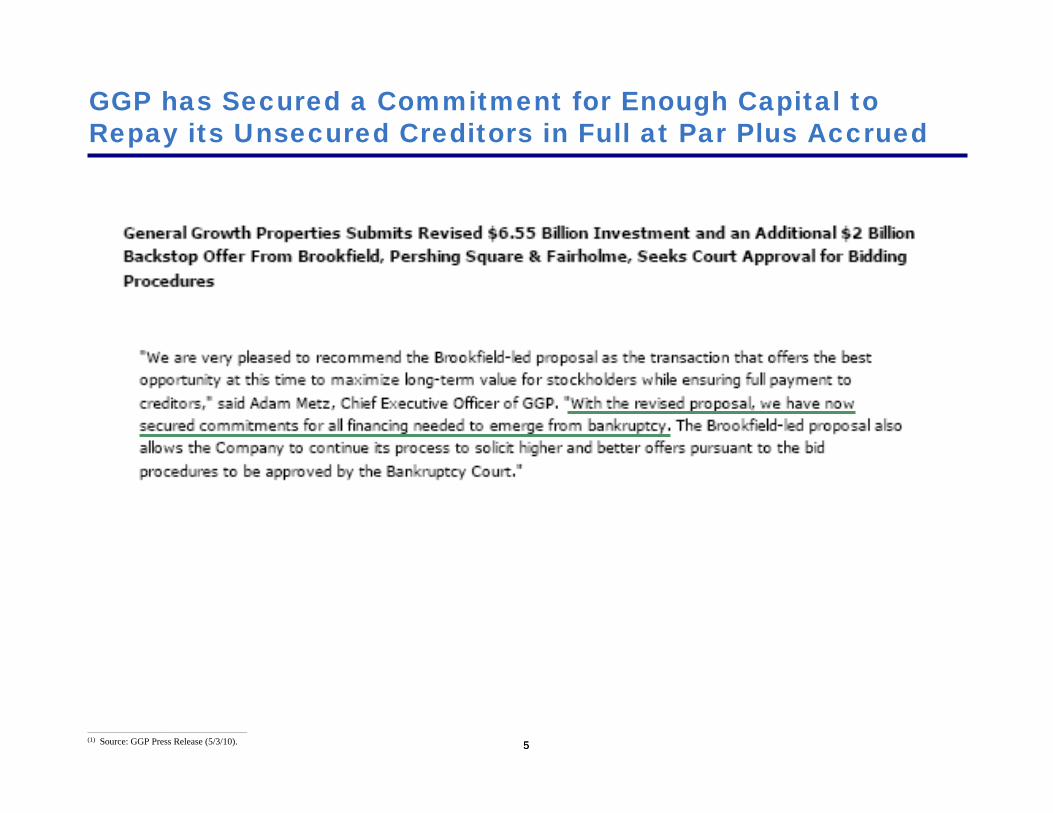
GGP has Secured a Commitment for Enough Capital to Repay its Unsecured Creditors in Full at Par Plus Accrued
________________________________________________(1) Source: GGP Press Release (5/3/10).
6
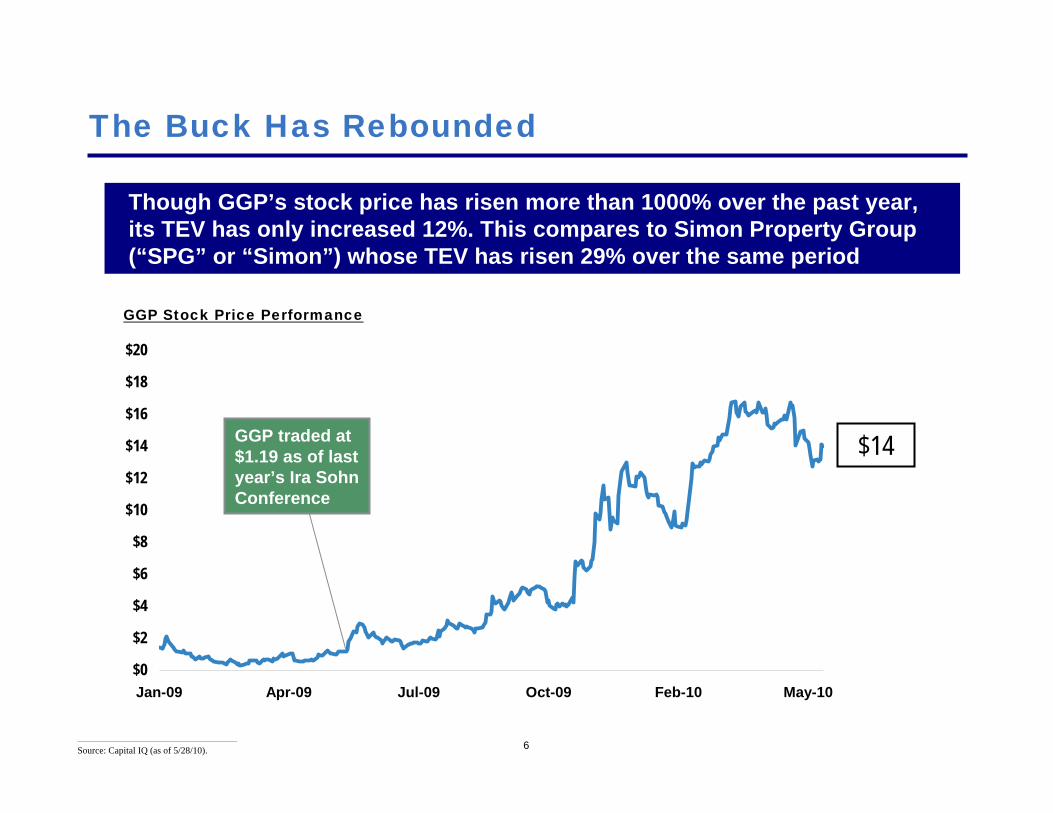
The Buck Has Rebounded
Though GGP’s stock price has risen more than 1000% over the past year, its TEV has only increased 12%. This compares to Simon Property Group (“SPG” or “Simon”) whose TEV has risen 29% over the same period
$14
GGP Stock Price Performance
________________________________________________
Source: Capital IQ (as of 5/28/10).
GGP traded at$1.19 as of lastyear’s Ira SohnConference
$0
$2
$4
$6
$8
$10
$12
$14
$16
$18
$20
Jan-09 Apr-09 Jul-09 Oct-09 Feb-10 May-10
A Little Context…
8
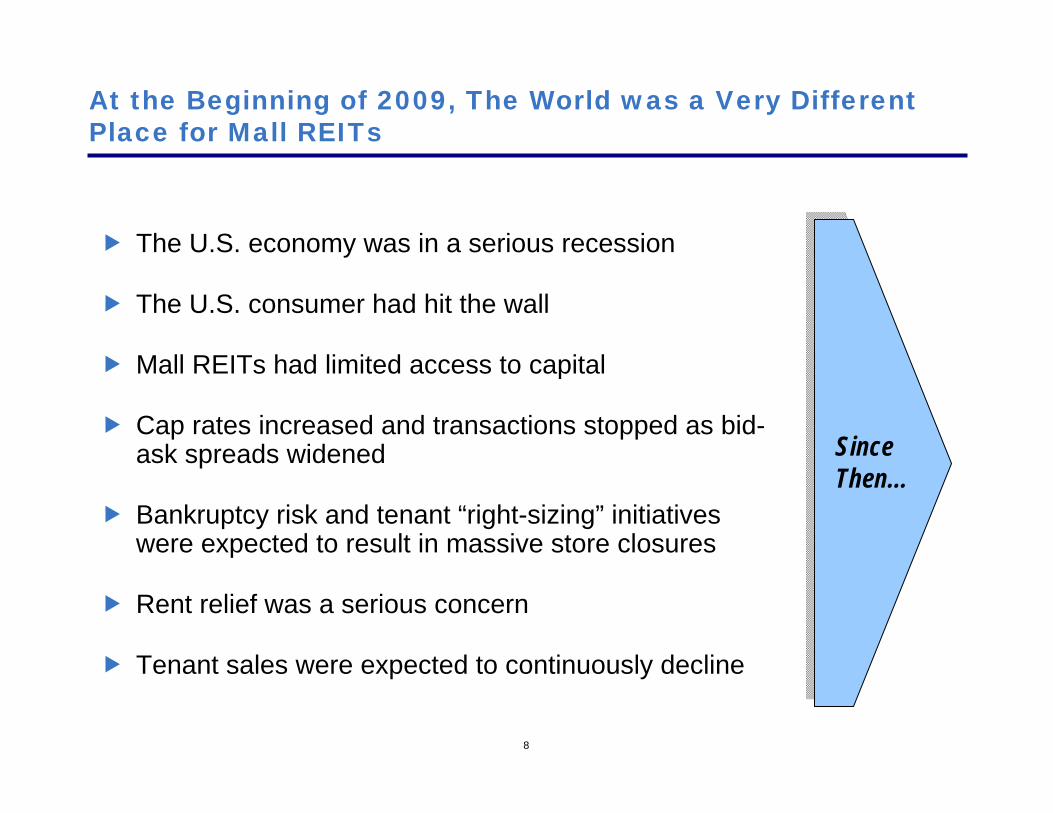
At the Beginning of 2009, The World was a Very Different Place for Mall REITs
The U.S. economy was in a serious recession
The U.S. consumer had hit the wall
Mall REITs had limited access to capital
Cap rates increased and transactions stopped as bid-ask spreads widened
Bankruptcy risk and tenant “right-sizing” initiatives were expected to result in massive store closures
Rent relief was a serious concern
Tenant sales were expected to continuously decline
SinceThen…
9
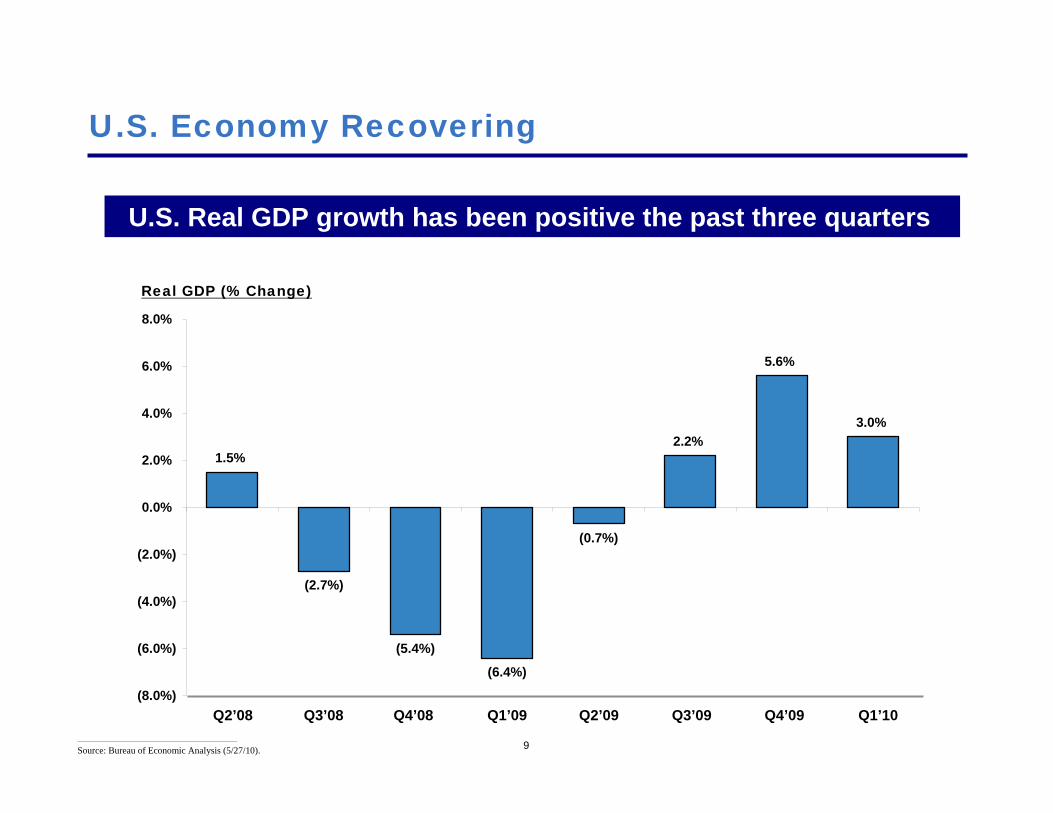
U.S. Economy Recovering
________________________________________________
Source: Bureau of Economic Analysis (5/27/10).
U.S. Real GDP growth has been positive the past three quarters
Real GDP (% Change)
Q2’08 Q3’08 Q4’08 Q1’09 Q2’09 Q3’09 Q4’09 Q1’10
1.5%
(2.7%)
(5.4%)
(6.4%)
(0.7%)
2.2%
5.6%
3.0%
(8.0%)
(6.0%)
(4.0%)
(2.0%)
0.0%
2.0%
4.0%
6.0%
8.0%
10
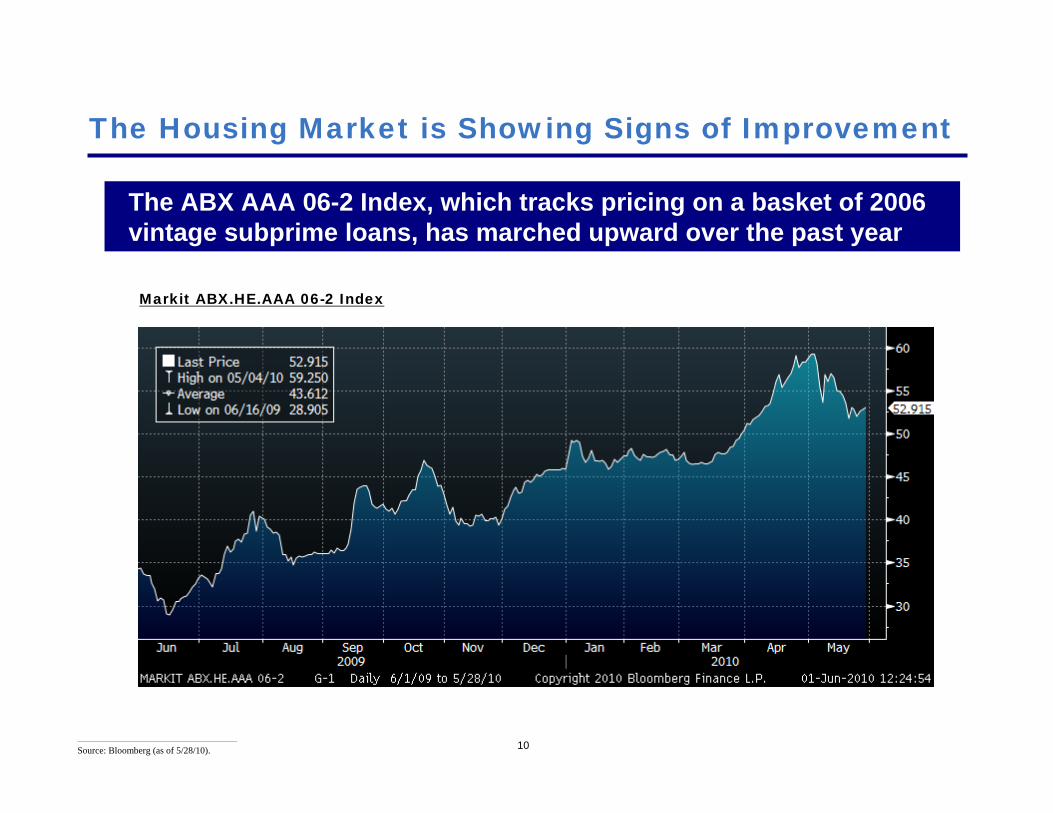
The Housing Market is Showing Signs of Improvement
________________________________________________
Source: Bloomberg (as of 5/28/10).
The ABX AAA 06-2 Index, which tracks pricing on a basket of 2006 vintage subprime loans, has marched upward over the past year
Markit ABX.HE.AAA 06-2 Index
11
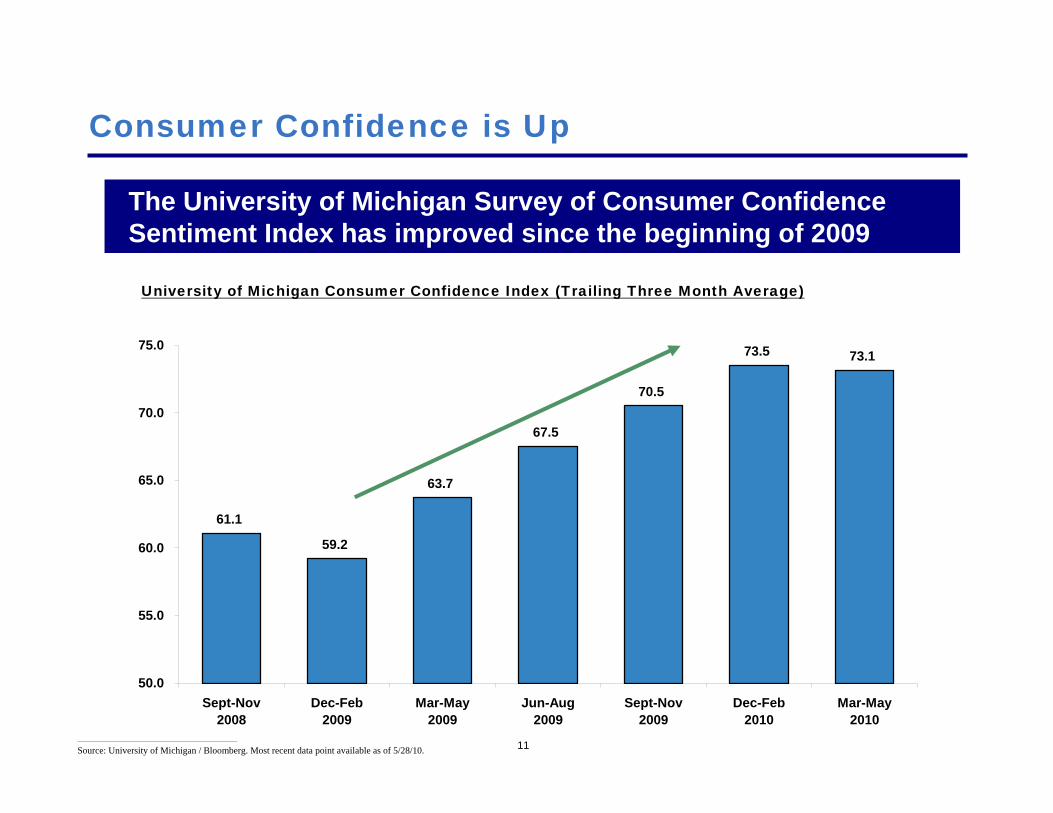
Consumer Confidence is Up
________________________________________________
Source: University of Michigan / Bloomberg. Most recent data point available as of 5/28/10.
The University of Michigan Survey of Consumer Confidence Sentiment Index has improved since the beginning of 2009
University of Michigan Consumer Confidence Index (Trailing Three Month Average)
61.1
59.2
63.7
67.5
70.5
73.5 73.1
50.0
55.0
60.0
65.0
70.0
75.0
Sept-Nov2008
Dec-Feb2009
Mar-May2009
Jun-Aug2009
Sept-Nov2009
Dec-Feb2010
Mar-May2010
12
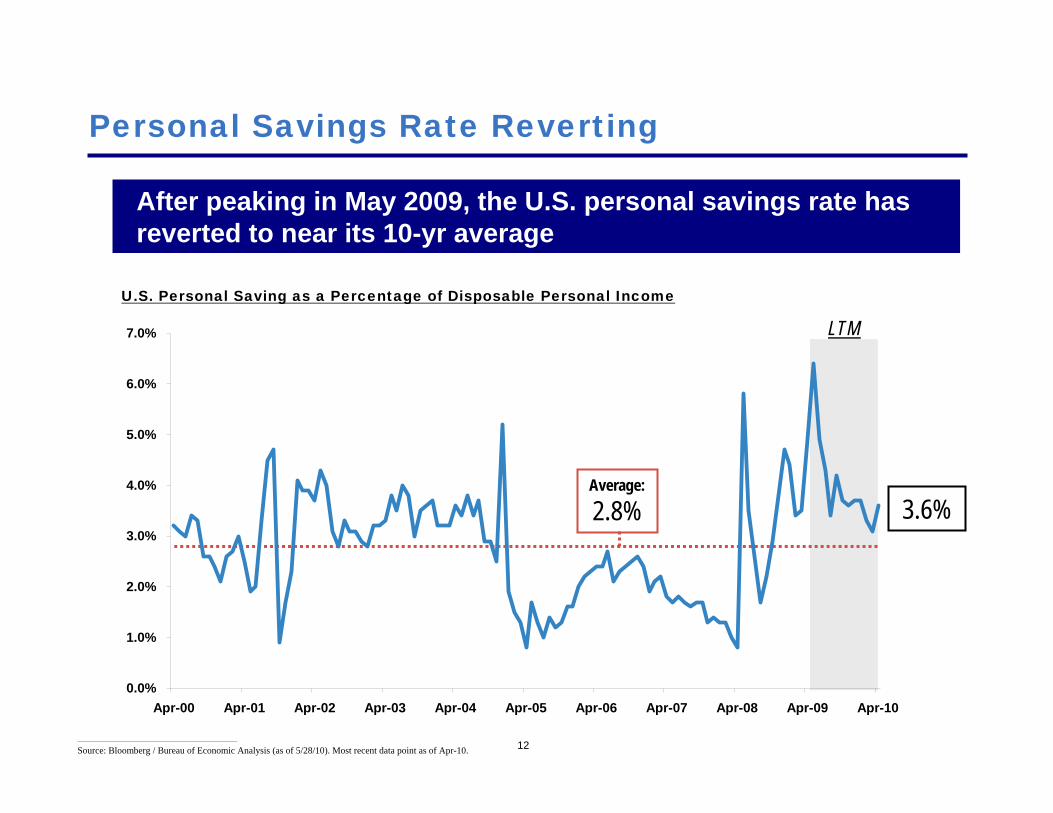
Personal Savings Rate Reverting
After peaking in May 2009, the U.S. personal savings rate has reverted to near its 10-yr average
U.S. Personal Saving as a Percentage of Disposable Personal Income
________________________________________________
Source: Bloomberg / Bureau of Economic Analysis (as of 5/28/10). Most recent data point as of Apr-10.
3.6%Average:
2.8%
LTM
0.0%
1.0%
2.0%
3.0%
4.0%
5.0%
6.0%
7.0%
Apr-00 Apr-01 Apr-02 Apr-03 Apr-04 Apr-05 Apr-06 Apr-07 Apr-08 Apr-09 Apr-10

13
Mall Traffic Improving
Consumers are returning to malls as evidenced by positive mall traffic trends year-to-date in 2010
________________________________________________
Source: Jefferies equity research (4/22/10).
1414
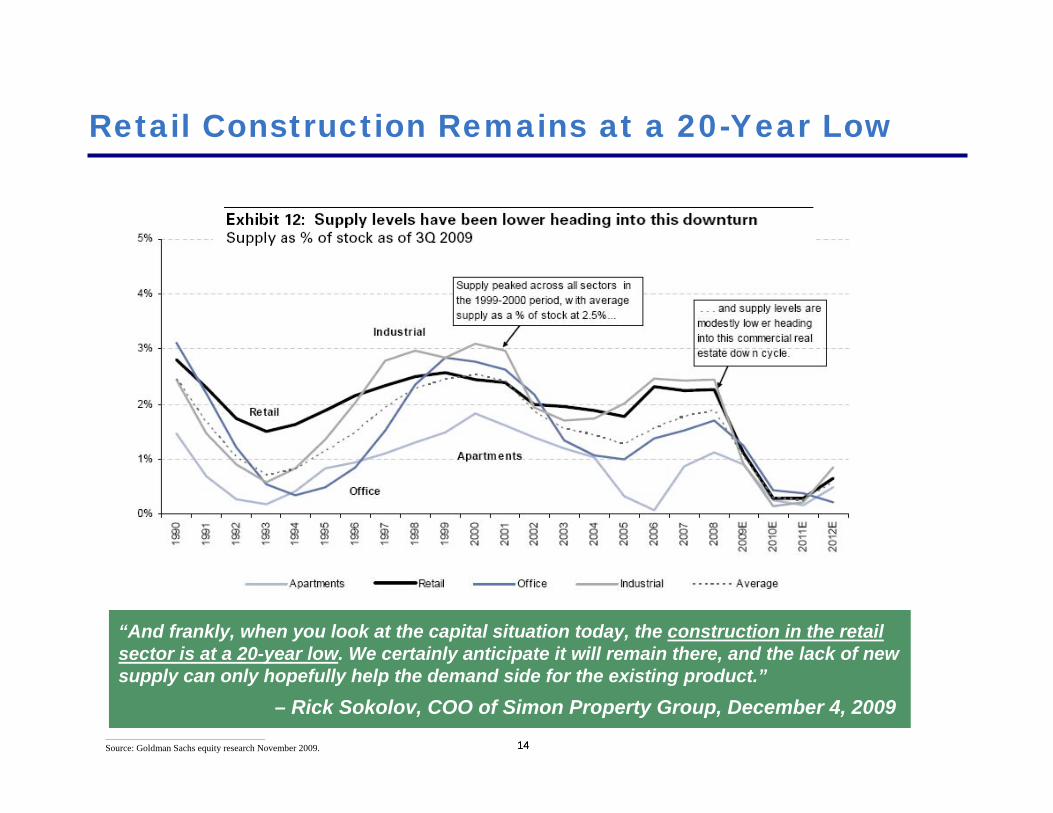
Retail Construction Remains at a 20-Year Low
________________________________________________
Source: Goldman Sachs equity research November 2009.
“And frankly, when you look at the capital situation today, the construction in the retail sector is at a 20-year low. We certainly anticipate it will remain there, and the lack of new supply can only hopefully help the demand side for the existing product.”
– Rick Sokolov, COO of Simon Property Group, December 4, 2009
15
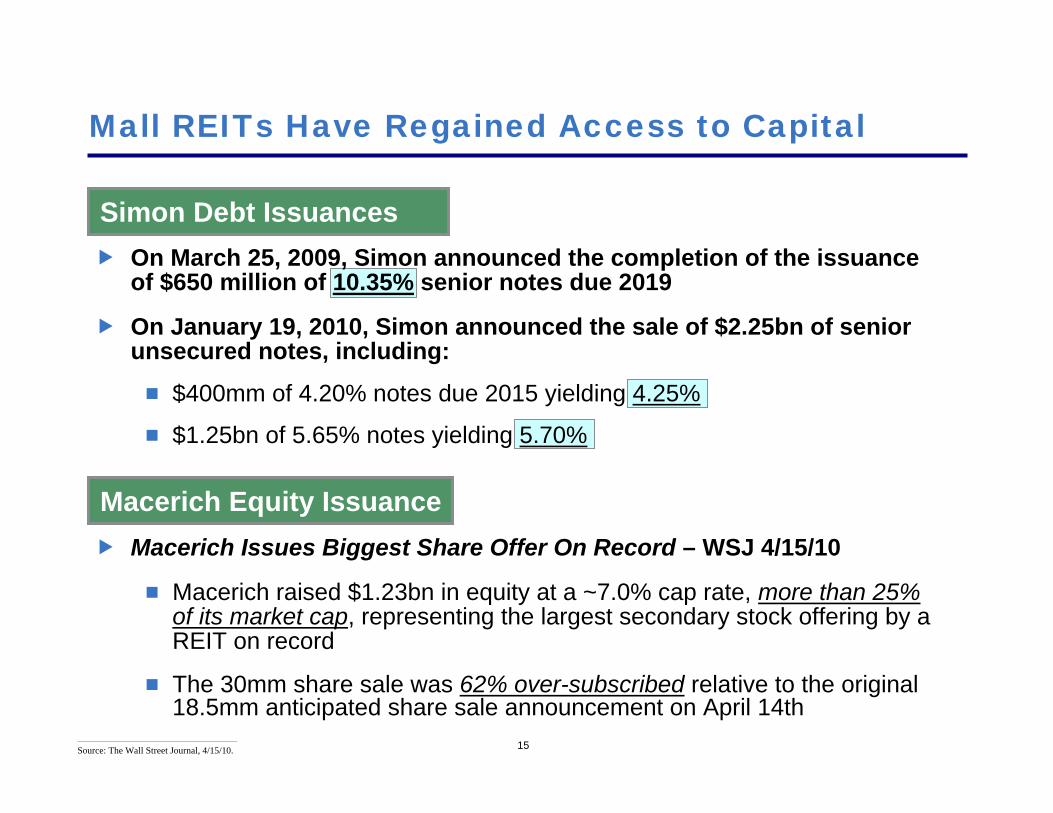
Mall REITs Have Regained Access to Capital
________________________________________________
Source: The Wall Street Journal, 4/15/10.
On March 25, 2009, Simon announced the completion of the issuance of $650 million of 10.35% senior notes due 2019
On January 19, 2010, Simon announced the sale of $2.25bn of senior unsecured notes, including:
$400mm of 4.20% notes due 2015 yielding 4.25%
$1.25bn of 5.65% notes yielding 5.70%
Macerich Issues Biggest Share Offer On Record – WSJ 4/15/10
Macerich raised $1.23bn in equity at a ~7.0% cap rate, more than 25%of its market cap, representing the largest secondary stock offering by a REIT on record
The 30mm share sale was 62% over-subscribed relative to the original 18.5mm anticipated share sale announcement on April 14th
Simon Debt Issuances
Macerich Equity Issuance
16
5.0%
5.5%
6.0%
6.5%
7.0%
7.5%
8.0%
8.5%
9.0%
9.5%
10.0%
Jan-05
Mar-05
May-05
Jul-0
5Sep
-05Nov-0
5Ja
n-06Mar
-06May
-06Ju
l-06
Sep-06
Nov-06
Jan-07
Mar-07
May-07
Jul-0
7Sep
-07Nov-0
7Ja
n-08Mar
-08May
-08Ju
l-08
Sep-08
Nov-08
Jan-09
Mar-09
May-09
Jul-0
9Sep
-09Nov-0
9Ja
n-10Mar
-10May
-10
Mall Implied Cap RateBaa
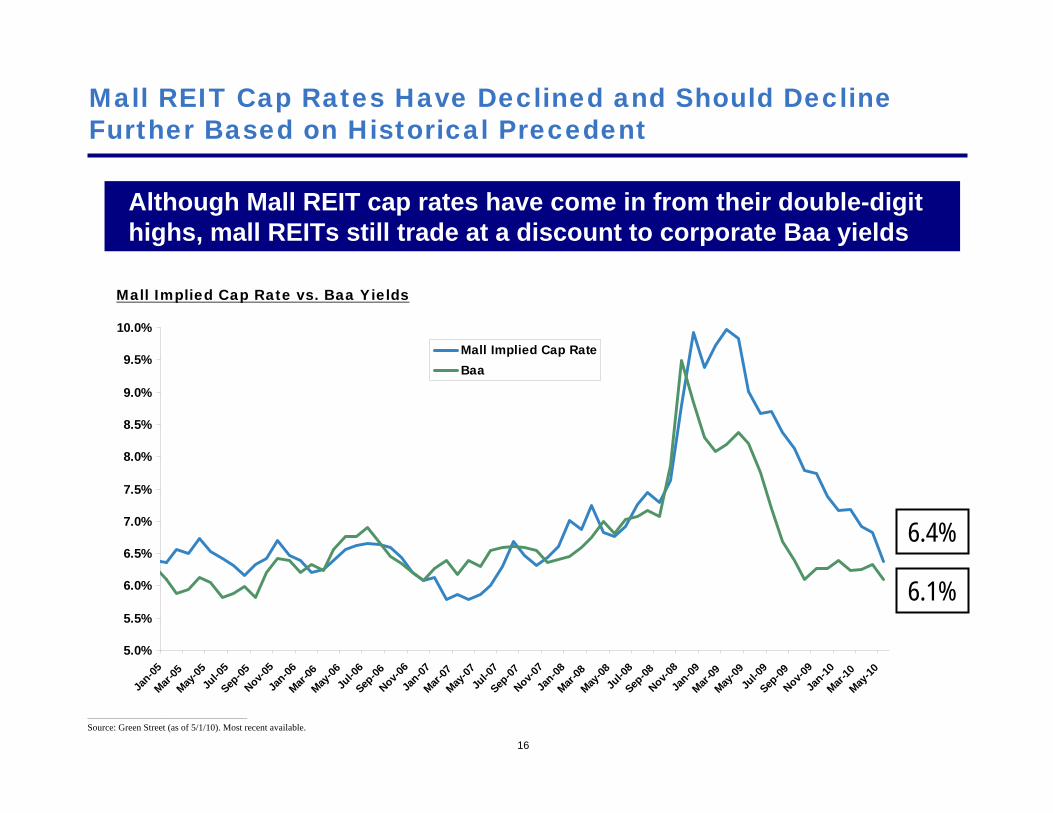
Mall REIT Cap Rates Have Declined and Should Decline Further Based on Historical Precedent
Although Mall REIT cap rates have come in from their double-digit highs, mall REITs still trade at a discount to corporate Baa yields
Mall Implied Cap Rate vs. Baa Yields
6.4%
6.1%
________________________________________________
Source: Green Street (as of 5/1/10). Most recent available.
17
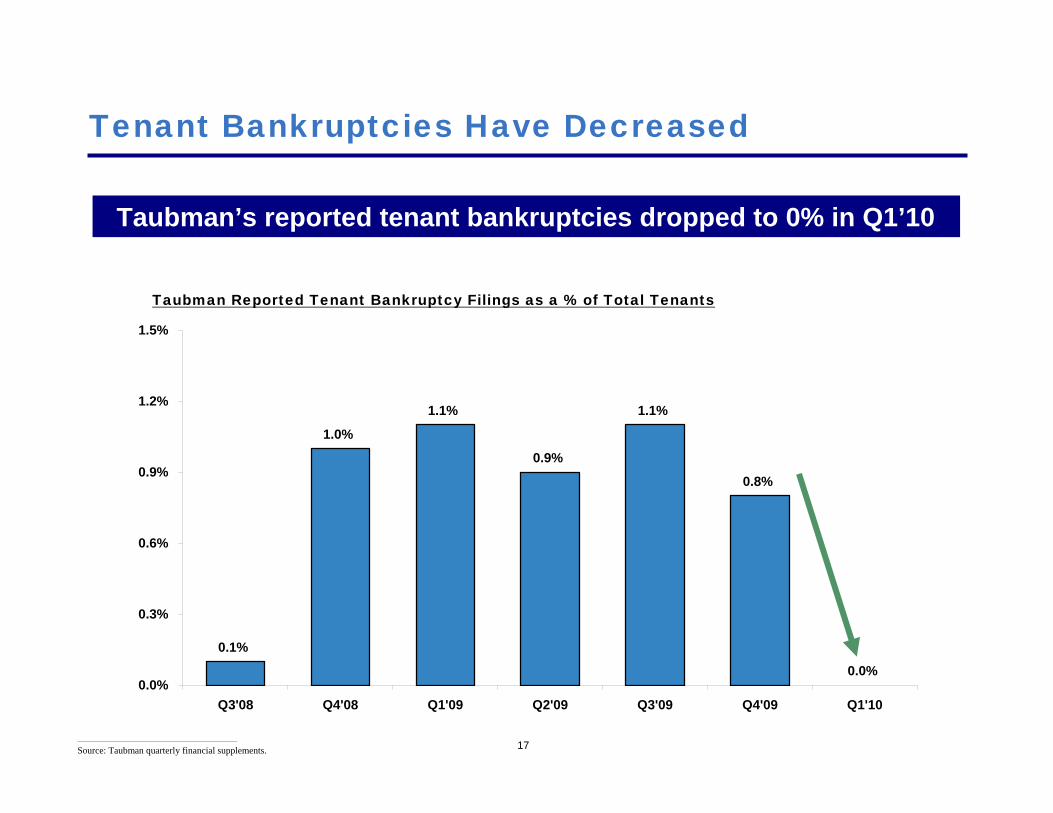
Tenant Bankruptcies Have Decreased
________________________________________________
Source: Taubman quarterly financial supplements.
Taubman’s reported tenant bankruptcies dropped to 0% in Q1’10
Taubman Reported Tenant Bankruptcy Filings as a % of Total Tenants
0.1%
1.0%
1.1%
0.9%
1.1%
0.8%
0.0%0.0%
0.3%
0.6%
0.9%
1.2%
1.5%
Q3'08 Q4'08 Q1'09 Q2'09 Q3'09 Q4'09 Q1'10
18
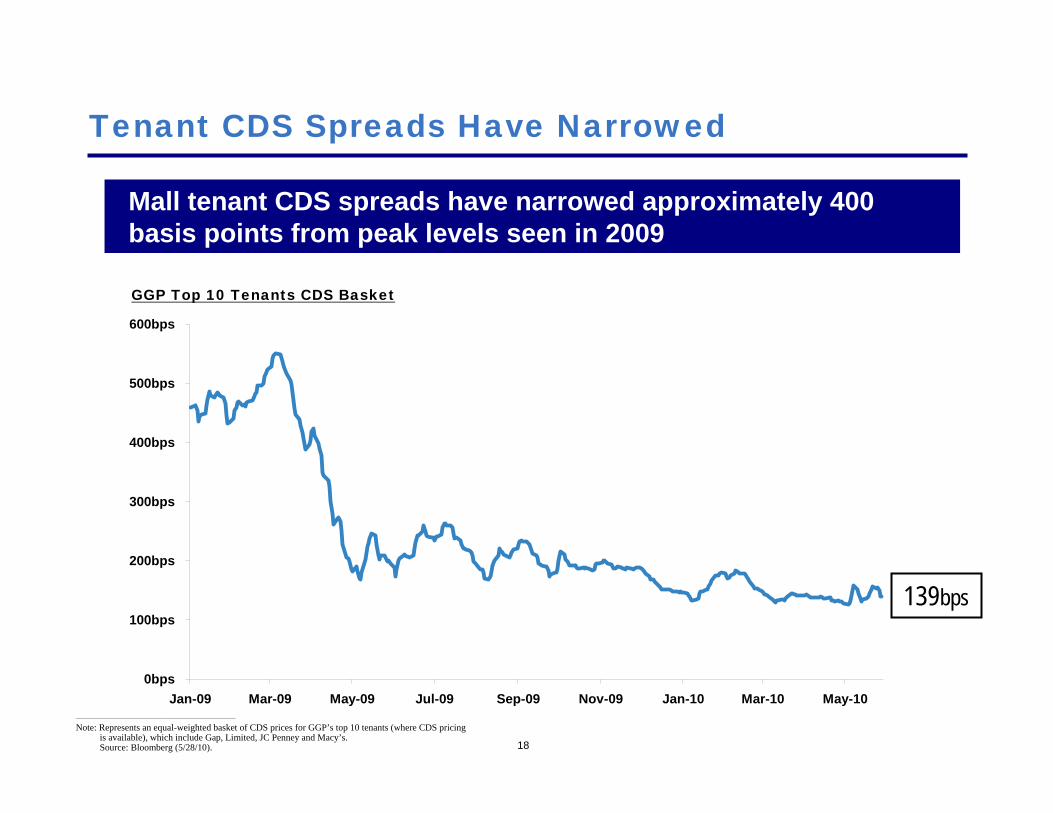
Tenant CDS Spreads Have Narrowed
Mall tenant CDS spreads have narrowed approximately 400 basis points from peak levels seen in 2009
139bps
GGP Top 10 Tenants CDS Basket
________________________________________________
Note: Represents an equal-weighted basket of CDS prices for GGP’s top 10 tenants (where CDS pricing is available), which include Gap, Limited, JC Penney and Macy’s.Source: Bloomberg (5/28/10).
0bps
100bps
200bps
300bps
400bps
500bps
600bps
Jan-09 Mar-09 May-09 Jul-09 Sep-09 Nov-09 Jan-10 Mar-10 May-10
1919
Simon expects to lose less than 2bps of total revenue as the result of rent relief concessions in 2009
Rent Relief Less of an Issue than Originally Anticipated
“Our 2009 rent relief total will be under $10 million, as in the $7 million to $8 million range. But as I think we said on the call last quarter, we hadn’t seen much of it year-to-date. So it’s a little back-end weighted, and as you look at the impact of average base rent it could have a nominal impact. But it’s a small number in the context of the size of our income statements.”
– Steve Sterrett, CFO of Simon Property Group, October 30, 2009
20
Mall Leasing Activity Picking Up Substantially
“Retail leasing activity increased significantly in the first quarter of 2010, with total in-line and outparcel tenant leasing deals covering 1.36 million square feet signed, an increase of 21% over the same period of last year. Within total deals, the number of new lease deals grew 84%, representing new deal square footage of approximately 284 thousand square feet. Although rents remain below 2007 peak levels, they have stabilized. As sales continue their upward trend, the Company expects lease rates to reflect those increases over time.”
– GGP Q1’10 Operating Supplement
21
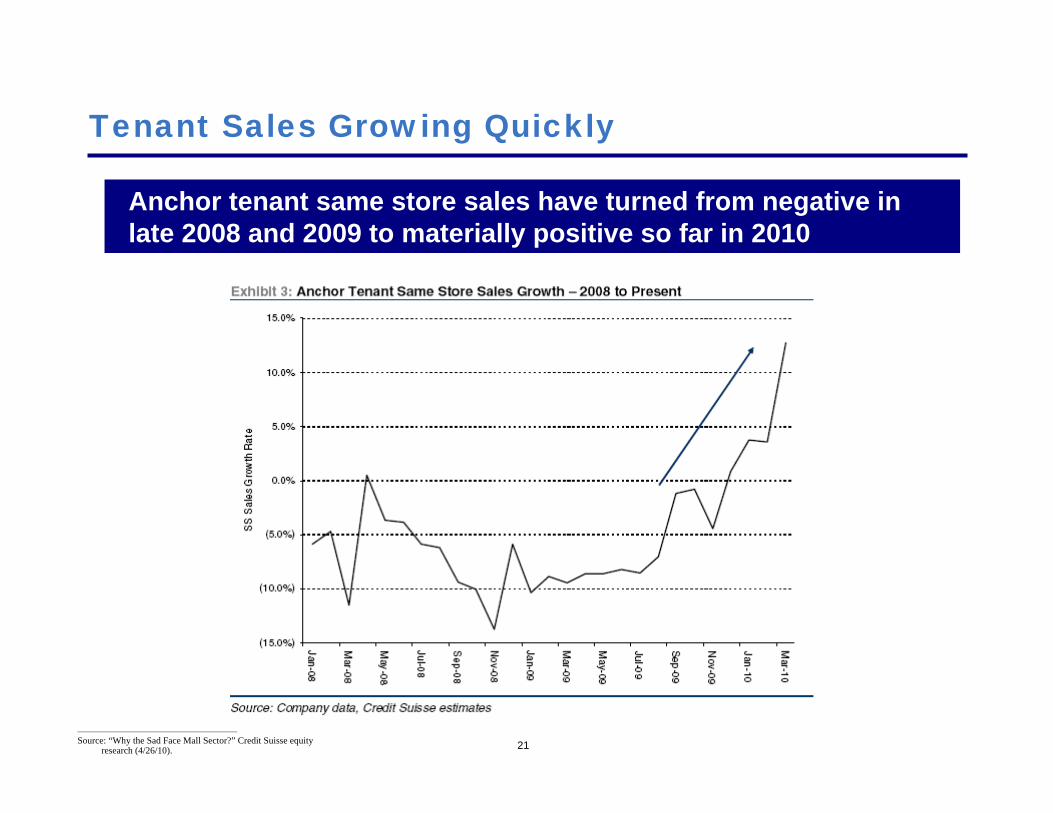
Tenant Sales Growing Quickly
________________________________________________
Source: “Why the Sad Face Mall Sector?” Credit Suisse equity research (4/26/10).
Anchor tenant same store sales have turned from negative in late 2008 and 2009 to materially positive so far in 2010
22
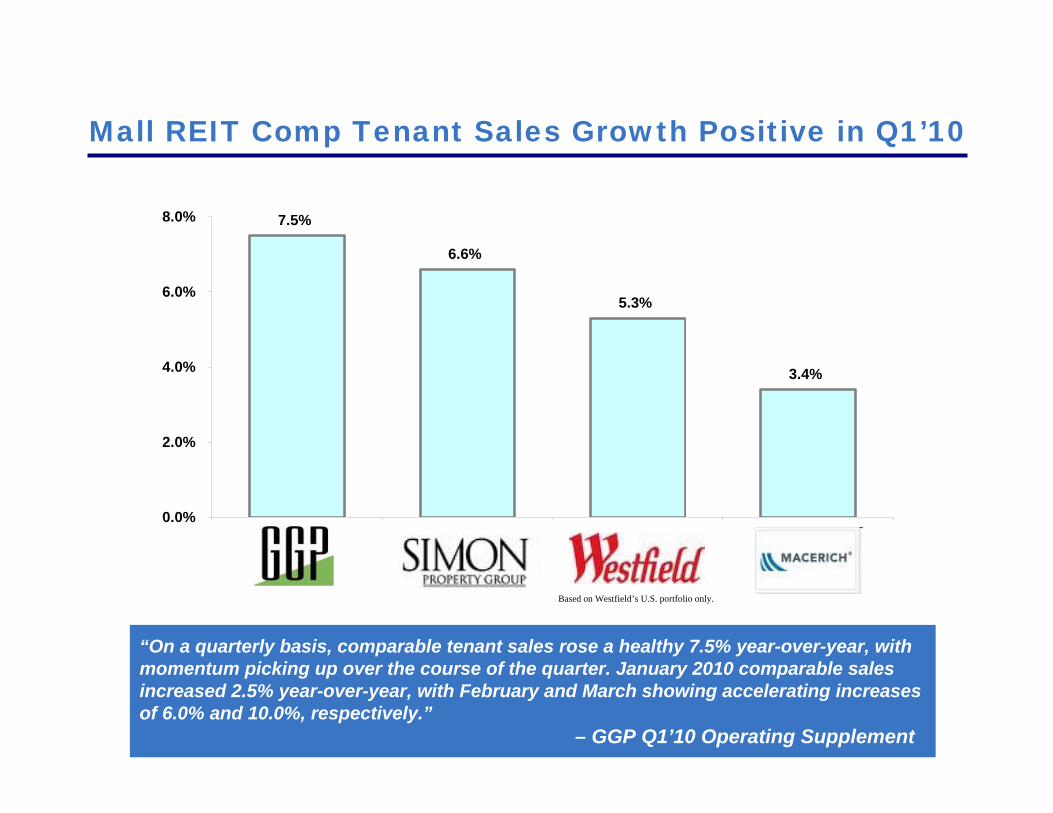
Mall REIT Comp Tenant Sales Growth Positive in Q1’10
7.5%
6.6%
5.3%
3.4%
0.0%
2.0%
4.0%
6.0%
8.0%
Based on Westfield’s U.S. portfolio only.
“On a quarterly basis, comparable tenant sales rose a healthy 7.5% year-over-year, with momentum picking up over the course of the quarter. January 2010 comparable sales increased 2.5% year-over-year, with February and March showing accelerating increases of 6.0% and 10.0%, respectively.”
– GGP Q1’10 Operating Supplement

23
The U.S. economy has recovered
The U.S. consumer is bouncing back
Mall traffic is increasing
Demand for mall REIT debt and equity capital is high
Cap rates have declined substantially
Store closure fears were overblown
Tenants are much better capitalized
Rent relief has been minimal
Tenant sales have returned to growth
The World has Improved Dramatically
24
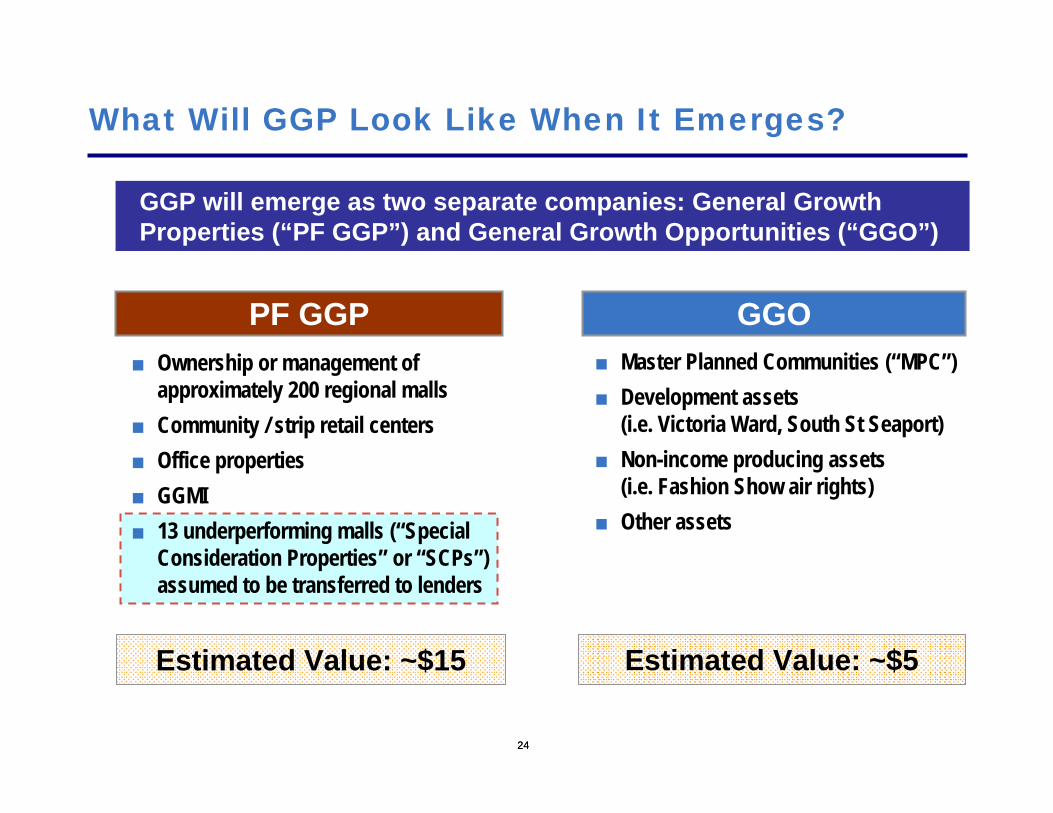
■ Ownership or management of approximately 200 regional malls
■ Community / strip retail centers■ Office properties■ GGMI■ 13 underperforming malls (“Special
Consideration Properties” or “SCPs”) assumed to be transferred to lenders
What Will GGP Look Like When It Emerges?
GGOPF GGP■ Master Planned Communities (“MPC”)■ Development assets
(i.e. Victoria Ward, South St Seaport)■ Non-income producing assets
(i.e. Fashion Show air rights)■ Other assets
24
Estimated Value: ~$15
GGP will emerge as two separate companies: General Growth Properties (“PF GGP”) and General Growth Opportunities (“GGO”)
Estimated Value: ~$5
PF GGP
26
Why is PF GGP a Good Investment?
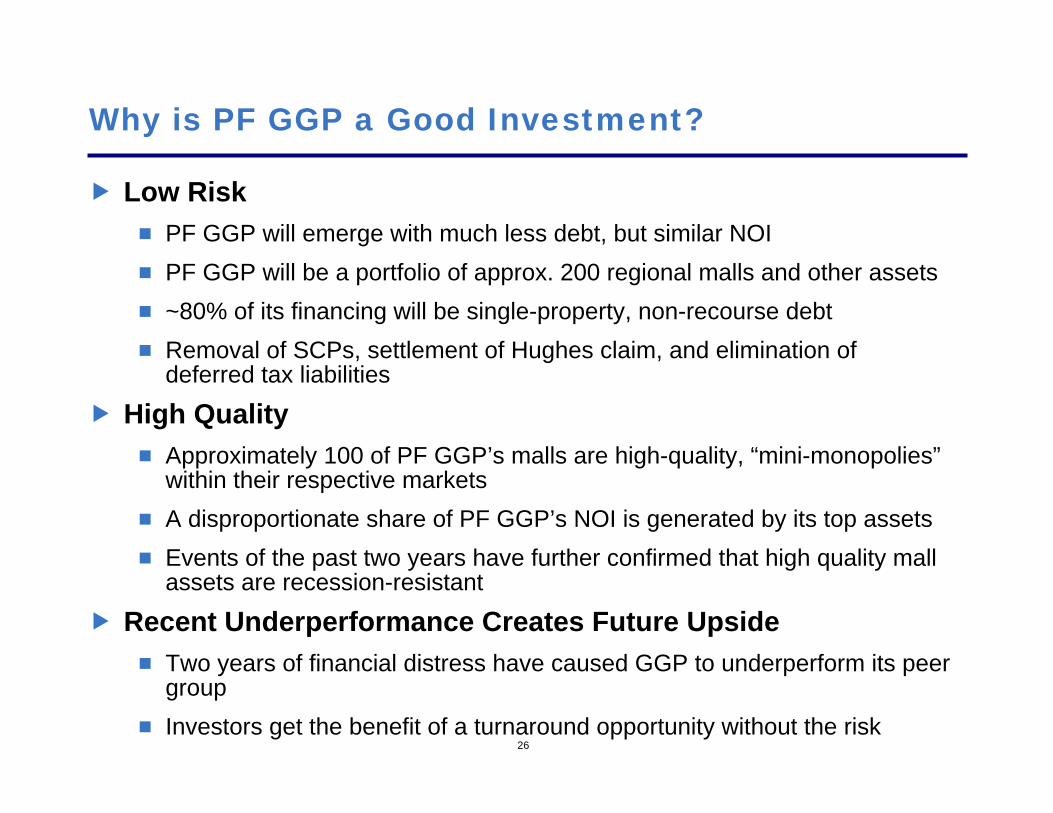
Low RiskPF GGP will emerge with much less debt, but similar NOIPF GGP will be a portfolio of approx. 200 regional malls and other assets~80% of its financing will be single-property, non-recourse debtRemoval of SCPs, settlement of Hughes claim, and elimination of deferred tax liabilities
High QualityApproximately 100 of PF GGP’s malls are high-quality, “mini-monopolies”within their respective marketsA disproportionate share of PF GGP’s NOI is generated by its top assetsEvents of the past two years have further confirmed that high quality mall assets are recession-resistant
Recent Underperformance Creates Future UpsideTwo years of financial distress have caused GGP to underperform its peer groupInvestors get the benefit of a turnaround opportunity without the risk
27
Why is PF GGP a Good Investment? (Cont’d)
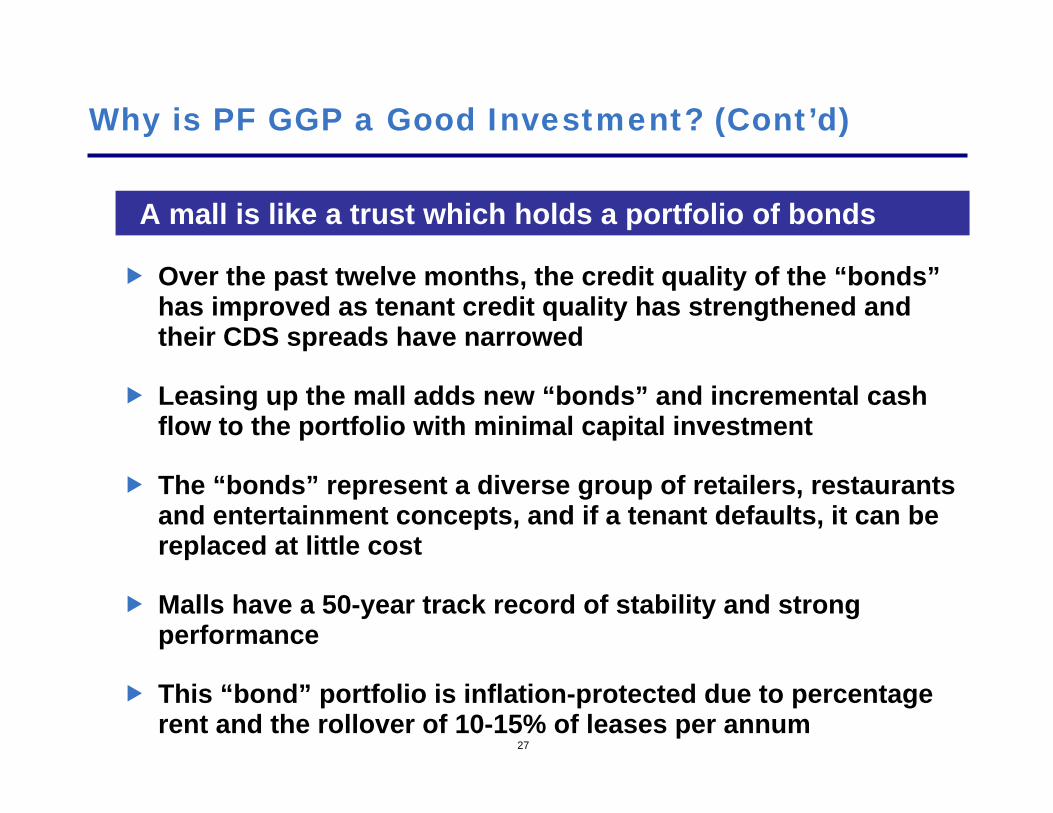
Over the past twelve months, the credit quality of the “bonds”has improved as tenant credit quality has strengthened and their CDS spreads have narrowed
Leasing up the mall adds new “bonds” and incremental cash flow to the portfolio with minimal capital investment
The “bonds” represent a diverse group of retailers, restaurants and entertainment concepts, and if a tenant defaults, it can be replaced at little cost
Malls have a 50-year track record of stability and strong performance
This “bond” portfolio is inflation-protected due to percentage rent and the rollover of 10-15% of leases per annum
A mall is like a trust which holds a portfolio of bonds
28
The Value of Non-Recourse Debt
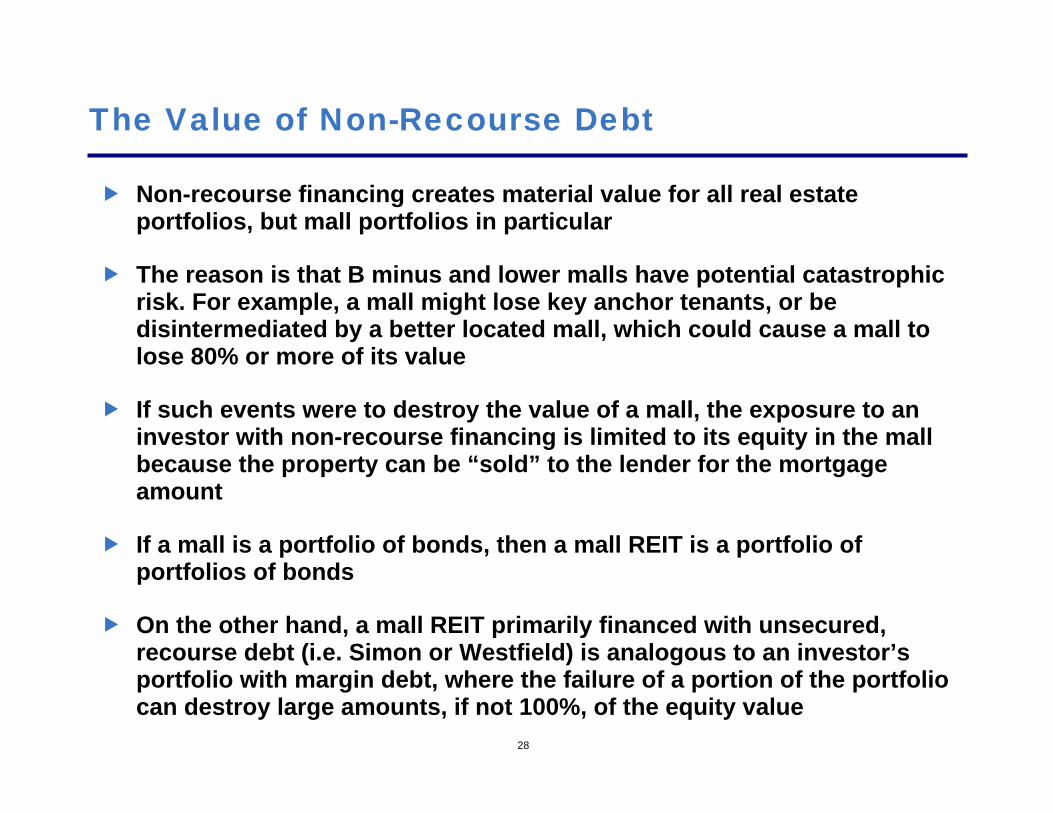
Non-recourse financing creates material value for all real estate portfolios, but mall portfolios in particular
The reason is that B minus and lower malls have potential catastrophic risk. For example, a mall might lose key anchor tenants, or be disintermediated by a better located mall, which could cause a mall to lose 80% or more of its value
If such events were to destroy the value of a mall, the exposure to an investor with non-recourse financing is limited to its equity in the mall because the property can be “sold” to the lender for the mortgage amount
If a mall is a portfolio of bonds, then a mall REIT is a portfolio of portfolios of bonds
On the other hand, a mall REIT primarily financed with unsecured, recourse debt (i.e. Simon or Westfield) is analogous to an investor’s portfolio with margin debt, where the failure of a portion of the portfolio can destroy large amounts, if not 100%, of the equity value

29
Illustrative Example: Non-Recourse Financed Mall Portfolio
Imagine a portfolio of three malls, each worth $100 and each with a 60% LTV non-recourse mortgage
$100$60
$100$60
$100$60
Total Mall Value$300
Total Debt$180
Total Equity$120- =
Leverage60%
$40
$40
$40
$60
$60
$60
$40$40$40
30
Illustrative Example: Non-Recourse Financed Mall Portfolio (Cont’d)
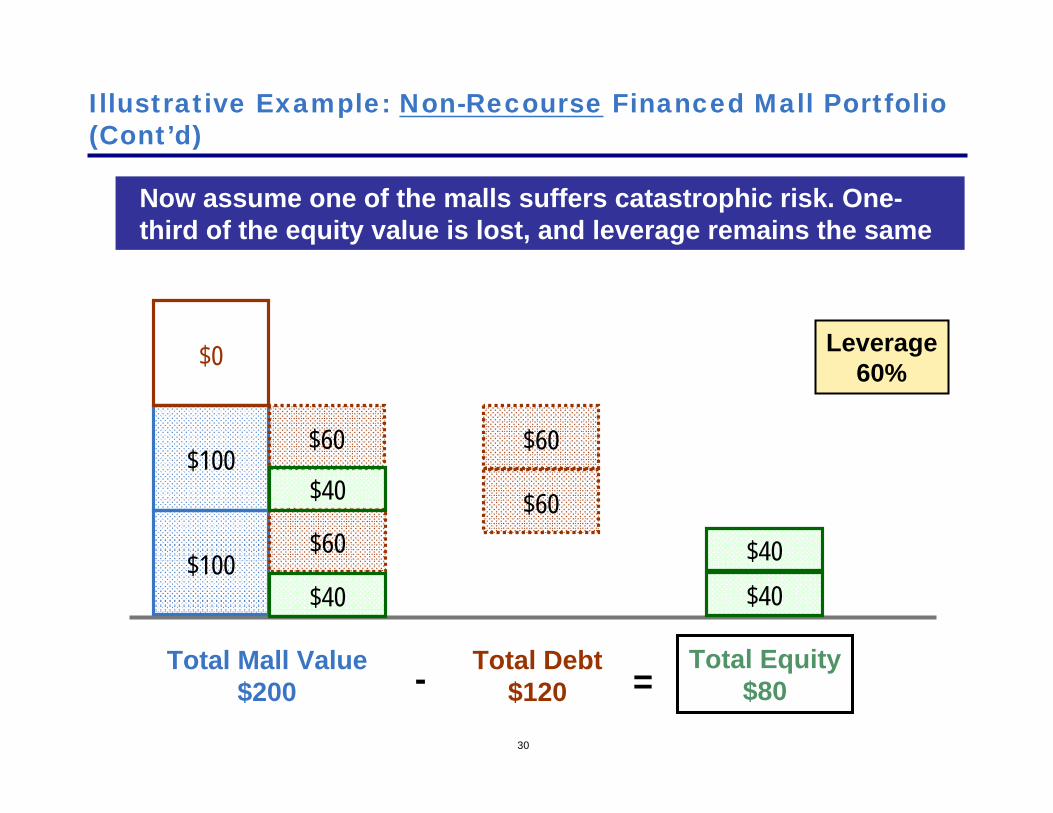
$100$60
$100$60
$0
Total Mall Value$200
Total Debt$120
Total Equity$80- =
$40
$40
$60
$60
$40$40
Now assume one of the malls suffers catastrophic risk. One-third of the equity value is lost, and leverage remains the same
Leverage60%
31
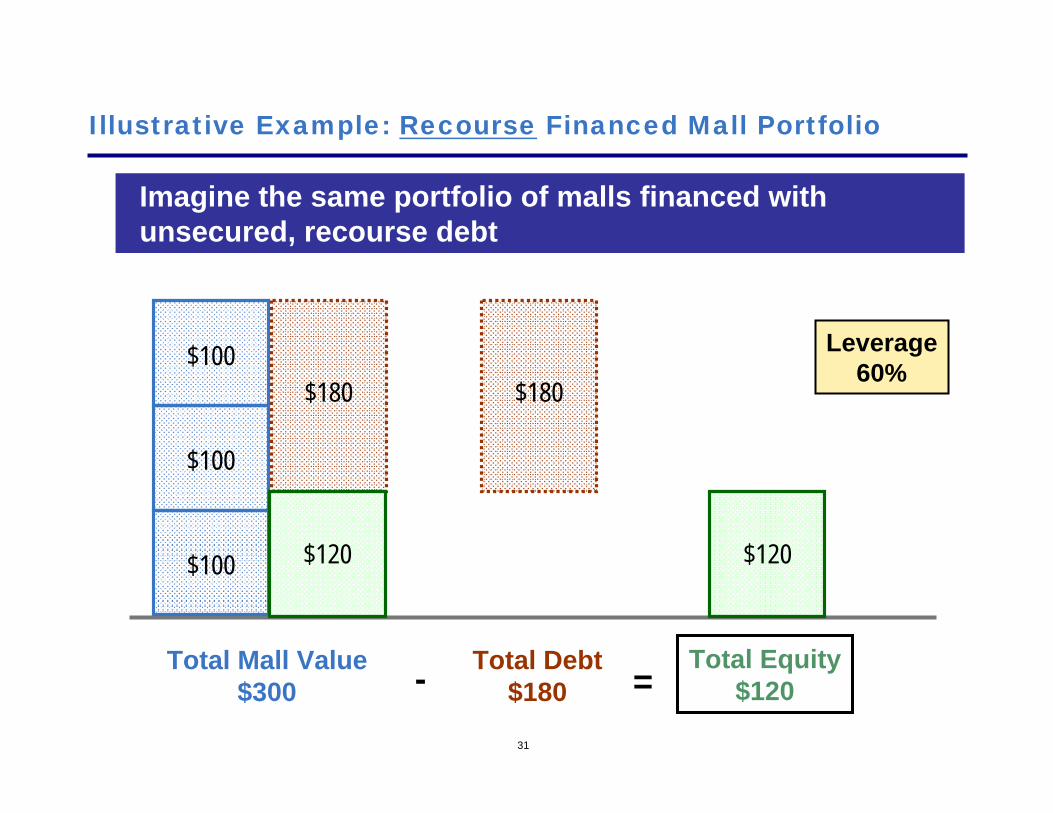
Illustrative Example: Recourse Financed Mall Portfolio
Imagine the same portfolio of malls financed with unsecured, recourse debt
$100
$100
$100
Total Mall Value$300
Total Debt$180
Total Equity$120- =
Leverage60%
$180
$120
$180
$120
32
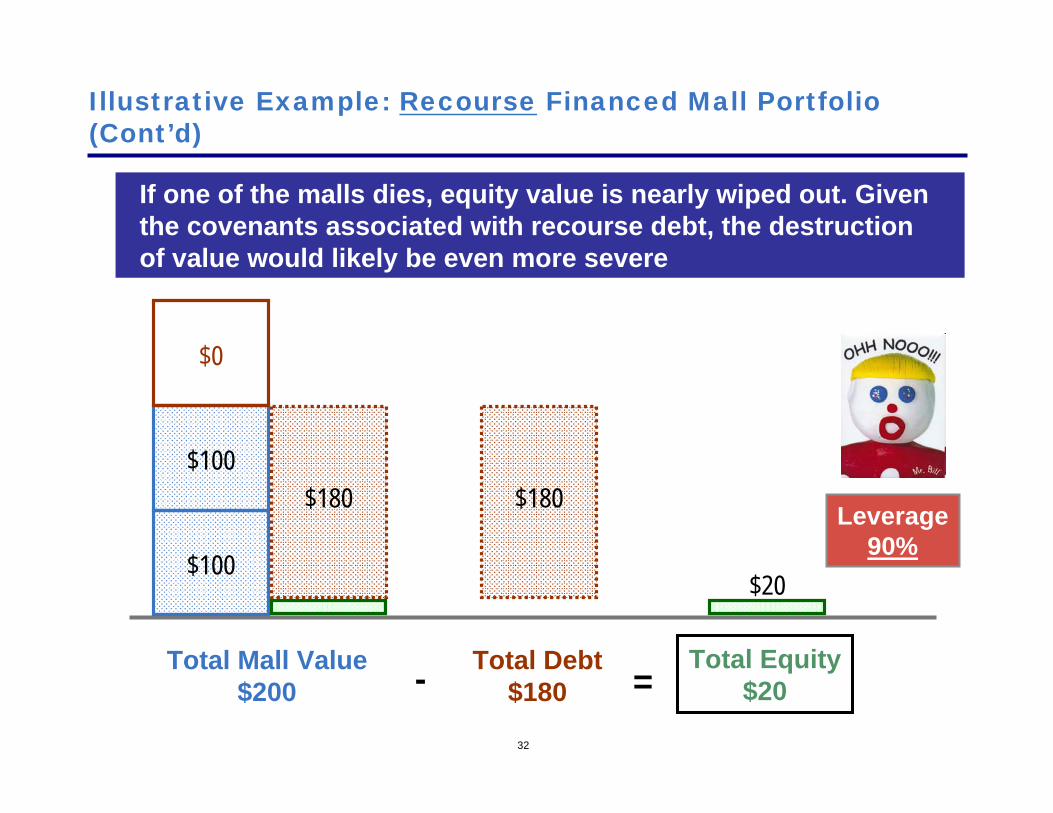
Illustrative Example: Recourse Financed Mall Portfolio (Cont’d)
$100
$100
Total Mall Value$200
Total Debt$180
Total Equity$20- =
$180 $180
$20
$0
Leverage90%
If one of the malls dies, equity value is nearly wiped out. Given the covenants associated with recourse debt, the destruction of value would likely be even more severe
33
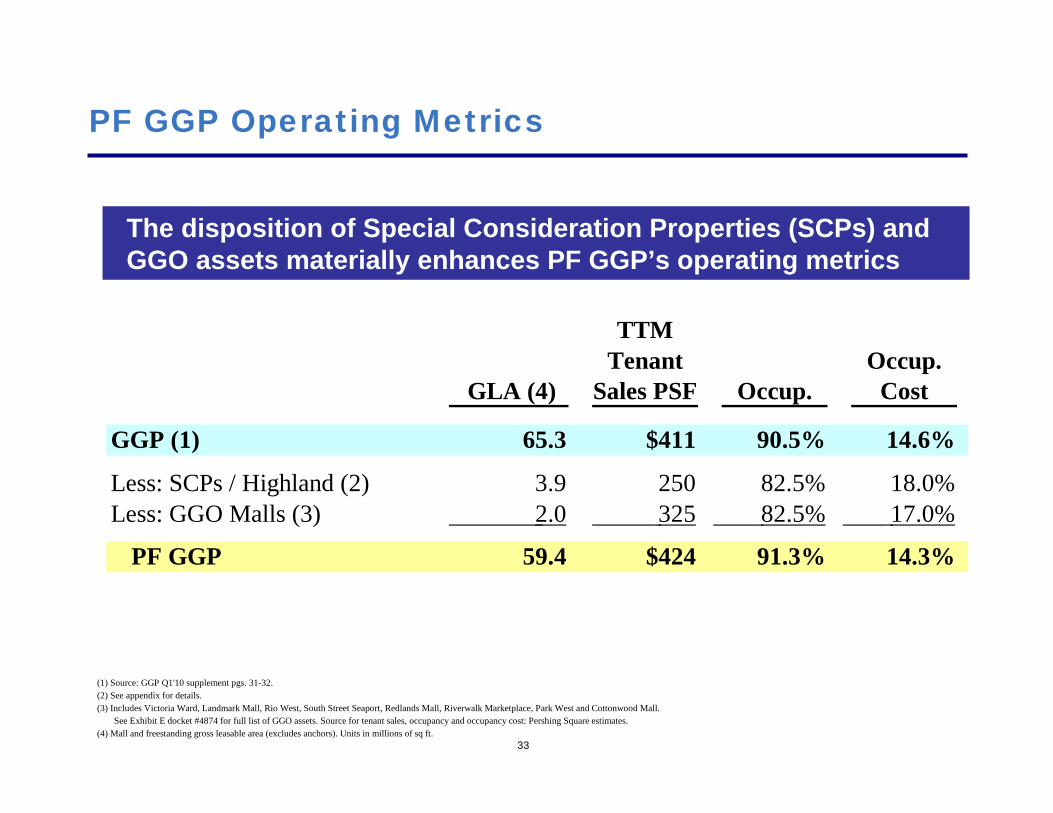
PF GGP Operating Metrics
The disposition of Special Consideration Properties (SCPs) and GGO assets materially enhances PF GGP’s operating metrics
TTMTenant Occup.
GLA (4) Sales PSF Occup. Cost
GGP (1) 65.3 $411 90.5% 14.6%
Less: SCPs / Highland (2) 3.9 250 82.5% 18.0%Less: GGO Malls (3) 2.0 325 82.5% 17.0%
PF GGP 59.4 $424 91.3% 14.3%
(1) Source: GGP Q1'10 supplement pgs. 31-32.(2) See appendix for details.(3) Includes Victoria Ward, Landmark Mall, Rio West, South Street Seaport, Redlands Mall, Riverwalk Marketplace, Park West and Cottonwood Mall.
See Exhibit E docket #4874 for full list of GGO assets. Source for tenant sales, occupancy and occupancy cost: Pershing Square estimates.(4) Mall and freestanding gross leasable area (excludes anchors). Units in millions of sq ft.
34
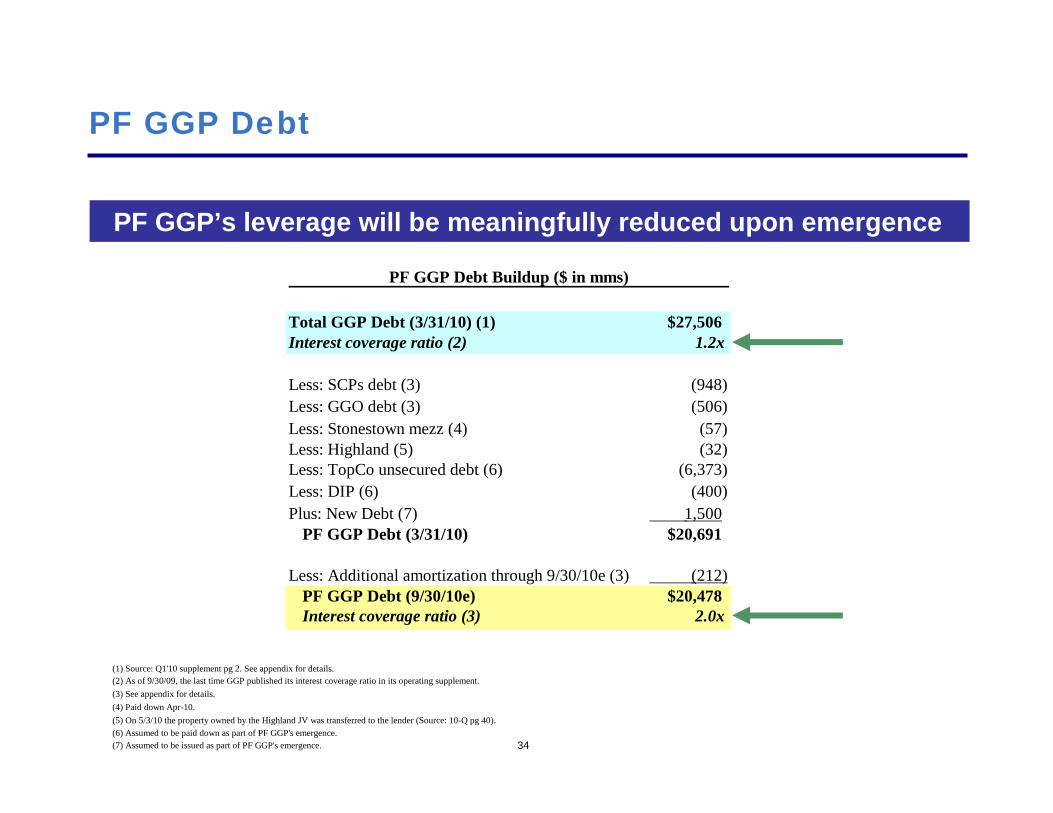
PF GGP Debt
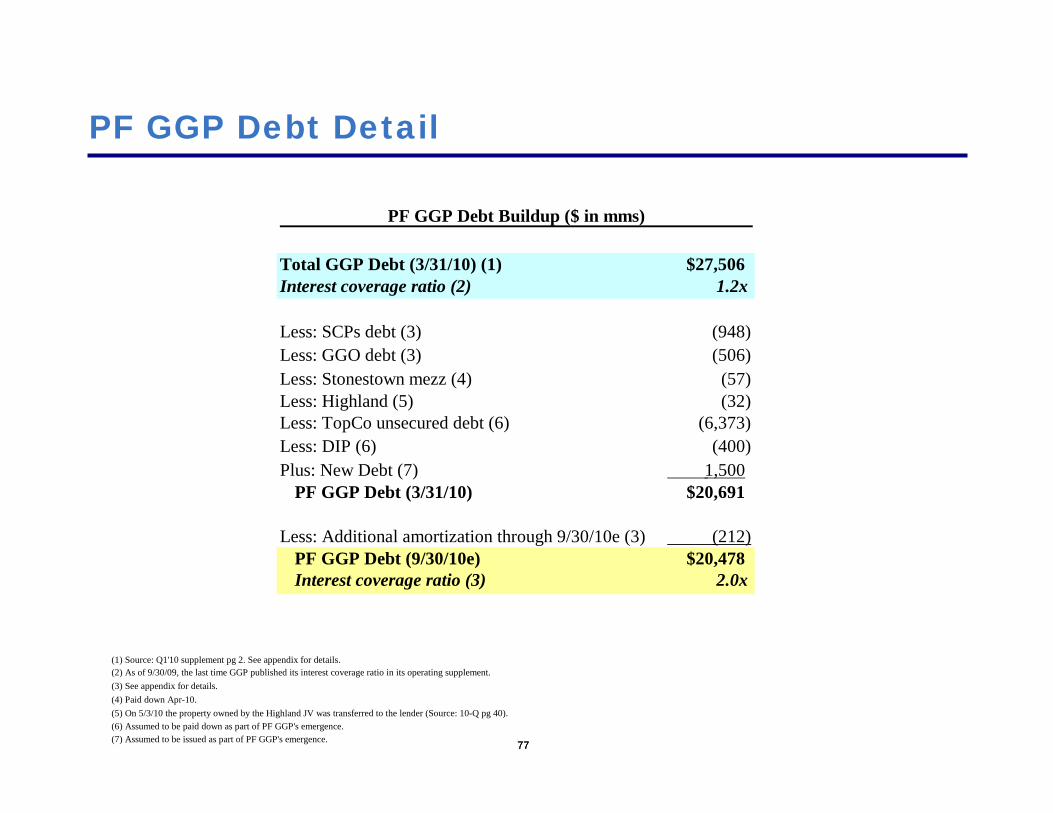
PF GGP’s leverage will be meaningfully reduced upon emergence
(1) Source: Q1'10 supplement pg 2. See appendix for details.(2) As of 9/30/09, the last time GGP published its interest coverage ratio in its operating supplement.(3) See appendix for details.(4) Paid down Apr-10.(5) On 5/3/10 the property owned by the Highland JV was transferred to the lender (Source: 10-Q pg 40).(6) Assumed to be paid down as part of PF GGP's emergence.(7) Assumed to be issued as part of PF GGP's emergence.
PF GGP Debt Buildup ($ in mms)
Total GGP Debt (3/31/10) (1) $27,506Interest coverage ratio (2) 1.2x
Less: SCPs debt (3) (948)Less: GGO debt (3) (506)Less: Stonestown mezz (4) (57) Less: Highland (5) (32) Less: TopCo unsecured debt (6) (6,373) Less: DIP (6) (400) Plus: New Debt (7) 1,500
PF GGP Debt (3/31/10) $20,691
Less: Additional amortization through 9/30/10e (3) (212) PF GGP Debt (9/30/10e) $20,478Interest coverage ratio (3) 2.0x
35
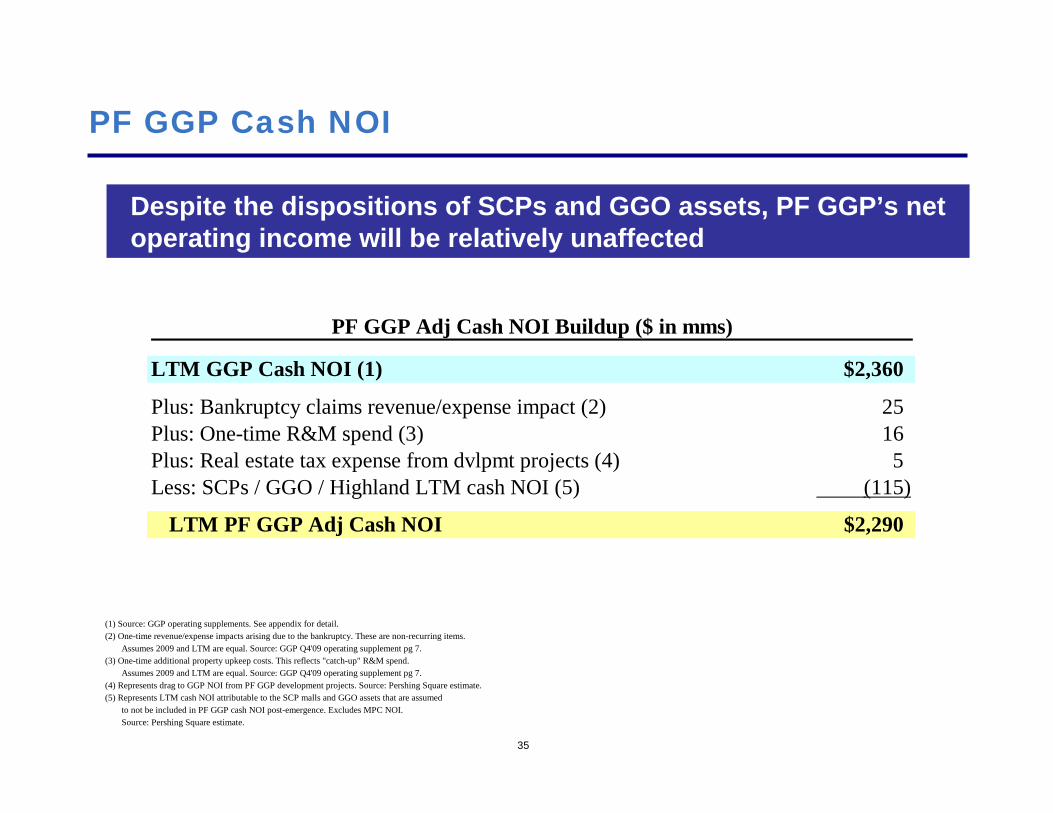
PF GGP Cash NOI
Despite the dispositions of SCPs and GGO assets, PF GGP’s net operating income will be relatively unaffected
(1) Source: GGP operating supplements. See appendix for detail.(2) One-time revenue/expense impacts arising due to the bankruptcy. These are non-recurring items.
Assumes 2009 and LTM are equal. Source: GGP Q4'09 operating supplement pg 7.(3) One-time additional property upkeep costs. This reflects "catch-up" R&M spend.
Assumes 2009 and LTM are equal. Source: GGP Q4'09 operating supplement pg 7.(4) Represents drag to GGP NOI from PF GGP development projects. Source: Pershing Square estimate.(5) Represents LTM cash NOI attributable to the SCP malls and GGO assets that are assumed
to not be included in PF GGP cash NOI post-emergence. Excludes MPC NOI.Source: Pershing Square estimate.
PF GGP Adj Cash NOI Buildup ($ in mms)
LTM GGP Cash NOI (1) $2,360
Plus: Bankruptcy claims revenue/expense impact (2) 25Plus: One-time R&M spend (3) 16Plus: Real estate tax expense from dvlpmt projects (4) 5Less: SCPs / GGO / Highland LTM cash NOI (5) (115)
LTM PF GGP Adj Cash NOI $2,290
36
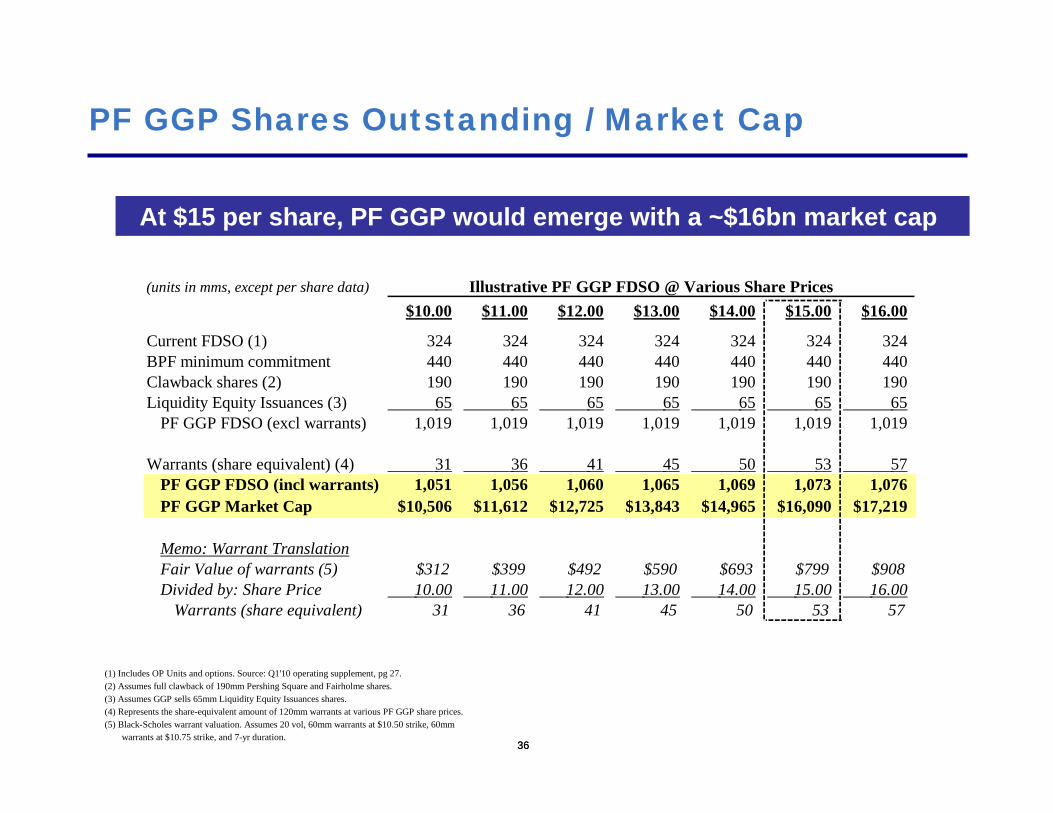
PF GGP Shares Outstanding / Market Cap
36
At $15 per share, PF GGP would emerge with a ~$16bn market cap
(1) Includes OP Units and options. Source: Q1'10 operating supplement, pg 27.(2) Assumes full clawback of 190mm Pershing Square and Fairholme shares.(3) Assumes GGP sells 65mm Liquidity Equity Issuances shares.(4) Represents the share-equivalent amount of 120mm warrants at various PF GGP share prices.(5) Black-Scholes warrant valuation. Assumes 20 vol, 60mm warrants at $10.50 strike, 60mm
warrants at $10.75 strike, and 7-yr duration.
(units in mms, except per share data) Illustrative PF GGP FDSO @ Various Share Prices$10.00 $11.00 $12.00 $13.00 $14.00 $15.00 $16.00
Current FDSO (1) 324 324 324 324 324 324 324BPF minimum commitment 440 440 440 440 440 440 440Clawback shares (2) 190 190 190 190 190 190 190Liquidity Equity Issuances (3) 65 65 65 65 65 65 65
PF GGP FDSO (excl warrants) 1,019 1,019 1,019 1,019 1,019 1,019 1,019
Warrants (share equivalent) (4) 31 36 41 45 50 53 57 PF GGP FDSO (incl warrants) 1,051 1,056 1,060 1,065 1,069 1,073 1,076PF GGP Market Cap $10,506 $11,612 $12,725 $13,843 $14,965 $16,090 $17,219
Memo: Warrant TranslationFair Value of warrants (5) $312 $399 $492 $590 $693 $799 $908Divided by: Share Price 10.00 11.00 12.00 13.00 14.00 15.00 16.00
Warrants (share equivalent) 31 36 41 45 50 53 57
37
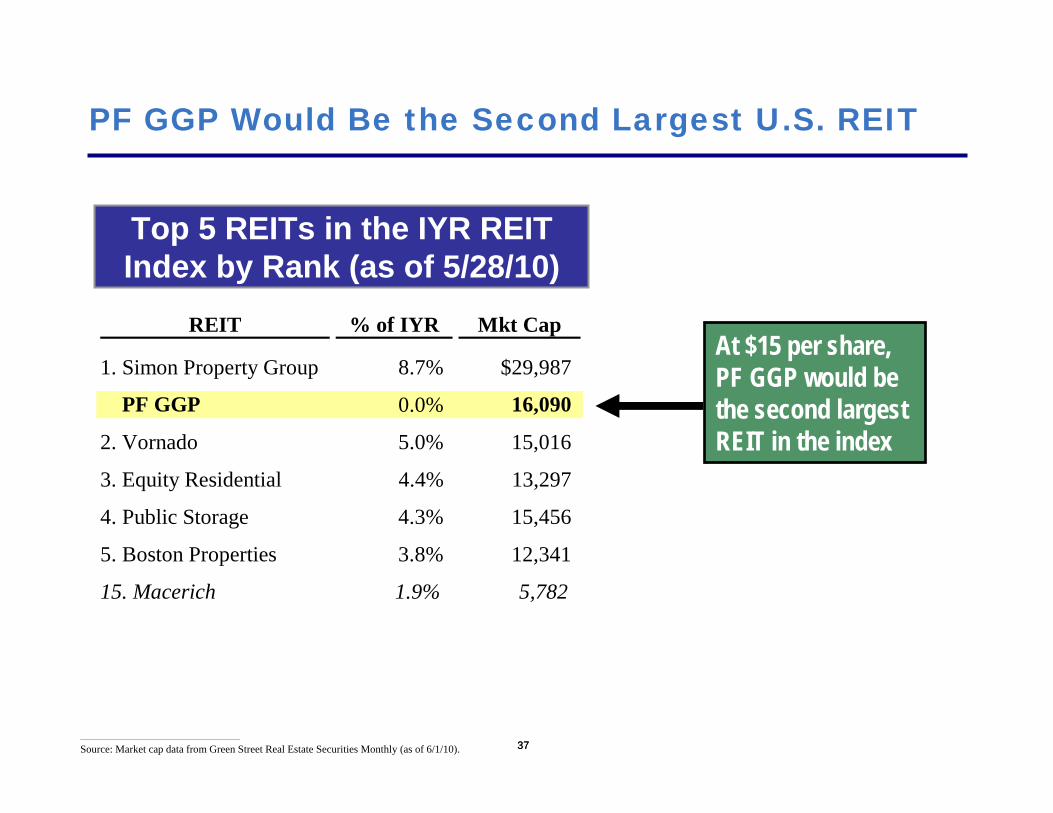
PF GGP Would Be the Second Largest U.S. REIT
37
Top 5 REITs in the IYR REIT Index by Rank (as of 5/28/10)
At $15 per share, PF GGP would be the second largest REIT in the index
________________________________________________
Source: Market cap data from Green Street Real Estate Securities Monthly (as of 6/1/10).
REIT % of IYR Mkt Cap
1. Simon Property Group 8.7% $29,987
PF GGP 0.0% 16,090
2. Vornado 5.0% 15,016
3. Equity Residential 4.4% 13,297
4. Public Storage 4.3% 15,456
5. Boston Properties 3.8% 12,341
15. Macerich 1.9% 5,782

38
PF GGP Will Be A “Must-Own” REIT Stock
38
Shareholder overlap among public REITs is extremely high due to a large, dedicated REIT investor universe
Dedicated REIT investors closely track REIT indexes
As a result of GGP’s bankruptcy, it was removed from REIT indexes
When PF GGP emerges from bankruptcy, it will once again be added to the real estate indexes. This will make it a “must-own” equity
39
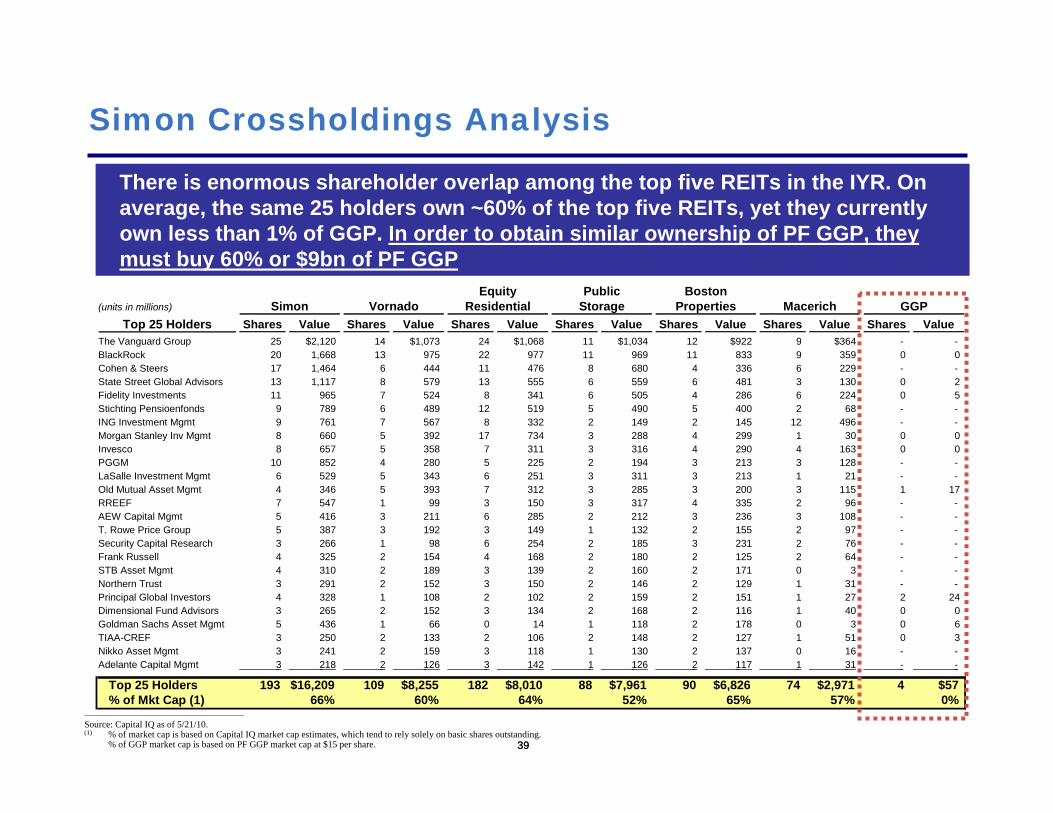
Simon Crossholdings Analysis
39
There is enormous shareholder overlap among the top five REITs in the IYR. On average, the same 25 holders own ~60% of the top five REITs, yet they currently own less than 1% of GGP. In order to obtain similar ownership of PF GGP, they must buy 60% or $9bn of PF GGP
Equity Public Boston(units in millions) Simon Vornado Residential Storage Properties Macerich GGP
Top 25 Holders Shares Value Shares Value Shares Value Shares Value Shares Value Shares Value Shares ValueThe Vanguard Group 25 $2,120 14 $1,073 24 $1,068 11 $1,034 12 $922 9 $364 - - BlackRock 20 1,668 13 975 22 977 11 969 11 833 9 359 0 0 Cohen & Steers 17 1,464 6 444 11 476 8 680 4 336 6 229 - - State Street Global Advisors 13 1,117 8 579 13 555 6 559 6 481 3 130 0 2 Fidelity Investments 11 965 7 524 8 341 6 505 4 286 6 224 0 5 Stichting Pensioenfonds 9 789 6 489 12 519 5 490 5 400 2 68 - - ING Investment Mgmt 9 761 7 567 8 332 2 149 2 145 12 496 - - Morgan Stanley Inv Mgmt 8 660 5 392 17 734 3 288 4 299 1 30 0 0 Invesco 8 657 5 358 7 311 3 316 4 290 4 163 0 0 PGGM 10 852 4 280 5 225 2 194 3 213 3 128 - - LaSalle Investment Mgmt 6 529 5 343 6 251 3 311 3 213 1 21 - - Old Mutual Asset Mgmt 4 346 5 393 7 312 3 285 3 200 3 115 1 17 RREEF 7 547 1 99 3 150 3 317 4 335 2 96 - - AEW Capital Mgmt 5 416 3 211 6 285 2 212 3 236 3 108 - - T. Rowe Price Group 5 387 3 192 3 149 1 132 2 155 2 97 - - Security Capital Research 3 266 1 98 6 254 2 185 3 231 2 76 - - Frank Russell 4 325 2 154 4 168 2 180 2 125 2 64 - - STB Asset Mgmt 4 310 2 189 3 139 2 160 2 171 0 3 - - Northern Trust 3 291 2 152 3 150 2 146 2 129 1 31 - - Principal Global Investors 4 328 1 108 2 102 2 159 2 151 1 27 2 24 Dimensional Fund Advisors 3 265 2 152 3 134 2 168 2 116 1 40 0 0 Goldman Sachs Asset Mgmt 5 436 1 66 0 14 1 118 2 178 0 3 0 6 TIAA-CREF 3 250 2 133 2 106 2 148 2 127 1 51 0 3 Nikko Asset Mgmt 3 241 2 159 3 118 1 130 2 137 0 16 - - Adelante Capital Mgmt 3 218 2 126 3 142 1 126 2 117 1 31 - -
Top 25 Holders 193 $16,209 109 $8,255 182 $8,010 88 $7,961 90 $6,826 74 $2,971 4 $57% of Mkt Cap (1) 66% 60% 64% 52% 65% 57% 0%
________________________________________________
Source: Capital IQ as of 5/21/10. (1) % of market cap is based on Capital IQ market cap estimates, which tend to rely solely on basic shares outstanding.
% of GGP market cap is based on PF GGP market cap at $15 per share.
40
Not Your Typical Public Offering
40
PF GGP’s emergence from bankruptcy will be tantamount to an initial public offering (IPO)
Unlike traditional IPOs where buyers have all the leverage, PF GGP’s equity is already fully committed pre-offering. As a result, rather than be a forced seller, PF GGP can achieve a high value execution
Under the terms of the Brookfield, Fairholme, and Pershing Square agreement, PF GGO can sell up to 255 million shares at prices of $10.50 or greater (1)
________________________________________________(1) Assumes full clawback of 190mm Pershing Square and Fairholme shares.
Assumes GGP sells full amount of 65mm Liquidity Equity Issuances shares.
41
PF GGP IPO Supply / Demand Dynamic
41
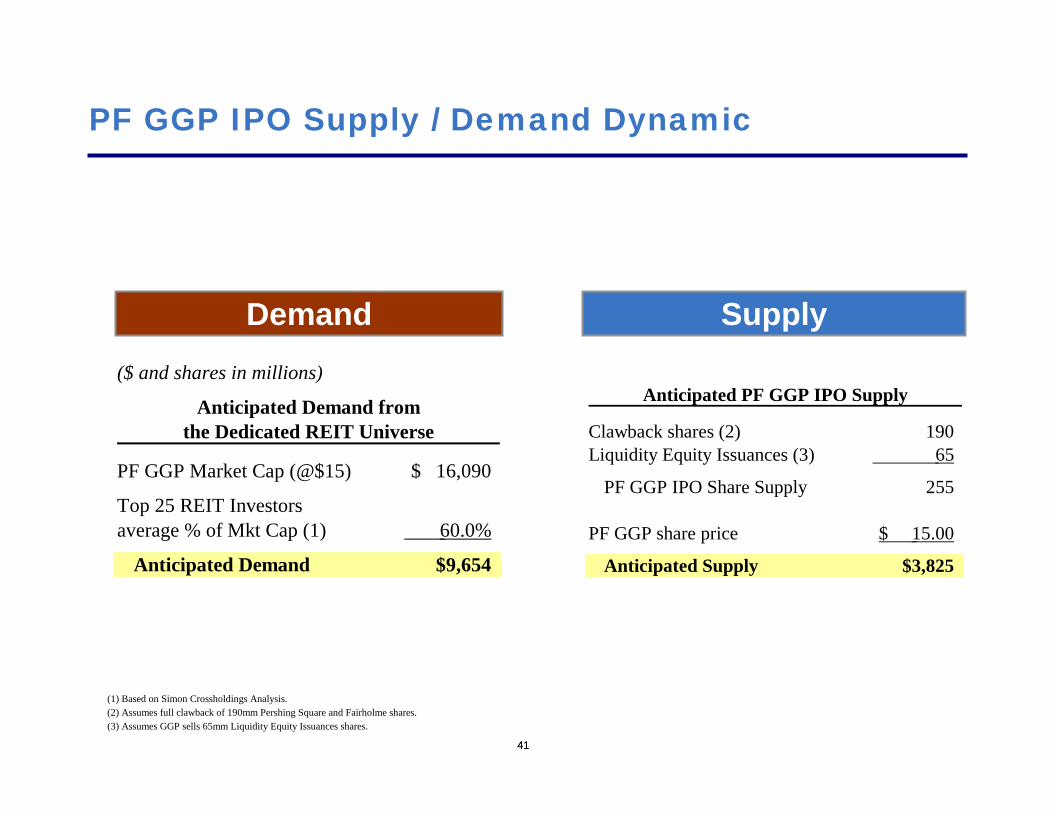
SupplyDemand
Anticipated PF GGP IPO Supply
Clawback shares (2) 190Liquidity Equity Issuances (3) 65
PF GGP IPO Share Supply 255
PF GGP share price 15.00$
Anticipated Supply $3,825
(1) Based on Simon Crossholdings Analysis.(2) Assumes full clawback of 190mm Pershing Square and Fairholme shares.(3) Assumes GGP sells 65mm Liquidity Equity Issuances shares.
($ and shares in millions)
Anticipated Demand fromthe Dedicated REIT Universe
PF GGP Market Cap (@$15) 16,090$
Top 25 REIT Investorsaverage % of Mkt Cap (1) 60.0%
Anticipated Demand $9,654
42
Illustrative PF GGP Valuation at Various Share Prices
42
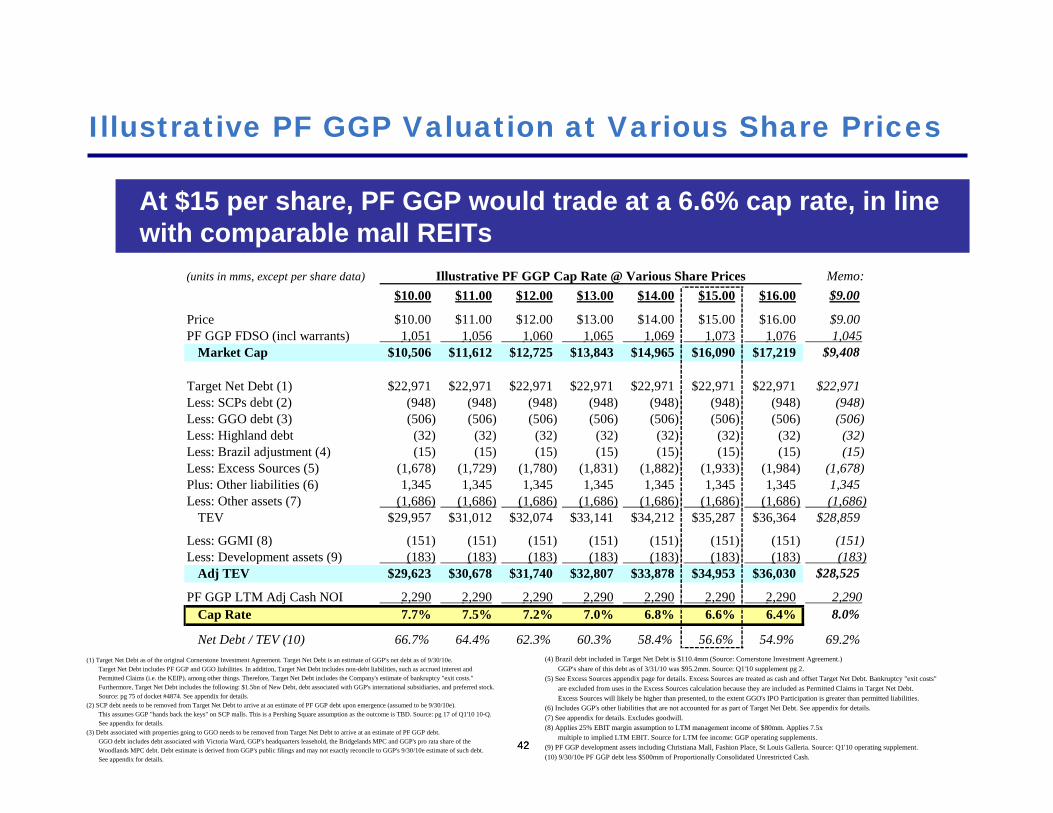
At $15 per share, PF GGP would trade at a 6.6% cap rate, in linewith comparable mall REITs
(1) Target Net Debt as of the original Cornerstone Investment Agreement. Target Net Debt is an estimate of GGP's net debt as of 9/30/10e.Target Net Debt includes PF GGP and GGO liabilities. In addition, Target Net Debt includes non-debt liabilities, such as accrued interest andPermitted Claims (i.e. the KEIP), among other things. Therefore, Target Net Debt includes the Company's estimate of bankruptcy "exit costs."Furthermore, Target Net Debt includes the following: $1.5bn of New Debt, debt associated with GGP's international subsidiaries, and preferred stock.Source: pg 75 of docket #4874. See appendix for details.
(2) SCP debt needs to be removed from Target Net Debt to arrive at an estimate of PF GGP debt upon emergence (assumed to be 9/30/10e).This assumes GGP "hands back the keys" on SCP malls. This is a Pershing Square assumption as the outcome is TBD. Source: pg 17 of Q1'10 10-Q.See appendix for details.
(3) Debt associated with properties going to GGO needs to be removed from Target Net Debt to arrive at an estimate of PF GGP debt.GGO debt includes debt associated with Victoria Ward, GGP's headquarters leasehold, the Bridgelands MPC and GGP's pro rata share of theWoodlands MPC debt. Debt estimate is derived from GGP's public filings and may not exactly reconcile to GGP's 9/30/10e estimate of such debt.See appendix for details.
(4) Brazil debt included in Target Net Debt is $110.4mm (Source: Cornerstone Investment Agreement.) GGP's share of this debt as of 3/31/10 was $95.2mm. Source: Q1'10 supplement pg 2.
(5) See Excess Sources appendix page for details. Excess Sources are treated as cash and offset Target Net Debt. Bankruptcy "exit costs"are excluded from uses in the Excess Sources calculation because they are included as Permitted Claims in Target Net Debt.Excess Sources will likely be higher than presented, to the extent GGO's IPO Participation is greater than permitted liabilities.
(6) Includes GGP's other liabilities that are not accounted for as part of Target Net Debt. See appendix for details.(7) See appendix for details. Excludes goodwill.(8) Applies 25% EBIT margin assumption to LTM management income of $80mm. Applies 7.5x
multiple to implied LTM EBIT. Source for LTM fee income: GGP operating supplements.(9) PF GGP development assets including Christiana Mall, Fashion Place, St Louis Galleria. Source: Q1'10 operating supplement.(10) 9/30/10e PF GGP debt less $500mm of Proportionally Consolidated Unrestricted Cash.
(units in mms, except per share data) Illustrative PF GGP Cap Rate @ Various Share Prices Memo:$10.00 $11.00 $12.00 $13.00 $14.00 $15.00 $16.00 $9.00
Price $10.00 $11.00 $12.00 $13.00 $14.00 $15.00 $16.00 $9.00PF GGP FDSO (incl warrants) 1,051 1,056 1,060 1,065 1,069 1,073 1,076 1,045
Market Cap $10,506 $11,612 $12,725 $13,843 $14,965 $16,090 $17,219 $9,408
Target Net Debt (1) $22,971 $22,971 $22,971 $22,971 $22,971 $22,971 $22,971 $22,971Less: SCPs debt (2) (948) (948) (948) (948) (948) (948) (948) (948)Less: GGO debt (3) (506) (506) (506) (506) (506) (506) (506) (506)Less: Highland debt (32) (32) (32) (32) (32) (32) (32) (32)Less: Brazil adjustment (4) (15) (15) (15) (15) (15) (15) (15) (15)Less: Excess Sources (5) (1,678) (1,729) (1,780) (1,831) (1,882) (1,933) (1,984) (1,678)Plus: Other liabilities (6) 1,345 1,345 1,345 1,345 1,345 1,345 1,345 1,345Less: Other assets (7) (1,686) (1,686) (1,686) (1,686) (1,686) (1,686) (1,686) (1,686)
TEV $29,957 $31,012 $32,074 $33,141 $34,212 $35,287 $36,364 $28,859
Less: GGMI (8) (151) (151) (151) (151) (151) (151) (151) (151)Less: Development assets (9) (183) (183) (183) (183) (183) (183) (183) (183)
Adj TEV $29,623 $30,678 $31,740 $32,807 $33,878 $34,953 $36,030 $28,525
PF GGP LTM Adj Cash NOI 2,290 2,290 2,290 2,290 2,290 2,290 2,290 2,290 Cap Rate 7.7% 7.5% 7.2% 7.0% 6.8% 6.6% 6.4% 8.0%
Net Debt / TEV (10) 66.7% 64.4% 62.3% 60.3% 58.4% 56.6% 54.9% 69.2%
43
GGP Currently Trades at a Meaningful Cap Rate Spread to Simon
43
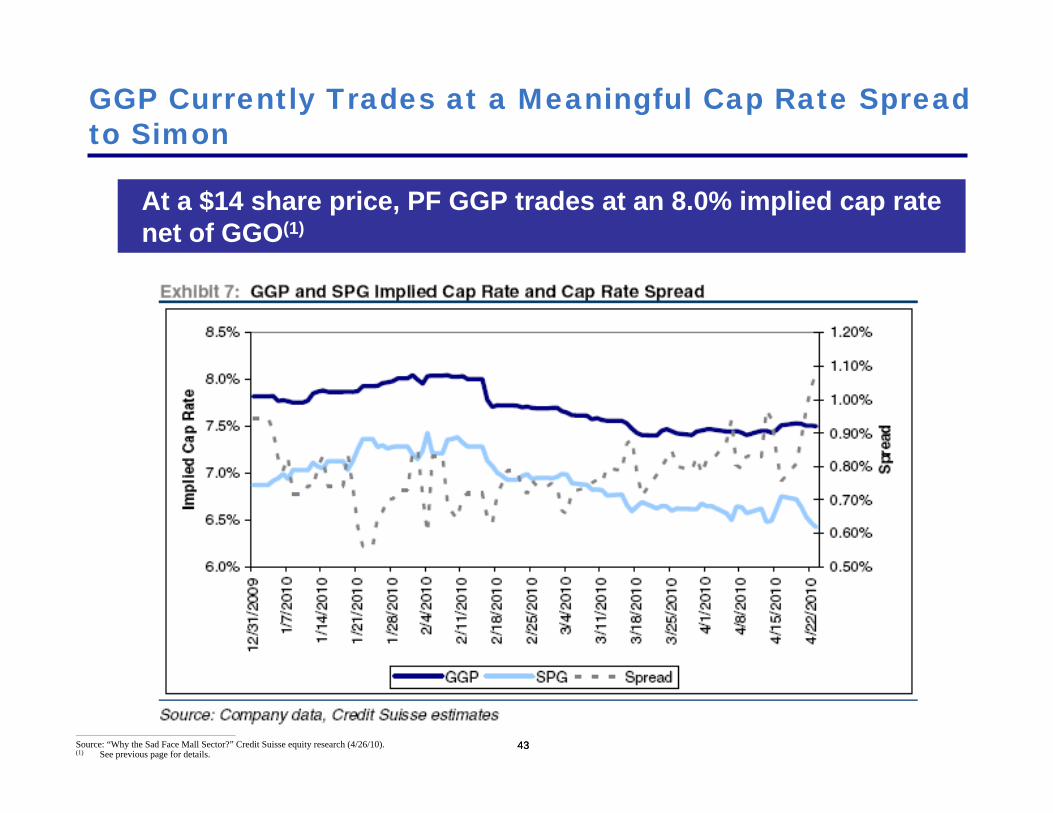
At a $14 share price, PF GGP trades at an 8.0% implied cap rate net of GGO(1)
________________________________________________
Source: “Why the Sad Face Mall Sector?” Credit Suisse equity research (4/26/10). (1) See previous page for details.
44
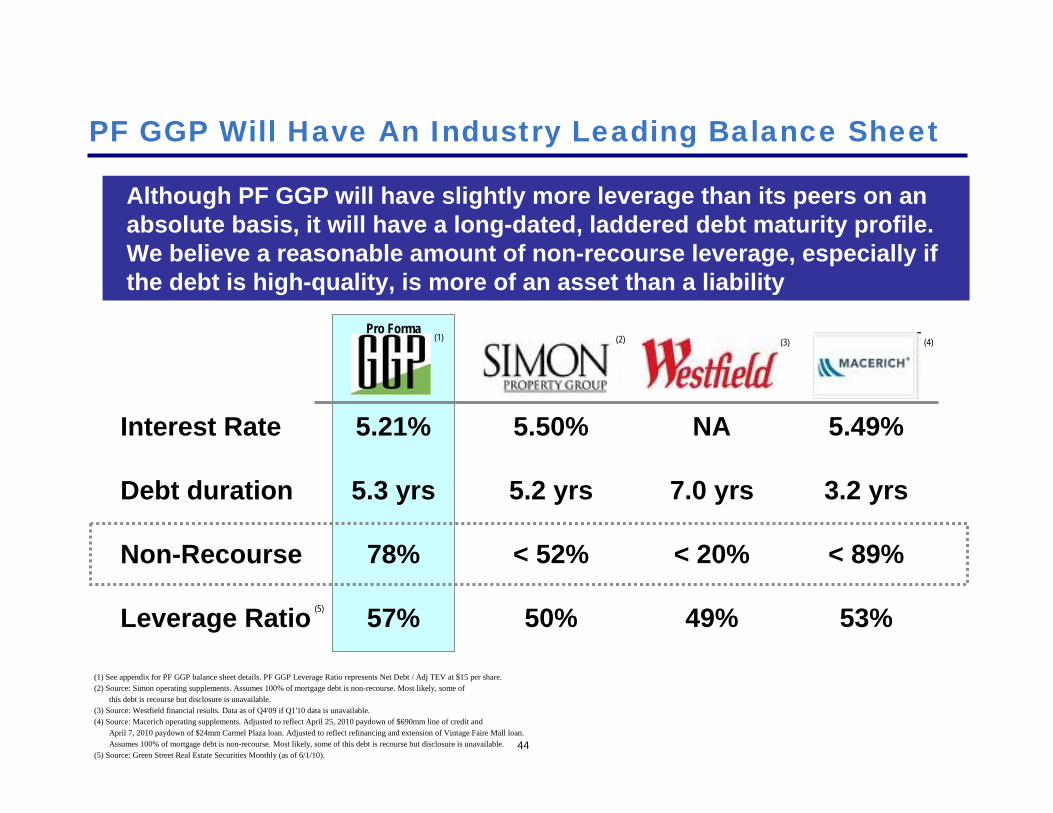
PF GGP Will Have An Industry Leading Balance Sheet
Interest Rate
Debt duration
Non-Recourse
Leverage Ratio
5.21%
5.3 yrs
78%
57%
5.50%
5.2 yrs
< 52%
50%
NA
7.0 yrs
< 20%
49%
5.49%
3.2 yrs
< 89%
53%
Although PF GGP will have slightly more leverage than its peers on an absolute basis, it will have a long-dated, laddered debt maturity profile. We believe a reasonable amount of non-recourse leverage, especially if the debt is high-quality, is more of an asset than a liability
Pro Forma(1) (2) (3) (4)
(5)
(1) See appendix for PF GGP balance sheet details. PF GGP Leverage Ratio represents Net Debt / Adj TEV at $15 per share.(2) Source: Simon operating supplements. Assumes 100% of mortgage debt is non-recourse. Most likely, some of
this debt is recourse but disclosure is unavailable.(3) Source: Westfield financial results. Data as of Q4'09 if Q1'10 data is unavailable.(4) Source: Macerich operating supplements. Adjusted to reflect April 25, 2010 paydown of $690mm line of credit and
April 7, 2010 paydown of $24mm Carmel Plaza loan. Adjusted to reflect refinancing and extension of Vintage Faire Mall loan.Assumes 100% of mortgage debt is non-recourse. Most likely, some of this debt is recourse but disclosure is unavailable.
(5) Source: Green Street Real Estate Securities Monthly (as of 6/1/10).

45
PF GGP Will Have Industry Leading Operating Metrics
Sales per Sq Ft
Occupancy
Occup. Cost
Tenants SalesGrowth (Q1’10)
Cap Rate
$424
91.3%
14.3%
7.5%
8.0%
PF GGP will have the added benefit of near-term growth as it refocuses on its operations post-emergence and corrects for the under-performance that resulted from its bankruptcy
Pro Forma(1) (2) (3)
$420
91.0%
15.1%
6.6%
6.6%
$400
92.1%
17.0%
5.3%
6.0%
$416
91.2%
14.2%
3.4%
7.0%(5)
(4)
(1) Simon malls only. Includes regional mall portfolio, the Mills, Mills regional malls, and malls included in Other Properties (excl Highland Mall).Source: Simon operating supplements and 10-K. See later pages for Simon Malls operating metrics details.
(2) Based on Westfield's U.S. mall portfolio only. Data as of Q4'09 if unavailable in Q1'10 financial results. Source: Westfield financial results.(3) Source: Macerich operating supplements.(4) Source for Macerich / Westfield: "U.S. Mall REITs May '10 Update" Green Street 5/19/10. See PF GGP Operating Metrics for PF GGP
occupancy cost details. See appendix for details on Simon's occupancy cost.(5) Source for Macerich / Westfield: Green Street Real Estate Securities Monthly (as of 6/1/10). PF GGP cap rate based on implied share price
of $9 net of GGO. See appendix for details on Simon's cap rate.

46
Aliansce
Sales per Sq Ft
Occupancy
Occup. Cost
Tenants SalesGrowth (Q1’10)
Cap Rate
$540
98.0%
13.4%
16.5%
~11%
(1) (2) (2)
$420
91.0%
15.1%
6.6%
6.6%
$400
92.1%
17.0%
5.3%
6.0%
$416
91.2%
14.2%
3.4%
7.0%
GGP owns 35% of Aliansce, a Brazilian mall developer, which went public in January. Pershing Square is the second largest owner with roughly 14% of the total shares outstanding
(2)
(1) Source: Aliansce Q1'10 financial results and Pershing Square estimates.(2) See previous page for details.
47
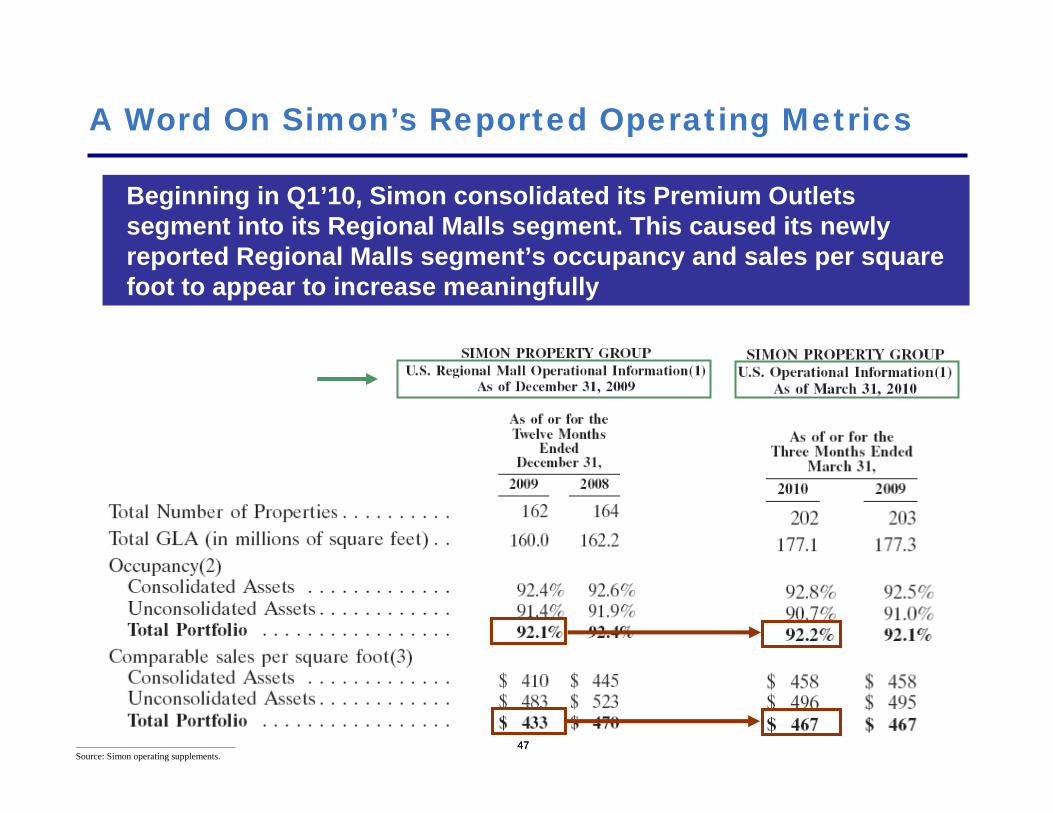
A Word On Simon’s Reported Operating Metrics
47
Beginning in Q1’10, Simon consolidated its Premium Outlets segment into its Regional Malls segment. This caused its newly reported Regional Malls segment’s occupancy and sales per square foot to appear to increase meaningfully
________________________________________________
Source: Simon operating supplements.
48
A Word On Simon’s Reported Operating Metrics (Cont’d)
48
We note that Simon’s Regional Mall portfolio excludes several regional malls in The Mills and Mills Regional Malls segments
In our view, these assets should be included in Simon’s Regional Malls portfolio
Simon has also transferred certain of its underperforming malls into its Other Properties segment
For example, Highland Mall, a joint venture between Simon and GGP that was 51% occupied as of 12/31/09, was recently transferred back to the lender
Highland Mall was included in Simon’s Regional Mall portfolio as of 12/31/08, but showed up in its Other Properties segment as of 12/31/09. This further served to increase Simon’s reported Regional Mall occupancy and sales per square foot as of Q1’10
49
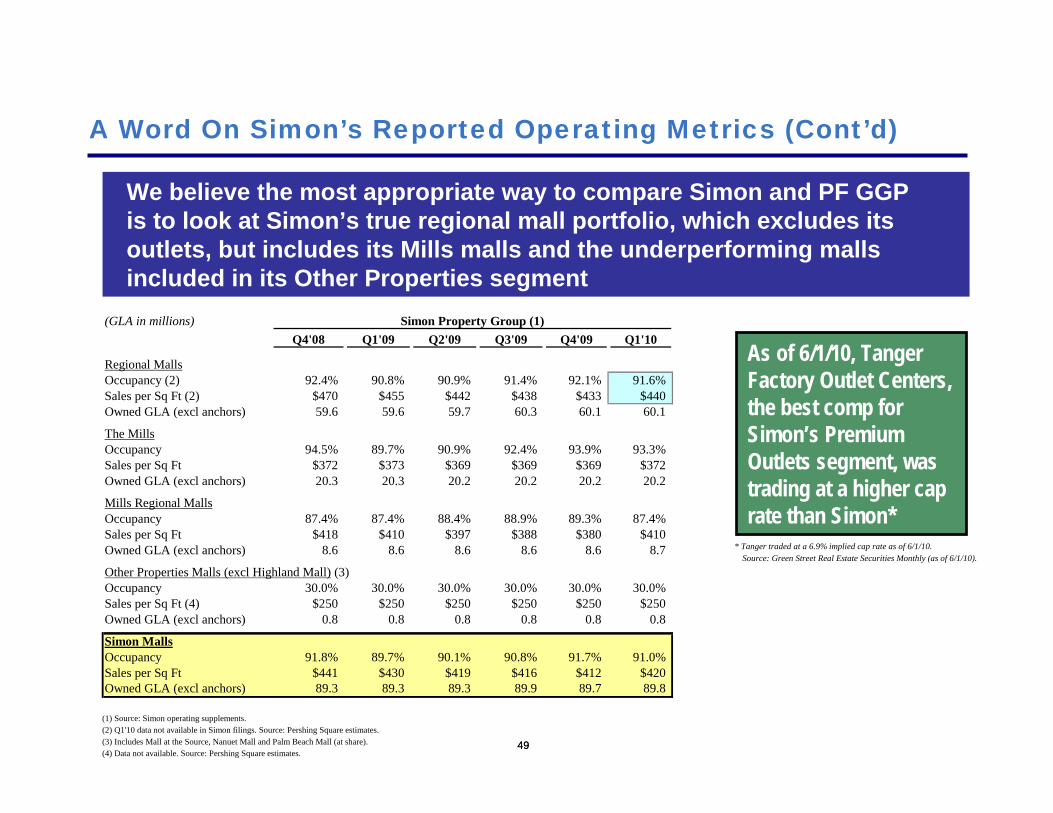
A Word On Simon’s Reported Operating Metrics (Cont’d)
49
We believe the most appropriate way to compare Simon and PF GGP is to look at Simon’s true regional mall portfolio, which excludes its outlets, but includes its Mills malls and the underperforming malls included in its Other Properties segment
(GLA in millions) Simon Property Group (1)Q4'08 Q1'09 Q2'09 Q3'09 Q4'09 Q1'10
Regional MallsOccupancy (2) 92.4% 90.8% 90.9% 91.4% 92.1% 91.6%Sales per Sq Ft (2) $470 $455 $442 $438 $433 $440Owned GLA (excl anchors) 59.6 59.6 59.7 60.3 60.1 60.1
The MillsOccupancy 94.5% 89.7% 90.9% 92.4% 93.9% 93.3%Sales per Sq Ft $372 $373 $369 $369 $369 $372Owned GLA (excl anchors) 20.3 20.3 20.2 20.2 20.2 20.2
Mills Regional MallsOccupancy 87.4% 87.4% 88.4% 88.9% 89.3% 87.4%Sales per Sq Ft $418 $410 $397 $388 $380 $410Owned GLA (excl anchors) 8.6 8.6 8.6 8.6 8.6 8.7
Other Properties Malls (excl Highland Mall) (3)Occupancy 30.0% 30.0% 30.0% 30.0% 30.0% 30.0%Sales per Sq Ft (4) $250 $250 $250 $250 $250 $250Owned GLA (excl anchors) 0.8 0.8 0.8 0.8 0.8 0.8
Simon MallsOccupancy 91.8% 89.7% 90.1% 90.8% 91.7% 91.0%Sales per Sq Ft $441 $430 $419 $416 $412 $420Owned GLA (excl anchors) 89.3 89.3 89.3 89.9 89.7 89.8
(1) Source: Simon operating supplements.(2) Q1'10 data not available in Simon filings. Source: Pershing Square estimates.(3) Includes Mall at the Source, Nanuet Mall and Palm Beach Mall (at share).(4) Data not available. Source: Pershing Square estimates.
As of 6/1/10, TangerFactory Outlet Centers, the best comp for Simon’s Premium Outlets segment, was trading at a higher cap rate than Simon*
* Tanger traded at a 6.9% implied cap rate as of 6/1/10.Source: Green Street Real Estate Securities Monthly (as of 6/1/10).

GGO
51
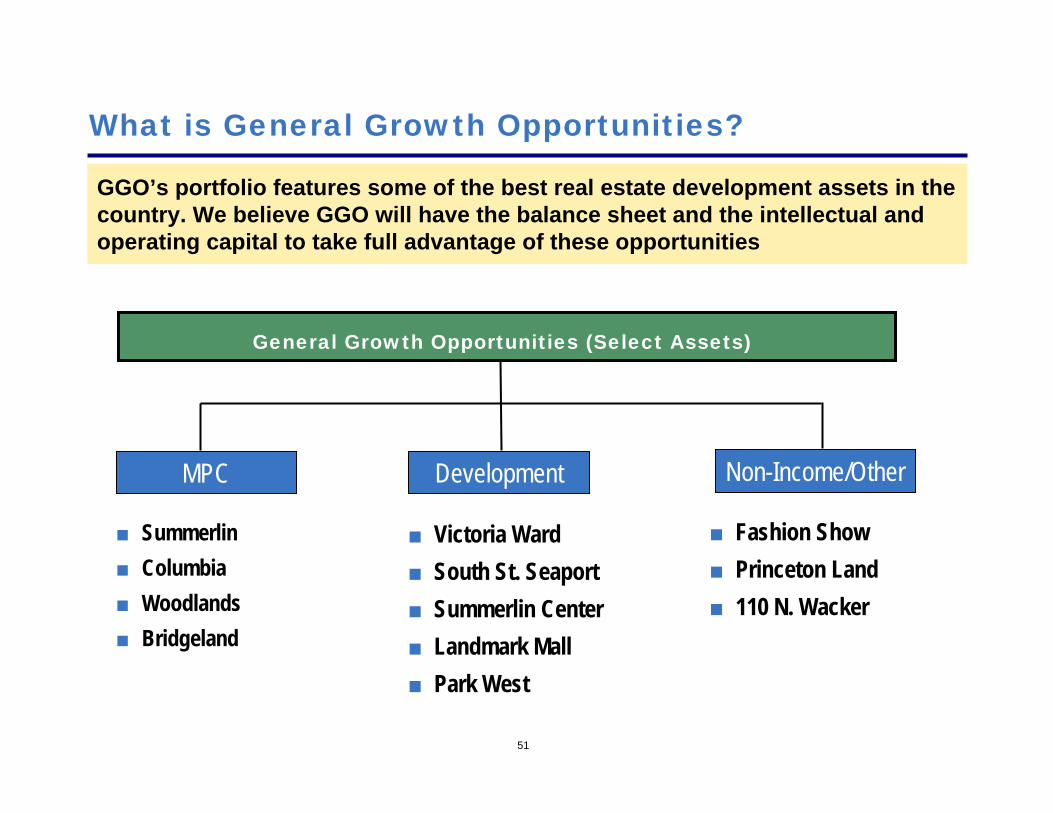
What is General Growth Opportunities?
GGO’s portfolio features some of the best real estate development assets in the country. We believe GGO will have the balance sheet and the intellectual and operating capital to take full advantage of these opportunities
General Growth Opportunities (Select Assets)
MPC Development Non-Income/Other
■ Summerlin■ Columbia■ Woodlands■ Bridgeland
■ Victoria Ward■ South St. Seaport■ Summerlin Center■ Landmark Mall■ Park West
■ Fashion Show■ Princeton Land■ 110 N. Wacker
52
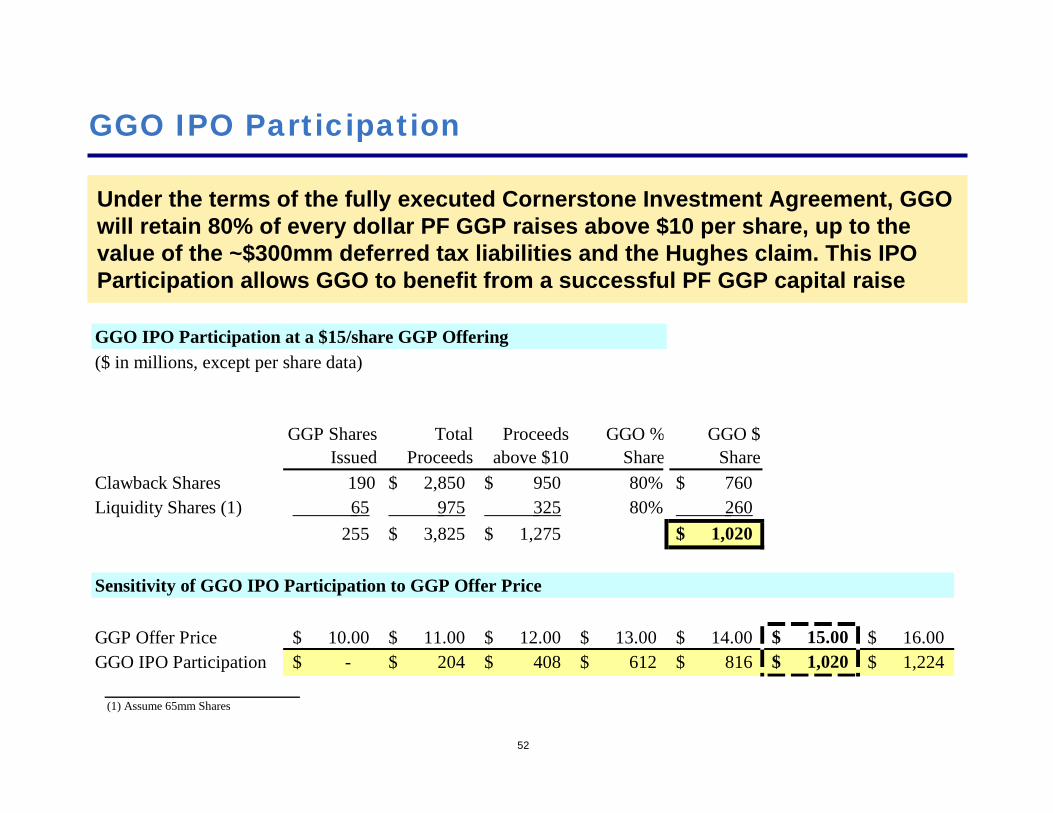
GGO IPO Participation
Under the terms of the fully executed Cornerstone Investment Agreement, GGO will retain 80% of every dollar PF GGP raises above $10 per share, up to the value of the ~$300mm deferred tax liabilities and the Hughes claim. This IPO Participation allows GGO to benefit from a successful PF GGP capital raise
(1) Assume 65mm Shares
GGO IPO Participation at a $15/share GGP Offering($ in millions, except per share data)
GGP Shares Issued
Total Proceeds
Proceeds above $10
GGO % Share
GGO $ Share
Clawback Shares 190 2,850$ 950$ 80% 760$ Liquidity Shares (1) 65 975 325 80% 260
255 3,825$ 1,275$ 1,020$
Sensitivity of GGO IPO Participation to GGP Offer Price
GGP Offer Price 10.00$ 11.00$ 12.00$ 13.00$ 14.00$ 15.00$ 16.00$ GGO IPO Participation -$ 204$ 408$ 612$ 816$ 1,020$ 1,224$
53
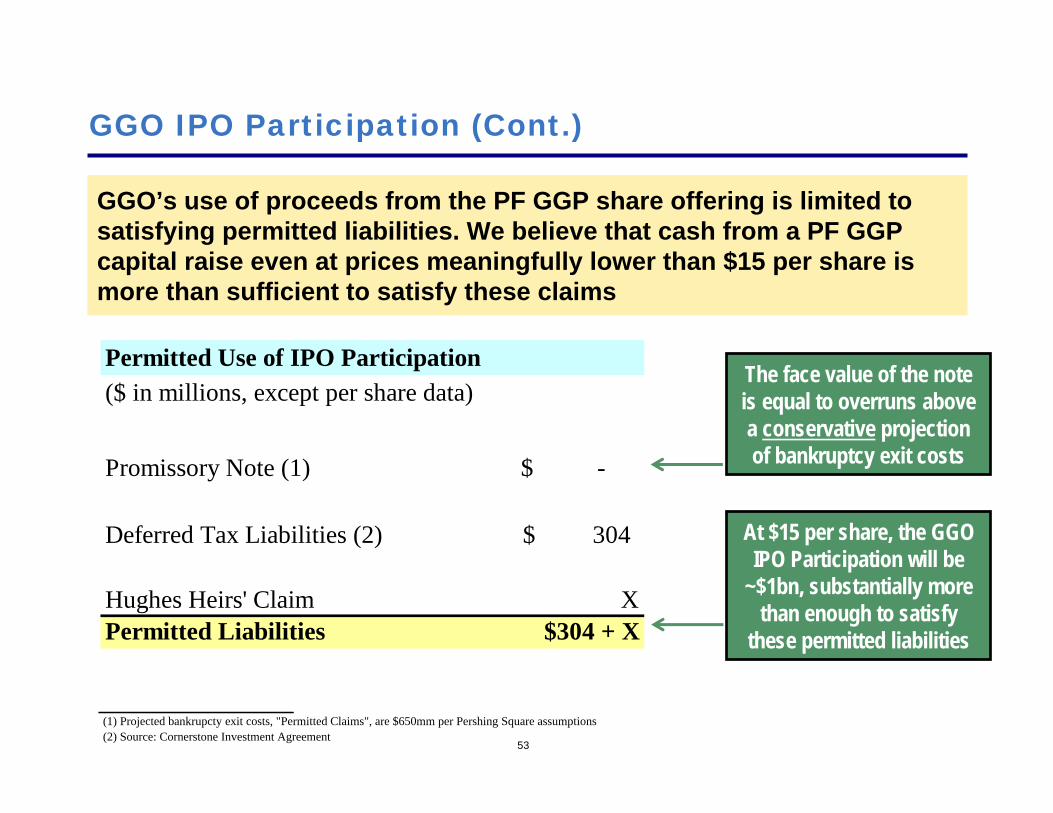
GGO IPO Participation (Cont.)
GGO’s use of proceeds from the PF GGP share offering is limited to satisfying permitted liabilities. We believe that cash from a PF GGP capital raise even at prices meaningfully lower than $15 per share is more than sufficient to satisfy these claims
The face value of the note is equal to overruns above a conservative projection of bankruptcy exit costs
At $15 per share, the GGO IPO Participation will be
~$1bn, substantially more than enough to satisfy
these permitted liabilities
Permitted Use of IPO Participation($ in millions, except per share data)
Promissory Note (1) -$
Deferred Tax Liabilities (2) 304$
Hughes Heirs' Claim XPermitted Liabilities $304 + X
(1) Projected bankrupcty exit costs, "Permitted Claims", are $650mm per Pershing Square assumptions(2) Source: Cornerstone Investment Agreement
54
Hughes Claim
GGP can settle the claim in bankruptcy at an estimation hearing
Settlement is based on a 12/31/09 valuation of Summerlin MPC
We expect the company to settle this claim at a reasonable number
Post settlement, GGO will have 100% ownership of Summerlin(from 50%)
55
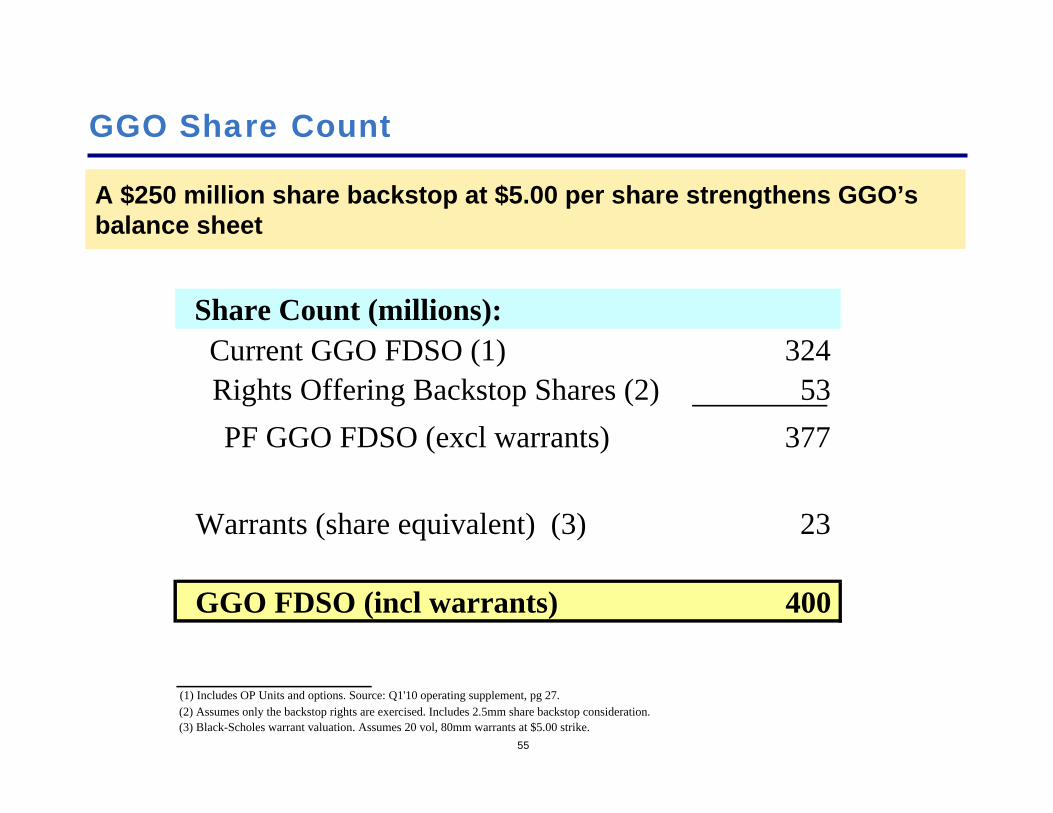
GGO Share Count
A $250 million share backstop at $5.00 per share strengthens GGO’sbalance sheet
(1) Includes OP Units and options. Source: Q1'10 operating supplement, pg 27.(2) Assumes only the backstop rights are exercised. Includes 2.5mm share backstop consideration.(3) Black-Scholes warrant valuation. Assumes 20 vol, 80mm warrants at $5.00 strike.
Share Count (millions):Current GGO FDSO (1) 324Rights Offering Backstop Shares (2) 53PF GGO FDSO (excl warrants) 377
Warrants (share equivalent) (3) 23
GGO FDSO (incl warrants) 400
56
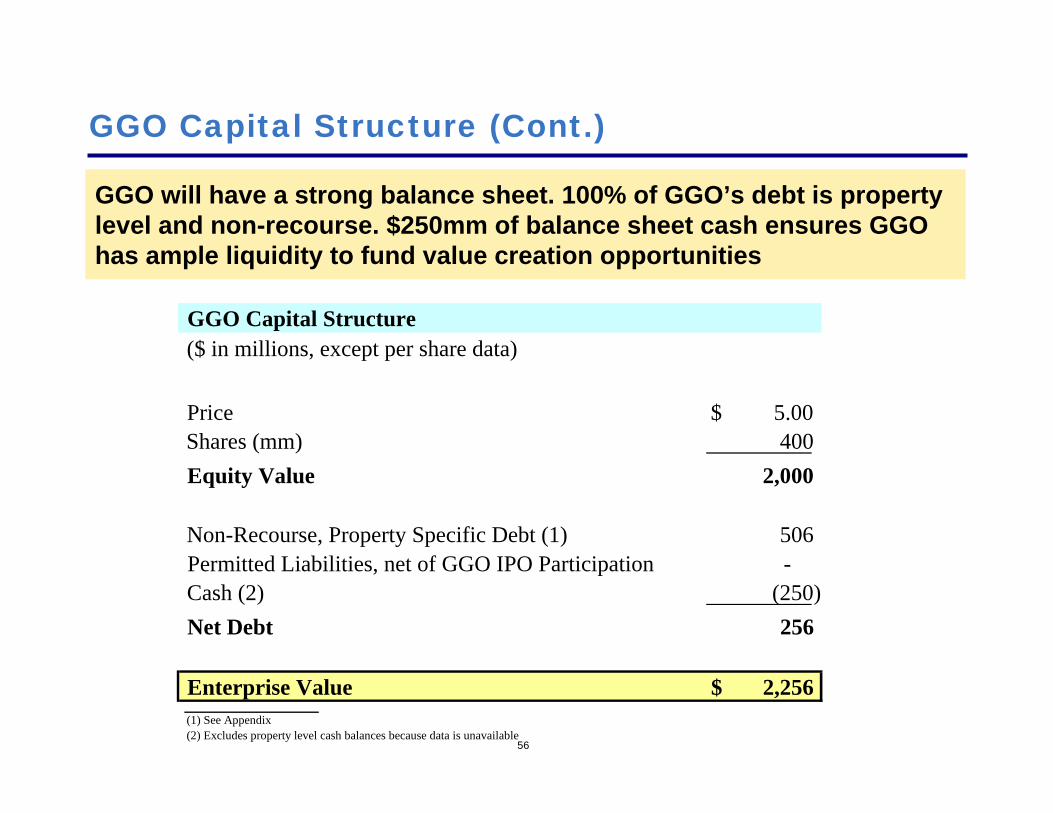
GGO Capital Structure (Cont.)
GGO will have a strong balance sheet. 100% of GGO’s debt is property level and non-recourse. $250mm of balance sheet cash ensures GGO has ample liquidity to fund value creation opportunities
(1) See Appendix(2) Excludes property level cash balances because data is unavailable
GGO Capital Structure($ in millions, except per share data)
Price 5.00$ Shares (mm) 400Equity Value 2,000
Non-Recourse, Property Specific Debt (1) 506Permitted Liabilities, net of GGO IPO Participation -Cash (2) (250)Net Debt 256
Enterprise Value 2,256$
57
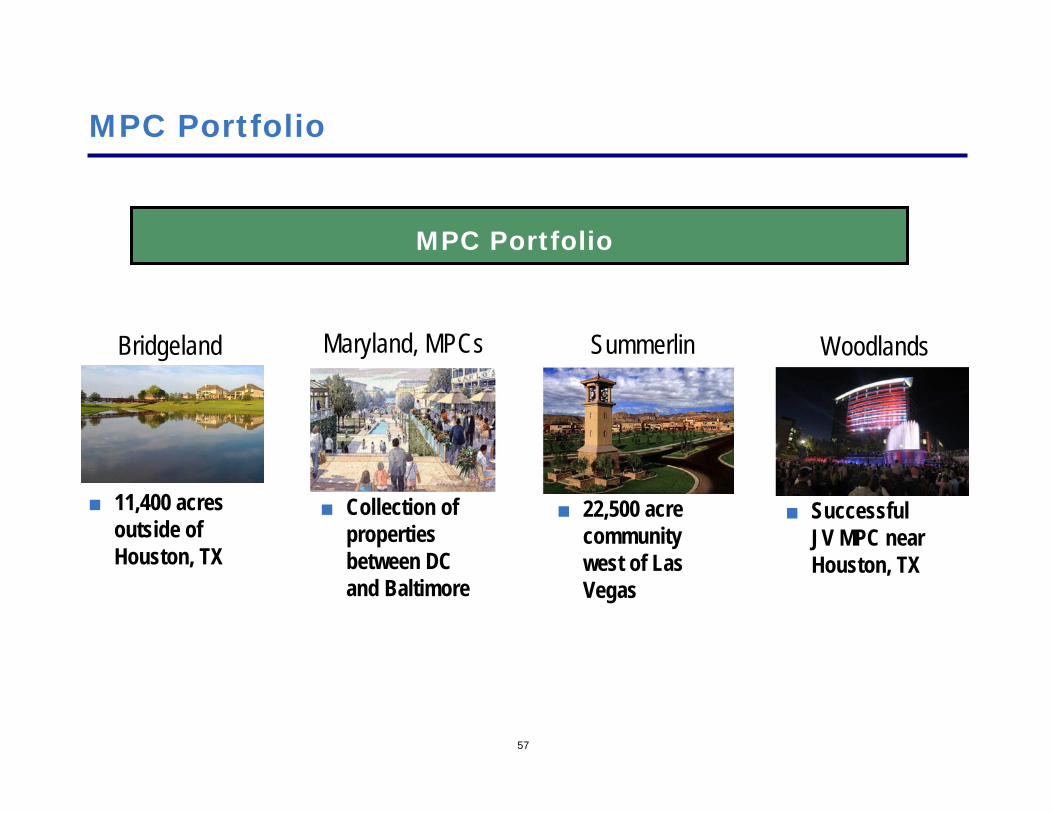
MPC Portfolio
MPC Portfolio
Bridgeland Summerlin WoodlandsMaryland, MPCs
■ 11,400 acres outside of Houston, TX
■ Collection of properties between DC and Baltimore
■ 22,500 acre community west of Las Vegas
■ Successful JV MPC near Houston, TX
58
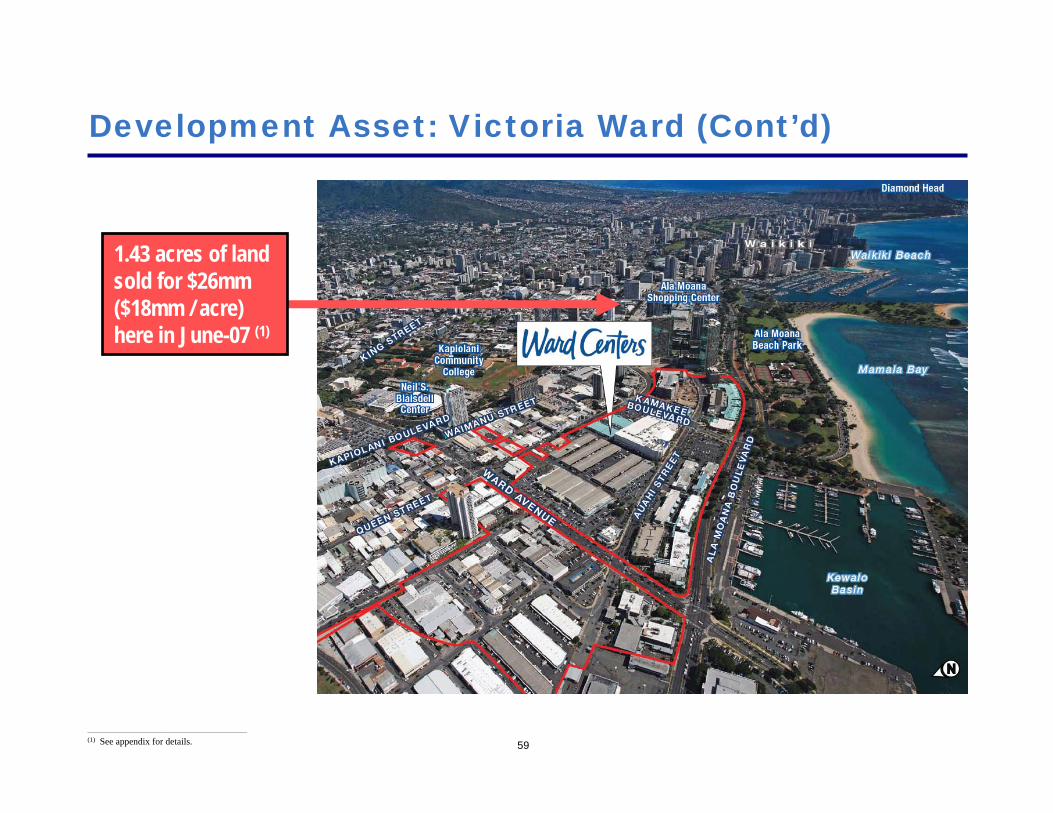
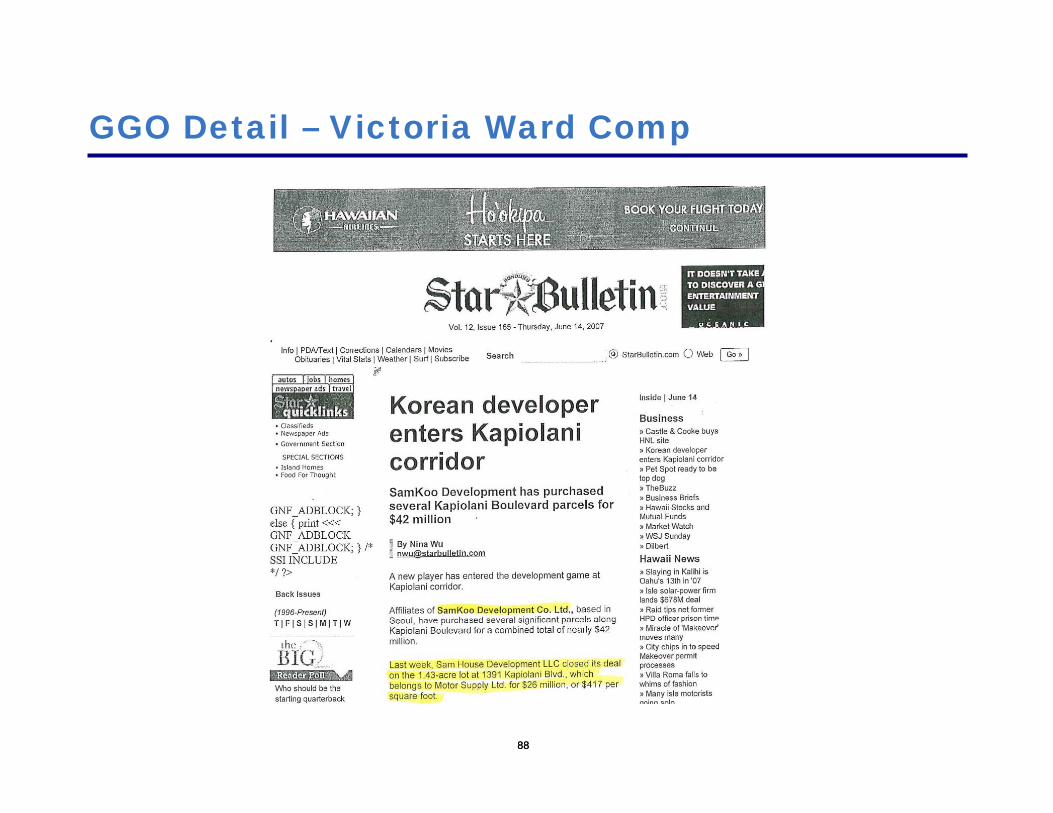
Development Asset: Victoria Ward
GGP recently received zoning approval to transform 60 acres of land in the heart of Honolulu into a vibrant and diverse neighborhood of residences, shops, entertainment and offices
The plan clears a path for GGP to bring to the oceanfront neighborhood as many as:
4,300 residential units, many of them in towers aligned to preserve mountain and ocean views
5 million square feet of retail shopping, restaurants and entertainment
4 million square feet of offices and other commercial space
700,000 square feet of industrial uses
14 acres of open space, parks and public facilities
59
Development Asset: Victoria Ward (Cont’d)
1.43 acres of land sold for $26mm ($18mm / acre) here in June-07 (1)
________________________________________________(1) See appendix for details.
60
Development Asset: South St. Seaport
Before the market turned, GGP was exploring a billion dollar redevelopment of South St. Seaport
Highlights of the development include:
400,000 square feet of retail space
A 286 room hotel and a smaller 163 room boutique
103 residential units
Nearly 5 acres of open space

61
Development Asset: South St. Seaport (Cont’d)
62
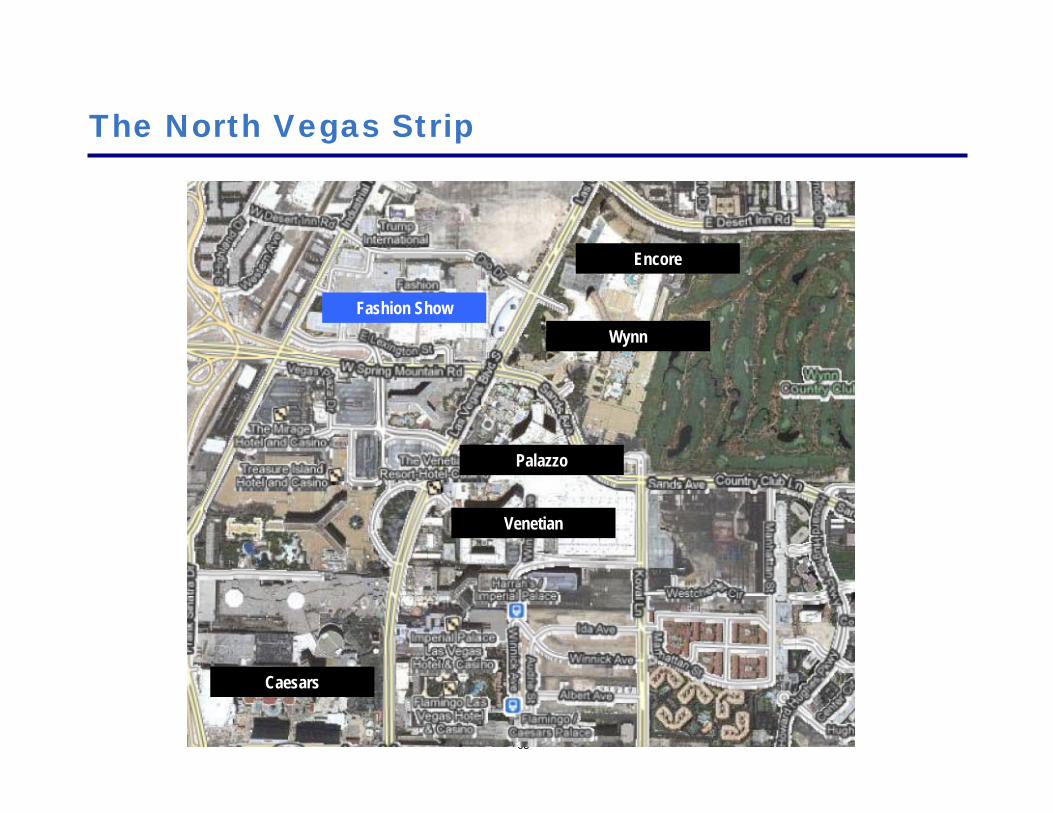
Non-Income Producing Asset: Fashion Show Air Rights
GGO owns the air rights above the Fashion Show Mall in Las Vegas
¹Source: "Vegas Land Values Soaring Sky High", Glenn Haussman, Hotel Interactive, 5/25/2007
This 48 acre, three-story property is located across from the Wynn and Encore, the most lucrative part of the Las Vegas Strip
In 2007, nearby North Vegas Strip land sold for $34mm/acre¹
Fashion Show’s location is within walking distance of 75% of the city’s more than 150,000 hotel rooms
Located adjacent to Fashion Show is The Venetian, The Palazzo, and Sands Expo Center – the largest hotel convention complex in the world
63
The North Vegas Strip
Fashion ShowWynn
Encore
Venetian
Palazzo
Caesars

Conclusion
6565
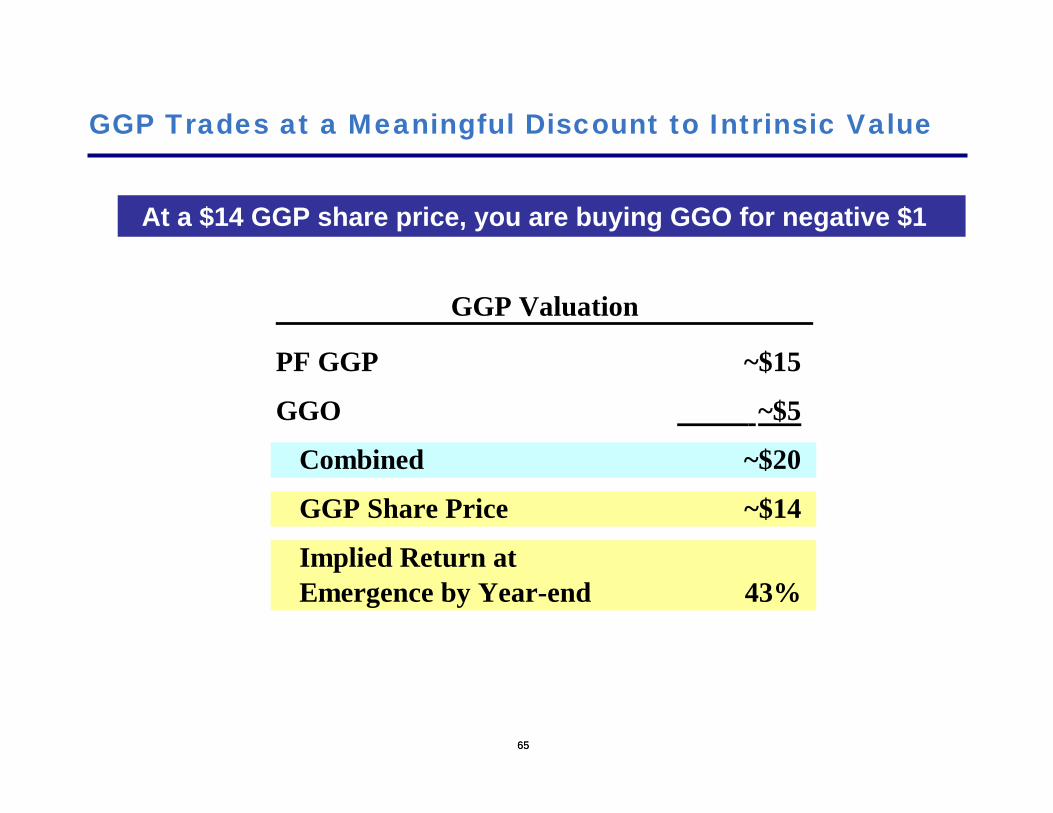
GGP Trades at a Meaningful Discount to Intrinsic Value
At a $14 GGP share price, you are buying GGO for negative $1
GGP Valuation
PF GGP ~$15
GGO ~$5
Combined ~$20
GGP Share Price ~$14
Implied Return atEmergence by Year-end 43%

Over the years, people have accused me of talking my book.
For my best investment idea…

6767
Buy Christine Richard’s Book, and Tell Your Friends
6868
And one more thing…
We have accumulated ~150mm shares of Citigroup during the past several weeks…
Appendix
7070
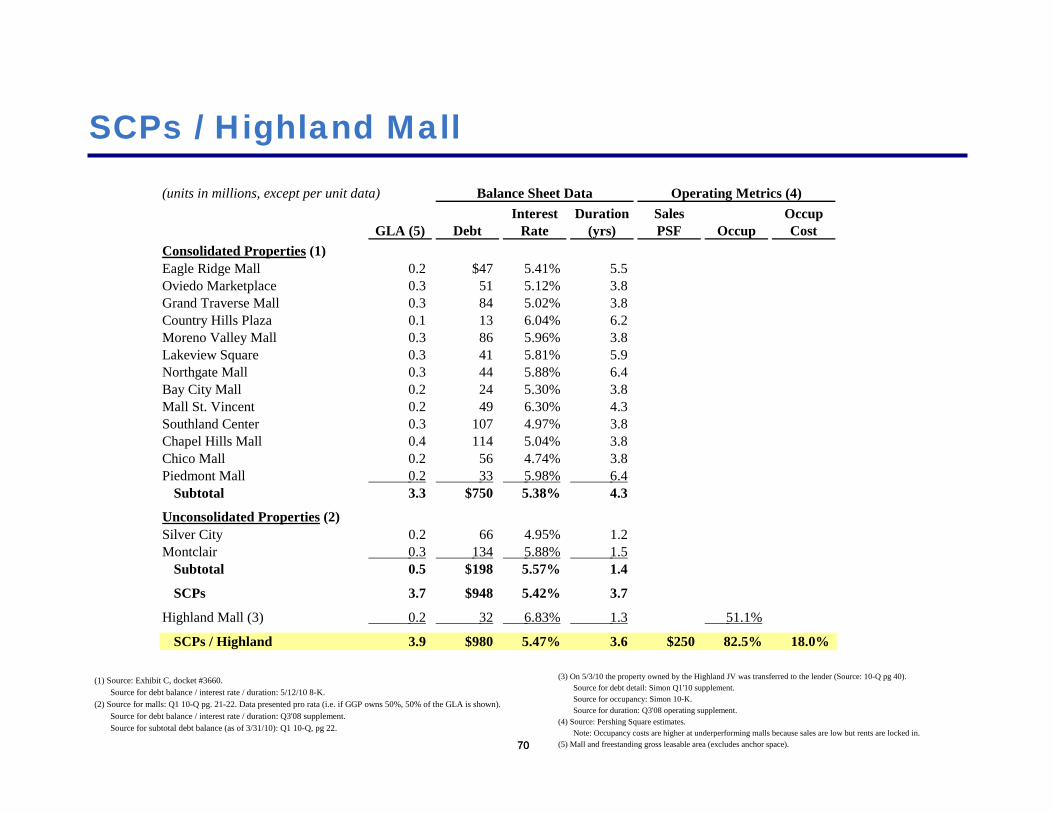
SCPs / Highland Mall
(1) Source: Exhibit C, docket #3660.Source for debt balance / interest rate / duration: 5/12/10 8-K.
(2) Source for malls: Q1 10-Q pg. 21-22. Data presented pro rata (i.e. if GGP owns 50%, 50% of the GLA is shown).Source for debt balance / interest rate / duration: Q3'08 supplement.Source for subtotal debt balance (as of 3/31/10): Q1 10-Q, pg 22.
(3) On 5/3/10 the property owned by the Highland JV was transferred to the lender (Source: 10-Q pg 40).Source for debt detail: Simon Q1'10 supplement.Source for occupancy: Simon 10-K.Source for duration: Q3'08 operating supplement.
(4) Source: Pershing Square estimates.Note: Occupancy costs are higher at underperforming malls because sales are low but rents are locked in.
(5) Mall and freestanding gross leasable area (excludes anchor space).
(units in millions, except per unit data) Balance Sheet Data Operating Metrics (4)Interest Duration Sales Occup
GLA (5) Debt Rate (yrs) PSF Occup CostConsolidated Properties (1)Eagle Ridge Mall 0.2 $47 5.41% 5.5Oviedo Marketplace 0.3 51 5.12% 3.8Grand Traverse Mall 0.3 84 5.02% 3.8Country Hills Plaza 0.1 13 6.04% 6.2Moreno Valley Mall 0.3 86 5.96% 3.8Lakeview Square 0.3 41 5.81% 5.9Northgate Mall 0.3 44 5.88% 6.4Bay City Mall 0.2 24 5.30% 3.8Mall St. Vincent 0.2 49 6.30% 4.3Southland Center 0.3 107 4.97% 3.8Chapel Hills Mall 0.4 114 5.04% 3.8Chico Mall 0.2 56 4.74% 3.8Piedmont Mall 0.2 33 5.98% 6.4
Subtotal 3.3 $750 5.38% 4.3
Unconsolidated Properties (2)Silver City 0.2 66 4.95% 1.2Montclair 0.3 134 5.88% 1.5
Subtotal 0.5 $198 5.57% 1.4
SCPs 3.7 $948 5.42% 3.7
Highland Mall (3) 0.2 32 6.83% 1.3 51.1%
SCPs / Highland 3.9 $980 5.47% 3.6 $250 82.5% 18.0%

7171
GGP Debt Detail – GGO
Note: Most recent debt balance reported assumed to be 3/31/10 balance.True balance is actually less as amortization has occurred since mostrecent reported debt balance.
Note: All GGO debt sits at the property-level and is non-recourse.Note: Excludes debt which may arise to the extent there is a GGO Promissory Note.
We believe the amount of this note will be $0.
Debt($ in 000s) Debt BalanceGGO Debt Balance as of: SourceVictoria Ward Cmbd $213,889 3/31/10 5/12/10 8-K110 N. Wacker 45,943 9/30/08 Q3'08 suppBridgelands MPC 29,812 12/31/09 10-KWoodlands MPC 216,343 9/30/08 Q3'08 supp
GGO Debt $505,987

7272
GGP Debt Detail – Debtor Entities
Source: GGP 5/12/10 8-K.Note: Entities with no debt will be unencumbered upon emergence.(1) Represents an SCP mall.(2) Paid down in April-10.
($ in 000s) Debt Debt Debt DebtDebtor Entities: 3/31/10 Debtor Entities: 3/31/10 Debtor Entities: 3/31/10 Debtor Entities: 3/31/1010 Columbia Corporate Center - Corporate Pointe #2 4,458 Mayfair Cmbd (offices included) 274,932 Sooner Cmbd 59,87310000 Chrlston/ 9901/21 Cvngton 21,772 Corporate Pointe #3 4,458 Mondawmin Mall Cmbd 84,689 Southlake Cmbd 99,79910000 Covington Cross - Country Hill Plaza 13,352 (1) Moreno Valley Mall Cmbd 86,432 (1) Southland Center Cmbd 106,940 (1)
10190 Covington Cross - Crossing Business Center #6 - Neighborhood Stores - Southland Cmbd 79,3251160/80 Town Center Drive 8,320 Crossing Business Center #7 - Newgate Mall Cmbd 40,207 Southwest Plaza Cmbd 96,1871201/41 Town Center Drive - Crossroads (MN) Cmbd 82,754 Newpark Mall 67,143 Spring Hill Cmbd 68,0881251/81 Town Center Drive - Deerbrook Mall 71,202 North Plains Mall Cmbd 10,656 Staten Island Mall 278,6721551 Hillshire Drive - Division Crossing 5,114 North Point Mall Cmbd 212,567 Steeplegate Mall Cmbd 76,5051635 Village Center Circle - Eagle Ridge Cmbd 46,942 (1) North Star Mall 228,174 Stonestown Mezz 57,400 (2)
1645 Village Center Circle - Eastridge (WY) Cmbd 38,497 North Town Cmbd 114,976 Stonestown Notes A/B 215,60020 Columbia Corporate Center - Eastridge Mall Cmbd 169,620 Northgate Cmbd 44,440 (1) The Boulevard Cmbd 105,34530 Columbia Corporate Center - Eden Prarie Cmbd 78,311 Northridge Fashion Ctr Cmbd 124,232 The Crossroads (MI) Cmbd 39,07440 Columbia Corporate Center - Faneuil Hall Marketplace Cmbd 92,788 Oakwood Center Cmbd 95,000 The Gallery at Harborplace Cmbd 78,51250 Columbia Corporate Center - Fashion Place Cmbd 142,255 Oakwood Cmbd 75,772 The Maine Mall Cmbd 212,59760 Columbia Corporate Center - Fashion Show Cmbd 645,918 Oglethorpe Cmbd 138,994 The Palazzo 249,6239950/80 Covington Cross - Foothills Mall Cmbd 50,758 Orem Plaza Center Street 2,386 The Shoppes at Fallen Timbers Cmbd 42,401Ala-Moana - Total 1,482,189 Fort Union 2,670 Orem Plaza State Street 1,477 The Woodland Mall 239,268Animas Valley Cmbd 35,054 Four Seasons Cmbd 97,950 Oviedo Marketplace Cmbd 51,066 (1) Three Rivers Cmbd 21,132Apache Cmbd - Fox River Cmbd 194,400 Owings Mills 53,281 Towneast Cmbd 102,775Arizona Center Cmbd - Gateway Cmbd 39,148 Oxmoor Cmbd 56,128 TRS-Fallbrook Cmbd 84,820Augusta Mall Cmbd 174,422 Gateway Crossing Shopping Ctr 14,931 Park City Center Cmbd 146,522 TRS-Grand Canal Shoppes Cmbd 386,487Austin Bluffs Plaza 2,219 Gateway Overlook 54,877 Park Place Cmbd 173,397 Tucson Mall 118,674Bay City Mall Cmbd 23,745 (1) Glenbrook Square Cmbd 174,262 Peachtree Cmbd 88,121 Tysons Galleria Cmbd 254,194Bayshore Cmbd 30,473 Grand Teton Cmbd 48,795 Pecanland Mall 56,159 University Crossing 11,147Beachwood Place Cmbd 240,164 Grand Traverse Cmbd 83,919 (1) Piedmont Cmbd 33,478 (1) Valley Hills Cmbd 55,775Bellis Fair Cmbd 59,826 Greenwood Cmbd 43,952 Pierre Bossier Cmbd 40,382 Valley Plaza Cmbd 93,129Birchwood Cmbd 44,308 Halsey Crossing 2,503 Pine Ridge Cmbd 25,956 Victoria Ward Center 57,175Boise Towne Plaza 10,704 Harborplace Cmbd 49,884 Pioneer Place Cmbd 156,764 Victoria Ward Village/Gateway/Indust 88,214Boise Towne Square 69,489 Hulen Mall Cmbd 111,085 Prince Kuhio Plaza 36,885 Victoria Ward Warehouse/Plaza 68,500Brass Mill Cmbd 120,142 Jordan Town Creek Cmbd 182,227 Providence Place Cmbd 381,691 Village of Cross Keys Cmbd 10,257Burlington Town Center Cmbd 31,406 Knollwood Mall Cmbd 39,332 Red Cliffs Mall Cmbd 24,669 Visalia Cmbd 40,253Cache Valley Cmbd 28,043 Lakeside Mall Cmbd 176,810 Regency Square Cmbd 91,588 Vista Commons - Capital Cmbd 19,975 Lakeview Square Cmbd 40,771 (1) Ridgedale Center Cmbd 175,127 Vista Ridge Mall Cmbd 78,869Chapel Hills Cmbd 113,785 (1) Lansing Cmbd 23,081 Ridgley Building - Washington Park Mall Cmbd 11,893Chico Mall Cmbd 55,913 (1) Lincolnshire Commons 27,939 River Hills Cmbd 79,831 West Valley Cmbd 54,543Chula Vista Center Cmbd - Lynnhaven Cmbd 233,105 River Pointe Plaza 3,696 Westwood Mall 24,117Collin Creek Combine 65,884 Mall at Sierra Vista Cmbd 23,556 Riverside Plaza 5,290 White Marsh Mall Cmbd 186,800Colony Square Cmbd 25,239 Mall of Louisiana 235,174 Rivertown Cmbd 115,948 White Mountain Cmbd 10,656Columbia Center-C.A. Building - Mall of Louisiana Power Center - Rogue Valley Cmbd 25,966 Willowbrook Cmbd 155,974Columbia Center-Exhibit Bldg - Mall of the Bluffs Cmbd 35,951 Saint Louis Galleria 233,390 Woodbridge Center Cmbd 203,884Columbia Mall Cmbd 89,807 Mall St. Mathews Cmbd 142,008 Salem Center Cmbd 41,728 Woodlands Village 6,758 Columbiana Centre Cmbd 105,441 Mall St. Vincent Cmbd 49,000 (1) Sikes Senter Cmbd 60,395Coronado Center Cmbd 166,028 Market Place Cmbd 105,773 Silver Lake Cmbd 18,228 Debtor Entity Debt $14,712,876
7373
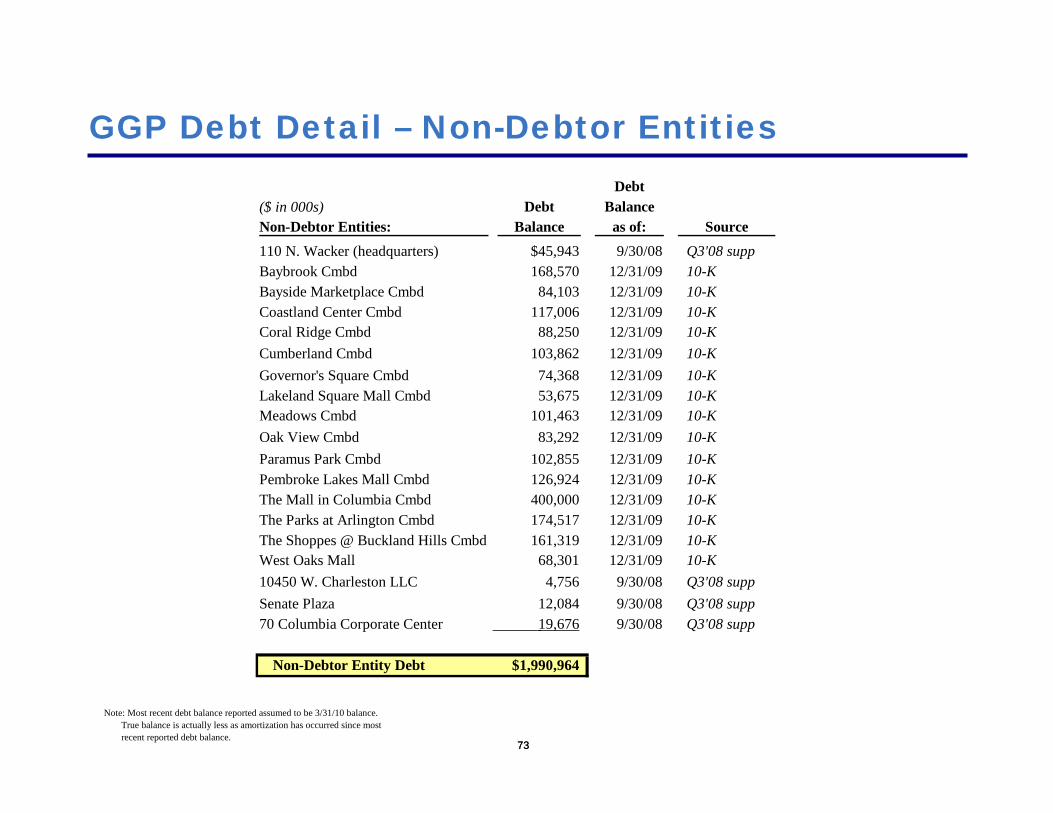
GGP Debt Detail – Non-Debtor Entities
Note: Most recent debt balance reported assumed to be 3/31/10 balance.True balance is actually less as amortization has occurred since mostrecent reported debt balance.
Debt($ in 000s) Debt BalanceNon-Debtor Entities: Balance as of: Source110 N. Wacker (headquarters) $45,943 9/30/08 Q3'08 suppBaybrook Cmbd 168,570 12/31/09 10-KBayside Marketplace Cmbd 84,103 12/31/09 10-KCoastland Center Cmbd 117,006 12/31/09 10-KCoral Ridge Cmbd 88,250 12/31/09 10-KCumberland Cmbd 103,862 12/31/09 10-KGovernor's Square Cmbd 74,368 12/31/09 10-KLakeland Square Mall Cmbd 53,675 12/31/09 10-KMeadows Cmbd 101,463 12/31/09 10-KOak View Cmbd 83,292 12/31/09 10-KParamus Park Cmbd 102,855 12/31/09 10-KPembroke Lakes Mall Cmbd 126,924 12/31/09 10-KThe Mall in Columbia Cmbd 400,000 12/31/09 10-KThe Parks at Arlington Cmbd 174,517 12/31/09 10-KThe Shoppes @ Buckland Hills Cmbd 161,319 12/31/09 10-KWest Oaks Mall 68,301 12/31/09 10-K10450 W. Charleston LLC 4,756 9/30/08 Q3'08 suppSenate Plaza 12,084 9/30/08 Q3'08 supp70 Columbia Corporate Center 19,676 9/30/08 Q3'08 supp
Non-Debtor Entity Debt $1,990,964
7474
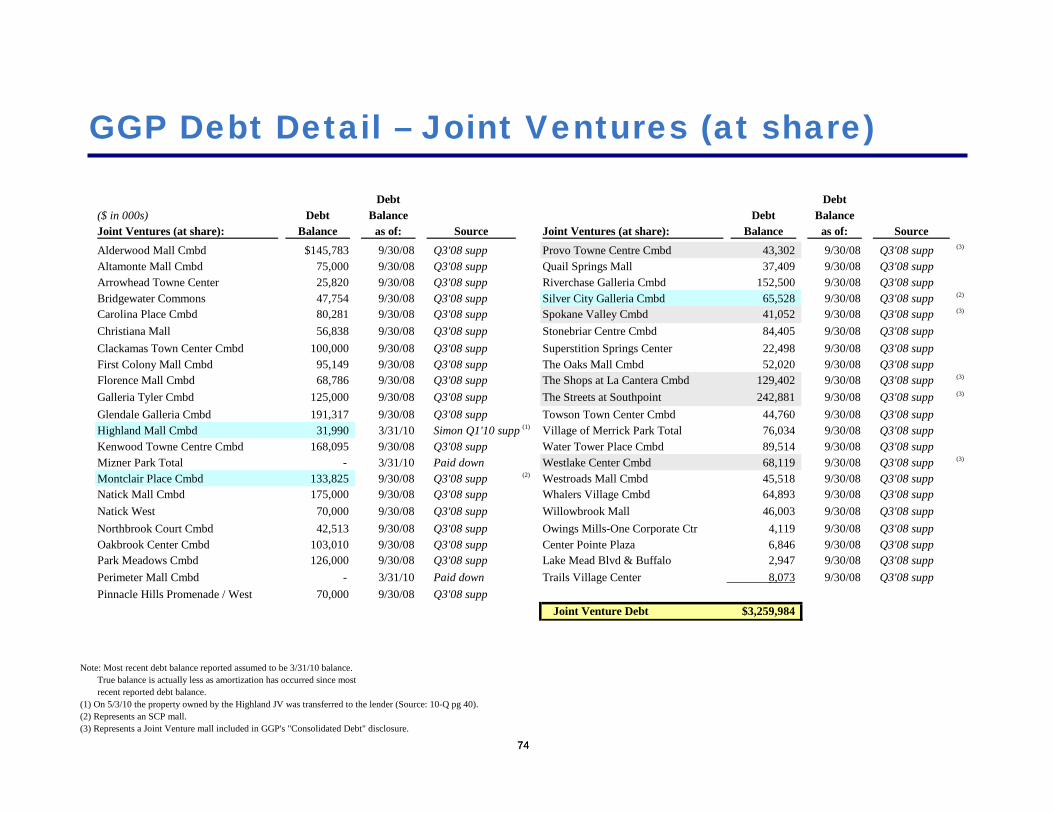
GGP Debt Detail – Joint Ventures (at share)
Note: Most recent debt balance reported assumed to be 3/31/10 balance.True balance is actually less as amortization has occurred since mostrecent reported debt balance.
(1) On 5/3/10 the property owned by the Highland JV was transferred to the lender (Source: 10-Q pg 40).(2) Represents an SCP mall.(3) Represents a Joint Venture mall included in GGP's "Consolidated Debt" disclosure.
Debt Debt($ in 000s) Debt Balance Debt BalanceJoint Ventures (at share): Balance as of: Source Joint Ventures (at share): Balance as of: SourceAlderwood Mall Cmbd $145,783 9/30/08 Q3'08 supp Provo Towne Centre Cmbd 43,302 9/30/08 Q3'08 supp (3)
Altamonte Mall Cmbd 75,000 9/30/08 Q3'08 supp Quail Springs Mall 37,409 9/30/08 Q3'08 suppArrowhead Towne Center 25,820 9/30/08 Q3'08 supp Riverchase Galleria Cmbd 152,500 9/30/08 Q3'08 suppBridgewater Commons 47,754 9/30/08 Q3'08 supp Silver City Galleria Cmbd 65,528 9/30/08 Q3'08 supp (2)
Carolina Place Cmbd 80,281 9/30/08 Q3'08 supp Spokane Valley Cmbd 41,052 9/30/08 Q3'08 supp (3)
Christiana Mall 56,838 9/30/08 Q3'08 supp Stonebriar Centre Cmbd 84,405 9/30/08 Q3'08 suppClackamas Town Center Cmbd 100,000 9/30/08 Q3'08 supp Superstition Springs Center 22,498 9/30/08 Q3'08 suppFirst Colony Mall Cmbd 95,149 9/30/08 Q3'08 supp The Oaks Mall Cmbd 52,020 9/30/08 Q3'08 suppFlorence Mall Cmbd 68,786 9/30/08 Q3'08 supp The Shops at La Cantera Cmbd 129,402 9/30/08 Q3'08 supp (3)
Galleria Tyler Cmbd 125,000 9/30/08 Q3'08 supp The Streets at Southpoint 242,881 9/30/08 Q3'08 supp (3)
Glendale Galleria Cmbd 191,317 9/30/08 Q3'08 supp Towson Town Center Cmbd 44,760 9/30/08 Q3'08 suppHighland Mall Cmbd 31,990 3/31/10 Simon Q1'10 supp (1) Village of Merrick Park Total 76,034 9/30/08 Q3'08 suppKenwood Towne Centre Cmbd 168,095 9/30/08 Q3'08 supp Water Tower Place Cmbd 89,514 9/30/08 Q3'08 suppMizner Park Total - 3/31/10 Paid down Westlake Center Cmbd 68,119 9/30/08 Q3'08 supp (3)
Montclair Place Cmbd 133,825 9/30/08 Q3'08 supp (2) Westroads Mall Cmbd 45,518 9/30/08 Q3'08 suppNatick Mall Cmbd 175,000 9/30/08 Q3'08 supp Whalers Village Cmbd 64,893 9/30/08 Q3'08 suppNatick West 70,000 9/30/08 Q3'08 supp Willowbrook Mall 46,003 9/30/08 Q3'08 suppNorthbrook Court Cmbd 42,513 9/30/08 Q3'08 supp Owings Mills-One Corporate Ctr 4,119 9/30/08 Q3'08 suppOakbrook Center Cmbd 103,010 9/30/08 Q3'08 supp Center Pointe Plaza 6,846 9/30/08 Q3'08 suppPark Meadows Cmbd 126,000 9/30/08 Q3'08 supp Lake Mead Blvd & Buffalo 2,947 9/30/08 Q3'08 suppPerimeter Mall Cmbd - 3/31/10 Paid down Trails Village Center 8,073 9/30/08 Q3'08 suppPinnacle Hills Promenade / West 70,000 9/30/08 Q3'08 supp
Joint Venture Debt $3,259,984
7575
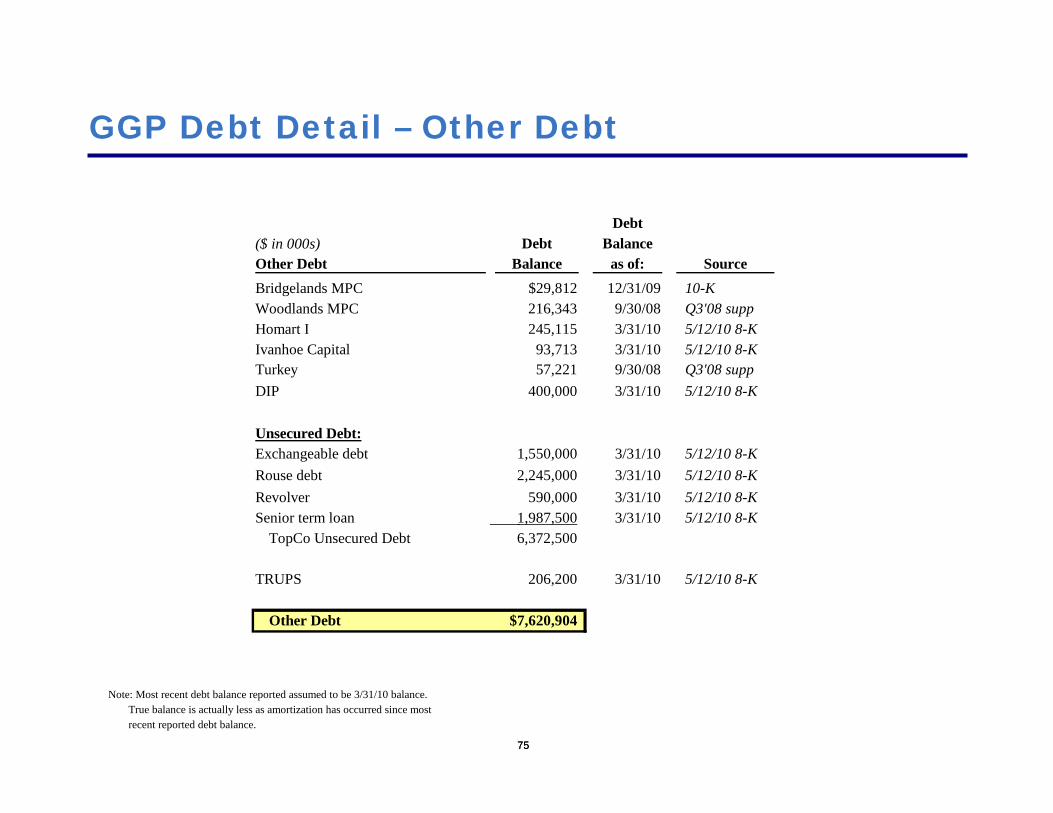
GGP Debt Detail – Other Debt
Note: Most recent debt balance reported assumed to be 3/31/10 balance.True balance is actually less as amortization has occurred since mostrecent reported debt balance.
Debt($ in 000s) Debt BalanceOther Debt Balance as of: SourceBridgelands MPC $29,812 12/31/09 10-KWoodlands MPC 216,343 9/30/08 Q3'08 suppHomart I 245,115 3/31/10 5/12/10 8-KIvanhoe Capital 93,713 3/31/10 5/12/10 8-KTurkey 57,221 9/30/08 Q3'08 suppDIP 400,000 3/31/10 5/12/10 8-K
Unsecured Debt:Exchangeable debt 1,550,000 3/31/10 5/12/10 8-KRouse debt 2,245,000 3/31/10 5/12/10 8-KRevolver 590,000 3/31/10 5/12/10 8-KSenior term loan 1,987,500 3/31/10 5/12/10 8-K
TopCo Unsecured Debt 6,372,500
TRUPS 206,200 3/31/10 5/12/10 8-K
Other Debt $7,620,904
7676
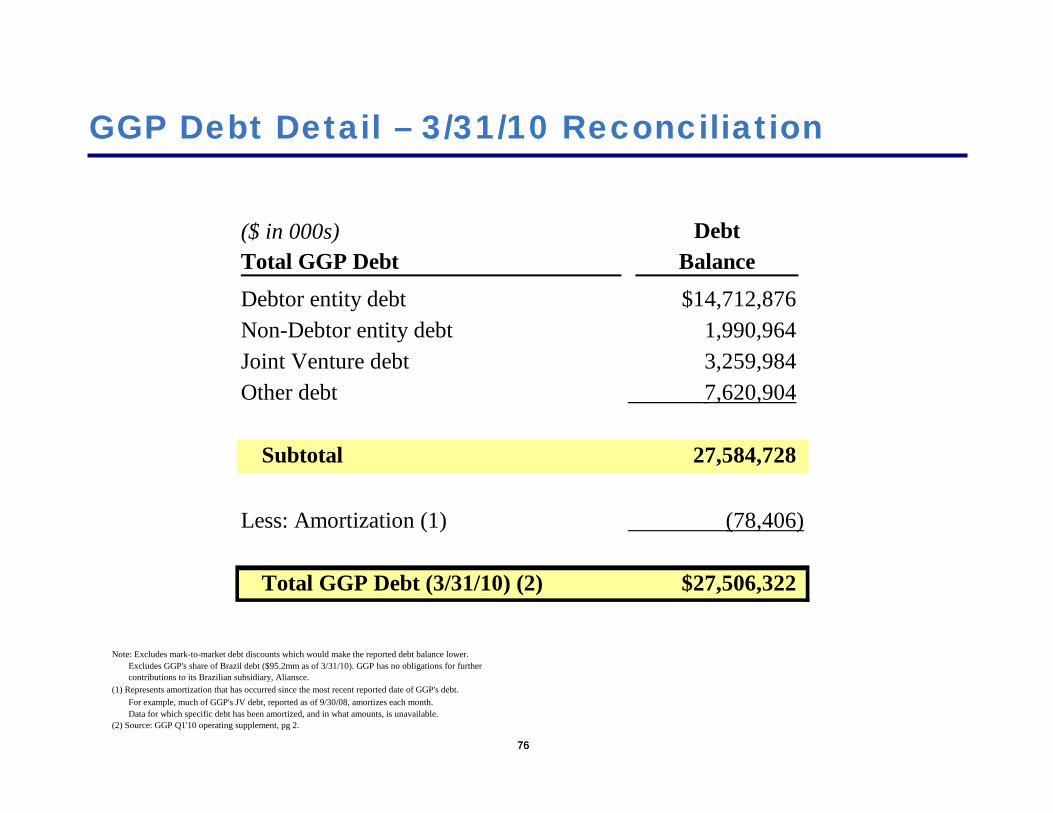
GGP Debt Detail – 3/31/10 Reconciliation
Note: Excludes mark-to-market debt discounts which would make the reported debt balance lower.Excludes GGP's share of Brazil debt ($95.2mm as of 3/31/10). GGP has no obligations for furthercontributions to its Brazilian subsidiary, Aliansce.
(1) Represents amortization that has occurred since the most recent reported date of GGP's debt.For example, much of GGP's JV debt, reported as of 9/30/08, amortizes each month.Data for which specific debt has been amortized, and in what amounts, is unavailable.
(2) Source: GGP Q1'10 operating supplement, pg 2.
($ in 000s) DebtTotal GGP Debt Balance
Debtor entity debt $14,712,876Non-Debtor entity debt 1,990,964Joint Venture debt 3,259,984Other debt 7,620,904
Subtotal 27,584,728
Less: Amortization (1) (78,406)
Total GGP Debt (3/31/10) (2) $27,506,322
7777
PF GGP Debt Detail
(1) Source: Q1'10 supplement pg 2. See appendix for details.(2) As of 9/30/09, the last time GGP published its interest coverage ratio in its operating supplement.(3) See appendix for details.(4) Paid down Apr-10.(5) On 5/3/10 the property owned by the Highland JV was transferred to the lender (Source: 10-Q pg 40).(6) Assumed to be paid down as part of PF GGP's emergence.(7) Assumed to be issued as part of PF GGP's emergence.
PF GGP Debt Buildup ($ in mms)
Total GGP Debt (3/31/10) (1) $27,506Interest coverage ratio (2) 1.2x
Less: SCPs debt (3) (948)Less: GGO debt (3) (506)Less: Stonestown mezz (4) (57) Less: Highland (5) (32) Less: TopCo unsecured debt (6) (6,373) Less: DIP (6) (400) Plus: New Debt (7) 1,500
PF GGP Debt (3/31/10) $20,691
Less: Additional amortization through 9/30/10e (3) (212) PF GGP Debt (9/30/10e) $20,478Interest coverage ratio (3) 2.0x
7878
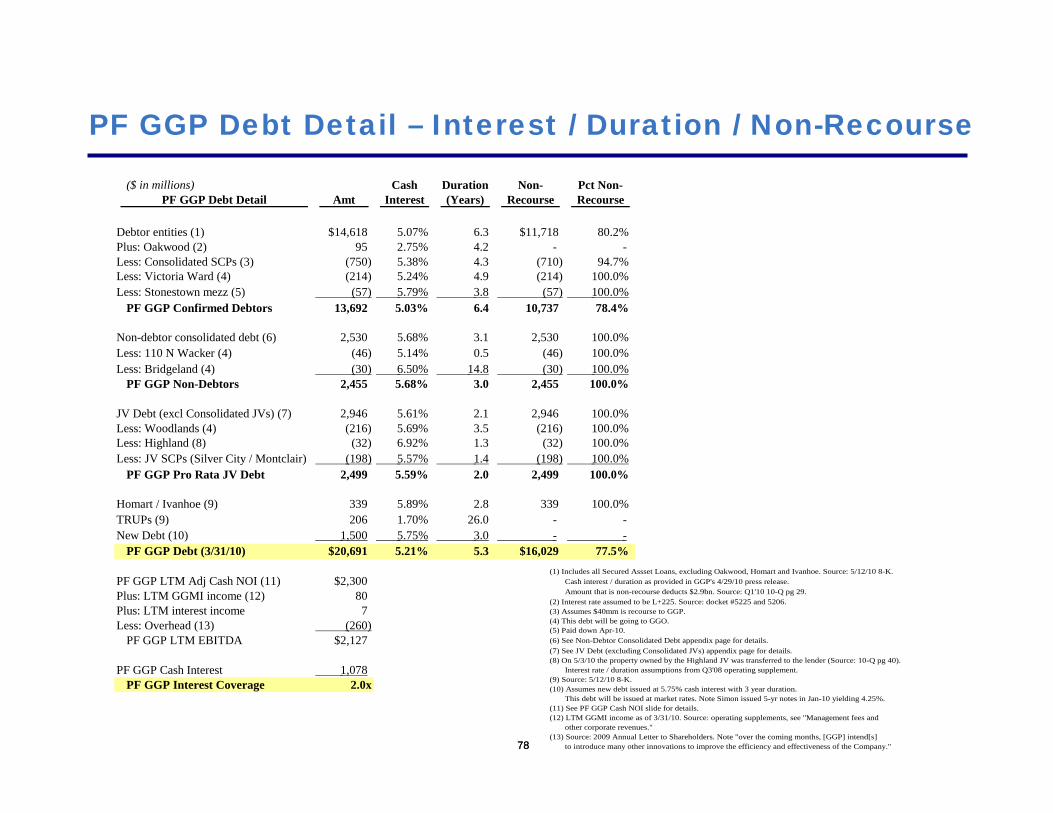
PF GGP Debt Detail – Interest / Duration / Non-Recourse
($ in millions) Cash Duration Non- Pct Non-PF GGP Debt Detail Amt Interest (Years) Recourse Recourse
Debtor entities (1) $14,618 5.07% 6.3 $11,718 80.2%Plus: Oakwood (2) 95 2.75% 4.2 - - Less: Consolidated SCPs (3) (750) 5.38% 4.3 (710) 94.7%Less: Victoria Ward (4) (214) 5.24% 4.9 (214) 100.0%Less: Stonestown mezz (5) (57) 5.79% 3.8 (57) 100.0%
PF GGP Confirmed Debtors 13,692 5.03% 6.4 10,737 78.4%
Non-debtor consolidated debt (6) 2,530 5.68% 3.1 2,530 100.0%Less: 110 N Wacker (4) (46) 5.14% 0.5 (46) 100.0%Less: Bridgeland (4) (30) 6.50% 14.8 (30) 100.0%
PF GGP Non-Debtors 2,455 5.68% 3.0 2,455 100.0%
JV Debt (excl Consolidated JVs) (7) 2,946 5.61% 2.1 2,946 100.0%Less: Woodlands (4) (216) 5.69% 3.5 (216) 100.0%Less: Highland (8) (32) 6.92% 1.3 (32) 100.0% Less: JV SCPs (Silver City / Montclair) (198) 5.57% 1.4 (198) 100.0%
PF GGP Pro Rata JV Debt 2,499 5.59% 2.0 2,499 100.0%
Homart / Ivanhoe (9) 339 5.89% 2.8 339 100.0%TRUPs (9) 206 1.70% 26.0 - - New Debt (10) 1,500 5.75% 3.0 - -
PF GGP Debt (3/31/10) $20,691 5.21% 5.3 $16,029 77.5%
PF GGP LTM Adj Cash NOI (11) $2,300Plus: LTM GGMI income (12) 80Plus: LTM interest income 7Less: Overhead (13) (260)
PF GGP LTM EBITDA $2,127
PF GGP Cash Interest 1,078 PF GGP Interest Coverage 2.0x
(1) Includes all Secured Assset Loans, excluding Oakwood, Homart and Ivanhoe. Source: 5/12/10 8-K.Cash interest / duration as provided in GGP's 4/29/10 press release.Amount that is non-recourse deducts $2.9bn. Source: Q1'10 10-Q pg 29.
(2) Interest rate assumed to be L+225. Source: docket #5225 and 5206.(3) Assumes $40mm is recourse to GGP.(4) This debt will be going to GGO.(5) Paid down Apr-10.(6) See Non-Debtor Consolidated Debt appendix page for details.(7) See JV Debt (excluding Consolidated JVs) appendix page for details.(8) On 5/3/10 the property owned by the Highland JV was transferred to the lender (Source: 10-Q pg 40).
Interest rate / duration assumptions from Q3'08 operating supplement.(9) Source: 5/12/10 8-K.(10) Assumes new debt issued at 5.75% cash interest with 3 year duration.
This debt will be issued at market rates. Note Simon issued 5-yr notes in Jan-10 yielding 4.25%.(11) See PF GGP Cash NOI slide for details.(12) LTM GGMI income as of 3/31/10. Source: operating supplements, see "Management fees and
other corporate revenues."(13) Source: 2009 Annual Letter to Shareholders. Note "over the coming months, [GGP] intend[s]
to introduce many other innovations to improve the efficiency and effectiveness of the Company."
7979
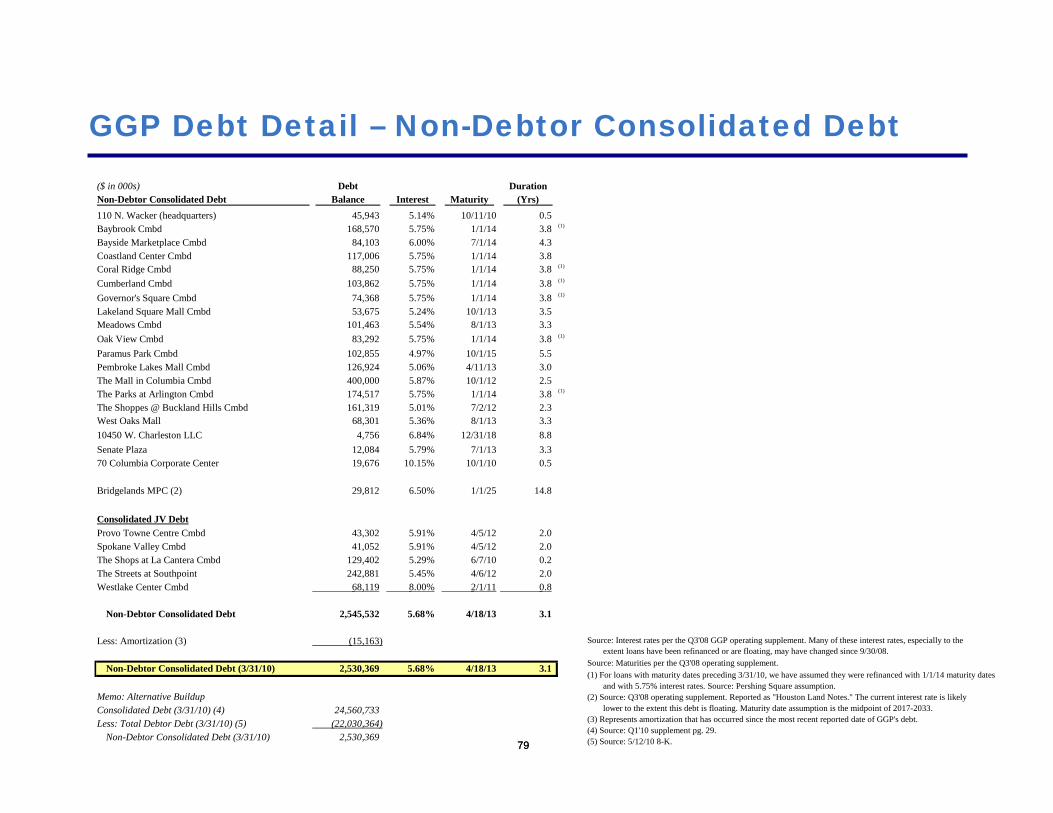
GGP Debt Detail – Non-Debtor Consolidated Debt
Source: Interest rates per the Q3'08 GGP operating supplement. Many of these interest rates, especially to theextent loans have been refinanced or are floating, may have changed since 9/30/08.
Source: Maturities per the Q3'08 operating supplement.(1) For loans with maturity dates preceding 3/31/10, we have assumed they were refinanced with 1/1/14 maturity dates
and with 5.75% interest rates. Source: Pershing Square assumption.(2) Source: Q3'08 operating supplement. Reported as "Houston Land Notes." The current interest rate is likely
lower to the extent this debt is floating. Maturity date assumption is the midpoint of 2017-2033.(3) Represents amortization that has occurred since the most recent reported date of GGP's debt.(4) Source: Q1'10 supplement pg. 29.(5) Source: 5/12/10 8-K.
($ in 000s) Debt DurationNon-Debtor Consolidated Debt Balance Interest Maturity (Yrs)110 N. Wacker (headquarters) 45,943 5.14% 10/11/10 0.5Baybrook Cmbd 168,570 5.75% 1/1/14 3.8 (1)
Bayside Marketplace Cmbd 84,103 6.00% 7/1/14 4.3Coastland Center Cmbd 117,006 5.75% 1/1/14 3.8Coral Ridge Cmbd 88,250 5.75% 1/1/14 3.8 (1)
Cumberland Cmbd 103,862 5.75% 1/1/14 3.8 (1)
Governor's Square Cmbd 74,368 5.75% 1/1/14 3.8 (1)
Lakeland Square Mall Cmbd 53,675 5.24% 10/1/13 3.5Meadows Cmbd 101,463 5.54% 8/1/13 3.3Oak View Cmbd 83,292 5.75% 1/1/14 3.8 (1)
Paramus Park Cmbd 102,855 4.97% 10/1/15 5.5Pembroke Lakes Mall Cmbd 126,924 5.06% 4/11/13 3.0The Mall in Columbia Cmbd 400,000 5.87% 10/1/12 2.5The Parks at Arlington Cmbd 174,517 5.75% 1/1/14 3.8 (1)
The Shoppes @ Buckland Hills Cmbd 161,319 5.01% 7/2/12 2.3West Oaks Mall 68,301 5.36% 8/1/13 3.310450 W. Charleston LLC 4,756 6.84% 12/31/18 8.8Senate Plaza 12,084 5.79% 7/1/13 3.370 Columbia Corporate Center 19,676 10.15% 10/1/10 0.5
Bridgelands MPC (2) 29,812 6.50% 1/1/25 14.8
Consolidated JV DebtProvo Towne Centre Cmbd 43,302 5.91% 4/5/12 2.0Spokane Valley Cmbd 41,052 5.91% 4/5/12 2.0The Shops at La Cantera Cmbd 129,402 5.29% 6/7/10 0.2The Streets at Southpoint 242,881 5.45% 4/6/12 2.0Westlake Center Cmbd 68,119 8.00% 2/1/11 0.8
Non-Debtor Consolidated Debt 2,545,532 5.68% 4/18/13 3.1
Less: Amortization (3) (15,163)
Non-Debtor Consolidated Debt (3/31/10) 2,530,369 5.68% 4/18/13 3.1
Memo: Alternative BuildupConsolidated Debt (3/31/10) (4) 24,560,733 Less: Total Debtor Debt (3/31/10) (5) (22,030,364)
Non-Debtor Consolidated Debt (3/31/10) 2,530,369
8080
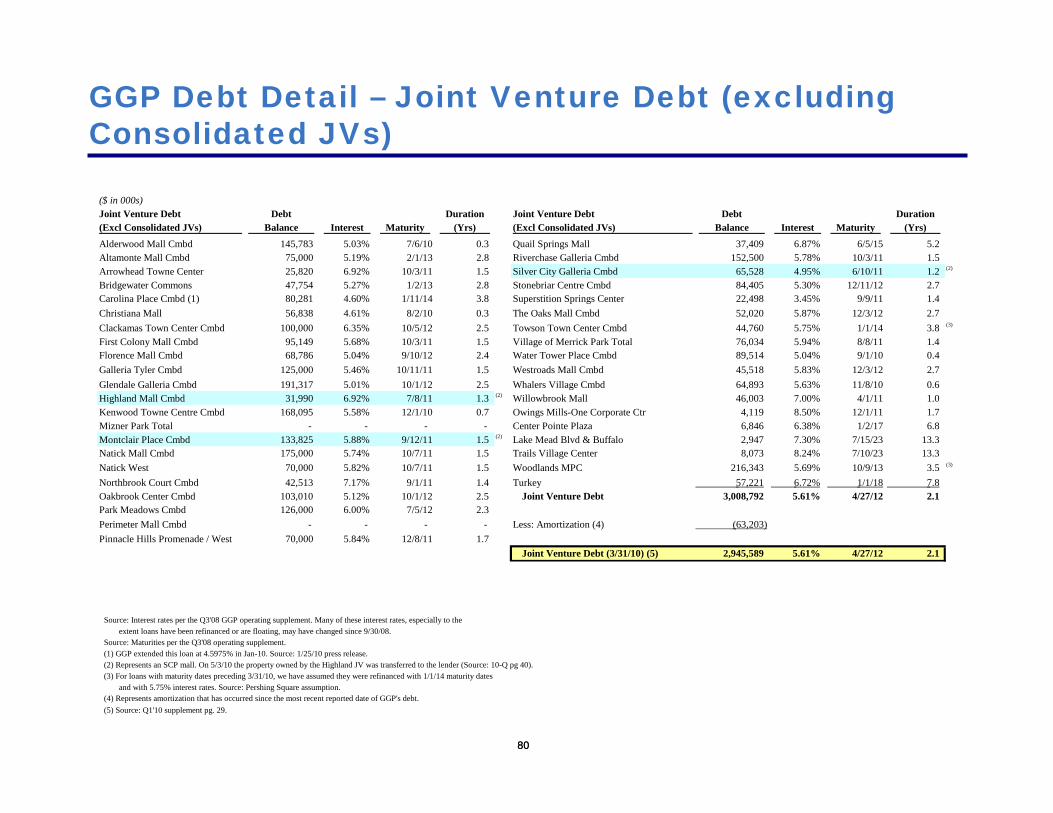
GGP Debt Detail – Joint Venture Debt (excluding Consolidated JVs)
($ in 000s)Joint Venture Debt Debt Duration Joint Venture Debt Debt Duration(Excl Consolidated JVs) Balance Interest Maturity (Yrs) (Excl Consolidated JVs) Balance Interest Maturity (Yrs)Alderwood Mall Cmbd 145,783 5.03% 7/6/10 0.3 Quail Springs Mall 37,409 6.87% 6/5/15 5.2Altamonte Mall Cmbd 75,000 5.19% 2/1/13 2.8 Riverchase Galleria Cmbd 152,500 5.78% 10/3/11 1.5Arrowhead Towne Center 25,820 6.92% 10/3/11 1.5 Silver City Galleria Cmbd 65,528 4.95% 6/10/11 1.2 (2)
Bridgewater Commons 47,754 5.27% 1/2/13 2.8 Stonebriar Centre Cmbd 84,405 5.30% 12/11/12 2.7Carolina Place Cmbd (1) 80,281 4.60% 1/11/14 3.8 Superstition Springs Center 22,498 3.45% 9/9/11 1.4Christiana Mall 56,838 4.61% 8/2/10 0.3 The Oaks Mall Cmbd 52,020 5.87% 12/3/12 2.7Clackamas Town Center Cmbd 100,000 6.35% 10/5/12 2.5 Towson Town Center Cmbd 44,760 5.75% 1/1/14 3.8 (3)
First Colony Mall Cmbd 95,149 5.68% 10/3/11 1.5 Village of Merrick Park Total 76,034 5.94% 8/8/11 1.4Florence Mall Cmbd 68,786 5.04% 9/10/12 2.4 Water Tower Place Cmbd 89,514 5.04% 9/1/10 0.4Galleria Tyler Cmbd 125,000 5.46% 10/11/11 1.5 Westroads Mall Cmbd 45,518 5.83% 12/3/12 2.7Glendale Galleria Cmbd 191,317 5.01% 10/1/12 2.5 Whalers Village Cmbd 64,893 5.63% 11/8/10 0.6Highland Mall Cmbd 31,990 6.92% 7/8/11 1.3 (2) Willowbrook Mall 46,003 7.00% 4/1/11 1.0Kenwood Towne Centre Cmbd 168,095 5.58% 12/1/10 0.7 Owings Mills-One Corporate Ctr 4,119 8.50% 12/1/11 1.7Mizner Park Total - - - - Center Pointe Plaza 6,846 6.38% 1/2/17 6.8Montclair Place Cmbd 133,825 5.88% 9/12/11 1.5 (2) Lake Mead Blvd & Buffalo 2,947 7.30% 7/15/23 13.3Natick Mall Cmbd 175,000 5.74% 10/7/11 1.5 Trails Village Center 8,073 8.24% 7/10/23 13.3Natick West 70,000 5.82% 10/7/11 1.5 Woodlands MPC 216,343 5.69% 10/9/13 3.5 (3)
Northbrook Court Cmbd 42,513 7.17% 9/1/11 1.4 Turkey 57,221 6.72% 1/1/18 7.8 Oakbrook Center Cmbd 103,010 5.12% 10/1/12 2.5 Joint Venture Debt 3,008,792 5.61% 4/27/12 2.1Park Meadows Cmbd 126,000 6.00% 7/5/12 2.3Perimeter Mall Cmbd - - - - Less: Amortization (4) (63,203) Pinnacle Hills Promenade / West 70,000 5.84% 12/8/11 1.7
Joint Venture Debt (3/31/10) (5) 2,945,589 5.61% 4/27/12 2.1
Source: Interest rates per the Q3'08 GGP operating supplement. Many of these interest rates, especially to theextent loans have been refinanced or are floating, may have changed since 9/30/08.
Source: Maturities per the Q3'08 operating supplement.(1) GGP extended this loan at 4.5975% in Jan-10. Source: 1/25/10 press release.(2) Represents an SCP mall. On 5/3/10 the property owned by the Highland JV was transferred to the lender (Source: 10-Q pg 40).(3) For loans with maturity dates preceding 3/31/10, we have assumed they were refinanced with 1/1/14 maturity dates
and with 5.75% interest rates. Source: Pershing Square assumption.(4) Represents amortization that has occurred since the most recent reported date of GGP's debt.(5) Source: Q1'10 supplement pg. 29.
8181
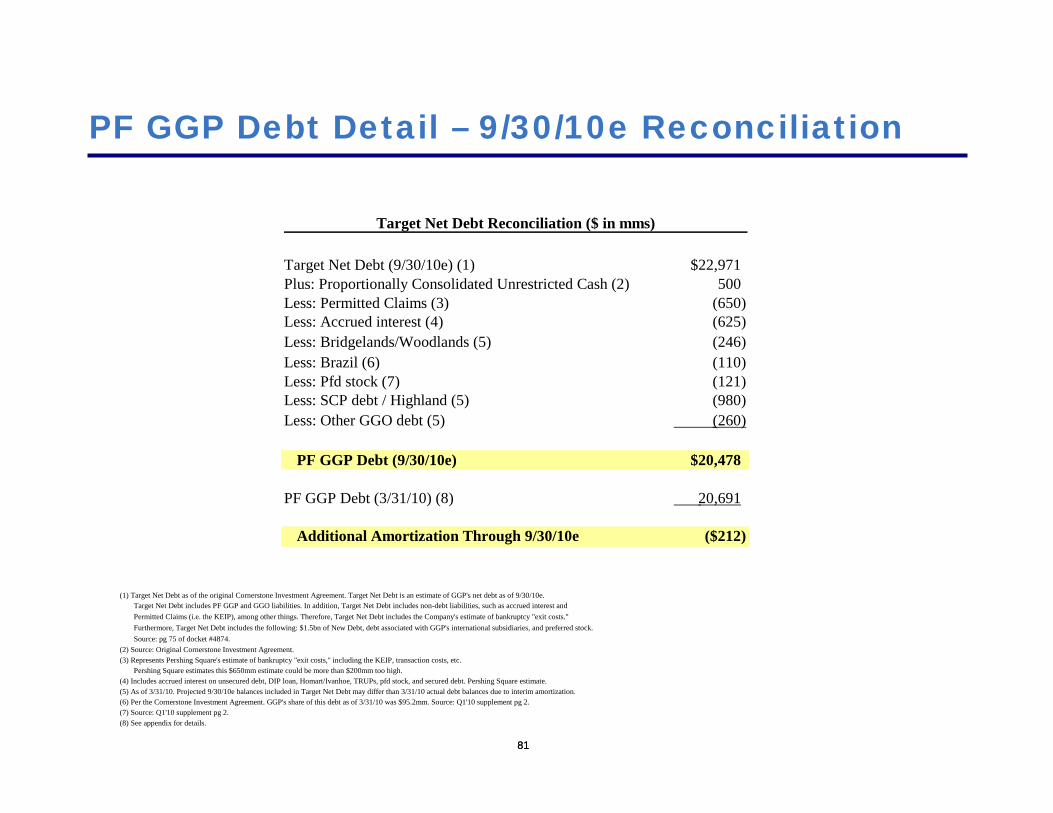
PF GGP Debt Detail – 9/30/10e Reconciliation
Target Net Debt Reconciliation ($ in mms)
Target Net Debt (9/30/10e) (1) $22,971Plus: Proportionally Consolidated Unrestricted Cash (2) 500Less: Permitted Claims (3) (650)Less: Accrued interest (4) (625)Less: Bridgelands/Woodlands (5) (246)Less: Brazil (6) (110)Less: Pfd stock (7) (121)Less: SCP debt / Highland (5) (980)Less: Other GGO debt (5) (260)
PF GGP Debt (9/30/10e) $20,478
PF GGP Debt (3/31/10) (8) 20,691
Additional Amortization Through 9/30/10e ($212)
(1) Target Net Debt as of the original Cornerstone Investment Agreement. Target Net Debt is an estimate of GGP's net debt as of 9/30/10e.Target Net Debt includes PF GGP and GGO liabilities. In addition, Target Net Debt includes non-debt liabilities, such as accrued interest andPermitted Claims (i.e. the KEIP), among other things. Therefore, Target Net Debt includes the Company's estimate of bankruptcy "exit costs."Furthermore, Target Net Debt includes the following: $1.5bn of New Debt, debt associated with GGP's international subsidiaries, and preferred stock.Source: pg 75 of docket #4874.
(2) Source: Original Cornerstone Investment Agreement.(3) Represents Pershing Square's estimate of bankruptcy "exit costs," including the KEIP, transaction costs, etc.
Pershing Square estimates this $650mm estimate could be more than $200mm too high.(4) Includes accrued interest on unsecured debt, DIP loan, Homart/Ivanhoe, TRUPs, pfd stock, and secured debt. Pershing Square estimate.(5) As of 3/31/10. Projected 9/30/10e balances included in Target Net Debt may differ than 3/31/10 actual debt balances due to interim amortization.(6) Per the Cornerstone Investment Agreement. GGP's share of this debt as of 3/31/10 was $95.2mm. Source: Q1'10 supplement pg 2.(7) Source: Q1'10 supplement pg 2.(8) See appendix for details.
8282
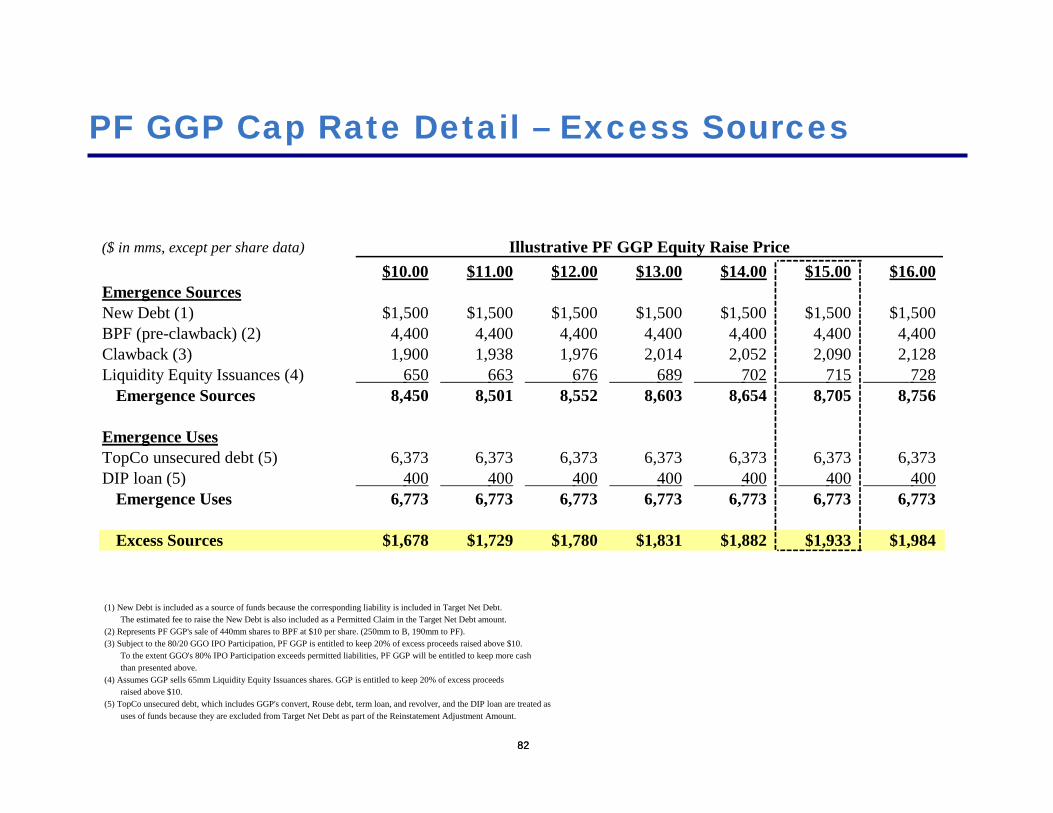
PF GGP Cap Rate Detail – Excess Sources
($ in mms, except per share data) Illustrative PF GGP Equity Raise Price$10.00 $11.00 $12.00 $13.00 $14.00 $15.00 $16.00
Emergence SourcesNew Debt (1) $1,500 $1,500 $1,500 $1,500 $1,500 $1,500 $1,500BPF (pre-clawback) (2) 4,400 4,400 4,400 4,400 4,400 4,400 4,400Clawback (3) 1,900 1,938 1,976 2,014 2,052 2,090 2,128Liquidity Equity Issuances (4) 650 663 676 689 702 715 728
Emergence Sources 8,450 8,501 8,552 8,603 8,654 8,705 8,756
Emergence UsesTopCo unsecured debt (5) 6,373 6,373 6,373 6,373 6,373 6,373 6,373DIP loan (5) 400 400 400 400 400 400 400
Emergence Uses 6,773 6,773 6,773 6,773 6,773 6,773 6,773
Excess Sources $1,678 $1,729 $1,780 $1,831 $1,882 $1,933 $1,984
(1) New Debt is included as a source of funds because the corresponding liability is included in Target Net Debt.The estimated fee to raise the New Debt is also included as a Permitted Claim in the Target Net Debt amount.
(2) Represents PF GGP's sale of 440mm shares to BPF at $10 per share. (250mm to B, 190mm to PF).(3) Subject to the 80/20 GGO IPO Participation, PF GGP is entitled to keep 20% of excess proceeds raised above $10.
To the extent GGO's 80% IPO Participation exceeds permitted liabilities, PF GGP will be entitled to keep more cashthan presented above.
(4) Assumes GGP sells 65mm Liquidity Equity Issuances shares. GGP is entitled to keep 20% of excess proceedsraised above $10.
(5) TopCo unsecured debt, which includes GGP's convert, Rouse debt, term loan, and revolver, and the DIP loan are treated asuses of funds because they are excluded from Target Net Debt as part of the Reinstatement Adjustment Amount.
8383
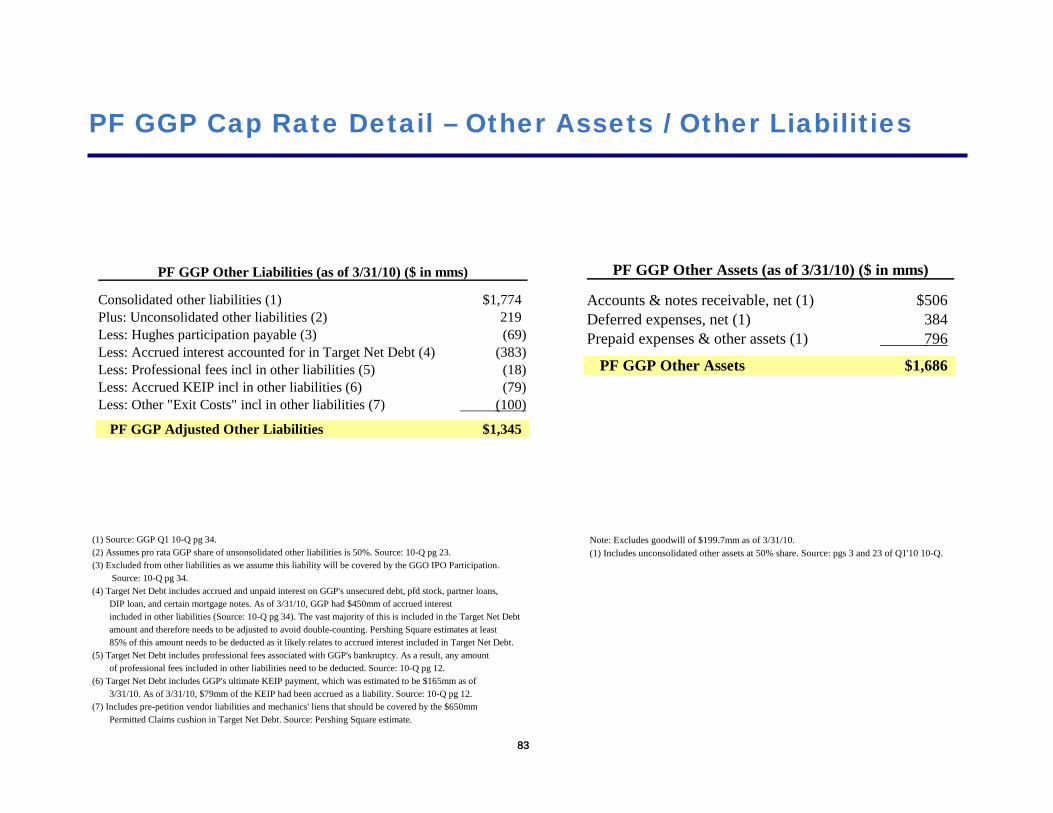
PF GGP Cap Rate Detail – Other Assets / Other Liabilities
PF GGP Other Liabilities (as of 3/31/10) ($ in mms)
Consolidated other liabilities (1) $1,774Plus: Unconsolidated other liabilities (2) 219Less: Hughes participation payable (3) (69)Less: Accrued interest accounted for in Target Net Debt (4) (383)Less: Professional fees incl in other liabilities (5) (18)Less: Accrued KEIP incl in other liabilities (6) (79)Less: Other "Exit Costs" incl in other liabilities (7) (100)
PF GGP Adjusted Other Liabilities $1,345
PF GGP Other Assets (as of 3/31/10) ($ in mms)
Accounts & notes receivable, net (1) $506Deferred expenses, net (1) 384Prepaid expenses & other assets (1) 796
PF GGP Other Assets $1,686
Note: Excludes goodwill of $199.7mm as of 3/31/10.(1) Includes unconsolidated other assets at 50% share. Source: pgs 3 and 23 of Q1'10 10-Q.
(1) Source: GGP Q1 10-Q pg 34.(2) Assumes pro rata GGP share of unsonsolidated other liabilities is 50%. Source: 10-Q pg 23.(3) Excluded from other liabilities as we assume this liability will be covered by the GGO IPO Participation.
Source: 10-Q pg 34.(4) Target Net Debt includes accrued and unpaid interest on GGP's unsecured debt, pfd stock, partner loans,
DIP loan, and certain mortgage notes. As of 3/31/10, GGP had $450mm of accrued interestincluded in other liabilities (Source: 10-Q pg 34). The vast majority of this is included in the Target Net Debtamount and therefore needs to be adjusted to avoid double-counting. Pershing Square estimates at least85% of this amount needs to be deducted as it likely relates to accrued interest included in Target Net Debt.
(5) Target Net Debt includes professional fees associated with GGP's bankruptcy. As a result, any amountof professional fees included in other liabilities need to be deducted. Source: 10-Q pg 12.
(6) Target Net Debt includes GGP's ultimate KEIP payment, which was estimated to be $165mm as of3/31/10. As of 3/31/10, $79mm of the KEIP had been accrued as a liability. Source: 10-Q pg 12.
(7) Includes pre-petition vendor liabilities and mechanics' liens that should be covered by the $650mmPermitted Claims cushion in Target Net Debt. Source: Pershing Square estimate.
8484
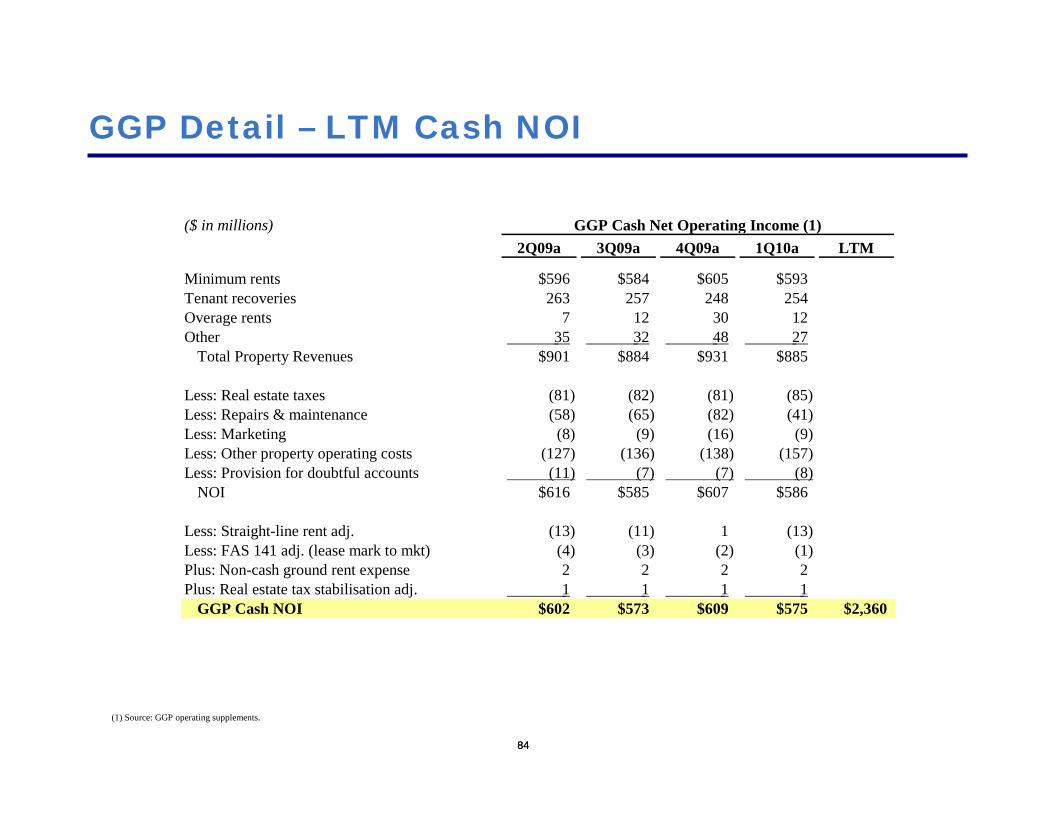
GGP Detail – LTM Cash NOI
($ in millions) GGP Cash Net Operating Income (1)2Q09a 3Q09a 4Q09a 1Q10a LTM
Minimum rents $596 $584 $605 $593Tenant recoveries 263 257 248 254Overage rents 7 12 30 12Other 35 32 48 27
Total Property Revenues $901 $884 $931 $885
Less: Real estate taxes (81) (82) (81) (85)Less: Repairs & maintenance (58) (65) (82) (41)Less: Marketing (8) (9) (16) (9)Less: Other property operating costs (127) (136) (138) (157)Less: Provision for doubtful accounts (11) (7) (7) (8)
NOI $616 $585 $607 $586
Less: Straight-line rent adj. (13) (11) 1 (13)Less: FAS 141 adj. (lease mark to mkt) (4) (3) (2) (1)Plus: Non-cash ground rent expense 2 2 2 2Plus: Real estate tax stabilisation adj. 1 1 1 1
GGP Cash NOI $602 $573 $609 $575 $2,360
(1) Source: GGP operating supplements.
8585
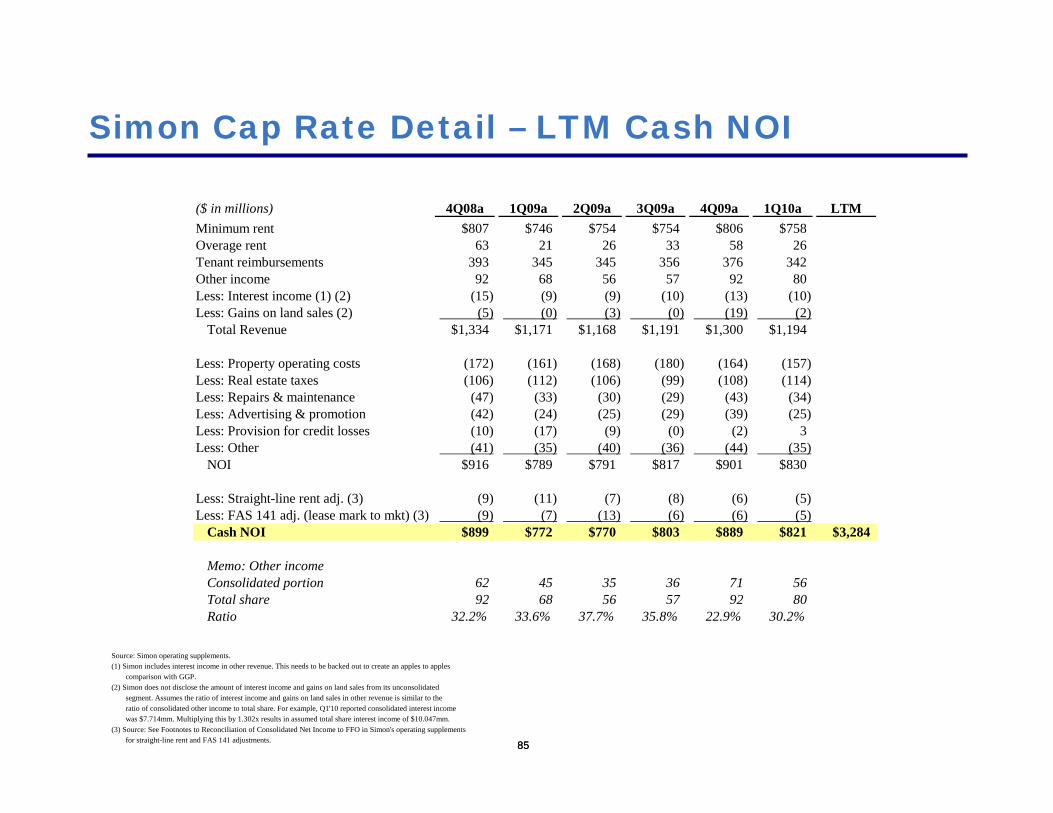
Simon Cap Rate Detail – LTM Cash NOI
Source: Simon operating supplements.(1) Simon includes interest income in other revenue. This needs to be backed out to create an apples to apples
comparison with GGP.(2) Simon does not disclose the amount of interest income and gains on land sales from its unconsolidated
segment. Assumes the ratio of interest income and gains on land sales in other revenue is similar to theratio of consolidated other income to total share. For example, Q1'10 reported consolidated interest incomewas $7.714mm. Multiplying this by 1.302x results in assumed total share interest income of $10.047mm.
(3) Source: See Footnotes to Reconciliation of Consolidated Net Income to FFO in Simon's operating supplementsfor straight-line rent and FAS 141 adjustments.
($ in millions) 4Q08a 1Q09a 2Q09a 3Q09a 4Q09a 1Q10a LTMMinimum rent $807 $746 $754 $754 $806 $758Overage rent 63 21 26 33 58 26Tenant reimbursements 393 345 345 356 376 342Other income 92 68 56 57 92 80 Less: Interest income (1) (2) (15) (9) (9) (10) (13) (10) Less: Gains on land sales (2) (5) (0) (3) (0) (19) (2)
Total Revenue $1,334 $1,171 $1,168 $1,191 $1,300 $1,194
Less: Property operating costs (172) (161) (168) (180) (164) (157)Less: Real estate taxes (106) (112) (106) (99) (108) (114)Less: Repairs & maintenance (47) (33) (30) (29) (43) (34)Less: Advertising & promotion (42) (24) (25) (29) (39) (25)Less: Provision for credit losses (10) (17) (9) (0) (2) 3 Less: Other (41) (35) (40) (36) (44) (35)
NOI $916 $789 $791 $817 $901 $830
Less: Straight-line rent adj. (3) (9) (11) (7) (8) (6) (5) Less: FAS 141 adj. (lease mark to mkt) (3) (9) (7) (13) (6) (6) (5)
Cash NOI $899 $772 $770 $803 $889 $821 $3,284
Memo: Other incomeConsolidated portion 62 45 35 36 71 56 Total share 92 68 56 57 92 80 Ratio 32.2% 33.6% 37.7% 35.8% 22.9% 30.2%

8686
Simon Cap Rate Detail – Cap Rate Buildup
(1) Includes Series I preferred shares and options (Source: Simon Q1'10 operating supplement).(2) As reported in Simon's pro rata balance sheet (Source: Simon Q1'10 operating supplement).(3) Excludes $20mm of goodwill (Source: Simon 2009 10-K).(4) Simon's share of U.S. CIP (page 36 of Q1'10 operating supplement).(5) Applies 25% EBIT margin to LTM fee income of $122mm and a 7.5x EBIT multiple.(6) See Simon LTM Cash NOI appendix page for details.
(units in millions, except per share data)Share Price (as of 5/28/10) $85.03Shares & Units (1) 352
Market Cap $29,906
Pro Rata for JVs: (2)Plus: Total Debt 24,250 Plus: Preferred Debt 126 Plus: Other Liabilities 1,845 Less: Cash (3,609) Less: Other Assets (3) (2,445) Less: Development Pipeline (4) (35)
TEV $50,038
Less: Mgmt Business (5) (229) Value of Simon's REIT $49,809
LTM Cash NOI (6) $3,284Implied Cap Rate 6.6%
8787
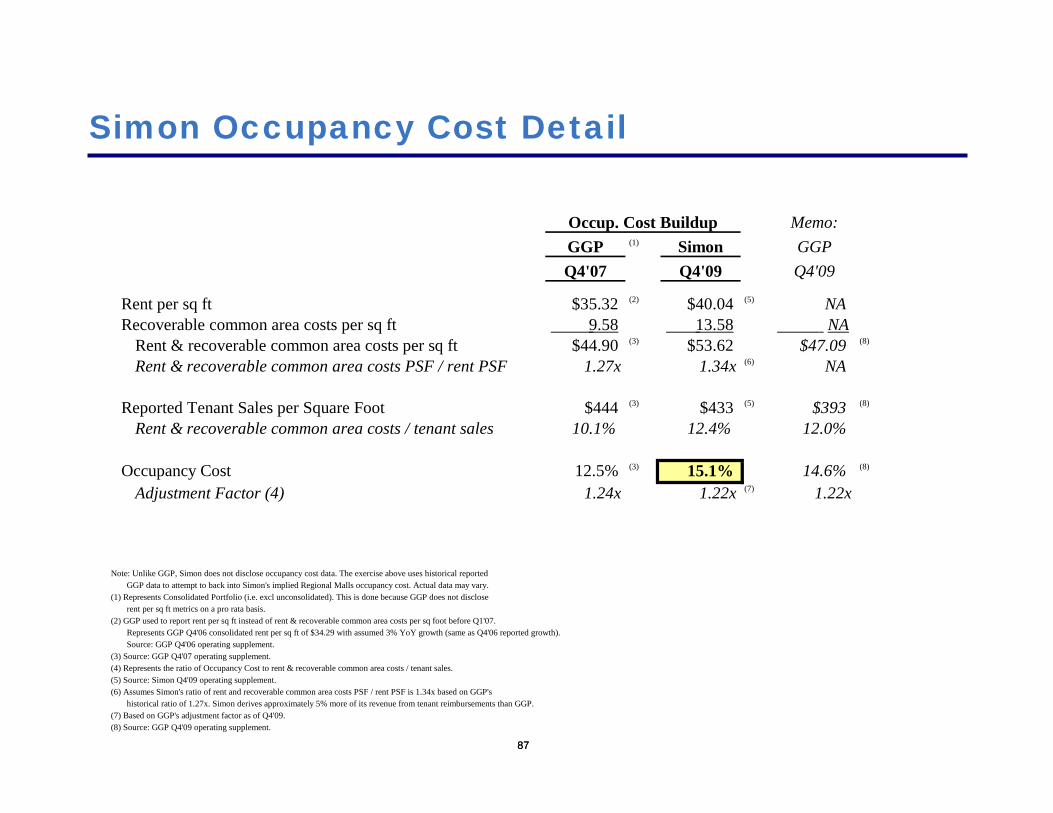
Simon Occupancy Cost Detail
Occup. Cost Buildup Memo:GGP (1) Simon GGPQ4'07 Q4'09 Q4'09
Rent per sq ft $35.32 (2) $40.04 (5) NARecoverable common area costs per sq ft 9.58 13.58 NA
Rent & recoverable common area costs per sq ft $44.90 (3) $53.62 $47.09 (8)
Rent & recoverable common area costs PSF / rent PSF 1.27x 1.34x (6) NA
Reported Tenant Sales per Square Foot $444 (3) $433 (5) $393 (8)
Rent & recoverable common area costs / tenant sales 10.1% 12.4% 12.0%
Occupancy Cost 12.5% (3) 15.1% 14.6% (8)
Adjustment Factor (4) 1.24x 1.22x (7) 1.22x
Note: Unlike GGP, Simon does not disclose occupancy cost data. The exercise above uses historical reportedGGP data to attempt to back into Simon's implied Regional Malls occupancy cost. Actual data may vary.
(1) Represents Consolidated Portfolio (i.e. excl unconsolidated). This is done because GGP does not discloserent per sq ft metrics on a pro rata basis.
(2) GGP used to report rent per sq ft instead of rent & recoverable common area costs per sq foot before Q1'07.Represents GGP Q4'06 consolidated rent per sq ft of $34.29 with assumed 3% YoY growth (same as Q4'06 reported growth).Source: GGP Q4'06 operating supplement.
(3) Source: GGP Q4'07 operating supplement.(4) Represents the ratio of Occupancy Cost to rent & recoverable common area costs / tenant sales.(5) Source: Simon Q4'09 operating supplement.(6) Assumes Simon's ratio of rent and recoverable common area costs PSF / rent PSF is 1.34x based on GGP's
historical ratio of 1.27x. Simon derives approximately 5% more of its revenue from tenant reimbursements than GGP. (7) Based on GGP's adjustment factor as of Q4'09.(8) Source: GGP Q4'09 operating supplement.
8888
GGO Detail – Victoria Ward Comp
Related Documents


