© Generali November 6, 2014 9M 2014 Results GENERALI GROUP 9M 2014 Results Please note that prior year’s figures have been restated throughout the whole presentation to reflect the new perimeter of th e Group. Net income, Shareholders’ Equity, Solvency I, Life Value KPIs are not adjusted for disposed entities. The like for like change of written premiums, life net inflows, APE and NBV is on equivalent terms (on equivalent exchange rates and consolidation area).

Generali Group 9M Results 2014
Jul 13, 2015
Welcome message from author
This document is posted to help you gain knowledge. Please leave a comment to let me know what you think about it! Share it to your friends and learn new things together.
Transcript
© Generali
November 6, 2014 9M 2014 Results
GENERALI GROUP 9M 2014 Results
Please note that prior year’s figures have been restated throughout the whole presentation to reflect the new perimeter of the Group.
Net income, Shareholders’ Equity, Solvency I, Life Value KPIs are not adjusted for disposed entities.
The like for like change of written premiums, life net inflows, APE and NBV is on equivalent terms (on equivalent exchange rates and consolidation area).
© Generali
November 6, 2014 9M 2014 Results
Agenda
2
- Profit & Loss and Balance Sheet Page 3
- Business review Page 9
- Backup Page 24
© Generali
November 6, 2014 9M 2014 Results
Agenda
I. Profit & Loss and Balance Sheet
3
© Generali
November 6, 2014 9M 2014 Results
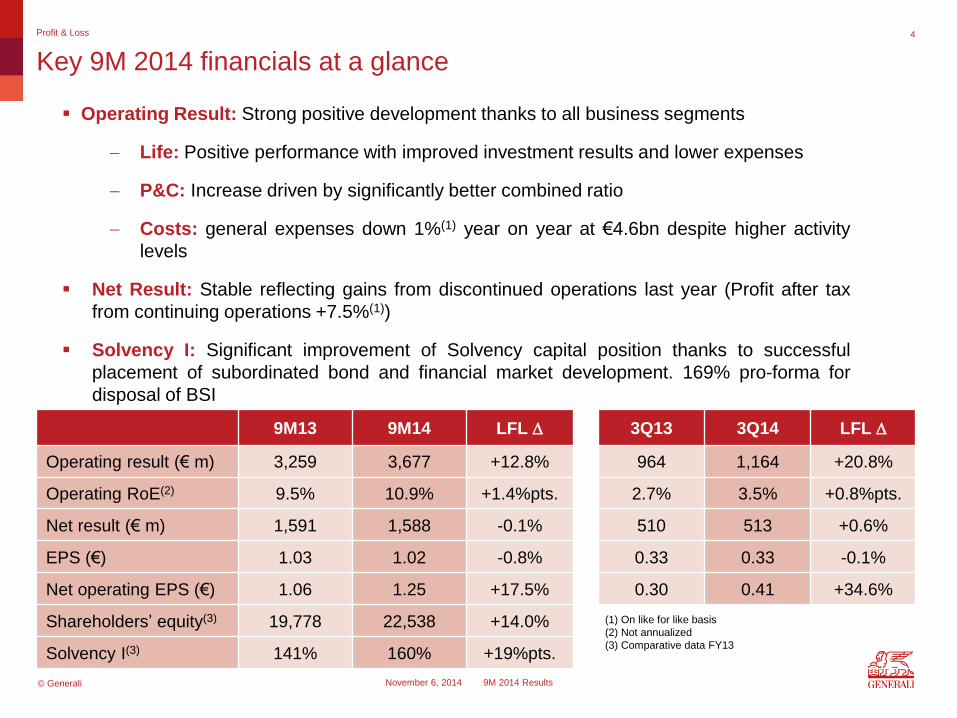
Operating Result: Strong positive development thanks to all business segments
Life: Positive performance with improved investment results and lower expenses
P&C: Increase driven by significantly better combined ratio
Costs: general expenses down 1%(1) year on year at €4.6bn despite higher activity
levels
Net Result: Stable reflecting gains from discontinued operations last year (Profit after tax
from continuing operations +7.5%(1))
Solvency I: Significant improvement of Solvency capital position thanks to successful
placement of subordinated bond and financial market development. 169% pro-forma for
disposal of BSI
4
Key 9M 2014 financials at a glance
Profit & Loss
9M13 9M14 LFL D 3Q13 3Q14 LFL D
Operating result (€ m) 3,259 3,677 +12.8% 964 1,164 +20.8%
Operating RoE(2) 9.5% 10.9% +1.4%pts. 2.7% 3.5% +0.8%pts.
Net result (€ m) 1,591 1,588 -0.1% 510 513 +0.6%
EPS (€) 1.03 1.02 -0.8% 0.33 0.33 -0.1%
Net operating EPS (€) 1.06 1.25 +17.5% 0.30 0.41 +34.6%
Shareholders’ equity(3) 19,778 22,538 +14.0%
Solvency I(3) 141% 160% +19%pts.
(1) On like for like basis
(2) Not annualized
(3) Comparative data FY13
© Generali
November 6, 2014 9M 2014 Results
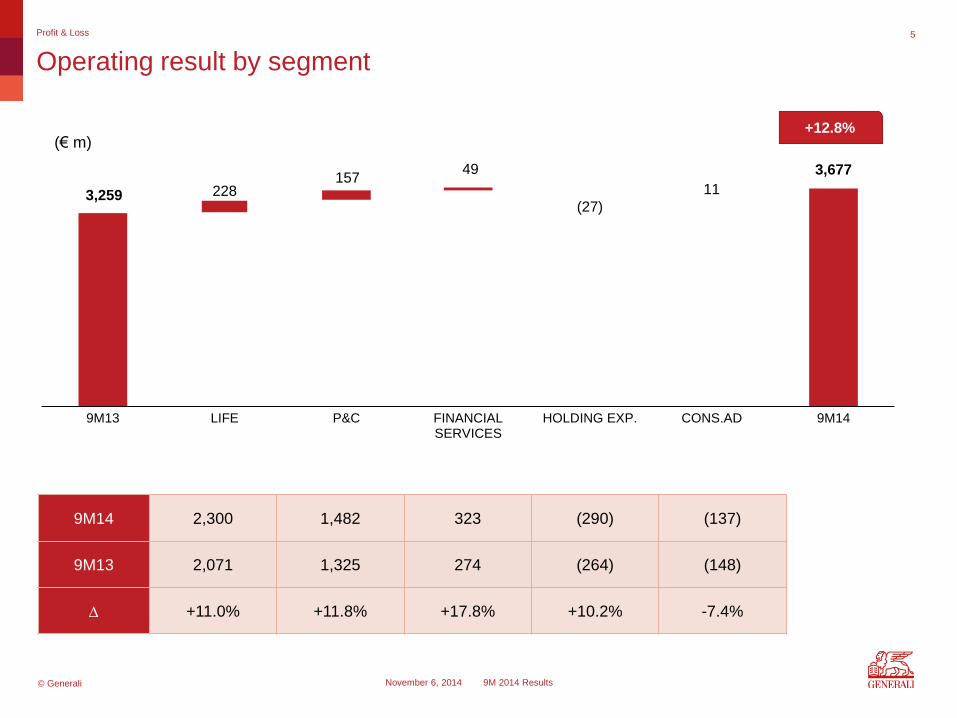
3,259 228 157
49
11
3,677
(27)
9M13 LIFE P&C FINANCIALSERVICES
HOLDING EXP. CONS.AD 9M14
5
Operating result by segment
Profit & Loss
(€ m) +12.8%
9M14 2,300 1,482 323 (290) (137)
9M13 2,071 1,325 274 (264) (148)
D +11.0% +11.8% +17.8% +10.2% -7.4%
© Generali
November 6, 2014 9M 2014 Results
6
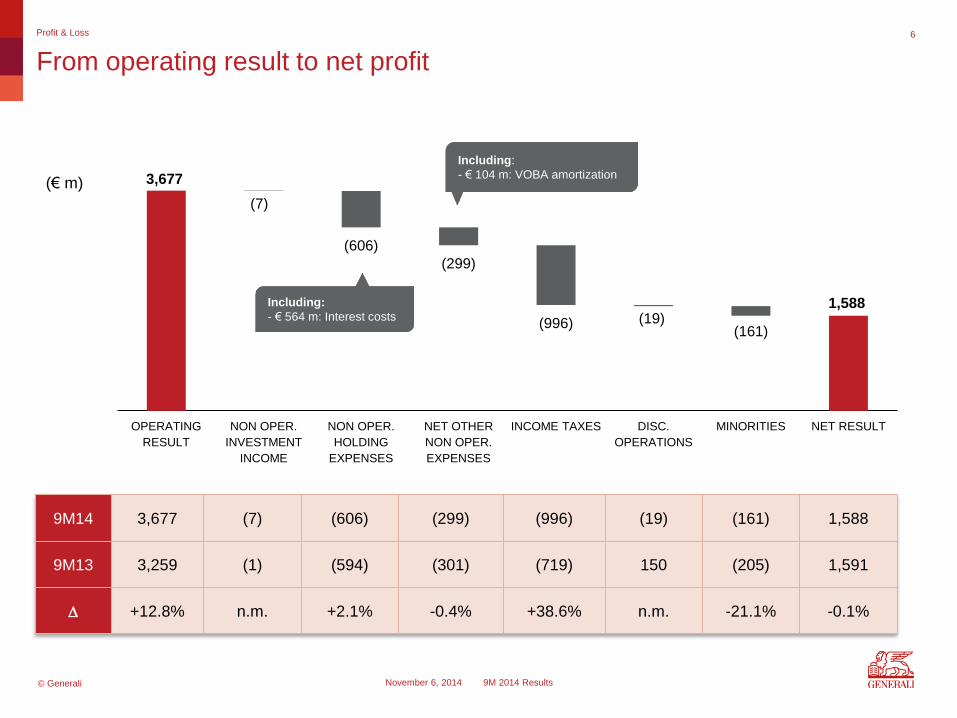
From operating result to net profit
Profit & Loss
9M14 3,677 (7) (606) (299) (996) (19) (161) 1,588
9M13 3,259 (1) (594) (301) (719) 150 (205) 1,591
D +12.8% n.m. +2.1% -0.4% +38.6% n.m. -21.1% -0.1%
3,677
(7)
(606)
(299)
(996) (19) (161)
1,588
OPERATING
RESULT
NON OPER.
INVESTMENT
INCOME
NON OPER.
HOLDING
EXPENSES
NET OTHER
NON OPER.
EXPENSES
INCOME TAXES DISC.
OPERATIONS
MINORITIES NET RESULT
(€ m)
Including:
- € 564 m: Interest costs
Including:
- € 104 m: VOBA amortization
© Generali
November 6, 2014 9M 2014 Results
7
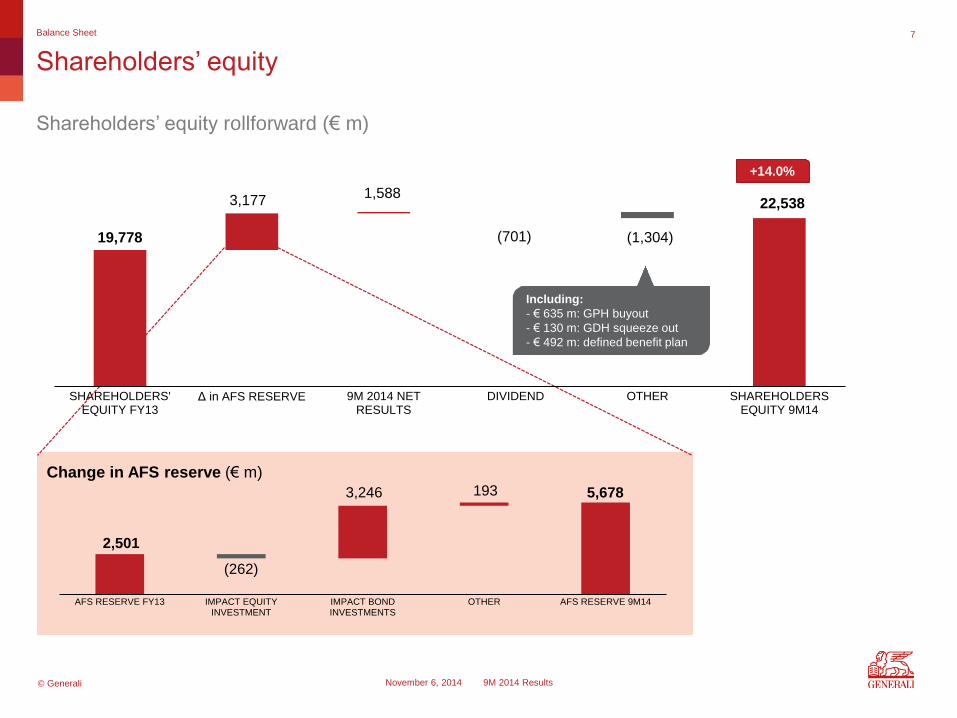
Shareholders’ equity
Balance Sheet
Change in AFS reserve (€ m)
Shareholders’ equity rollforward (€ m)
1,588
(701) (1,304) 19,778
3,177 22,538
SHAREHOLDERS'EQUITY FY13
Δ in AFS RESERVE 9M 2014 NETRESULTS
DIVIDEND OTHER SHAREHOLDERSEQUITY 9M14
2,501
3,246 193 5,678
(262)
AFS RESERVE FY13 IMPACT EQUITYINVESTMENT
IMPACT BONDINVESTMENTS
OTHER AFS RESERVE 9M14
+14.0%
Including:
- € 635 m: GPH buyout
- € 130 m: GDH squeeze out
- € 492 m: defined benefit plan
© Generali
November 6, 2014 9M 2014 Results
8
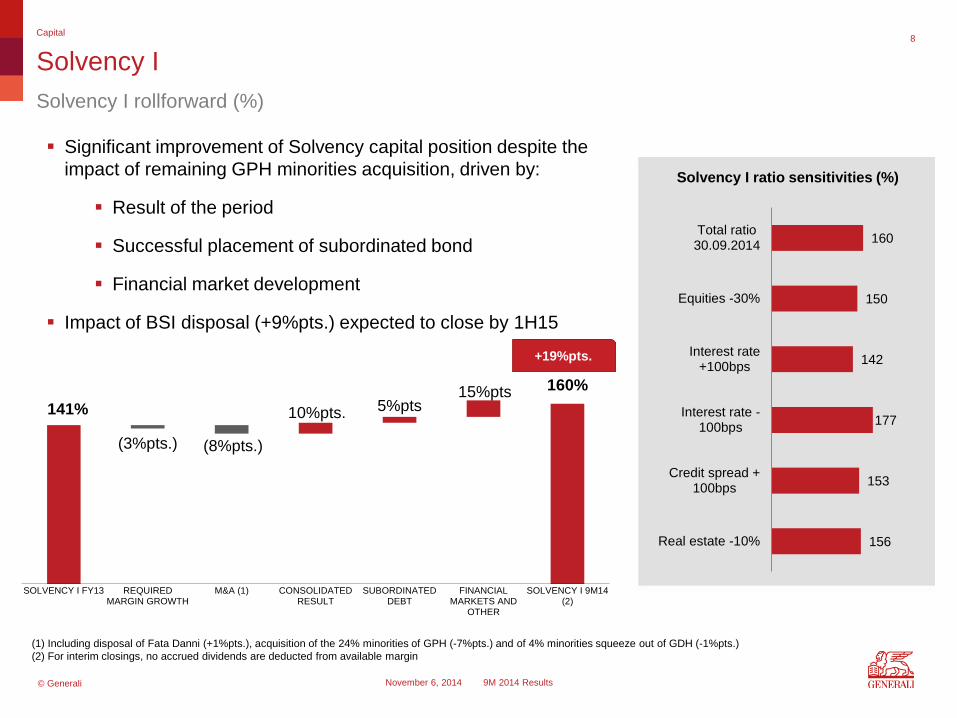
Solvency I
Capital
+19%pts.
156
153
177
142
150
160
Real estate -10%
Credit spread +100bps
Interest rate -100bps
Interest rate+100bps
Equities -30%
Total ratio30.09.2014
Solvency I ratio sensitivities (%)
Solvency I rollforward (%)
141% 10%pts. 5%pts 15%pts 160%
(3%pts.) (8%pts.)
SOLVENCY I FY13 REQUIREDMARGIN GROWTH
M&A (1) CONSOLIDATEDRESULT
SUBORDINATEDDEBT
FINANCIALMARKETS AND
OTHER
SOLVENCY I 9M14(2)
(1) Including disposal of Fata Danni (+1%pts.), acquisition of the 24% minorities of GPH (-7%pts.) and of 4% minorities squeeze out of GDH (-1%pts.)
(2) For interim closings, no accrued dividends are deducted from available margin
Significant improvement of Solvency capital position despite the
impact of remaining GPH minorities acquisition, driven by:
Result of the period
Successful placement of subordinated bond
Financial market development
Impact of BSI disposal (+9%pts.) expected to close by 1H15

© Generali
November 6, 2014 9M 2014 Results
Agenda
II. Business review
9
© Generali
November 6, 2014 9M 2014 Results
10
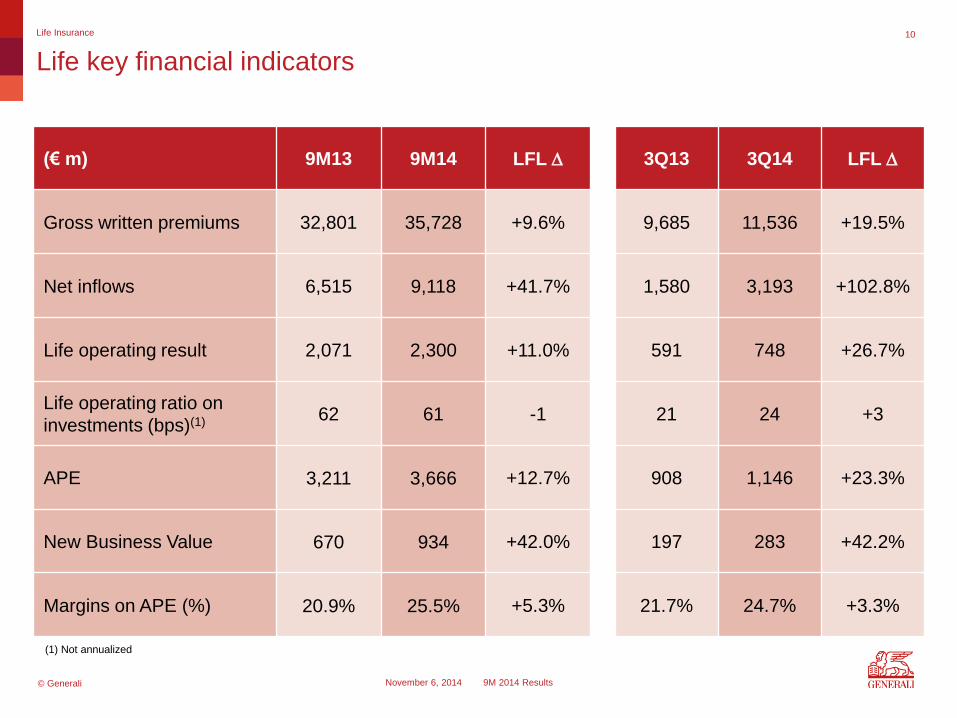
Life key financial indicators
Life Insurance
(€ m) 9M13 9M14 LFL D 3Q13 3Q14 LFL D
Gross written premiums 32,801 35,728 +9.6% 9,685 11,536 +19.5%
Net inflows 6,515 9,118 +41.7% 1,580 3,193 +102.8%
Life operating result 2,071 2,300 +11.0% 591 748 +26.7%
Life operating ratio on
investments (bps)(1) 62 61 -1 21 24 +3
APE 3,211 3,666 +12.7% 908 1,146 +23.3%
New Business Value 670 934 +42.0% 197 283 +42.2%
Margins on APE (%) 20.9% 25.5% +5.3% 21.7% 24.7% +3.3%
(1) Not annualized
© Generali
November 6, 2014 9M 2014 Results
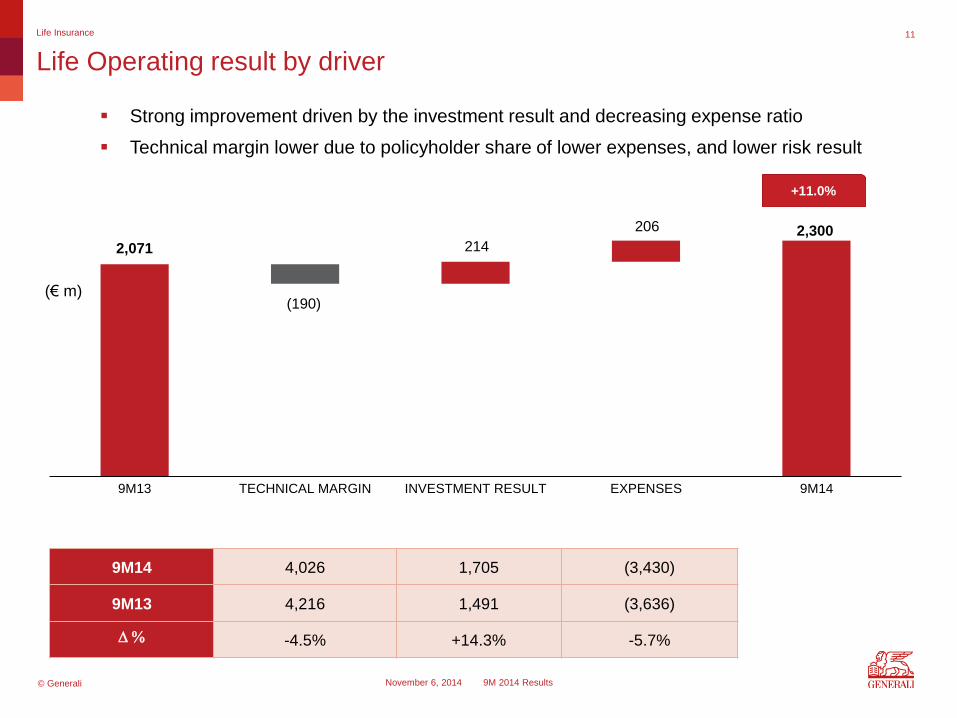
2,071 214
206 2,300
(190)
9M13 TECHNICAL MARGIN INVESTMENT RESULT EXPENSES 9M14
11
Life Operating result by driver
Life Insurance
9M14 4,026 1,705 (3,430)
9M13 4,216 1,491 (3,636)
D % -4.5% +14.3% -5.7%
Strong improvement driven by the investment result and decreasing expense ratio
Technical margin lower due to policyholder share of lower expenses, and lower risk result
(€ m)
+11.0%
© Generali
November 6, 2014 9M 2014 Results
12
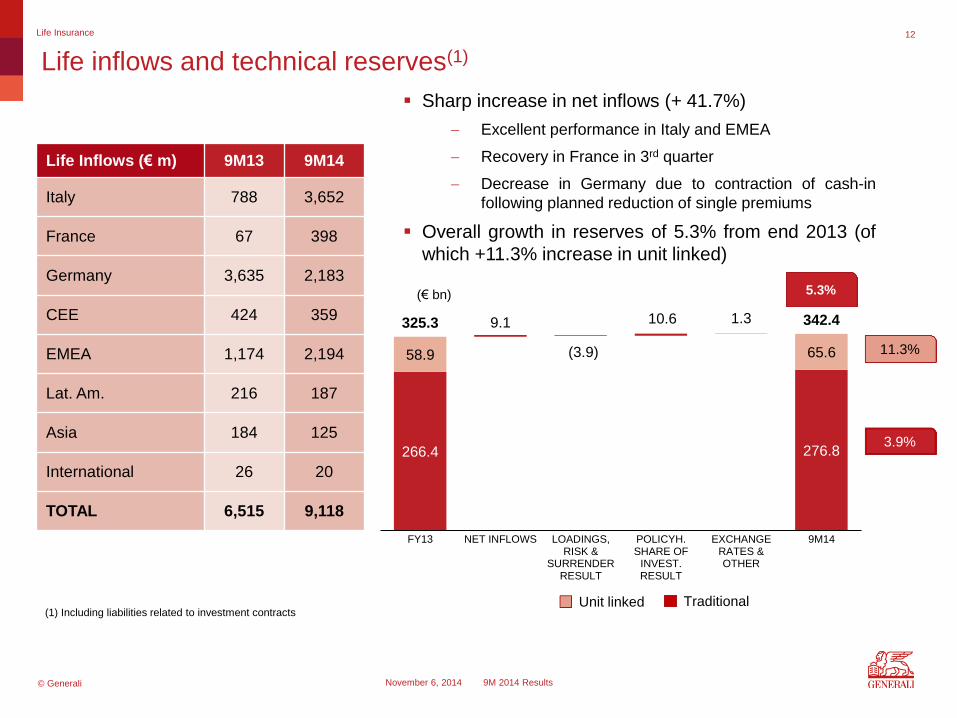
Life inflows and technical reserves(1)
Life Insurance
(1) Including liabilities related to investment contracts
Life Inflows (€ m) 9M13 9M14
Italy 788 3,652
France 67 398
Germany 3,635 2,183
CEE 424 359
EMEA 1,174 2,194
Lat. Am. 216 187
Asia 184 125
International 26 20
TOTAL 6,515 9,118
5.3%
11.3%
3.9%
Unit linked Traditional
(€ bn)
266.4
9.1 10.6
276.8
58.9 65.6
325.3 342.4
(3.9)
1.3
FY13 NET INFLOWS LOADINGS,RISK &
SURRENDERRESULT
POLICYH.SHARE OF
INVEST.RESULT
EXCHANGERATES &OTHER
9M14
Sharp increase in net inflows (+ 41.7%)
Excellent performance in Italy and EMEA
Recovery in France in 3rd quarter
Decrease in Germany due to contraction of cash-in
following planned reduction of single premiums
Overall growth in reserves of 5.3% from end 2013 (of
which +11.3% increase in unit linked)
© Generali
November 6, 2014 9M 2014 Results
13
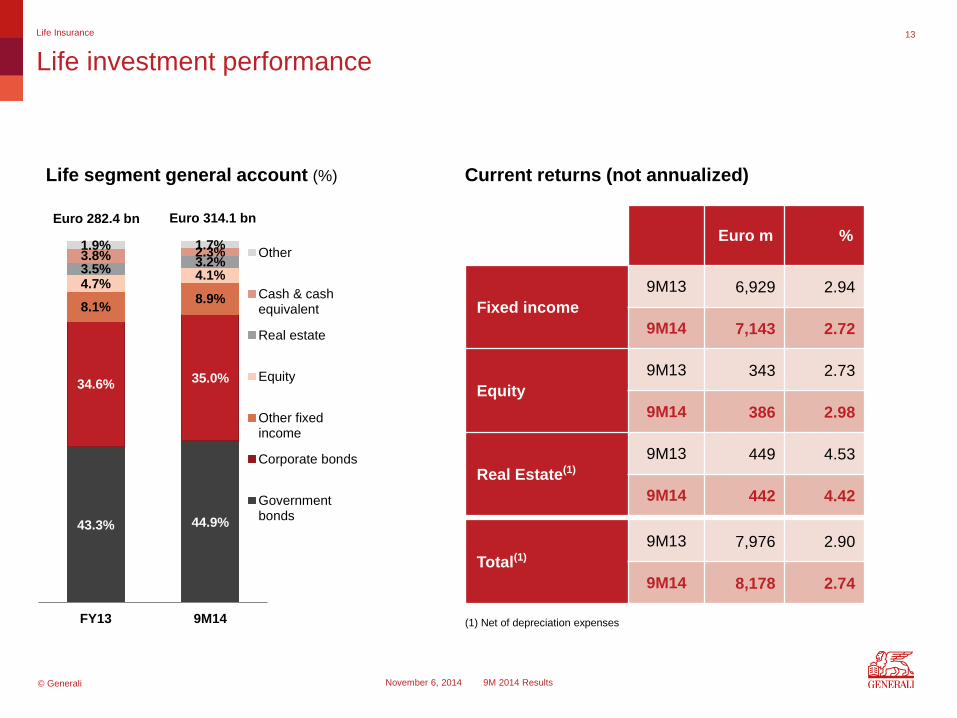
Life investment performance
Life Insurance
Life segment general account (%)
Euro 282.4 bn Euro 314.1 bn
(1) Net of depreciation expenses
43.3% 44.9%
34.6% 35.0%
8.1% 8.9%
4.7% 4.1%
3.5% 3.2%
3.8% 2.3% 1.9% 1.7%
FY13 9M14
Other
Cash & cashequivalent
Real estate
Equity
Other fixedincome
Corporate bonds
Governmentbonds
Euro m %
Fixed income
9M13 6,929 2.94
9M14 7,143 2.72
Equity
9M13 343 2.73
9M14 386 2.98
Real Estate(1)
9M13 449 4.53
9M14 442 4.42
Total(1)
9M13 7,976 2.90
9M14 8,178 2.74
Current returns (not annualized)
© Generali
November 6, 2014 9M 2014 Results
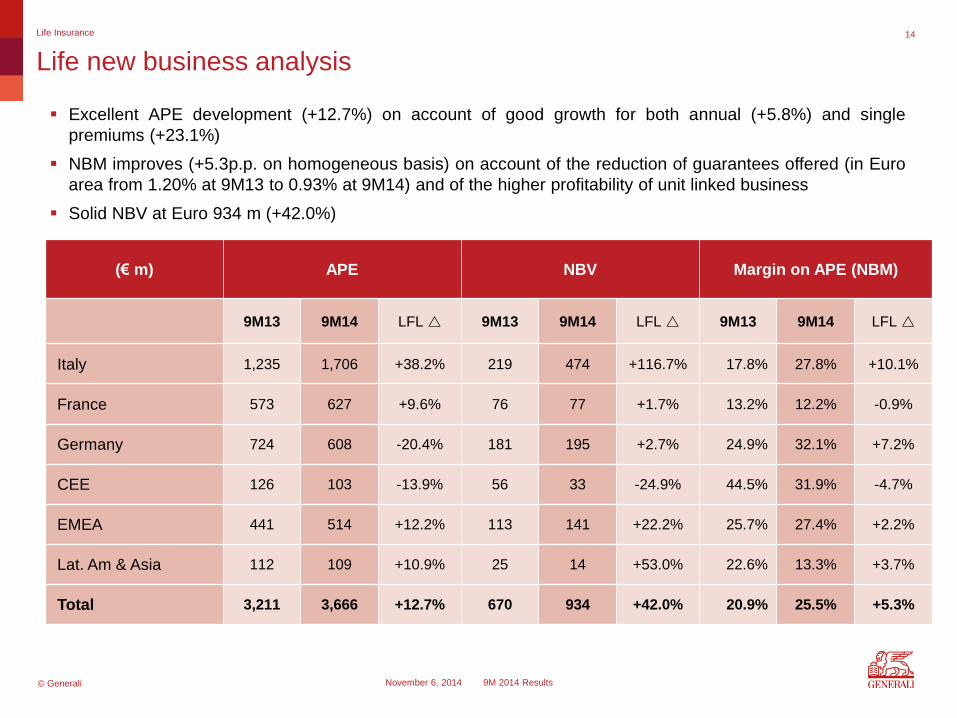
Excellent APE development (+12.7%) on account of good growth for both annual (+5.8%) and single
premiums (+23.1%)
NBM improves (+5.3p.p. on homogeneous basis) on account of the reduction of guarantees offered (in Euro
area from 1.20% at 9M13 to 0.93% at 9M14) and of the higher profitability of unit linked business
Solid NBV at Euro 934 m (+42.0%)
14
Life new business analysis
Life Insurance
(€ m) APE NBV Margin on APE (NBM)
9M13 9M14 LFL r 9M13 9M14 LFL r 9M13 9M14 LFL r
Italy 1,235 1,706 +38.2% 219 474 +116.7% 17.8% 27.8% +10.1%
France 573 627 +9.6% 76 77 +1.7% 13.2% 12.2% -0.9%
Germany 724 608 -20.4% 181 195 +2.7% 24.9% 32.1% +7.2%
CEE 126 103 -13.9% 56 33 -24.9% 44.5% 31.9% -4.7%
EMEA 441 514 +12.2% 113 141 +22.2% 25.7% 27.4% +2.2%
Lat. Am & Asia 112 109 +10.9% 25 14 +53.0% 22.6% 13.3% +3.7%
Total 3,211 3,666 +12.7% 670 934 +42.0% 20.9% 25.5% +5.3%
© Generali
November 6, 2014 9M 2014 Results
15
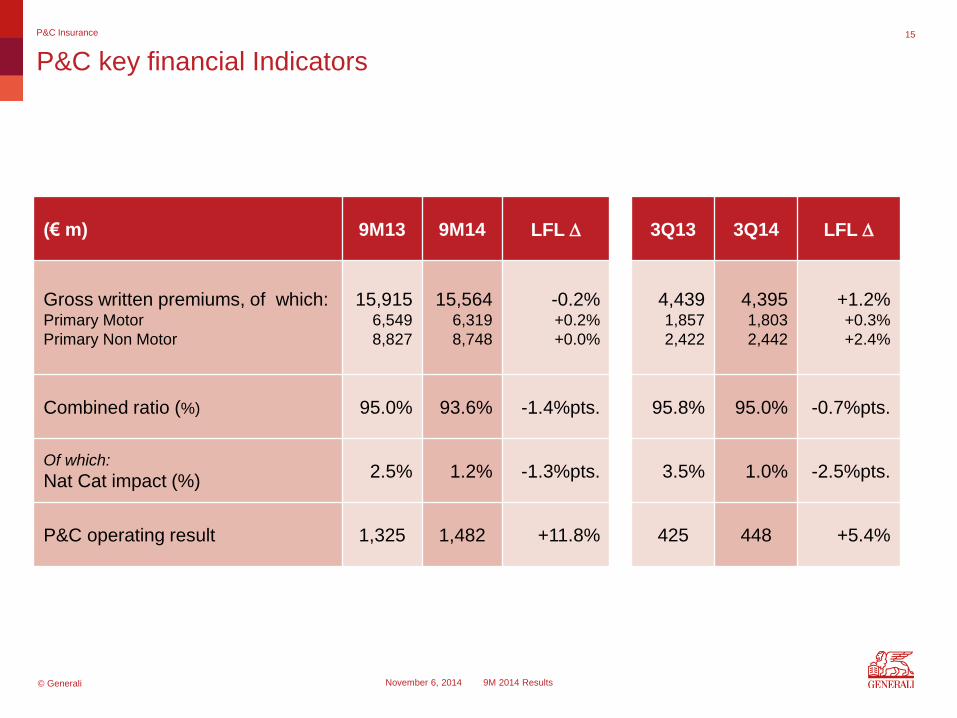
P&C key financial Indicators
P&C Insurance
(€ m) 9M13 9M14 LFL D 3Q13 3Q14 LFL D
Gross written premiums, of which: Primary Motor
Primary Non Motor
15,915 6,549
8,827
15,564 6,319
8,748
-0.2% +0.2%
+0.0%
4,439 1,857
2,422
4,395 1,803
2,442
+1.2% +0.3%
+2.4%
Combined ratio (%) 95.0% 93.6% -1.4%pts. 95.8% 95.0% -0.7%pts.
Of which:
Nat Cat impact (%) 2.5% 1.2% -1.3%pts. 3.5% 1.0% -2.5%pts.
P&C operating result 1,325 1,482 +11.8% 425 448 +5.4%
© Generali
November 6, 2014 9M 2014 Results
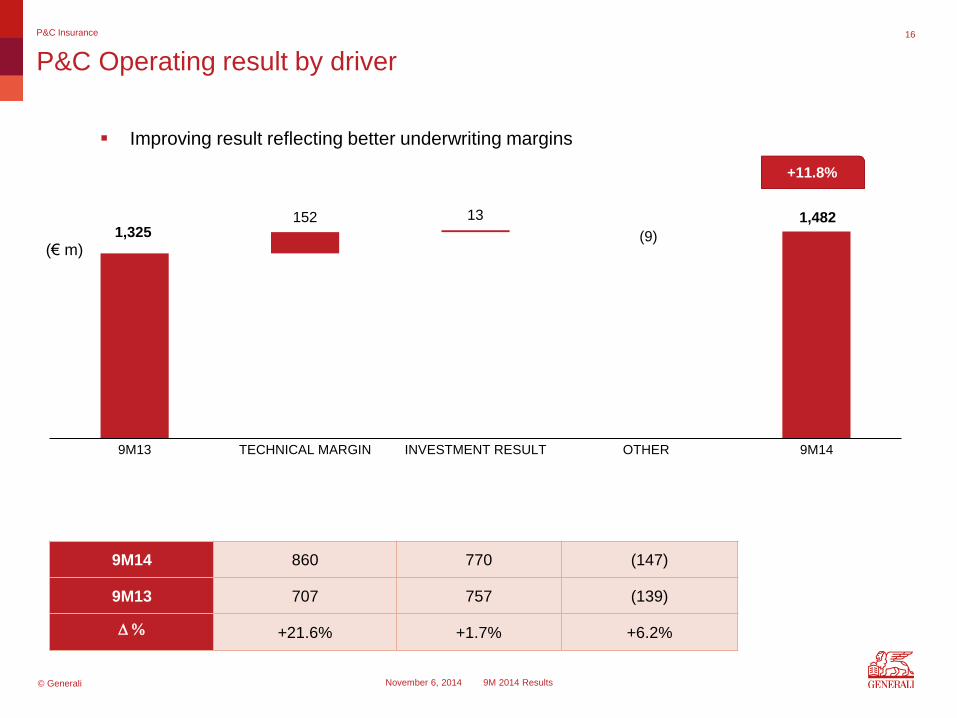
1,325 152 13
(9)
1,482
9M13 TECHNICAL MARGIN INVESTMENT RESULT OTHER 9M14
16
P&C Operating result by driver
P&C Insurance
9M14 860 770 (147)
9M13 707 757 (139)
D % +21.6% +1.7% +6.2%
Improving result reflecting better underwriting margins
(€ m)
+11.8%
© Generali
November 6, 2014 9M 2014 Results
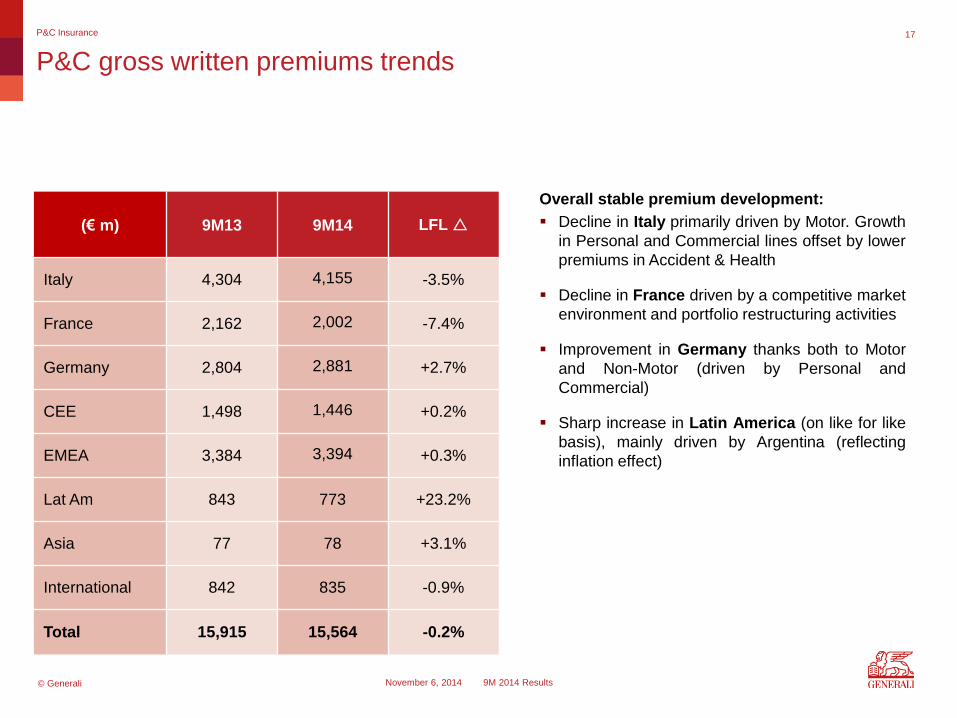
(€ m) 9M13 9M14 LFL r
Italy 4,304 4,155 -3.5%
France 2,162 2,002 -7.4%
Germany 2,804 2,881 +2.7%
CEE 1,498 1,446 +0.2%
EMEA 3,384 3,394 +0.3%
Lat Am 843 773 +23.2%
Asia 77 78 +3.1%
International 842 835 -0.9%
Total 15,915 15,564 -0.2%
17
P&C gross written premiums trends
P&C Insurance
Overall stable premium development:
Decline in Italy primarily driven by Motor. Growth
in Personal and Commercial lines offset by lower
premiums in Accident & Health
Decline in France driven by a competitive market
environment and portfolio restructuring activities
Improvement in Germany thanks both to Motor
and Non-Motor (driven by Personal and
Commercial)
Sharp increase in Latin America (on like for like
basis), mainly driven by Argentina (reflecting
inflation effect)
© Generali
November 6, 2014 9M 2014 Results
68.2
0.2 66.8
(0.3) (1.3)
9M13 Current year NAT CAT Prior years 9M14
68.2 66.8
26.8 26.8
(1.4) (0.1)
95.0 93.6
9M13 Δ Expense ratio Δ Loss ratio 9M14
20.9
(0.0)
21.0
5.9 5.8
26.8 26.8
9M13 Δ Admin Δ Acq. 9M14
(0.1)
18
Combined ratio analysis
P&C Insurance
Combined ratio (%)
Loss ratio Expense ratio
Expense ratio (%)
Δ%pts
- 0.1%pts.
9M14 69.6 1.2 -4.0 66.8
9M13 69.8 2.5 -4.2 68.2
Loss ratio (%)
- 1.4%pts.
- 1.4%pts.
Acquisition
costs
Administr.
costs
© Generali
November 6, 2014 9M 2014 Results
19
Combined ratio by country
P&C Insurance
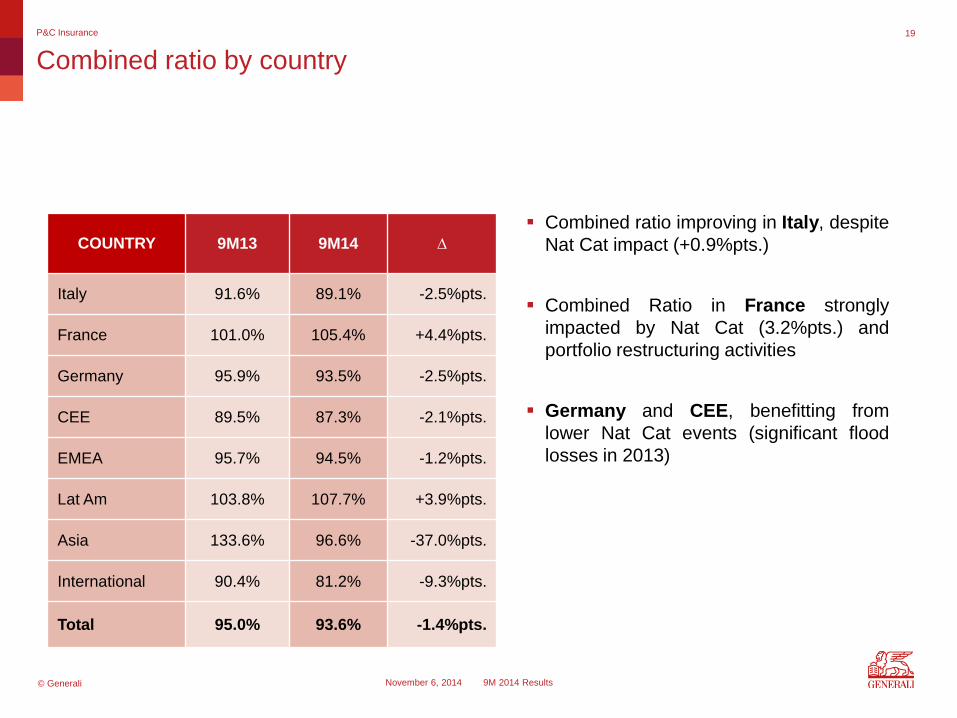
COUNTRY 9M13 9M14 ∆
Italy 91.6% 89.1% -2.5%pts.
France 101.0% 105.4% +4.4%pts.
Germany 95.9% 93.5% -2.5%pts.
CEE 89.5% 87.3% -2.1%pts.
EMEA 95.7% 94.5% -1.2%pts.
Lat Am 103.8% 107.7% +3.9%pts.
Asia 133.6% 96.6% -37.0%pts.
International 90.4% 81.2% -9.3%pts.
Total 95.0% 93.6% -1.4%pts.
Combined ratio improving in Italy, despite
Nat Cat impact (+0.9%pts.)
Combined Ratio in France strongly
impacted by Nat Cat (3.2%pts.) and
portfolio restructuring activities
Germany and CEE, benefitting from
lower Nat Cat events (significant flood
losses in 2013)
© Generali
November 6, 2014 9M 2014 Results
20
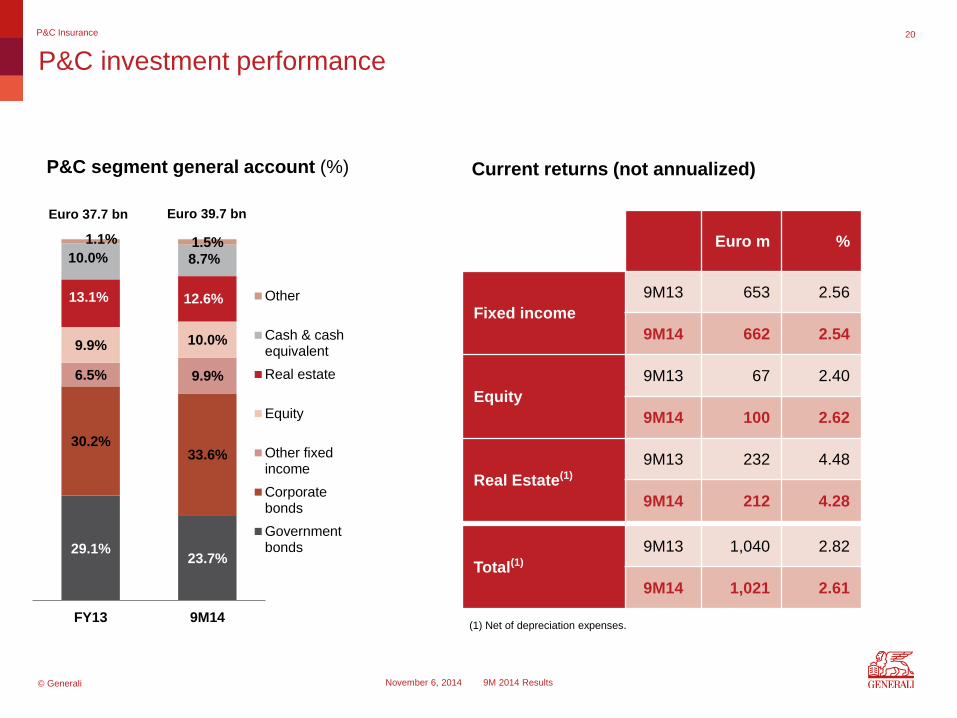
P&C investment performance
P&C Insurance
P&C segment general account (%)
Euro 37.7 bn Euro 39.7 bn
29.1% 23.7%
30.2% 33.6%
6.5% 9.9%
9.9% 10.0%
13.1% 12.6%
10.0% 8.7%
1.1% 1.5%
FY13 9M14
Other
Cash & cashequivalent
Real estate
Equity
Other fixedincome
Corporatebonds
Governmentbonds
(1) Net of depreciation expenses.
Euro m %
Fixed income
9M13 653 2.56
9M14 662 2.54
Equity
9M13 67 2.40
9M14 100 2.62
Real Estate(1)
9M13 232 4.48
9M14 212 4.28
Total(1)
9M13 1,040 2.82
9M14 1,021 2.61
Current returns (not annualized)
© Generali
November 6, 2014 9M 2014 Results
21
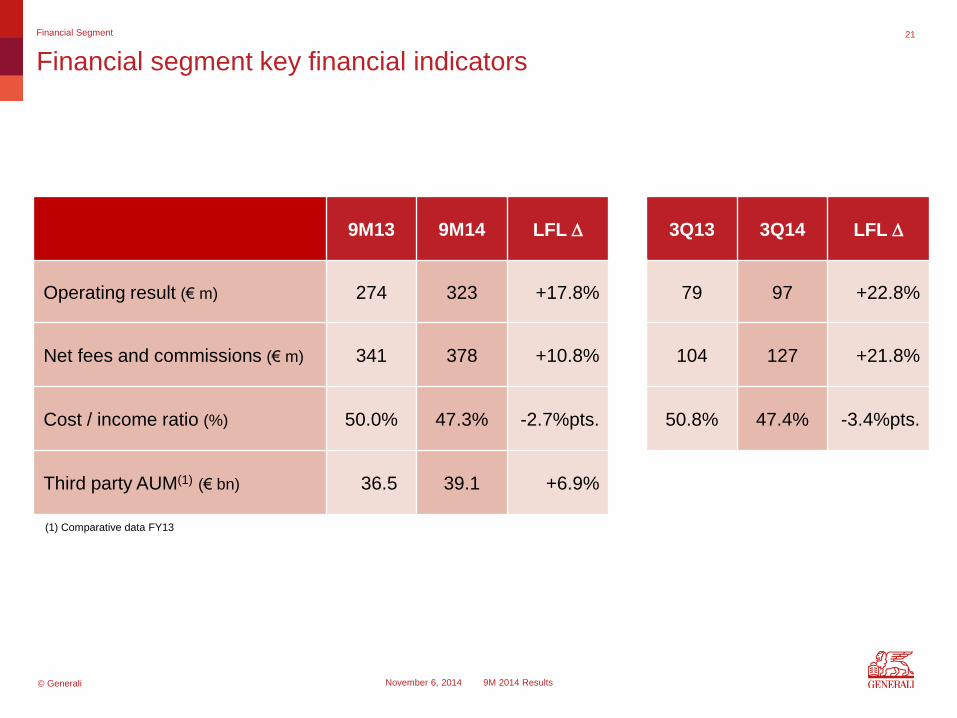
Financial segment key financial indicators
Financial Segment
(1) Comparative data FY13
9M13 9M14 LFL D 3Q13 3Q14 LFL D
Operating result (€ m) 274 323 +17.8% 79 97 +22.8%
Net fees and commissions (€ m) 341 378 +10.8% 104 127 +21.8%
Cost / income ratio (%) 50.0% 47.3% -2.7%pts. 50.8% 47.4% -3.4%pts.
Third party AUM(1) (€ bn) 36.5 39.1 +6.9%
© Generali
November 6, 2014 9M 2014 Results
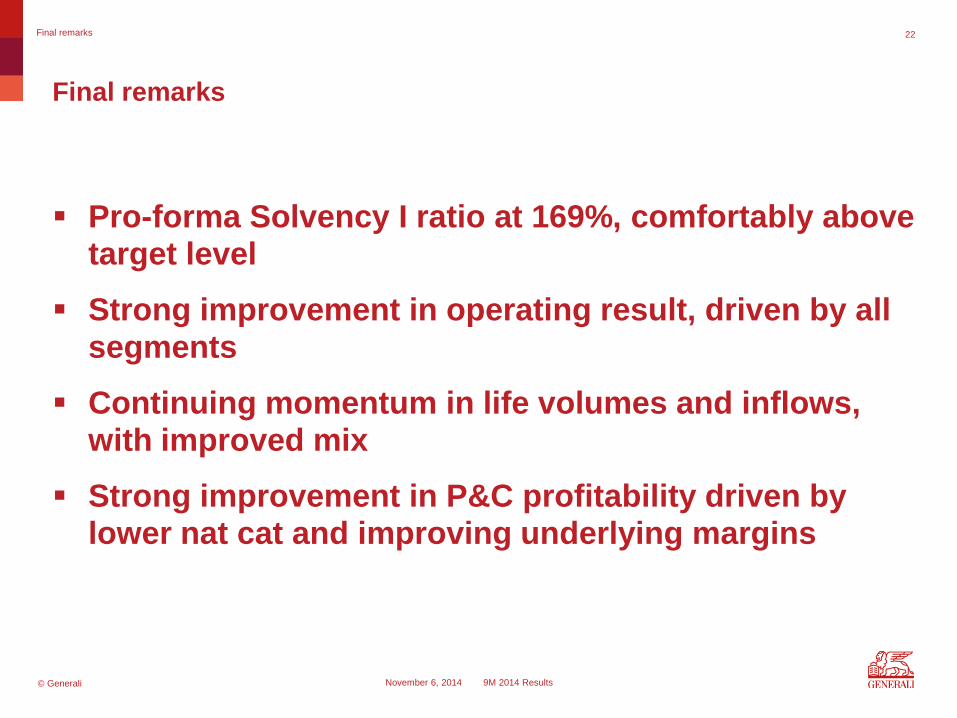
22 Final remarks
Pro-forma Solvency I ratio at 169%, comfortably above target level
Strong improvement in operating result, driven by all segments
Continuing momentum in life volumes and inflows, with improved mix
Strong improvement in P&C profitability driven by lower nat cat and improving underlying margins
Final remarks
© Generali
November 6, 2014 9M 2014 Results
23
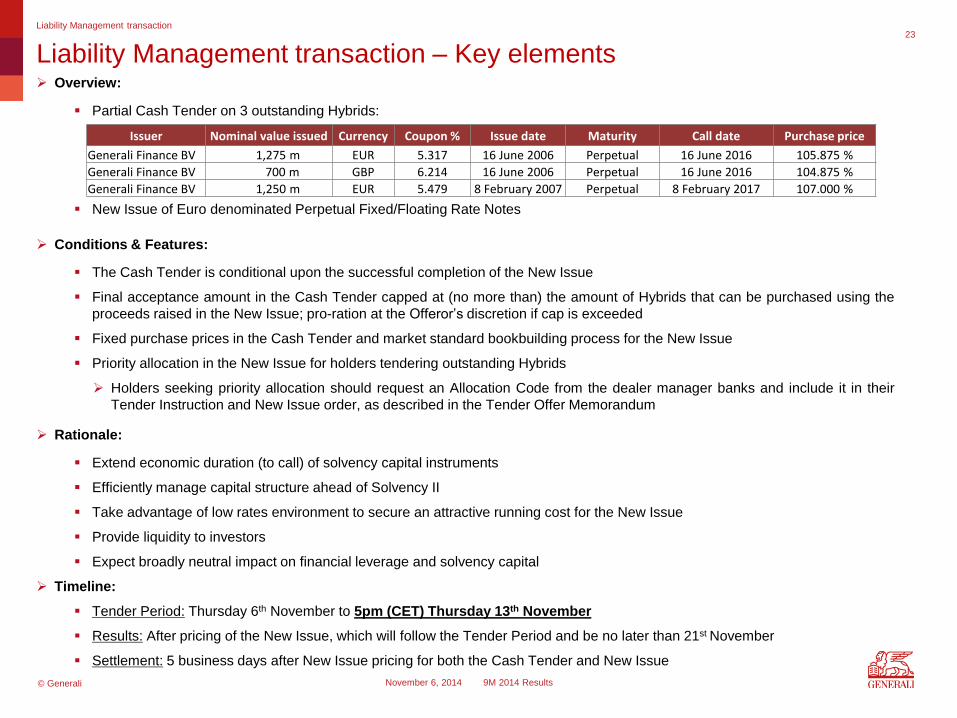
Overview:
Partial Cash Tender on 3 outstanding Hybrids:
New Issue of Euro denominated Perpetual Fixed/Floating Rate Notes
Conditions & Features:
The Cash Tender is conditional upon the successful completion of the New Issue
Final acceptance amount in the Cash Tender capped at (no more than) the amount of Hybrids that can be purchased using the
proceeds raised in the New Issue; pro-ration at the Offeror’s discretion if cap is exceeded
Fixed purchase prices in the Cash Tender and market standard bookbuilding process for the New Issue
Priority allocation in the New Issue for holders tendering outstanding Hybrids
Holders seeking priority allocation should request an Allocation Code from the dealer manager banks and include it in their
Tender Instruction and New Issue order, as described in the Tender Offer Memorandum
Rationale:
Extend economic duration (to call) of solvency capital instruments
Efficiently manage capital structure ahead of Solvency II
Take advantage of low rates environment to secure an attractive running cost for the New Issue
Provide liquidity to investors
Expect broadly neutral impact on financial leverage and solvency capital
Timeline:
Tender Period: Thursday 6th November to 5pm (CET) Thursday 13th November
Results: After pricing of the New Issue, which will follow the Tender Period and be no later than 21st November
Settlement: 5 business days after New Issue pricing for both the Cash Tender and New Issue
Liability Management transaction – Key elements
Issuer Nominal value issued Currency Coupon % Issue date Maturity Call date Purchase price
Generali Finance BV 1,275 m EUR 5.317 16 June 2006 Perpetual 16 June 2016 105.875 %
Generali Finance BV 700 m GBP 6.214 16 June 2006 Perpetual 16 June 2016 104.875 %
Generali Finance BV 1,250 m EUR 5.479 8 February 2007 Perpetual 8 February 2017 107.000 %
Liability Management transaction

© Generali
November 6, 2014 9M 2014 Results
Agenda
24
II. Backup
- Investments Page 25
- Financial debt Page 30

© Generali
November 6, 2014 9M 2014 Results
Agenda
25
II. Backup
- Investments Page 25
- Financial debt Page 30
© Generali
November 6, 2014 9M 2014 Results
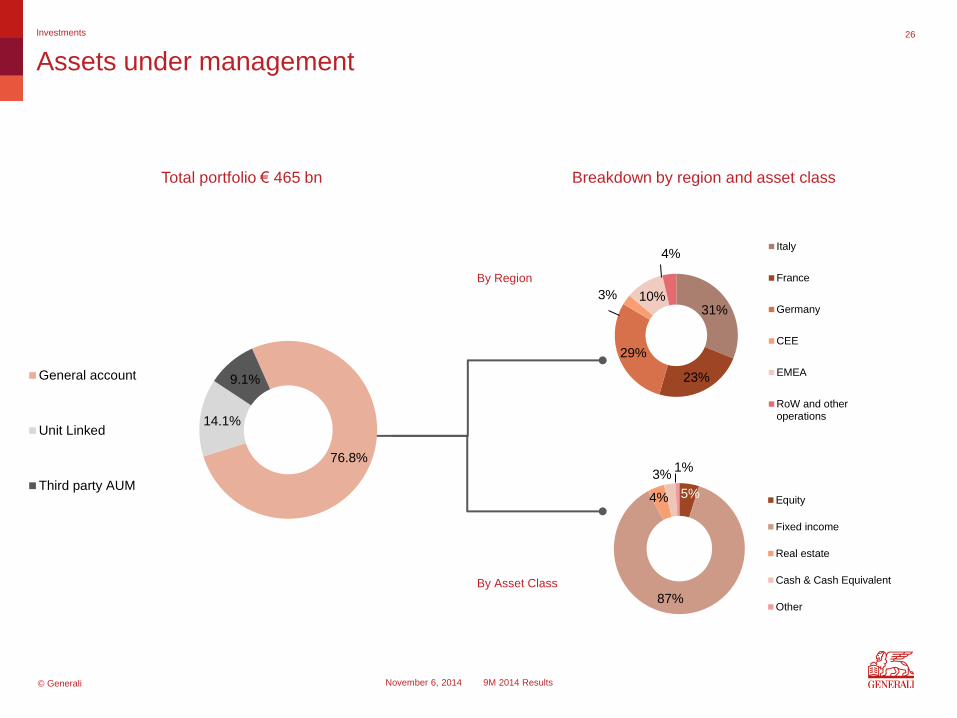
26
Assets under management
Investments
76.8%
14.1%
9.1% General account
Unit Linked
Third party AUM5%
87%
4%
3% 1%
Equity
Fixed income
Real estate
Cash & Cash Equivalent
Other
By Asset Class
By Region
Total portfolio € 465 bn Breakdown by region and asset class
31%
23%
29%
3% 10%
4% Italy
France
Germany
CEE
EMEA
RoW and otheroperations
© Generali
November 6, 2014 9M 2014 Results
14%
34%
4%
46%
2% 0%
Government € 155 bn (1)
71%
10%
10%
7%
1% 1%
Covered € 31 bn
4% 8%
37%
40%
10%
1%
Corporate € 93 bn
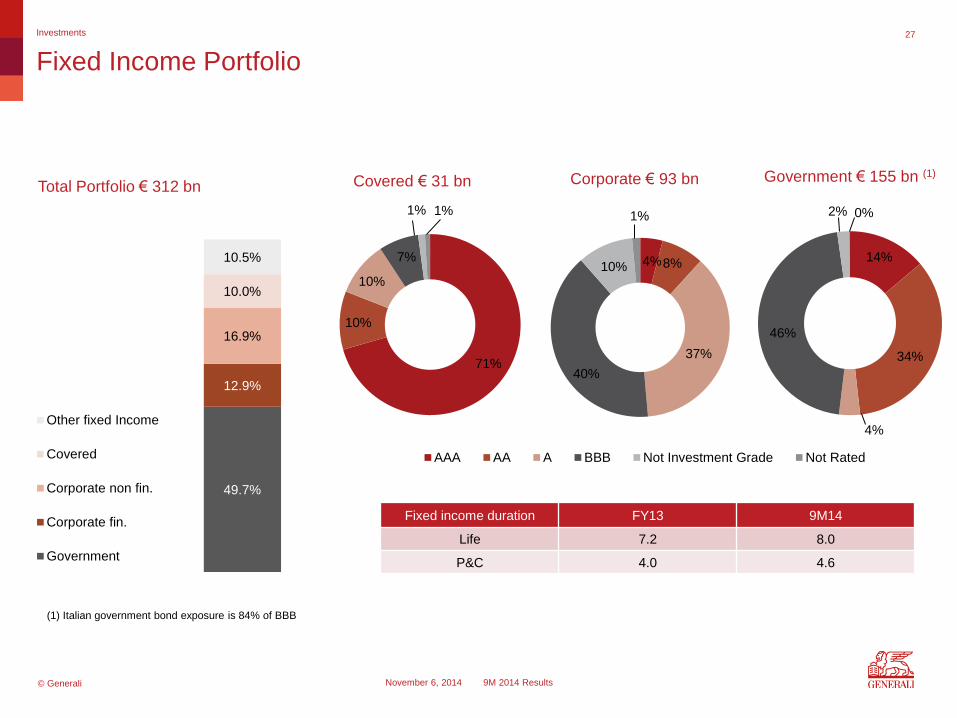
AAA AA A BBB Not Investment Grade Not Rated
Total Portfolio € 312 bn
27 Investments
Fixed Income Portfolio
(1) Italian government bond exposure is 84% of BBB
Fixed income duration FY13 9M14
Life 7.2 8.0
P&C 4.0 4.6
49.7%
12.9%
16.9%
10.0%
10.5%
Other fixed Income
Covered
Corporate non fin.
Corporate fin.
Government
© Generali
November 6, 2014 9M 2014 Results
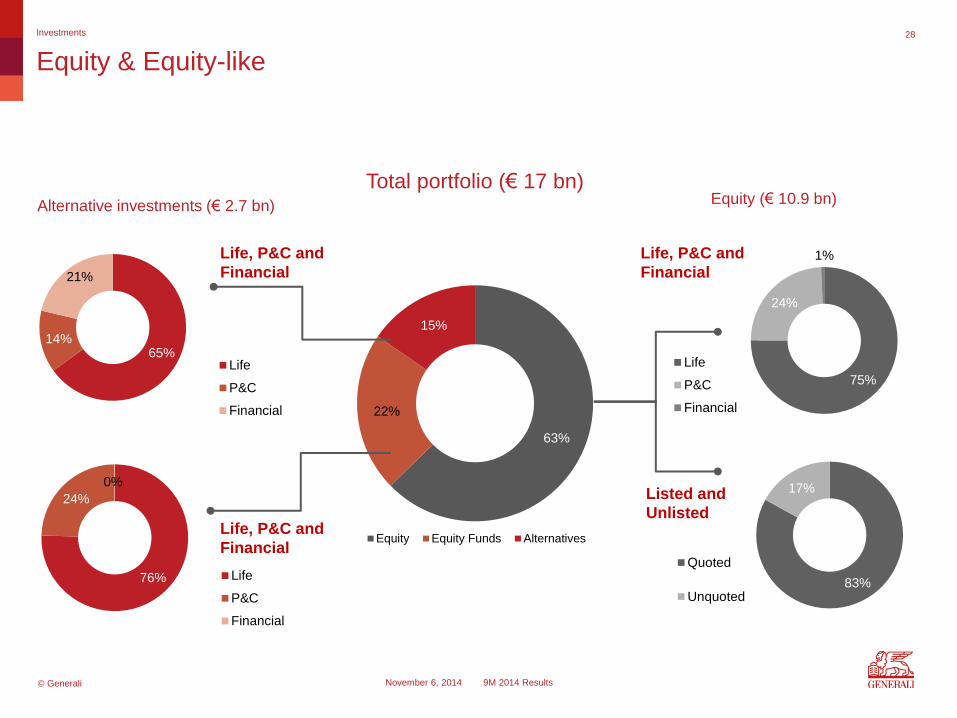
63%
22%
15%
Equity Equity Funds Alternatives
28 Investments
Equity & Equity-like
Life, P&C and
Financial
Total portfolio (€ 17 bn) Equity (€ 10.9 bn) Alternative investments (€ 2.7 bn)
Life, P&C and
Financial
Life, P&C and
Financial
Listed and
Unlisted
65% 14%
21%
Life
P&C
Financial
76%
24%
0%
Life
P&C
Financial
75%
24%
1%
Life
P&C
Financial
83%
17%
Quoted
Unquoted
© Generali
November 6, 2014 9M 2014 Results
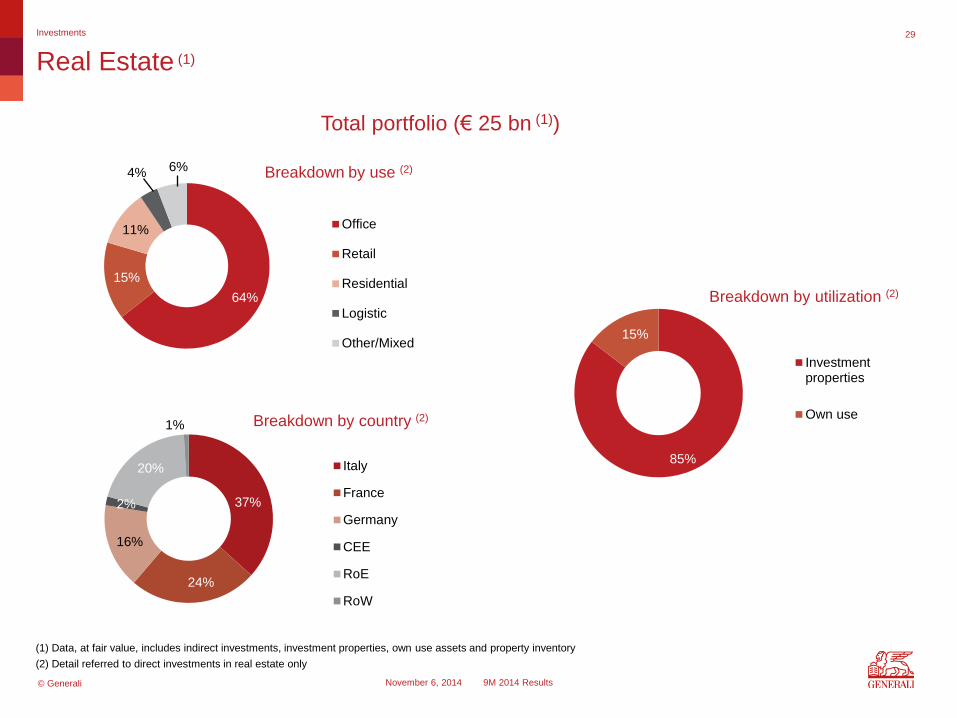
85%
15%
Breakdown by utilization (2)
Investmentproperties
Own use
64%
15%
11%
4% 6% Breakdown by use (2)
Office
Retail
Residential
Logistic
Other/Mixed
29 Investments
37%
24%
16%
2%
20%
1% Breakdown by country (2)
Italy
France
Germany
CEE
RoE
RoW
Real Estate (1)
(1) Data, at fair value, includes indirect investments, investment properties, own use assets and property inventory
(2) Detail referred to direct investments in real estate only
Total portfolio (€ 25 bn (1))

© Generali
November 6, 2014 9M 2014 Results
Agenda
30
II. Backup
- Investments Page 25
- Financial debt Page 30
© Generali
November 6, 2014 9M 2014 Results
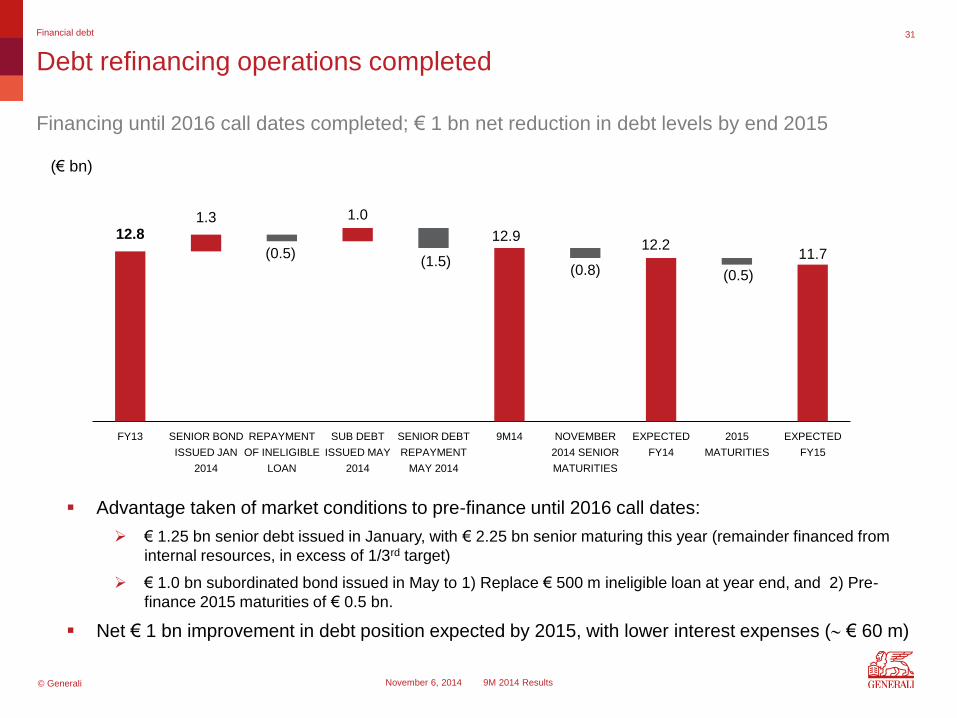
Debt refinancing operations completed
Financing until 2016 call dates completed; € 1 bn net reduction in debt levels by end 2015
12.8 1.3
(0.5)
1.0
(1.5)
12.9
(0.8)
12.2
(0.5)
11.7
FY13 SENIOR BOND
ISSUED JAN
2014
REPAYMENT
OF INELIGIBLE
LOAN
SUB DEBT
ISSUED MAY
2014
SENIOR DEBT
REPAYMENT
MAY 2014
9M14 NOVEMBER
2014 SENIOR
MATURITIES
EXPECTED
FY14
2015
MATURITIES
EXPECTED
FY15
(€ bn)
Advantage taken of market conditions to pre-finance until 2016 call dates:
€ 1.25 bn senior debt issued in January, with € 2.25 bn senior maturing this year (remainder financed from
internal resources, in excess of 1/3rd target)
€ 1.0 bn subordinated bond issued in May to 1) Replace € 500 m ineligible loan at year end, and 2) Pre-
finance 2015 maturities of € 0.5 bn.
Net € 1 bn improvement in debt position expected by 2015, with lower interest expenses ( € 60 m)
Financial debt 31
© Generali
November 6, 2014 9M 2014 Results
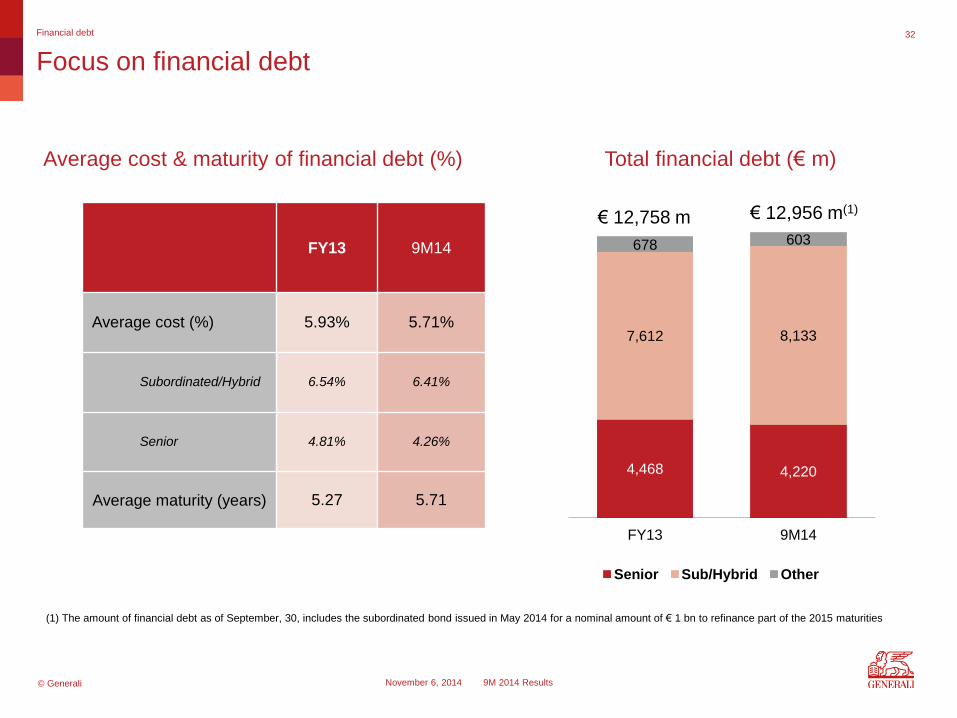
32
Focus on financial debt
Financial debt
Total financial debt (€ m) Average cost & maturity of financial debt (%)
4,468 4,220
7,612 8,133
678 603
FY13 9M14
Senior Sub/Hybrid Other
FY13 9M14
Average cost (%) 5.93% 5.71%
Subordinated/Hybrid 6.54% 6.41%
Senior 4.81% 4.26%
Average maturity (years) 5.27 5.71
€ 12,758 m € 12,956 m(1)
(1) The amount of financial debt as of September, 30, includes the subordinated bond issued in May 2014 for a nominal amount of € 1 bn to refinance part of the 2015 maturities
© Generali
November 6, 2014 9M 2014 Results
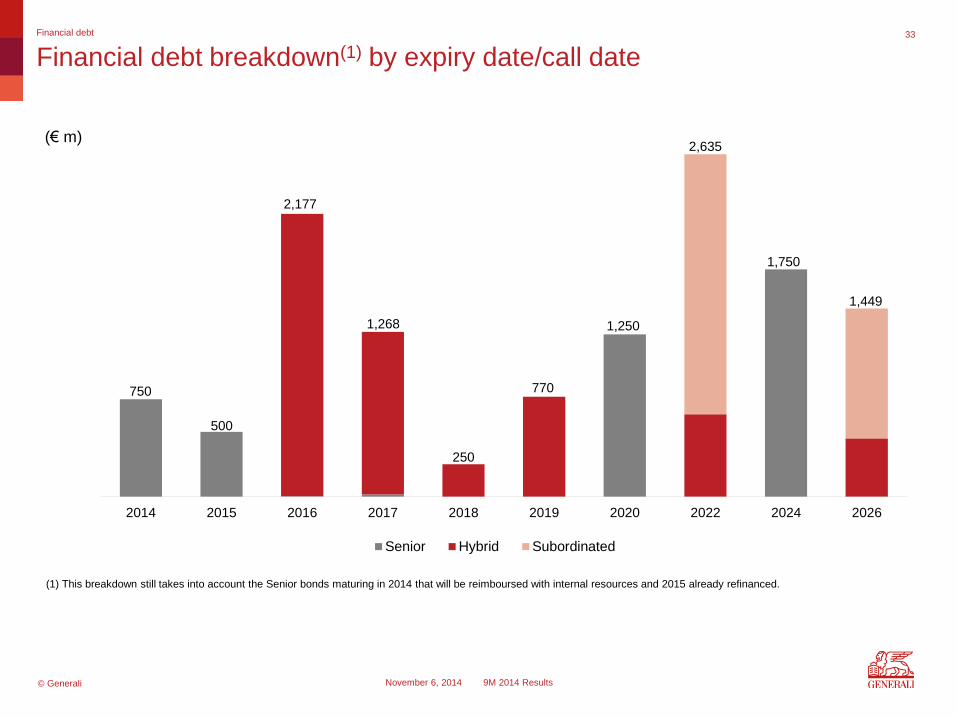
2014 2015 2016 2017 2018 2019 2020 2022 2024 2026
Senior Hybrid Subordinated
33
Financial debt breakdown(1) by expiry date/call date Financial debt
750
500
2,177
1,268
250
770
2,635
1,750
1,449
(1) This breakdown still takes into account the Senior bonds maturing in 2014 that will be reimboursed with internal resources and 2015 already refinanced.
1,250
(€ m)
© Generali
November 6, 2014 9M 2014 Results
Disclaimer
Certain of the statements contained herein are statements of future expectations and other forward-looking
statements.
These expectations are based on management's current views and assumptions and involve known and
unknown risks and uncertainties.
The user of such information should recognise that actual results, performance or events may differ
materially from such expectations because they relate to future events and circumstances which are
beyond our control including, among other things, general economic and sector conditions.
Neither Assicurazioni Generali S.p.A. nor any of its affiliates, directors, officers employees or agents owe
any duty of care towards any user of the information provided herein nor any obligation to update any
forward-looking information contained in this document.
The manager charged with preparing the company’s financial reports, Alberto Minali, declares, pursuant to
paragraph 2 of article 154-bis of the Consolidated Law on Financial Intermediation, that the accounting
information contained in this presentation corresponds to document results, books and accounts records.
© Generali
November 6, 2014 9M 2014 Results
35
Next events
19.11.2014
2014 Investor Day
12.03.2015
FY 2014 results reporting
30.04.2015
Annual General Meeting
14.05.2015
1Q 2015 results reporting
30.07.2015
1H 2015 results reporting
05.11.2015
9M 2015 results reporting
© Generali
November 6, 2014 9M 2014 Results
Team
Marta Porczynska
Team Assistant & Event Manager
+39 040 671402
Martina Vono
Team Assistant & Event Manager
+39 040 671548
Assicurazioni Generali
P.za Duca degli Abruzzi 2
34132 Trieste, Italy
Fax: +39 040 671338
e-mail: [email protected]
www.generali.com
Spencer Horgan
Head of Investor & Rating Agency Relations
+44 20 7265 6480
Stefano Burrino
Senior IR Manager
+39 040 671202
Emanuele Marciante
Senior IR Manager - Credit & Rating Agency Relations
+39 040 671347
Veronica Cherini
IR Manager
+39 040 671488
Rodolfo Svara
IR Manager
+39 040 671823
36

© Generali
November 6, 2014 9M 2014 Results
Thank you
37
© Generali
November 6, 2014 9M 2014 Results
GENERALI GROUP 9M 2014 Results
Related Documents