DELL INC (4331) 10-K Annual report pursuant to section 13 and 15(d) Filed on 03/13/2012 Filed Period 02/03/2012

Welcome message from author
This document is posted to help you gain knowledge. Please leave a comment to let me know what you think about it! Share it to your friends and learn new things together.
Transcript
DELL INC (4331)
10-K Annual report pursuant to section 13 and 15(d)
Filed on 03/13/2012Filed Period 02/03/2012
Table of Contents
UNITED STATESSECURITIES AND EXCHANGE COMMISSION
Washington, D.C. 20549
Form 10-K
(Mark One)
x ANNUAL REPORT PURSUANT TO SECTION 13 OR 15(d) OF THE SECURITIESEXCHANGE ACT OF 1934
For the fiscal year ended February 3, 2012
or
o TRANSITION REPORT PURSUANT TO SECTION 13 OR 15(d) OF THE SECURITIESEXCHANGE ACT OF 1934
For the transition period from to
Commission file number: 0-17017
Dell Inc.(Exact name of registrant as specified in its charter)
Delaware 74-2487834(State or other jurisdiction ofincorporation or organization)
(I.R.S. EmployerIdentification No.)
One Dell Way, Round Rock, Texas 78682(Address of principal executive offices) (Zip Code)
Registrant’s telephone number, including area code: 1-800-BUY-DELL
Securities registered pursuant to Section 12(b) of the Act:
Title of each class Name of each exchange on which registered
Common Stock, par value $.01 per share The NASDAQ Stock Market LLC(NASDAQ Global Select Market)
Securities registered pursuant to Section 12(g) of the Act: None
Indicate by check mark if the registrant is a well-known seasoned issuer, as defined in Rule 405 of the Securities Act. Yes o No R
Indicate by check mark if the registrant is not required to file reports pursuant to Section 13 or Section 15(d) of the Act. Yes o No R
Indicate by check mark whether the registrant (1) has filed all reports required to be filed by Section 13 or 15(d) of the Securities Exchange Act of 1934during the preceding 12 months (or for such shorter period that the registrant was required to file such reports), and (2) has been subject to such filingrequirements for the past 90 days. Yes R No o
Indicate by check mark whether the registrant has submitted electronically and posted on its corporate Web site, if any, every Interactive Data File required tobe submitted and posted pursuant to Rule 405 of Regulation S-T during the preceding 12 months (or for such shorter period that the registrant was required tosubmit and post such files). Yes R No o
Indicate by check mark if disclosure of delinquent filers pursuant to Item 405 of Regulation S-K is not contained herein, and will not be contained, to the bestof registrant’s knowledge, in definitive proxy or information statements incorporated by reference in Part III of this Form 10-K or any amendment to thisForm 10-K. o
Indicate by check mark whether the registrant is a large accelerated filer, an accelerated filer, a non-accelerated filer, or a smaller reporting company. See thedefinitions of “large accelerated filer,” “accelerated filer,” and “smaller reporting company” in Rule 12b-2 of the Exchange Act.
Large accelerated filer R Accelerated filer o
Non-accelerated filer o (Do not check if a smaller reporting company) Smaller reporting company o
Indicate by check mark whether the registrant is a shell company (as defined in Rule 12b-2 of the Act). Yes o No R
Approximate aggregate market value of the registrant’s common stock held by non-affiliates as of July 29, 2011, based uponthe last sale price reported for such date on the NASDAQ Global Select Market
$25.3 billion
Number of shares of common stock outstanding as of March 7, 2012 1,762,044,563

Table of Contents
DOCUMENTS INCORPORATED BY REFERENCE
The information required by Part III of this report, to the extent not set forth herein, is incorporated by reference from the registrant's proxy statement relatingto the annual meeting of stockholders in 2012. Such proxy statement will be filed with the Securities and Exchange Commission within 120 days after the endof the fiscal year to which this report relates.
PART I Table of Contents Page
Item 1. Business 4
Item 1A. Risk Factors 14
Item 1B. Unresolved Staff Comments 20
Item 2. Properties 21
Item 3. Legal Proceedings 21
Item 4. Mine Safety Disclosures 21
PART II
Item 5. Market for Registrant’s Common Equity, Related Stockholder Matters and Issuer Purchases of Equity Securities 22
Item 6. Selected Financial Data 25
Item 7. Management’s Discussion and Analysis of Financial Condition and Results of Operations 26
Item 7A. Quantitative and Qualitative Disclosures About Market Risk 56
Item 8. Financial Statements and Supplementary Data 57
Item 9. Changes in and Disagreements with Accountants on Accounting and Financial Disclosure 108
Item 9A. Controls and Procedures 108
Item 9B. Other Information 109
PART III
Item 10 Directors, Executive Officers and Corporate Governance 110
Item 11 Executive Compensation 110
Item 12 Security Ownership of Certain Beneficial Owners and Management and Related Stockholder Matters 110
Item 13 Certain Relationships and Related Transactions, and Director Independence 110
Item 14 Principal Accounting Fees and Services 110
PART IV
Item 15. Exhibits, Financial Statement Schedules 111
Signatures 113
Exhibit Index 115
Exhibits
EX-12.1
EX-21
EX-23
EX-31.1
EX-31.2
EX-32.1
EX-101 INSTANCE DOCUMENT
EX-101 SCHEMA DOCUMENT
EX-101 CALCULATION LINKBASE DOCUMENT
EX-101 LABELS LINKBASE DOCUMENT
EX-101 PRESENTATION LINKBASE DOCUMENT
EX-101 DEFINITION LINKBASE DOCUMENT

Table of Contents
CAUTIONARY NOTE REGARDING FORWARD-LOOKING STATEMENTS
This report includes “forward-looking statements.” The words “may,” “will,” “anticipate,” “estimate,” “expect,” “intend,” “plan,” “aim,” “seek” and similarexpressions as they relate to us or our management are intended to identify these forward-looking statements. All statements by us regarding our expectedfinancial position, revenues, cash flows and other operating results, business strategy, legal proceedings and similar matters are forward-looking statements.Our expectations expressed or implied in these forward-looking statements may not turn out to be correct. Our results could be materially different from ourexpectations because of various risks, including the risks discussed in this report under “Part I - Item 1A - Risk Factors.” Any forward-looking statementspeaks only as of the date as of which such statement is made, and, except as required by law, we undertake no obligation to update any forward-lookingstatement to reflect events or circumstances, including unanticipated events, after the date as of which such statement was made.
Table of Contents
PART I
All percentage amounts and ratios were calculated using the underlying data in thousands. Unless otherwise noted, all references to time periods refer toour fiscal years. Our fiscal year is the 52 or 53 week period ending on the Friday nearest January 31. The fiscal year ended February 3, 2012 ("Fiscal2012") was a 53 week period.
Unless the context indicates otherwise, references in this report to “we,” “us,” “our” and “Dell” mean Dell Inc. and our consolidated subsidiaries.
ITEM 1 — BUSINESS
General
Dell is a global information technology company that offers its customers a broad range of solutions and services delivered directly by Dell and through otherdistribution channels. We are focused on providing technology solutions that are more efficient, more accessible, and easier to manage.
Dell Inc. is a holding company that conducts its business worldwide through its subsidiaries. Our global corporate headquarters is located in Round Rock,Texas. When we refer to our company and its business in this report, we are referring to the business and activities of our consolidated subsidiaries.
Business Strategy
Dell built its reputation as a leading technology provider through listening to customers and developing solutions that meet customer needs. A few years ago,we initiated a broad transformation of the company to become an end-to-end technology solutions company.
We are expanding our enterprise solutions, which include servers, networking, and storage offerings. In services, we are adding more capabilities to provideend-to-end technology solutions to our customers, including managed security services focused on threat intelligence and security consulting. We are alsofocused on growing our end-user computing business, which includes desktop and mobility offerings. Software is a critical part of enterprise solutions andend-user computing, and we are expanding our capabilities in this business. Since the beginning of Fiscal 2011, we have acquired more than ten companieswhose offerings and intellectual property enhance our solutions business. We will continue to focus our organic and inorganic investments on opportunitiesthat we believe will enhance our solutions capabilities.
We are committed to this transformation as we have experienced its benefits. We seek to balance revenue growth with an appropriate level of profitability. Inaddition, we will continue to manage our businesses to grow operating income and cash flows over the long-term. We believe our strategy will benefit ourcustomers, drive greater efficiency and productivity, and create value for our shareholders.
Operating Business Segments
We operate in the information technology industry, and we manage our business in four global customer-centric operating segments that we identify as LargeEnterprise, Public, Small and Medium Business, and Consumer. We believe our business segments allow us to serve our customers with faster innovation andgreater responsiveness.
• Large Enterprise — Our Large Enterprise customers include large global and national corporate businesses. We believe that a single large-enterprise unit enhances our knowledge of our customers and improves our advantage in delivering globally consistent solutions and services tomany of the world's largest IT users. Our efforts in this segment will be increasingly focused on delivering innovative solutions and servicesthrough data center and cloud computing solutions.
• Public — Our Public customers, which include educational institutions, government, health care, and law enforcement agencies, operate in theirown communities. These customers have a broad range of unique IT needs and we strive to expand our leadership and address their urgent ITchallenges through the delivery of technology solutions that help them achieve their mission.
• Small and Medium Business ("SMB") — Our SMB segment is focused on helping small and medium-sized businesses get the most out of theirtechnology by offering scalable products, services, and solutions. As cloud computing and workforce mobility become a routine part of a growingbusiness's operations, server and storage virtualization facilitate achievement of the organization's IT goals. Our SMB segment continues to createand
4
Table of Contents
deliver SMB-specific solutions so customers worldwide can take advantage of these emerging technologies and grow their businesses.
• Consumer — Our Consumer segment is focused on delivering what customers want from the total technology experience of entertainment,mobility, gaming, and design. We are designing new, innovative products and experiences with fast development cycles and competitive featuresand will continue our efforts to deliver high quality products and services to Consumer customers around the world.
We refer to our Large Enterprise, Public, and SMB segments as "Commercial." For financial information about the results of our reportable operatingsegments for each of the last three fiscal years, see “Part II - Item 7 - Management's Discussion and Analysis of Financial Condition and Results ofOperations - Results of Operations - Segment Discussion” and Note 15 of the Notes to Consolidated Financial Statements included in “Part II - Item 8 -Financial Statements and Supplementary Data.”
Products and Services
We design, develop, manufacture, market, sell, and support a wide range of products, solutions, and services. We also provide various customer financialservices to our Commercial and Consumer customers.
Enterprise Solutions and Services
• Enterprise SolutionsOur enterprise solutions include servers, networking, and storage products.
• Servers and Networking — Our PowerEdge line of servers is designed to offer customers affordable performance, reliability, and scalability.Our portfolio includes high performance rack, blade, and tower servers for enterprise customers and value tower servers for smallorganizations, networks, and remote offices. During Fiscal 2012, we expanded our PowerConnect campus networking product offerings witha full suite of Dell Force10 data center networking solutions. We have also recently introduced our 12th generation of PowerEdge servers,which will help customers run their applications more effectively and their data centers more efficiently. These products support our missionto help companies of all sizes simplify their IT environments.
• Storage — We offer a comprehensive portfolio of advanced storage solutions, including storage area networks, network-attached storage,
direct-attached storage, and various backup systems. Our acquisition of Compellent Technologies, Inc. in early Fiscal 2012 has furtherexpanded our network storage offerings, and we have added a variety of increasingly flexible new Dell EqualLogic ("EqualLogic"),Dell PowerVault, and Dell DX Object storage choices that allow customers to grow capacity, add performance, and protect their datain a more economical manner. The flexibility and scalability offered by our Dell PowerVault and EqualLogic storage systems helporganizations optimize storage for diverse environments with varied requirements. During Fiscal 2012, we shifted more of ourportfolio of storage solutions to Dell-owned storage products. We believe that, along with our solid position with the EqualLogicproduct line, our recent acquisitions allow us to expand our customer base for mid-range and high-end storage solutions and deliverintegrated data management solutions to our customers.
• ServicesOur services include a broad range of configurable IT and business services, including infrastructure technology, consulting and applications, and product-related support services. Historically, we have provided the following categories of services to our customers either on a stand-alone basis or bundled withina comprehensive solution. We manage our services based on a customer engagement model, which groups our services with similar demand, economic, anddelivery profiles into three categories of services: transactional; outsourcing; and project-based. Within those categories, we offer a variety of services to ourcustomers as part of an overall solution. • Transactional — We offer services that are closely tied to the sale of our servers, storage, and client offerings. These services include support
and extended warranty services, managed deployment, enterprise installation, and configuration services.
• Outsourcing — Our outsourcing services business is designed to reduce customer costs and increase the efficiency and improve the quality ofcustomer business operations. Our outsourcing services include data center and systems management, network management, life cycleapplication development and management
5
Table of Contents
services, and business process outsourcing services. A significant portion of the revenue we derive from our outsourcing services contracts is typicallyrecurring in nature.
• Project-based — We also offer short-term services that address a wide array of client needs, including IT infrastructure, applications, businessprocess, and business consulting.
Beginning in Fiscal 2013, we will transition to new classifications for our services business that are aligned with the types of service offerings we provide toour customers. This change reinforces our commitment to developing and delivering innovative solutions that meet our customers' needs. We will classify ourservices as Support and Deployment services, Infrastructure, Cloud, and Security services, and Applications and Business Process services.
• Support and Deployment Services — Support and deployment services are closely tied to the sale of our servers, storage, networking andclient offerings, as well as multivendor support services. These services include the majority of the services we currently classify astransactional services above.
• Infrastructure, Cloud, and Security Services — Infrastructure, Cloud, and Security services may be performed under multi-year outsourcingarrangements, subscription services, or short-term consulting contracts. These services include infrastructure and security managedservices, cloud computing, infrastructure consulting, and security consulting and threat intelligence. We are often responsible fordefining the infrastructure technology strategies for our customers through the identification and delivery of new technology offeringsand innovations that deliver value to our customers.
• Applications and Business Process Services — Applications services include such services as application development and maintenance,application migration and management services, package implementation, testing and quality assurance functions, business intelligence anddata warehouse solutions, and application consulting services. Business process services involve assuming responsibility for certain customerbusiness functions, including back office administration, call center management, and other technical and administration services.
Software and Peripherals
We offer Dell-branded printers and displays and a multitude of competitively priced third-party peripheral products such as printers, televisions, notebookaccessories, mice, keyboards, networking and wireless products, digital cameras, and other products. We also sell a wide range of third-party softwareproducts, including operating systems, business and office applications, anti-virus and related security software, entertainment software, and products invarious other categories. We are focusing our participation in this area on higher-value offerings.
Client Products
We offer a wide variety of mobility and desktop products, including notebooks, workstations, tablets, smartphones, and desktop PCs, to our Commercial andConsumer customers.
• Commercial — Our Latitude, Optiplex, Vostro, and Dell Precision workstation lines of mobility notebooks and desktop PCs are designed withour Commercial customers in mind. The Latitude line of notebooks and the Optiplex line of desktop PCs deliver industry leading design,durability, security, and manageability to drive enterprise efficiency and reduce the total cost of ownership. The Vostro line is designed tocustomize technology, services, and expertise to suit the specific needs of small businesses. We also offer the Precision line of mobile anddesktop workstations for professional users who demand advanced workstation performance capabilities to run sophisticated applications.During Fiscal 2012, we introduced the new Vostro 3000 series notebooks, and the Dell Precision M4600 and M6600 mobile workstations, andmade enhancements to our Dell Latitude E-family of notebooks.
• Consumer — For our Consumer customers, we offer the Inspiron, XPS, and Alienware lines of notebooks and desktop PCs. The Inspiron lineis designed for the mainstream user seeking a personalized smart investment that is easy to use, while the XPS line is designed for customersseeking un-compromised form plus function, with high performance and craftsmanship. We target sales of our Alienware line to customersseeking advanced multimedia capabilities for high performance gaming. During Fiscal 2012, we introduced new desktops and notebooks ineach of our consumer brands, including thin and powerful Inspiron and XPS notebooks.
6
Table of Contents
For additional information about the above products and services, see “Part II — Item 7 — Management’s Discussion and Analysis of Financial Conditionand Results of Operations — Results of Operations — Revenue by Product and Services Categories.”
In early Fiscal 2013, we launched our newly formed Software Group, which will expand our ability to execute in strategic areas that are important to ourcustomers. The formation of this group, in conjunction with enhancements to our software capabilities across Dell, will help support our strategictransformation as an end-to-end technology solutions company.
Financial Services
We offer or arrange various financing options and services for our Commercial and Consumer customers in the U.S. and Canada through Dell FinancialServices ("DFS"). DFS offers a wide range of financial services, including originating, collecting, and servicing customer receivables primarily related to thepurchase of Dell products. DFS offers private label credit financing programs to qualified Consumer and Commercial customers and offers leases and fixed-term financing primarily to Commercial customers. Financing through DFS is one of many sources of funding that our customers may select. For additionalinformation about our financing arrangements, see “Part II - Item 7 - Management's Discussion and Analysis of Financial Condition and Results ofOperations - Dell Financial Services and Financing Receivables” and Note 4 of the Notes to Consolidated Financial Statements included in “Part II -Item 8 -Financial Statements and Supplementary Data.”
During Fiscal 2012, we acquired Dell Financial Services Canada Limited from CIT Group Inc. and we announced our entry into a definitive agreement toacquire CIT Vendor Finance's Dell-related assets and its sales and servicing functions in Europe. CIT Vendor Finance is currently a Dell financing preferredvendor operating in more than 25 countries and will continue to support Dell for the transition period in Europe. CIT Vendor Finance will also continue toprovide financing programs with Dell in select countries around the world, including programs in Latin America, after completion of this transaction.
Product Development
We focus on developing scalable technologies that incorporate highly desirable features and capabilities at competitive prices. We employ a collaborativeapproach to product design and development in which our engineers, with direct customer input, design innovative solutions and work with a global networkof technology companies to architect new system designs, influence the direction of future development, and integrate new technologies into our products. Wemanage our research, development, and engineering ("RD&E") spending by targeting those innovations and products that we believe are most valuable to ourcustomers and by relying on the capabilities of our strategic relationships. Through this collaborative, customer-focused approach, we strive to deliver newand relevant products to the market quickly and efficiently.
We are increasing our focus on research and development and will continue to shift our investment in RD&E activities to support initiatives that enhance ourenterprise solutions and services offerings. In Fiscal 2012, we opened the Dell Silicon Valley Research and Development Center, bringing the total number ofglobal research and development centers we operate to 12. Our total research, development, and engineering expenses were $856 million, $661 million, and$624 million for Fiscal 2012, Fiscal 2011, and Fiscal 2010, respectively.
Manufacturing and Materials
Third parties manufacture the majority of the client products we sell under the Dell brand. We use contract manufacturers and manufacturing outsourcingrelationships to achieve our goals of generating cost efficiencies, delivering products faster, better serving our customers, and building a world-class supplychain. Our manufacturing facilities are located in Austin, Texas; Penang, Malaysia; Xiamen, China; Hortolândia, Brazil; Chennai, India; and Lodz, Poland.See “Part I - Item 2 - Properties” for information about our manufacturing and distribution locations.
Our manufacturing process consists of assembly, software installation, functional testing, and quality control. Testing and quality control processes are alsoapplied to components, parts, sub-assemblies, and systems obtained from third-party suppliers. Quality control is maintained through the testing ofcomponents, sub-assemblies, and systems at various stages in the manufacturing process. Quality control also includes a burn-in period for completed unitsafter assembly, ongoing production reliability audits, failure tracking for early identification of production and component problems, and information fromcustomers obtained through services and support programs. We are certified to the ISO (International
7
Table of Contents
Organization for Standardization) 9001: 2008 Quality management systems standard. This certification includes most of our global sites that design,manufacture, and service our products.
We purchase materials, supplies, product components, and products from a large number of vendors. In some cases, where multiple sources of supply are notavailable, we rely on single-source vendors. In other cases, we may establish a working relationship with a single source or a limited number of sources ofsupply if we believe it is advantageous to do so due to performance, quality, support, delivery, capacity, or price considerations. We believe that anydisruption that may occur because of our dependency on single- or limited-source vendors would not disproportionately disadvantage us relative to ourcompetitors. See “Part I - Item 1A - Risk Factors” for information about the risks associated with single- or limited-source suppliers.
Geographic Operations
Our global corporate headquarters is located in Round Rock, Texas. We have operations and conduct business in many countries located in the Americas,Europe, the Middle East, Asia and other geographic regions. We continue to expand and invest in Growth Countries, which we define as non-U.S. marketsexcluding Western Europe, Canada, and Japan. In particular, we are focused on the BRIC region, which consists of Brazil, Russia, India, and China. Ourcontinued expansion outside of the U.S. creates additional complexity in coordinating the design, development, procurement, manufacturing, distribution, andsupport of our increasingly complex product and service offerings. For additional information on our product and service offerings, see “Products andServices - Manufacturing and Materials” and “Part I - Item 2 - Properties.” For information about percentages of revenue we generated from our operationsoutside of the U.S. and other financial information for each of the last three fiscal years, see “Part II - Item 7 - Management's Discussion and Analysis ofFinancial Condition and Results of Operations - Results of Operations” and Note 15 of the Notes to Consolidated Financial Statements included in “Part II -Item 8 - Financial Statements and Supplementary Data."
Competition
We operate in an industry in which there are rapid technological advances in hardware, software, and service offerings and we face ongoing product and pricecompetition in all areas of our business including both branded and generic competitors. We compete based on our ability to offer to our customerscompetitive, scalable, and integrated solutions that provide the most current and desired product and services features. We believe that our strong relationshipswith our customers and our distribution channels, such as retail, system integrators, value-added resellers, distributors, and other channel partners, allow us torespond to changing customer needs faster than many of our competitors.
Sales and Marketing
We sell our products and services directly to customers and through various other sales distribution channels, such as retailers, third-party solution providers,system integrators, and third-party resellers. Our customers include large global and national corporate businesses, public institutions that include government,education, and healthcare organizations, law enforcement agencies, small and medium business, and consumers. No single customer accounted for more than10% of our consolidated net revenue during any of the last three fiscal years.
Our sales efforts are organized around the evolving needs of our customers, and our marketing initiatives reflect this focus. Our direct business modelemphasizes direct communication with our customers, thereby allowing us to refine our products and marketing programs for specific customer groups. Wemarket our products and services to small and medium-sized businesses and consumers through various advertising media. Customers may offer suggestionsfor current and future Dell products, services, and operations on an interactive portion of our Internet website called Dell IdeaStorm. In order to react quicklyto our customers' needs, we track our Net Promoter Score, a customer loyalty metric that is widely used across various industries. Increasingly, we alsoengage with customers through our social media communities on www.dell.com and in external social media channels. In Fiscal 2012, in an effort to create amore responsive and efficient sales organization, we announced the unification of our global sales and marketing teams. We believe that this change willcreate a sales organization that is more customer-focused, collaborative, and innovative.
For large business and institutional customers, we maintain a field sales force throughout the world. Dedicated account teams, which include field-basedenterprise solution specialists, form long-term relationships to provide our largest customers with a single source of assistance, develop tailored solutions forthese customers, and provide us with customer feedback. For these customers, we offer several programs designed to provide single points of contact andaccountability with global account specialists, special global pricing, and consistent global service and support programs. We also maintain specific sales andmarketing programs targeted at federal, state, and local governmental agencies, as well as healthcare and educational customers.
8

Table of Contents
Patents, Trademarks, and Licenses
At February 3, 2012, we held a worldwide portfolio of 3,449 patents and had an additional 1,660 patent applications pending. We also hold licenses to usenumerous third-party patents. To replace expiring patents, we obtain new patents through our ongoing research and development activities. The inventionsclaimed in our patents and patent applications cover aspects of our current and possible future computer system products, manufacturing processes, andrelated technologies. Our product, business method, and manufacturing process patents may establish barriers to entry in many product lines. While we useour patented inventions and also license them to others, we are not substantially dependent on any single patent or group of related patents. We have enteredinto a variety of intellectual property licensing and cross-licensing agreements. We have also entered into various software licensing agreements with othercompanies. We anticipate that our worldwide patent portfolio will be of value in negotiating intellectual property rights with others in the industry.
We have obtained U.S. federal trademark registration for the DELL word mark and the Dell logo mark. We ownregistrations for 107 of our other trademarks in the U.S. At February 3, 2012, we had pending applications for registration of 14 other trademarks. We believethat establishment of the DELL word mark and logo mark in the U.S. is material to our operations. We have also applied for or obtained registration of theDELL word mark and several other marks in approximately 183 other countries.
From time to time, other companies and individuals assert exclusive patent, copyright, trademark, or other intellectual property rights to technologies or marksthat are important to the technology industry or our business. We evaluate each claim relating to our products and, if appropriate, seek a license to use theprotected technology. The licensing agreements generally do not require the licensor to assist us in duplicating its patented technology, nor do theseagreements protect us from trade secret, copyright, or other violations by us or our suppliers in developing or selling these products.
Government Regulation and Sustainability
• Government Regulation
Our business is subject to regulation by various U.S. federal and state governmental agencies and other governmental agencies. Such regulation includes theradio frequency emission regulatory activities of the U.S. Federal Communications Commission; the anti-trust regulatory activities of the U.S. Federal TradeCommission, the U.S. Department of Justice, and the European Union; the consumer protection laws and financial services regulations of the U.S. FederalTrade Commission and various state governmental agencies; the export regulatory activities of the U.S. Department of Commerce and the U.S. Department ofTreasury; the import regulatory activities of U.S. Customs and Border Protection; the product safety regulatory activities of the U.S. Consumer Product SafetyCommission and the U.S. Department of Transportation; the investor protection and capital markets regulatory activities of the U.S. Securities and ExchangeCommission; and the environmental, employment and labor, and other regulatory activities of a variety of governmental authorities in each of the countries inwhich we conduct business. We were not assessed any material environmental fines, nor did we have any material environmental remediation or otherenvironmental costs, during Fiscal 2012.
• Sustainability
Environmental stewardship and social responsibility are both integral parts of how we manage our business, and complement our focus on businessefficiencies and customer satisfaction. We use open dialogue with our stockholders, customers, vendors, and other stakeholders as part of our sustainabilitygovernance process in which we solicit candid feedback and offer honest discussions on the challenges we face globally. Our environmental initiatives takemany forms, including maximizing product energy efficiency, reducing and eliminating sensitive materials from our products, and providing responsible,convenient computer recycling options for customers.We were the first company in our industry to offer a free worldwide recycling program for our consumers. We also provide consumers with no-chargerecycling of any brand of computer or printer with the purchase of a new Dell computer or printer. We have streamlined our transportation network to reducetransit times, minimize air freight and reduce emissions. Our packaging is designed to minimize box size and to increase recycled content of materials alongwith recyclability. When developing and designing products, we select materials guided by a precautionary approach in which we seek to eliminateenvironmentally sensitive substances (where reasonable alternatives exist) from our products and work towards developing reliable, environmentally sound,and commercially scalable solutions. We also have created a series of tools that help customers assess their current IT operations and uncover ways to reduceboth the costs of those operations and their impact on the environment.
9
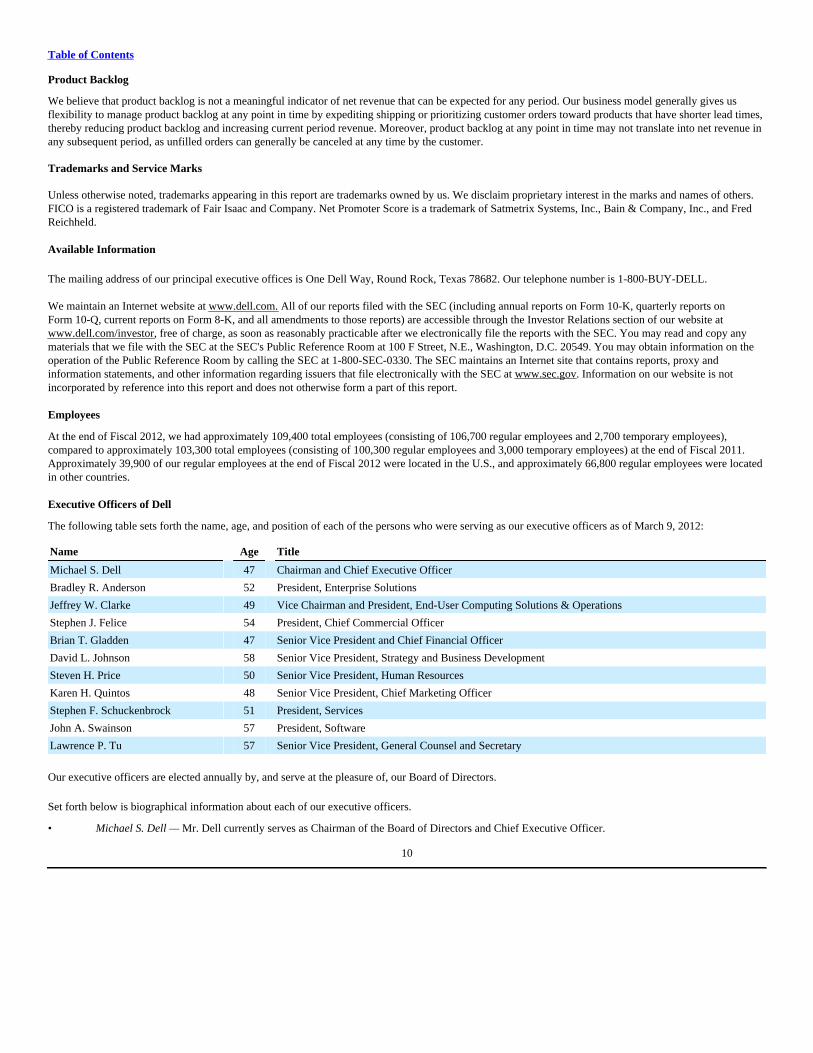
Table of Contents
Product Backlog
We believe that product backlog is not a meaningful indicator of net revenue that can be expected for any period. Our business model generally gives usflexibility to manage product backlog at any point in time by expediting shipping or prioritizing customer orders toward products that have shorter lead times,thereby reducing product backlog and increasing current period revenue. Moreover, product backlog at any point in time may not translate into net revenue inany subsequent period, as unfilled orders can generally be canceled at any time by the customer.
Trademarks and Service Marks
Unless otherwise noted, trademarks appearing in this report are trademarks owned by us. We disclaim proprietary interest in the marks and names of others.FICO is a registered trademark of Fair Isaac and Company. Net Promoter Score is a trademark of Satmetrix Systems, Inc., Bain & Company, Inc., and FredReichheld.
Available Information
The mailing address of our principal executive offices is One Dell Way, Round Rock, Texas 78682. Our telephone number is 1-800-BUY-DELL.
We maintain an Internet website at www.dell.com. All of our reports filed with the SEC (including annual reports on Form 10-K, quarterly reports onForm 10-Q, current reports on Form 8-K, and all amendments to those reports) are accessible through the Investor Relations section of our website atwww.dell.com/investor, free of charge, as soon as reasonably practicable after we electronically file the reports with the SEC. You may read and copy anymaterials that we file with the SEC at the SEC's Public Reference Room at 100 F Street, N.E., Washington, D.C. 20549. You may obtain information on theoperation of the Public Reference Room by calling the SEC at 1-800-SEC-0330. The SEC maintains an Internet site that contains reports, proxy andinformation statements, and other information regarding issuers that file electronically with the SEC at www.sec.gov. Information on our website is notincorporated by reference into this report and does not otherwise form a part of this report. Employees
At the end of Fiscal 2012, we had approximately 109,400 total employees (consisting of 106,700 regular employees and 2,700 temporary employees),compared to approximately 103,300 total employees (consisting of 100,300 regular employees and 3,000 temporary employees) at the end of Fiscal 2011.Approximately 39,900 of our regular employees at the end of Fiscal 2012 were located in the U.S., and approximately 66,800 regular employees were locatedin other countries.
Executive Officers of Dell
The following table sets forth the name, age, and position of each of the persons who were serving as our executive officers as of March 9, 2012:
Name Age Title
Michael S. Dell 47 Chairman and Chief Executive Officer
Bradley R. Anderson 52 President, Enterprise Solutions
Jeffrey W. Clarke 49 Vice Chairman and President, End-User Computing Solutions & Operations
Stephen J. Felice 54 President, Chief Commercial Officer
Brian T. Gladden 47 Senior Vice President and Chief Financial Officer
David L. Johnson 58 Senior Vice President, Strategy and Business Development
Steven H. Price 50 Senior Vice President, Human Resources
Karen H. Quintos 48 Senior Vice President, Chief Marketing Officer
Stephen F. Schuckenbrock 51 President, Services
John A. Swainson 57 President, Software
Lawrence P. Tu 57 Senior Vice President, General Counsel and Secretary
Our executive officers are elected annually by, and serve at the pleasure of, our Board of Directors.
Set forth below is biographical information about each of our executive officers.
• Michael S. Dell — Mr. Dell currently serves as Chairman of the Board of Directors and Chief Executive Officer.
10

Table of Contents
He has held the title of Chairman of the Board since he founded Dell in 1984. Mr. Dell also served as Chief Executive Officer of Dell from 1984 untilJuly 2004 and resumed that role in January 2007. He serves on the Foundation Board of the World Economic Forum, the executive committee of theInternational Business Council, and is a member of the U.S. Business Council and the Business Roundtable, and serves as chairman of the Technology CEOCouncil. He also serves on the governing board of the Indian School of Business in Hyderabad, India, and is a board member of Catalyst, Inc.
• Bradley R. Anderson — Mr. Anderson joined Dell in July 2005 and has served as President, Enterprise Solutions since January 2012. In this role,he is responsible for worldwide engineering, design, development, and marketing of Dell's enterprise products, including servers, networking, andstorage systems. From July 2005 until January 2009, Mr. Anderson served as Senior Vice President, Business Product Group. Prior to joining Dell,Mr. Anderson was Senior Vice President and General Manager of the Industry Standard Servers business at Hewlett-Packard Company (“HP”),where he was responsible for HP's server solutions. Previously, he was Vice President of Server, Storage, and Infrastructure for HP, where he ledthe team responsible for server, storage, peripheral, and infrastructure products. Before joining HP in 1996, Mr. Anderson held top managementpositions at Cray Research in executive staff, field marketing, sales, finance, and corporate marketing. Mr. Anderson earned a Bachelor of Sciencedegree in Petroleum Engineering from Texas A&M University and a Master of Business Administration degree from Harvard University.
• Jeffrey W. Clarke — Mr. Clarke serves as Vice Chairman and President, End User Computing Solutions & Operations. In this role, in which he hasserved since January 2009, he is responsible for worldwide engineering, design and development of Dell's business client products, including DellOptiPlex Desktops, Latitude Notebooks and Precision Workstations, and production of all company products worldwide. From January 2003 untilJanuary 2009, Mr. Clarke served as Senior Vice President, Business Product Group. From November 2001 to January 2003, Mr. Clarke served asVice President and General Manager, Relationship Product Group. In 1995, Mr. Clarke became the director of desktop development. Mr. Clarkejoined Dell in 1987 as a quality engineer and has served in a variety of engineering and management roles. Mr. Clarke received a Bachelor's degreein Electrical Engineering from the University of Texas at San Antonio.
• Stephen J. Felice — Mr. Felice was named President, Chief Commercial Officer in January 2012. From November 2009 until January 2012, heserved as President, Consumer, Small and Medium Business. Mr. Felice leads the Dell organization that creates and delivers specific solutions andtechnology to Commercial customers globally and is responsible for Dell's portfolio of products, including desktops, laptops, software andperipherals as well as product design and sales. From January 2009 until November 2009, Mr. Felice served as President, Small and MediumBusiness, and from March 2007 until January 2009, as Senior Vice President and President, Asia Pacific-Japan, after having served as VicePresident, Asia Pacific-Japan since August 2005. In those positions, Mr. Felice was responsible for Dell's operations throughout the APJ region,including sales and customer service centers in Penang, Malaysia, and Xiamen, China. From February 2002 until July 2005, Mr. Felice was VicePresident, Corporate Business Group, Dell Americas. Mr. Felice joined us in February 1999 and has held various executive roles in our sales andconsulting services organizations. Prior to joining Dell, Mr. Felice served as Chief Executive Officer and President of DecisionOne Corp.Mr. Felice also served as Vice President, Planning and Development, with Bell Atlantic Customer Services, and he spent five years with Shell Oilin Houston. Mr. Felice holds a Bachelor's degree in Business Administration from the University of Iowa and a Master of Business Administrationdegree from the University of Houston.
• Brian T. Gladden — Mr. Gladden serves as Senior Vice President and Chief Financial Officer (“CFO”). In this role, in which he has served sinceJune of 2008, he is responsible for all aspects of Dell's finance functions, including accounting, financial planning and analysis, tax, treasury, andinvestor relations, and is also responsible for Dell's information technology, global security and facilities functions. Prior to joining Dell,Mr. Gladden was President and CEO of SABIC Innovative Plastics Holding BV from August 2007 through May 2008. Prior to this role,Mr. Gladden spent nearly 20 years with General Electric Company (“GE”) in a variety of financial and management leadership roles. He is amember of the University of Texas McCombs School of Business Advisory Council. Mr. Gladden earned a Bachelor of Science degree in BusinessAdministration and Finance from Millersville University in Millersville, Pennsylvania.
• David L. Johnson — Mr. Johnson serves as Senior Vice President, Corporate Strategy and Business Development. He joined Dell in June of 2009as Senior Vice President, Corporate Strategy. In this role, he works with Michael Dell on the development of short- and long-term strategy, andalso with leaders of the company's global business units on their respective growth strategies. In June 2010, Mr. Johnson assumed responsibility for
11
Table of Contents
Dell's Business Development strategy, including responsibility for Dell's acquisition strategy and other strategic investments. Mr. Johnson previously spent 27years at International Business Machines Corporation ("IBM") in a variety of corporate-development and finance roles, and was a member of the company'ssenior leadership team. Mr. Johnson holds both a Master of Business Administration and a Bachelor's degree in English from Boston College.
• Steven H. Price — Mr. Price serves as Senior Vice President, Human Resources. In this role, he is responsible for overall human resources ("HR")strategy in support of the purpose, values and business initiatives of Dell. He is also responsible for developing and driving people strategy andfostering an environment where the global Dell team thrives. Mr. Price joined Dell in February 1997 and has played leadership roles throughout theHR organization, including Vice President of HR for the global Consumer business, Global Talent Management and Americas Human Resources.From November 2006 until June 2010, he served as Vice President, Human Resources Dell Global Consumer Group. From January 2003 untilNovember 2006, he served as Vice President, Human Resources Dell Americas Business Group. From July 2001 until January 2003, he served asVice President, Human Resources Global HR Operations. From May 1999 to July 2001, he served as Vice President, Human Resources DellEMEA. Prior to joining Dell in 1997, Mr. Price spent 13 years with SC Johnson Wax, based in Racine, Wisconsin. Having started his career therein sales, he later moved into HR, where he held a variety of senior positions. Mr. Price is a member of the Executive Advisory Board for the RawlsCollege of Business at Texas Tech University and also serves on the Executive Advisory Board for The Wharton School at the University ofPennsylvania. He holds a Bachelor's degree in Business from Southwestern Oklahoma State University and a Master's degree in BusinessAdministration from the University of Central Oklahoma.
• Karen H. Quintos — Karen Quintos is Senior Vice President and Chief Marketing Officer (“CMO”) for Dell, where she is responsible for bringingthe company's brand to life for Dell customers, team members, and stakeholders around the world. She leads Dell's branding, messaging, andmarketing for all Dell customer segments, in addition to global communications, social media, and agency management. Before becoming CMO inSeptember 2010, Ms. Quintos served as Vice President of Dell's global Public business, from January 2008 to September 2010, and was responsiblefor driving global marketing strategies, product and pricing programs, communications and channel plans. She has also held various executive rolesin SMB marketing and Dell's Services and Supply Chain Management teams since joining Dell in 2000. She came to Dell from Citigroup, whereshe served as Vice President of Global Operations and Technology. She also spent 12 years with Merck & Co., where she held a variety of roles inmarketing, planning, operations and supply chain management. Ms. Quintos holds a Master's degree in Marketing and International Business fromNew York University and a Bachelor of Science degree in Supply Chain Management from The Pennsylvania State University State College. Shehas served on multiple boards of directors and currently serves on the Susan G. Komen for the Cure, Penn State's Smeal Business School Board ofVisitors, Association of National Advertisers, the Ad Council, and Dell's Women's Networking Board.
• Stephen F. Schuckenbrock — Mr. Schuckenbrock serves as President, Services. In this role, he is responsible for developing and delivering a best-in-class suite of intelligent, end-to-end IT services and business solutions for global corporations, government, health care, educational institutionsand medium-sized businesses in more than 180 countries around the world. Mr. Schuckenbrock joined Dell in January 2007 as Senior VicePresident and President, Global Services. In September 2007, he assumed the additional role of Chief Information Officer, and he served in thoseroles until January 2009. In those roles, he was responsible for all aspects of Dell's services business, with worldwide responsibility for Dellenterprise service offerings, and was also responsible for Dell's global information systems and technology structure. From January 2009 until re-assuming the Services role in January 2011, Mr. Schuckenbrock was President, Large Enterprise, leading the delivery of innovative and globallyconsistent Dell solutions and services to the world's largest corporate IT users. Prior to joining Dell, Mr. Schuckenbrock served as Co-ChiefOperating Officer and Executive Vice President of Global Sales and Services for Electronic Data Systems Corporation (“EDS”). Before joiningEDS in 2003, he was Chief Operating Officer of The Feld Group, an information technology consulting organization. Mr. Schuckenbrock served asGlobal Chief Information Officer at PepsiCo from 1995 to 2000. Mr. Schuckenbrock earned a Bachelor's degree in Business Administration fromElon University.
• John A. Swainson — Mr. Swainson joined Dell in March 2012. He currently serves as President of Dell's newly formed Software Group.Immediately prior to joining Dell, Mr. Swainson was a Senior Advisor to Silver Lake, a global private equity firm from May 2010 to February2012. From February 2005 until December 2009, Mr. Swainson served as Chief Executive Officer and Director of CA, Inc., an enterprise softwarecompany. Prior to joining CA, Inc. Mr. Swainson worked for IBM for over 26 years, where he held various management positions
12
Table of Contents
in the U.S. and Canada, including seven years in the role of General Manager of the Application Integration Middleware Division. Mr. Swainson holds aBachelor's degree in Engineering from the University of British Colombia, Canada. He currently serves on the boards of directors of Visa Inc., BroadcomCorporation, Assurant, Inc., and Cadence Design Systems, Inc. Mr. Swainson will be retiring from the boards of directors of Broadcom Corporation,Assurant, Inc. and Cadence Design Systems, Inc. in May 2012.
• Lawrence P. Tu — Mr. Tu joined Dell as Senior Vice President, General Counsel and Secretary in July 2004, and is responsible for overseeingDell's global legal, governmental affairs, and ethics and compliance departments. Before joining Dell, Mr. Tu served as Executive Vice Presidentand General Counsel at NBC Universal for three years. Prior to his position at NBC, he was a partner with the law firm of O'Melveny & MyersLLP, where he focused on energy, technology, Internet, and media-related transactions. He also served five years as managing partner of the firm'sHong Kong office. Mr. Tu's prior experience also includes serving as General Counsel Asia-Pacific for Goldman Sachs, attorney for the U.S. StateDepartment, and law clerk for U.S. Supreme Court Justice Thurgood Marshall. Mr. Tu holds Juris Doctor and Bachelor of Arts degrees fromHarvard University, as well as a Master's degree from Oxford University, where he was a Rhodes Scholar.
13
Table of Contents
ITEM 1A — RISK FACTORS
Our business, operating results, financial condition, and prospects are subject to a variety of significant risks, many of which are beyond our control. Thefollowing is a description of some of the important risk factors that may cause our actual results in future periods to differ substantially from those wecurrently expect or seek. The risks described below are not the only risks facing us. There are additional risks and uncertainties not currently known to us orthat we currently deem to be immaterial that also may materially adversely affect our business, operating results, financial condition, or prospects.
• We face intense competition, which may adversely affect our industry unit share position, revenue, and profitability. We operate in an industry in which there are rapid technological advances in hardware, software, and service offerings, and we face aggressive product andprice competition from both branded and generic competitors. We compete based on our ability to offer to our customers competitive integrated solutions thatprovide the most current and desired product and services features. We expect that competition will continue to be intense, and there is a risk that ourcompetitors' products may be less costly, provide better performance or include additional features when compared to our products. Additionally, there is arisk that our product portfolios may quickly become outdated or our market share may quickly erode. Moreover, our efforts to balance our mix of productsand services to optimize profitability, liquidity, and growth may put pressure on our industry position.
In addition to competitive factors we face as a result of the current state of our business and our industry, we confront additional competitive challenges as ourbusiness and industry continue to grow and evolve. As we expand globally, we may see new and increased competition in different geographic regions.Moreover, the generally low barriers to entry in our business increase the potential for challenges from new industry competitors. We may also see increasedcompetition from new types of products as the options for mobile and cloud computing solutions increase. Further, as our industry evolves and our companygrows, companies with which we have strategic alliances may become competitors in other product areas or our current competitors may enter into newstrategic relationships with new or existing competitors, all of which may further increase the competitive pressures we face.
• Our reliance on vendors for products and components, many of whom are single-source or limited-source suppliers, could harm our business byadversely affecting product availability, delivery, reliability, and cost.
We maintain several single-source or limited-source supplier relationships, either because multiple sources are not readily available or because therelationships are advantageous to us due to performance, quality, support, delivery, capacity, or price considerations. If the supply of a critical single- orlimited-source product or component is delayed or curtailed, we may not be able to ship the related product in desired quantities, configurations, or in a timelymanner. Even where multiple sources of supply are available, qualification of the alternative suppliers and establishment of reliable supplies could result indelays and a possible loss of sales, which could harm our operating results.We obtain many of our products and all of our components from third-party vendors, many of which are located outside of the U.S. In addition, significantportions of the products we sell are now assembled by contract manufacturers, primarily in various parts of Asia. A significant concentration of thisoutsourced manufacturing is currently performed by only a few of our contract manufacturers, often in single locations. We sell components to these contractmanufacturers and generate large non-trade accounts receivables, an arrangement that presents a risk of uncollectibility if the financial condition of a contractmanufacturer should deteriorate.
While these relationships generate cost efficiencies, they reduce our direct control over production. Our increasing reliance on these vendorssubjects us to a greater risk of shortages, and reduced control over delivery schedules of components and products, as well as a greater risk of increases inproduct and component costs. Because we maintain minimal levels of component and product inventories, a disruption in component or product availabilitycould harm our financial performance and our ability to satisfy customer needs. In addition, defective parts and products from these vendors could reduceproduct reliability and harm our reputation.
• If we fail to achieve favorable pricing from our vendors, our profitability could be adversely affected. Our profitability is affected by our ability to achieve favorable pricing from our vendors and contract manufacturers, including through negotiations forvendor rebates, marketing funds, and other vendor funding received in the normal course of business. Because these supplier negotiations are continuous andreflect the ongoing competitive environment, the variability in timing and amount of incremental vendor discounts and rebates can affect our profitability.These vendor programs may change periodically, potentially resulting in adverse profitability trends if we cannot adjust pricing or cost variables. Our inabilityto establish a cost and product advantage, or determine
14
Table of Contents
alternative means to deliver value to our customers, may adversely affect our revenue and profitability.
• Adverse global economic conditions and instability in financial markets may harm our business and result in reduced net revenue and profitability. As a global company with customers in virtually every business and industry, our performance depends significantly on global economic conditions. Adverseeconomic conditions may negatively affect customer demand for our products and services and result in postponed or decreased spending amid customerconcerns over unemployment, reduced asset values, volatile energy costs, geopolitical issues, the availability and cost of credit, and the stability and solvencyof financial institutions, financial markets, businesses, local and state governments, and sovereign nations. Weak global economic conditions also could harmour business by contributing to potential product shortages or delays, insolvency of key suppliers, potential customer and counterparty insolvencies, andincreased challenges in conducting our treasury operations. All of these possible effects of weak global economic conditions could negatively impact our netrevenue and profitability.
The European sovereign debt crisis has negatively affected the financial markets in Europe. These conditions have resulted in reduced consumer and businessconfidence and spending in many countries in Europe, where we derived a significant portion of our consolidated net revenue for Fiscal 2012. A continuationor worsening of the European sovereign debt crisis will likely have a negative effect on our European operations, as well as on the businesses of our Europeancustomers, suppliers, and partners. Any of these conditions could harm our overall business and operating results.
• We may not successfully execute our growth strategy if we fail to manage effectively the change involved in implementing our strategic initiatives. Our growth strategy involves reaching more customers through new distribution channels, expanding our relationships with resellers, and augmenting selectareas of our business through targeted acquisitions and other commercial arrangements. As we reach more customers through new distribution channels andexpanded reseller relationships, we may fail to manage in an effective manner the increasingly difficult tasks of inventory management and demandforecasting. Our ability to accomplish the goals of our growth strategy depends on our success in transitioning our sales capabilities in accordance with ourstrategy, adding to the breadth of our higher margin offerings through selective acquisitions of other businesses, and managing the effects of these strategicinitiatives. If we are unable to meet these challenges, our results of operations could be unfavorably affected.
• We may not successfully implement our acquisition strategy. We acquire companies as a part of our growth strategy. These acquisitions may involve significant new risks and uncertainties that could adversely affect ourprofitability or operations, including distraction of management attention from a focus on our current business operations, insufficient new revenue to offsetexpenses, inadequate return of capital, integration challenges, retention of employees of acquired businesses, new regulatory requirements, and liabilities andother exposures not discovered in our due diligence process. Further, our acquisitions may negatively impact our relationships with strategic partners if theseacquisitions are seen as bringing us into competition with such partners. In addition, if we make changes in our business strategy or if external conditionsadversely affect our business operations, we may be required to record an impairment charge to goodwill or intangible assets.
• If our cost efficiency measures are not successful, we may become less competitive. We continue to focus on minimizing our operating expenses through cost improvements and simplifying our structure. However, certain factors may preventthe achievement of these goals, which may in turn negatively affect our competitive position. For example, we may experience delays or unanticipated costsin implementing our cost efficiency plans. As a result, we may not achieve our expected cost efficiencies in the time or to the extent anticipated.
• Our inability to manage solutions, product, and services transitions in an effective manner could reduce the demand for our solutions, products,and services and the profitability of our operations.
Continuing improvements in technology result in frequent new solutions, product, and services introductions, short product life cycles, and improvements inproduct performance characteristics. If we cannot manage in an effective manner the transition to new solutions offerings and these offerings' new productsand services, customer demand for our solutions, products and services could diminish and our profitability could suffer. We are increasingly sourcing
15
Table of Contents
new products and transitioning existing products through our contract manufacturers and manufacturing outsourcing relationships in order to generate costefficiencies, deliver products faster, and better serve our customers. The success of product transitions depends on a number of factors that include theavailability of sufficient quantities of components at attractive costs. In addition, product transitions present execution challenges and risks, including the riskthat new or upgraded products may have quality issues or other defects.
• We may lose customers and experience diminished profitability if we fail to deliver products and services of consistent quality.
In selling our extensive line of products and services, many of which include third-party components, we must identify and address any quality issuesassociated with our offerings. Although quality testing is performed regularly to detect any quality problems and implement required solutions, our failure toidentify and correct significant product quality issues before sale could result in lower sales, increased warranty or replacement expenses, and reducedcustomer confidence that could harm our operating results.
• Our ability to generate substantial non-U.S. net revenue is subject to additional risks and uncertainties. Sales outside the U.S. accounted for approximately 51% of our consolidated net revenue for Fiscal 2012. Our future growth rates and success are substantiallydependent on the continued growth of our business outside the U.S. Our international operations face many risks and uncertainties, including varied localeconomic and labor conditions, political instability, changes in the U.S. and international regulatory environments, trade protection measures, tax laws(including U.S. taxes on foreign operations), copyright levies, and foreign currency exchange rates. Any of these factors could adversely affect our operationsand profitability.
• Our profitability may be adversely affected by our product, customer, and geographic sales mix and by seasonal sales trends. Our overall profitability for any particular period may be adversely affected by changes in the mix of products, customers, and geographic markets reflected inour sales for that period, as well as by seasonal trends. Our profit margins vary among products, services, customers, and geographic markets. For instance,our services offerings generally have a higher profit margin than our consumer products. In addition, parts of our business are subject to seasonal sales trends.Among the trends with the most significant impact on our operating results, sales to government customers (particularly the U.S. federal government) aretypically stronger in our third fiscal quarter, sales in Europe, the Middle East, and Africa ("EMEA") are often weaker in our third fiscal quarter, and consumersales are typically strongest during our fourth fiscal quarter.
• We may lose revenue opportunities and experience gross margin pressure if our sales channel participants fail to perform as we expect.
In recent years, we have added third-party distributors, retailers, systems integrators, value-added resellers, and other sales channels to complement our directsales organization so that we can reach even more end-users around the world. Our future operating results increasingly will depend on the performance of oursales channel participants and on our success in maintaining and developing our relationships with those sales channels. Our revenue and gross margins couldbe negatively affected if the financial condition or operations of our channel participants weaken as a result of adverse economic conditions or other businesschallenges, or if uncertainty regarding the demand for our products causes our channel participants to reduce their orders for our products. Further, somechannel participants may consider the expansion of our direct sales initiatives to conflict with their business interests as distributors or resellers of ourproducts, which could lead them to reduce their investment in the distribution and sale of our products, or to cease all sales of our products.
• Our financial performance could suffer from any reduced access to the capital markets by us or some of our customers. We are increasingly dependent on access to debt and capital sources to provide financing for our customers and to obtain funds in the U.S. for generalcorporate purposes, including working capital, acquisitions, capital expenditures, funding of customer receivables, and share repurchases. In addition, we havecustomer financing relationships with some companies that rely on access to the debt and capital markets to meet significant funding needs. Any inability ofthese companies to access such markets could compel us to self-fund transactions with them or forgo customer financing opportunities, potentially harmingour financial performance. The debt and capital markets may experience
16
Table of Contents
extreme volatility and disruption from time to time in the future, which could result in higher credit spreads in such markets and higher funding costs for us.Deterioration in our business performance, a credit rating downgrade, volatility in the securitization markets, changes in financial services regulation, oradverse changes in the economy could lead to reductions in debt availability and could limit our ability to continue asset securitizations or other financingsfrom debt or capital sources, reduce the amount of financing receivables that we originate, or negatively affect the costs or terms on which we may be able toobtain capital. Any of these developments could unfavorably affect our net revenue, profitability, and cash flows. Developments in the European Union could have significant repercussions for the U.S. and international debt and capital markets. The currentmacroeconomic climate and related disruption of the financial markets have led to concerns over the solvency of certain European Union member states andof financial institutions that have significant direct or indirect exposure to debt issued by those countries. Certain of the major credit rating agencies havedowngraded the sovereign debt of some of the European Union member states. The ratings downgrades and uncertainty regarding the effectiveness of theEuropean Union and private sector actions to address such negative developments have increased concerns that other European Union member states couldexperience similar financial troubles.
• Weak economic conditions and additional regulation could harm our financial services activities. Our financial services activities are negatively affected by an adverse economic environment through related loan delinquencies and defaults. Although loandelinquencies and defaults have improved from higher levels in recent periods, an increase in defaults would result in greater net credit losses, which mayrequire us to increase our reserves for customer receivables in the future. In addition, the implementation of new financial services regulation, or theapplication of existing financial services regulation in new countries where we expand our financial services activities and related supporting activities, couldunfavorably impact the profitability and cash flows of our consumer financing activities.
• We are subject to counterparty default risks. We have numerous arrangements with financial institutions that include cash and investment deposits, interest rate swap contracts, foreign currency optioncontracts, and forward contracts. As a result, we are subject to the risk that the counterparty to one or more of these arrangements will default, eithervoluntarily or involuntarily, on its performance under the terms of the arrangement. In times of market distress, a counterparty may default rapidly andwithout notice to us, and we may be unable to take action to cover our exposure, either because we lack the contractual ability or because market conditionsmake it difficult to take effective action. If one of our counterparties becomes insolvent or files for bankruptcy, our ability eventually to recover any lossessuffered as a result of that counterparty's default may be limited by the liquidity of the counterparty or the applicable legal regime governing the bankruptcyproceeding. In the event of such default, we could incur significant losses, which could harm our business and negatively impact our results of operations andfinancial condition.
• The exercise by customers of certain rights under our services contracts, or our failure to perform as we anticipate at the time we enter servicescontracts, could adversely affect our revenue and profitability.
Many of our services contracts allow the customer to take the following actions that may adversely affect our revenue and profitability:• Terminate the contract if our performance does not meet specified service levels• Look to a benchmarker's opinion of market rates in order to request a rate reduction or alternatively terminate the contract• Reduce the customer's use of our services and, as a result, reduce our fees• Terminate the contract early upon payment of an agreed fee In addition, we estimate our costs to deliver the services at the outset of the contract. If we fail to estimate accurately, our actual costs may significantlyexceed our estimates, even for a time and materials contract, and we may incur losses on the services contracts.
• Loss of government contracts could harm our business. Contracts with the U.S. federal, state, and local governments and foreign governments are subject to future funding that may affect the extension ortermination of programs and are subject to the right of governments to terminate for
17
Table of Contents
convenience or non-appropriation. In addition, if we violate legal or regulatory requirements, the applicable government could suspend or disbar us as acontractor, which would unfavorably affect our net revenue and profitability.
• Our business could suffer if we do not develop and protect our own intellectual property or do not obtain or protect licenses to intellectual propertydeveloped by others on commercially reasonable and competitive terms.
If we or our suppliers are unable to develop or protect desirable technology or technology licenses, we may be prevented from marketing products, could beforced to market products without desirable features, or could incur substantial costs to redesign products, defend or enforce legal actions, or pay damages.Although our suppliers might be contractually obligated to obtain or protect such licenses and indemnify us against related expenses, those suppliers could beunable to meet their obligations. Similarly, we invest in research and development and obtain additional intellectual property through acquisitions, but theseactivities do not guarantee that we will develop or obtain intellectual property necessary for profitable operations. Costs involved in developing and protectingrights in intellectual property may have a negative impact on our business. In addition, our operating costs could increase because of copyright levies orsimilar fees by rights holders and collection agencies in European and other countries.
• Infrastructure disruptions could harm our business. We depend on our information technology and manufacturing infrastructure to achieve our business objectives. A disruption of our infrastructure could becaused by a natural disaster, manufacturing failure, telecommunications system failure, or defective or improperly installed new or upgraded businessmanagement systems. Portions of our IT infrastructure also may experience interruptions, delays, or cessations of service or produce errors in connection withsystems integration or migration work that takes place from time to time. In the event of any such disruption, we may be unable to receive or process orders,manufacture and ship products in a timely manner, or otherwise conduct our business in the normal course. Moreover, portions of our services businessinvolve the processing, storage, and transmission of data, which would also be negatively affected by such an event. A disruption of our infrastructure couldcause us to lose customers and revenue, particularly during a period of heavy demand for our products and services. We also could incur significant expensein repairing system damage and taking other remedial measures.
• We could suffer a loss of revenue and increased costs, exposure to significant liability, reputational harm, and other serious negative consequencesif we sustain cyber attacks or other data security breaches that disrupt our operations or result in the dissemination of proprietary or confidentialinformation about us or our customers or other third-parties.
We manage and store various proprietary information and sensitive or confidential data relating to our operations. In addition, our outsourcing services andcloud computing businesses routinely process, store, and transmit large amounts of data for our customers, including sensitive and personally identifiableinformation. We may be subject to breaches of the information technology systems we use for these purposes. Experienced computer programmers andhackers may be able to penetrate our network security and misappropriate or compromise our confidential information or that of third-parties, create systemdisruptions, or cause shutdowns. Computer programmers and hackers also may be able to develop and deploy viruses, worms, and other malicious softwareprograms that attack our products or otherwise exploit any security vulnerabilities of our products. In addition, sophisticated hardware and operating systemsoftware and applications that we produce or procure from third-parties may contain defects in design or manufacture, including "bugs" and other problemsthat could unexpectedly interfere with the operation of the system.
The costs to us to eliminate or address the foregoing security problems and security vulnerabilities before or after a cyber incident could be significant. Ourremediation efforts may not be successful and could result in interruptions, delays, or cessation of service, and loss of existing or potential customers that mayimpede our sales, manufacturing, distribution, or other critical functions. We could lose existing or potential customers for outsourcing services or otherinformation technology solutions in connection with any actual or perceived security vulnerabilities in our products. In addition, breaches of our securitymeasures and the unapproved dissemination of proprietary information or sensitive or confidential data about us or our customers or other third-parties, couldexpose us, our customers, or other third-parties affected to a risk of loss or misuse of this information, result in litigation and potential liability for us, damageour brand and reputation, or otherwise harm our business. In addition, we rely in certain limited capacities on third-party data management providers whosepossible security problems and security vulnerabilities may have similar effects on us.
We are subject to laws, rules, and regulations in the U.S. and other countries relating to the collection, use, and
18
Table of Contents
security of user data. Our ability to execute transactions and to possess and use personal information and data in conducting our business subjects us tolegislative and regulatory burdens that may require us to notify customers or employees of a data security breach. We have incurred, and will continue toincur, significant expenses to comply with mandatory privacy and security standards and protocols imposed by law, regulation, industry standards, orcontractual obligations.
• Our performance could be adversely affected by our failure to hedge effectively our exposure to fluctuations in foreign currency exchange ratesand interest rates.
We utilize derivative instruments to hedge our exposure to fluctuations in foreign currency exchange rates and interest rates. Some of these instruments andcontracts may involve elements of market and credit risk in excess of the amounts recognized in our financial statements. If we are not successful inmonitoring our foreign exchange exposures and conducting an effective hedging program, our foreign currency hedging activities may not offset the impact offluctuations in currency exchange rates on our future results of operations and financial position.
• The expiration of tax holidays or favorable tax rate structures, or unfavorable outcomes in tax audits and other tax compliance matters, couldresult in an increase in our current tax expense or our effective income tax rate in the future.
Portions of our operations are subject to a reduced tax rate or are free of tax under various tax holidays that expire in whole or in part from time to time. Manyof these holidays may be extended when certain conditions are met, or terminated if certain conditions are not met. If the tax holidays are not extended, or ifwe fail to satisfy the conditions of the reduced tax rate, then our effective tax rate would increase in the future. Our effective tax rate could also increase if ourgeographic sales mix changes. We are under audit in various tax jurisdictions. An unfavorable outcome in certain of these matters could result in a substantialincrease to our tax expense. In addition, changes in tax laws (including U.S. taxes on foreign operations) could adversely affect our operations andprofitability.
• Our profitability could suffer from any impairment of our portfolio investments. We invest a significant portion of our available funds in a portfolio consisting primarily of debt securities of various types and maturities pending thedeployment of these funds in our business. Our earnings performance could suffer from any impairment of our investments. Our portfolio securities generallyare classified as available-for-sale and are recorded on our Consolidated Statements of Financial Position at fair value. If any such investments experiencemarket price declines, we may recognize in earnings the decline in the fair market value of such investments below their cost or carrying value when thedecline is determined to be other than temporary.
• Unfavorable results of legal proceedings could harm our business and result in substantial costs. We are involved in various claims, suits, investigations, and legal proceedings that arise from time to time in the ordinary course of our business, includingthose described elsewhere in this report. Additional legal claims or regulatory matters may arise in the future and could involve stockholder, consumer,government regulatory and compliance, intellectual property, antitrust, tax, and other issues on a global basis. Litigation is inherently unpredictable.Regardless of the merits of the claims, litigation may be both time-consuming and disruptive to our business. We could incur judgments or enter intosettlements of claims that could adversely affect our operating results or cash flows in a particular period. In addition, our business, operating results, andfinancial condition could be adversely affected if any infringement or other intellectual property claim made against us by any third-party is successful, or ifwe fail to develop non-infringing technology or license the proprietary rights on commercially reasonable terms and conditions.
• Our success depends on our ability to attract, retain, and motivate our key employees. We rely on key personnel, including our CEO and executive leadership team, to support anticipated continued rapid international growth and increasinglycomplex product and services offerings. We may not be able to attract, retain, and motivate the key professional, technical, marketing, and staff resources weneed.
• We face risks relating to any inability to maintain strong internal controls. If management is not successful in maintaining a strong internal control environment, investors could lose confidence in our reported financial information.This could lead to a decline in our stock price, limit our ability to access the
19
Table of Contents
capital markets in the future, and require us to incur additional costs to improve our internal control systems and procedures.
• Current or future environmental and safety laws, or other regulatory laws, may harm our business. Our operations are subject to environmental and safety regulation in all of the areas in which we conduct business. Our product design and procurementoperations must comply with new and future requirements relating to climate change laws and regulations, materials composition, sourcing, energy efficiencyand collection, recycling, treatment, transportation, and disposal of our electronics products, including restrictions on mercury, lead, cadmium, lithium metal,lithium ion, and other substances. If we fail to comply with applicable rules and regulations regarding the transportation, source, use, and sale of suchregulated substances, we could be subject to liability. The costs and timing of costs under environmental and safety laws are difficult to predict, but couldhave an unfavorable impact on our business.
In addition, we are subject to provisions of the Dodd-Frank Wall Street Reform and Consumer Protection Act intended to improve transparency andaccountability concerning the supply of minerals originating from the conflict zones of the Democratic Republic of Congo or adjoining countries. We willincur costs to comply with the new disclosure requirements of this law and may realize other costs relating to the sourcing and availability of minerals used inour products. Further, since our supply chain is complex, we may face reputational harm if our customers or other stakeholders conclude that we are unable toverify sufficiently the origins of the minerals used in the products we sell.
• Armed hostilities, terrorism, natural disasters, or public health issues could harm our business. Armed hostilities, terrorism, natural disasters, or public health issues, whether in the U.S. or abroad, could cause damage or disruption to us, our suppliers, orour customers, or could create political or economic instability, any of which could harm our business. These events could cause a decrease in demand for ourproducts, could make it difficult or impossible for us to deliver products or for our suppliers to deliver components, and could create delays and inefficienciesin our supply chain. The earthquake and tsunami in Japan and severe flooding in Thailand which occurred during Fiscal 2012 caused damage to infrastructure and factories thatdisrupted the supply chain for a variety of components used in our products. In particular, the flooding in Thailand resulted in a significant shortage in thesupply of hard disk drives that has adversely affected our operations. If we are unsuccessful in our continuing efforts to minimize the impact of these eventson our customers and operations, our business and financial results could suffer.
ITEM 1B — UNRESOLVED STAFF COMMENTS
None.
20
Table of Contents
ITEM 2 — PROPERTIES
At February 3, 2012, we owned or leased a total of approximately 18.9 million square feet of office, manufacturing, and warehouse space worldwide,approximately 8.5 million square feet of which is located in the U.S. We owned approximately 58% of this space and leased the remaining 42%. Included inthese amounts are approximately 1.6 million square feet that is either vacant or sublet.
Our principal executive offices, including global headquarters, are located at One Dell Way, Round Rock, Texas. Our business centers, which includefacilities that contain operations for sales, technical support, administrative, and support functions, occupy 12.7 million square feet of space, of which we own46%. We own 2.6 million square feet of manufacturing space. In addition, our research and development centers are housed in 2.0 million square feet ofspace, of which we own 53%.
During Fiscal 2012, we opened a research and development center in Santa Clara, California as well as a data center in Washington. At February 3, 2012, abusiness center in Coimbatore, India was under construction. We believe that our existing properties are suitable and adequate for our current needs and thatwe can readily meet our requirements for additional space at competitive rates by extending expiring leases or by finding alternative space.
As discussed in “Part I — Item 1 — Business,” we have four operating segments identified as Large Enterprise, Public, SMB and Consumer. Because of theinterrelation of the products and services offered in each of these segments, we do not designate our properties to any segment. All four segments usesubstantially all of the properties at least in part, and we retain the flexibility to make future use of each of the properties available to each of the segments.
ITEM 3 — LEGAL PROCEEDINGS
The information required by this Item 3 is incorporated herein by reference to the information set forth under the caption “Legal Matters” in Note 10 of Notesto Consolidated Financial Statements included in “Part II — Item 8 — Financial Statements and Supplementary Data.”
ITEM 4 — MINE SAFETY DISCLOSURES
Not applicable.
21
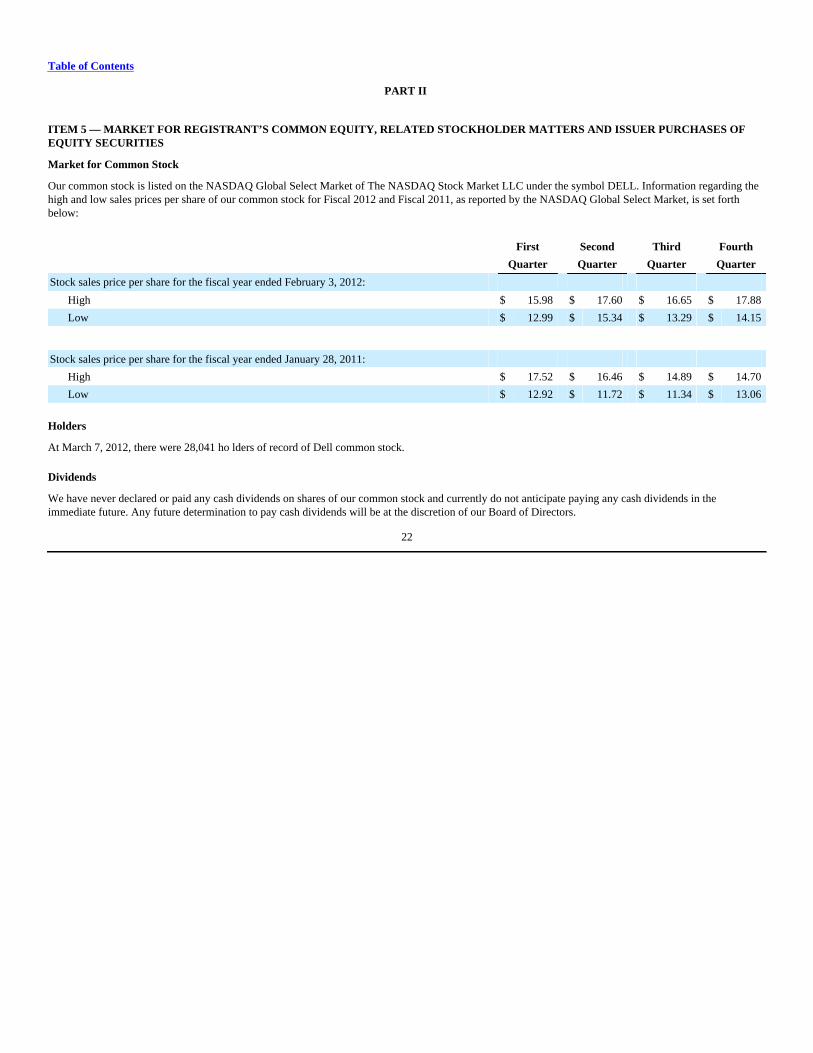
Table of Contents
PART II
ITEM 5 — MARKET FOR REGISTRANT’S COMMON EQUITY, RELATED STOCKHOLDER MATTERS AND ISSUER PURCHASES OFEQUITY SECURITIES
Market for Common Stock
Our common stock is listed on the NASDAQ Global Select Market of The NASDAQ Stock Market LLC under the symbol DELL. Information regarding thehigh and low sales prices per share of our common stock for Fiscal 2012 and Fiscal 2011, as reported by the NASDAQ Global Select Market, is set forthbelow:
First Second Third Fourth Quarter Quarter Quarter Quarter
Stock sales price per share for the fiscal year ended February 3, 2012:
High $ 15.98 $ 17.60 $ 16.65 $ 17.88
Low $ 12.99 $ 15.34 $ 13.29 $ 14.15
Stock sales price per share for the fiscal year ended January 28, 2011:
High $ 17.52 $ 16.46 $ 14.89 $ 14.70
Low $ 12.92 $ 11.72 $ 11.34 $ 13.06
Holders
At March 7, 2012, there were 28,041 ho lders of record of Dell common stock.
Dividends
We have never declared or paid any cash dividends on shares of our common stock and currently do not anticipate paying any cash dividends in theimmediate future. Any future determination to pay cash dividends will be at the discretion of our Board of Directors.
22
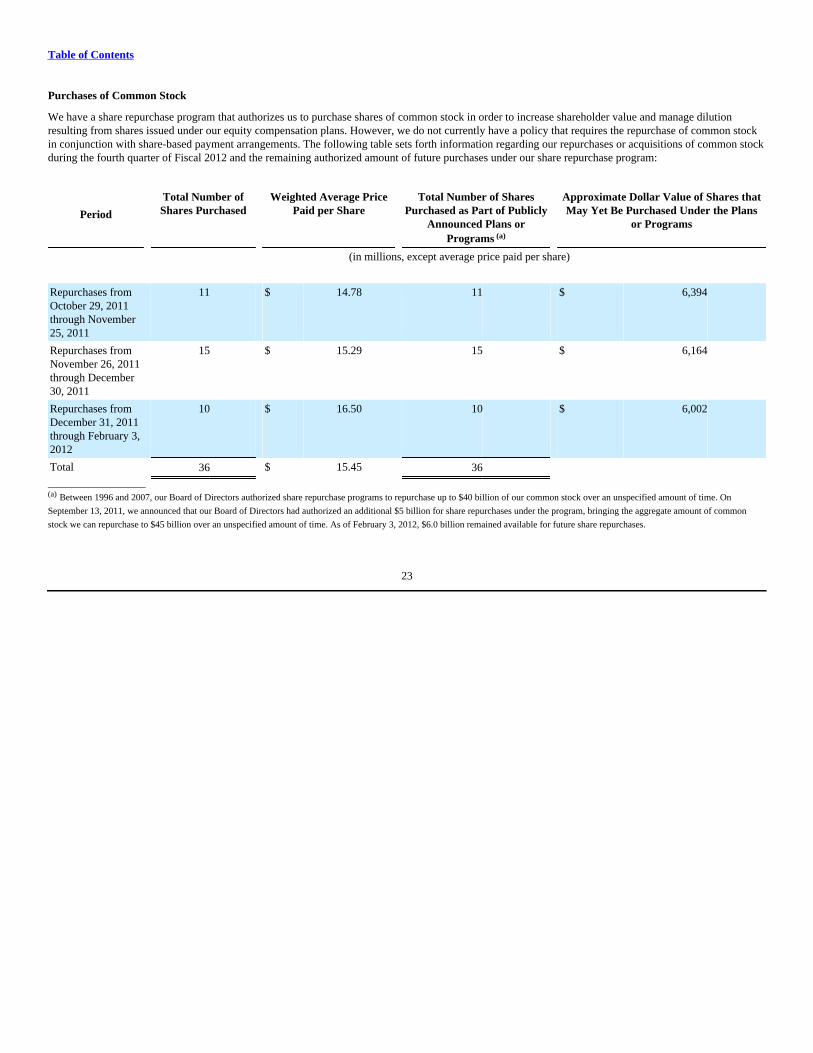
Table of Contents
Purchases of Common Stock
We have a share repurchase program that authorizes us to purchase shares of common stock in order to increase shareholder value and manage dilutionresulting from shares issued under our equity compensation plans. However, we do not currently have a policy that requires the repurchase of common stockin conjunction with share-based payment arrangements. The following table sets forth information regarding our repurchases or acquisitions of common stockduring the fourth quarter of Fiscal 2012 and the remaining authorized amount of future purchases under our share repurchase program:
Total Number ofShares Purchased
Weighted Average PricePaid per Share
Total Number of SharesPurchased as Part of Publicly
Announced Plans orPrograms (a)
Approximate Dollar Value of Shares thatMay Yet Be Purchased Under the Plans
or ProgramsPeriod
(in millions, except average price paid per share)
Repurchases fromOctober 29, 2011through November25, 2011
11 $ 14.78 11 $ 6,394
Repurchases fromNovember 26, 2011through December30, 2011
15 $ 15.29 15 $ 6,164
Repurchases fromDecember 31, 2011through February 3,2012
10 $ 16.50 10 $ 6,002
Total 36 $ 15.45 36 _____________________(a) Between 1996 and 2007, our Board of Directors authorized share repurchase programs to repurchase up to $40 billion of our common stock over an unspecified amount of time. On
September 13, 2011, we announced that our Board of Directors had authorized an additional $5 billion for share repurchases under the program, bringing the aggregate amount of common
stock we can repurchase to $45 billion over an unspecified amount of time. As of February 3, 2012, $6.0 billion remained available for future share repurchases.
23
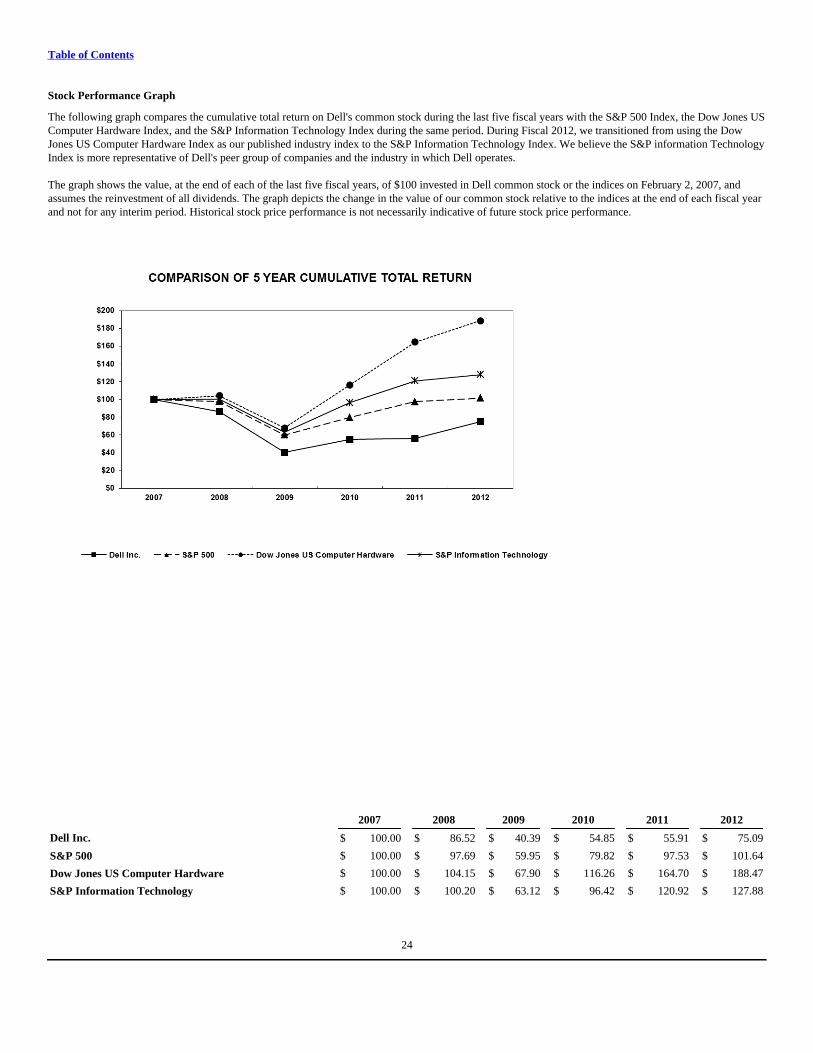
Table of Contents
Stock Performance Graph
The following graph compares the cumulative total return on Dell's common stock during the last five fiscal years with the S&P 500 Index, the Dow Jones USComputer Hardware Index, and the S&P Information Technology Index during the same period. During Fiscal 2012, we transitioned from using the DowJones US Computer Hardware Index as our published industry index to the S&P Information Technology Index. We believe the S&P information TechnologyIndex is more representative of Dell's peer group of companies and the industry in which Dell operates.
The graph shows the value, at the end of each of the last five fiscal years, of $100 invested in Dell common stock or the indices on February 2, 2007, andassumes the reinvestment of all dividends. The graph depicts the change in the value of our common stock relative to the indices at the end of each fiscal yearand not for any interim period. Historical stock price performance is not necessarily indicative of future stock price performance.
2007 2008 2009 2010 2011 2012
Dell Inc. $ 100.00 $ 86.52 $ 40.39 $ 54.85 $ 55.91 $ 75.09
S&P 500 $ 100.00 $ 97.69 $ 59.95 $ 79.82 $ 97.53 $ 101.64
Dow Jones US Computer Hardware $ 100.00 $ 104.15 $ 67.90 $ 116.26 $ 164.70 $ 188.47
S&P Information Technology $ 100.00 $ 100.20 $ 63.12 $ 96.42 $ 120.92 $ 127.88
24

Table of Contents
ITEM 6 — SELECTED FINANCIAL DATA
The following selected consolidated financial data for our company should be read in conjunction with “Part II — Item 7 — Management’s Discussion andAnalysis of Financial Condition and Results of Operations” and “Part II — Item 8 — Financial Statements and Supplementary Data” and are derived from ouraudited consolidated financial statements included in “Part II — Item 8 — Financial Statements and Supplementary Data” or in our previously filed AnnualReports on Form 10-K.
Fiscal Year Ended
February 3,2012
January 28,2011
January 29,2010
January 30,2009
February 1,2008
(in millions, except per share data)
Results of Operations:
Net revenue $ 62,071 $ 61,494 $ 52,902 $ 61,101 $ 61,133
Gross margin $ 13,811 $ 11,396 $ 9,261 $ 10,957 $ 11,671
Operating income $ 4,431 $ 3,433 $ 2,172 $ 3,190 $ 3,440
Income before income taxes $ 4,240 $ 3,350 $ 2,024 $ 3,324 $ 3,827
Net income $ 3,492 $ 2,635 $ 1,433 $ 2,478 $ 2,947
Earnings per share:
Basic $ 1.90 $ 1.36 $ 0.73 $ 1.25 $ 1.33
Diluted $ 1.88 $ 1.35 $ 0.73 $ 1.25 $ 1.31
Number of weighted-average shares outstanding:
Basic 1,838 1,944 1,954 1,980 2,223
Diluted 1,853 1,955 1,962 1,986 2,247
Cash Flow & Balance Sheet Data:
Net cash provided by operating activities $ 5,527 $ 3,969 $ 3,906 $ 1,894 $ 3,949
Cash, cash equivalents and investments $ 18,222 $ 15,069 $ 11,789 $ 9,546 $ 9,532
Total assets $ 44,533 $ 38,599 $ 33,652 $ 26,500 $ 27,561
Short-term borrowings $ 2,867 $ 851 $ 663 $ 113 $ 225
Long-term debt $ 6,387 $ 5,146 $ 3,417 $ 1,898 $ 362
Total stockholders’ equity $ 8,917 $ 7,766 $ 5,641 $ 4,271 $ 3,735
25
Table of Contents
ITEM 7 — MANAGEMENT’S DISCUSSION AND ANALYSIS OF FINANCIAL CONDITION AND RESULTS OF OPERATIONS
This section should be read in conjunction with “Part II — Item 8 — Financial Statements and Supplementary Data.”
INTRODUCTION
We are a leading integrated technology solutions provider in the IT industry. We built our reputation through listening to customers and developing solutionsthat meet customer needs. We are focused on providing long-term value creation through the delivery of customized solutions that make technology moreefficient, more accessible, and easier to manage. Our four customer-centric, global business segments are Large Enterprise, Public, Small and MediumBusiness, and Consumer. We also refer to our Large Enterprise, Public, and SMB segments as “Commercial.”
A key component of our business strategy is to continue shifting our portfolio to products and services that provide higher-value and recurring revenuestreams over time. As part of this strategy, we emphasize expansion of our enterprise solutions and services, which include servers, networking, storage, andservices. We believe the most attractive areas for profitable growth include data center and information management as well as client and cloud computing.Some of our most attractive growth opportunities for technology expansion are in emerging countries which include a vast majority of the world's population.In recent years, we have focused much of our investment in Growth Countries, with a particular focus on BRIC. Growth Countries now account for asignificant portion of our revenue and revenue from BRIC has continued to increase each year. Our strategic transformation has contributed to significant improvements in our operating margins. We have directed our client product development effortstowards streamlining our product portfolio and focusing on product leadership by developing next generation capabilities. We employ a collaborativeapproach to product design and development in which our engineers, with direct customer input, design innovative solutions and work with a global networkof technology companies to architect new system designs, influence the direction of future development, and integrate new technologies into our products.Through this collaborative, customer-focused approach, we strive to deliver new and relevant products and services to the market quickly and efficiently. Wecontinue to invest in the enhancement of our sales and marketing functions. Over time, we have added new distribution channels, such as retail, systemintegrators, value-added resellers, and distributors, to expand our access to more end-users around the world.
We supplement organic growth with a disciplined acquisition program targeting businesses that will expand our portfolio of higher-margin enterprisesolutions offerings. We emphasize acquisitions of companies with portfolios that we can leverage with our global customer base and distribution. Since thebeginning of Fiscal 2011, we acquired more than ten businesses that extended our core capabilities in a variety of enterprise solutions offerings, includingstorage, networking, systems management appliance, virtualized server and data center solutions, and software-as-a-service application integration, as well asenabled expansion of our customer financing activities. The comparability of our results of operations for Fiscal 2012, as compared to Fiscal 2011, is affectedby our Fiscal 2012 acquisitions, though the impact is not material. Our Fiscal 2012 and Fiscal 2011 results of operations, as compared to Fiscal 2010, areimpacted by our acquisition of Perot Systems Corporation ("Perot Systems") in November of 2009. See our Services discussion under "Results of Operations— Revenue of Operations — Revenue by Product and Services Categories" for more information about our acquisition of Perot Systems.
The successful execution of our business strategy is subject to a variety of risks and uncertainties, including those discussed in “Part I - Item 1A - RiskFactors.”
Fiscal Year Periods
Our fiscal year is the 52 or 53 week period ending on the Friday nearest January 31. Fiscal 2012 was a 53 week period that ended on February 3, 2012, whileFiscal 2011 and Fiscal 2010 were 52 week periods that ended on January 28, 2011, and January 29, 2010, respectively.
26
Table of Contents
Presentation of Supplemental Non-GAAP Financial Measures
In this management's discussion and analysis, we use supplemental measures of our performance, which are derived from our consolidated financialinformation but which are not presented in our consolidated financial statements prepared in accordance with accounting principles generally accepted in theUnited States of America (“GAAP”). These financial measures, which are considered “non-GAAP financial measures” under SEC rules, include our non-GAAP gross margin, non-GAAP operating expenses, non-GAAP operating income, non-GAAP net income and non-GAAP earnings per share. See “Resultsof Operations — Non-GAAP Financial Measures” below for information about our use of these non-GAAP financial measures, including our reasons forincluding the measures, material limitations with respect to the usefulness of the measures, and a reconciliation of each non-GAAP financial measure to themost directly comparable GAAP financial measure.
27
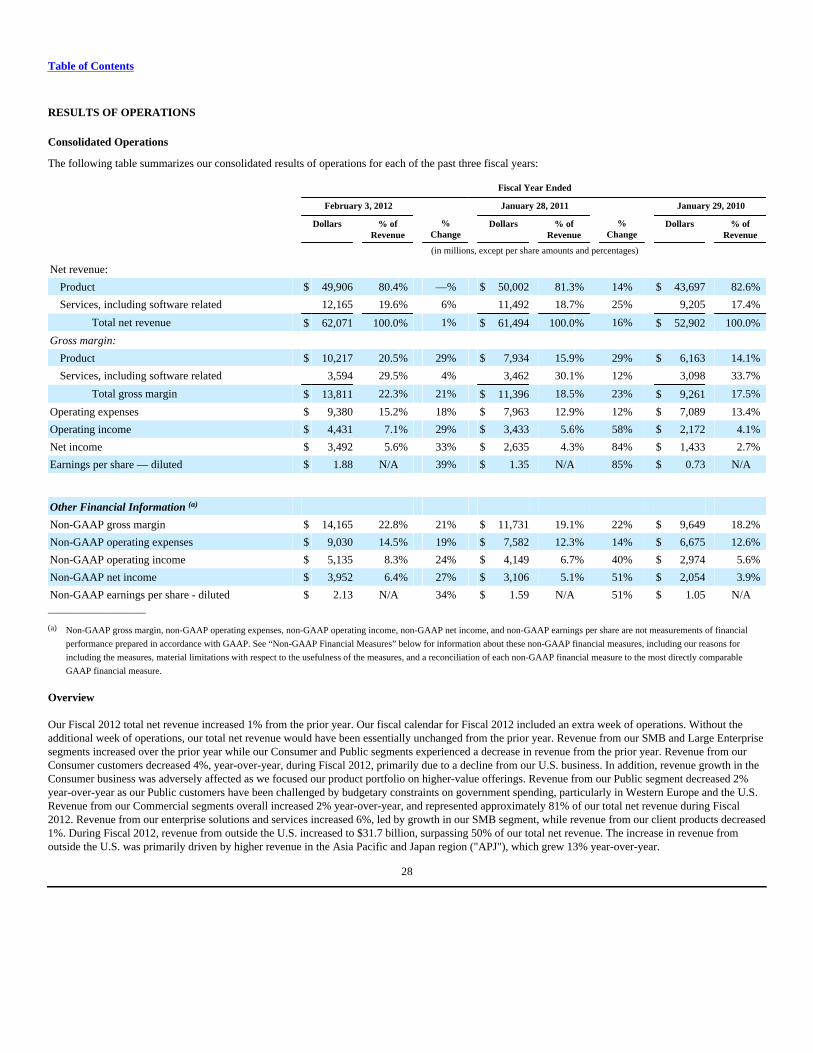
Table of Contents
RESULTS OF OPERATIONS
Consolidated Operations
The following table summarizes our consolidated results of operations for each of the past three fiscal years:
Fiscal Year Ended
February 3, 2012 January 28, 2011 January 29, 2010
Dollars % ofRevenue
%Change
Dollars % ofRevenue
%Change
Dollars % ofRevenue
(in millions, except per share amounts and percentages)
Net revenue:
Product $ 49,906 80.4% —% $ 50,002 81.3% 14% $ 43,697 82.6%
Services, including software related 12,165 19.6% 6% 11,492 18.7% 25% 9,205 17.4%
Total net revenue $ 62,071 100.0% 1% $ 61,494 100.0% 16% $ 52,902 100.0%
Gross margin:
Product $ 10,217 20.5% 29% $ 7,934 15.9% 29% $ 6,163 14.1%
Services, including software related 3,594 29.5% 4% 3,462 30.1% 12% 3,098 33.7%
Total gross margin $ 13,811 22.3% 21% $ 11,396 18.5% 23% $ 9,261 17.5%
Operating expenses $ 9,380 15.2% 18% $ 7,963 12.9% 12% $ 7,089 13.4%
Operating income $ 4,431 7.1% 29% $ 3,433 5.6% 58% $ 2,172 4.1%
Net income $ 3,492 5.6% 33% $ 2,635 4.3% 84% $ 1,433 2.7%
Earnings per share — diluted $ 1.88 N/A 39% $ 1.35 N/A 85% $ 0.73 N/A
Other Financial Information (a)
Non-GAAP gross margin $ 14,165 22.8% 21% $ 11,731 19.1% 22% $ 9,649 18.2%
Non-GAAP operating expenses $ 9,030 14.5% 19% $ 7,582 12.3% 14% $ 6,675 12.6%
Non-GAAP operating income $ 5,135 8.3% 24% $ 4,149 6.7% 40% $ 2,974 5.6%
Non-GAAP net income $ 3,952 6.4% 27% $ 3,106 5.1% 51% $ 2,054 3.9%
Non-GAAP earnings per share - diluted $ 2.13 N/A 34% $ 1.59 N/A 51% $ 1.05 N/A_____________________
(a) Non-GAAP gross margin, non-GAAP operating expenses, non-GAAP operating income, non-GAAP net income, and non-GAAP earnings per share are not measurements of financial
performance prepared in accordance with GAAP. See “Non-GAAP Financial Measures” below for information about these non-GAAP financial measures, including our reasons for
including the measures, material limitations with respect to the usefulness of the measures, and a reconciliation of each non-GAAP financial measure to the most directly comparable
GAAP financial measure.
Overview
Our Fiscal 2012 total net revenue increased 1% from the prior year. Our fiscal calendar for Fiscal 2012 included an extra week of operations. Without theadditional week of operations, our total net revenue would have been essentially unchanged from the prior year. Revenue from our SMB and Large Enterprisesegments increased over the prior year while our Consumer and Public segments experienced a decrease in revenue from the prior year. Revenue from ourConsumer customers decreased 4%, year-over-year, during Fiscal 2012, primarily due to a decline from our U.S. business. In addition, revenue growth in theConsumer business was adversely affected as we focused our product portfolio on higher-value offerings. Revenue from our Public segment decreased 2%year-over-year as our Public customers have been challenged by budgetary constraints on government spending, particularly in Western Europe and the U.S.Revenue from our Commercial segments overall increased 2% year-over-year, and represented approximately 81% of our total net revenue during Fiscal2012. Revenue from our enterprise solutions and services increased 6%, led by growth in our SMB segment, while revenue from our client products decreased1%. During Fiscal 2012, revenue from outside the U.S. increased to $31.7 billion, surpassing 50% of our total net revenue. The increase in revenue fromoutside the U.S. was primarily driven by higher revenue in the Asia Pacific and Japan region ("APJ"), which grew 13% year-over-year.
28

Table of Contents
During Fiscal 2012, our consolidated operating income as a percentage of net revenue increased 150 basis points to 7.1%. The increase in operating incomepercentage was primarily driven by improved product gross margins, the effect of which was partially offset by higher selling, general, and administrativeexpenses, and to a lesser extent, an increase in research, development, and engineering expenditures. Operating income as a percentage of net revenue fromour Commercial segments increased 130 basis points to 10.3% year-over-year during Fiscal 2012, while our Consumer operating income percentage increased220 basis points to 2.7%.
Our improved profitability for Fiscal 2012 was in part due to growth in our enterprise solutions and services business. For Fiscal 2012, enterprise solutionsand services revenue grew 6% year-over-year to $18.6 billion, while gross margins generated from this category grew 10% year-over-year. We alsosubstantially improved the profitability of our client product business in Fiscal 2012 by simplifying our product offerings, continuing to optimize our supplychain, and shifting our revenue mix to higher-value products. We will remain focused on growing our revenue and profitability by continuing our efforts toprovide IT solutions to our customers in areas such as enterprise solutions and services. In addition, we will continue to utilize our flexible supply chain toenhance the profitability of our client products.
As of February 3, 2012, we had $18.2 billion of total cash, cash equivalents, and investments, compared to $15.1 billion as of January 28, 2011. During Fiscal2012, we continued to maintain an efficient cash conversion cycle as well as strong cash and investment positions. Cash flow from operations was $5.5billion, $ 4.0 billion, and $3.9 billion during Fiscal 2012, Fiscal 2011, and Fiscal 2010, respectively. As of February 3, 2012, we had $9.3 billion in total debt,compared to $6.0 billion in total debt as of January 28, 2011.
In the third quarter of Fiscal 2012, several regions of Thailand experienced severe flooding, causing damage to infrastructure and factories that havesignificantly impacted the hard disk drive ("HDD") supply chain. Although we were effective in shaping demand and pricing for hard drive cost increases inthe fourth quarter of Fiscal 2012, we were impacted by the available mix of hard drives, which affected the product configuration mix we were able to sell.We prioritized high end-drives to our strategic customers, which reduced profitability in our Consumer segment. During the fourth quarter of Fiscal 2012, weentered into purchase commitments with certain HDD suppliers to ensure continuity of supply for these components. We expect the impact of the HDDsituation to improve as we move through Fiscal 2013. See "Liquidity, Capital Commitments, and Contractual Cash Obligations — Contractual CashObligations" for more information about our purchase commitments.
We believe that we will continue to profitably grow revenue in the long- term through the expansion of our enterprise solutions, services, and productofferings. We will balance revenue growth with the objective of enhancing operating income and cash flow. We expect that total revenue growth in the firsthalf of Fiscal 2013 will be challenging, given the existing weakness in our Public segment as well as the uncertain macroeconomic environment.
Revenue
Fiscal 2012 compared to Fiscal 2011
• Product Revenue — Product revenue for Fiscal 2012 was essentially unchanged from the prior year. Product revenue increases in our Large Enterpriseand SMB segments were offset by decreases from our Public and Consumer segments. The decline in product revenue from our Public segment wasdriven by weakened demand, while the decrease in our Consumer segment revenue was largely attributable to lower average selling prices, partiallyoffset by an increase in sales of higher-value products.
• Services Revenue, including software related — Services revenue, including software related, increased year-over-year by 6% for Fiscal 2012. Ourservices revenue performance during Fiscal 2012 was attributable to a 8% year-over-year increase in services revenue, excluding software related, andan increase of 1% in software related revenue. All of our Commercial segments experienced increases in services revenue while Consumer servicesrevenue decreased.
At a regional level, revenue from outside the U.S. increased 7% to $31.7 billion and represented 51% of total net revenue while revenue from the U.S.decreased 5% to $30.4 billion. Revenue from Growth Countries increased 12% overall year-over-year. In particular, revenue from BRIC increased 15% year-over-year during Fiscal 2012 and represented 14.2% of our total net revenue for Fiscal 2012, compared to 12.3% for the prior year. We are continuing toexpand into these and other emerging countries that represent the vast majority of the world's population, tailor solutions to meet specific regional needs, andenhance relationships to provide customer choice and flexibility.
We manage our business on a U.S. dollar basis and factor foreign currency exchange rate movements into our pricing decisions. In addition, we utilize acomprehensive hedging strategy intended to mitigate the impact of foreign currency volatility over
29
Table of Contents
time. During Fiscal 2012, we experienced favorable changes in foreign currency exchange rates, though the impact of these currency movements was notmaterial to our results for the period.
Fiscal 2011 compared to Fiscal 2010
• Product Revenue — Product revenue increased year-over-year by 14% for Fiscal 2011. Our product revenue performance was primarily attributable toimproved customer demand as a result of increased global IT spending from our Commercial customers across all product categories as well as a shift inmix to higher priced products. See "Revenue by Product and Services Categories" for further information regarding the average selling prices of ourproducts.
• Services Revenue, including software related — Services revenue, including software related, increased year-over-year by 25% for Fiscal 2011. Ourservices revenue performance was attributable to a 36% year-over-year increase in services revenue, excluding software related, and an increase of 7% insoftware related services revenue during Fiscal 2011. The increase in services revenue was primarily due to our acquisition of Perot Systems in thefourth quarter of Fiscal 2010, which was integrated into our Public and Large Enterprise segments.
During Fiscal 2011, revenue from the U.S. increased 14% to $31.9 billion and represented 52% of total net revenue. Revenue from outside the U.S. increased19% to $29.6 billion. Revenue from BRIC increased 38% year-over-year for Fiscal 2011. As a result of our comprehensive hedging program, our results werenot materially impacted by foreign currency exchange rates in Fiscal 2011 or Fiscal 2010.
Gross Margin
Fiscal 2012 compared to Fiscal 2011
• Products — During Fiscal 2012, product gross margins increased in absolute dollars year-over-year and in gross margin percentage. Product grossmargin percentage increased to 20.5% for Fiscal 2012 from 15.9% for Fiscal 2011. A shift away from lower-value business, better supply chainexecution, a disciplined pricing strategy in a competitive environment, and favorable component cost conditions contributed to the year-over-yearincrease in product gross margin percentage for all of our segments. We have created a flexible supply chain that has improved our supply chainexecution, and we have simplified our product offerings.
• Services, including software related — During Fiscal 2012, our services gross margin increased in absolute dollars compared to the prior fiscal year,although our gross margin percentage decreased. The decrease in gross margin percentage for services, including software related, was primarily drivenby declines in gross margin percentages from our transactional and outsourcing services.
Total gross margin for Fiscal 2012 increased 21% on both a GAAP and non-GAAP basis. Total gross margin on a GAAP basis for Fiscal 2012 was $13.8billion, compared to $14.2 billion on a non-GAAP basis. Gross margin on a GAAP basis for Fiscal 2012 and Fiscal 2011 includes the effects of amortizationof intangible assets and of severance and facility action costs and acquisition-related charges. As set forth in the reconciliation under "Non-GAAP FinancialMeasures" below, these items are excluded from the calculation of non-GAAP gross margin for Fiscal 2012 and Fiscal 2011. Amortization of intangible assetsincluded in gross margin increased 10% to $305 million for Fiscal 2012. Severance and facility action costs and acquisition-related charges included in grossmargin decreased 14% to $49 million during Fiscal 2012. The overall decrease in severance and facility action costs and acquisition-related charges wasprimarily due to a decrease in charges related to facility closures in Fiscal 2011, which was slightly offset by an increase in acquisition-related charges duringFiscal 2012.
Fiscal 2011 compared to Fiscal 2010
• Products — During Fiscal 2011, product gross margins increased in absolute dollars year-over-year and in gross margin percentage. Product grossmargin percentage increased to 15.9% for Fiscal 2011 from 14.1% for Fiscal 2010. Reduced component costs, improved pricing discipline, better salesand supply chain execution, and improved quality resulting in favorable warranty experience contributed to the year-over-year increase in product grossmargin percentage.
• Services, including software related — During Fiscal 2011, our services gross margin increased in absolute dollars compared to the prior fiscal year,although our gross margin percentage decreased. The decrease in gross margin percentage for services, including software related, was primarily due to ahigher mix of outsourcing and project-related services.
Total gross margin for Fiscal 2011 increased 23% to $11.4 billion on a GAAP basis and 22% to $11.7 billion on a non-GAAP basis from Fiscal 2010. Grossmargin on a GAAP basis for Fiscal 2011 and Fiscal 2010 includes the effects of amortization of intangible assets and of severance and facility action costsand acquisition-related charges. As set forth in the reconciliation
30
Table of Contents
under "Non-GAAP Financial Measures" below, these items are excluded from the calculation of non-GAAP gross margin for Fiscal 2011 and Fiscal 2010.Amortization of intangible assets included in gross margin increased 84% to $278 million for Fiscal 2011. The increase in amortization of intangibles forFiscal 2011 was primarily attributable to an increase in intangible assets of $1.2 billion in Fiscal 2010 related to our acquisition of Perot Systems. Severanceand facility action costs and acquisition-related charges included in gross margin decreased 76% to $57 million during Fiscal 2011. The overall decrease inseverance and facility action costs and acquisition-related charges was due to a decrease in cost reduction activities from Fiscal 2010.
Vendor Rebate Programs
Our gross margin is affected by our ability to achieve competitive pricing with our vendors and contract manufacturers, including through our negotiation of avariety of vendor rebate programs to achieve lower net costs for the various components we include in our products. Under these programs, vendors provideus with rebates or other discounts from the list prices for the components, which are generally elements of their pricing strategy. Vendor rebate programs areonly one element of the costs we negotiate for our product components. We account for rebates and other discounts as a reduction in cost of net revenue. Ourtotal net cost includes supplier list prices reduced by vendor rebates and other discounts. We manage our costs on a total net cost basis.
The terms and conditions of our vendor rebate programs are largely based on product volumes and are generally not long-term in nature, but instead aretypically negotiated at the beginning of each quarter. Because of the fluid nature of these ongoing negotiations, which reflect changes in the competitiveenvironment, the timing and amount of rebates and other discounts we receive under the programs may vary from period to period. Since we manage ourcomponent costs on a total net cost basis, any fluctuations in the timing and amount of rebates and other discounts we receive from vendors may notnecessarily result in material changes to our gross margin. We monitor our component costs and seek to address the effects of any changes to terms that mightarise under our vendor rebate programs. Our gross margins for Fiscal 2012, Fiscal 2011 and Fiscal 2010, were not materially affected by any changes to theterms of our vendor rebate programs, as the amounts we received under these programs were generally stable relative to our total net cost. We are not awareof any significant programmatic changes to vendor pricing and rebate programs that will impact our results in the near term.
In addition, we have pursued legal action against certain vendors and are currently involved in negotiations with other vendors regarding their past pricingpractices. We have negotiated settlements with some of these vendors and may have additional settlements in future quarters. During Fiscal 2012, negotiatedvendor settlements, including settlements related to past pricing practices, resulted in a net increase to our Consolidated Gross Margin of approximately $70million. These settlements are allocated to our segments based on the relative amount of affected vendor products used by each segment.
31

Table of Contents
Operating Expenses
The following table presents information regarding our operating expenses during each of the past three fiscal years:
Fiscal Year Ended
February 3, 2012 January 28, 2011 January 29, 2010
Dollars % ofRevenue
%Change
Dollars % ofRevenue
%Change
Dollars % ofRevenue
(in millions, except percentages)
Operating expenses:
Selling, general, and administrative $ 8,524 13.7% 17% $ 7,302 11.9% 13% $ 6,465 12.2%
Research, development, and engineering 856 1.5% 30% 661 1.0% 6% 624 1.2%
Total operating expenses $ 9,380 15.2% 18% $ 7,963 12.9% 12% $ 7,089 13.4%
Other Financial Information
Non-GAAP operating expenses (a) $ 9,030 14.5% 19% $ 7,582 12.3% 14% $ 6,675 12.6%
(a) For a reconciliation of non-GAAP operating expenses to operating expenses prepared in accordance with GAAP, see “Non-GAAP Financial Measures” below.
Fiscal 2012 compared to Fiscal 2011
• Selling, General, and Administrative — During Fiscal 2012, selling, general, and administrative ("SG&A") expenses increased $1.2 billion year-over-year. The overall higher level of SG&A was largely attributable to the continued execution of our strategic transformation. Our strategic initiativeshave entailed organic investments in enterprise solution selling capabilities and other infrastructure spending as well as investments in enterpriseand services-focused acquisitions, which generally have higher expense structures. During Fiscal 2012, compensation-related expenses, excludingseverance-related expenses, increased approximately $967 million due to a 6% year-over-year increase in headcount, which was driven by ourorganic and inorganic investments. We also experienced a year-over-year increase of $175 million in advertising, promotional, and other selling-related expenses. In addition, higher SG&A expenses for Fiscal 2012 reflected increases in acquisition-related charges, which were offset in part bydecreases in severance and facility action costs, discussed below.
• Research, Development, and Engineering — During Fiscal 2012, research, development, and engineering expenses were 1.5% of net revenue, comparedto 1.0% during the prior year. We manage our research, development, and engineering spending by targeting those innovations and products thatwe believe are most valuable to our customers and by relying upon the capabilities of our strategic relationships. We are increasing our focus onresearch and development and will continue to shift our investment in RD&E activities to support our initiatives that grow our enterprise solutionsand services offerings.
Total operating expenses for Fiscal 2012 increased 18% to $9.4 billion on a GAAP basis and 19% to $9.0 billion on a non-GAAP basis over Fiscal 2011.Operating expenses on a GAAP basis for Fiscal 2012 and Fiscal 2011 includes the effects of severance and facility action costs and acquisition-relatedcharges and amortization of intangible assets. These charges increased 45% to $350 million during Fiscal 2012 compared to Fiscal 2011, primarily due to anincrease in acquisition-related charges as a result of the larger acquisitions that were completed in Fiscal 2012 compared to Fiscal 2011. For Fiscal 2011,operating expenses on a GAAP basis also included $140 million in settlements we incurred related to an SEC investigation and a securities litigation matter.As set forth in the reconciliation under “Non-GAAP Financial Measures” below, non-GAAP operating expenses for Fiscal 2012 and for Fiscal 2011 excludesthe effects of severance and facility action costs and acquisition related charges, amortization of intangible assets, and, for Fiscal 2011, the settlementsreferred to above.
Fiscal 2011 compared to Fiscal 2010
• Selling, General, and Administrative — During Fiscal 2011, SG&A expenses increased year-over-year, while SG&A expenses as a percentage of netrevenue decreased. The increase in SG&A expenses was primarily attributable to increases in compensation-related expenses and advertising andpromotional expenses. Compensation-related expenses, excluding severance-related expenses, increased approximately $679 million due to an increasein performance-based compensation expense, which is tied to revenue and operating income growth, and cash flow targets, and an increase in headcount.Our
32
Table of Contents
headcount increased approximately 6% due to our acquisitions and new hires related to our strategic initiatives. We also experienced a year-over-year increaseof $111 million in advertising and promotional expenses. These increases were offset in part by decreases in severance and facility action costs andacquisition-related charges, discussed below.
• Research, Development, and Engineering — During Fiscal 2011, research, development, and engineering expenses remained at approximately 1.0% ofrevenue, consistent with the prior fiscal year.
Total operating expenses for Fiscal 2011 increased 12% to $8.0 billion on a GAAP basis and 14% to $7.6 billion on a non-GAAP basis for Fiscal 2011 overFiscal 2010. Operating expenses on a GAAP basis for Fiscal 2011 and Fiscal 2010 includes the effects of severance and facility action costs and acquisition-related charges as well as amortization of intangible assets. For Fiscal 2011, operating expenses on a GAAP basis also includes $140 million in settlements weincurred related to an SEC investigation and a securities litigation matter. As set forth in the reconciliation under “Non-GAAP Financial Measures” below,non-GAAP operating expenses for Fiscal 2011 and for Fiscal 2010 excludes the effects of severance and facility action costs and acquisition-related charges,amortization of intangible assets, and, for Fiscal 2011, the settlements referred to above. Severance and facility action costs and acquisition-related chargesincluded in operating expenses decreased year-over-year by 53% to $170 million for Fiscal 2011. The decrease in severance and facility action costs andacquisition-related charges was primarily due to a decrease in cost reduction activities from Fiscal 2010. Amortization of intangibles included in operatingexpenses increased 31% to $71 million over Fiscal 2010, and was primarily related to our acquisition of Perot Systems in Fiscal 2010 as well as our Fiscal2011 acquisitions.
Operating and Net Income
Fiscal 2012 compared to Fiscal 2011
• Operating Income — During Fiscal 2012, operating income increased 29% to $4.4 billion on a GAAP basis and 24% to $5.1 billion on a non-GAAPbasis over Fiscal 2011. The increases were primarily attributable to the improved gross margins discussed above, the effect of which was partially offsetby an increase in selling and marketing costs.
• Net Income — During Fiscal 2012, net income increased 33% to $3.5 billion on a GAAP basis and 27% to $4.0 billion on a non-GAAP basis over Fiscal2011. Net income was positively impacted by increases in operating income and a lower effective tax rate, offset in part by unfavorable changes inInterest and other, net. Interest and other, net for Fiscal 2011 was favorably impacted by our receipt of a $72 million merger termination fee. This fee isexcluded from net income on a non-GAAP basis. See “Income and Other Taxes” and “Interest and Other, net” below for a discussion of our effective taxrates and Interest and other, net.
Fiscal 2011 compared to Fiscal 2010
• Operating Income — During Fiscal 2011, operating income increased 58% to $3.4 billion on a GAAP basis and 40% to $4.1 billion on a non-GAAPbasis over Fiscal 2010. The increases were primarily attributable to increased revenue, improved gross margins, and better operating leverage resultingfrom the increase in net revenue.
• Net Income — During Fiscal 2011, net income increased 84% to $2.6 billion on a GAAP basis and 51% to $3.1 billion on a non-GAAP basis over Fiscal2010. Net income was positively impacted by increases in operating income and a lower effective income tax rate. In addition, on a GAAP basis, Interestand other, net increased favorably by 44% for Fiscal 2011 due primarily to a $72 million merger termination fee that we received during the third quarterof Fiscal 2011. See “Income and Other Taxes” and “Interest and Other, net” below for discussion of our effective tax rates and Interest and other, net.
33
Table of Contents
Non-GAAP Financial Measures
We use non-GAAP financial measures to supplement the financial information presented on a GAAP basis. We believe that excluding certain items from ourGAAP results allows our management to better understand our consolidated financial performance from period to period and in relationship to the operatingresults of our segments, as management does not believe that the excluded items are reflective of our underlying operating performance. We also believe thatexcluding certain items from our GAAP results allows our management to better project our future consolidated financial performance because our forecastsare developed at a level of detail different from that used to prepare GAAP-based financial measures. Moreover, we believe these non-GAAP financialmeasures will provide investors with useful information to help them evaluate our operating results by facilitating an enhanced understanding of our operatingperformance, and enabling them to make more meaningful period to period comparisons.
The non-GAAP financial measures presented in this report include non-GAAP gross margin, non-GAAP operating expenses, non-GAAP operating income,non-GAAP net income, and non-GAAP earnings per share. These non-GAAP financial measures, as defined by us, represent the comparable GAAP measuresadjusted to exclude severance and facility action costs and acquisition-related charges, amortization of purchased intangible assets related to acquisitions, thesettlements related to the SEC investigation and a securities litigation matter, which were both incurred during the first quarter of Fiscal 2011, and a mergertermination fee, which we received during the third quarter of Fiscal 2011, and for non-GAAP net income and non-GAAP earnings per share, the aggregateadjustment for income taxes related to the exclusion of such items. We provide more detail below regarding each of these items and our reasons for excludingthem. In future fiscal periods, we may exclude such items and may incur income and expenses similar to these excluded items. Accordingly, the exclusion ofthese items and other similar items in our non-GAAP presentation should not be interpreted as implying that these items are non-recurring, infrequent, orunusual.
There are limitations to the use of the non-GAAP financial measures presented in this report. Our non-GAAP financial measures may not be comparable tosimilarly titled measures of other companies. Other companies, including companies in our industry, may calculate the non-GAAP financial measuresdifferently than we do, limiting the usefulness of those measures for comparative purposes. In addition, items such as amortization of purchased intangibleassets represent the loss in value of intangible assets over time. The expense associated with this loss in value is not included in the non-GAAP financialmeasures and such measures, therefore, do not reflect the full economic effect of such loss. Further, items such as severance and facility action costs andacquisition-related charges that are excluded from the non-GAAP financial measures can have a material impact on earnings. Our management compensatesfor the foregoing limitations by relying primarily on our GAAP results and using non-GAAP financial measures supplementally or for projections whencomparable GAAP financial measures are not available. The non-GAAP financial measures are not meant to be considered as indicators of performance inisolation from or as a substitute for gross margin, operating expenses, operating income, net income, and earnings per share prepared in accordance withGAAP, and should be read only in conjunction with financial information presented on a GAAP basis. We provide below reconciliations of each non-GAAPfinancial measure to its most directly comparable GAAP financial measure, and encourage you to review the reconciliations in conjunction with thepresentation of the non-GAAP financial measures for each of the past three fiscal years.
The following is a summary of the costs and other items excluded from the most comparable GAAP financial measures to calculate the non-GAAP financialmeasures presented in this management's discussion and analysis:
• Severance and Facility Actions and Acquisition-related Costs — Severance and facility action costs are primarily related to facilities charges includingaccelerated depreciation and severance and benefits for employees terminated pursuant to cost synergies related to strategic acquisitions and actionstaken as part of a comprehensive review of costs. Acquisition-related charges are expensed as incurred and consist primarily of retention payments,integration costs, and other costs. Retention payments include stock-based compensation and cash incentives awarded to employees, which arerecognized over the vesting period. Integration costs primarily include IT costs related to the integration of IT systems and processes, costs related to theintegration of employees, costs related to full-time employees who are working on the integration, and consulting expenses. Severance and facilityactions and acquisition-related charges are inconsistent in amount and are significantly impacted by the timing and nature of these events. Therefore,although we may incur these types of expenses in the future, we believe that eliminating these charges for purposes of calculating the non-GAAPfinancial measures facilitates a more meaningful evaluation of our current operating performance and comparisons to our past operating performance.
• Amortization of Intangible Assets — Amortization of purchased intangible assets consists primarily of amortization of customer relationships, acquired
technology, non-compete covenants, and trade names purchased in connection with business acquisitions. We incur charges relating to the amortizationof these intangibles, and those charges are included in our Consolidated Financial Statements. Amortization charges for our purchased intangible assetsare inconsistent in
34
Table of Contents
amount from period to period and are significantly impacted by the timing and magnitude of our acquisitions. Consequently, we exclude these charges forpurposes of calculating the non-GAAP financial measures to facilitate a more meaningful evaluation of our current operating performance and comparisons toour past operating performance.
• Other Fees and Settlements — We also adjust our GAAP results for certain fees and settlements. During the third quarter of Fiscal 2011, we received a$72 million fee for termination of a merger agreement with us. During the first quarter of Fiscal 2011, we recorded a $100 million settlement amount forthe SEC investigation into certain of our accounting and financial matters, which was initiated in 2005, and incurred $40 million for a securities litigationclass action lawsuit that was filed against us during Fiscal 2007. We are excluding these fees and settlements for the purpose of calculating the non-GAAP financial measures because we believe these fees and settlements, while not unusual, are outside our ordinary course of business and do notcontribute to a meaningful evaluation of our current operating performance or comparisons to our past operating performance.
• Aggregate Adjustment for Income Taxes — The aggregate adjustment for income taxes is the estimated combined income tax effect for the itemsdescribed above. The tax effects are determined based on the jurisdictions where the items were incurred.
35

Table of Contents
The table below presents a reconciliation of each non-GAAP financial measure to the most comparable GAAP measure for each of the past three fiscal years:
Fiscal Year Ended
February 3,2012
% Change January 28,2011
% Change January 29, 2010
(in millions, except percentages)
GAAP gross margin $ 13,811 21% $ 11,396 23% $ 9,261
Non-GAAP adjustments:
Amortization of intangibles 305 278 151
Severance and facility actions and acquisition-related costs 49 57 237
Non-GAAP gross margin $ 14,165 21% $ 11,731 22% $ 9,649
GAAP operating expenses $ 9,380 18% $ 7,963 12% $ 7,089
Non-GAAP adjustments:
Amortization of intangibles (86) (71) (54)
Severance and facility actions and acquisition-related costs (264) (170) (360)
Other fees and settlements — (140) —
Non-GAAP operating expenses $ 9,030 19% $ 7,582 14% $ 6,675
GAAP operating income $ 4,431 29% $ 3,433 58% $ 2,172
Non-GAAP adjustments:
Amortization of intangibles 391 349 205
Severance and facility actions and acquisition-related costs 313 227 597
Other fees and settlements — 140 —
Non-GAAP operating income $ 5,135 24% $ 4,149 40% $ 2,974
GAAP net income $ 3,492 33% $ 2,635 84% $ 1,433
Non-GAAP adjustments:
Amortization of intangibles 391 349 205
Severance and facility actions and acquisition-related costs 313 227 597
Other fees and settlements — 68 —
Aggregate adjustment for income taxes (244) (173) (181)
Non-GAAP net income $ 3,952 27% $ 3,106 51% $ 2,054
GAAP earnings per share - diluted $ 1.88 39% $ 1.35 85% $ 0.73
Non-GAAP adjustments per share - diluted 0.25 0.24 0.32
Non-GAAP earnings per share - diluted $ 2.13 34% $ 1.59 51% $ 1.05
36
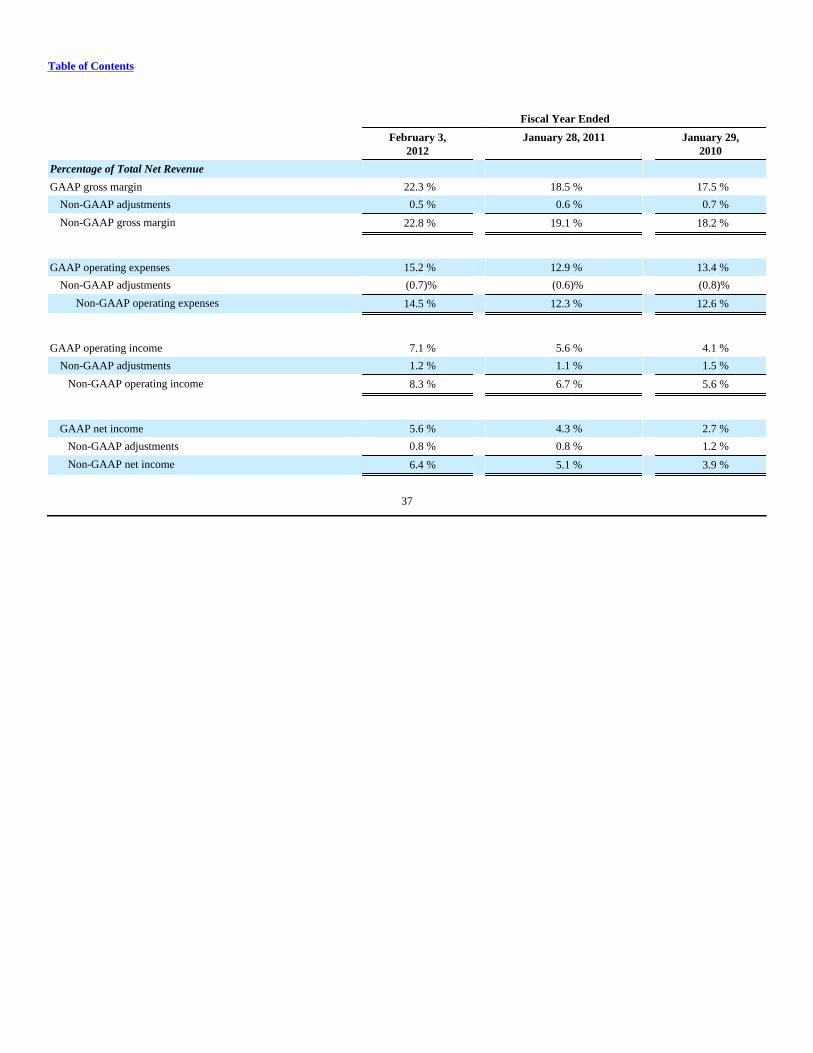
Table of Contents
Fiscal Year Ended
February 3,2012
January 28, 2011 January 29,2010
Percentage of Total Net Revenue
GAAP gross margin 22.3 % 18.5 % 17.5 %
Non-GAAP adjustments 0.5 % 0.6 % 0.7 %
Non-GAAP gross margin 22.8 % 19.1 % 18.2 %
GAAP operating expenses 15.2 % 12.9 % 13.4 %
Non-GAAP adjustments (0.7)% (0.6)% (0.8)%
Non-GAAP operating expenses 14.5 % 12.3 % 12.6 %
GAAP operating income 7.1 % 5.6 % 4.1 %
Non-GAAP adjustments 1.2 % 1.1 % 1.5 %
Non-GAAP operating income 8.3 % 6.7 % 5.6 %
GAAP net income 5.6 % 4.3 % 2.7 %
Non-GAAP adjustments 0.8 % 0.8 % 1.2 %
Non-GAAP net income 6.4 % 5.1 % 3.9 %
37

Table of Contents
Segment Discussion
Our four global business segments are Large Enterprise, Public, Small and Medium Business, and Consumer.
Severance and facility actions and acquisition-related charges, broad based, long-term incentive expenses, amortization of purchased intangible assets costs,and charges related to our settlement of the SEC investigation as well as a securities litigation class action lawsuit that were incurred during Fiscal 2011, arenot allocated to the reporting segments as management does not believe that these items are reflective of the underlying operating performance of thereporting segments. These costs totaled $1.1 billion for each of Fiscal 2012 and Fiscal 2011, and $1.2 billion for Fiscal 2010.
See Note 15 of the Notes to Consolidated Financial Statements included in “Part II — Item 8 — Financial Statements and Supplementary Data” foradditional information and reconciliation of segment revenue and operating income to consolidated revenue and operating income.
The following table presents our net revenue and operating income by our reportable global segments:
Fiscal Year Ended
February 3, 2012 January 28, 2011 January 29, 2010
Dollars % ofRevenue(a)
%Change
Dollars % ofRevenue(a)
%Change
Dollars % ofRevenue(a)
(in millions, except percentages)
Large Enterprise
Net revenue $ 18,457 30% 4 % $ 17,813 29% 25 % $ 14,285 27%
Operating income $ 1,854 10.0% 26 % $ 1,473 8.3% 80 % $ 819 5.7%
Public
Net revenue $ 16,548 27% (2)% $ 16,851 27% 16 % $ 14,484 27%
Operating income $ 1,644 9.9% 11 % $ 1,484 8.8% 9 % $ 1,361 9.4%
Small and Medium Business
Net revenue $ 15,166 24% 5 % $ 14,473 24% 20 % $ 12,079 23%
Operating income $ 1,665 11.0% 13 % $ 1,477 10.2% 42 % $ 1,040 8.6%
Consumer
Net revenue $ 11,900 19% (4)% $ 12,357 20% 3 % $ 12,054 23%
Operating income $ 324 2.7% 398 % $ 65 0.5% (39)% $ 107 0.9% _______________________(a) Operating income percentage of revenue is stated in relation to the respective segment.
Fiscal 2012 compared to Fiscal 2011
• Large Enterprise — During Fiscal 2012, Large Enterprise experienced a 4% year-over-year increase in revenue that was driven by increases in revenueacross all product lines, except for storage revenue and desktop PC revenue, which declined 30% and was essentially unchanged, respectively. Thedecline in storage revenue was primarily due to a decrease in the sale of third-party storage products as we shifted to sales of Dell-owned storagesolutions. Revenue from services and servers and networking increased 13% and 8%, year-over-year, respectively, while mobility revenue increased 6%and software and peripherals revenue increased 2% year-over-year. During Fiscal 2012, Large Enterprise's revenue from outside the U.S increased year-over year, while revenue from the U.S. decreased slightly.
During Fiscal 2012, Large Enterprise's operating income as a percentage of revenue increased 170 basis points year-over-year to 10.0%. The increase wasprimarily attributable to improvements in gross margin for our products, partially offset by an increase in operating expenses as a percentage of net revenue,resulting primarily from increased selling and marketing costs.
• Public — During Fiscal 2012, Public experienced a 2% year-over-year decrease in revenue which was primarily driven by a weakened demandenvironment. Revenue from desktop PCs, storage products, and mobility products decreased year-over-year by 7%, 16%, and 3%, respectively. Revenuefrom services, servers and networking, and software and peripherals increased 4%, 3%, and 1% year-over-year, respectively. The decline in Public'srevenue was primarily
38
Table of Contents
attributable to revenue decreases in the U.S. and Western Europe, largely because of budgetary constraints on public spending, the effects of which werepartially offset by revenue growth in APJ.
During Fiscal 2012, Public's operating income as a percentage of net revenue increased 110 basis points to 9.9%. The increase was primarily attributable toimprovements in gross margin for our products, partially offset by an increase in operating expenses as a percentage of net revenue, which was primarily dueto increased selling and marketing costs.
• Small and Medium Business — During Fiscal 2012, SMB experienced a 5% year-over-year increase in revenue that was primarily attributable to
increases from enterprise solutions and services and software and peripherals, partially offset by a slight decrease in mobility revenue. Revenue fromservers and networking, storage, and services increased 17%, 10%, and 21%, year-over-year, respectively. Revenue from software and peripherals anddesktop PCs increased 5% and 1%, year-over-year, respectively, while mobility product revenue declined 2% year-over-year. SMB experienced revenuegrowth across all regions.
During Fiscal 2012, SMB's operating income as a percentage of net revenue increased 80 basis points to 11.0%. The increase was primarily attributable toimprovements in gross margin for our products, partially offset by an increase in operating expenses as a percentage of net revenue, resulting principally fromincreased selling and marketing costs.
• Consumer — During Fiscal 2012, Consumer experienced a 4% year-over-year decrease in revenue. Revenue from all product and services categoriesdecreased during Fiscal 2012, except mobility product revenue, which increased slightly. The overall decrease in consumer revenue was driven by a 12%decline in revenue from desktop PCs and a 16% decline in revenue from software and peripherals. During Fiscal 2012, desktop PC unit sales declined4% and the average selling price of desktop PCs decreased 8%. The decline in software and peripherals revenue was due to the removal of lower-marginproducts from our portfolio of software and peripheral product offerings. Mobility revenue increased 1% due to an increase in units sold of 6%, whichwas largely driven by an overall increase in demand for our higher-value product lines. The revenue increase from the increase in units sold was largelyoffset by a decrease in average selling prices of 4%. Revenue from Consumer services decreased 7%, year-over-year, largely due to decreased sales fromour U.S. business as well as lower attach rates on our product sales. Revenue from the U.S. decreased 18% year-over-year, while revenue from outsideof the U.S. increased 10%. Revenue from Growth Countries increased 27% over the prior year.
For Fiscal 2012, Consumer's operating income percentage as a percentage of net revenue increased 220 basis points, year-over-year, to 2.7%. The increase inoperating income percentage was largely attributable to an increase in our product gross margin percentage due to a more favorable component costenvironment. In addition, during Fiscal 2012, we sold more units of higher-value client products, as compared to the prior year. Furthermore, we haveexperienced year-over-year increases in profitability from our customer financing arrangements, which benefited from improvements in consumer credit lossperformance on our owned and purchased portfolios. We believe the impact of this improved profitability from our financing arrangements will moderate infuture periods as our loss rates have stabilized and as our overall consumer financing portfolio is declining. The positive effects of these factors have beenpartially offset by a slight increase in operating expenses as a percentage of revenue year-over-year due to increased selling and marketing costs.
Fiscal 2011 compared to Fiscal 2010
• Large Enterprise — The year-over-year increase in Large Enterprise's revenue for Fiscal 2011 was mainly attributable to improved demand due to ahardware refresh among our Large Enterprise customers. Large Enterprise experienced year-over-year increases in revenue across all product lines duringFiscal 2011, except for storage revenue, which declined 5%. The decrease in storage revenue was primarily due to a decrease in the sale of third-partystorage products as we shifted more towards Dell-owned storage solutions. Revenue from servers and networking and services increased 33% and 35%,respectively. The increase in services revenue was largely due to the acquisition of Perot Systems in Fiscal 2010. Sales of client products generated largerevenue increases, with mobility and desktop PCs revenue increasing 33% and 25%, year-over-year, respectively. During Fiscal 2011, Large Enterprise'srevenue increased year-over-year across all regions.
During Fiscal 2011, operating income as a percentage of revenue increased 260 basis points year-over-year to 8.3%. The increase was mostly driven byimprovements in gross margin due to a shift in gross margin mix to enterprise solutions and services, improved component costs, better product quality, andimproved pricing discipline, particularly in the latter half of Fiscal 2011 for client products. Revenue increases and tighter spending controls on operatingexpenses resulted in a decrease in operating expenses as a percentage of net revenue.
• Public — During Fiscal 2011, Public experienced a year-over-year increase in revenue across all product and service categories. Services contributed thelargest increase, with a 69% increase in revenue over the prior year. The increase in
39
Table of Contents
services revenue was primarily a result of our acquisition of Perot Systems in Fiscal 2010. Revenue from servers and networking and storage increased 15%and 8%, year-over-year, respectively. Software and peripherals revenue increased 10% year-over-year. Revenue from mobility and desktop PCs increased 5%and 6%, year-over-year, respectively. Public's revenue grew during Fiscal 2011 across the Americas and the Asia-Pacific region, but declined in Europe dueto budgetary constraints on public spending.
Public's operating income percentage declined 60 basis points to 8.8% for Fiscal 2011 due to a year-over-year increase in operating expenses as a percentageof revenue, offset in part by a slight increase in gross margin percentage. The increase in operating expenses was a result of higher selling and marketingcosts.
• Small and Medium Business — During Fiscal 2011, SMB experienced a year-over-year increase in revenue with increases across all product and services
categories. Servers and networking, and storage revenue increased 26% and 21% year-over-year, respectively. Revenue from mobility and desktop PCsincreased 20% and 23%, year-over-year, respectively, while software and peripherals revenue increased 16% year-over-year. The improved demandenvironment was a major contributor to the increase in revenue for all product categories. Services revenue increased 6% year-over-year. SMB revenueexperienced year-over-year growth across all regions during Fiscal 2011. SMB revenue from BRIC grew 40% year-over-year.
Operating income percentage increased 160 basis points to 10.2%. The increase in operating income percentage was attributable to improved gross margins asa result of lower component costs and an improved pricing environment, as well as to a decrease in operating expenses as a percentage of revenue due totighter spending controls.
• Consumer — Consumer's revenue increased 3% year-over-year during Fiscal 201l. Revenue from all product and services categories decreased year-over-year for Fiscal 2011, except mobility. Consumer mobility revenue increased by 8% year-over-year, due to increase of 8% in notebook units sold,while revenue from desktops PCs decreased by 1% due to a decline in desktop PC units of 2%. Average selling prices for Consumer mobility anddesktop PCs were relatively flat year-over-year during Fiscal 2011. The increase in mobility revenue was due to improved unit demand for Consumermobility products. Consumer services decreased 11% year-over-year and software and peripherals revenue decreased 10% for the same period. At acountry level, our U.S. Consumer revenue decreased 9% year-over-year due to softer demand, while our non-U.S. regions experienced 16% revenuegrowth. Revenue from BRIC grew 46% year-over-year for Fiscal 2011.
For Fiscal 2011, Consumer's operating income percentage decreased 40 basis points year-over-year to 0.5%. The decrease in operating income percentage waslargely attributable to a decrease in gross margin percentage. Consumer gross margin decreased due to the shift in sales mix from direct sales to sales throughother distribution channels, which generally carry a lower gross margin, which was not entirely offset by decreases in operating expenses as a percentage ofrevenue. Operating expenses as a percentage of revenue remained relatively flat year-over-year. In the second half of Fiscal 2011, Dell Financial Services,which provides financing to our customers, experienced improved delinquency and charge-off rates that partially offset the decrease in Consumer 's operatingincome percentage. From time to time, we monetize aspects of the Consumer business model with arrangements with vendors and suppliers, such as revenuesharing arrangements, which we believe will continue to contribute to and improve Consumer's operating income over time. The impact of our vendor andsupplier arrangements was not material to our Fiscal 2011 results as compared to Fiscal 2010.
40
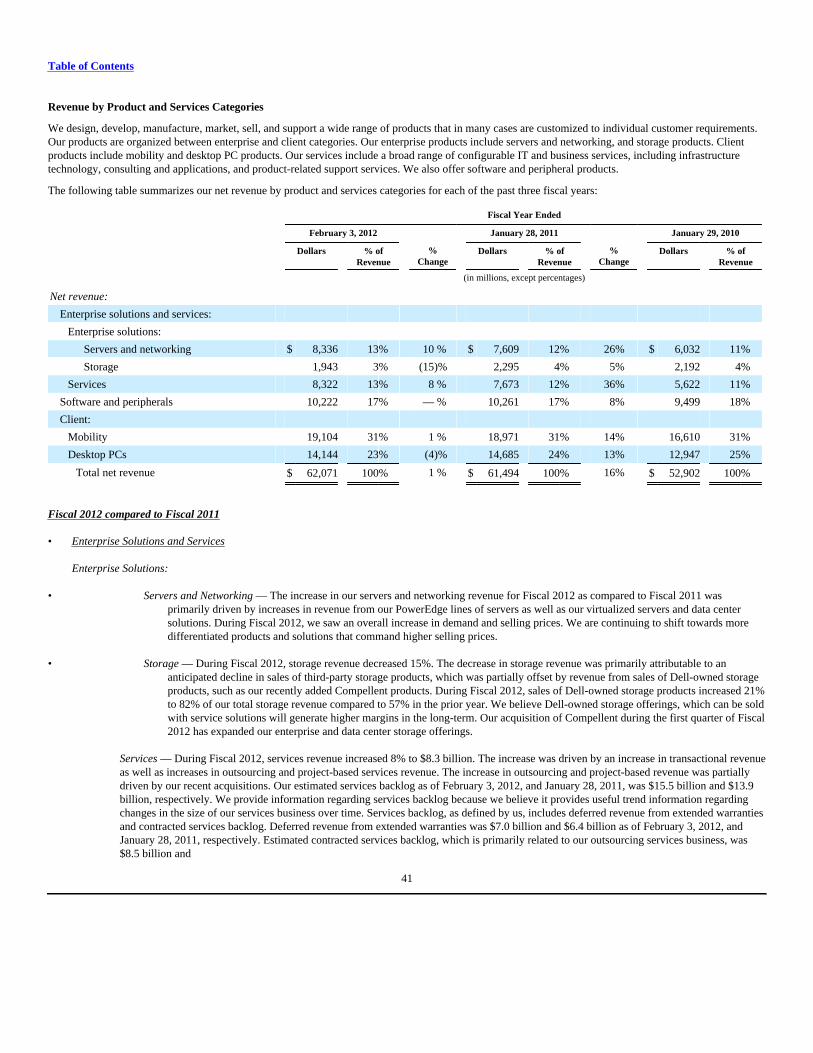
Table of Contents
Revenue by Product and Services Categories
We design, develop, manufacture, market, sell, and support a wide range of products that in many cases are customized to individual customer requirements.Our products are organized between enterprise and client categories. Our enterprise products include servers and networking, and storage products. Clientproducts include mobility and desktop PC products. Our services include a broad range of configurable IT and business services, including infrastructuretechnology, consulting and applications, and product-related support services. We also offer software and peripheral products.
The following table summarizes our net revenue by product and services categories for each of the past three fiscal years:
Fiscal Year Ended
February 3, 2012 January 28, 2011 January 29, 2010
Dollars % ofRevenue
%Change
Dollars % ofRevenue
%Change
Dollars % ofRevenue
(in millions, except percentages)
Net revenue:
Enterprise solutions and services:
Enterprise solutions:
Servers and networking $ 8,336 13% 10 % $ 7,609 12% 26% $ 6,032 11%
Storage 1,943 3% (15)% 2,295 4% 5% 2,192 4%
Services 8,322 13% 8 % 7,673 12% 36% 5,622 11%
Software and peripherals 10,222 17% — % 10,261 17% 8% 9,499 18%
Client:
Mobility 19,104 31% 1 % 18,971 31% 14% 16,610 31%
Desktop PCs 14,144 23% (4)% 14,685 24% 13% 12,947 25%
Total net revenue $ 62,071 100% 1 % $ 61,494 100% 16% $ 52,902 100%
Fiscal 2012 compared to Fiscal 2011
• Enterprise Solutions and Services
▪ Enterprise Solutions:
• Servers and Networking — The increase in our servers and networking revenue for Fiscal 2012 as compared to Fiscal 2011 wasprimarily driven by increases in revenue from our PowerEdge lines of servers as well as our virtualized servers and data centersolutions. During Fiscal 2012, we saw an overall increase in demand and selling prices. We are continuing to shift towards moredifferentiated products and solutions that command higher selling prices.
• Storage — During Fiscal 2012, storage revenue decreased 15%. The decrease in storage revenue was primarily attributable to ananticipated decline in sales of third-party storage products, which was partially offset by revenue from sales of Dell-owned storageproducts, such as our recently added Compellent products. During Fiscal 2012, sales of Dell-owned storage products increased 21%to 82% of our total storage revenue compared to 57% in the prior year. We believe Dell-owned storage offerings, which can be soldwith service solutions will generate higher margins in the long-term. Our acquisition of Compellent during the first quarter of Fiscal2012 has expanded our enterprise and data center storage offerings.
▪ Services — During Fiscal 2012, services revenue increased 8% to $8.3 billion. The increase was driven by an increase in transactional revenueas well as increases in outsourcing and project-based services revenue. The increase in outsourcing and project-based revenue was partiallydriven by our recent acquisitions. Our estimated services backlog as of February 3, 2012, and January 28, 2011, was $15.5 billion and $13.9billion, respectively. We provide information regarding services backlog because we believe it provides useful trend information regardingchanges in the size of our services business over time. Services backlog, as defined by us, includes deferred revenue from extended warrantiesand contracted services backlog. Deferred revenue from extended warranties was $7.0 billion and $6.4 billion as of February 3, 2012, andJanuary 28, 2011, respectively. Estimated contracted services backlog, which is primarily related to our outsourcing services business, was$8.5 billion and
41

Table of Contents
$7.5 billion as of February 3, 2012, and January 28, 2011, respectively. While there are no third-party standards or requirements governing the calculation ofcontracted services backlog, our estimated contracted services backlog represents signed contracts that are initially $2 million or more in total expectedrevenue with an initial contract term of at least 18 months. The terms of the signed services contracts included in our calculation of services backlog aresubject to change and are affected by terminations, changes in the scope of services, and changes to other factors that could impact the value of the contract.For these and other reasons, it is not reasonably practicable to estimate the portions for these backlog amounts that will ultimately be recognized as revenuewhen performance on the contracts is completed.
We continue to view services as a strategic growth opportunity and will continue to invest in our offerings and resources to focus on increasing our solutionssales.
• Software and Peripherals — Revenue from sales of software and peripherals (“S&P”) is derived from sales of Dell-branded printers, monitors (not soldwith systems), projectors, keyboards, mice, docking stations, and a multitude of third-party peripherals, including televisions, cameras, stand-alonesoftware sales and related support services, and other products. During Fiscal 2012, S&P revenue was effectively unchanged when compared to the prioryear. Revenue growth in S&P has been impacted as we continue to reduce our participation in non-strategic areas.
Software revenue from our S&P line of business, which includes stand-alone sales of software license fees and related post-contract customer support, isreported in services revenue, including software related, on our Consolidated Statements of Income. Software and related support services revenuerepresented 32% and 33% of services revenue, including software related, for Fiscal 2012 and Fiscal 2011, respectively.
• Client
▪ Mobility — Revenue from mobility products (which include notebooks, mobile workstations, smartphones, and tablets) increased 1% during Fiscal2012. This increase was primarily attributable to a 3% increase in notebook units sold, largely offset by a 3% decline in average selling price. Wehave been experiencing declines in revenue from our lower priced consumer notebooks, which have been largely offset by increases in revenuefrom our higher value XPS line of notebooks. During Fiscal 2012, Commercial mobility revenue was essentially unchanged year-over-year, whencompared to Fiscal 2011, while Consumer mobility revenue increased 1%.
▪ Desktop PCs — During Fiscal 2012, revenue from desktop PCs (which include desktop computer systems and fixed workstations) decreased 4% asthe average selling price as well as unit sales for our desktop PCs each decreased 2% when compared to Fiscal 2011.
Fiscal 2011 compared to Fiscal 2010
• Enterprise Solutions and Services
▪ Enterprise Solutions:
• Servers and Networking — The increase in our servers and networking revenue for Fiscal 2011 as compared to Fiscal 2010 was due todemand improvements across all Commercial segments. During Fiscal 2011, unit shipments increased 13% year-over-year, andaverage selling prices increased 12%, driven by an improved product mix that includes our new product lines.
• Storage — Storage revenue increased 5% for Fiscal 2011. The increase in Storage revenue was primarily driven by our SMB segmentwith a 21% increase year-over-year. EqualLogic performance was strong, with year-over-year revenue growth of 62%.
▪ Services — Services revenue increased $2.1 billion from $5.6 billion during Fiscal 2010 to $7.7 billion during Fiscal 2011, with revenue fromPerot Systems contributing a large proportion of the increase. As Perot Systems was acquired on November 3, 2009, our services results forFiscal 2010 include contributions from Perot Systems for one fiscal quarter. Perot Systems reported revenue of $1.9 billion for the threequarters ended September 30, 2009.
During Fiscal 2011, we experienced increases in our outsourcing and project-based revenues, due to our acquisition of Perot Systems, while transactionalrevenues remained relatively flat. Our estimated services
42
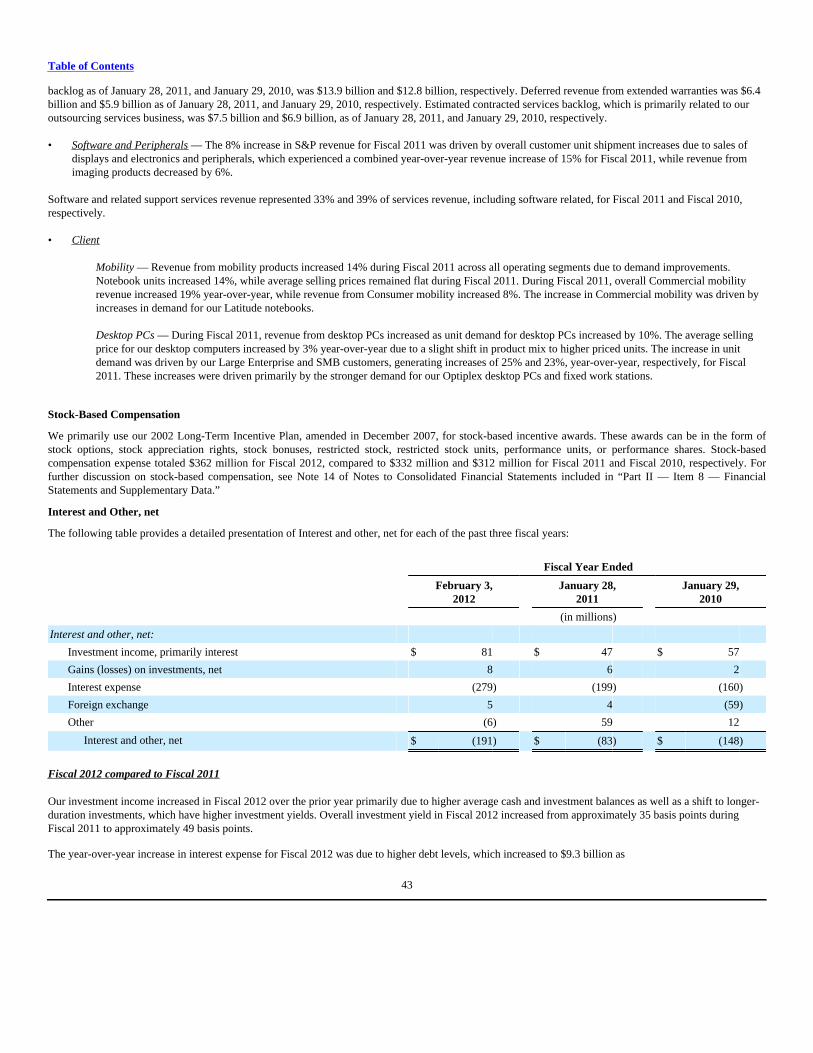
Table of Contents
backlog as of January 28, 2011, and January 29, 2010, was $13.9 billion and $12.8 billion, respectively. Deferred revenue from extended warranties was $6.4billion and $5.9 billion as of January 28, 2011, and January 29, 2010, respectively. Estimated contracted services backlog, which is primarily related to ouroutsourcing services business, was $7.5 billion and $6.9 billion, as of January 28, 2011, and January 29, 2010, respectively.
• Software and Peripherals — The 8% increase in S&P revenue for Fiscal 2011 was driven by overall customer unit shipment increases due to sales ofdisplays and electronics and peripherals, which experienced a combined year-over-year revenue increase of 15% for Fiscal 2011, while revenue fromimaging products decreased by 6%.
Software and related support services revenue represented 33% and 39% of services revenue, including software related, for Fiscal 2011 and Fiscal 2010,respectively.
• Client
▪ Mobility — Revenue from mobility products increased 14% during Fiscal 2011 across all operating segments due to demand improvements.Notebook units increased 14%, while average selling prices remained flat during Fiscal 2011. During Fiscal 2011, overall Commercial mobilityrevenue increased 19% year-over-year, while revenue from Consumer mobility increased 8%. The increase in Commercial mobility was driven byincreases in demand for our Latitude notebooks.
▪ Desktop PCs — During Fiscal 2011, revenue from desktop PCs increased as unit demand for desktop PCs increased by 10%. The average sellingprice for our desktop computers increased by 3% year-over-year due to a slight shift in product mix to higher priced units. The increase in unitdemand was driven by our Large Enterprise and SMB customers, generating increases of 25% and 23%, year-over-year, respectively, for Fiscal2011. These increases were driven primarily by the stronger demand for our Optiplex desktop PCs and fixed work stations.
Stock-Based Compensation
We primarily use our 2002 Long-Term Incentive Plan, amended in December 2007, for stock-based incentive awards. These awards can be in the form ofstock options, stock appreciation rights, stock bonuses, restricted stock, restricted stock units, performance units, or performance shares. Stock-basedcompensation expense totaled $362 million for Fiscal 2012, compared to $332 million and $312 million for Fiscal 2011 and Fiscal 2010, respectively. Forfurther discussion on stock-based compensation, see Note 14 of Notes to Consolidated Financial Statements included in “Part II — Item 8 — FinancialStatements and Supplementary Data.”
Interest and Other, net
The following table provides a detailed presentation of Interest and other, net for each of the past three fiscal years:
Fiscal Year Ended February 3,
2012 January 28,
2011 January 29,
2010
(in millions)
Interest and other, net:
Investment income, primarily interest $ 81 $ 47 $ 57
Gains (losses) on investments, net 8 6 2
Interest expense (279) (199) (160)
Foreign exchange 5 4 (59)
Other (6) 59 12
Interest and other, net $ (191) $ (83) $ (148)
Fiscal 2012 compared to Fiscal 2011
Our investment income increased in Fiscal 2012 over the prior year primarily due to higher average cash and investment balances as well as a shift to longer-duration investments, which have higher investment yields. Overall investment yield in Fiscal 2012 increased from approximately 35 basis points duringFiscal 2011 to approximately 49 basis points.
The year-over-year increase in interest expense for Fiscal 2012 was due to higher debt levels, which increased to $9.3 billion as
43
Table of Contents
of February 3, 2012, from $6.0 billion as of January 28, 2011.
The year-over-year decrease in other income was primarily due to a $72 million merger termination fee that we received during Fiscal 2011.
Fiscal 2011 compared to Fiscal 2010
During Fiscal 2011 and Fiscal 2010, we maintained a portfolio of instruments with shorter maturities, which typically carry lower market yields. DuringFiscal 2011, our investment income declined slightly, even with higher average balances, primarily due to a continued declined in market yields. Overallinvestment yield in Fiscal 2011 declined from approximately 48 basis points during Fiscal 2010 to approximately 35 basis points.
The year-over-year increase in interest expense for Fiscal 2011 was due to higher debt levels, which increased to $6.0 billion as of January 28, 2011, from$4.1 billion as of January 29, 2010.
The year-over-year change in foreign exchange for Fiscal 2011 was primarily due to gains from revaluation of certain un-hedged foreign currency balances,the effect of which was partially offset by increases in the costs associated with the hedge program.
Other includes a $72 million merger termination fee that we received during Fiscal 2011.
44

Table of Contents
Income and Other Taxes
Our effective tax rate was 17.6%, 21.3%, and 29.2% for Fiscal 2012, Fiscal 2011, and Fiscal 2010, respectively. The decrease in our effective income tax ratefor Fiscal 2012 as compared to Fiscal 2011, was primarily due to an increase in the proportion of taxable income attributable to lower tax jurisdictions. Oureffective tax rate can fluctuate depending on the geographic distribution of our world-wide earnings, as our foreign earnings are generally taxed at lower ratesthan in the U.S. In certain jurisdictions, our tax rate is significantly less than the applicable statutory rate as a result of tax holidays. The majority of ourforeign income that is subject to these tax holidays and lower tax rates is attributable to Singapore, China, and Malaysia. Our significant tax holidays expire inwhole or in part during Fiscal 2016 through 2021. The differences between our effective tax rate and the U.S. federal statutory rate of 35% principally resultedfrom the geographical distribution of taxable income discussed above and permanent differences between the book and tax treatment of certain items. Wecontinue to assess our business model and its impact in various taxing jurisdictions.
Deferred tax assets and liabilities are recorded for the estimated tax impact of temporary differences between the tax and book basis of assets and liabilities,and are recognized based on the enacted statutory tax rates for the year in which we expect the differences to reverse. A valuation allowance is establishedagainst a deferred tax asset when it is more likely than not that the asset or any portion thereof will not be realized. Based upon all the available evidence,including expectation of future taxable income, we have determined that we will be able to realize all of our deferred tax assets, net of valuation allowances.
For a further discussion regarding tax matters, including the status of income tax audits, see Note 11 of the Notes to Consolidated Financial Statementsincluded in “Part II — Item 8 — Financial Statements and Supplementary Data.”
ACCOUNTS RECEIVABLE
We sell products and services directly to customers and through a variety of sales channels, including retail distribution. Our Accounts receivable, net was$6.5 billion as of February 3, 2012, and January 28, 2011. We maintain an allowance for doubtful accounts to cover receivables that may be deemeduncollectible. The allowance for losses is based on specific identifiable customer accounts that are deemed at risk and a provision for accounts that arecollectively evaluated based on historical bad debt experience. As of February 3, 2012, and January 28, 2011, the allowance for doubtful accounts was $63million and $96 million, respectively. Based on our assessment, we believe we are adequately reserved for expected credit losses. We monitor the aging of ouraccounts receivable and continue to take actions to reduce our exposure to credit losses.
DELL FINANCIAL SERVICES AND FINANCING RECEIVABLES
DFS offers a wide range of financial services, including originating, collecting, and servicing customer receivables primarily related to the purchase of Dellproducts. To support the financing needs of our customers internationally, we have aligned with a select number of third-party financial services companies.During Fiscal 2012, we acquired Dell Financial Services Canada Limited ("DFS Canada") from CIT Group Inc. In addition, we announced our entry into adefinitive agreement to acquire CIT Vendor Finance's Dell-related financing assets portfolio and sales and servicing functions in Europe for approximately$400 million. Subject to customary closing, regulatory, and other conditions, Dell expects to close substantially all of this acquisition in the fiscal year endingFebruary 1, 2013. CIT Vendor Finance is currently a Dell financing preferred vendor operating in more than 25 countries and will continue to support Dell forthe transition period in Europe. CIT Vendor Finance will also continue to provide financing programs with Dell in select countries around the world,including programs in Latin America, after completion of this transaction. At February 3, 2012, and January 28, 2011, our net financing receivables balances were $4.7 billion and $4.4 billion, respectively. Included in the February 3,2012, balance was approximately $0.3 billion related to our acquisition of the DFS Canada portfolio. To manage the expected net growth in financingreceivables, we will continue to balance the use of our own working capital and other sources of liquidity, including securitization programs.
We have securitization programs to fund revolving loans and fixed-term leases and loans through consolidated special purpose entities ("SPEs"), which weaccount for as secured borrowings. We transfer certain U.S. customer financing receivables to these SPEs, whose purpose is to facilitate the funding ofcustomer receivables through financing arrangements with multi-seller conduits that issue asset-backed debt securities in the capital markets. We transferred$2.3 billion, $1.9 billion, and $0.8 billion to these SPEs during Fiscal 2012, Fiscal 2011, and Fiscal 2010, respectively. Our risk of loss related to thesesecuritized receivables is limited to the amount of our over-collateralization in the transferred pool of receivables. At February 3, 2012, and January 28, 2011,the structured financing debt related to all of our secured borrowing securitization programs was $1.3 billion and $1.0 billion, respectively, and the carryingamount of the corresponding financing receivables was $1.5 billion and
45
Table of Contents
$1.3 billion, respectively.
We maintain an allowance to cover expected financing receivable credit losses and evaluate credit loss expectations based on our total portfolio. For Fiscal2012, Fiscal 2011, and Fiscal 2010, the principal charge-off rate for our total portfolio was 4.6%, 7.5%, and 8.0%, respectively. The charge-off rate for Fiscal2011 is annualized for a portfolio of receivables that consisted of revolving Dell U.S. customer account balances that was purchased during the third quarterof Fiscal 2011. The credit quality mix of our financing receivables has improved in recent years due to our underwriting actions and as the mix of high qualitycommercial accounts in our portfolio has increased. The allowance for losses is determined based on various factors, including historical and anticipatedexperience, past due receivables, receivable type, and customer risk profile. At February 3, 2012, and January 28, 2011, the allowance for financing receivablelosses was $202 million and $241 million, respectively. In general, the loss rates on our financing receivables for Fiscal 2012 have continued to improve overthe prior year. However, we do not expect this improvement to continue as loss rates have stabilized. We continue to monitor broader economic indicators andtheir potential impact on future loss performance. We have an extensive process to manage our exposure to customer risk, including active management ofcredit lines and our collection activities. Based on our assessment of the customer financing receivables, we believe that we are adequately reserved.
See Note 4 of the Notes to Consolidated Financial Statements included in “Part II — Item 8 — Financial Statements and Supplementary Data” for additionalinformation about our financing receivables and the associated allowance.
OFF-BALANCE SHEET ARRANGEMENTS
With the consolidation of our previously nonconsolidated special purpose entities, we no longer have off-balance sheet financing arrangements.
46
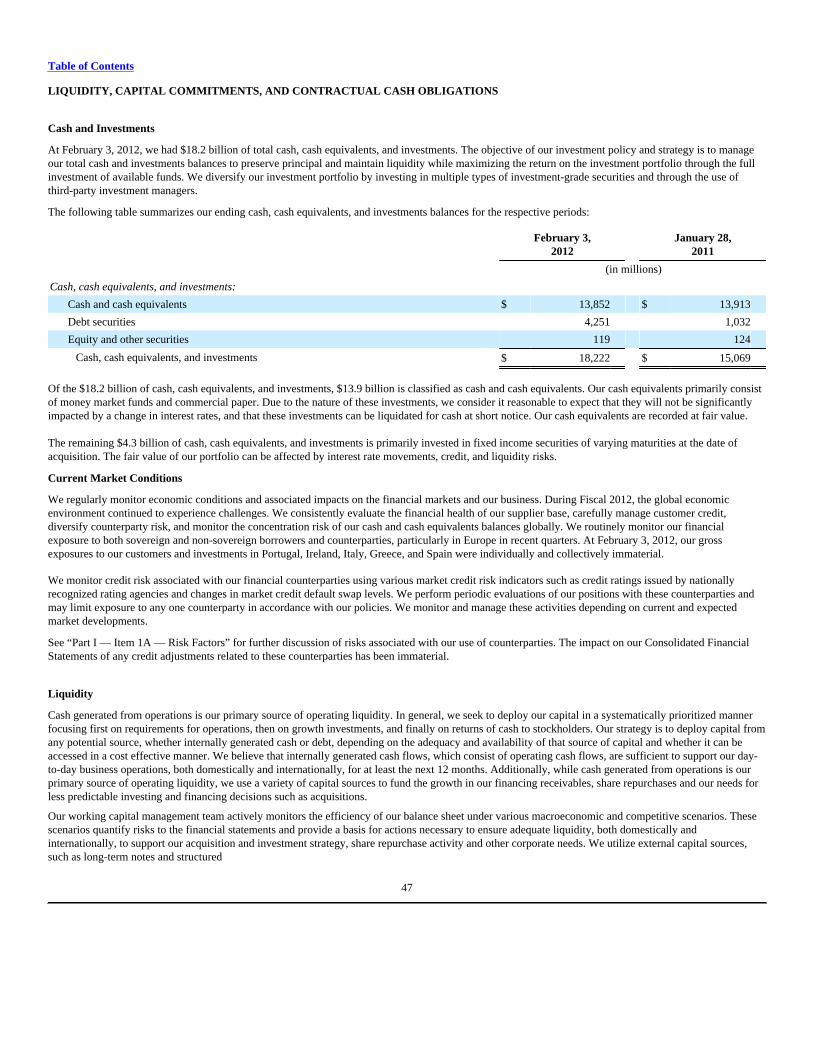
Table of Contents
LIQUIDITY, CAPITAL COMMITMENTS, AND CONTRACTUAL CASH OBLIGATIONS
Cash and Investments
At February 3, 2012, we had $18.2 billion of total cash, cash equivalents, and investments. The objective of our investment policy and strategy is to manageour total cash and investments balances to preserve principal and maintain liquidity while maximizing the return on the investment portfolio through the fullinvestment of available funds. We diversify our investment portfolio by investing in multiple types of investment-grade securities and through the use ofthird-party investment managers.
The following table summarizes our ending cash, cash equivalents, and investments balances for the respective periods:
February 3,2012
January 28,2011
(in millions)
Cash, cash equivalents, and investments:
Cash and cash equivalents $ 13,852 $ 13,913
Debt securities 4,251 1,032
Equity and other securities 119 124
Cash, cash equivalents, and investments $ 18,222 $ 15,069
Of the $18.2 billion of cash, cash equivalents, and investments, $13.9 billion is classified as cash and cash equivalents. Our cash equivalents primarily consistof money market funds and commercial paper. Due to the nature of these investments, we consider it reasonable to expect that they will not be significantlyimpacted by a change in interest rates, and that these investments can be liquidated for cash at short notice. Our cash equivalents are recorded at fair value.
The remaining $4.3 billion of cash, cash equivalents, and investments is primarily invested in fixed income securities of varying maturities at the date ofacquisition. The fair value of our portfolio can be affected by interest rate movements, credit, and liquidity risks.
Current Market Conditions
We regularly monitor economic conditions and associated impacts on the financial markets and our business. During Fiscal 2012, the global economicenvironment continued to experience challenges. We consistently evaluate the financial health of our supplier base, carefully manage customer credit,diversify counterparty risk, and monitor the concentration risk of our cash and cash equivalents balances globally. We routinely monitor our financialexposure to both sovereign and non-sovereign borrowers and counterparties, particularly in Europe in recent quarters. At February 3, 2012, our grossexposures to our customers and investments in Portugal, Ireland, Italy, Greece, and Spain were individually and collectively immaterial.
We monitor credit risk associated with our financial counterparties using various market credit risk indicators such as credit ratings issued by nationallyrecognized rating agencies and changes in market credit default swap levels. We perform periodic evaluations of our positions with these counterparties andmay limit exposure to any one counterparty in accordance with our policies. We monitor and manage these activities depending on current and expectedmarket developments.
See “Part I — Item 1A — Risk Factors” for further discussion of risks associated with our use of counterparties. The impact on our Consolidated FinancialStatements of any credit adjustments related to these counterparties has been immaterial.
Liquidity
Cash generated from operations is our primary source of operating liquidity. In general, we seek to deploy our capital in a systematically prioritized mannerfocusing first on requirements for operations, then on growth investments, and finally on returns of cash to stockholders. Our strategy is to deploy capital fromany potential source, whether internally generated cash or debt, depending on the adequacy and availability of that source of capital and whether it can beaccessed in a cost effective manner. We believe that internally generated cash flows, which consist of operating cash flows, are sufficient to support our day-to-day business operations, both domestically and internationally, for at least the next 12 months. Additionally, while cash generated from operations is ourprimary source of operating liquidity, we use a variety of capital sources to fund the growth in our financing receivables, share repurchases and our needs forless predictable investing and financing decisions such as acquisitions.
Our working capital management team actively monitors the efficiency of our balance sheet under various macroeconomic and competitive scenarios. Thesescenarios quantify risks to the financial statements and provide a basis for actions necessary to ensure adequate liquidity, both domestically andinternationally, to support our acquisition and investment strategy, share repurchase activity and other corporate needs. We utilize external capital sources,such as long-term notes and structured
47
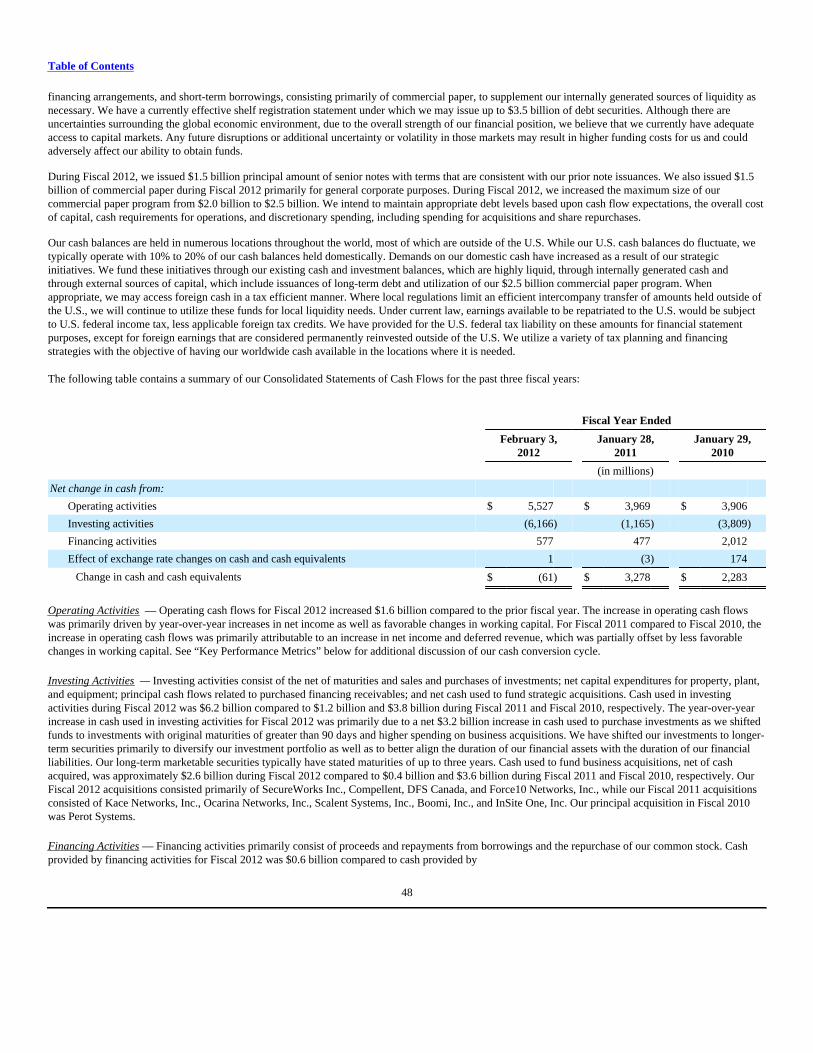
Table of Contents
financing arrangements, and short-term borrowings, consisting primarily of commercial paper, to supplement our internally generated sources of liquidity asnecessary. We have a currently effective shelf registration statement under which we may issue up to $3.5 billion of debt securities. Although there areuncertainties surrounding the global economic environment, due to the overall strength of our financial position, we believe that we currently have adequateaccess to capital markets. Any future disruptions or additional uncertainty or volatility in those markets may result in higher funding costs for us and couldadversely affect our ability to obtain funds.
During Fiscal 2012, we issued $1.5 billion principal amount of senior notes with terms that are consistent with our prior note issuances. We also issued $1.5billion of commercial paper during Fiscal 2012 primarily for general corporate purposes. During Fiscal 2012, we increased the maximum size of ourcommercial paper program from $2.0 billion to $2.5 billion. We intend to maintain appropriate debt levels based upon cash flow expectations, the overall costof capital, cash requirements for operations, and discretionary spending, including spending for acquisitions and share repurchases.
Our cash balances are held in numerous locations throughout the world, most of which are outside of the U.S. While our U.S. cash balances do fluctuate, wetypically operate with 10% to 20% of our cash balances held domestically. Demands on our domestic cash have increased as a result of our strategicinitiatives. We fund these initiatives through our existing cash and investment balances, which are highly liquid, through internally generated cash andthrough external sources of capital, which include issuances of long-term debt and utilization of our $2.5 billion commercial paper program. Whenappropriate, we may access foreign cash in a tax efficient manner. Where local regulations limit an efficient intercompany transfer of amounts held outside ofthe U.S., we will continue to utilize these funds for local liquidity needs. Under current law, earnings available to be repatriated to the U.S. would be subjectto U.S. federal income tax, less applicable foreign tax credits. We have provided for the U.S. federal tax liability on these amounts for financial statementpurposes, except for foreign earnings that are considered permanently reinvested outside of the U.S. We utilize a variety of tax planning and financingstrategies with the objective of having our worldwide cash available in the locations where it is needed.
The following table contains a summary of our Consolidated Statements of Cash Flows for the past three fiscal years:
Fiscal Year Ended
February 3,2012
January 28,2011
January 29,2010
(in millions)
Net change in cash from:
Operating activities $ 5,527 $ 3,969 $ 3,906
Investing activities (6,166) (1,165) (3,809)
Financing activities 577 477 2,012
Effect of exchange rate changes on cash and cash equivalents 1 (3) 174
Change in cash and cash equivalents $ (61) $ 3,278 $ 2,283
Operating Activities — Operating cash flows for Fiscal 2012 increased $1.6 billion compared to the prior fiscal year. The increase in operating cash flowswas primarily driven by year-over-year increases in net income as well as favorable changes in working capital. For Fiscal 2011 compared to Fiscal 2010, theincrease in operating cash flows was primarily attributable to an increase in net income and deferred revenue, which was partially offset by less favorablechanges in working capital. See “Key Performance Metrics” below for additional discussion of our cash conversion cycle.
Investing Activities — Investing activities consist of the net of maturities and sales and purchases of investments; net capital expenditures for property, plant,and equipment; principal cash flows related to purchased financing receivables; and net cash used to fund strategic acquisitions. Cash used in investingactivities during Fiscal 2012 was $6.2 billion compared to $1.2 billion and $3.8 billion during Fiscal 2011 and Fiscal 2010, respectively. The year-over-yearincrease in cash used in investing activities for Fiscal 2012 was primarily due to a net $3.2 billion increase in cash used to purchase investments as we shiftedfunds to investments with original maturities of greater than 90 days and higher spending on business acquisitions. We have shifted our investments to longer-term securities primarily to diversify our investment portfolio as well as to better align the duration of our financial assets with the duration of our financialliabilities. Our long-term marketable securities typically have stated maturities of up to three years. Cash used to fund business acquisitions, net of cashacquired, was approximately $2.6 billion during Fiscal 2012 compared to $0.4 billion and $3.6 billion during Fiscal 2011 and Fiscal 2010, respectively. OurFiscal 2012 acquisitions consisted primarily of SecureWorks Inc., Compellent, DFS Canada, and Force10 Networks, Inc., while our Fiscal 2011 acquisitionsconsisted of Kace Networks, Inc., Ocarina Networks, Inc., Scalent Systems, Inc., Boomi, Inc., and InSite One, Inc. Our principal acquisition in Fiscal 2010was Perot Systems.
Financing Activities — Financing activities primarily consist of proceeds and repayments from borrowings and the repurchase of our common stock. Cashprovided by financing activities for Fiscal 2012 was $0.6 billion compared to cash provided by
48
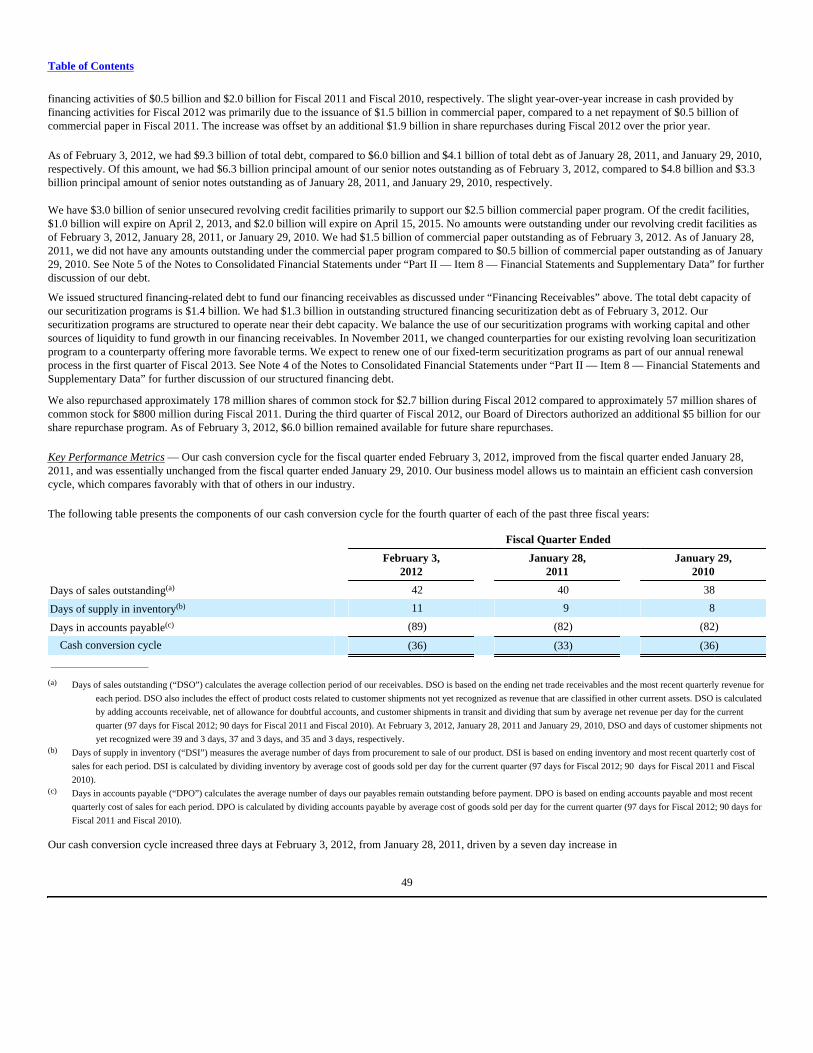
Table of Contents
financing activities of $0.5 billion and $2.0 billion for Fiscal 2011 and Fiscal 2010, respectively. The slight year-over-year increase in cash provided byfinancing activities for Fiscal 2012 was primarily due to the issuance of $1.5 billion in commercial paper, compared to a net repayment of $0.5 billion ofcommercial paper in Fiscal 2011. The increase was offset by an additional $1.9 billion in share repurchases during Fiscal 2012 over the prior year.
As of February 3, 2012, we had $9.3 billion of total debt, compared to $6.0 billion and $4.1 billion of total debt as of January 28, 2011, and January 29, 2010,respectively. Of this amount, we had $6.3 billion principal amount of our senior notes outstanding as of February 3, 2012, compared to $4.8 billion and $3.3billion principal amount of senior notes outstanding as of January 28, 2011, and January 29, 2010, respectively.
We have $3.0 billion of senior unsecured revolving credit facilities primarily to support our $2.5 billion commercial paper program. Of the credit facilities,$1.0 billion will expire on April 2, 2013, and $2.0 billion will expire on April 15, 2015. No amounts were outstanding under our revolving credit facilities asof February 3, 2012, January 28, 2011, or January 29, 2010. We had $1.5 billion of commercial paper outstanding as of February 3, 2012. As of January 28,2011, we did not have any amounts outstanding under the commercial paper program compared to $0.5 billion of commercial paper outstanding as of January29, 2010. See Note 5 of the Notes to Consolidated Financial Statements under “Part II — Item 8 — Financial Statements and Supplementary Data” for furtherdiscussion of our debt.
We issued structured financing-related debt to fund our financing receivables as discussed under “Financing Receivables” above. The total debt capacity ofour securitization programs is $1.4 billion. We had $1.3 billion in outstanding structured financing securitization debt as of February 3, 2012. Oursecuritization programs are structured to operate near their debt capacity. We balance the use of our securitization programs with working capital and othersources of liquidity to fund growth in our financing receivables. In November 2011, we changed counterparties for our existing revolving loan securitizationprogram to a counterparty offering more favorable terms. We expect to renew one of our fixed-term securitization programs as part of our annual renewalprocess in the first quarter of Fiscal 2013. See Note 4 of the Notes to Consolidated Financial Statements under “Part II — Item 8 — Financial Statements andSupplementary Data” for further discussion of our structured financing debt.
We also repurchased approximately 178 million shares of common stock for $2.7 billion during Fiscal 2012 compared to approximately 57 million shares ofcommon stock for $800 million during Fiscal 2011. During the third quarter of Fiscal 2012, our Board of Directors authorized an additional $5 billion for ourshare repurchase program. As of February 3, 2012, $6.0 billion remained available for future share repurchases.
Key Performance Metrics — Our cash conversion cycle for the fiscal quarter ended February 3, 2012, improved from the fiscal quarter ended January 28,2011, and was essentially unchanged from the fiscal quarter ended January 29, 2010. Our business model allows us to maintain an efficient cash conversioncycle, which compares favorably with that of others in our industry.
The following table presents the components of our cash conversion cycle for the fourth quarter of each of the past three fiscal years:
Fiscal Quarter Ended
February 3,2012
January 28,2011
January 29,2010
Days of sales outstanding(a) 42 40 38
Days of supply in inventory(b) 11 9 8
Days in accounts payable(c) (89) (82) (82)
Cash conversion cycle (36) (33) (36)
_____________________
(a) Days of sales outstanding (“DSO”) calculates the average collection period of our receivables. DSO is based on the ending net trade receivables and the most recent quarterly revenue for
each period. DSO also includes the effect of product costs related to customer shipments not yet recognized as revenue that are classified in other current assets. DSO is calculated
by adding accounts receivable, net of allowance for doubtful accounts, and customer shipments in transit and dividing that sum by average net revenue per day for the current
quarter (97 days for Fiscal 2012; 90 days for Fiscal 2011 and Fiscal 2010). At February 3, 2012, January 28, 2011 and January 29, 2010, DSO and days of customer shipments not
yet recognized were 39 and 3 days, 37 and 3 days, and 35 and 3 days, respectively.(b) Days of supply in inventory (“DSI”) measures the average number of days from procurement to sale of our product. DSI is based on ending inventory and most recent quarterly cost of
sales for each period. DSI is calculated by dividing inventory by average cost of goods sold per day for the current quarter (97 days for Fiscal 2012; 90 days for Fiscal 2011 and Fiscal
2010).(c) Days in accounts payable (“DPO”) calculates the average number of days our payables remain outstanding before payment. DPO is based on ending accounts payable and most recent
quarterly cost of sales for each period. DPO is calculated by dividing accounts payable by average cost of goods sold per day for the current quarter (97 days for Fiscal 2012; 90 days for
Fiscal 2011 and Fiscal 2010).
Our cash conversion cycle increased three days at February 3, 2012, from January 28, 2011, driven by a seven day increase in
49
Table of Contents
DPO, which was largely attributable to the timing of payments to vendors at the end of the period as compared to the prior year due to an additional week ofoperations in Fiscal 2012. The increase in DPO was offset in part by a two day increase in DSO and a two day increase in DSI. The increase in DSO fromJanuary 28, 2011, was due to a shift in the mix of receivables towards customers with longer payment terms. The increase in DSI from January 28, 2011,wasprimarily driven by strategic purchases of inventory, particularly HDDs.
Our cash conversion cycle decreased three days at January 28, 2011, from January 29, 2010, driven by a two day increase in DSO and a one day increase inDSI. DPO was flat year-over-year. The increase in DSO from January 29, 2010, was due to growth in our Commercial business, which typically has longerpayment terms. The slight increase in DSI from January 29, 2010, was primarily attributable to an increase in strategic purchases of materials and finishedgoods inventory in connection with the optimization of our supply chain.
We defer the cost of revenue associated with customer shipments not yet recognized as revenue until these shipments are delivered. These deferred costs areincluded in our reported DSO because we believe this reporting results in a more accurate presentation of our DSO and cash conversion cycle. These deferredcosts are recorded in Other current assets in our Consolidated Statements of Financial Position and totaled $482 million, $541 million, and $523 million, atFebruary 3, 2012, January 28, 2011, and January 29, 2010, respectively.
We believe that we can generate cash flow from operations in excess of net income over the long term and can operate our cash conversion cycle in the midnegative 30 day range.
Capital Commitments
Share Repurchase Program — We have a share repurchase program that authorizes us to purchase shares of our common stock through a systematic programof open market purchases in order to increase shareholder value and manage dilution resulting from shares issued under our equity compensation plans.However, we do not currently have a policy that requires the repurchase of common stock to offset share-based compensation arrangements. For moreinformation regarding our share repurchases, see “Part II — Item 5 — Market for Registrant's Common Equity, Related Stockholder Matters and IssuerPurchases of Equity Securities.”
Capital Expenditures — During Fiscal 2012 and Fiscal 2011, we spent $675 million and $444 million, respectively, on property, plant, and equipmentprimarily in connection with our global expansion efforts and infrastructure investments made to support future growth. Product demand, product mix, and theincreased use of contract manufacturers, as well as ongoing investments in operating and information technology infrastructure, influence the level andprioritization of our capital expenditures. Aggregate capital expenditures for Fiscal 2013, which will be primarily related to infrastructure investments andstrategic initiatives, are currently expected to total approximately $650 million to $700 million. These expenditures will be primarily funded from our cashflows from operating activities.
Purchase Obligations — We utilize several suppliers to manufacture sub-assemblies for our products. Our efficient supply chain management allows us toenter into flexible and mutually beneficial purchase arrangements with our suppliers in order to minimize inventory risk. Consistent with industry practice, weacquire raw materials or other goods and services, including product components, by issuing to suppliers authorizations to purchase based on our projecteddemand and manufacturing needs. See "Liquidity, Capital Commitments, and Contractual Cash Obligations — Contractual Cash Obligations" for moreinformation about our purchase commitments.
50
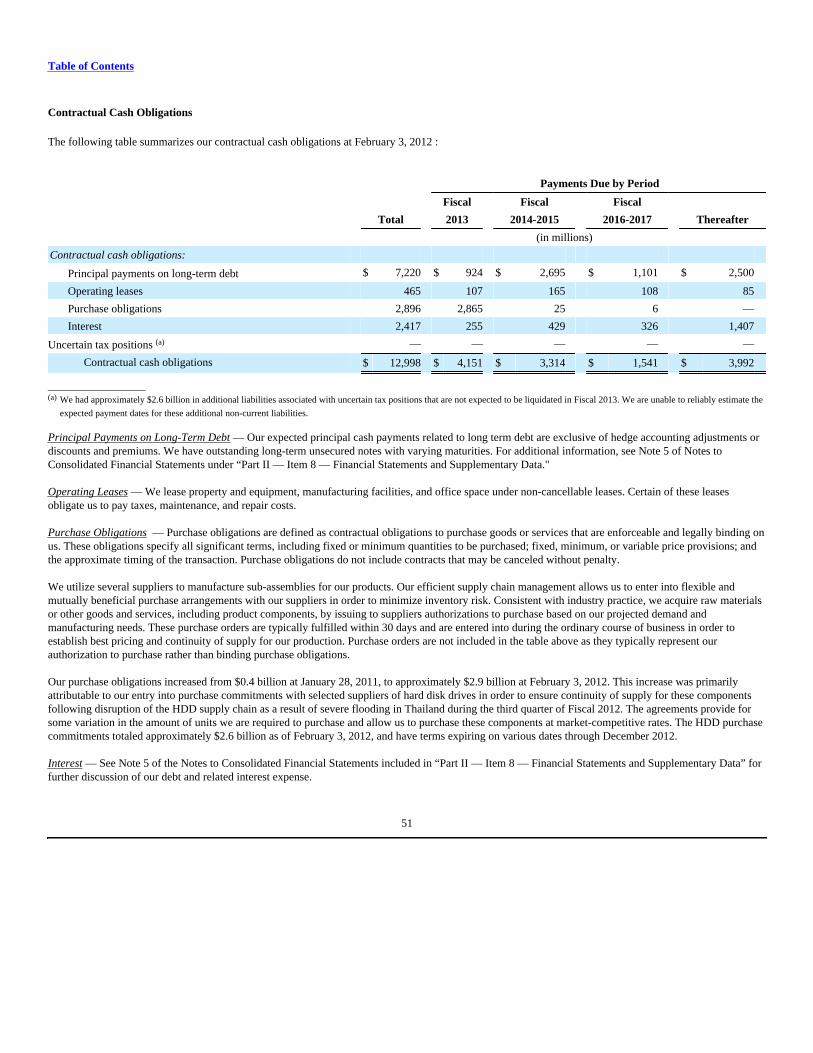
Table of Contents
Contractual Cash Obligations
The following table summarizes our contractual cash obligations at February 3, 2012 :
Payments Due by Period
Fiscal Fiscal Fiscal Total 2013 2014-2015 2016-2017 Thereafter
(in millions)
Contractual cash obligations:
Principal payments on long-term debt $ 7,220 $ 924 $ 2,695 $ 1,101 $ 2,500
Operating leases 465 107 165 108 85
Purchase obligations 2,896 2,865 25 6 —
Interest 2,417 255 429 326 1,407
Uncertain tax positions (a) — — — — —
Contractual cash obligations $ 12,998 $ 4,151 $ 3,314 $ 1,541 $ 3,992
_____________________(a) We had approximately $2.6 billion in additional liabilities associated with uncertain tax positions that are not expected to be liquidated in Fiscal 2013. We are unable to reliably estimate the
expected payment dates for these additional non-current liabilities.
Principal Payments on Long-Term Debt — Our expected principal cash payments related to long term debt are exclusive of hedge accounting adjustments ordiscounts and premiums. We have outstanding long-term unsecured notes with varying maturities. For additional information, see Note 5 of Notes toConsolidated Financial Statements under “Part II — Item 8 — Financial Statements and Supplementary Data."
Operating Leases — We lease property and equipment, manufacturing facilities, and office space under non-cancellable leases. Certain of these leasesobligate us to pay taxes, maintenance, and repair costs.
Purchase Obligations — Purchase obligations are defined as contractual obligations to purchase goods or services that are enforceable and legally binding onus. These obligations specify all significant terms, including fixed or minimum quantities to be purchased; fixed, minimum, or variable price provisions; andthe approximate timing of the transaction. Purchase obligations do not include contracts that may be canceled without penalty.
We utilize several suppliers to manufacture sub-assemblies for our products. Our efficient supply chain management allows us to enter into flexible andmutually beneficial purchase arrangements with our suppliers in order to minimize inventory risk. Consistent with industry practice, we acquire raw materialsor other goods and services, including product components, by issuing to suppliers authorizations to purchase based on our projected demand andmanufacturing needs. These purchase orders are typically fulfilled within 30 days and are entered into during the ordinary course of business in order toestablish best pricing and continuity of supply for our production. Purchase orders are not included in the table above as they typically represent ourauthorization to purchase rather than binding purchase obligations.
Our purchase obligations increased from $0.4 billion at January 28, 2011, to approximately $2.9 billion at February 3, 2012. This increase was primarilyattributable to our entry into purchase commitments with selected suppliers of hard disk drives in order to ensure continuity of supply for these componentsfollowing disruption of the HDD supply chain as a result of severe flooding in Thailand during the third quarter of Fiscal 2012. The agreements provide forsome variation in the amount of units we are required to purchase and allow us to purchase these components at market-competitive rates. The HDD purchasecommitments totaled approximately $2.6 billion as of February 3, 2012, and have terms expiring on various dates through December 2012.
Interest — See Note 5 of the Notes to Consolidated Financial Statements included in “Part II — Item 8 — Financial Statements and Supplementary Data” forfurther discussion of our debt and related interest expense.
51
Table of Contents
Risk Factors Affecting Our Business and Prospects
There are numerous significant risks that affect our business, operating results, financial condition, and prospects. Many of these risks are beyond our control.These risks include those relating to:
• intense competition;• our reliance on vendors for products and components, including reliance on several single-source or limited-source suppliers;• our ability to achieve favorable pricing from our vendors;• adverse global economic conditions and instability in financial markets;• our ability to manage effectively the change involved in implementing our strategic initiatives;• successful implementation of our acquisition strategy;• our cost efficiency measures;• our ability to manage solutions, product, and services transitions in an effective manner;• our ability to deliver quality products and services;• our ability to generate substantial non-U.S. net revenue;• our product, customer, and geographic sales mix, or seasonal sales trends;• the performance of our sales channel participants;• access to the capital markets by us and some of our customers;• weak economic conditions and additional regulation affecting our financial services activities;• counterparty default;• customer terminations of, or pricing changes in, services contracts, or our failure to perform as we anticipate at the time we enter into services contracts;• loss of government contracts;• our ability to develop, obtain or protect licenses to intellectual property developed by us or by others on commercially reasonable and competitive terms;• infrastructure disruptions;• cyber attacks or other data security breaches;• our ability to hedge effectively our exposure to fluctuations in foreign currency exchange rates and interest rates;• expiration of tax holidays or favorable tax rate structures, or unfavorable outcomes in tax audits and other tax compliance matters;• impairment of our portfolio investments;• unfavorable results of legal proceedings;• our ability to attract, retain, and motivate key personnel;• our ability to maintain strong and effective internal controls;• our compliance with current and changing environmental and safety laws or other regulatory laws; and• the effect of armed hostilities, terrorism, natural disasters, and public health issues.
For a discussion of these risk factors affecting our business, operating results, financial conditions, and prospects, see “Part I — Item 1A — Risk Factors.”
52
Table of Contents
Critical Accounting Policies
We prepare our financial statements in conformity with GAAP. The preparation of financial statements in accordance with GAAP requires certain estimates,assumptions, and judgments to be made that may affect our Consolidated Statements of Financial Position and Consolidated Statements of Income. Webelieve that our most critical accounting policies relate to revenue recognition, business combinations, warranty liabilities, income taxes, and losscontingencies. We have discussed the development, selection, and disclosure of our critical accounting policies with the Audit Committee of our Board ofDirectors. These critical accounting policies and our other accounting policies are also described in Note 1 of the Notes to Consolidated Financial Statementsincluded in “Part II — Item 8 — Financial Statements and Supplementary Data.”
Revenue Recognition and Related Allowances — We enter into contracts to sell our products, software and services and frequently enter into salesarrangements with customers that contain multiple elements or deliverables such as hardware, software, peripherals, and services. We use general revenuerecognition accounting guidance for hardware, software bundled with hardware that is essential to the functionality of the hardware, peripherals, and certainservices. We recognize revenue for these products when it is realized or realizable and earned. Revenue is considered realized and earned when persuasiveevidence of an arrangement exists; delivery has occurred or services have been rendered; our fee is fixed and determinable; and collection of the resultingreceivable is reasonably assured. We recognize revenue in accordance with industry specific software accounting guidance for all software that is not essentialto the functionality of the hardware. Judgments and estimates are necessary to ensure compliance with GAAP. These judgments include the allocation of theproceeds received from an arrangement to the multiple elements, and the appropriate timing of revenue recognition. Most of our products and services qualifyas separate units of accounting. We allocate revenue to all deliverables based on their relative selling prices. GAAP requires the following hierarchy to beused to determine the selling price for allocating revenue to deliverables; (i) vendor-specific objective evidence (“VSOE”); (ii) third-party evidence of sellingprice (“TPE”); or (iii) best estimate of the selling price (“ESP”). A majority of our product and service offerings are sold on a stand-alone basis. Becauseselling price is generally available based on stand-alone sales, we have limited application of TPE, as determined by comparison of pricing for products andservices to the pricing of similar products and services as offered by Dell or its competitors in stand-alone sales to similarly situated customers.
We record reductions to revenue for estimated customer sales returns, rebates, and certain other customer incentive programs. These reductions to revenue aremade based upon reasonable and reliable estimates that are determined by historical experience, contractual terms, and current conditions. The primary factorsaffecting our accrual for estimated customer returns include estimated return rates as well as the number of units shipped that have a right of return that hasnot expired as of the balance sheet date. If returns cannot be reliably estimated, revenue is not recognized until a reliable estimate can be made or the returnright lapses. Each quarter, we reevaluate our estimates to assess the adequacy of our recorded accruals and allowance for doubtful accounts, and adjust theamounts as necessary.
We sell our products directly to customers as well as through other distribution channels, including retailers, distributors, and resellers. Sales through ourdistribution channels are primarily made under agreements allowing for limited rights of return, price protection, rebates, and marketing development funds.We have generally limited return rights through contractual caps or we have an established selling history for these arrangements. Therefore, there issufficient data to establish reasonable and reliable estimates of returns for the majority of these sales. To the extent price protection or return rights are notlimited and a reliable estimate cannot be made, all of the revenue and related cost are deferred until the product has been sold to the end-user or the rightsexpire. We record estimated reductions to revenue or an expense for distribution channel programs at the later of the offer or the time revenue is recognized.
We offer extended warranty and service contracts to customers that extend and/or enhance the technical support, parts, and labor coverage offered as part ofthe base warranty included with the product. Revenue from extended warranty and service contracts, for which we are obligated to perform, is recorded asdeferred services revenue and subsequently recognized on a straight-line basis over the term of the contract or ratably as services are completed. Revenuefrom sales of third-party extended warranty and service contracts, which we are not obligated to perform, is recognized on a net basis at the time of sale. Allother revenue is recognized on a gross basis.
We report revenue net of any revenue-based taxes assessed by governmental authorities that are imposed on and concurrent with specific revenue-producingtransactions.
Business Combinations and Intangible Assets Including Goodwill — We account for business combinations using the acquisition method of accounting andaccordingly, the assets and liabilities of the acquired business are recorded at their fair values at the date of acquisition. The excess of the purchase price overthe estimated fair value is recorded as goodwill. Any changes in the estimated fair values of the net assets recorded for acquisitions prior to the finalization ofmore detailed analysis, but not to exceed one year from the date of acquisition, will change the amount of the purchase price allocable to goodwill. All
53
Table of Contents
acquisition costs are expensed as incurred and in-process research and development costs are recorded at fair value as an indefinite-lived intangible asset andassessed for impairment thereafter until completion, at which point the asset is amortized over its expected useful life. Any restructuring charges associatedwith a business combination are expensed subsequent to the acquisition date. The application of business combination and impairment accounting requires theuse of significant estimates and assumptions.
The results of operations of acquired businesses are included in our Consolidated Financial Statements from the acquisition date.
Goodwill and indefinite-lived intangible assets are tested for impairment on an annual basis in the second fiscal quarter, or sooner if an indicator ofimpairment occurs. To determine whether goodwill is impaired, we determine the fair values of each of our reportable business units using a discounted cashflow methodology and then compare the fair values to the carrying values of each reportable business unit. We concluded that there were no impairmenttriggering events during Fiscal 2012. At the end of the second quarter of Fiscal 2012, the annual testing period, our market capitalization, including commonstock held by affiliates, was $29.8 billion compared to stockholders’ equity of $8.3 billion. We have determined that a 10% decrease in the fair value of anyone of our reporting units as of February 3, 2012, would have no impact on the carrying value of our goodwill. Though we believe our estimates arereasonable, these fair values require the use of management’s assumptions, which would not reflect unanticipated events and circumstances that may occur.
Standard Warranty Liabilities — We record warranty liabilities at the time of sale for the estimated costs that may be incurred under the terms of the limitedwarranty. The liability for standard warranties is included in accrued and other current and other non-current liabilities on the Consolidated Statements ofFinancial Position. The specific warranty terms and conditions vary depending upon the product sold and the country in which we do business, but generallyinclude technical support, parts, and labor over a period ranging from one to three years. Factors that affect our warranty liability include the number ofinstalled units currently under warranty, historical and anticipated rates of warranty claims on those units, and cost per claim to satisfy our warrantyobligation. The anticipated rate of warranty claims is the primary factor impacting our estimated warranty obligation. The other factors are less significant dueto the fact that the average remaining aggregate warranty period of the covered installed base is approximately 15 months, repair parts are generally already instock or available at pre-determined prices, and labor rates are generally arranged at pre-established amounts with service providers. Warranty claims arereasonably predictable based on historical experience of failure rates. If actual results differ from our estimates, we revise our estimated warranty liability toreflect such changes. Each quarter, we reevaluate our estimates to assess the adequacy of the recorded warranty liabilities and adjust the amounts as necessary.
Income Taxes — We calculate a provision for income taxes using the asset and liability method, under which deferred tax assets and liabilities are recognizedby identifying the temporary differences arising from the different treatment of items for tax and accounting purposes. We provide related valuationallowances for deferred tax assets, where appropriate. In determining the future tax consequences of events that have been recognized in our financialstatements or tax returns, judgment is required. Differences between the anticipated and actual outcomes of these future tax consequences could have amaterial impact on our consolidated results of operations or financial position. Additionally, we use tax planning strategies as a part of our global taxcompliance program. Judgments and interpretation of statutes are inherent in this process.
While we believe our tax return positions are sustainable, we recognize tax benefits from uncertain tax positions in the financial statements only when it ismore likely than not that the positions will be sustained upon examination, including resolution of any related appeals or litigation processes, based on thetechnical merits and a consideration of the relevant taxing authority's administrative practices and precedents. The determination of income tax expenserelated to these positions requires management judgment as well as use of estimates. We believe we have provided adequate reserves for all uncertain taxpositions.
Loss Contingencies — We are subject to the possibility of various losses arising in the ordinary course of business. We consider the likelihood of loss orimpairment of an asset or the incurrence of a liability, as well as our ability to reasonably estimate the amount of loss, in determining loss contingencies. Anestimated loss contingency is accrued when it is probable that an asset has been impaired or a liability has been incurred and the amount of loss can bereasonably estimated. We regularly evaluate current information available to us to determine whether such accruals should be adjusted and whether newaccruals are required. Third parties have in the past asserted, and may in the future assert claims, or initiate litigation related to exclusive patent, copyright,and other intellectual property rights to technologies and related standards that are relevant to us. If any infringement or other intellectual property claim madeagainst us by any third party is successful, or if we fail to develop non-infringing technology or license the proprietary rights on commercially reasonableterms and conditions, our business, operating results, and financial condition could be materially and adversely affected.
54

Table of Contents
New Accounting Pronouncements
Intangibles- Goodwill and Other — In September 2011, the Financial Accounting Standards Board issued new guidance that will simplify how entities testgoodwill for impairment. After assessment of certain qualitative factors, if it is determined to be more likely than not that the fair value of a reporting unit isless than its carrying amount, entities must perform a quantitative analysis of the goodwill impairment test. Otherwise, the quantitative test becomes optional.This new guidance is effective for us for the first quarter of the fiscal year ending February 1, 2013. Early adoption is permitted. We do not expect that thisnew guidance will impact our Consolidated Financial Statements.
55
Table of Contents
ITEM 7A — QUANTITATIVE AND QUALITATIVE DISCLOSURES ABOUT MARKET RISK
We are exposed to a variety of risks, including foreign currency exchange rate fluctuations and changes in the market value of our investments. In the normalcourse of business, we employ established policies and procedures to manage these risks.
Foreign Currency Risk
During Fiscal 2012, the principal foreign currencies in which we transacted business were the Euro, Chinese Renminbi, Japanese Yen, British Pound,Canadian Dollar, and Australian Dollar. Our objective in managing our exposures to foreign currency exchange rate fluctuations is to reduce the impact ofadverse fluctuations associated with foreign currency exchange rate changes on our earnings and cash flows. Accordingly, we utilize foreign currency optioncontracts and forward contracts to hedge our exposure on forecasted transactions and firm commitments for certain currencies. During Fiscal 2012, we hedgedour exposures on more than 20 currencies. We monitor our foreign currency exchange exposures to ensure the overall effectiveness of our foreign currencyhedge positions. However, there can be no assurance that our foreign currency hedging activities will continue to substantially offset the impact offluctuations in currency exchange rates on our results of operations and financial position in the future.
Based on our foreign currency cash flow hedge instruments outstanding at February 3, 2012, and January 28, 2011, we estimate a maximum potential one-dayloss in fair value of approximately $57 million and $65 million, respectively, using a Value-at-Risk (“VAR”) model. By using market implied rates andincorporating volatility and correlation among the currencies of a portfolio, the VAR model simulates 3,000 randomly generated market prices and calculatesthe difference between the fifth percentile and the average as the Value-at-Risk. The VAR model is a risk estimation tool and is not intended to representactual losses in fair value that will be incurred. Additionally, as we utilize foreign currency instruments for hedging forecasted and firmly committedtransactions, a loss in fair value for those instruments is generally offset by increases in the value of the underlying exposure.
Interest Rate Risk
We also are exposed to interest rate risk related to our debt and investment portfolios and financing receivables. We mitigate the risk related to our structuredfinancing debt through the use of interest rate swaps to hedge the variability in cash flows related to the interest rate payments on such debt. See Note 6 of theNotes to Consolidated Financial Statements included in “Part II — Item 8 — Financial Statements and Supplementary Data” for more information on ourinterest rate swaps.
We mitigate the risks related to our investment portfolio by investing primarily in high credit quality securities, limiting the amount that can be invested inany single issuer, and investing in short -to- intermediate-term investments. Based on our investment portfolio and interest rates as of February 3, 2012, a 100basis point increase or decrease in interest rates would result in a decrease or increase of approximately $61 million in the fair value of our investmentportfolio. As of January 28, 2011, a 100 basis point increase or decrease in interest rates would have resulted in a decrease or increase of approximately $4million in the fair value of our investment portfolio. The overall increase in our interest rate sensitivity from January 28, 2011, to February 3, 2012, was due toa shift to longer-duration investments.
56
Table of Contents
ITEM 8 — FINANCIAL STATEMENTS AND SUPPLEMENTARY DATA
INDEX TO CONSOLIDATED FINANCIAL STATEMENTS Page
Financial Statements:
Report of Independent Registered Public Accounting Firm 58
Consolidated Statements of Financial Position at February 3, 2012, and January 28, 2011 59
Consolidated Statements of Income for the fiscal years ended February 3, 2012, January 28, 2011, and January 29, 2010 60
Consolidated Statements of Cash Flows for the fiscal years ended February 3, 2012, January 28, 2011, and January 29, 2010 61
Consolidated Statements of Stockholders’ Equity for the fiscal years ended February 3, 2012, January 28, 2011, andJanuary 29, 2010
62
Notes to Consolidated Financial Statements 63
57
Table of Contents
Report of Independent Registered Public Accounting Firm
To the Board of Directors andShareholders of Dell Inc.:
In our opinion, the consolidated financial statements listed in the accompanying index present fairly, in all material respects, the financial position of Dell Inc.and its subsidiaries (the "Company") at February 3, 2012 and January 28, 2011, and the results of their operations and their cash flows for each of the threeyears in the period ended February 3, 2012 in conformity with accounting principles generally accepted in the United States of America. Also, in our opinion,the Company maintained, in all material respects, effective internal control over financial reporting as of February 3, 2012, based on criteria established inInternal Control - Integrated Framework issued by the Committee of Sponsoring Organizations of the Treadway Commission (COSO). The Company'smanagement is responsible for these financial statements, for maintaining effective internal control over financial reporting and for its assessment of theeffectiveness of internal control over financial reporting, included in Management's Report on Internal Control Over Financial Reporting appearing underItem 9A. Our responsibility is to express opinions on these financial statements, and on the Company's internal control over financial reporting based on ourintegrated audits. We conducted our audits in accordance with the standards of the Public Company Accounting Oversight Board (United States). Thosestandards require that we plan and perform the audits to obtain reasonable assurance about whether the financial statements are free of material misstatementand whether effective internal control over financial reporting was maintained in all material respects. Our audits of the financial statements includedexamining, on a test basis, evidence supporting the amounts and disclosures in the financial statements, assessing the accounting principles used andsignificant estimates made by management, and evaluating the overall financial statement presentation. Our audit of internal control over financial reportingincluded obtaining an understanding of internal control over financial reporting, assessing the risk that a material weakness exists, and testing and evaluatingthe design and operating effectiveness of internal control based on the assessed risk. Our audits also included performing such other procedures as weconsidered necessary in the circumstances. We believe that our audits provide a reasonable basis for our opinions.
As described in Note 1, in Fiscal 2011 the Company changed the manner in which it accounts for variable interest entities and transfers of financial assets andextinguishments of liabilities.
A company's internal control over financial reporting is a process designed to provide reasonable assurance regarding the reliability of financial reporting andthe preparation of financial statements for external purposes in accordance with generally accepted accounting principles. A company's internal control overfinancial reporting includes those policies and procedures that (i) pertain to the maintenance of records that, in reasonable detail, accurately and fairly reflectthe transactions and dispositions of the assets of the company; (ii) provide reasonable assurance that transactions are recorded as necessary to permitpreparation of financial statements in accordance with generally accepted accounting principles, and that receipts and expenditures of the company are beingmade only in accordance with authorizations of management and directors of the company; and (iii) provide reasonable assurance regarding prevention ortimely detection of unauthorized acquisition, use, or disposition of the company's assets that could have a material effect on the financial statements.
Because of its inherent limitations, internal control over financial reporting may not prevent or detect misstatements. Also, projections of any evaluation ofeffectiveness to future periods are subject to the risk that controls may become inadequate because of changes in conditions, or that the degree of compliancewith the policies or procedures may deteriorate.
/s/ PRICEWATERHOUSECOOPERS LLP
Austin, TexasMarch 13, 2012
58

Table of Contents
DELL INC.
CONSOLIDATED STATEMENTS OF FINANCIAL POSITION(in millions)
February 3,2012
January 28,2011
ASSETS
Current assets:
Cash and cash equivalents $ 13,852 $ 13,913
Short-term investments 966 452
Accounts receivable, net 6,476 6,493
Short-term financing receivables, net 3,327 3,643
Inventories, net 1,404 1,301
Other current assets 3,423 3,219
Total current assets 29,448 29,021
Property, plant, and equipment, net 2,124 1,953
Long-term investments 3,404 704
Long-term financing receivables, net 1,372 799
Goodwill 5,838 4,365
Purchased intangible assets, net 1,857 1,495
Other non-current assets 490 262
Total assets $ 44,533 $ 38,599
LIABILITIES AND STOCKHOLDERS’ EQUITY
Current liabilities:
Short-term debt $ 2,867 $ 851
Accounts payable 11,656 11,293
Accrued and other 3,934 4,181
Short-term deferred services revenue 3,544 3,158
Total current liabilities 22,001 19,483
Long-term debt 6,387 5,146
Long-term deferred services revenue 3,836 3,518
Other non-current liabilities 3,392 2,686
Total liabilities 35,616 30,833
Commitments and contingencies (Note 10)
Stockholders’ equity:
Common stock and capital in excess of $.01 par value; shares authorized: 7,000; shares issued: 3,390 and 3,369,respectively; shares outstanding: 1,761 and 1,918, respectively
12,187 11,797
Treasury stock at cost: 1,154 and 976 shares, respectively (31,445) (28,704)
Retained earnings 28,236 24,744
Accumulated other comprehensive loss (61) (71)
Total stockholders’ equity 8,917 7,766
Total liabilities and stockholders’ equity $ 44,533 $ 38,599
The accompanying notes are an integral part of these consolidated financial statements.
59
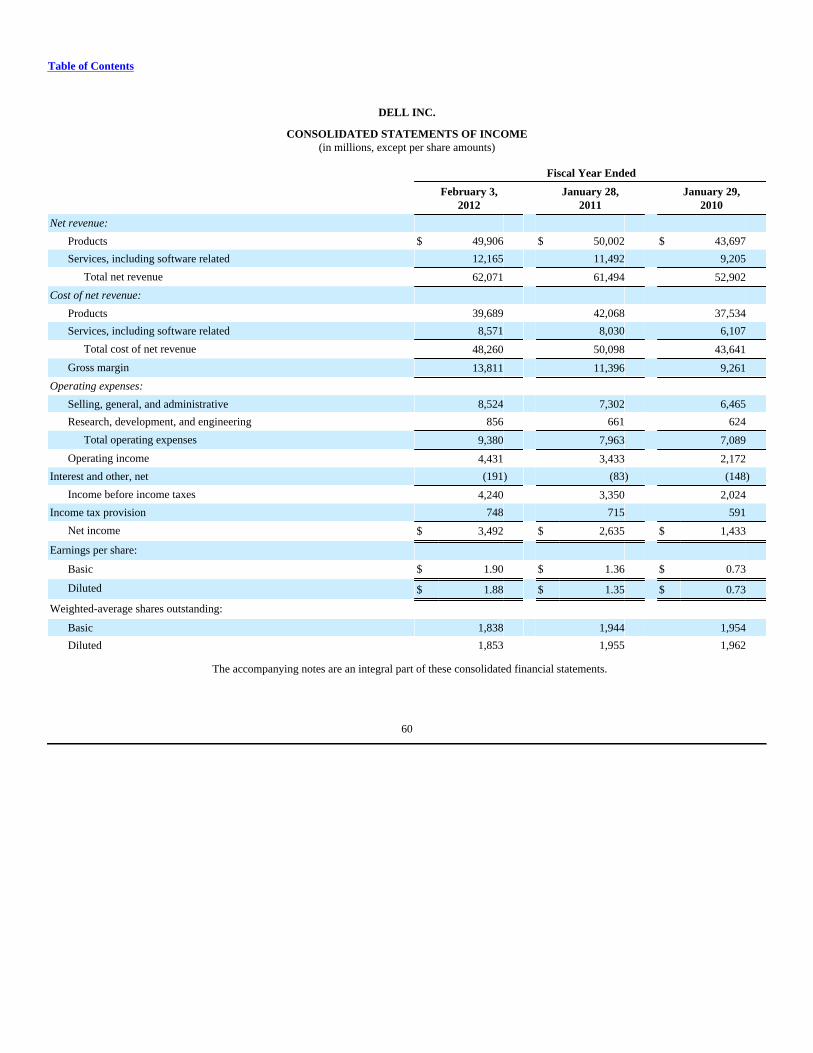
Table of Contents
DELL INC.
CONSOLIDATED STATEMENTS OF INCOME(in millions, except per share amounts)
Fiscal Year Ended
February 3,2012
January 28,2011
January 29,2010
Net revenue:
Products $ 49,906 $ 50,002 $ 43,697
Services, including software related 12,165 11,492 9,205
Total net revenue 62,071 61,494 52,902
Cost of net revenue:
Products 39,689 42,068 37,534
Services, including software related 8,571 8,030 6,107
Total cost of net revenue 48,260 50,098 43,641
Gross margin 13,811 11,396 9,261
Operating expenses:
Selling, general, and administrative 8,524 7,302 6,465
Research, development, and engineering 856 661 624
Total operating expenses 9,380 7,963 7,089
Operating income 4,431 3,433 2,172
Interest and other, net (191) (83) (148)
Income before income taxes 4,240 3,350 2,024
Income tax provision 748 715 591
Net income $ 3,492 $ 2,635 $ 1,433
Earnings per share:
Basic $ 1.90 $ 1.36 $ 0.73
Diluted $ 1.88 $ 1.35 $ 0.73
Weighted-average shares outstanding:
Basic 1,838 1,944 1,954
Diluted 1,853 1,955 1,962
The accompanying notes are an integral part of these consolidated financial statements.
60
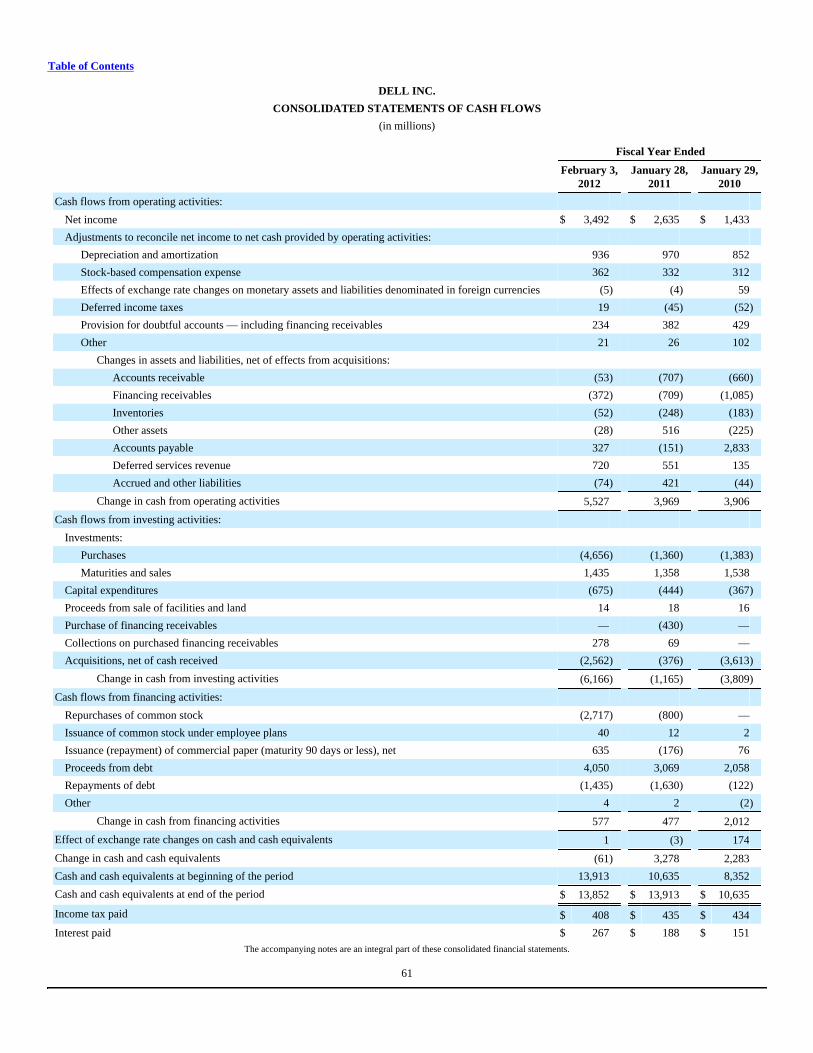
Table of Contents
DELL INC.
CONSOLIDATED STATEMENTS OF CASH FLOWS
(in millions)
Fiscal Year Ended February 3,
2012 January 28,
2011 January 29,
2010
Cash flows from operating activities:
Net income $ 3,492 $ 2,635 $ 1,433
Adjustments to reconcile net income to net cash provided by operating activities:
Depreciation and amortization 936 970 852
Stock-based compensation expense 362 332 312
Effects of exchange rate changes on monetary assets and liabilities denominated in foreign currencies (5) (4) 59
Deferred income taxes 19 (45) (52)
Provision for doubtful accounts — including financing receivables 234 382 429
Other 21 26 102
Changes in assets and liabilities, net of effects from acquisitions:
Accounts receivable (53) (707) (660)
Financing receivables (372) (709) (1,085)
Inventories (52) (248) (183)
Other assets (28) 516 (225)
Accounts payable 327 (151) 2,833
Deferred services revenue 720 551 135
Accrued and other liabilities (74) 421 (44)
Change in cash from operating activities 5,527 3,969 3,906
Cash flows from investing activities:
Investments:
Purchases (4,656) (1,360) (1,383)
Maturities and sales 1,435 1,358 1,538
Capital expenditures (675) (444) (367)
Proceeds from sale of facilities and land 14 18 16
Purchase of financing receivables — (430) —
Collections on purchased financing receivables 278 69 —
Acquisitions, net of cash received (2,562) (376) (3,613)
Change in cash from investing activities (6,166) (1,165) (3,809)
Cash flows from financing activities:
Repurchases of common stock (2,717) (800) —
Issuance of common stock under employee plans 40 12 2
Issuance (repayment) of commercial paper (maturity 90 days or less), net 635 (176) 76
Proceeds from debt 4,050 3,069 2,058
Repayments of debt (1,435) (1,630) (122)
Other 4 2 (2)
Change in cash from financing activities 577 477 2,012
Effect of exchange rate changes on cash and cash equivalents 1 (3) 174
Change in cash and cash equivalents (61) 3,278 2,283
Cash and cash equivalents at beginning of the period 13,913 10,635 8,352
Cash and cash equivalents at end of the period $ 13,852 $ 13,913 $ 10,635
Income tax paid $ 408 $ 435 $ 434
Interest paid $ 267 $ 188 $ 151The accompanying notes are an integral part of these consolidated financial statements.
61
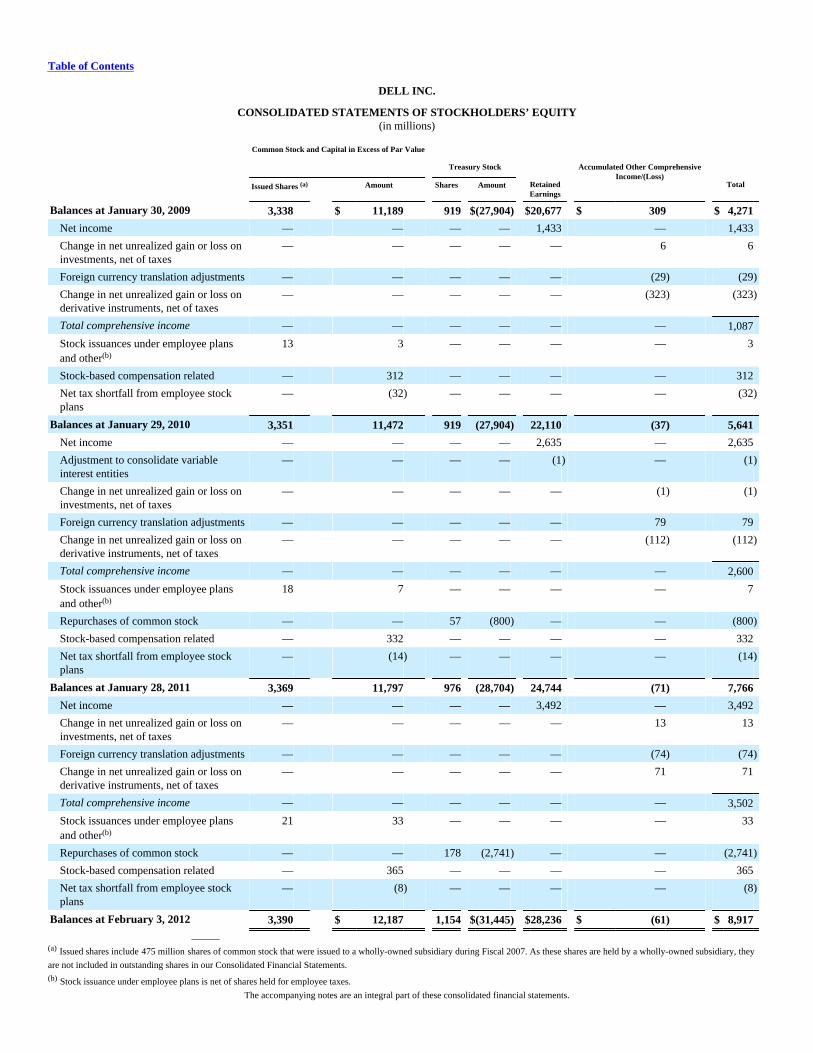
Table of Contents
DELL INC.
CONSOLIDATED STATEMENTS OF STOCKHOLDERS’ EQUITY(in millions)
Common Stock and Capital in Excess of Par Value
Treasury Stock Accumulated Other ComprehensiveIncome/(Loss)
Issued Shares (a) Amount Shares Amount RetainedEarnings
Total
Balances at January 30, 2009 3,338 $ 11,189 919 $(27,904) $20,677 $ 309 $ 4,271
Net income — — — — 1,433 — 1,433
Change in net unrealized gain or loss oninvestments, net of taxes
— — — — — 6 6
Foreign currency translation adjustments — — — — — (29) (29)
Change in net unrealized gain or loss onderivative instruments, net of taxes
— — — — — (323) (323)
Total comprehensive income — — — — — — 1,087
Stock issuances under employee plansand other(b)
13 3 — — — — 3
Stock-based compensation related — 312 — — — — 312
Net tax shortfall from employee stockplans
— (32) — — — — (32)
Balances at January 29, 2010 3,351 11,472 919 (27,904) 22,110 (37) 5,641
Net income — — — — 2,635 — 2,635
Adjustment to consolidate variableinterest entities
— — — — (1) — (1)
Change in net unrealized gain or loss oninvestments, net of taxes
— — — — — (1) (1)
Foreign currency translation adjustments — — — — — 79 79
Change in net unrealized gain or loss onderivative instruments, net of taxes
— — — — — (112) (112)
Total comprehensive income — — — — — — 2,600
Stock issuances under employee plansand other(b)
18 7 — — — — 7
Repurchases of common stock — — 57 (800) — — (800)
Stock-based compensation related — 332 — — — — 332
Net tax shortfall from employee stockplans
— (14) — — — — (14)
Balances at January 28, 2011 3,369 11,797 976 (28,704) 24,744 (71) 7,766
Net income — — — — 3,492 — 3,492
Change in net unrealized gain or loss oninvestments, net of taxes
— — — — — 13 13
Foreign currency translation adjustments — — — — — (74) (74)
Change in net unrealized gain or loss onderivative instruments, net of taxes
— — — — — 71 71
Total comprehensive income — — — — — — 3,502
Stock issuances under employee plansand other(b)
21 33 — — — — 33
Repurchases of common stock — — 178 (2,741) — — (2,741)
Stock-based compensation related — 365 — — — — 365
Net tax shortfall from employee stockplans
— (8) — — — — (8)
Balances at February 3, 2012 3,390 $ 12,187 1,154 $(31,445) $28,236 $ (61) $ 8,917
(a) Issued shares include 475 million shares of common stock that were issued to a wholly-owned subsidiary during Fiscal 2007. As these shares are held by a wholly-owned subsidiary, they
are not included in outstanding shares in our Consolidated Financial Statements.(b) Stock issuance under employee plans is net of shares held for employee taxes.
The accompanying notes are an integral part of these consolidated financial statements.

62
Table of Contents
DELL INC.
NOTES TO CONSOLIDATED FINANCIAL STATEMENTS
NOTE 1 — DESCRIPTION OF BUSINESS AND SUMMARY OF SIGNIFICANT ACCOUNTING POLICIES
Description of Business — Dell Inc., a Delaware corporation (both individually and together with its consolidated subsidiaries, “Dell”), offers a broad rangeof technology solutions, including servers and networking products, storage products, services, software and peripherals, mobility products, and desktop PCs.Dell sells its products and services directly to customers through dedicated sales representatives, telephone-based sales, and online sales, and through a varietyof other sales distribution channels. Dell's business segments are Large Enterprise, Public, Small and Medium Business ("SMB"), and Consumer. Referencesto Commercial business refer to Large Enterprise, Public, and SMB.
Fiscal Year — Dell's fiscal year is the 52 or 53 week period ending on the Friday nearest January 31. The fiscal year ended February 3, 2012 included 53weeks, while the fiscal years ended January 28, 2011 and January 29, 2010 included 52 weeks.
Principles of Consolidation — The accompanying consolidated financial statements include the accounts of Dell Inc. and its wholly-owned subsidiaries andhave been prepared in accordance with accounting principles generally accepted in the United States of America (“GAAP”). All significant intercompanytransactions and balances have been eliminated.
Use of Estimates — The preparation of financial statements in accordance with GAAP requires the use of management's estimates. These estimates aresubjective in nature and involve judgments that affect the reported amounts of assets and liabilities, the disclosure of contingent assets and liabilities at fiscalyear-end, and the reported amounts of revenues and expenses during the fiscal year. Actual results could differ from those estimates.
Cash and Cash Equivalents — All highly liquid investments, including credit card receivables due from banks, with original maturities of 90 days or less atdate of purchase, are reported at fair value and are considered to be cash equivalents. All other investments not considered to be cash equivalents areseparately categorized as investments.
Investments — Dell's investments are primarily in debt securities, which are classified as available-for-sale and are reported at fair value (based primarily onquoted prices and market observable inputs) using the specific identification method. Unrealized gains and losses, net of taxes, are reported as a component ofstockholders’ equity. Realized gains and losses on investments are included in Interest and other, net. An impairment loss will be recognized and will reducean investment's carrying amount to its fair value when a decline in the fair value of an individual security below its cost or carrying value is determined to beother than temporary.
Dell reviews its investment portfolio quarterly to determine if any investment is other than temporarily impaired. Dell determines an impairment is other thantemporary when there is intent to sell the security, it is more likely than not that the security will be required to be sold before recovery in value or it is notexpected to recover its entire amortized cost basis (“credit-related loss”). However, if Dell does not expect to sell a debt security, it still evaluates expectedcash flows to be received and determines if a credit-related loss exists. In the event of a credit-related loss, only the amount of impairment associated with thecredit-related loss is recognized in earnings. Amounts relating to factors other than credit-related losses are recorded as a component of stockholders' equity.See Note 3 of the Notes to Consolidated Financial Statements for additional information.
Allowance for Doubtful Accounts — Dell recognizes an allowance for losses on accounts receivable in an amount equal to the estimated probable losses netof recoveries. The allowance is based on an analysis of historical bad debt experience, current receivables aging, and expected future write-offs, as well as anassessment of specific identifiable customer accounts considered at risk or uncollectible. The expense associated with the allowance for doubtful accounts isrecognized in Selling, general, and administrative expenses.
Financing Receivables —
Financing receivables consist of customer receivables and residual interest. Customer receivables include revolving loans and fixed-term leases and loansresulting primarily from the sale of Dell products and services. Based on how Dell assesses risk and determines the appropriate allowance levels, Dell has twoportfolio segments, (1) fixed-term leases and loans and (2) revolving loans. Portfolio segments are further segregated into classes based on operating segmentand whether the receivable was owned by Dell since its inception or was purchased subsequent to its inception. Financing receivables are presented net of theallowance for losses.
Dell retains a residual interest in equipment leased under its fixed-term lease programs. The amount of the residual interest is established at the inception ofthe lease based upon estimates of the value of the equipment at the end of the lease term using historical studies, industry data, and future value-at-riskdemand valuation methods. On a quarterly
63
Table of ContentsDELL INC.
NOTES TO CONSOLIDATED FINANCIAL STATEMENTS (Continued)
basis, Dell assesses the carrying amount of its recorded residual values for impairment. Anticipated declines in specific future residual values that areconsidered to be other-than-temporary are recorded currently in earnings.
Allowance for Financing Receivables Losses
Dell recognizes an allowance for losses on financing receivables in an amount equal to the probable losses net of recoveries. The allowance for losses isgenerally determined at the aggregate portfolio level based on a variety of factors, including historical and anticipated experience, past due receivables,receivable type, and customer risk profile. Customer account principal and interest are charged to the allowance for losses when an account is deemed to beuncollectible or generally when the account is 180 days delinquent. While Dell does not generally place financing receivables on non-accrual status during thedelinquency period, accrued interest is included in the allowance for loss calculation and Dell is therefore adequately reserved in the event of charge off.Recoveries on receivables previously charged off as uncollectible are recorded to the allowance for financing receivables losses. The expense associated withthe allowance for financing receivables losses is recognized as cost of net revenue. Both fixed and revolving receivable loss rates are affected bymacroeconomic conditions, including the level of GDP growth, unemployment rates, the level of commercial capital equipment investment, and the creditquality of the borrower.
Asset Securitization
Dell enters into securitization transactions to transfer certain financing receivables to special purpose entities. During Fiscal 2011, Dell adopted the newaccounting guidance that removes the concept of a qualifying special purpose entity and removes the exception from applying variable interest entityaccounting. The adoption of the new guidance requires an entity to perform an ongoing analysis to determine whether it has a controlling financial interest inits special purpose entities. As a result of this analysis, Dell has determined that it has a controlling financial interest in its special purpose entities, andtherefore, consolidated them into Dell's Consolidated Statements of Financial Position as of February 3, 2012 and January 28, 2011. The asset securitizationsin these special purpose entities are being accounted for as secured borrowings. See Note 4 of Notes to Consolidated Financial Statements for additionalinformation on the impact of the consolidation.
Inventories — Inventories are stated at the lower of cost or market with cost being determined on a first-in, first-out basis.
Property, Plant, and Equipment — Property, plant, and equipment are carried at depreciated cost. Depreciation is provided using the straight-line method overthe estimated economic lives of the assets, which range from ten to thirty years for buildings and two to five years for all other assets. Leaseholdimprovements are amortized over the shorter of five years or the lease term. Gains or losses related to retirements or disposition of fixed assets are recognizedin the period incurred. Dell capitalizes eligible internal-use software development costs incurred subsequent to the completion of the preliminary project stage.Development costs are amortized over the shorter of the expected useful life of the software or five years. Costs associated with maintenance and minorenhancements to the features and functionality of Dell's website are expensed as incurred.
Impairment of Long-Lived Assets — Dell reviews long-lived assets for impairment when circumstances indicate the carrying amount of an asset may not berecoverable based on the undiscounted future cash flows of the asset. If the carrying amount of the asset is determined not to be recoverable, a write-down tofair value is recorded. Fair values are determined based on quoted market values, discounted cash flows, or external appraisals, as applicable. Dell reviewslong-lived assets for impairment at the individual asset or the asset group level for which the lowest level of independent cash flows can be identified.
Business Combinations — Dell accounts for business combinations using the acquisition method of accounting, and accordingly, the assets and liabilities ofthe acquired business are recorded at their fair values at the date of acquisition. The excess of the purchase price over the estimated fair values is recorded asgoodwill. Any changes in the estimated fair values of the net assets recorded for acquisitions prior to the finalization of more detailed analysis, but not toexceed one year from the date of acquisition, will change the amount of the purchase prices allocable to goodwill. All acquisition costs are expensed asincurred and in-process research and development costs are recorded at fair value as an indefinite-lived intangible asset and assessed for impairment thereafteruntil completion, at which point the asset is amortized over its expected useful life. Any restructuring charges associated with a business combination areexpensed subsequent to the acquisition date. The results of operations of acquired businesses are included in the Consolidated Financial Statements from theacquisition date.
Intangible Assets Including Goodwill— Identifiable intangible assets with finite lives are amortized over their estimated useful lives. They are generallyamortized on a non-straight-line approach based on the associated projected cash flows in order to match the amortization pattern to the pattern in which theeconomic benefits of the assets are expected to be consumed. Intangible assets are reviewed for impairment if indicators of potential impairment exist.Goodwill and indefinite-lived intangible assets are tested for impairment on an annual basis in the second fiscal quarter, or sooner if an indicator of
64
Table of ContentsDELL INC.
NOTES TO CONSOLIDATED FINANCIAL STATEMENTS (Continued)
impairment occurs.
Foreign Currency Translation — The majority of Dell's international sales are made by international subsidiaries, most of which have the U.S. dollar as theirfunctional currency. Dell's subsidiaries that do not have the U.S. dollar as their functional currency translate assets and liabilities at current rates of exchangein effect at the balance sheet date. Revenue and expenses from these international subsidiaries are translated using the monthly average exchange rates ineffect for the period in which the items occur. These translations resulted in cumulative foreign currency translation gains (losses) of $(35) million , $39million, and $(40) million as of February 3, 2012, January 28, 2011, and January 29, 2010, respectively, and are included as a component of accumulatedother comprehensive income (loss) in stockholders’ equity.
Local currency transactions of international subsidiaries that have the U.S. dollar as the functional currency are remeasured into U.S. dollars using currentrates of exchange for monetary assets and liabilities and historical rates of exchange for non-monetary assets and liabilities. Gains and losses fromremeasurement of monetary assets and liabilities are included in Interest and other, net. See Note 6 of Notes to Consolidated Financial Statements foradditional information.
Hedging Instruments — Dell uses derivative financial instruments, primarily forwards, options, and swaps, to hedge certain foreign currency and interest rateexposures. The relationships between hedging instruments and hedged items, as well as the risk management objectives and strategies for undertaking hedgetransactions, are formally documented. Dell does not use derivatives for speculative purposes.
All derivative instruments are recognized as either assets or liabilities on the Consolidated Statements of Financial Position and are measured at fair value.Hedge accounting is applied based upon the criteria established by accounting guidance for derivative instruments and hedging activities. Derivatives areassessed for hedge effectiveness both at the onset of the hedge and at regular intervals throughout the life of the derivative. Any hedge ineffectiveness isrecognized currently in earnings as a component of Interest and other, net. Dell's hedge portfolio includes derivatives designated as both cash flow and fairvalue hedges.
For derivative instruments that are designated as cash flow hedges, hedge ineffectiveness is measured by comparing the cumulative change in the fair value ofthe hedge contract with the cumulative change in the fair value of the hedged item, both of which are based on forward rates. Dell records the effective portionof the gain or loss on the derivative instrument in accumulated other comprehensive income (loss) (“OCI”), as a separate component of stockholders' equityand reclassifies the gain or loss into earnings in the period during which the hedged transaction is recognized in earnings.
For derivatives that are designated as fair value hedges, hedge ineffectiveness is measured by calculating the periodic change in the fair value of the hedgecontract and the periodic change in the fair value of the hedged item. To the extent that these fair value changes do not fully offset each other, the difference isrecorded as ineffectiveness in earnings as a component of Interest and other, net.
For derivatives that are not designated as hedges or do not qualify for hedge accounting treatment, Dell recognizes the change in the instrument's fair valuecurrently in earnings as a component of interest and other, net.
Cash flows from derivative instruments are presented in the same category on the Consolidated Statements of Cash Flows as the cash flows from theunderlying hedged items. See Note 6 of the Notes to Consolidated Financial Statements for a description of Dell's derivative financial instrument activities.
Revenue Recognition — Net revenues include sales of hardware, software and peripherals, and services. Dell recognizes revenue for these products andservices when it is realized or realizable and earned. Revenue is considered realized and earned when persuasive evidence of an arrangement exists; deliveryhas occurred or services have been rendered; Dell's fee to its customer is fixed and determinable; and collection of the resulting receivable is reasonablyassured.
Dell classifies revenue and cost of revenue related to stand-alone software sold with Post Contract Support ("PCS") in the same line item as services on theConsolidated Statements of Income. Services revenue and cost of services revenue captions on the Consolidated Statements of Income include Dell's servicesand software from Dell's software and peripherals product category. This software revenue and related costs include software license fees and related PCS thatis sold separately from computer systems through Dell's software and peripherals product category.
65
Table of ContentsDELL INC.
NOTES TO CONSOLIDATED FINANCIAL STATEMENTS (Continued)
ProductsRevenue from the sale of products is recognized when title and risk of loss passes to the customer. Delivery is considered complete when products have beenshipped to Dell's customer, title and risk of loss has transferred to the customer, and customer acceptance has been satisfied. Customer acceptance is satisfiedif acceptance is obtained from the customer, if all acceptance provisions lapse, or if Dell has evidence that all acceptance provisions have been satisfied.
Dell records reductions to revenue for estimated customer sales returns, rebates, and certain other customer incentive programs. These reductions to revenueare made based upon reasonable and reliable estimates that are determined by historical experience, contractual terms, and current conditions. The primaryfactors affecting Dell's accrual for estimated customer returns include estimated return rates as well as the number of units shipped that have a right of returnthat has not expired as of the balance sheet date. If returns cannot be reliably estimated, revenue is not recognized until a reliable estimate can be made or thereturn right lapses.
Dell sells its products directly to customers as well as through other distribution channels, such as retailers, distributors, and resellers. Dell recognizes revenueon these sales when the reseller has economic substance apart from Dell; any credit risk has been identified and quantified; title and risk of loss has passed tothe sales channel; the fee paid to Dell is not contingent upon resale or payment by the end user; and Dell has no further obligations related to bringing aboutresale or delivery.
Sales through Dell's distribution channels are primarily made under agreements allowing for limited rights of return, price protection, rebates, and marketingdevelopment funds. Dell has generally limited return rights through contractual caps or has an established selling history for these arrangements. Therefore,there is sufficient data to establish reasonable and reliable estimates of returns for the majority of these sales. To the extent price protection or return rights arenot limited and a reliable estimate cannot be made, all of the revenue and related costs are deferred until the product has been sold to the end-user or the rightsexpire. Dell records estimated reductions to revenue or an expense for distribution channel programs at the later of the offer or the time revenue is recognized.
Dell defers the cost of shipped products awaiting revenue recognition until revenue is recognized.
ServicesServices include transactional, outsourcing and project-based offerings. Revenue is recognized for services contracts as earned, which is generally on astraight-line basis over the term of the contract or on a proportional performance basis as the services are rendered and Dell's obligations are fulfilled.Revenue from time and materials or cost-plus contracts is recognized as the services are performed. Revenue from fixed price contracts is recognized on astraight line basis, unless revenue is earned and obligations are fulfilled in a different pattern. These service contracts may include provisions for cancellation,termination, refunds, or service level adjustments. These contract provisions would not have a significant impact on recognized revenue as Dell generallyrecognizes revenue for these contracts as the services are performed.
For sales of extended warranties with a separate contract price, Dell defers revenue equal to the separately stated price. Revenue associated with undeliveredelements is deferred and recorded when delivery occurs or services are provided. Revenue from extended warranty and service contracts, for which Dell isobligated to perform, is recorded as deferred revenue and subsequently recognized over the term of the contract on a straight-line basis.
Revenue from sales of third-party extended warranty and service contracts or software PCS, for which Dell is not obligated to perform, and for which Delldoes not meet the criteria for gross revenue recognition under the guidance of the Financial Accounting Standards Board (the "FASB"), is recognized on a netbasis. All other revenue is recognized on a gross basis.
SoftwareDell recognizes revenue in accordance with industry specific software accounting guidance for all software and PCS that are not essential to the functionalityof the hardware. Accounting for software that is essential to the functionality of the hardware is accounted for as specified below under “MultipleDeliverables.” Dell has established vendor specific objective evidence ("VSOE") on a limited basis for certain software offerings. When Dell has notestablished VSOE to support a separation of the software license and PCS elements, the revenue and related costs are generally
66

Table of Contents DELL INC.
NOTES TO CONSOLIDATED FINANCIAL STATEMENTS (Continued)
recognized over the term of the agreement.
In September 2009, the FASB issued revised guidance, which excluded sales of tangible products that contain essential software elements from the scope ofsoftware revenue recognition guidance. Accordingly, beginning in the first quarter of Fiscal 2011, certain Dell storage products were removed from the scopeof software revenue recognition guidance. Prior to the new guidance, Dell established fair value for PCS for these products based on VSOE and used theresidual method to allocate revenue to the delivered elements. Under the revised guidance, the revenue for what was previously deemed PCS is nowconsidered part of a multiple deliverable arrangement. As such, any discount is allocated to all elements based on the relative selling price of both deliveredand undelivered elements. The impact of applying this new guidance was not material to Dell's Consolidated Financial Statements for Fiscal 2011 or 2010.
Multiple DeliverablesDell's multiple deliverable arrangements generally include hardware products that are sold with essential software or services such as extended warranty,installation, maintenance, and other services contracts. Dell's service contracts may include a combination of services arrangements, including deployment,asset recovery, recycling, IT outsourcing, consulting, applications development, applications maintenance, and business process services. The nature andterms of these multiple deliverable arrangements will vary based on the customized needs of Dell's customers. Each of these deliverables in an arrangementtypically represents a separate unit of accounting.
In the first quarter of Fiscal 2011, based on new guidance, Dell began allocating revenue to all deliverables in a multiple-element arrangement based on therelative selling price of that deliverable. The hierarchy to be used to determine the selling price of a deliverable is: (1) VSOE, (2) third-party evidence ofselling price (“TPE”), and (3) best estimate of the selling price (“ESP”). A majority of Dell product and service offerings are sold on a stand-alone basis.Because selling price is generally available based on stand-alone sales, Dell has limited application of TPE, as determined by comparison of pricing forproducts and services to the pricing of similar products and services as offered by Dell or its competitors in stand-alone sales to similarly situated customers.As new products are introduced in future periods, Dell may be required to use TPE or ESP, depending on the specific facts at the time.
For Fiscal 2010, pursuant to the previous guidance for Revenue Arrangements with Multiple Deliverables , Dell allocated revenue from multiple elementarrangements to the elements based on the relative fair value of each element, which was generally based on the relative sales price of each element when soldseparately. The adoption of the new guidance in the first quarter of Fiscal 2011 did not change the manner in which Dell accounts for its multiple deliverablearrangements as Dell did not use the residual method for the majority of its offerings and its services offerings are generally sold on a stand-alone basis whereevidence of selling price is available.
OtherDell records revenue from the sale of equipment under sales-type leases as product revenue in an amount equal to the present value of minimum leasepayments at the inception of the lease. Sales-type leases also produce financing income, which is included in net revenue in the Consolidated Statements ofIncome and is recognized at consistent rates of return over the lease term. Dell also offers qualified customers revolving credit lines for the purchase ofproducts and services offered by Dell. Financing income attributable to these revolving loans is recognized in net revenue on an accrual basis.
Dell reports revenue net of any revenue-based taxes assessed by governmental authorities that are imposed on and concurrent with specific revenue-producingtransactions.
Standard Warranty Liabilities — Dell records warranty liabilities for its standard limited warranty at the time of sale for the estimated costs that may beincurred under its limited warranty. The liability for standard warranties is included in accrued and other current and other non-current liabilities on theConsolidated Statements of Financial Position. The specific warranty terms and conditions vary depending upon the product sold and the country in whichDell does business, but generally includes technical support, parts, and labor over a period ranging from one to three years. Fa ctors that affect Dell's warrantyliability include the number of installed units currently under warranty, historical and anticipated rates of warranty claims on those units, and cost per claim tosatisfy Dell's warranty obligation. The anticipated rate of warranty claims is the primary factor impacting the estimated warranty obligation. The other factorsare less significant due to the fact that the average remaining aggregate warranty period of the covered installed base is approximately 15 months, repair partsare generally already in stock or available at pre-determined prices, and labor rates are generally arranged at pre-established amounts with service providers.
67
Table of Contents DELL INC.
NOTES TO CONSOLIDATED FINANCIAL STATEMENTS (Continued)
Warranty claims are relatively predictable based on historical experience of failure rates. If actual results differ from the estimates, Dell revises its estimatedwarranty liability. Each quarter, Dell reevaluates its estimates to assess the adequacy of its recorded warranty liabilities and adjusts the amounts as necessary.
Deferred Services Revenue — Deferred services revenue primarily represents amounts received in advance for extended warranty sales and services contracts.Revenue from the sale of extended warranties and services contracts is recognized over the term of the contract or when the service is completed, and thecosts associated with these contracts are recognized as incurred. As of February 3, 2012, and January 28, 2011, the majority of deferred services revenue isrelated to extended warranties.
Vendor Rebates — Dell may receive consideration from vendors in the normal course of business. Certain of these funds are rebates of purchase price paidand others are related to reimbursement of costs incurred by Dell to sell the vendor's products. Dell recognizes a reduction of cost of goods sold and inventoryif the funds are a reduction of the price of the vendor's products. If the consideration is a reimbursement of costs incurred by Dell to sell or develop thevendor's products, then the consideration is classified as a reduction of that cost in the Consolidated Statements of Income, most often operating expenses. Inorder to be recognized as a reduction of operating expenses, the reimbursement must be for a specific, incremental, identifiable cost incurred by Dell in sellingthe vendor's products or services.
Loss Contingencies — Dell is subject to the possibility of various losses arising in the ordinary course of business. Dell considers the likelihood of loss orimpairment of an asset or the incurrence of a liability, as well as Dell's ability to reasonably estimate the amount of loss, in determining loss contingencies. Anestimated loss contingency is accrued when it is probable that an asset has been impaired or a liability has been incurred and the amount of loss can bereasonably estimated. Dell regularly evaluates current information available to determine whether such accruals should be adjusted and whether new accrualsare required.
Shipping Costs — Dell's shipping and handling costs are included in cost of sales in the Consolidated Statements of Income.
Selling, General, and Administrative — Selling expenses include items such as sales salaries and commissions, marketing and advertising costs, andcontractor services. Advertising costs are expensed as incurred and were $860 million, $730 million, and $619 million, during Fiscal 2012, Fiscal 2011, andFiscal 2010, respectively. Advertising costs are included in Selling, general, and administrative in the Consolidated Statements of Income. General andadministrative expenses include items for Dell's administrative functions, such as Finance, Legal, Human Resources, and Information Technology support.These functions include costs for items such as salaries, maintenance and supplies, insurance, depreciation expense, and allowance for doubtful accounts.
Research, Development, and Engineering Costs — Research, development, and engineering costs are expensed as incurred. Research, development, andengineering expenses primarily include payroll and headcount related costs, contractor fees, infrastructure costs, and administrative expenses directly relatedto research and development support.
Income Taxes — Deferred tax assets and liabilities are recorded based on the difference between the financial statement and tax basis of assets and liabilitiesusing enacted tax rates in effect for the year in which the differences are expected to reverse. Dell calculates a provision for income taxes using the asset andliability method, under which deferred tax assets and liabilities are recognized by identifying the temporary differences arising from the different treatment ofitems for tax and accounting purposes. In determining the future tax consequences of events that have been recognized in the financial statements or taxreturns, judgment and interpretation of statutes are required. Additionally, Dell uses tax planning strategies as a part of its global tax compliance program.Judgments and interpretation of statutes are inherent in this process.
The accounting guidance for uncertainties in income tax prescribes a comprehensive model for the financial statement recognition, measurement,presentation, and disclosure of uncertain tax positions taken or expected to be taken in income tax returns. Dell recognizes a tax benefit from an uncertain taxposition in the financial statements only when it is more likely than not that the position will be sustained upon examination, including resolution of anyrelated appeals or litigation processes, based on the technical merits and a consideration of the relevant taxing authority's administrative practices andprecedents.
Earnings Per Share — Basic earnings per share is based on the weighted-average effect of all common shares issued and outstanding, and is calculated bydividing net income by the weighted-average shares outstanding during the period. Diluted earnings per share is calculated by dividing net income by theweighted-average number of common shares used in the basic earnings per share calculation plus the number of common shares that would be issuedassuming exercise or conversion of all potentially dilutive common shares outstanding. Dell excludes equity instruments from the calculation of dilutedearnings per share if the effect of including such instruments is anti-dilutive. See Note 12 of the Notes to Consolidated Financial Statements for furtherinformation on earnings per share.
68
Table of ContentsDELL INC.
NOTES TO CONSOLIDATED FINANCIAL STATEMENTS (Continued)
Stock-Based Compensation — Dell measures stock-based compensation expense for all share-based awards granted based on the estimated fair value of thoseawards at grant date. The cost of restricted stock units and performance-based restricted stock units is determined using the fair market value of Dell'scommon stock on the date of grant. Dell generally estimates the fair value of stock option awards using the Black-Scholes valuation model. Thecompensation costs of stock options, restricted stock units, and awards with a cliff vesting feature are recognized net of any estimated forfeitures on a straight-line basis over the employee requisite service period. Compensation cost for performance-based awards is recognized on a graded accelerated basis net ofestimated forfeitures over the requisite service period when achievement of the performance conditions are considered probable. Forfeiture rates areestimated at grant date based on historical experience and adjusted in subsequent periods for differences in actual forfeitures from those estimates. SeeNote 14 of the Notes to Consolidated Financial Statements included for further discussion of stock-based compensation.
Recently Issued Accounting Pronouncements
Credit Quality of Financing Receivables and the Allowance for Credit Losses — In July 2010, the FASB issued a new pronouncement that requires enhanceddisclosures regarding the nature of credit risk inherent in an entity's portfolio of financing receivables, how that risk is analyzed, and the changes and reasonsfor those changes in the allowance for credit losses. These new disclosures require information for both the financing receivables and the related allowance forcredit losses at more disaggregated levels. Disclosures related to information as of the end of a reporting period became effective for Dell in Fiscal 2011.Specific disclosures regarding activities that occur during a reporting period were required for Dell beginning in the first quarter of Fiscal 2012. As thesechanges relate only to disclosures, they did not impact Dell's Consolidated Financial Statements.
Fair Value Measurements — In May 2011, the FASB issued new guidance on fair value measurements, which clarifies how a principal market is determined,how and when the valuation premise of highest and best use applies, and how premiums and discounts are applied, as well as requiring new disclosures. Thisnew guidance is effective for Dell for the fiscal year ending February 1, 2013. Early application is not permitted. Other than requiring additional disclosures,Dell does not expect that this new guidance will impact Dell's Consolidated Financial Statements.
Comprehensive Income — In June 2011, the FASB issued new guidance on presentation of comprehensive income. The new guidance eliminates the optionto present components of other comprehensive income as part of the statement of changes in stockholders' equity and requires an entity to present either onecontinuous statement of net income and other comprehensive income or two separate, but consecutive statements. This new guidance relates only topresentation. Dell will present a separate statement of comprehensive income beginning in the first quarter of the fiscal year ending February 1, 2013.
Intangibles- Goodwill and Other — In September 2011, the FASB issued new guidance that will simplify how entities test goodwill for impairment. Afterassessment of certain qualitative factors, if it is determined to be more likely than not that the fair value of a reporting unit is less than its carrying amount,entities must perform a quantitative analysis of the goodwill impairment test. Otherwise, the quantitative test becomes optional. This new guidance is effectivefor Dell for the first quarter of the fiscal year ending February 1, 2013. Early adoption is permitted. Dell does not expect that this new guidance will impactDell's Consolidated Financial Statements.
Disclosures about Offsetting Assets and Liabilities — In December 2011, the FASB issued new guidance that will enhance disclosure requirements about thenature of an entity’s right to offset and related arrangements associated with its financial instruments and derivative instruments. This new guidance requiresthe disclosure of the gross amounts subject to rights of offset, amounts offset in accordance with the accounting standards followed, and the related netexposure. This new guidance will be effective for Dell for the first quarter of the fiscal year ending January 31, 2014. Early adoption is not permitted. Otherthan requiring additional disclosures, Dell does not expect that this new guidance will impact Dell's Consolidated Financial Statements.
69
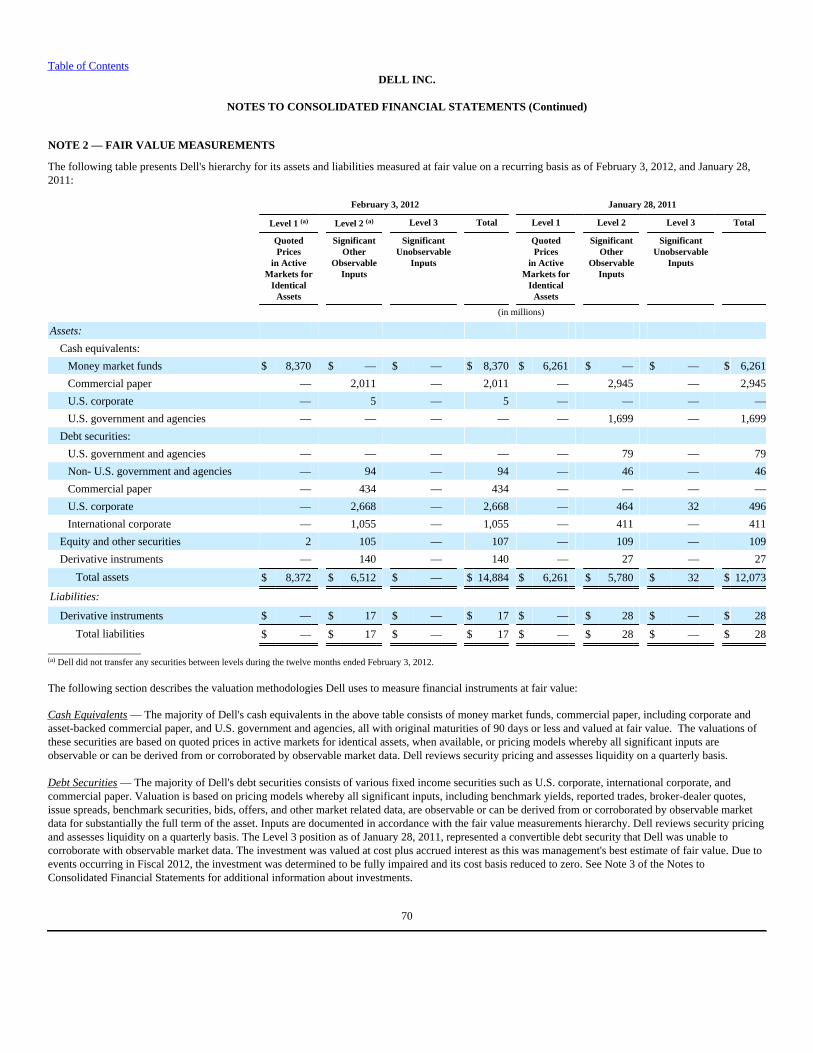
Table of ContentsDELL INC.
NOTES TO CONSOLIDATED FINANCIAL STATEMENTS (Continued)
NOTE 2 — FAIR VALUE MEASUREMENTS
The following table presents Dell's hierarchy for its assets and liabilities measured at fair value on a recurring basis as of February 3, 2012, and January 28,2011:
February 3, 2012 January 28, 2011
Level 1 (a) Level 2 (a) Level 3 Total Level 1 Level 2 Level 3 Total
QuotedPrices
in ActiveMarkets for
IdenticalAssets
SignificantOther
ObservableInputs
SignificantUnobservable
Inputs
QuotedPrices
in ActiveMarkets for
IdenticalAssets
SignificantOther
ObservableInputs
SignificantUnobservable
Inputs
(in millions)
Assets:
Cash equivalents:
Money market funds $ 8,370 $ — $ — $ 8,370 $ 6,261 $ — $ — $ 6,261
Commercial paper — 2,011 — 2,011 — 2,945 — 2,945
U.S. corporate — 5 — 5 — — — —
U.S. government and agencies — — — — — 1,699 — 1,699
Debt securities:
U.S. government and agencies — — — — — 79 — 79
Non- U.S. government and agencies — 94 — 94 — 46 — 46
Commercial paper — 434 — 434 — — — —
U.S. corporate — 2,668 — 2,668 — 464 32 496
International corporate — 1,055 — 1,055 — 411 — 411
Equity and other securities 2 105 — 107 — 109 — 109
Derivative instruments — 140 — 140 — 27 — 27
Total assets $ 8,372 $ 6,512 $ — $ 14,884 $ 6,261 $ 5,780 $ 32 $ 12,073
Liabilities:
Derivative instruments $ — $ 17 $ — $ 17 $ — $ 28 $ — $ 28
Total liabilities $ — $ 17 $ — $ 17 $ — $ 28 $ — $ 28____________________(a) Dell did not transfer any securities between levels during the twelve months ended February 3, 2012.
The following section describes the valuation methodologies Dell uses to measure financial instruments at fair value:
Cash Equivalents — The majority of Dell's cash equivalents in the above table consists of money market funds, commercial paper, including corporate andasset-backed commercial paper, and U.S. government and agencies, all with original maturities of 90 days or less and valued at fair value. The valuations ofthese securities are based on quoted prices in active markets for identical assets, when available, or pricing models whereby all significant inputs areobservable or can be derived from or corroborated by observable market data. Dell reviews security pricing and assesses liquidity on a quarterly basis.
Debt Securities — The majority of Dell's debt securities consists of various fixed income securities such as U.S. corporate, international corporate, andcommercial paper. Valuation is based on pricing models whereby all significant inputs, including benchmark yields, reported trades, broker-dealer quotes,issue spreads, benchmark securities, bids, offers, and other market related data, are observable or can be derived from or corroborated by observable marketdata for substantially the full term of the asset. Inputs are documented in accordance with the fair value measurements hierarchy. Dell reviews security pricingand assesses liquidity on a quarterly basis. The Level 3 position as of January 28, 2011, represented a convertible debt security that Dell was unable tocorroborate with observable market data. The investment was valued at cost plus accrued interest as this was management's best estimate of fair value. Due toevents occurring in Fiscal 2012, the investment was determined to be fully impaired and its cost basis reduced to zero. See Note 3 of the Notes toConsolidated Financial Statements for additional information about investments.
70
Table of Contents DELL INC.
NOTES TO CONSOLIDATED FINANCIAL STATEMENTS (Continued)
Equity and Other Securities — The majority of Dell's investments in equity and other securities consists of various mutual funds held in Dell's DeferredCompensation Plan. The valuation of these securities is based on pricing models whereby all significant inputs are observable or can be derived from orcorroborated by observable market data. The Level 1 position consists of equity investments which began trading during Fiscal 2012. The valuations arebased on quoted prices in active markets. These investments were previously accounted for under the cost method.
Derivative Instruments — Dell's derivative financial instruments consist primarily of foreign currency forward and purchased option contracts and interestrate swaps. The fair value of the portfolio is determined using valuation models based on market observable inputs, including interest rate curves, forward andspot prices for currencies, and implied volatilities . Credit risk is factored into the fair value calculation of Dell's derivative instrument portfolio. For interestrate derivative instruments, credit risk is determined at the contract level with the use of credit default spreads of either Dell, when in a net liability position,or the relevant counterparty, when in a net asset position. For foreign exchange derivative instruments, credit risk is determined in a similar manner, exceptthat the credit default spread is applied based on the net position of each counterparty with the use of the appropriate credit default spreads. See Note 6 of theNotes to Consolidated Financial Statements for a description of Dell's derivative financial instrument activities.
Assets and Liabilities Measured at Fair Value on a Nonrecurring Basis — Certain assets are measured at fair value on a nonrecurring basis and therefore arenot included in the recurring fair value table above. These assets consist primarily of investments accounted for under the cost method and non-financialassets such as goodwill and intangible assets. Investments accounted for under the cost method included in equity and other securities, approximated $12million and $15 million, on February 3, 2012, and January 28, 2011, respectively. Goodwill and intangible assets are measured at fair value initially andsubsequently when there is an indicator of impairment and the impairment is recognized. See Note 8 of the Notes to Consolidated Financial Statements foradditional information about goodwill and intangible assets.
71
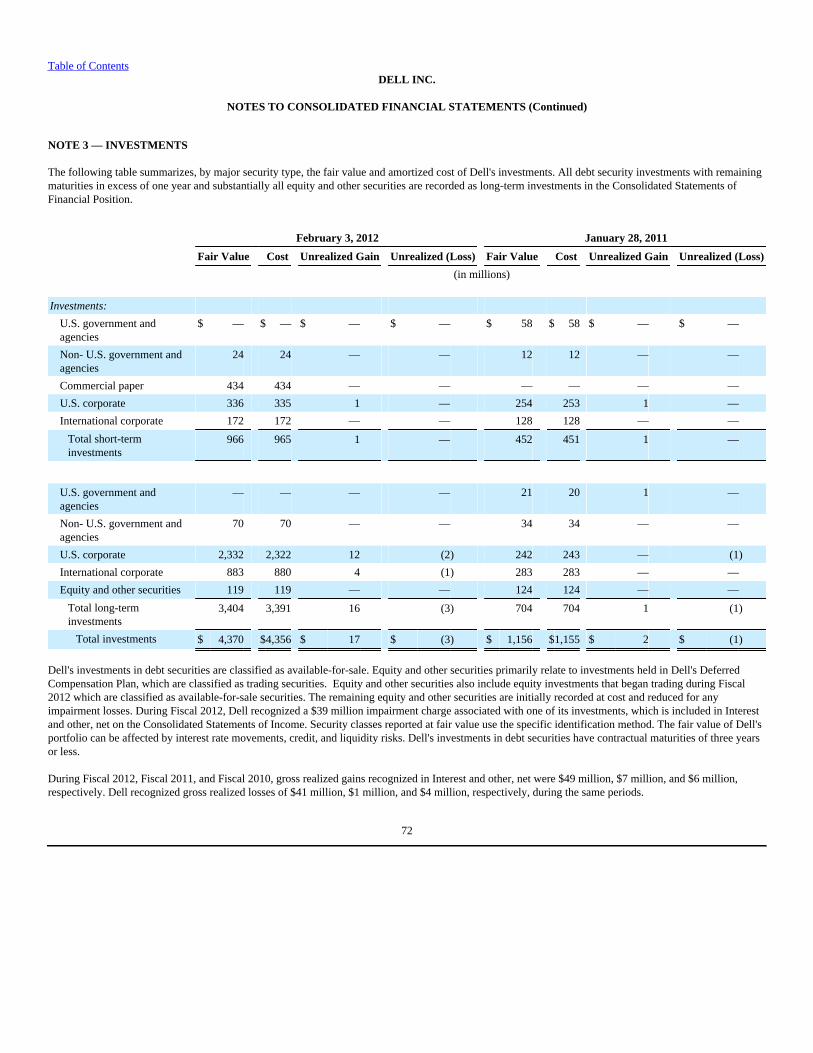
Table of Contents DELL INC.
NOTES TO CONSOLIDATED FINANCIAL STATEMENTS (Continued)
NOTE 3 — INVESTMENTS
The following table summarizes, by major security type, the fair value and amortized cost of Dell's investments. All debt security investments with remainingmaturities in excess of one year and substantially all equity and other securities are recorded as long-term investments in the Consolidated Statements ofFinancial Position.
February 3, 2012 January 28, 2011
Fair Value Cost Unrealized Gain Unrealized (Loss) Fair Value Cost Unrealized Gain Unrealized (Loss)
(in millions)
Investments:
U.S. government andagencies
$ — $ — $ — $ — $ 58 $ 58 $ — $ —
Non- U.S. government andagencies
24 24 — — 12 12 — —
Commercial paper 434 434 — — — — — —
U.S. corporate 336 335 1 — 254 253 1 —
International corporate 172 172 — — 128 128 — —
Total short-terminvestments
966 965 1 — 452 451 1 —
U.S. government andagencies
— — — — 21 20 1 —
Non- U.S. government andagencies
70 70 — — 34 34 — —
U.S. corporate 2,332 2,322 12 (2) 242 243 — (1)
International corporate 883 880 4 (1) 283 283 — —
Equity and other securities 119 119 — — 124 124 — —
Total long-terminvestments
3,404 3,391 16 (3) 704 704 1 (1)
Total investments $ 4,370 $4,356 $ 17 $ (3) $ 1,156 $1,155 $ 2 $ (1)
Dell's investments in debt securities are classified as available-for-sale. Equity and other securities primarily relate to investments held in Dell's DeferredCompensation Plan, which are classified as trading securities. Equity and other securities also include equity investments that began trading during Fiscal2012 which are classified as available-for-sale securities. The remaining equity and other securities are initially recorded at cost and reduced for anyimpairment losses. During Fiscal 2012, Dell recognized a $39 million impairment charge associated with one of its investments, which is included in Interestand other, net on the Consolidated Statements of Income. Security classes reported at fair value use the specific identification method. The fair value of Dell'sportfolio can be affected by interest rate movements, credit, and liquidity risks. Dell's investments in debt securities have contractual maturities of three yearsor less.
During Fiscal 2012, Fiscal 2011, and Fiscal 2010, gross realized gains recognized in Interest and other, net were $49 million, $7 million, and $6 million,respectively. Dell recognized gross realized losses of $41 million, $1 million, and $4 million, respectively, during the same periods.
72
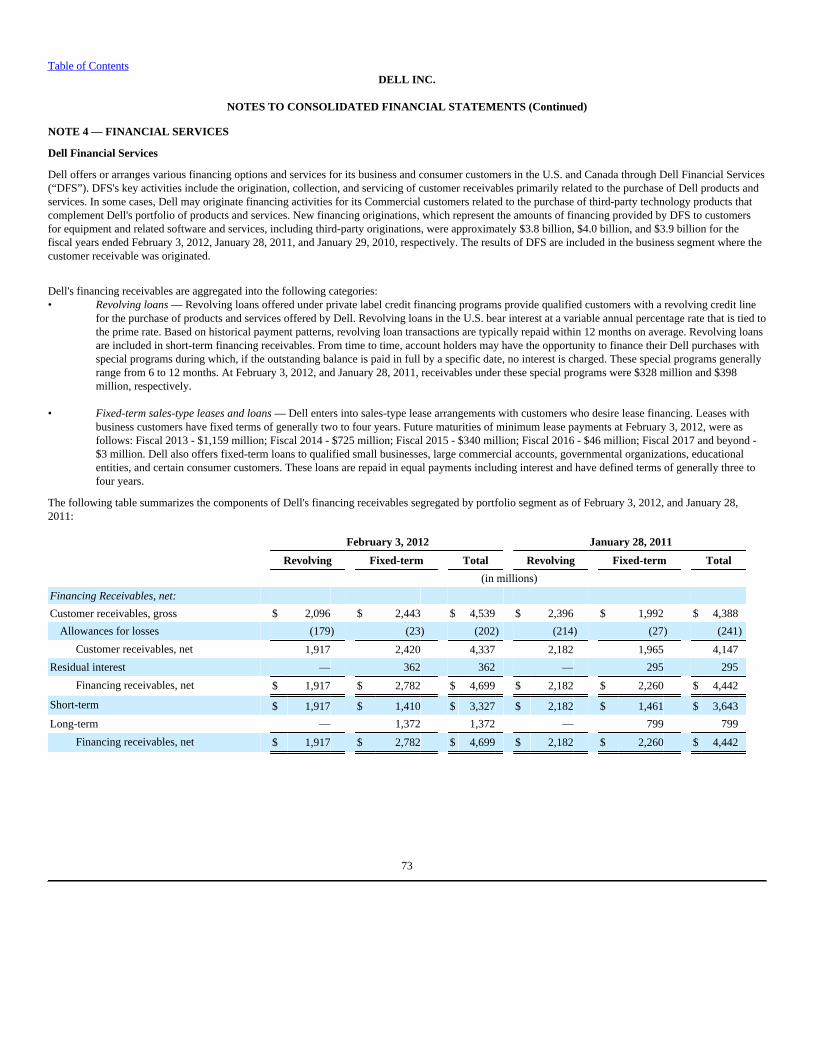
Table of ContentsDELL INC.
NOTES TO CONSOLIDATED FINANCIAL STATEMENTS (Continued)
NOTE 4 — FINANCIAL SERVICES
Dell Financial Services
Dell offers or arranges various financing options and services for its business and consumer customers in the U.S. and Canada through Dell Financial Services(“DFS”). DFS's key activities include the origination, collection, and servicing of customer receivables primarily related to the purchase of Dell products andservices. In some cases, Dell may originate financing activities for its Commercial customers related to the purchase of third-party technology products thatcomplement Dell's portfolio of products and services. New financing originations, which represent the amounts of financing provided by DFS to customersfor equipment and related software and services, including third-party originations, were approximately $3.8 billion, $4.0 billion, and $3.9 billion for thefiscal years ended February 3, 2012, January 28, 2011, and January 29, 2010, respectively. The results of DFS are included in the business segment where thecustomer receivable was originated.
Dell's financing receivables are aggregated into the following categories:• Revolving loans — Revolving loans offered under private label credit financing programs provide qualified customers with a revolving credit line
for the purchase of products and services offered by Dell. Revolving loans in the U.S. bear interest at a variable annual percentage rate that is tied tothe prime rate. Based on historical payment patterns, revolving loan transactions are typically repaid within 12 months on average. Revolving loansare included in short-term financing receivables. From time to time, account holders may have the opportunity to finance their Dell purchases withspecial programs during which, if the outstanding balance is paid in full by a specific date, no interest is charged. These special programs generallyrange from 6 to 12 months. At February 3, 2012, and January 28, 2011, receivables under these special programs were $328 million and $398million, respectively.
• Fixed-term sales-type leases and loans — Dell enters into sales-type lease arrangements with customers who desire lease financing. Leases withbusiness customers have fixed terms of generally two to four years. Future maturities of minimum lease payments at February 3, 2012, were asfollows: Fiscal 2013 - $1,159 million; Fiscal 2014 - $725 million; Fiscal 2015 - $340 million; Fiscal 2016 - $46 million; Fiscal 2017 and beyond -$3 million. Dell also offers fixed-term loans to qualified small businesses, large commercial accounts, governmental organizations, educationalentities, and certain consumer customers. These loans are repaid in equal payments including interest and have defined terms of generally three tofour years.
The following table summarizes the components of Dell's financing receivables segregated by portfolio segment as of February 3, 2012, and January 28,2011:
February 3, 2012 January 28, 2011
Revolving Fixed-term Total Revolving Fixed-term Total
(in millions)
Financing Receivables, net:
Customer receivables, gross $ 2,096 $ 2,443 $ 4,539 $ 2,396 $ 1,992 $ 4,388
Allowances for losses (179) (23) (202) (214) (27) (241)
Customer receivables, net 1,917 2,420 4,337 2,182 1,965 4,147
Residual interest — 362 362 — 295 295
Financing receivables, net $ 1,917 $ 2,782 $ 4,699 $ 2,182 $ 2,260 $ 4,442
Short-term $ 1,917 $ 1,410 $ 3,327 $ 2,182 $ 1,461 $ 3,643
Long-term — 1,372 1,372 — 799 799
Financing receivables, net $ 1,917 $ 2,782 $ 4,699 $ 2,182 $ 2,260 $ 4,442
73
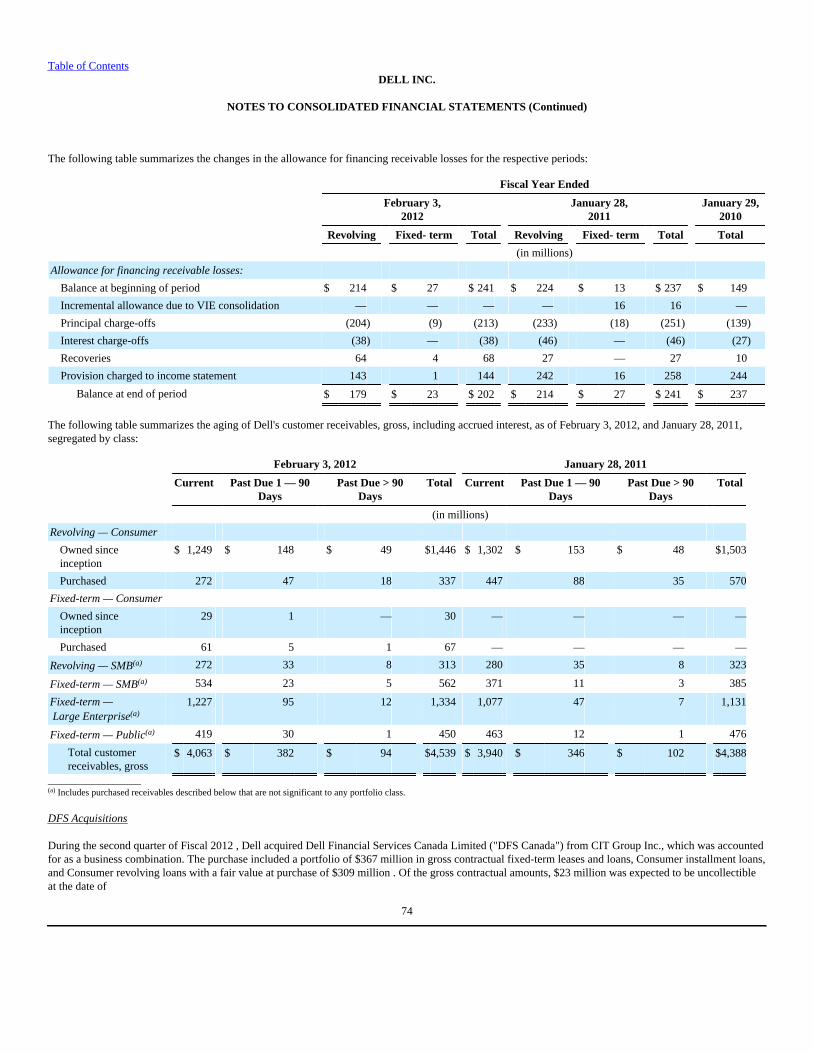
Table of ContentsDELL INC.
NOTES TO CONSOLIDATED FINANCIAL STATEMENTS (Continued)
The following table summarizes the changes in the allowance for financing receivable losses for the respective periods:
Fiscal Year Ended
February 3,2012
January 28,2011
January 29,2010
Revolving Fixed- term Total Revolving Fixed- term Total Total
(in millions)
Allowance for financing receivable losses:
Balance at beginning of period $ 214 $ 27 $ 241 $ 224 $ 13 $ 237 $ 149
Incremental allowance due to VIE consolidation — — — — 16 16 —
Principal charge-offs (204) (9) (213) (233) (18) (251) (139)
Interest charge-offs (38) — (38) (46) — (46) (27)
Recoveries 64 4 68 27 — 27 10
Provision charged to income statement 143 1 144 242 16 258 244
Balance at end of period $ 179 $ 23 $ 202 $ 214 $ 27 $ 241 $ 237
The following table summarizes the aging of Dell's customer receivables, gross, including accrued interest, as of February 3, 2012, and January 28, 2011,segregated by class:
February 3, 2012 January 28, 2011
Current Past Due 1 — 90Days
Past Due > 90Days
Total Current Past Due 1 — 90Days
Past Due > 90Days
Total
(in millions)
Revolving — Consumer
Owned sinceinception
$ 1,249 $ 148 $ 49 $1,446 $ 1,302 $ 153 $ 48 $1,503
Purchased 272 47 18 337 447 88 35 570
Fixed-term — Consumer
Owned sinceinception
29 1 — 30 — — — —
Purchased 61 5 1 67 — — — —
Revolving — SMB(a) 272 33 8 313 280 35 8 323
Fixed-term — SMB(a) 534 23 5 562 371 11 3 385
Fixed-term — Large Enterprise(a)
1,227 95 12 1,334 1,077 47 7 1,131
Fixed-term — Public(a) 419 30 1 450 463 12 1 476
Total customerreceivables, gross
$ 4,063 $ 382 $ 94 $4,539 $ 3,940 $ 346 $ 102 $4,388
____________________ (a) Includes purchased receivables described below that are not significant to any portfolio class.
DFS Acquisitions
During the second quarter of Fiscal 2012 , Dell acquired Dell Financial Services Canada Limited ("DFS Canada") from CIT Group Inc., which was accountedfor as a business combination. The purchase included a portfolio of $367 million in gross contractual fixed-term leases and loans, Consumer installment loans,and Consumer revolving loans with a fair value at purchase of $309 million . Of the gross contractual amounts, $23 million was expected to be uncollectibleat the date of
74

Table of ContentsDELL INC.
NOTES TO CONSOLIDATED FINANCIAL STATEMENTS (Continued)
acquisition. Dell also acquired a liquidating portfolio of computer equipment operating leases. The gross amount of the equipment associated with theseoperating leases at the date of acquisition was $67 million and is included in Property, plant, and equipment in the Consolidated Statements of FinancialPosition. See Note 7 of Notes to Consolidated Financial Statements for additional information about Dell's acquisitions.
In Fiscal 2012 , Dell entered into a definitive agreement to acquire CIT Vendor Finance's Dell-related financing assets portfolio and sales and servicingfunctions in Europe. The acquisition of these assets will enable global expansion of Dell's direct finance model. Subject to customary closing, regulatory, andother conditions, Dell expects to close substantially all of this acquisition in the fiscal year ending February 1, 2013.
Purchased Credit-Impaired Loans During the third quarter of Fiscal 2011, Dell purchased a portfolio of revolving loan receivables from CIT Group Inc. Prior to the acquisition, it was evidentthat Dell would not collect on all contractually required principal and interest payments. As such, these receivables met the definition of Purchased Credit-Impaired (“PCI”) loans. At February 3, 2012, the outstanding balance of these receivables, including principal and accrued interest, was $419 million and thecarrying amount was $184 million.
The excess of cash flows expected to be collected over the carrying value of PCI loans is referred to as the accretable yield and is accreted into interest incomeusing the effective yield method based on the expected future cash flows over the estimated lives of the PCI loans. Due to improved expectations of theamount of expected cash flows and higher post charge-off recoveries, Dell increased the accretable yield associated with these PCI loans in Fiscal 2012. Theincreases in accretable yield will be amortized over the remaining life of the loans.
The following table shows activity for the accretable yield on the PCI loans for the fiscal years ended February 3, 2012, and January 28, 2011. We expect theremaining balance of the accretable yield as of February 3, 2012 to accrete over the next 3 years, using the effective interest method.
Fiscal Year Ended
February 3, 2012 January 28, 2011
(in millions)
Accretable Yield:
Balance at beginning of period $ 137 $ —
Additions/ Purchases — 166
Accretion (88) (29)
Prospective yield adjustment 93 —
Balance at end of period $ 142 $ 137
75
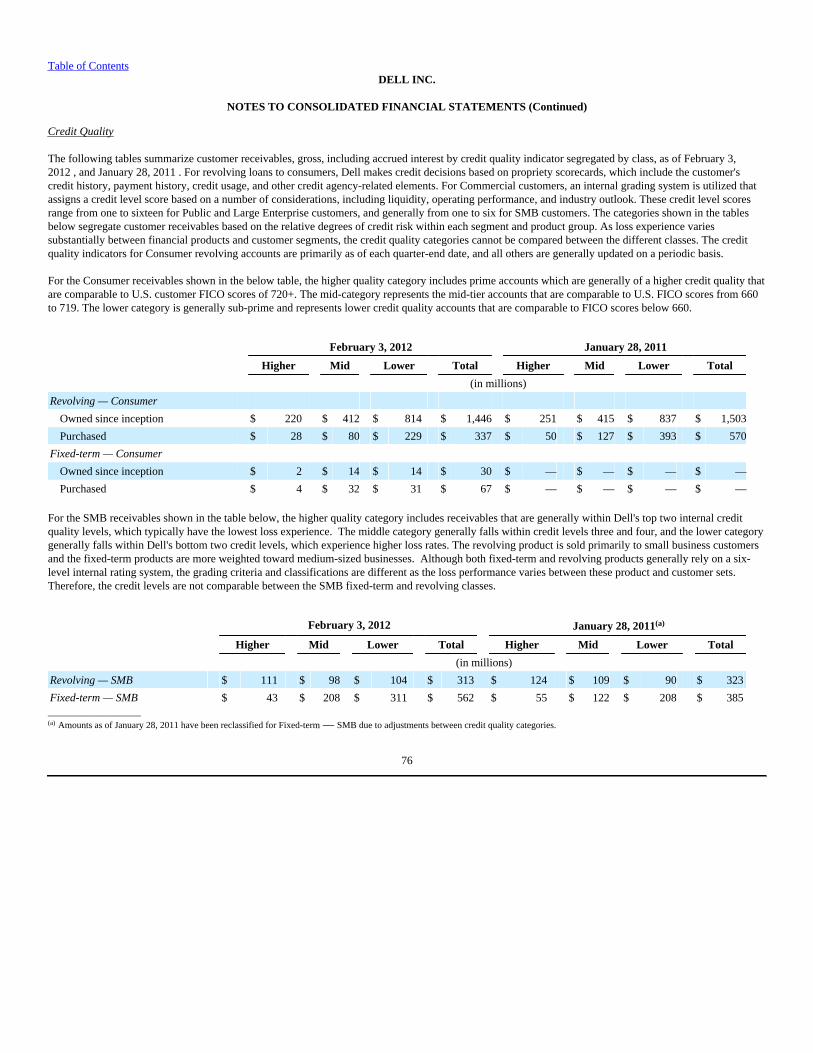
Table of ContentsDELL INC.
NOTES TO CONSOLIDATED FINANCIAL STATEMENTS (Continued)
Credit Quality
The following tables summarize customer receivables, gross, including accrued interest by credit quality indicator segregated by class, as of February 3,2012 , and January 28, 2011 . For revolving loans to consumers, Dell makes credit decisions based on propriety scorecards, which include the customer'scredit history, payment history, credit usage, and other credit agency-related elements. For Commercial customers, an internal grading system is utilized thatassigns a credit level score based on a number of considerations, including liquidity, operating performance, and industry outlook. These credit level scoresrange from one to sixteen for Public and Large Enterprise customers, and generally from one to six for SMB customers. The categories shown in the tablesbelow segregate customer receivables based on the relative degrees of credit risk within each segment and product group. As loss experience variessubstantially between financial products and customer segments, the credit quality categories cannot be compared between the different classes. The creditquality indicators for Consumer revolving accounts are primarily as of each quarter-end date, and all others are generally updated on a periodic basis.
For the Consumer receivables shown in the below table, the higher quality category includes prime accounts which are generally of a higher credit quality thatare comparable to U.S. customer FICO scores of 720+. The mid-category represents the mid-tier accounts that are comparable to U.S. FICO scores from 660to 719. The lower category is generally sub-prime and represents lower credit quality accounts that are comparable to FICO scores below 660.
February 3, 2012 January 28, 2011
Higher Mid Lower Total Higher Mid Lower Total
(in millions)
Revolving — Consumer
Owned since inception $ 220 $ 412 $ 814 $ 1,446 $ 251 $ 415 $ 837 $ 1,503
Purchased $ 28 $ 80 $ 229 $ 337 $ 50 $ 127 $ 393 $ 570
Fixed-term — Consumer
Owned since inception $ 2 $ 14 $ 14 $ 30 $ — $ — $ — $ —
Purchased $ 4 $ 32 $ 31 $ 67 $ — $ — $ — $ —
For the SMB receivables shown in the table below, the higher quality category includes receivables that are generally within Dell's top two internal creditquality levels, which typically have the lowest loss experience. The middle category generally falls within credit levels three and four, and the lower categorygenerally falls within Dell's bottom two credit levels, which experience higher loss rates. The revolving product is sold primarily to small business customersand the fixed-term products are more weighted toward medium-sized businesses. Although both fixed-term and revolving products generally rely on a six-level internal rating system, the grading criteria and classifications are different as the loss performance varies between these product and customer sets. Therefore, the credit levels are not comparable between the SMB fixed-term and revolving classes.
February 3, 2012 January 28, 2011(a)
Higher Mid Lower Total Higher Mid Lower Total
(in millions)
Revolving — SMB $ 111 $ 98 $ 104 $ 313 $ 124 $ 109 $ 90 $ 323
Fixed-term — SMB $ 43 $ 208 $ 311 $ 562 $ 55 $ 122 $ 208 $ 385____________________ (a) Amounts as of January 28, 2011 have been reclassified for Fixed-term — SMB due to adjustments between credit quality categories.
76
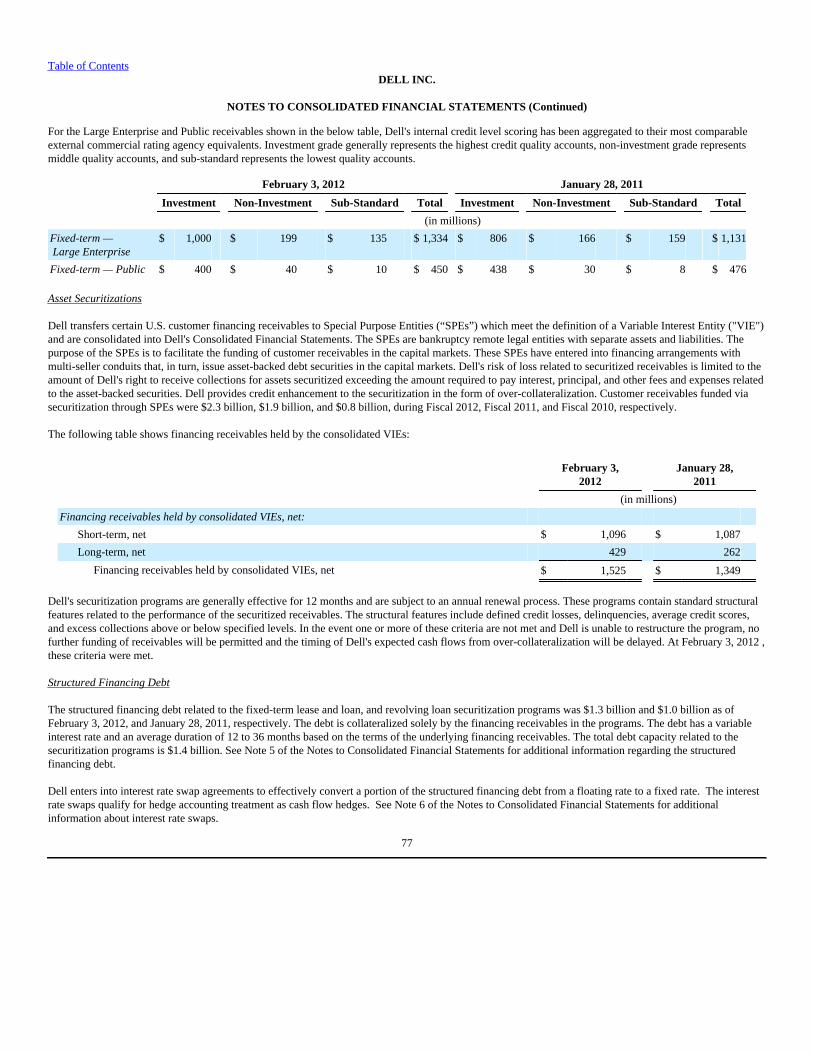
Table of ContentsDELL INC.
NOTES TO CONSOLIDATED FINANCIAL STATEMENTS (Continued)
For the Large Enterprise and Public receivables shown in the below table, Dell's internal credit level scoring has been aggregated to their most comparableexternal commercial rating agency equivalents. Investment grade generally represents the highest credit quality accounts, non-investment grade representsmiddle quality accounts, and sub-standard represents the lowest quality accounts.
February 3, 2012 January 28, 2011
Investment Non-Investment Sub-Standard Total Investment Non-Investment Sub-Standard Total
(in millions)
Fixed-term — Large Enterprise
$ 1,000 $ 199 $ 135 $ 1,334 $ 806 $ 166 $ 159 $ 1,131
Fixed-term — Public $ 400 $ 40 $ 10 $ 450 $ 438 $ 30 $ 8 $ 476
Asset Securitizations
Dell transfers certain U.S. customer financing receivables to Special Purpose Entities (“SPEs”) which meet the definition of a Variable Interest Entity ("VIE")and are consolidated into Dell's Consolidated Financial Statements. The SPEs are bankruptcy remote legal entities with separate assets and liabilities. Thepurpose of the SPEs is to facilitate the funding of customer receivables in the capital markets. These SPEs have entered into financing arrangements withmulti-seller conduits that, in turn, issue asset-backed debt securities in the capital markets. Dell's risk of loss related to securitized receivables is limited to theamount of Dell's right to receive collections for assets securitized exceeding the amount required to pay interest, principal, and other fees and expenses relatedto the asset-backed securities. Dell provides credit enhancement to the securitization in the form of over-collateralization. Customer receivables funded viasecuritization through SPEs were $2.3 billion, $1.9 billion, and $0.8 billion, during Fiscal 2012, Fiscal 2011, and Fiscal 2010, respectively.
The following table shows financing receivables held by the consolidated VIEs:
February 3,2012
January 28,2011
(in millions)
Financing receivables held by consolidated VIEs, net:
Short-term, net $ 1,096 $ 1,087
Long-term, net 429 262
Financing receivables held by consolidated VIEs, net $ 1,525 $ 1,349
Dell's securitization programs are generally effective for 12 months and are subject to an annual renewal process. These programs contain standard structuralfeatures related to the performance of the securitized receivables. The structural features include defined credit losses, delinquencies, average credit scores,and excess collections above or below specified levels. In the event one or more of these criteria are not met and Dell is unable to restructure the program, nofurther funding of receivables will be permitted and the timing of Dell's expected cash flows from over-collateralization will be delayed. At February 3, 2012 ,these criteria were met.
Structured Financing Debt
The structured financing debt related to the fixed-term lease and loan, and revolving loan securitization programs was $1.3 billion and $1.0 billion as ofFebruary 3, 2012, and January 28, 2011, respectively. The debt is collateralized solely by the financing receivables in the programs. The debt has a variableinterest rate and an average duration of 12 to 36 months based on the terms of the underlying financing receivables. The total debt capacity related to thesecuritization programs is $1.4 billion. See Note 5 of the Notes to Consolidated Financial Statements for additional information regarding the structuredfinancing debt.
Dell enters into interest rate swap agreements to effectively convert a portion of the structured financing debt from a floating rate to a fixed rate. The interestrate swaps qualify for hedge accounting treatment as cash flow hedges. See Note 6 of the Notes to Consolidated Financial Statements for additionalinformation about interest rate swaps.
77
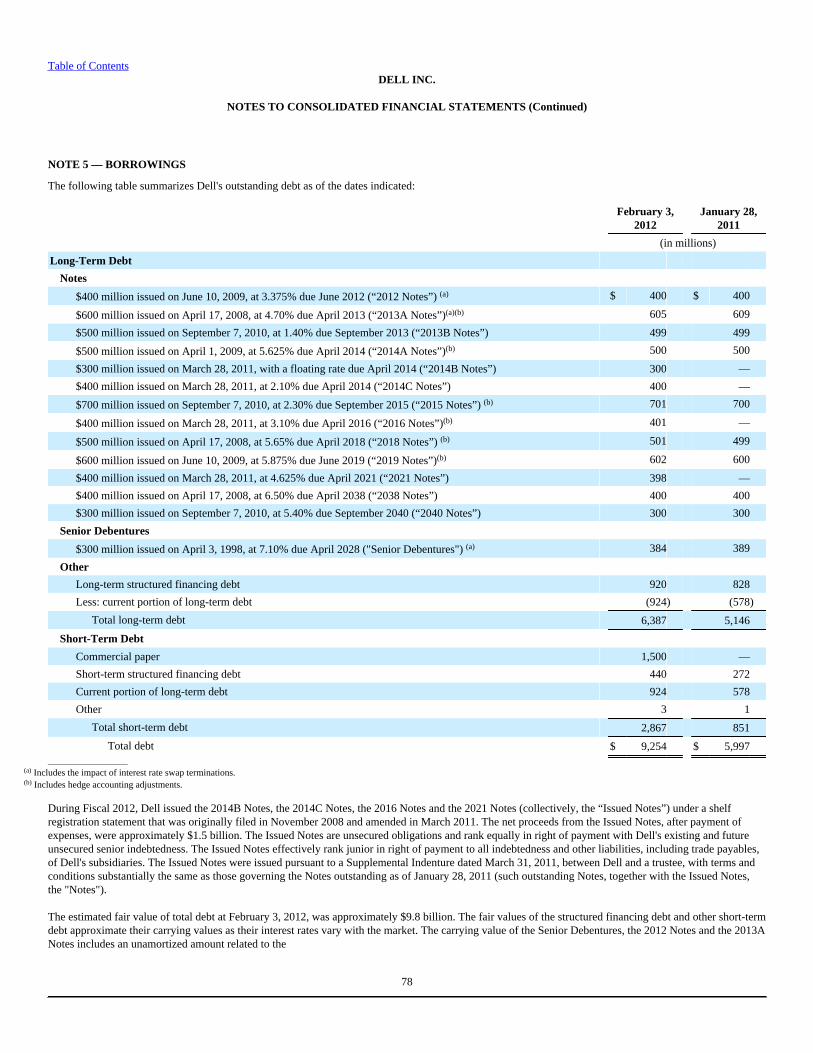
Table of ContentsDELL INC.
NOTES TO CONSOLIDATED FINANCIAL STATEMENTS (Continued)
NOTE 5 — BORROWINGS
The following table summarizes Dell's outstanding debt as of the dates indicated:
February 3,2012
January 28,2011
(in millions)
Long-Term Debt
Notes
$400 million issued on June 10, 2009, at 3.375% due June 2012 (“2012 Notes”) (a) $ 400 $ 400
$600 million issued on April 17, 2008, at 4.70% due April 2013 (“2013A Notes”)(a)(b) 605 609
$500 million issued on September 7, 2010, at 1.40% due September 2013 (“2013B Notes”) 499 499
$500 million issued on April 1, 2009, at 5.625% due April 2014 (“2014A Notes”)(b) 500 500
$300 million issued on March 28, 2011, with a floating rate due April 2014 (“2014B Notes”) 300 —
$400 million issued on March 28, 2011, at 2.10% due April 2014 (“2014C Notes”) 400 —
$700 million issued on September 7, 2010, at 2.30% due September 2015 (“2015 Notes”) (b) 701 700
$400 million issued on March 28, 2011, at 3.10% due April 2016 (“2016 Notes”)(b) 401 —
$500 million issued on April 17, 2008, at 5.65% due April 2018 (“2018 Notes”) (b) 501 499
$600 million issued on June 10, 2009, at 5.875% due June 2019 (“2019 Notes”)(b) 602 600
$400 million issued on March 28, 2011, at 4.625% due April 2021 (“2021 Notes”) 398 —
$400 million issued on April 17, 2008, at 6.50% due April 2038 (“2038 Notes”) 400 400
$300 million issued on September 7, 2010, at 5.40% due September 2040 (“2040 Notes”) 300 300
Senior Debentures
$300 million issued on April 3, 1998, at 7.10% due April 2028 ("Senior Debentures") (a) 384 389
Other
Long-term structured financing debt 920 828
Less: current portion of long-term debt (924) (578)
Total long-term debt 6,387 5,146
Short-Term Debt
Commercial paper 1,500 —
Short-term structured financing debt 440 272
Current portion of long-term debt 924 578
Other 3 1
Total short-term debt 2,867 851
Total debt $ 9,254 $ 5,997____________________
(a) Includes the impact of interest rate swap terminations.(b) Includes hedge accounting adjustments.
During Fiscal 2012, Dell issued the 2014B Notes, the 2014C Notes, the 2016 Notes and the 2021 Notes (collectively, the “Issued Notes”) under a shelfregistration statement that was originally filed in November 2008 and amended in March 2011. The net proceeds from the Issued Notes, after payment ofexpenses, were approximately $1.5 billion. The Issued Notes are unsecured obligations and rank equally in right of payment with Dell's existing and futureunsecured senior indebtedness. The Issued Notes effectively rank junior in right of payment to all indebtedness and other liabilities, including trade payables,of Dell's subsidiaries. The Issued Notes were issued pursuant to a Supplemental Indenture dated March 31, 2011, between Dell and a trustee, with terms andconditions substantially the same as those governing the Notes outstanding as of January 28, 2011 (such outstanding Notes, together with the Issued Notes,the "Notes").
The estimated fair value of total debt at February 3, 2012, was approximately $9.8 billion. The fair values of the structured financing debt and other short-termdebt approximate their carrying values as their interest rates vary with the market. The carrying value of the Senior Debentures, the 2012 Notes and the 2013ANotes includes an unamortized amount related to the
78
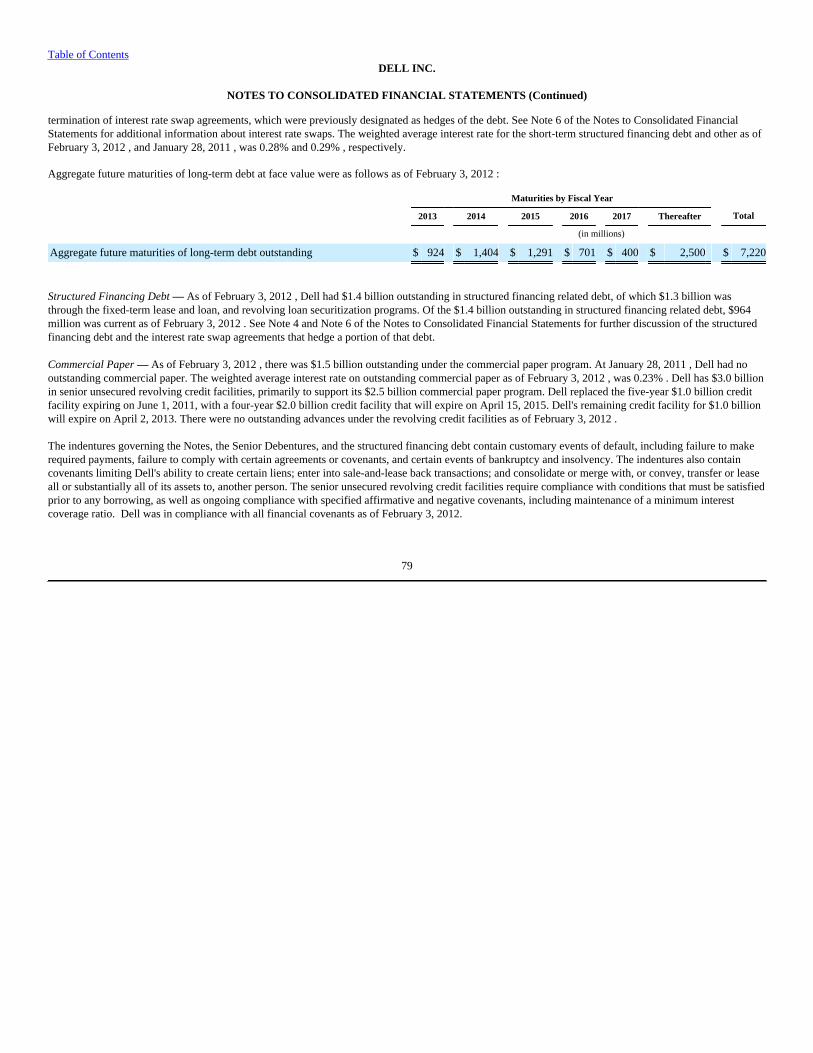
Table of Contents DELL INC.
NOTES TO CONSOLIDATED FINANCIAL STATEMENTS (Continued)
termination of interest rate swap agreements, which were previously designated as hedges of the debt. See Note 6 of the Notes to Consolidated FinancialStatements for additional information about interest rate swaps. The weighted average interest rate for the short-term structured financing debt and other as ofFebruary 3, 2012 , and January 28, 2011 , was 0.28% and 0.29% , respectively.
Aggregate future maturities of long-term debt at face value were as follows as of February 3, 2012 :
Maturities by Fiscal Year
2013 2014 2015 2016 2017 Thereafter Total
(in millions)
Aggregate future maturities of long-term debt outstanding $ 924 $ 1,404 $ 1,291 $ 701 $ 400 $ 2,500 $ 7,220
Structured Financing Debt — As of February 3, 2012 , Dell had $1.4 billion outstanding in structured financing related debt, of which $1.3 billion wasthrough the fixed-term lease and loan, and revolving loan securitization programs. Of the $1.4 billion outstanding in structured financing related debt, $964million was current as of February 3, 2012 . See Note 4 and Note 6 of the Notes to Consolidated Financial Statements for further discussion of the structuredfinancing debt and the interest rate swap agreements that hedge a portion of that debt. Commercial Paper — As of February 3, 2012 , there was $1.5 billion outstanding under the commercial paper program. At January 28, 2011 , Dell had nooutstanding commercial paper. The weighted average interest rate on outstanding commercial paper as of February 3, 2012 , was 0.23% . Dell has $3.0 billionin senior unsecured revolving credit facilities, primarily to support its $2.5 billion commercial paper program. Dell replaced the five-year $1.0 billion creditfacility expiring on June 1, 2011, with a four-year $2.0 billion credit facility that will expire on April 15, 2015. Dell's remaining credit facility for $1.0 billionwill expire on April 2, 2013. There were no outstanding advances under the revolving credit facilities as of February 3, 2012 .
The indentures governing the Notes, the Senior Debentures, and the structured financing debt contain customary events of default, including failure to makerequired payments, failure to comply with certain agreements or covenants, and certain events of bankruptcy and insolvency. The indentures also containcovenants limiting Dell's ability to create certain liens; enter into sale-and-lease back transactions; and consolidate or merge with, or convey, transfer or leaseall or substantially all of its assets to, another person. The senior unsecured revolving credit facilities require compliance with conditions that must be satisfiedprior to any borrowing, as well as ongoing compliance with specified affirmative and negative covenants, including maintenance of a minimum interestcoverage ratio. Dell was in compliance with all financial covenants as of February 3, 2012.
79
Table of ContentsDELL INC.
NOTES TO CONSOLIDATED FINANCIAL STATEMENTS (Continued)
NOTE 6 — DERIVATIVE INSTRUMENTS AND HEDGING ACTIVITIES
Derivative Instruments
As part of its risk management strategy, Dell uses derivative instruments, primarily forward contracts and purchased options, to hedge certain foreigncurrency exposures and interest rate swaps to manage the exposure of its debt portfolio to interest rate risk. Dell's objective is to offset gains and lossesresulting from these exposures with gains and losses on the derivative contracts used to hedge the exposures, thereby reducing volatility of earnings andprotecting fair values of assets and liabilities. Dell assesses hedge effectiveness both at the onset of the hedge and at regular intervals throughout the life of thederivative and recognizes any ineffective portion of the hedge, as well as amounts not included in the assessment of effectiveness, in earnings as a componentof Interest and other, net.
Foreign Exchange Risk
Dell uses a combination of forward contracts and purchased options designated as cash flow hedges to protect against the foreign currency exchange rate risksinherent in its forecasted transactions denominated in currencies other than the U.S. dollar. The risk of loss associated with purchased options is limited topremium amounts paid for the option contracts. The risk of loss associated with forward contracts is equal to the exchange rate differential from the time thecontract is entered into until the time it is settled. The majority of these contracts typically expire in 12 months or less.
Dell assessed hedge ineffectiveness for foreign exchange contracts designated as cash flow hedges for the fiscal year ended February 3, 2012, and determinedthat such ineffectiveness was not material. During the fiscal year ended February 3, 2012, Dell did not discontinue any cash flow hedges related to foreignexchange contracts that had a material impact on Dell's results of operations, as substantially all forecasted foreign currency transactions were realized inDell's actual results.
In addition, Dell uses forward contracts to hedge monetary assets and liabilities, primarily receivables and payables, denominated in a foreign currency. Thesecontracts generally expire in three months or less, are considered economic hedges and are not designated. The change in the fair value of these instrumentsrepresents a natural hedge as their gains and losses offset the changes in the underlying fair value of the monetary assets and liabilities due to movements incurrency exchange rates. Dell recognized gains (losses) for the change in fair value of these foreign currency forward contracts of $17 million, $59 millionand $(85) million during Fiscal 2012, Fiscal 2011, and Fiscal 2010, respectively.
Interest Rate Risk
Dell uses interest rate swaps to hedge the variability in cash flows related to the interest rate payments on structured financing debt. The interest rate swapseconomically convert the variable rate on the structured financing debt to a fixed interest rate to match the underlying fixed rate being received on fixed termcustomer leases and loans. The duration of these contracts typically ranges from 30 to 42 months. Certain of these swaps are designated as cash flow hedges.Hedge ineffectiveness for interest rate swaps designated as cash flow hedges was not material for the fiscal years ended February 3, 2012, and January 28,2011.
Periodically, Dell also uses interest rate swaps designated as fair value hedges to modify the market risk exposures in connection with long-term debt toachieve primarily LIBOR-based floating interest expense. During the fiscal year ended February 3, 2012, Dell entered into interest rate swaps to economicallyhedge a portion of its interest rate exposure on certain tranches of its long-term debt. Hedge ineffectiveness for interest rate swaps designated as fair valuehedges was not material for the fiscal years ended February 3, 2012, and January 28, 2011.
80
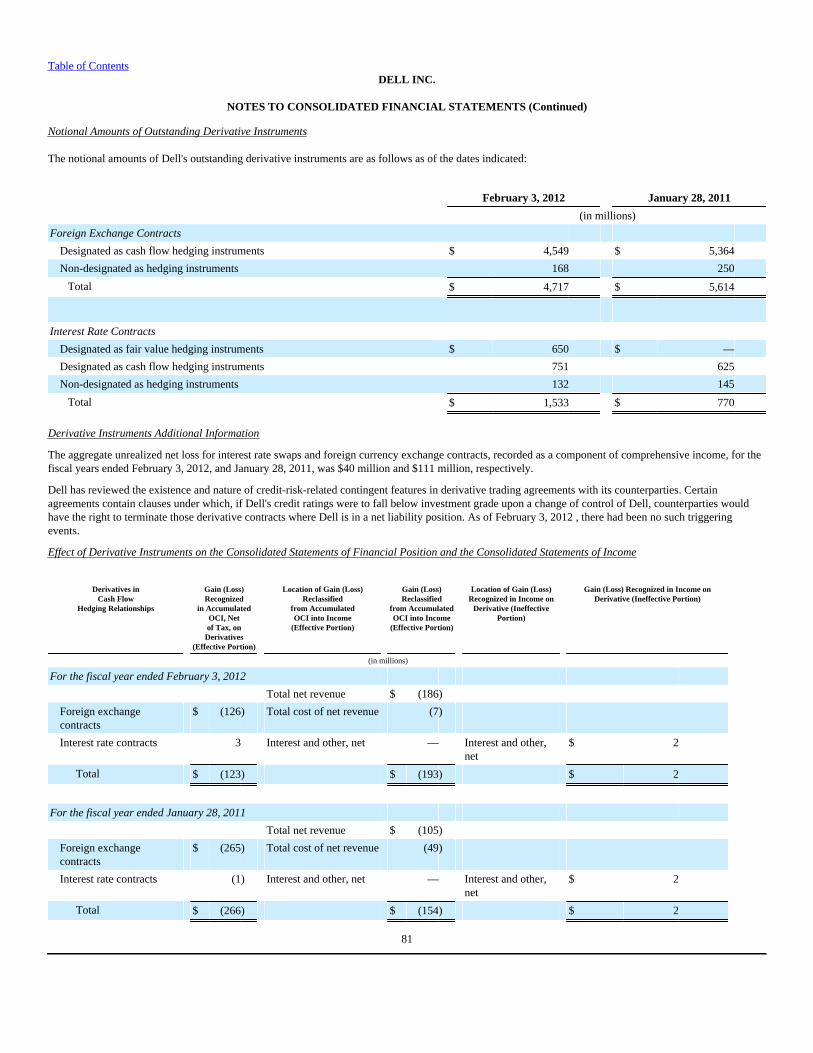
Table of ContentsDELL INC.
NOTES TO CONSOLIDATED FINANCIAL STATEMENTS (Continued)
Notional Amounts of Outstanding Derivative Instruments
The notional amounts of Dell's outstanding derivative instruments are as follows as of the dates indicated:
February 3, 2012 January 28, 2011
(in millions)
Foreign Exchange Contracts
Designated as cash flow hedging instruments $ 4,549 $ 5,364
Non-designated as hedging instruments 168 250
Total $ 4,717 $ 5,614
Interest Rate Contracts
Designated as fair value hedging instruments $ 650 $ —
Designated as cash flow hedging instruments 751 625
Non-designated as hedging instruments 132 145
Total $ 1,533 $ 770
Derivative Instruments Additional Information
The aggregate unrealized net loss for interest rate swaps and foreign currency exchange contracts, recorded as a component of comprehensive income, for thefiscal years ended February 3, 2012, and January 28, 2011, was $40 million and $111 million, respectively.
Dell has reviewed the existence and nature of credit-risk-related contingent features in derivative trading agreements with its counterparties. Certainagreements contain clauses under which, if Dell's credit ratings were to fall below investment grade upon a change of control of Dell, counterparties wouldhave the right to terminate those derivative contracts where Dell is in a net liability position. As of February 3, 2012 , there had been no such triggeringevents.
Effect of Derivative Instruments on the Consolidated Statements of Financial Position and the Consolidated Statements of Income
Derivatives inCash Flow
Hedging Relationships
Gain (Loss)Recognized
in AccumulatedOCI, Netof Tax, on
Derivatives(Effective Portion)
Location of Gain (Loss)Reclassified
from AccumulatedOCI into Income
(Effective Portion)
Gain (Loss)Reclassified
from AccumulatedOCI into Income
(Effective Portion)
Location of Gain (Loss)Recognized in Income on
Derivative (IneffectivePortion)
Gain (Loss) Recognized in Income onDerivative (Ineffective Portion)
(in millions)
For the fiscal year ended February 3, 2012
Total net revenue $ (186)
Foreign exchangecontracts
$ (126) Total cost of net revenue (7)
Interest rate contracts 3 Interest and other, net — Interest and other,net
$ 2
Total $ (123) $ (193) $ 2
For the fiscal year ended January 28, 2011
Total net revenue $ (105)
Foreign exchangecontracts
$ (265) Total cost of net revenue (49)
Interest rate contracts (1) Interest and other, net — Interest and other,net
$ 2
Total $ (266) $ (154) $ 2
81
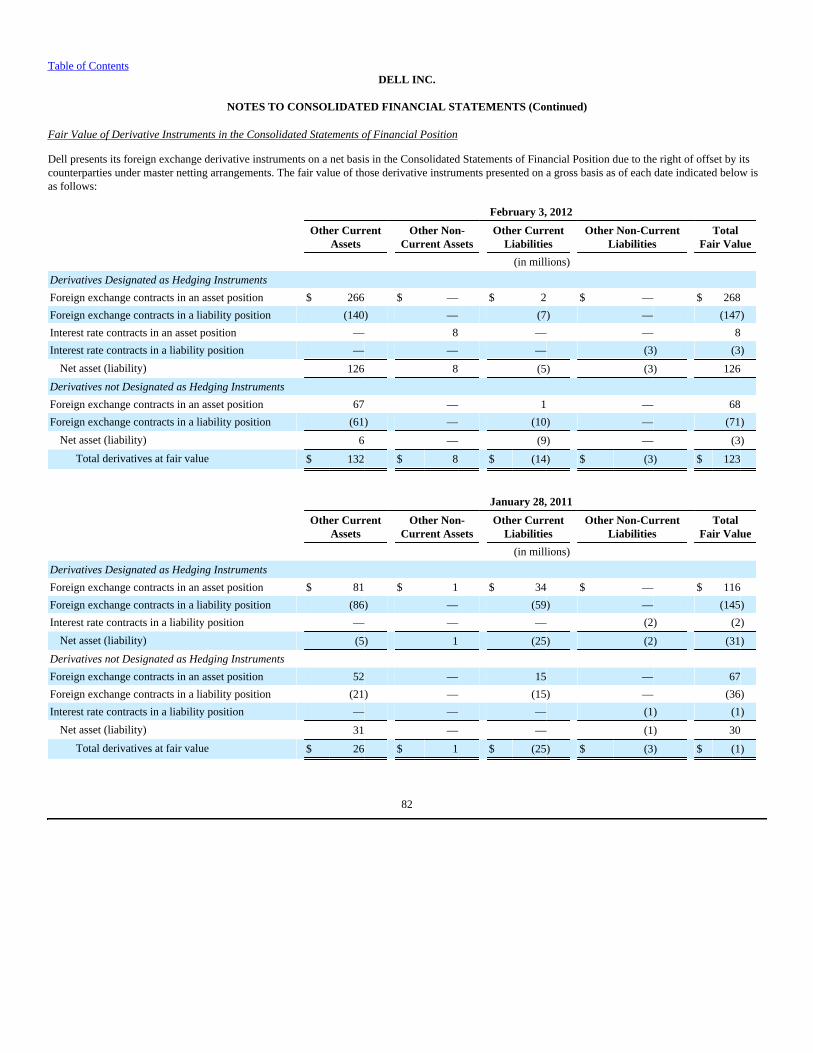
Table of ContentsDELL INC.
NOTES TO CONSOLIDATED FINANCIAL STATEMENTS (Continued)
Fair Value of Derivative Instruments in the Consolidated Statements of Financial Position
Dell presents its foreign exchange derivative instruments on a net basis in the Consolidated Statements of Financial Position due to the right of offset by itscounterparties under master netting arrangements. The fair value of those derivative instruments presented on a gross basis as of each date indicated below isas follows:
February 3, 2012 Other Current
Assets Other Non-
Current Assets Other Current
Liabilities Other Non-Current
Liabilities Total
Fair Value
(in millions)
Derivatives Designated as Hedging Instruments
Foreign exchange contracts in an asset position $ 266 $ — $ 2 $ — $ 268
Foreign exchange contracts in a liability position (140) — (7) — (147)
Interest rate contracts in an asset position — 8 — — 8
Interest rate contracts in a liability position — — — (3) (3)
Net asset (liability) 126 8 (5) (3) 126
Derivatives not Designated as Hedging Instruments
Foreign exchange contracts in an asset position 67 — 1 — 68
Foreign exchange contracts in a liability position (61) — (10) — (71)
Net asset (liability) 6 — (9) — (3)
Total derivatives at fair value $ 132 $ 8 $ (14) $ (3) $ 123
January 28, 2011 Other Current
Assets Other Non-
Current Assets Other Current
Liabilities Other Non-Current
Liabilities Total
Fair Value
(in millions)
Derivatives Designated as Hedging Instruments
Foreign exchange contracts in an asset position $ 81 $ 1 $ 34 $ — $ 116
Foreign exchange contracts in a liability position (86) — (59) — (145)
Interest rate contracts in a liability position — — — (2) (2)
Net asset (liability) (5) 1 (25) (2) (31)
Derivatives not Designated as Hedging Instruments
Foreign exchange contracts in an asset position 52 — 15 — 67
Foreign exchange contracts in a liability position (21) — (15) — (36)
Interest rate contracts in a liability position — — — (1) (1)
Net asset (liability) 31 — — (1) 30
Total derivatives at fair value $ 26 $ 1 $ (25) $ (3) $ (1)
82
Table of Contents DELL INC.
NOTES TO CONSOLIDATED FINANCIAL STATEMENTS (Continued)
NOTE 7 — ACQUISITIONS
Fiscal 2012 Acquisitions
During Fiscal 2012, Dell completed several acquisitions, including acquisitions of Compellent Technologies, Inc. ("Compellent"), SecureWorks Inc.("SecureWorks"), DFS Canada, and Force10 Networks, Inc. ("Force10"). The total purchase consideration was approximately $2.7 billion in cash for all ofthe outstanding shares for all acquisitions completed during the period. Compellent is a provider of virtual storage solutions for enterprise and cloudcomputing environments, and SecureWorks is a global provider of information security services. Force10 is a global technology company that providesdatacenter networking solutions. Compellent, SecureWorks, and Force10 will be integrated into Dell's Commercial segments. DFS Canada enables expansionof Dell's direct finance model into Canada for all of Dell's segments. See Note 4 of the Notes to Consolidated Financial Statements for further discussion onDell's acquisition of DFS Canada.
Dell has recorded these acquisitions using the acquisition method of accounting and recorded their respective assets and liabilities at fair value at the date ofacquisition. The excess of the purchase prices over the estimated fair values was recorded as goodwill. Any changes in the estimated fair values of the netassets recorded for these acquisitions prior to the finalization of more detailed analyses, but not to exceed one year from the date of acquisition, will changethe amount of the purchase prices allocable to goodwill. Any subsequent changes to any purchase price allocations that are material to Dell's consolidatedfinancial results will be adjusted retroactively.
Dell recorded $1.5 billion in goodwill related to acquisitions during the fiscal year ended February 3, 2012. This amount primarily represents synergiesassociated with combining these companies with Dell to provide Dell's customers with a broader range of IT solutions or, in the case of DFS Canada, toextend Dell's financial services capabilities. This goodwill is not deductible for tax purposes. Dell also recorded $753 million in intangible assets related tothese acquisitions, which consist primarily of purchased technology and customer relationships. The intangible assets have weighted-average useful livesranging from 3 to 11 years. In conjunction with these acquisitions, Dell will incur approximately $150 million in compensation-related expenses that will beexpensed over a period of up to four years. There was no contingent consideration related to these acquisitions.
Dell has not presented pro forma results of operations for Fiscal 2012 acquisitions because these acquisitions are not material to Dell's consolidated results ofoperations, financial position, or cash flows on either an individual or an aggregate basis.
Fiscal 2011 Acquisitions
Dell completed five acquisitions during Fiscal 2011, Kace Networks, Inc. (“KACE”), Ocarina Networks Inc. (“Ocarina”), Scalent Systems Inc. (“Scalent”),Boomi, Inc. (“Boomi”), and InSite One, Inc. (“InSite”), for a total purchase consideration of approximately $413 million in cash. KACE is a systemsmanagement appliance company with solutions tailored to the requirements of mid-sized businesses. KACE is being integrated primarily into Dell's SMB andPublic segments. Ocarina is a provider of de-duplication solutions and content-aware compression across storage product lines. Scalent is a provider ofscalable and efficient data center infrastructure software. Boomi is a provider of on-demand integration technology. Ocarina, Scalent, and Boomi will beintegrated into all of Dell's Commercial segments. InSite provides cloud-based medical data archiving, storage, and disaster-recovery solutions to the healthcare industry. InSite will be integrated into Dell's Public segment.
Dell has recorded these acquisitions using the acquisition method of accounting and recorded their respective assets and liabilities at fair value at the date ofacquisition. The excess of the purchase prices over the estimated fair values were recorded as goodwill. Any changes in the estimated fair values of the netassets recorded for these acquisitions prior to the finalization of more detailed analyses, but not to exceed one year from the date of acquisition, will changethe amount of the purchase prices allocable to goodwill. Any subsequent changes to the purchase price allocations that are material to Dell's consolidatedfinancial results will be adjusted retroactively. Dell recorded approximately $284 million in goodwill and $141 million in intangible assets related to theseacquisitions. The goodwill related to these acquisitions is not deductible for tax purposes. In conjunction with these acquisitions, Dell will incur $56 million incompensation-related expenses that will be expensed over a period of one to three years. There was no contingent consideration related to these acquisitions.
Dell has not presented pro forma results of operations for the Fiscal 2011 acquisitions because these acquisitions are not material to Dell's consolidated resultsof operations, financial position, or cash flows on either an individual or an aggregate
83
Table of ContentsDELL INC.
NOTES TO CONSOLIDATED FINANCIAL STATEMENTS (Continued)
basis. Fiscal 2010 Acquisitions
On November 3, 2009, Dell completed its acquisition of all the outstanding shares of the Class A common stock of Perot Systems, a worldwide provider ofinformation technology and business solutions, for a purchase consideration of $3.9 billion in cash. This acquisition is expected to provide customers abroader range of IT services and solutions and better position Dell for its own immediate and long-term growth and efficiency. Perot Systems was primarilyintegrated into the Large Enterprise and Public segments for reporting purposes. Perot Systems’ results of operations were included in Dell's results beginningNovember 3, 2009.
The following table summarizes the consideration paid for Perot Systems and the amounts of assets acquired and liabilities assumed recognized at theacquisition date:
Total (in millions)
Cash and cash equivalents $ 266
Accounts receivable, net 410
Other assets 58
Property, plant, and equipment 323
Customer relationships and other intangible assets 1,174
Deferred tax liability, net (a) (424)
Other liabilities (256)
Total identifiable net assets 1,551
Goodwill 2,327
Total purchase price $ 3,878_____________________(a) The deferred tax liability, net primarily relates to purchased identifiable intangible assets and property, plant, and equipment and is shown net of associated deferred tax assets.
The goodwill of $2.3 billion represents the value from combining Perot Systems with Dell to provide customers with a broader range of IT services andsolutions as well as optimizing how these solutions are delivered. The acquisition has enabled Dell to supply even more Perot Systems customers with Dellproducts and extended the reach of Perot Systems' capabilities to Dell customers around the world. Goodwill of $679 million, $1,613 million, and $35 millionwas assigned to the Large Enterprise, Public, and SMB segments, respectively.
In conjunction with the acquisition, Dell incurred $93 million in cash compensation payments made to former Perot Systems employees who acceptedpositions with Dell related to the acceleration of Perot Systems unvested stock options and other cash compensation payments. These cash compensationpayments were expensed as incurred and are recorded in Selling, general, and administrative expenses in the Consolidated Statements of Income for Fiscal2010. During Fiscal 2010, Dell incurred $116 million in acquisition-related costs for Perot Systems, including the payments above, and an additional $23million in other acquisition-related costs such as bankers' fees, consulting fees, other employee-related charges, and integration costs.
There was no contingent consideration related to the acquisition.
Unaudited pro-forma results for the fiscal year ended January 29, 2010 were pro-forma net sales of $54.7 billion, pro-forma net income of $1.4 billion, andpro-forma diluted earnings per share of $0.72. The pro forma results were adjusted for intercompany charges, but did not include any anticipated costsynergies or other effects of the planned integration of Perot Systems. Accordingly, the pro forma results presented are not necessarily indicative of the resultsthat actually would have occurred had the acquisition been completed on the dates indicated, nor are they indicative of the future operating results of thecombined company.
84

Table of Contents DELL INC.
NOTES TO CONSOLIDATED FINANCIAL STATEMENTS (Continued)
NOTE 8 — GOODWILL AND INTANGIBLE ASSETS
Goodwill
Goodwill allocated to Dell's business segments as of February 3, 2012, and January 28, 2011, and changes in the carrying amount of goodwill for therespective periods, were as follows:
Fiscal Year Ended
February 3, 2012 Large
Enterprise Public Small and
MediumBusiness
Consumer Total
(in millions)
Balance at beginning of period $ 1,424 $ 2,164 $ 476 $ 301 $ 4,365
Goodwill acquired during the period 800 386 287 6 1,479
Adjustments (2) (3) (4) 3 (6)
Balance at end of period $ 2,222 $ 2,547 $ 759 $ 310 $ 5,838
January 28, 2011
LargeEnterprise
Public Small andMediumBusiness
Consumer Total
(in millions)
Balance at beginning of period $ 1,361 $ 2,026 $ 389 $ 298 $ 4,074
Goodwill acquired during the period 62 135 87 — 284
Adjustments 1 3 — 3 7
Balance at end of period $ 1,424 $ 2,164 $ 476 $ 301 $ 4,365
Goodwill is tested annually during the second fiscal quarter and whenever events or circumstances indicate an impairment may have occurred. If the carryingamount of goodwill exceeds its fair value, estimated based on discounted cash flow analyses, an impairment charge would be recorded. Based on the results ofthe annual impairment tests, no impairment of goodwill existed at July 30, 2011. Further, no triggering events have transpired since July 30, 2011, that wouldindicate a potential impairment of goodwill as of February 3, 2012. Dell did not have any accumulated goodwill impairment charges as of February 3, 2012.
Intangible Assets
Dell's intangible assets associated with completed acquisitions at February 3, 2012, and January 28, 2011, were as follows:
February 3, 2012 January 28, 2011 Gross Accumulated
Amortization Net Gross Accumulated
Amortization Net
(in millions)
Customer relationships $ 1,569 $ (506) $ 1,063 $ 1,363 $ (309) $ 1,054
Technology 1,156 (490) 666 647 (322) 325
Non-compete agreements 70 (42) 28 68 (26) 42
Tradenames 81 (41) 40 54 (31) 23
Amortizable intangible assets 2,876 (1,079) 1,797 2,132 (688) 1,444
In-process research and development 34 — 34 26 — 26
Indefinite lived intangible assets 26 — 26 25 — 25
Total intangible assets $ 2,936 $ (1,079) $ 1,857 $ 2,183 $ (688) $ 1,495
During Fiscal 2012 and Fiscal 2011, Dell recorded additions to intangible assets of $715 million and $126 million , respectively, and additions to in-processresearch and development of $38 million and $26 million , respectively. These additions were
85
Table of ContentsDELL INC.
NOTES TO CONSOLIDATED FINANCIAL STATEMENTS (Continued)
primarily related to Dell's Fiscal 2012 and Fiscal 2011 business acquisitions.
Amortization expense related to finite-lived intangible assets was approximately $391 million and $350 million in Fiscal 2012 and Fiscal 2011, respectively.There were no material impairment charges related to intangible assets for the fiscal years ended February 3, 2012, and January 28, 2011.
Estimated future annual pre-tax amortization expense of finite-lived intangible assets as of February 3, 2012, over the next five fiscal years and thereafter is asfollows:
Fiscal Years (in millions)
2013 $ 388
2014 370
2015 275
2016 227
2017 189
Thereafter 348
Total $ 1,797
86
Table of Contents DELL INC.
NOTES TO CONSOLIDATED FINANCIAL STATEMENTS (Continued)
NOTE 9 — WARRANTY AND DEFERRED EXTENDED WARRANTY REVENUE
Dell records liabilities for its standard limited warranties at the time of sale for the estimated costs that may be incurred. The liability for standard warranties isincluded in Accrued and other current liabilities and Other non-current liabilities on the Consolidated Statements of Financial Position. Revenue from the saleof extended warranties is recognized over the term of the contract or when the service is completed, and the costs associated with these contracts arerecognized as incurred. Deferred extended warranty revenue is included in deferred services revenue on the Consolidated Statements of Financial Position.Changes in Dell's liabilities for standard limited warranties and deferred services revenue related to extended warranties are presented in the following tablesfor the periods indicated:
Fiscal Year Ended
February 3,2012
January 28,2011
January 29,2010
(in millions)
Warranty liability:
Warranty liability at beginning of period $ 895 $ 912 $ 1,035
Costs accrued for new warranty contracts and changes in estimates for pre-existing warranties(a)(b) 1,025 1,046 987
Service obligations honored (1,032) (1,063) (1,110)
Warranty liability at end of period $ 888 $ 895 $ 912
Current portion $ 572 $ 575 $ 593
Non-current portion 316 320 319
Warranty liability at end of period $ 888 $ 895 $ 912
Fiscal Year Ended
February 3,2012
January 28,2011
January 29,2010
(in millions)
Deferred extended warranty revenue:
Deferred extended warranty revenue at beginning of period $ 6,416 $ 5,910 $ 5,587
Revenue deferred for new extended warranties(b) 4,301 3,877 3,481
Revenue recognized (3,715) (3,371) (3,158)
Deferred extended warranty revenue at end of period $ 7,002 $ 6,416 $ 5,910
Current portion $ 3,265 $ 2,959 $ 2,906
Non-current portion 3,737 3,457 3,004
Deferred extended warranty revenue at end of period $ 7,002 $ 6,416 $ 5,910____________________
(a) Changes in cost estimates related to pre-existing warranties are aggregated with accruals for new standard warranty contracts. Dell's warranty liability process does not differentiatebetween estimates made for pre-existing warranties and new warranty obligations.
(b) Includes the impact of foreign currency exchange rate fluctuations.
87

Table of ContentsDELL INC.
NOTES TO CONSOLIDATED FINANCIAL STATEMENTS (Continued)
NOTE 10 — COMMITMENTS AND CONTINGENCIES
Lease Commitments — Dell lease s property and equipment, manufacturing facilities, and office space under non-cancelable leases. Certain of these leasesobligate Dell to pay taxes, maintenance, and repair costs. At February 3, 2012 , future minimum lease payments under these non-cancelable leases are asfollows: $107 million in Fiscal 2013; $86 million in Fiscal 2014; $79 million in Fiscal 2015; $58 million in Fiscal 2016; $50 million in Fiscal 2017; and $85million thereafter.
Rent expense under all leases totaled $107 million , $87 million , and $93 million for Fiscal 2012 , Fiscal 2011 , and Fiscal 2010 , respectively.
Purchase Obligations — Dell has contractual obligations to purchase goods or services, which specify significant terms, including fixed or minimumquantities to be purchased; fixed, minimum, or variable price provisions; and the approximate timing of the transaction. As of February 3, 2012, Dell had$2,865 million, $15 million, and $16 million in p urchase obligations for Fiscal 2013, Fiscal 2014, and Fiscal 2015, and thereafter, respectively.
Legal Matters — Dell is involved in various claims, suits, assessments, investigations, and legal proceedings that arise from time to time in the ordinarycourse of its business, including those identified below, consisting of matters involving consumer, antitrust, tax, intellectual property, and other issues on aglobal basis. Dell accrues a liability when it believes that it is both probable that a liability has been incurred and that it can reasonably estimate the amount ofthe loss. Dell reviews these accruals at least quarterly and adjusts them to reflect ongoing negotiations, settlements, rulings, advice of legal counsel, and otherrelevant information. To the extent new information is obtained and Dell's views on the probable outcomes of claims, suits, assessments, investigations, orlegal proceedings change, changes in Dell's accrued liabilities would be recorded in the period in which such determination is made. For some matters, theamount of liability is not probable or the amount cannot be reasonably estimated and therefore accruals have not been made. The following is a discussion ofDell's significant legal matters and other proceedings pending at February 3, 2012:
Securities Litigation — Four putative securities class actions filed between September 13, 2006, and January 31, 2007, in the U.S. District Court for theWestern District of Texas, Austin Division, against Dell and certain of its current and former directors and officers were consolidated as In re Dell SecuritiesLitigation, and a lead plaintiff was appointed by the court. The lead plaintiff asserted claims under Sections 10(b), 20(a), and 20A of the Securities ExchangeAct of 1934 based on alleged false and misleading disclosures or omissions regarding Dell's financial statements, governmental investigations, internalcontrols, known battery problems and business model, and based on insiders' sales of Dell securities. This action also included Dell's independent registeredpublic accounting firm, PricewaterhouseCoopers LLP, as a defendant. On October 6, 2008, the court dismissed all of the plaintiff's claims with prejudice andwithout leave to amend. On November 3, 2008, the plaintiff appealed the dismissal of Dell and the officer defendants to the Fifth Circuit Court of Appeals.The appeal was fully briefed, and oral argument on the appeal was heard by the Fifth Circuit Court of Appeals on September 1, 2009. On November 20, 2009,the parties to the appeal entered into a written settlement agreement whereby Dell would pay $40 million to the proposed class and the plaintiff would dismissthe pending litigation. The settlement was preliminarily approved by the District Court on December 21, 2009. The settlement was subject to certainconditions, including opt-outs from the proposed class not exceeding a specified percentage and final approval by the District Court. During the first quarterof Fiscal 2011, the original opt-out period in the notice approved by the District Court expired without the specified percentage being exceeded. The DistrictCourt subsequently granted final approval for the settlement and entered a final judgment on July 20, 2010. Dell paid $40 million into an escrow account tosatisfy this settlement and discharged the liability during the second quarter of Fiscal 2011. Certain objectors to the settlement filed notices of appeal to theFifth Circuit Court of Appeals with regard to approval of the settlement. On February 7, 2012, the Fifth Circuit Court of Appeals affirmed the District Court'sapproval of the settlement.
Copyright Levies — Dell's obligation to collect and remit copyright levies in certain European Union (“EU”) countries may be affected by the resolution oflegal proceedings pending in Germany against various companies, including Dell's German subsidiary, and elsewhere in the EU against other companies inDell's industry. The plaintiffs in those proceedings, some of which are described below, generally seek to impose or modify the levies with respect to sales ofsuch equipment as multifunction devices, phones, personal computers, and printers, alleging that such products enable the copying of copyrighted materials.Some of the proceedings also challenge whether the levy schemes in those countries comply with EU law. Certain EU member countries that do not yetimpose levies on digital devices are expected to implement legislation to enable them to extend existing levy schemes, while some other
88
Table of Contents DELL INC.
NOTES TO CONSOLIDATED FINANCIAL STATEMENTS (Continued)
EU member countries are expected to limit the scope of levy schemes and their applicability in the digital hardware environment. Dell, other companies, andvarious industry associations have opposed the extension of levies to the digital environment and have advocated alternative models of compensation to rightsholders. Dell continues to collect levies in certain EU countries where it has determined that based on local laws it is probable that Dell has a paymentobligation. The amount of levies is generally based on the number of products sold and the per-product amounts of the levies, which vary. In all other matters,Dell does not believe there is a probable and estimable claim. As such, Dell has not accrued any liability nor collected any levies.
On December 29, 2005, Zentralstelle Für private Überspielungrechte (“ZPÜ”), a joint association of various German collecting societies, instituted arbitrationproceedings against Dell's German subsidiary before the Board of Arbitration at the German Patent and Trademark Office in Munich, and subsequently filed alawsuit in the German Regional Court in Munich on February 21, 2008, seeking levies to be paid on each personal computer sold by Dell in Germany throughthe end of calendar year 2007. On December 23, 2009, ZPÜ and the German industry association, BCH, reached a settlement regarding audio-video copyrightlevy litigation (with levies ranging from €3.15 to €13.65 per unit). Dell joined this settlement on February 23, 2010 and has paid the amounts due under thesettlement. However, because the settlement agreement expired on December 31, 2010, the amount of levies payable after calendar year 2010, as well asDell's ability to recover such amounts through increased prices, remains uncertain.
German courts are also considering a lawsuit originally filed in July 2004 by VG Wort, a German collecting society representing certain copyright holders,against Hewlett-Packard Company in the Stuttgart Civil Court seeking levies on printers, and a lawsuit originally filed in September 2003 by the sameplaintiff against Fujitsu Siemens Computer GmbH in Munich Civil Court in Munich, Germany seeking levies on personal computers. In each case, the civiland appellate courts held that the subject classes of equipment were subject to levies. In July 2011, the German Federal Supreme Court, to which the lowercourt holdings have been appealed, referred each case to the Court of Justice of the European Union, submitting a number of legal questions on theinterpretation of the European Copyright Directive which the German Federal Supreme Court deems necessary for its decision. Dell has not accrued anyliability in either matter, as Dell does not believe there is a probable and estimable claim.
Proceedings seeking to impose or modify copyright levies for sales of digital devices also have been instituted in courts in Spain and in other EU memberstates. Even in countries where Dell is not a party to such proceedings, decisions in those cases could impact Dell's business and the amount of copyrightlevies Dell may be required to collect.
The ultimate resolution of these proceedings and the associated financial impact to Dell, if any, including the number of units potentially affected, the amountof levies imposed, and the ability of Dell to recover such amounts remains uncertain at this time. Should the courts determine there is liability for previousunits shipped beyond the amount of levies Dell has collected or accrued, Dell would be liable for such incremental amounts. Recovery of any such amountsfrom others by Dell would be possible only on future collections related to future shipments.
Chad Brazil and Steven Seick v Dell Inc. — Chad Brazil and Steven Seick filed a class action suit against Dell in March 2007 in the U.S. District Court for theNorthern District of California. The plaintiffs allege that Dell advertised discounts on its products from false “regular” prices, in violation of California law.The plaintiffs seek compensatory damages, disgorgement of profits from the alleged false advertising, injunctive relief, punitive damages and attorneys' fees.In December 2010, the District Court certified a class consisting of all California residents who had purchased certain products advertised with a former salesprice on the consumer segment of Dell's website during an approximately four year period between March 2003 and June 2007. During the first quarter ofFiscal 2012, the plaintiffs and Dell reached a class-wide settlement in principle regarding the dispute on terms that are not material to Dell, and on October 28,2011 the District Court granted final approval of the settlement. Since the final approval, an objector to the settlement has filed a notice of appeal to the NinthCircuit Court of Appeals with regard to approval of the settlement. While there can be no assurances with respect to litigation, Dell believes it is unlikely thatthe settlement will be overturned on appeal.
Convolve Inc. v Dell Inc. — Convolve, Inc. sued Dell, Western Digital Corporation (“Western Digital”), Hitachi Global Storage Technologies, Inc., andHitachi Ltd. (collectively “Hitachi”) on June 18, 2008 in the Eastern District of Texas, Marshall Division, alleging that the defendants infringe United StatesPatent No. 4,916,635 (entitled “Shaping Command Inputs to Minimize Unwanted Dynamics”) and United States Patent No. 6,314,473 (entitled “System for
89
Table of ContentsDELL INC.
NOTES TO CONSOLIDATED FINANCIAL STATEMENTS (Continued)
Removing Selected Unwanted Frequencies in Accordance with Altered Settings in a User Interface of a Data Storage Device”). Western Digital and Hitachiare hard drive suppliers of Dell. The plaintiff sought damages for each product with an allegedly infringing hard drive sold by Dell, plus exemplary damagesfor allegedly willful infringement. On July 26, 2011, a jury found that the patents had been infringed and awarded the plaintiff an amount that is not materialto Dell. The jury decision is subject to final approval and entry by the judge.
Other Litigation — The various legal proceedings in which Dell is involved include commercial litigation and a variety of patent suits. In some of these cases,Dell is the sole defendant. More often, particularly in the patent suits, Dell is one of a number of defendants in the electronics and technology industries. Dellis actively defending a number of patent infringement suits, and several pending claims are in various stages of evaluation. While the number of patent caseshas grown over time, Dell does not currently anticipate that any of these matters will have a material adverse effect on Dell's business, financial condition,results of operations, or cash flows.
As of February 3, 2012, Dell does not believe there is a reasonable possibility that a material loss exceeding the amounts already accrued for these or otherproceedings or matters may have been incurred. However, since the ultimate resolution of any such proceedings and matters is inherently unpredictable, Dell'sbusiness, financial condition, results of operations, or cash flows could be materially affected in any particular period by unfavorable outcomes in one or moreof these proceedings or matters. Whether the outcome of any claim, suit, assessment, investigation, or legal proceeding, individually or collectively, couldhave a material adverse effect on Dell's business, financial condition, results of operations, or cash flows will depend on a number of variables, including thenature, timing, and amount of any associated expenses, amounts paid in settlement, damages or other remedies or consequences.
Certain Concentrations — Dell's counterparties to its financial instruments consist of a number of major financial institutions with credit ratings of AA and Aby major credit rating agencies. In addition to limiting the amount of agreements and contracts it enters into with any one party, Dell monitors its positionswith, and the credit quality of the counterparties to, these financial instruments. Dell does not anticipate nonperformance by any of the counterparties.
Dell's investments in debt securities are in high quality financial institutions and companies. As part of its cash and risk management processes, Dell performsperiodic evaluations of the credit standing of the institutions in accordance with its investment policy. Dell's investments in debt securities have statedmaturities of up to three years. Management believes that no significant concentration of credit risk for investments exists for Dell.
As of February 3, 2012, Dell did not have significant concentrations of cash and cash equivalent deposits with its financial institutions.
Dell markets and sells its products and services to large corporate clients, governments, and health care and education accounts, as well as to small andmedium-sized businesses and individuals. No single customer accounted for more than 10% of Dell's consolidated net revenue during Fiscal 2012, Fiscal2011, or Fiscal 2010.
Dell purchases a number of components from single or limited sources. In some cases, alternative sources of supply are not available. In other cases, Dell mayestablish a working relationship with a single source or a limited number of sources if Dell believes it is advantageous to do so based on performance, quality,support, delivery, capacity, or price considerations.
Dell also sells components to certain contract manufacturers who assemble final products for Dell. Dell does not recognize the sale of these components innet sales and does not recognize the related profits until the final products are sold by Dell to end users. Profits from the sale of these parts are recognized as areduction of cost of sales at the time of sale. Dell has net settlement agreements with the majority of these contract manufacturers that allow Dell to offset theaccounts payable to the contract manufacturers from the amounts receivable from them. Gross non-trade receivables as of February 3, 2012, and January 28,2011 were $3.0 billion and $2.7 billion, respectively, and four contract manufacturers account for the majority of these receivables. Dell has net settlementagreements with these four contract manufacturers and as of February 3, 2012, and January 28, 2011, the payables to these four contract manufacturersexceeded the receivables due from them; therefore, the non-trade receivable amounts due from these manufacturers are offset against the correspondingaccounts payable to those manufacturers in the accompanying Consolidated Statements of Financial Position.
90
Table of ContentsDELL INC.
NOTES TO CONSOLIDATED FINANCIAL STATEMENTS (Continued)
NOTE 11 — INCOME AND OTHER TAXES
The provision for income taxes consists of the following:
Fiscal Year Ended
February 3,2012
January 28,2011
January 29,2010
(in millions)
Current:
Federal $ 375 $ 597 $ 491
State/Local 81 66 36
Foreign 273 97 116
Current 729 760 643
Deferred:
Federal 62 (95) (21)
State/Local (12) 9 9
Foreign (31) 41 (40)
Deferred 19 (45) (52)
Provision for income taxes $ 748 $ 715 $ 591
Income before provision for income taxes consists of the following:
Fiscal Year Ended
February 3,2012
January 28,2011
January 29,2010
(in millions)
Domestic $ 365 $ 532 $ 182
Foreign 3,875 2,818 1,842
Income before income taxes $ 4,240 $ 3,350 $ 2,024
Deferred tax assets and liabilities are recorded for the estimated tax impact of temporary differences between the tax and book basis of assets and liabilities,and are recognized based on the enacted statutory tax rates for the year in which Dell expects the differences to reverse. A valuation allowance is establishedagainst a deferred tax asset when it is more likely than not that the asset or any portion thereof will not be realized. Based upon all the available evidence,including expectation of future taxable income, Dell has provided a valuation allowance of $44 million and $48 million f or Fiscal 2012 and Fiscal 2011 ,respectively, related to state income tax credit carryforwards. Dell has provided a valuation allowance of $29 million and $20 million related to net operatinglosses for Fiscal 2012 and Fiscal 2011, respectively. No valuation allowance has been provided against other deferred tax assets for Fiscal 2012, compared toa $4 million valuation allowance provided against other deferred tax assets for Fiscal 2011. Dell has determined that it will be able to realize the remainder ofits deferred tax assets.
91
Table of ContentsDELL INC.
NOTES TO CONSOLIDATED FINANCIAL STATEMENTS (Continued)
The components of Dell's net deferred tax assets are as follows:
February 3,2012
January 28,2011
(in millions)
Deferred tax assets:
Deferred revenue $ 486 $ 369
Warranty provisions 226 214
Provisions for product returns and doubtful accounts 85 77
Credit carryforwards 61 54
Loss carryforwards 271 268
Stock-based and deferred compensation 183 203
Operating and compensation related accruals 140 135
Capitalized intangible assets 51 55
Other 97 98
Deferred tax assets 1,600 1,473
Valuation allowance (73) (72)
Deferred tax assets, net of valuation allowance 1,527 1,401
Deferred tax liabilities:
Leasing and financing (220) (49)
Property and equipment (136) (144)
Acquired intangibles (667) (511)
Other (59) (64)
Deferred tax liabilities (1,082) (768)
Net deferred tax assets $ 445 $ 633
Current portion $ 682 $ 558
Non-current portion (237) 75
Net deferred tax assets $ 445 $ 633
The current portion of net deferred tax assets is included in Other current assets in the Consolidated Statements of Financial Position as of February 3, 2012,and January 28, 2011. The non-current portion of net deferred tax assets is included in Other non-current liabilities and Other non-current assets in theConsolidated Statements of Financial Position as of February 3, 2012, and January 28, 2011, respectively.
During Fiscal 2012 and Fiscal 2011 , Dell recorded $124 million and $41 million , respectively, of deferred tax assets related to net operating loss and creditcarryforwards acquired during the year, all of which was offset against goodwill. During Fiscal 2012 and Fiscal 2011 , $10 million and $21 million ,respectively, were recorded to additional paid in capital related to the utilization of acquired net operating losses as a result of employee stock option activity,and is included in net tax shortfall from employee stock plans on the Consolidated Statements of Stockholders' Equity. Utilization of the acquiredcarryforwards is subject to limitations due to ownership changes that may delay the utilization of a portion of the acquired carryforwards. No additionalvaluation allowances have been placed on the acquired net operating loss and credit carryforwards. The carryforwards expire beginning in Fiscal 2015.
Deferred taxes have not been recorded on the excess book basis in the shares of certain foreign subsidiaries because these basis differences are not expected toreverse in the foreseeable future and are expected to be permanent in duration. The basis differences in the amount of approximately $15.9 billion aroseprimarily from undistributed book earnings, which Dell intends to reinvest indefinitely. The basis differences could reverse through a sale of the subsidiariesor the receipt of dividends from the subsidiaries, as well as various other events. Net of available foreign tax credits, residual income tax of approximately$5.2 billion would be due upon reversal of this excess book basis as of February 3, 2012.
A portion of Dell's operations is subject to a reduced tax rate or is free of tax under various tax holidays. Dell's significant tax holidays expire in whole or inpart during Fiscal 2016 through Fiscal 2021. Many of these tax holidays and reduced tax rates may be extended when certain conditions are met or may beterminated early if certain conditions are not met. The income tax
92

Table of Contents DELL INC.
NOTES TO CONSOLIDATED FINANCIAL STATEMENTS (Continued)
benefits attributable to the tax status of these subsidiaries were estimated to be approximately $474 million ($.26 per share) in Fiscal 2012, $321 million ($.17per share) in Fiscal 2011, and $149 million ($.08 per share) in Fiscal 2010.
The effective tax rate differed from the statutory U.S. federal income tax rate as follows:
Fiscal Year Ended
February 3,2012
January 28,2011
January 29,2010
U.S. federal statutory rate 35.0 % 35.0 % 35.0 %
Foreign income taxed at different rates (19.2) (14.7) (7.6)
State income taxes, net of federal tax benefit 0.8 1.4 1.4
Regulatory settlement — 1.0 —
Other 1.0 (1.4) 0.4
Total 17.6 % 21.3 % 29.2 %
A reconciliation of the beginning and ending amount of unrecognized tax benefits is as follows:
Total
(in millions)
Balance at January 30, 2009 $ 1,538
Increases related to tax positions of the current year 298
Increases related to tax positions of prior years 32
Reductions for tax positions of prior years (69)
Lapse of statute of limitations (3)
Audit settlements (3)
Balance at January 29, 2010 1,793
Increases related to tax positions of the current year 262
Increases related to tax positions of prior years 22
Reductions for tax positions of prior years (41)
Lapse of statute of limitations (32)
Audit settlements (21)
Balance at January 28, 2011 1,983
Increases related to tax positions of the current year 260
Increases related to tax positions of prior years 30
Reductions for tax positions of prior years (43)
Lapse of statute of limitations (32)
Audit settlements (4)
Balance at February 3, 2012 $ 2,194
Dell recorded net unrecognized tax benefits of $2.6 billion and $2.3 billion, which are included in Other non-current liabilities in its Consolidated Statementsof Financial Position, as of February 3, 2012, and January 28, 2011, respectively. The unrecognized tax benefits in the table above do not include accruedinterest and penalties. Dell had accrued interest and penalties of $664 million, $552 million, and $507 million as of February 3, 2012, January 28, 2011, andJanuary 29, 2010, respectively. These interest and penalties are offset by tax benefits from transfer pricing, interest deductions, and state income tax, whichare also not included in the table above. These benefits were $295 million, $242 million, and $209 million as of February 3, 2012, January 28, 2011, andJanuary 29, 2010, respectively. Net unrecognized tax benefits, if recognized, would favorably affect Dell's effective tax rate.
Interest and penalties related to income tax liabilities are included in income tax expense. Dell recorded $112 million , $45 million , and $107 million relatedto interest and penalties, which were included in income tax expense for Fiscal 2012, Fiscal 2011, and Fiscal 2010, respectively.
93
Table of Contents DELL INC.
NOTES TO CONSOLIDATED FINANCIAL STATEMENTS (Continued)
Dell is currently under income tax audits in various jurisdictions, including the United States. The tax periods open to examination by the major taxingjurisdictions to which Dell is subject include fiscal years 1999 through 2011. As a result of these audits, Dell maintains ongoing discussions and negotiationsrelating to tax matters with the taxing authorities in these various jurisdictions. Dell believes that it has provided adequate reserves related to all matterscontained in tax periods open to examination.
Dell's U.S. federal income tax returns for fiscal years 2007 through 2009 are currently under examination by the Internal Revenue Service (“IRS”). The IRSissued a Revenue Agent's Report (“RAR”) for fiscal years 2004 through 2006 proposing certain assessments primarily related to transfer pricing matters. Delldisagrees with certain of the proposed assessments and has contested them through the IRS administrative appeals procedures. The IRS has remanded theaudit for tax years 2004 through 2006 back to examination for further review. Should Dell experience an unfavorable outcome in the IRS matter, such anoutcome could have a material impact on its results of operations, financial position, and cash flows. Although the timing of income tax audit resolutions andnegotiations with taxing authorities is highly uncertain, Dell does not anticipate a significant change to the total amount of unrecognized income tax benefitswithin the next 12 months.
Dell takes certain non-income tax positions in the jurisdictions in which it operates and has received certain non-income tax assessments from variousjurisdictions. Dell has recently reached agreement with a state government in Brazil regarding the proper application of transactional taxes to warrantiesrelated to the sale of computers. Under the consensus, Dell has agreed to apply certain tax incentives in order to offset potential tax liabilities. Reaching thisagreement did not have a material impact to its Consolidated Financial Statements.
Dell believes its positions in these non-income tax litigation matters are supportable, that a liability is not probable, and that it will ultimately prevail. In thenormal course of business, Dell's positions and conclusions related to its non-income taxes could be challenged and assessments may be made. To the extentnew information is obtained and Dell's views on its positions, probable outcomes of assessments, or litigation change, changes in estimates to Dell's accruedliabilities would be recorded in the period in which such determination is made.
94
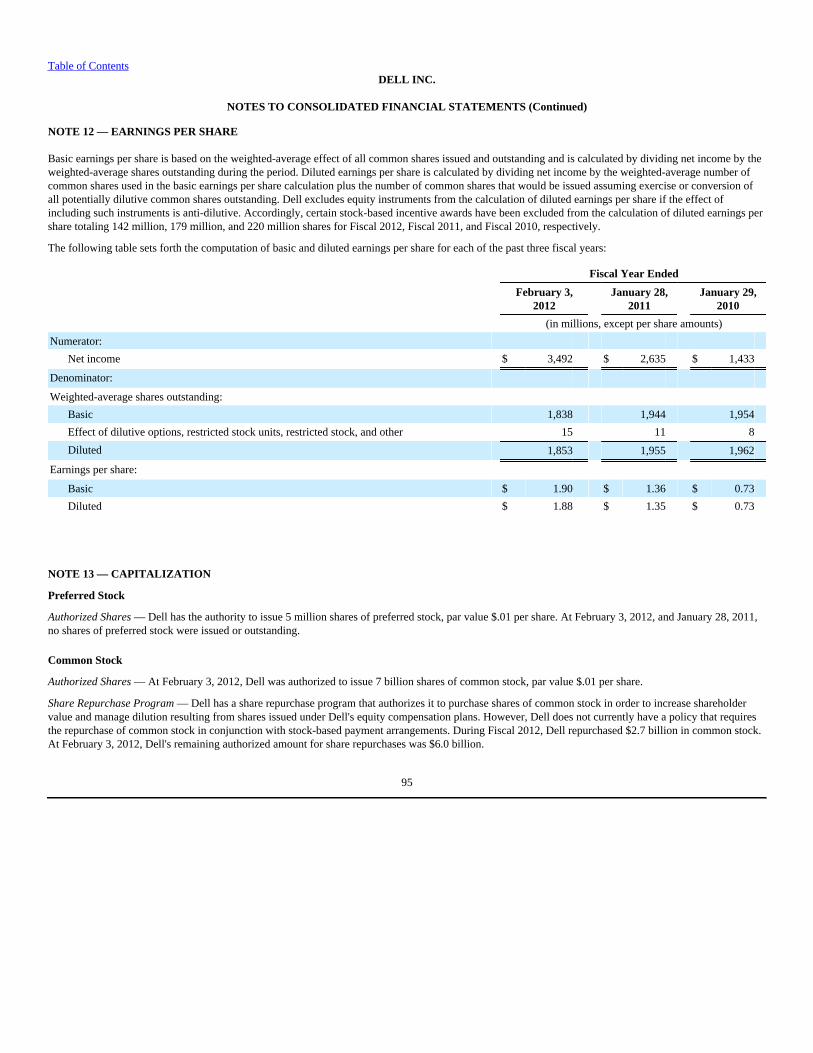
Table of Contents DELL INC.
NOTES TO CONSOLIDATED FINANCIAL STATEMENTS (Continued)
NOTE 12 — EARNINGS PER SHARE
Basic earnings per share is based on the weighted-average effect of all common shares issued and outstanding and is calculated by dividing net income by theweighted-average shares outstanding during the period. Diluted earnings per share is calculated by dividing net income by the weighted-average number ofcommon shares used in the basic earnings per share calculation plus the number of common shares that would be issued assuming exercise or conversion ofall potentially dilutive common shares outstanding. Dell excludes equity instruments from the calculation of diluted earnings per share if the effect ofincluding such instruments is anti-dilutive. Accordingly, certain stock-based incentive awards have been excluded from the calculation of diluted earnings pershare totaling 142 million, 179 million, and 220 million shares for Fiscal 2012, Fiscal 2011, and Fiscal 2010, respectively.
The following table sets forth the computation of basic and diluted earnings per share for each of the past three fiscal years:
Fiscal Year Ended
February 3,2012
January 28,2011
January 29,2010
(in millions, except per share amounts)
Numerator:
Net income $ 3,492 $ 2,635 $ 1,433
Denominator:
Weighted-average shares outstanding:
Basic 1,838 1,944 1,954
Effect of dilutive options, restricted stock units, restricted stock, and other 15 11 8
Diluted 1,853 1,955 1,962
Earnings per share:
Basic $ 1.90 $ 1.36 $ 0.73
Diluted $ 1.88 $ 1.35 $ 0.73
NOTE 13 — CAPITALIZATION
Preferred Stock
Authorized Shares — Dell has the authority to issue 5 million shares of preferred stock, par value $.01 per share. At February 3, 2012, and January 28, 2011,no shares of preferred stock were issued or outstanding.
Common Stock
Authorized Shares — At February 3, 2012, Dell was authorized to issue 7 billion shares of common stock, par value $.01 per share.
Share Repurchase Program — Dell has a share repurchase program that authorizes it to purchase shares of common stock in order to increase shareholdervalue and manage dilution resulting from shares issued under Dell's equity compensation plans. However, Dell does not currently have a policy that requiresthe repurchase of common stock in conjunction with stock-based payment arrangements. During Fiscal 2012, Dell repurchased $2.7 billion in common stock.At February 3, 2012, Dell's remaining authorized amount for share repurchases was $6.0 billion.
95

Table of ContentsDELL INC.
NOTES TO CONSOLIDATED FINANCIAL STATEMENTS (Continued)
NOTE 14 — STOCK-BASED COMPENSATION AND BENEFIT PLANS
Stock-based Compensation
Description of the Plans
Employee Stock Plans — Dell is currently issuing stock grants under the Dell Amended and Restated 2002 Long-Term Incentive Plan (the “2002 IncentivePlan”), which was approved by shareholders on December 4, 2007. There are previous plans that have been terminated, except for options previously grantedunder those plans which remain outstanding. In Fiscal 2012, in connection with a business acquisition, Dell assumed the stock incentive plan of one of itsacquired companies. No future grants will be made under the assumed plan. The 2002 Incentive Plan, all previous plans, and the assumed plan are allcollectively referred to as the “Stock Plans.”
The 2002 Incentive Plan provides for the grant of stock-based incentive awards to Dell's employees and non-employee directors. Awards may be incentivestock options within the meaning of Section 422 of the Internal Revenue Code, non-qualified stock options, restricted stock, restricted stock units, orperformance-based restricted stock units. There were approximately 342 million, 344 million, and 320 million shares of Dell's common stock available forfuture grants under the 2002 Incentive Plan at February 3, 2012, January 28, 2011, and January 29, 2010, respectively. To satisfy stock option exercises andvested restricted stock awards, Dell has a policy of issuing new shares rather than repurchasing shares on the open market.
Stock Option Agreements — Stock options granted under the 2002 Incentive Plan typically vest pro-rata at each option anniversary date over a three- to five-year period. These options, which are granted with option exercise prices equal to the fair market value of Dell's common stock on the date of grant, generallyexpire within ten to twelve years from the date of grant. In connection with business acquisitions, during Fiscal 2012, Dell converted or assumed a smallnumber of stock options granted under the stock incentive plans of acquired companies, which are collectively referred to as the "assumed options." Theseassumed options vest over a period of up to four years and generally expire within ten years from the date of assumption. Compensation expense for all stockoptions is recognized on a straight-line basis over the requisite service period.
Restricted Stock Awards — Awards of restricted stock may be either grants of restricted stock, restricted stock units, or performance-based stock units that areissued at no cost to the recipient. For restricted stock grants, at the date of grant, the recipient has all rights of a stockholder, subject to certain restrictions ontransferability and a risk of forfeiture. Restricted stock grants typically vest over a three- to seven-year period beginning on the date of the grant. For restrictedstock units, legal ownership of the shares is not transferred to the employee until the units vest, which is generally over a three- to five-year period. The costof these awards is determined using the fair market value of Dell's common stock on the date of the grant. Dell also grants performance-based restricted stockunits as a long-term incentive in which an award recipient receives shares contingent upon Dell achieving performance objectives and the employee'scontinuing employment through the vesting period, which is generally over a three- to five-year period. Compensation costs recorded in connection with theseperformance-based restricted stock units are based on Dell's best estimate of the number of shares that will eventually be issued upon achievement of thespecified performance objectives and when it becomes probable that such performance objectives will be achieved.
Compensation costs for restricted stock awards with a service condition is recognized on a straight-line basis over the requisite service period. Compensationcosts for performance-based restricted stock awards is recognized on an accelerated multiple-award approach based on the most probable outcome of theperformance condition.
96
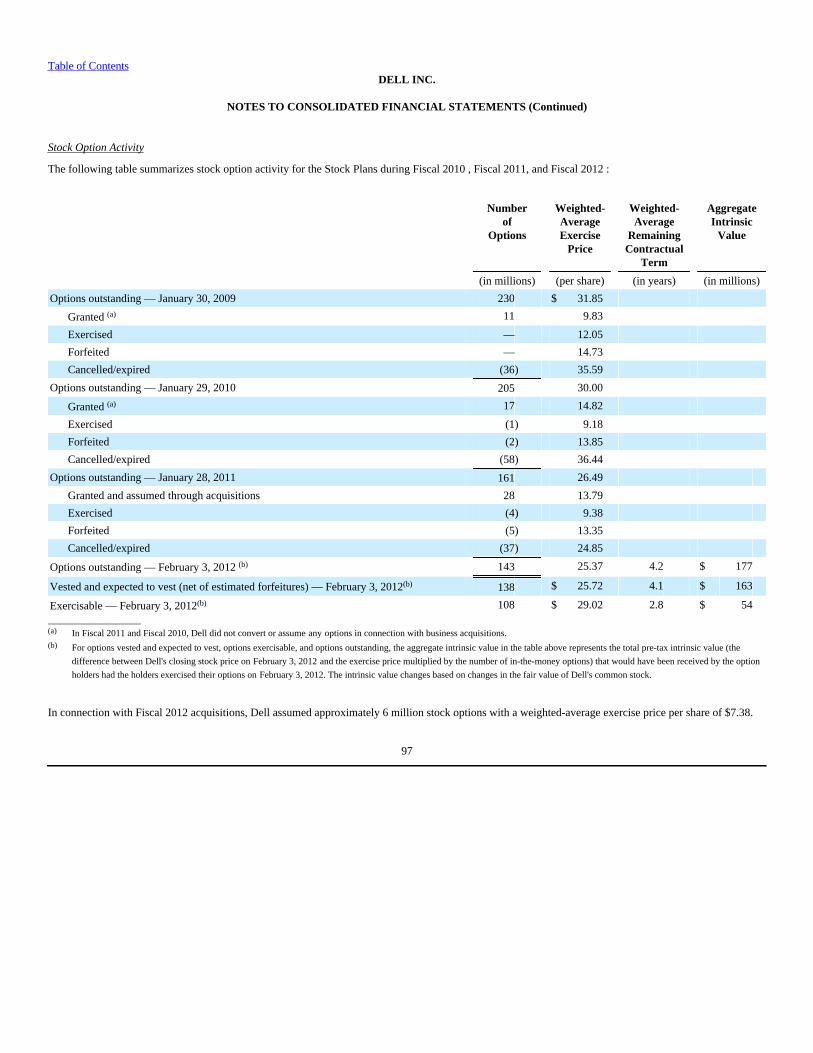
Table of ContentsDELL INC.
NOTES TO CONSOLIDATED FINANCIAL STATEMENTS (Continued)
Stock Option Activity
The following table summarizes stock option activity for the Stock Plans during Fiscal 2010 , Fiscal 2011, and Fiscal 2012 :
Numberof
Options
Weighted-AverageExercise
Price
Weighted-Average
RemainingContractual
Term
AggregateIntrinsic
Value
(in millions) (per share) (in years) (in millions)
Options outstanding — January 30, 2009 230 $ 31.85
Granted (a) 11 9.83
Exercised — 12.05
Forfeited — 14.73
Cancelled/expired (36) 35.59
Options outstanding — January 29, 2010 205 30.00
Granted (a) 17 14.82
Exercised (1) 9.18
Forfeited (2) 13.85
Cancelled/expired (58) 36.44
Options outstanding — January 28, 2011 161 26.49
Granted and assumed through acquisitions 28 13.79
Exercised (4) 9.38
Forfeited (5) 13.35
Cancelled/expired (37) 24.85
Options outstanding — February 3, 2012 (b) 143 25.37 4.2 $ 177
Vested and expected to vest (net of estimated forfeitures) — February 3, 2012(b) 138 $ 25.72 4.1 $ 163
Exercisable — February 3, 2012(b) 108 $ 29.02 2.8 $ 54____________________(a) In Fiscal 2011 and Fiscal 2010, Dell did not convert or assume any options in connection with business acquisitions.(b) For options vested and expected to vest, options exercisable, and options outstanding, the aggregate intrinsic value in the table above represents the total pre-tax intrinsic value (the
difference between Dell's closing stock price on February 3, 2012 and the exercise price multiplied by the number of in-the-money options) that would have been received by the option
holders had the holders exercised their options on February 3, 2012. The intrinsic value changes based on changes in the fair value of Dell's common stock.
In connection with Fiscal 2012 acquisitions, Dell assumed approximately 6 million stock options with a weighted-average exercise price per share of $7.38.
97
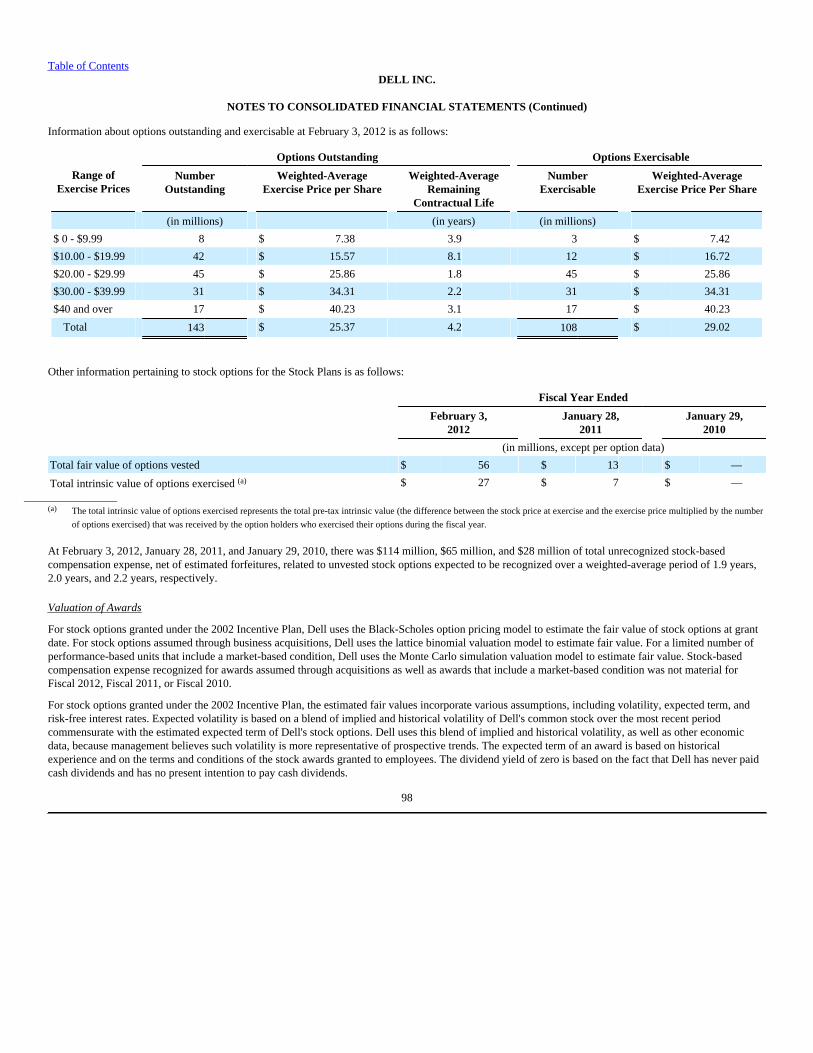
Table of ContentsDELL INC.
NOTES TO CONSOLIDATED FINANCIAL STATEMENTS (Continued)
Information about options outstanding and exercisable at February 3, 2012 is as follows:
Options Outstanding Options Exercisable
Range ofExercise Prices
NumberOutstanding
Weighted-AverageExercise Price per Share
Weighted-AverageRemaining
Contractual Life
NumberExercisable
Weighted-AverageExercise Price Per Share
(in millions) (in years) (in millions)
$ 0 - $9.99 8 $ 7.38 3.9 3 $ 7.42
$10.00 - $19.99 42 $ 15.57 8.1 12 $ 16.72
$20.00 - $29.99 45 $ 25.86 1.8 45 $ 25.86
$30.00 - $39.99 31 $ 34.31 2.2 31 $ 34.31
$40 and over 17 $ 40.23 3.1 17 $ 40.23
Total 143 $ 25.37 4.2 108 $ 29.02
Other information pertaining to stock options for the Stock Plans is as follows:
Fiscal Year Ended
February 3,2012
January 28,2011
January 29,2010
(in millions, except per option data)
Total fair value of options vested $ 56 $ 13 $ —
Total intrinsic value of options exercised (a) $ 27 $ 7 $ —____________________
(a) The total intrinsic value of options exercised represents the total pre-tax intrinsic value (the difference between the stock price at exercise and the exercise price multiplied by the number
of options exercised) that was received by the option holders who exercised their options during the fiscal year.
At February 3, 2012, January 28, 2011, and January 29, 2010, there was $114 million, $65 million, and $28 million of total unrecognized stock-basedcompensation expense, net of estimated forfeitures, related to unvested stock options expected to be recognized over a weighted-average period of 1.9 years,2.0 years, and 2.2 years, respectively.
Valuation of Awards
For stock options granted under the 2002 Incentive Plan, Dell uses the Black-Scholes option pricing model to estimate the fair value of stock options at grantdate. For stock options assumed through business acquisitions, Dell uses the lattice binomial valuation model to estimate fair value. For a limited number ofperformance-based units that include a market-based condition, Dell uses the Monte Carlo simulation valuation model to estimate fair value. Stock-basedcompensation expense recognized for awards assumed through acquisitions as well as awards that include a market-based condition was not material forFiscal 2012, Fiscal 2011, or Fiscal 2010.
For stock options granted under the 2002 Incentive Plan, the estimated fair values incorporate various assumptions, including volatility, expected term, andrisk-free interest rates. Expected volatility is based on a blend of implied and historical volatility of Dell's common stock over the most recent periodcommensurate with the estimated expected term of Dell's stock options. Dell uses this blend of implied and historical volatility, as well as other economicdata, because management believes such volatility is more representative of prospective trends. The expected term of an award is based on historicalexperience and on the terms and conditions of the stock awards granted to employees. The dividend yield of zero is based on the fact that Dell has never paidcash dividends and has no present intention to pay cash dividends.
98

Table of ContentsDELL INC.
NOTES TO CONSOLIDATED FINANCIAL STATEMENTS (Continued)
The weighted-average fair value of stock options granted under the 2002 Incentive Plan was determined based on the Black-Scholes option pricing model.The assumptions utilized in this model as well as the weighted-average grant date fair value of stock options granted during Fiscal 2012, Fiscal 2011, andFiscal 2010 are presented below:
Fiscal Year Ended
February 3,2012
January 28,2011
January 29,2010
Weighted-average grant date fair value of stock options granted per option $ 5.13 $ 5.01 $ 3.71
Expected term (in years) 4.6 4.5 4.5
Risk-free interest rate (U.S. Government Treasury Note) 1.9% 2.2% 1.8%
Volatility 36% 37% 44%
Dividends —% —% —%
Restricted Stock Awards
Non-vested restricted stock awards and activities For Fiscal 2010, Fiscal 2011, and Fiscal 2012 were as follows:
Numberof
Shares
Weighted-Average
Grant DateFair Value
(in millions) (per share)
Non-vested restricted stock:
Non-vested restricted stock balance as of January 30, 2009 36 $ 22.45
Granted 22 11.39
Vested(a) (13) 22.78
Forfeited (5) 18.23
Non-vested restricted stock balance as of January 29, 2010 40 16.84
Granted 26 14.53
Vested(a) (17) 19.10
Forfeited (7) 15.21
Non-vested restricted stock balance as of January 28, 2011 42 14.71
Granted 22 15.19
Vested(a) (18) 16.47
Forfeited (4) 14.05
Non-vested restricted stock balance as of February 3, 2012 42 $ 14.29____________________
(a) Upon vesting of restricted stock units, some of the underlying shares are generally sold to cover the required withholding taxes. However, select participants may choose the net shares
settlement method to cover withholding tax requirements. Total shares withheld were approximately 426,000, 354,000, and 157,000 for Fiscal 2012, Fiscal 2011, and Fiscal 2010,
respectively. Total payments for the employee's tax obligations to the taxing authorities were $6 million, $5 million, and $2 million in Fiscal 2012, 2011, and 2010, respectively, and are
reflected as a financing activity within the Consolidated Statements of Cash Flows.
For Fiscal 2012, Fiscal 2011, and Fiscal 2010, the total estimated vest date fair value of restricted stock awards was $273 million, $250 million, and $134million, respectively.
At February 3, 2012, January 28, 2011, and January 29, 2010, there was $348 million, $341 million, and $393 million, respectively, of unrecognized stock-based compensation expense, net of estimated forfeitures, related to non-vested restricted stock awards. These awards are expected to be recognized over aweighted-average period of approximately 1.8, 1.9, and 1.8 years, respectively.
99
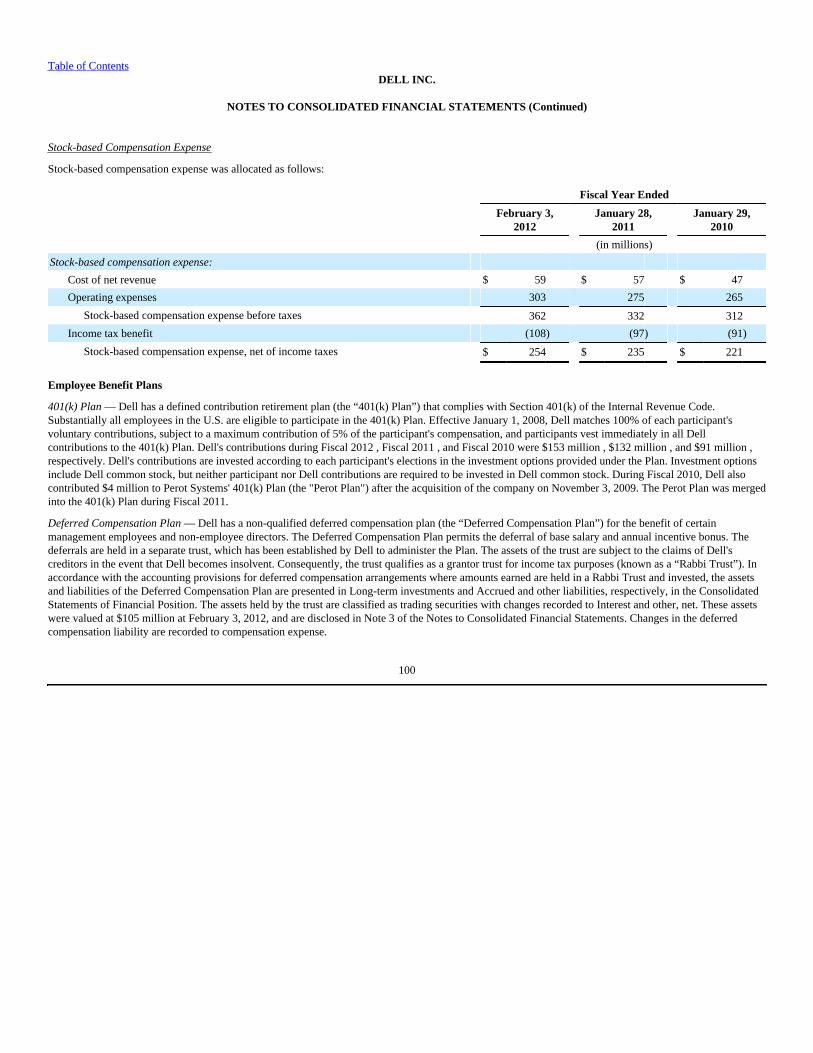
Table of Contents DELL INC.
NOTES TO CONSOLIDATED FINANCIAL STATEMENTS (Continued)
Stock-based Compensation Expense
Stock-based compensation expense was allocated as follows:
Fiscal Year Ended
February 3,2012
January 28,2011
January 29,2010
(in millions)
Stock-based compensation expense:
Cost of net revenue $ 59 $ 57 $ 47
Operating expenses 303 275 265
Stock-based compensation expense before taxes 362 332 312
Income tax benefit (108) (97) (91)
Stock-based compensation expense, net of income taxes $ 254 $ 235 $ 221
Employee Benefit Plans
401(k) Plan — Dell has a defined contribution retirement plan (the “401(k) Plan”) that complies with Section 401(k) of the Internal Revenue Code.Substantially all employees in the U.S. are eligible to participate in the 401(k) Plan. Effective January 1, 2008, Dell matches 100% of each participant'svoluntary contributions, subject to a maximum contribution of 5% of the participant's compensation, and participants vest immediately in all Dellcontributions to the 401(k) Plan. Dell's contributions during Fiscal 2012 , Fiscal 2011 , and Fiscal 2010 were $153 million , $132 million , and $91 million ,respectively. Dell's contributions are invested according to each participant's elections in the investment options provided under the Plan. Investment optionsinclude Dell common stock, but neither participant nor Dell contributions are required to be invested in Dell common stock. During Fiscal 2010, Dell alsocontributed $4 million to Perot Systems' 401(k) Plan (the "Perot Plan") after the acquisition of the company on November 3, 2009. The Perot Plan was mergedinto the 401(k) Plan during Fiscal 2011.
Deferred Compensation Plan — Dell has a non-qualified deferred compensation plan (the “Deferred Compensation Plan”) for the benefit of certainmanagement employees and non-employee directors. The Deferred Compensation Plan permits the deferral of base salary and annual incentive bonus. Thedeferrals are held in a separate trust, which has been established by Dell to administer the Plan. The assets of the trust are subject to the claims of Dell'screditors in the event that Dell becomes insolvent. Consequently, the trust qualifies as a grantor trust for income tax purposes (known as a “Rabbi Trust”). Inaccordance with the accounting provisions for deferred compensation arrangements where amounts earned are held in a Rabbi Trust and invested, the assetsand liabilities of the Deferred Compensation Plan are presented in Long-term investments and Accrued and other liabilities, respectively, in the ConsolidatedStatements of Financial Position. The assets held by the trust are classified as trading securities with changes recorded to Interest and other, net. These assetswere valued at $105 million at February 3, 2012, and are disclosed in Note 3 of the Notes to Consolidated Financial Statements. Changes in the deferredcompensation liability are recorded to compensation expense.
100
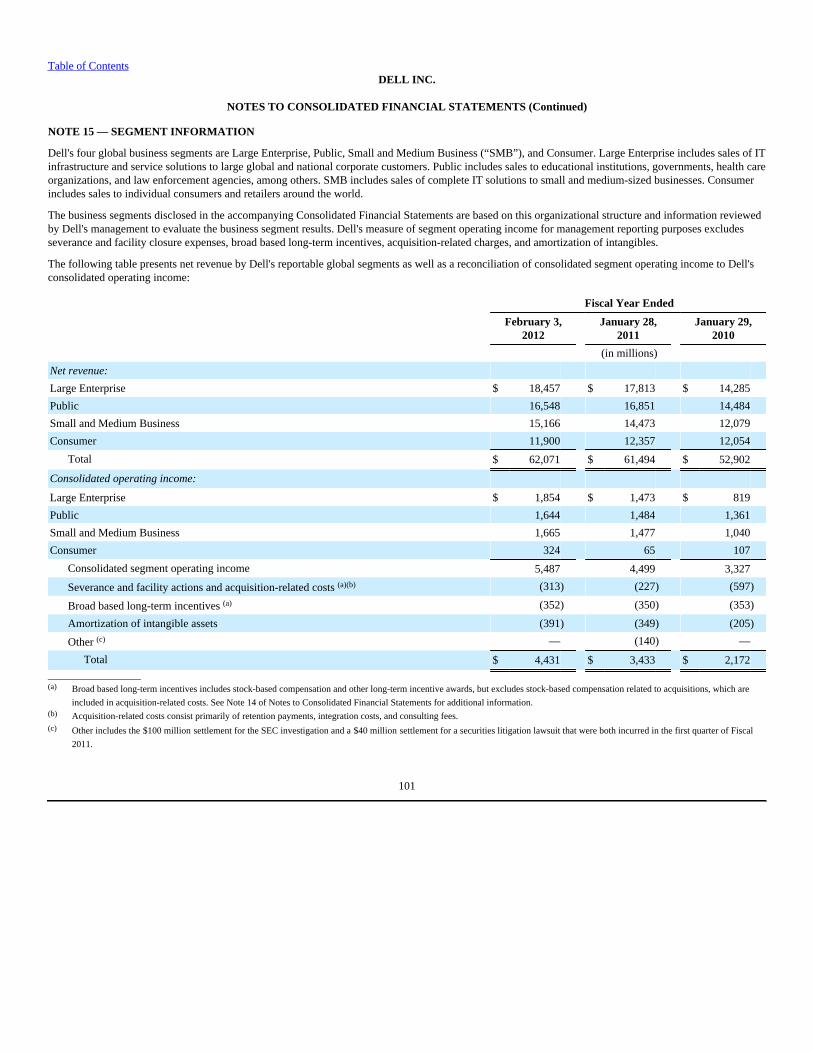
Table of ContentsDELL INC.
NOTES TO CONSOLIDATED FINANCIAL STATEMENTS (Continued)
NOTE 15 — SEGMENT INFORMATION
Dell's four global business segments are Large Enterprise, Public, Small and Medium Business (“SMB”), and Consumer. Large Enterprise includes sales of ITinfrastructure and service solutions to large global and national corporate customers. Public includes sales to educational institutions, governments, health careorganizations, and law enforcement agencies, among others. SMB includes sales of complete IT solutions to small and medium-sized businesses. Consumerincludes sales to individual consumers and retailers around the world.
The business segments disclosed in the accompanying Consolidated Financial Statements are based on this organizational structure and information reviewedby Dell's management to evaluate the business segment results. Dell's measure of segment operating income for management reporting purposes excludesseverance and facility closure expenses, broad based long-term incentives, acquisition-related charges, and amortization of intangibles.
The following table presents net revenue by Dell's reportable global segments as well as a reconciliation of consolidated segment operating income to Dell'sconsolidated operating income:
Fiscal Year Ended
February 3,2012
January 28,2011
January 29,2010
(in millions)
Net revenue:
Large Enterprise $ 18,457 $ 17,813 $ 14,285
Public 16,548 16,851 14,484
Small and Medium Business 15,166 14,473 12,079
Consumer 11,900 12,357 12,054
Total $ 62,071 $ 61,494 $ 52,902
Consolidated operating income:
Large Enterprise $ 1,854 $ 1,473 $ 819
Public 1,644 1,484 1,361
Small and Medium Business 1,665 1,477 1,040
Consumer 324 65 107
Consolidated segment operating income 5,487 4,499 3,327
Severance and facility actions and acquisition-related costs (a)(b) (313) (227) (597)
Broad based long-term incentives (a) (352) (350) (353)
Amortization of intangible assets (391) (349) (205)
Other (c) — (140) —
Total $ 4,431 $ 3,433 $ 2,172____________________ (a) Broad based long-term incentives includes stock-based compensation and other long-term incentive awards, but excludes stock-based compensation related to acquisitions, which are
included in acquisition-related costs. See Note 14 of Notes to Consolidated Financial Statements for additional information.(b) Acquisition-related costs consist primarily of retention payments, integration costs, and consulting fees.(c) Other includes the $100 million settlement for the SEC investigation and a $40 million settlement for a securities litigation lawsuit that were both incurred in the first quarter of Fiscal
2011.
101
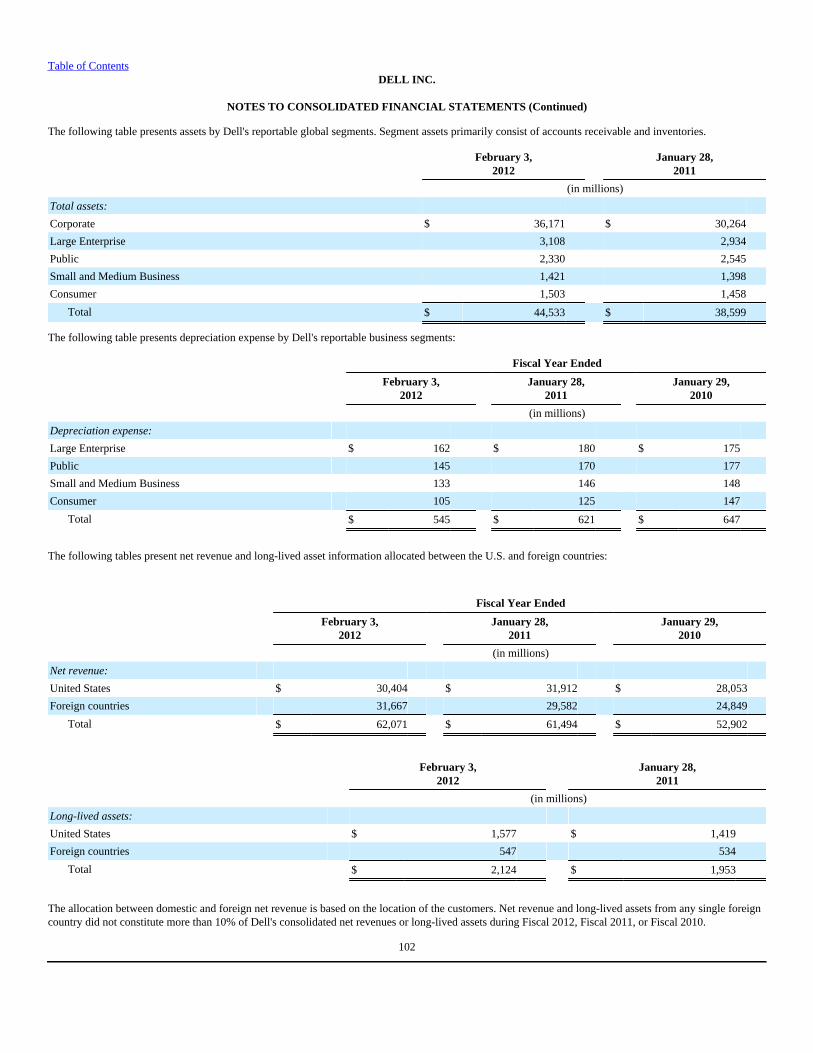
Table of Contents DELL INC.
NOTES TO CONSOLIDATED FINANCIAL STATEMENTS (Continued)
The following table presents assets by Dell's reportable global segments. Segment assets primarily consist of accounts receivable and inventories.
February 3,2012
January 28,2011
(in millions)
Total assets:
Corporate $ 36,171 $ 30,264
Large Enterprise 3,108 2,934
Public 2,330 2,545
Small and Medium Business 1,421 1,398
Consumer 1,503 1,458
Total $ 44,533 $ 38,599
The following table presents depreciation expense by Dell's reportable business segments:
Fiscal Year Ended
February 3,2012
January 28,2011
January 29,2010
(in millions)
Depreciation expense:
Large Enterprise $ 162 $ 180 $ 175
Public 145 170 177
Small and Medium Business 133 146 148
Consumer 105 125 147
Total $ 545 $ 621 $ 647
The following tables present net revenue and long-lived asset information allocated between the U.S. and foreign countries:
Fiscal Year Ended
February 3,2012
January 28,2011
January 29,2010
(in millions)
Net revenue:
United States $ 30,404 $ 31,912 $ 28,053
Foreign countries 31,667 29,582 24,849
Total $ 62,071 $ 61,494 $ 52,902
February 3,2012
January 28,2011
(in millions)
Long-lived assets:
United States $ 1,577 $ 1,419
Foreign countries 547 534
Total $ 2,124 $ 1,953
The allocation between domestic and foreign net revenue is based on the location of the customers. Net revenue and long-lived assets from any single foreigncountry did not constitute more than 10% of Dell's consolidated net revenues or long-lived assets during Fiscal 2012, Fiscal 2011, or Fiscal 2010.
102
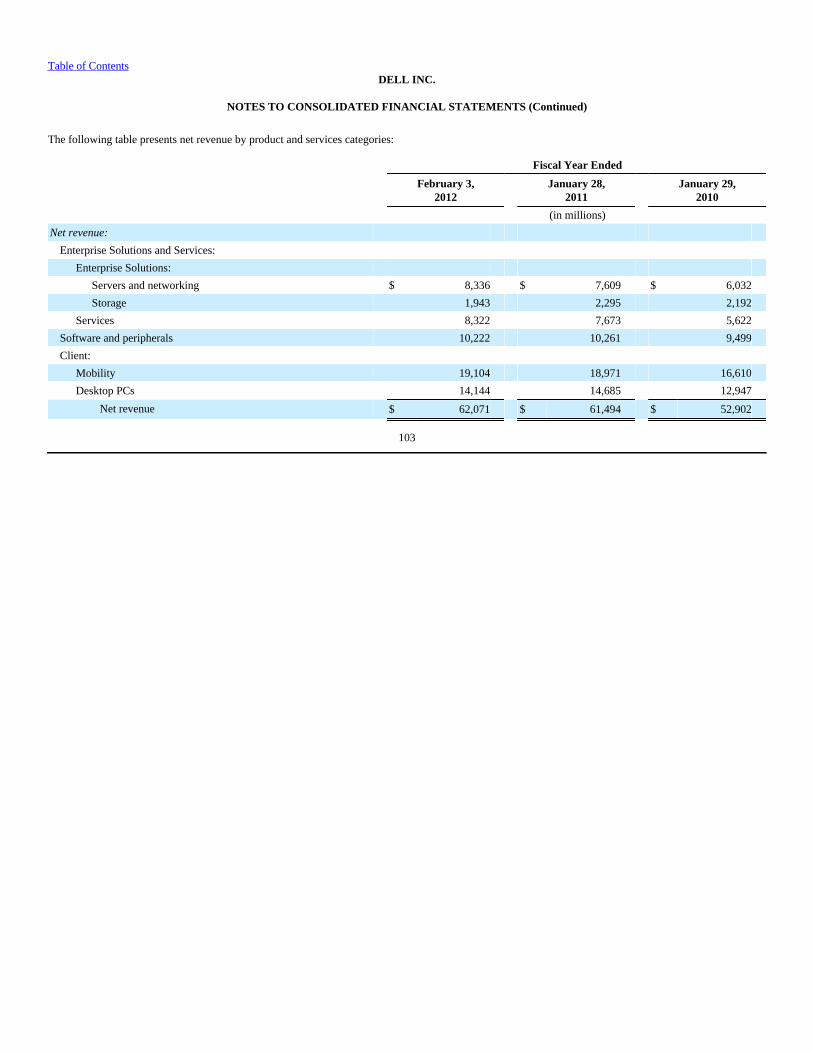
Table of Contents DELL INC.
NOTES TO CONSOLIDATED FINANCIAL STATEMENTS (Continued)
The following table presents net revenue by product and services categories:
Fiscal Year Ended
February 3,2012
January 28,2011
January 29,2010
(in millions)
Net revenue:
Enterprise Solutions and Services:
Enterprise Solutions:
Servers and networking $ 8,336 $ 7,609 $ 6,032
Storage 1,943 2,295 2,192
Services 8,322 7,673 5,622
Software and peripherals 10,222 10,261 9,499
Client:
Mobility 19,104 18,971 16,610
Desktop PCs 14,144 14,685 12,947
Net revenue $ 62,071 $ 61,494 $ 52,902
103
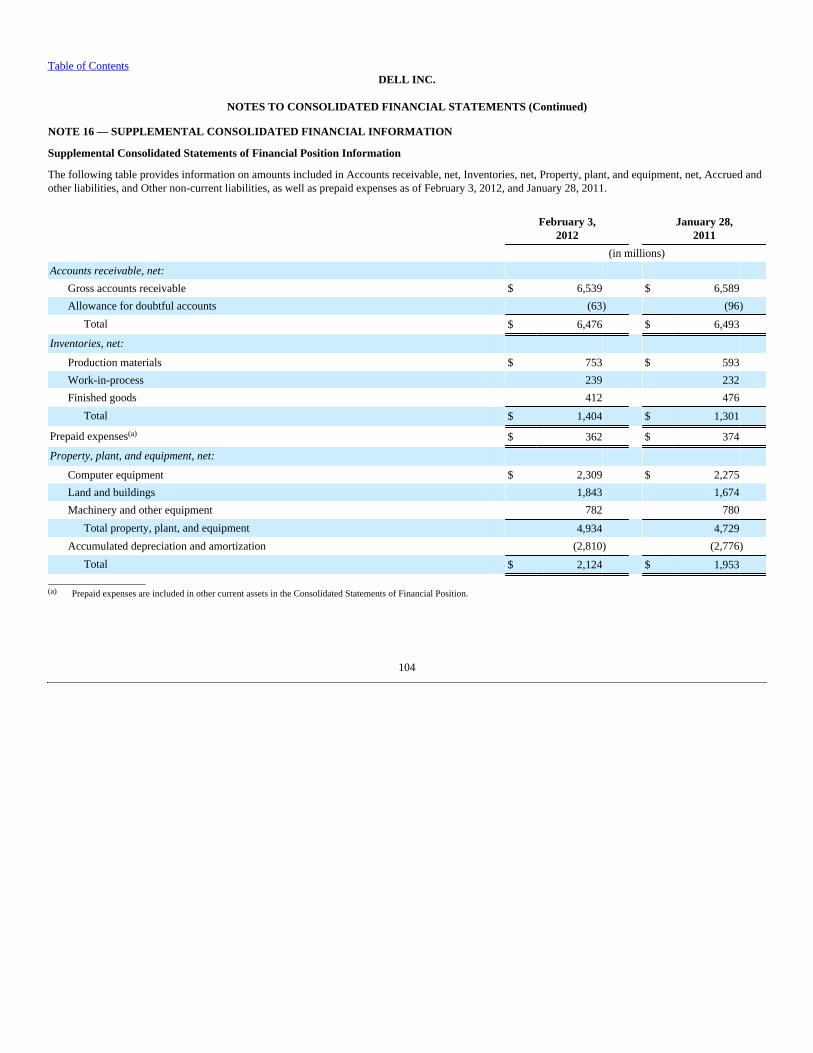
Table of ContentsDELL INC.
NOTES TO CONSOLIDATED FINANCIAL STATEMENTS (Continued)
NOTE 16 — SUPPLEMENTAL CONSOLIDATED FINANCIAL INFORMATION
Supplemental Consolidated Statements of Financial Position Information
The following table provides information on amounts included in Accounts receivable, net, Inventories, net, Property, plant, and equipment, net, Accrued andother liabilities, and Other non-current liabilities, as well as prepaid expenses as of February 3, 2012, and January 28, 2011.
February 3,2012
January 28,2011
(in millions)
Accounts receivable, net:
Gross accounts receivable $ 6,539 $ 6,589
Allowance for doubtful accounts (63) (96)
Total $ 6,476 $ 6,493
Inventories, net:
Production materials $ 753 $ 593
Work-in-process 239 232
Finished goods 412 476
Total $ 1,404 $ 1,301
Prepaid expenses(a) $ 362 $ 374
Property, plant, and equipment, net:
Computer equipment $ 2,309 $ 2,275
Land and buildings 1,843 1,674
Machinery and other equipment 782 780
Total property, plant, and equipment 4,934 4,729
Accumulated depreciation and amortization (2,810) (2,776)
Total $ 2,124 $ 1,953_____________________(a) Prepaid expenses are included in other current assets in the Consolidated Statements of Financial Position.
104

Table of ContentsDELL INC.
NOTES TO CONSOLIDATED FINANCIAL STATEMENTS (Continued)
Supplemental Consolidated Statements of Financial Position Information (cont.)
February 3,2012
January 28,2011
(in millions)
Accrued and other current liabilities:
Compensation $ 1,604 $ 1,550
Warranty liability 572 575
Income and other taxes 432 529
Other 1,326 1,527
Total $ 3,934 $ 4,181
Other non-current liabilities:
Warranty liability $ 316 $ 320
Unrecognized tax benefits, net 2,563 2,293
Deferred tax liabilities 405 —
Other 108 73
Total $ 3,392 $ 2,686
Supplemental Consolidated Statements of Income
The table below provides details of interest and other, net for Fiscal 2012, Fiscal 2011, and Fiscal 2010:
Fiscal Year Ended
February 3,2012
January 28,2011
January 29,2010
(in millions)
Interest and other, net:
Investment income, primarily interest $ 81 $ 47 $ 57
Gains (losses) on investments, net 8 6 2
Interest expense (279) (199) (160)
Foreign exchange 5 4 (59)
Other (6) 59 12
Interest and other, net $ (191) $ (83) $ (148)
105
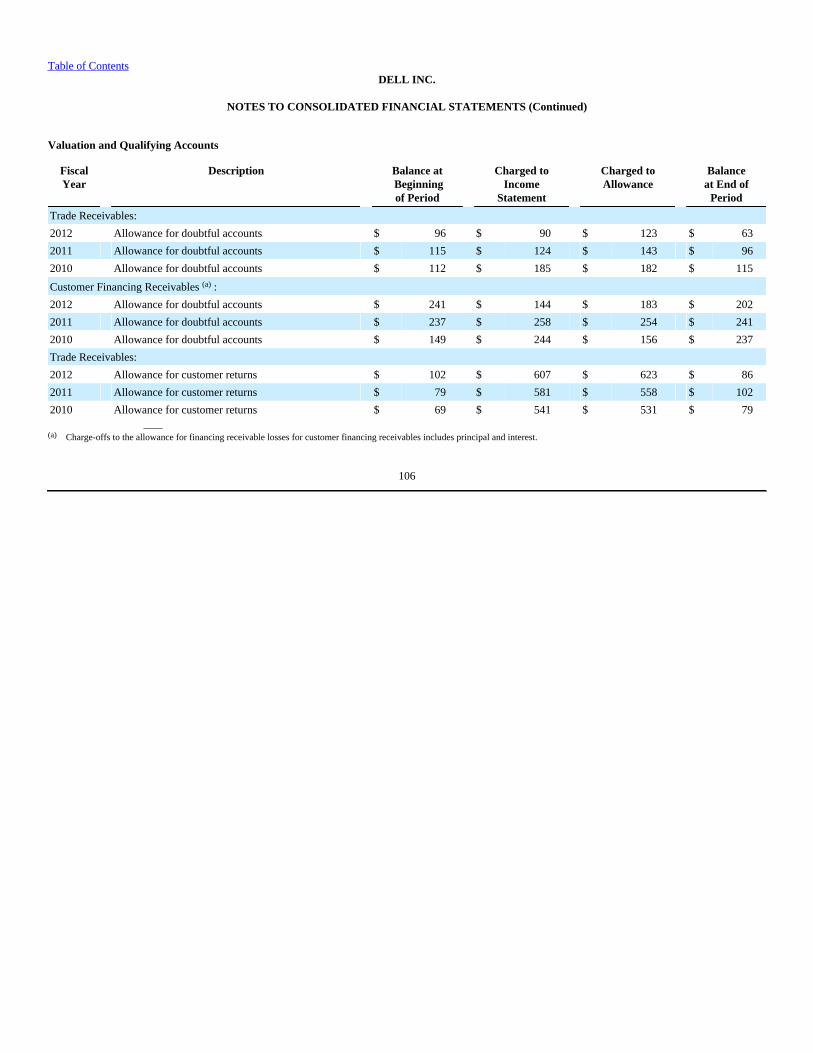
Table of Contents DELL INC.
NOTES TO CONSOLIDATED FINANCIAL STATEMENTS (Continued)
Valuation and Qualifying Accounts
FiscalYear
Description Balance at Beginningof Period
Charged toIncome
Statement
Charged toAllowance
Balanceat End of
Period
Trade Receivables:
2012 Allowance for doubtful accounts $ 96 $ 90 $ 123 $ 63
2011 Allowance for doubtful accounts $ 115 $ 124 $ 143 $ 96
2010 Allowance for doubtful accounts $ 112 $ 185 $ 182 $ 115
Customer Financing Receivables (a) :
2012 Allowance for doubtful accounts $ 241 $ 144 $ 183 $ 202
2011 Allowance for doubtful accounts $ 237 $ 258 $ 254 $ 241
2010 Allowance for doubtful accounts $ 149 $ 244 $ 156 $ 237
Trade Receivables:
2012 Allowance for customer returns $ 102 $ 607 $ 623 $ 86
2011 Allowance for customer returns $ 79 $ 581 $ 558 $ 102
2010 Allowance for customer returns $ 69 $ 541 $ 531 $ 79
(a) Charge-offs to the allowance for financing receivable losses for customer financing receivables includes principal and interest.
106

Table of Contents DELL INC.
NOTES TO CONSOLIDATED FINANCIAL STATEMENTS (Continued)
NOTE 17 — UNAUDITED QUARTERLY RESULTS
The following tables present selected unaudited Consolidated Statements of Income for each quarter of Fiscal 2012 and Fiscal 2011:
Fiscal Year 2012
First Second Third Fourth Quarter Quarter Quarter Quarter
(in millions, except per share data)
Net revenue $ 15,017 $ 15,658 $ 15,365 $ 16,031
Gross margin $ 3,432 $ 3,525 $ 3,469 $ 3,385
Net income $ 945 $ 890 $ 893 $ 764
Earnings per share:
Basic $ 0.50 $ 0.48 $ 0.49 $ 0.43
Diluted $ 0.49 $ 0.48 $ 0.49 $ 0.43
Weighted-average shares outstanding:
Basic 1,908 1,858 1,813 1,778
Diluted 1,923 1,871 1,828 1,796
Fiscal Year 2011
First Second Third Fourth Quarter Quarter Quarter Quarter
(in millions, except per share data)
Net revenue $ 14,874 $ 15,534 $ 15,394 $ 15,692
Gross margin $ 2,516 $ 2,586 $ 3,003 $ 3,291
Net income $ 341 $ 545 $ 822 $ 927
Earnings per share:
Basic $ 0.17 $ 0.28 $ 0.42 $ 0.48
Diluted $ 0.17 $ 0.28 $ 0.42 $ 0.48
Weighted-average shares outstanding:
Basic 1,961 1,952 1,939 1,924
Diluted 1,973 1,960 1,949 1,938
107
Table of Contents
ITEM 9 — CHANGES IN AND DISAGREEMENTS WITH ACCOUNTANTS ON ACCOUNTING AND FINANCIAL DISCLOSURE
None.
ITEM 9A — CONTROLS AND PROCEDURES
Exhibits 31.1 and 31.2 to this report include the certifications of our Chief Executive Officer and Chief Financial Officer required by Rule 13a-14 under theSecurities Exchange Act of 1934 (the “Exchange Act”). This Item 9A includes information concerning the controls and control evaluations referred to in thosecertifications. Management's Report on Internal Control over Financial Reporting
Management, under the supervision of the Chief Executive Officer and the Chief Financial Officer, is responsible for establishing and maintaining adequateinternal control over financial reporting. Internal control over financial reporting (as defined in Rules 13a-15(f) and 15d(f) under the Exchange Act) is aprocess designed to provide reasonable assurance regarding the reliability of financial reporting and the preparation of financial statements for externalpurposes in accordance with GAAP. Internal control over financial reporting includes those policies and procedures which (a) pertain to the maintenance ofrecords that, in reasonable detail, accurately and fairly reflect the transactions and dispositions of assets, (b) provide reasonable assurance that transactions arerecorded as necessary to permit preparation of financial statements in accordance with GAAP, (c) provide reasonable assurance that receipts and expendituresare being made only in accordance with appropriate authorization of management and the board of directors, and (d) provide reasonable assurance regardingprevention or timely detection of unauthorized acquisition, use, or disposition of assets that could have a material effect on the financial statements.
In connection with the preparation of this report, our management, under the supervision and with the participation of our Chief Executive Officer and ChiefFinancial Officer, conducted an evaluation of the effectiveness of our internal control over financial reporting as of February 3, 2012, based on the criteriaestablished in Internal Control — Integrated Framework issued by the Committee of Sponsoring Organizations of the Treadway Commission. As a result ofthat evaluation, management has concluded that our internal control over financial reporting was effective as of February 3, 2012. The effectiveness of ourinternal control over financial reporting as of February 3, 2012, has been audited by PricewaterhouseCoopers LLP, our independent registered publicaccounting firm, as stated in their report, which is included in “Part II — Item 8 — Financial Statements and Supplementary Data.”
Changes in Internal Control over Financial Reporting
Dell's management, with the participation of Dell's Chief Executive Officer and Chief Financial Officer, has evaluated whether any change in Dell's internalcontrol over financial reporting occurred during the fourth quarter of Fiscal 2012. Based on their evaluation, management concluded that there has been nochange in Dell's internal control over financial reporting during the fourth quarter of Fiscal 2012 that has materially affected, or is reasonably likely tomaterially affect, Dell's internal control over financial reporting. Evaluation of Disclosure Controls and Procedures
Disclosure controls and procedures (as defined in Rules 13a-15(e) and 15d-15(e) under the Exchange Act) are designed to ensure that information required tobe disclosed in reports filed or submitted under the Exchange Act is recorded, processed, summarized, and reported within the time periods specified in SECrules and forms and that such information is accumulated and communicated to management, including the Chief Executive Officer and the Chief FinancialOfficer, to allow timely decisions regarding required disclosures.
In connection with the preparation of this report, our management, under the supervision and with the participation of our Chief Executive Officer and ChiefFinancial Officer, conducted an evaluation of the effectiveness of the design and operation of our disclosure controls and procedures as of February 3, 2012.Based on that evaluation, our management has concluded that our disclosure controls and procedures were effective as of February 3, 2012.
Inherent Limitations in Internal Controls
Our system of controls is designed to provide reasonable, not absolute, assurance regarding the reliability and integrity of accounting and financial reporting.Management does not expect that our disclosure controls and procedures or our internal control over financial reporting will prevent or detect all errors and allfraud. A control system, no matter how well designed and operated, can provide only reasonable, not absolute, assurance that the objectives of the controlsystem will be met. These inherent limitations include the following:
• Judgments in decision-making can be faulty, and control and process breakdowns can occur because of simple errors or
108
mistakes.
• Controls can be circumvented by individuals, acting alone or in collusion with each other, or by management override.
• The design of any system of controls is based in part on certain assumptions about the likelihood of future events, and there can be no assurance that anydesign will succeed in achieving its stated goals under all potential future conditions.
• Over time, controls may become inadequate because of changes in conditions or deterioration in the degree of compliance with associated policies orprocedures.
• The design of a control system must reflect the fact that resources are constrained, and the benefits of controls must be considered relative to their costs.
ITEM 9B — OTHER INFORMATION
None.
109

Table of Contents
PART III
ITEM 10 — DIRECTORS, EXECUTIVE OFFICERS AND CORPORATE GOVERNANCE
We have adopted a code of ethics applicable to our principal executive officer and other senior financial officers, who include our principal financial officer,principal accounting officer or controller, and persons performing similar functions. The code of ethics, which we refer to as our Code of Conduct, is availableon our Internet website at www.dell.com. To the extent required by SEC rules, we intend to disclose any amendments to this code and any waiver of aprovision of the code for the benefit of our principal executive officer, principal financial officer, principal accounting officer or controller, or personsperforming similar functions, on our website within any period that may be required under SEC rules from time to time.
See “Part I — Item 1 — Business — Executive Officers of Dell” for information about our executive officers, which is incorporated by reference in thisItem 10. Other information required by this Item 10 is incorporated herein by reference to our definitive proxy statement for our 2012 annual meeting ofstockholders, referred to as the “2012 proxy statement,” which we will file with the SEC on or before 120 days after our 2012 fiscal year-end, and which willappear in the 2012 proxy statement under the captions “Proposal 1 — Election of Directors” and “Additional Information — Section 16(a) BeneficialOwnership Reporting Compliance.”
ITEM 11 — EXECUTIVE COMPENSATION
Information required by this Item 11 is incorporated herein by reference to the 2012 proxy statement, including the information in the 2012 proxy statementappearing under the captions “Proposal 1 — Election of Directors — Director Compensation” and “Executive Compensation.”
ITEM 12 — SECURITY OWNERSHIP OF CERTAIN BENEFICIAL OWNERS AND MANAGEMENT AND RELATED STOCKHOLDER MATTERS
Information required by this Item 12 is incorporated herein by reference to the 2012 proxy statement, including the information in the 2012 proxy statementappearing under the captions “Stock Ownership” and “Executive Compensation — Equity Compensation Plans.”
ITEM 13 — CERTAIN RELATIONSHIPS AND RELATED TRANSACTIONS, AND DIRECTOR INDEPENDENCE
Information required by this Item 13 is incorporated herein by reference to the 2012 proxy statement, including the information in the 2012 proxy statementappearing under the captions “Proposal 1 — Elections of Directors” and “Additional Information — Certain Relationships and Related Transactions.”
ITEM 14 — PRINCIPAL ACCOUNTING FEES AND SERVICES
Information required by this Item 14 is incorporated herein by reference to the 2012 proxy statement, including the information in the 2012 proxy statementappearing under the caption “Proposal 2 — Ratification of Independent Auditor.”
110
Table of Contents
PART IV
ITEM 15 — EXHIBITS, FINANCIAL STATEMENT SCHEDULES
Financial Statements
The following financial statements are filed as a part of this report under “Part II — Item 8 — Financial Statements and Supplementary Data”:
Page
Financial Statements:
Report of Independent Registered Public Accounting Firm 58
Consolidated Statements of Financial Position at February 3, 2012, and January 28, 2011 59
Consolidated Statements of Income for the fiscal years ended February 3, 2012, January 28, 2011, and January 29, 2010 60
Consolidated Statements of Cash Flows for the fiscal years ended February 3, 2012, January 28, 2011, and January 29, 2010 61
Consolidated Statements of Stockholders’ Equity for the fiscal years ended February 3, 2012, January 28, 2011, and January 29,2010
62
Notes to Consolidated Financial Statements 63
A list of the exhibits filed or furnished with this report (or incorporated by reference to exhibits previously filed or furnished) is provided in the Exhibit indexon page 115 of this report.
111

Table of Contents
Financial Statement Schedule
Schedule II — Valuation and Qualifying Accounts for the three fiscal years ended February 3, 2012, January 28, 2011 , and January 29, 2010 is included inNote 16 of Notes to Consolidated Financial Statements included in "Part II — Item 8 — Financial Statements and Supplementary Data." All other schedulescalled for by Form 10-K are omitted because they are inapplicable or the required information is shown in the consolidated financial statements, or notesthereto, included herein.
112
Table of Contents
SIGNATURES
Pursuant to the requirements of Section 13 or 15(d) of the Securities Exchange Act of 1934, the registrant has duly caused this report to be signed on its behalfby the undersigned, thereunto duly authorized.
DELL INC.
By: /s/ MICHAEL S. DELL
Michael S. Dell
Chairman and Chief Executive Officer
(Duly authorized officer)
Date: March 13, 2012
113
Table of Contents
Pursuant to the requirements of the Securities Exchange Act of 1934, this report has been signed below by the following persons on behalf of the registrantand in the capacities and as of the date indicated.
Name Title Date
/s/ MICHAEL S. DELL Chairman and Chief Executive Officer(principal executive officer)
March 13, 2012
Michael S. Dell
/s/ JAMES W. BREYER Director March 13, 2012
James W. Breyer
/s/ DONALD J. CARTY Director March 13, 2012
Donald J. Carty
/s/ JANET F. CLARK Director March 13, 2012
Janet F. Clark
/s/ LAURA CONIGLIARO Director March 13, 2012
Laura Conigliaro
/s/ KENNETH M. DUBERSTEIN Director March 13, 2012
Kenneth M. Duberstein
/s/ WILLIAM H. GRAY, III Director March 13, 2012
William H. Gray, III
/s/ GERARD J. KLEISTERLEE Director March 13, 2012
Gerard J. Kleisterlee
/s/ THOMAS W. LUCE, III Director March 13, 2012
Thomas W. Luce, III
/s/ KLAUS S. LUFT Director March 13, 2012
Klaus S. Luft
/s/ ALEX J. MANDL Director March 13, 2012
Alex J. Mandl
/s/ SHANTANU NARAYEN Director March 13, 2012
Shantanu Narayen
/s/ H. ROSS PEROT, JR. Director March 13, 2012
H. Ross Perot, Jr.
/s/ BRIAN T. GLADDEN Senior Vice President and Chief Financial Officer March 13, 2012

(principal financial officer)
Brian T. Gladden
/s/ THOMAS W. SWEET Vice President, Corporate Finance and Chief Accounting Officer(principal accounting officer)
March 13, 2012
Thomas W. Sweet
114
Table of Contents
Exhibits
Exhibit No. Description of Exhibit
3.1 — Restated Certificate of Incorporation (incorporated by reference to Exhibit 3.1 of the Quarterly Report on Form 10-Q of Dell Inc.(“Dell”) for the fiscal quarter ended April 29, 2011, Commission File No. 0-17017)
3.2 — Restated Bylaws, as amended and effective as of August 16, 2010 (incorporated by reference to Exhibit 3.2 of Dell's Quarterly Reporton Form 10-Q for the fiscal quarter ended July 30, 2010, Commission File No. 0-17017)
4.1 — Indenture, dated as of April 27, 1998, between Dell Computer Corporation and Chase Bank of Texas, National Association(incorporated by reference to Exhibit 99.2 of Dell's Current Report on Form 8-K filed April 28, 1998, Commission File No. 0-17017)
4.2 — Officers' Certificate pursuant to Section 301 of the Indenture establishing the terms of Dell's 7.10% Senior Debentures Due 2028(incorporated by reference to Exhibit 99.4 of Dell's Current Report on Form 8-K filed April 28, 1998, Commission File No. 0-17017)
4.3 — Form of Dell's 7.10% Senior Debentures Due 2028 (incorporated by reference to Exhibit 99.6 of Dell's Current Report on Form 8-Kfiled April 28, 1998, Commission File No. 0-17017)
4.4 — Indenture, dated as of April 17, 2008, between Dell and The Bank of New York Mellon Trust Company, N.A. (formerly The Bank ofNew York Trust Company, N.A.), as trustee (including the form of notes) (incorporated by reference to Exhibit 4.1 of Dell's CurrentReport on Form 8-K filed April 17, 2008, Commission File No. 0-17017)
4.5 — Indenture, dated as of April 6, 2009, between Dell and The Bank of New York Mellon Trust Company, N.A., as trustee (incorporatedby reference to Exhibit 4.1 of Dell's Current Report on Form 8-K filed April 6, 2009, Commission File No. 0-17017)
4.6 — First Supplemental Indenture, dated April 6, 2009, between Dell and The Bank of New York Mellon Trust Company, N.A., as trustee(incorporated by reference to Exhibit 4.2 of Dell's Current Report on Form 8-K filed April 6, 2009, Commission File No. 0-17017)
4.7 — Form of 5.625% Notes due 2014 (incorporated by reference to Exhibit 4.3 of Dell's Current Report on Form 8-K filed April 6, 2009,Commission File No. 0-17017)
4.8 — Second Supplemental Indenture, dated June 15, 2009, between Dell and The Bank of New York Mellon Trust Company, N.A., astrustee (incorporated by reference to Exhibit 4.1 of Dell's Current Report on Form 8-K filed June 15, 2009, Commission File No.0-17017)
4.9 — Form of 3.375% Notes due 2012 (incorporated by reference to Exhibit 4.2 of Dell's Current Report on Form 8-K filed June 15, 2009,Commission File No. 0-17017)
4.10 — Form of 5.875% Notes due 2019 (incorporated by reference to Exhibit 4.3 of Dell's Current Report on Form 8-K filed June 15, 2009,Commission File No. 0-17017)
4.11 — Third Supplemental Indenture, dated September 10, 2010, between Dell and The Bank of New York Mellon Trust Company, N.A., astrustee (incorporated by reference to Exhibit 4.1 of Dell's Current Report on Form 8-K filed September 10, 2010, Commission File No.0-17017)
4.12 — Form of 1.40% Notes due 2013 (incorporated by reference to Exhibit 4.2 of Dell's Current Report on Form 8-K filed September 10,2010, Commission File No. 0-17017)
4.13 — Form of 2.30% Notes due 2015 (incorporated by reference to Exhibit 4.3 of Dell's Current Report on Form 8-K filed September 10,2010, Commission File No. 0-17017)
4.14 — Form of 5.40% Notes due 2040 (incorporated by reference to Exhibit 4.4 of Dell's Current Report on Form 8-K filed September 10,2010, Commission File No. 0-17017)
4.15 — Fourth Supplemental Indenture, dated March 31, 2011, between Dell and The Bank of New York Mellon Trust Company, N.A., astrustee (incorporated by reference to Exhibit 4.1 of Dell's Current Report on Form 8-K filed March 31, 2011, Commission File No.0-17017)

4.16 — Form of Floating Rate Notes due 2014 (incorporated by reference to Exhibit 4.2 of Dell's Current Report on Form 8-K filed March 31,2011, Commission File No. 0-17017)
4.17 — Form of 2.100% Notes due 2014 (incorporated by reference to Exhibit 4.3 of Dell's Current Report on Form 8-K filed March 31, 2011,Commission File No. 0-17017)
4.18 — Form of 3.100% Notes due 2016 (incorporated by reference to Exhibit 4.4 of Dell's Current Report on Form 8-K filed March 31, 2011,Commission File No. 0-17017)
4.19 — Form of 4.625% Notes due 2021 (incorporated by reference to Exhibit 4.5 of Dell's Current Report on Form 8-K filed March 31, 2011,Commission File No. 0-17017)
115

Table of Contents
Exhibit No. Description of Exhibit
10.1 * — Amended and Restated Dell Computer Corporation 1994 Incentive Plan (incorporated by reference to Exhibit 99 of Dell's RegistrationStatement on Form S-8 filed October 31, 2000, Registration No. 333-49014)
10.2 * — Amended and Restated Dell Computer Corporation 1998 Broad-Based Stock Option Plan (incorporated by reference to Exhibit 99 ofDell's Registration Statement on Form S-8 filed October 31, 2000, Registration No. 333-49016)
10.3 * — Dell Computer Corporation 2002 Long-Term Incentive Plan (incorporated by reference to Exhibit 10.1 of Dell's Quarterly Report onForm 10-Q for the fiscal quarter ended August 2, 2002, Commission File No. 0-17017)
10.4 * — Dell Inc. Amended and Restated 2002 Long-Term Incentive Plan (incorporated by reference to Appendix A of Dell's 2007 proxystatement filed October 31, 2007, Commission File No. 0-17017)
10.5 * — Amended and Restated Dell Inc. Deferred Compensation Plan effective as of January 1, 2005 (incorporated by reference to Exhibit10.7 of Dell's Annual Report on Form 10-K for the fiscal year ended January 30, 2009, Commission File No. 0-17017)
10.6 * — Amended and Restated Dell Inc. Deferred Compensation Plan for Non-Employee Directors effective as of January 1, 2005(incorporated by reference to Exhibit 10.8 of Dell's Annual Report on Form 10-K for the fiscal year ended January 30, 2009,Commission File No. 0-17017)
10.7 * — Executive Annual Incentive Bonus Plan (incorporated by reference to Appendix A of Dell's 2008 proxy statement filed June 2, 2008,Commission File No. 0-17017)
10.8 * — Form of Restricted Stock Agreement for Non-Employee Directors under the 2002 Long-Term Incentive Plan (incorporated byreference to Exhibit 99.1 of Dell's Current Report on Form 8-K filed July 27, 2006, Commission File No. 0-17017)
10.9 * — Form of Restricted Stock Unit Agreement for Non-Employee Directors under the 2002 Long-Term Incentive Plan (incorporated byreference to Exhibit 99.2 of Dell's Current Report on Form 8-K filed July 27, 2006, Commission File No. 0-17017)
10.10 * — Form of Stock Unit Agreement for grant to Donald J. Carty under the 2002 Long-Term Incentive Plan (incorporated by reference toExhibit 99.2 of Dell's Current Report on Form 8-K filed December 20, 2006, Commission File No. 0-17017)
10.11 * — Form of Restricted Stock Unit Agreement for Non-Employee Directors under the Amended and Restated 2002 Long-Term IncentivePlan (incorporated by reference to Exhibit 10.10 of Dell's Quarterly Report on Form 10-Q for the fiscal quarter ended May 4, 2007,Commission File No. 0-17017)
10.12 * — Form of Restricted Stock Unit Agreement for Non-Employee Directors under the Amended and Restated 2002 Long-Term IncentivePlan (incorporated by reference to Exhibit 10.12 of Dell's Annual Report on Form 10-K for the fiscal year ended January 28, 2011,Commission File No. 0-17017)
10.13 * — Form of Restricted Stock Unit Agreement for Executive Officers under the Amended and Restated 2002 Long-Term Incentive Plan(incorporated by reference to Exhibit 10.23 of Dell's Annual Report on Form 10-K for the fiscal year ended January 30, 2009,Commission File No. 0-17017)
10.14 * — Form of Restricted Stock Unit Agreement for Executive Officers under the Amended and Restated 2002 Long-Term Incentive Plan(incorporated by reference to Exhibit 10.4 of Dell's Quarterly Report on Form 10-Q for the fiscal quarter ended April 30, 2010,Commission File No. 0-17017)
10.15 * — Form of Restricted Stock Unit Agreement for New Hire Senior Executive Officers under the Amended and Restated 2002 Long-TermIncentive Plan (incorporated by reference to Exhibit 10.5 of Dell's Quarterly Report on Form 10-Q for the fiscal quarter ended April30, 2010, Commission File No. 0-17017)
10.16 * — Form of Performance Based Stock Unit Agreement for employees under the 2002 Long-Term Incentive Plan (incorporated byreference to Exhibit 99.2 of Dell's Current Report on Form 8-K filed March 14, 2006, Commission File No. 0-17017)
10.17 * — Form of Performance Based Stock Unit Agreement for Executive Officers under the Amended and Restated 2002 Long-TermIncentive Plan (incorporated by reference to Exhibit 10.17 of Dell's Annual Report on Form 10-K for the fiscal year ended February 1,2008, Commission File No. 0-17017)
10.18 * — Form of Performance Based Stock Unit Agreement for Executive Officers under the Amended and Restated 2002 Long-TermIncentive Plan (incorporated by reference to Exhibit 10.21 of Dell's Annual Report on Form 10-K for the fiscal year ended January 30,2009, Commission File No. 0-17017)
116
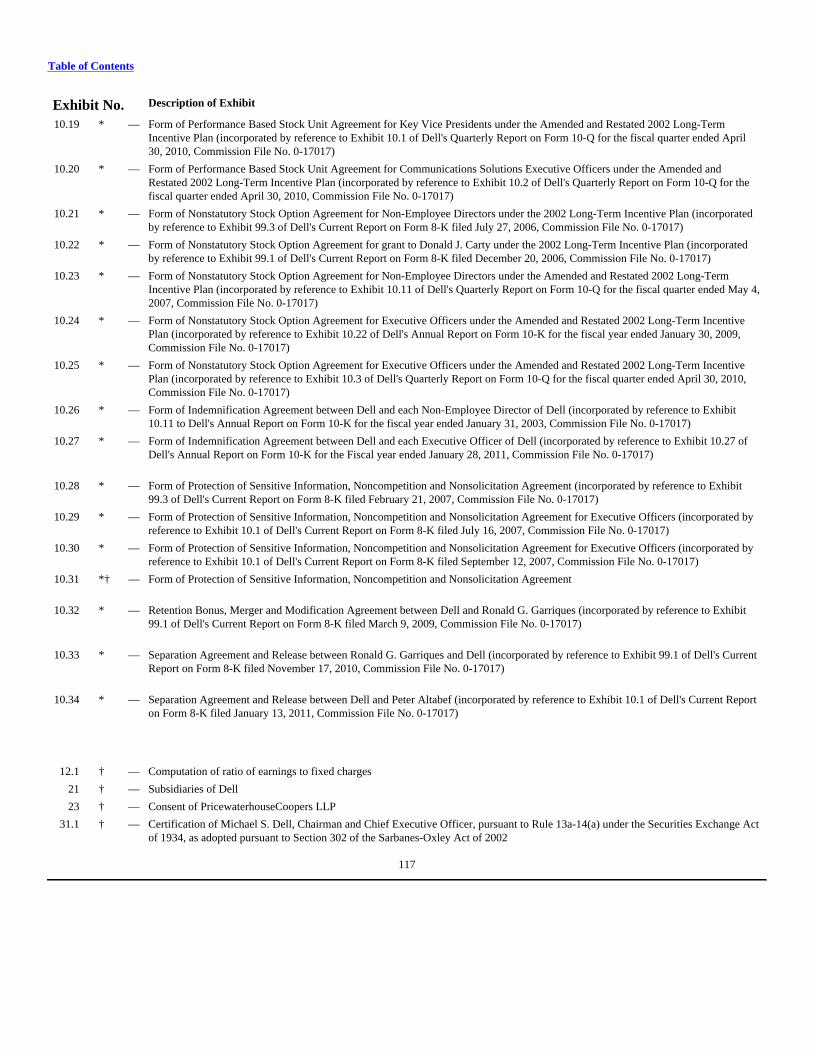
Table of Contents
Exhibit No. Description of Exhibit
10.19 * — Form of Performance Based Stock Unit Agreement for Key Vice Presidents under the Amended and Restated 2002 Long-TermIncentive Plan (incorporated by reference to Exhibit 10.1 of Dell's Quarterly Report on Form 10-Q for the fiscal quarter ended April30, 2010, Commission File No. 0-17017)
10.20 * — Form of Performance Based Stock Unit Agreement for Communications Solutions Executive Officers under the Amended andRestated 2002 Long-Term Incentive Plan (incorporated by reference to Exhibit 10.2 of Dell's Quarterly Report on Form 10-Q for thefiscal quarter ended April 30, 2010, Commission File No. 0-17017)
10.21 * — Form of Nonstatutory Stock Option Agreement for Non-Employee Directors under the 2002 Long-Term Incentive Plan (incorporatedby reference to Exhibit 99.3 of Dell's Current Report on Form 8-K filed July 27, 2006, Commission File No. 0-17017)
10.22 * — Form of Nonstatutory Stock Option Agreement for grant to Donald J. Carty under the 2002 Long-Term Incentive Plan (incorporatedby reference to Exhibit 99.1 of Dell's Current Report on Form 8-K filed December 20, 2006, Commission File No. 0-17017)
10.23 * — Form of Nonstatutory Stock Option Agreement for Non-Employee Directors under the Amended and Restated 2002 Long-TermIncentive Plan (incorporated by reference to Exhibit 10.11 of Dell's Quarterly Report on Form 10-Q for the fiscal quarter ended May 4,2007, Commission File No. 0-17017)
10.24 * — Form of Nonstatutory Stock Option Agreement for Executive Officers under the Amended and Restated 2002 Long-Term IncentivePlan (incorporated by reference to Exhibit 10.22 of Dell's Annual Report on Form 10-K for the fiscal year ended January 30, 2009,Commission File No. 0-17017)
10.25 * — Form of Nonstatutory Stock Option Agreement for Executive Officers under the Amended and Restated 2002 Long-Term IncentivePlan (incorporated by reference to Exhibit 10.3 of Dell's Quarterly Report on Form 10-Q for the fiscal quarter ended April 30, 2010,Commission File No. 0-17017)
10.26 * — Form of Indemnification Agreement between Dell and each Non-Employee Director of Dell (incorporated by reference to Exhibit10.11 to Dell's Annual Report on Form 10-K for the fiscal year ended January 31, 2003, Commission File No. 0-17017)
10.27 * — Form of Indemnification Agreement between Dell and each Executive Officer of Dell (incorporated by reference to Exhibit 10.27 ofDell's Annual Report on Form 10-K for the Fiscal year ended January 28, 2011, Commission File No. 0-17017)
10.28 * — Form of Protection of Sensitive Information, Noncompetition and Nonsolicitation Agreement (incorporated by reference to Exhibit99.3 of Dell's Current Report on Form 8-K filed February 21, 2007, Commission File No. 0-17017)
10.29 * — Form of Protection of Sensitive Information, Noncompetition and Nonsolicitation Agreement for Executive Officers (incorporated byreference to Exhibit 10.1 of Dell's Current Report on Form 8-K filed July 16, 2007, Commission File No. 0-17017)
10.30 * — Form of Protection of Sensitive Information, Noncompetition and Nonsolicitation Agreement for Executive Officers (incorporated byreference to Exhibit 10.1 of Dell's Current Report on Form 8-K filed September 12, 2007, Commission File No. 0-17017)
10.31 *† — Form of Protection of Sensitive Information, Noncompetition and Nonsolicitation Agreement
10.32 * — Retention Bonus, Merger and Modification Agreement between Dell and Ronald G. Garriques (incorporated by reference to Exhibit99.1 of Dell's Current Report on Form 8-K filed March 9, 2009, Commission File No. 0-17017)
10.33 * — Separation Agreement and Release between Ronald G. Garriques and Dell (incorporated by reference to Exhibit 99.1 of Dell's CurrentReport on Form 8-K filed November 17, 2010, Commission File No. 0-17017)
10.34 * — Separation Agreement and Release between Dell and Peter Altabef (incorporated by reference to Exhibit 10.1 of Dell's Current Reporton Form 8-K filed January 13, 2011, Commission File No. 0-17017)
12.1 † — Computation of ratio of earnings to fixed charges
21 † — Subsidiaries of Dell
23 † — Consent of PricewaterhouseCoopers LLP
31.1 † — Certification of Michael S. Dell, Chairman and Chief Executive Officer, pursuant to Rule 13a-14(a) under the Securities Exchange Actof 1934, as adopted pursuant to Section 302 of the Sarbanes-Oxley Act of 2002
117
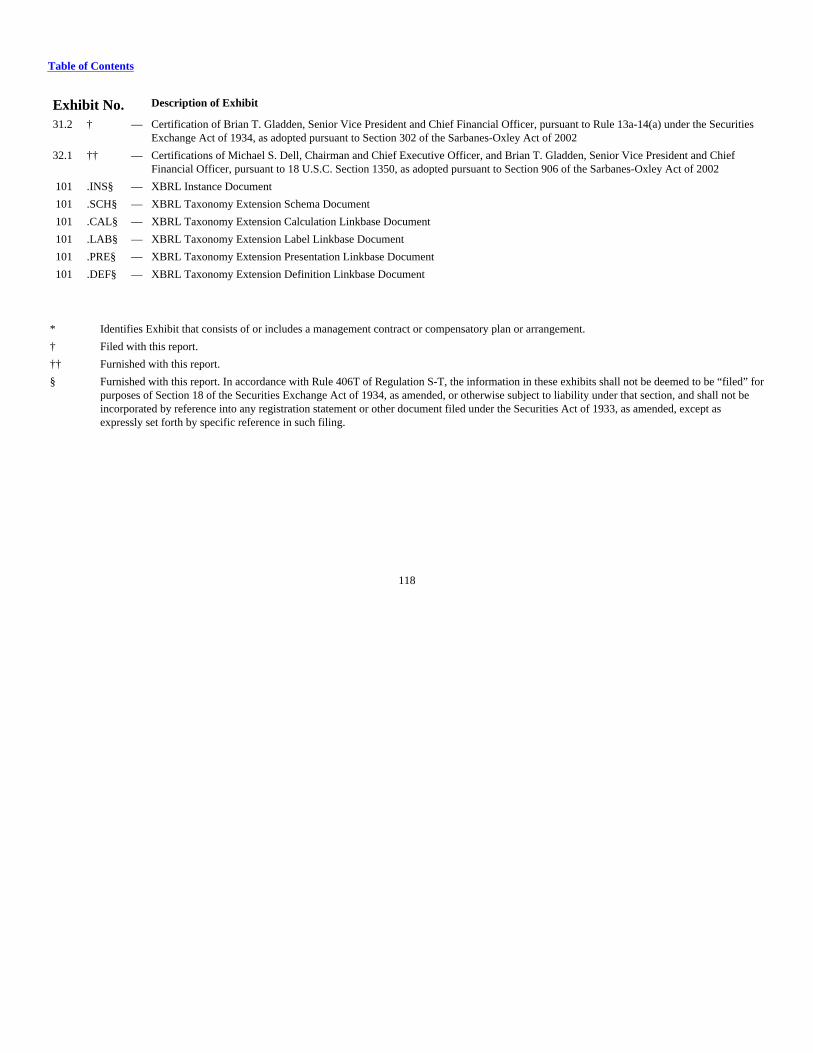
Table of Contents
Exhibit No. Description of Exhibit
31.2 † — Certification of Brian T. Gladden, Senior Vice President and Chief Financial Officer, pursuant to Rule 13a-14(a) under the SecuritiesExchange Act of 1934, as adopted pursuant to Section 302 of the Sarbanes-Oxley Act of 2002
32.1 †† — Certifications of Michael S. Dell, Chairman and Chief Executive Officer, and Brian T. Gladden, Senior Vice President and ChiefFinancial Officer, pursuant to 18 U.S.C. Section 1350, as adopted pursuant to Section 906 of the Sarbanes-Oxley Act of 2002
101 .INS§ — XBRL Instance Document
101 .SCH§ — XBRL Taxonomy Extension Schema Document
101 .CAL§ — XBRL Taxonomy Extension Calculation Linkbase Document
101 .LAB§ — XBRL Taxonomy Extension Label Linkbase Document
101 .PRE§ — XBRL Taxonomy Extension Presentation Linkbase Document
101 .DEF§ — XBRL Taxonomy Extension Definition Linkbase Document
* Identifies Exhibit that consists of or includes a management contract or compensatory plan or arrangement.
† Filed with this report.
†† Furnished with this report.
§ Furnished with this report. In accordance with Rule 406T of Regulation S-T, the information in these exhibits shall not be deemed to be “filed” forpurposes of Section 18 of the Securities Exchange Act of 1934, as amended, or otherwise subject to liability under that section, and shall not beincorporated by reference into any registration statement or other document filed under the Securities Act of 1933, as amended, except asexpressly set forth by specific reference in such filing.
118
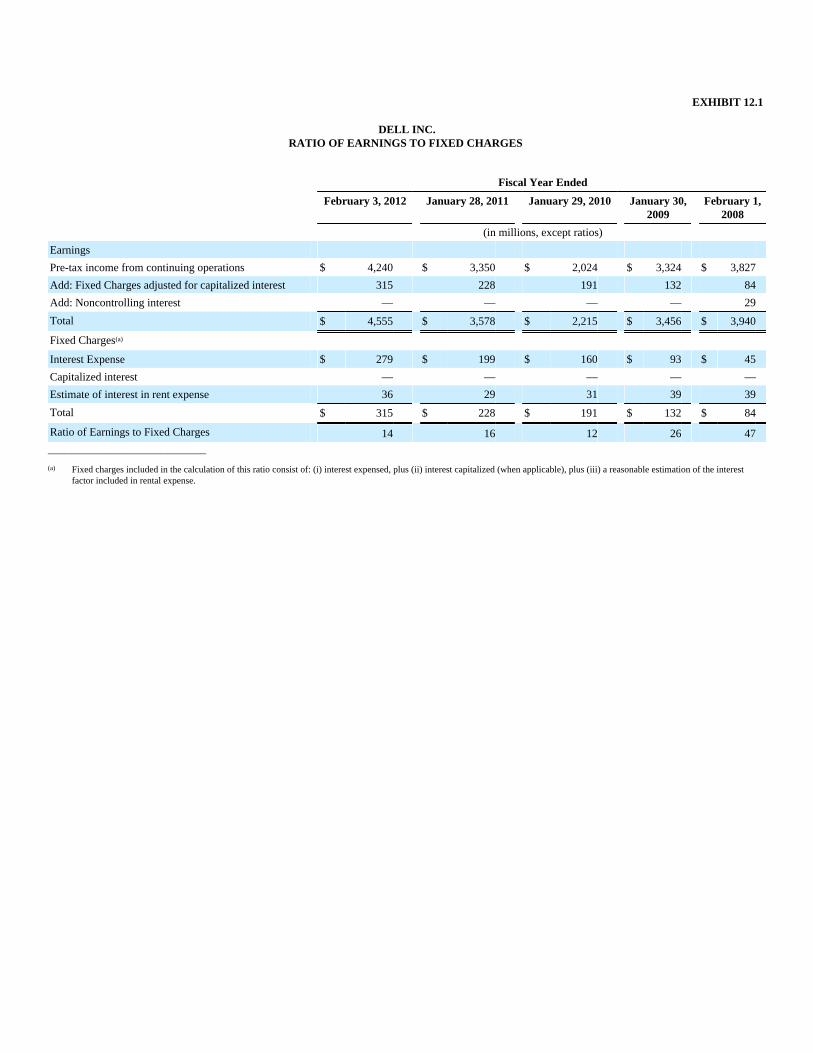
EXHIBIT 12.1
DELL INC.RATIO OF EARNINGS TO FIXED CHARGES
Fiscal Year Ended
February 3, 2012 January 28, 2011 January 29, 2010 January 30,2009
February 1,2008
(in millions, except ratios)
Earnings
Pre-tax income from continuing operations $ 4,240 $ 3,350 $ 2,024 $ 3,324 $ 3,827
Add: Fixed Charges adjusted for capitalized interest 315 228 191 132 84
Add: Noncontrolling interest — — — — 29
Total $ 4,555 $ 3,578 $ 2,215 $ 3,456 $ 3,940
Fixed Charges(a)
Interest Expense $ 279 $ 199 $ 160 $ 93 $ 45
Capitalized interest — — — — —
Estimate of interest in rent expense 36 29 31 39 39
Total $ 315 $ 228 $ 191 $ 132 $ 84
Ratio of Earnings to Fixed Charges 14 16 12 26 47____________________________
(a) Fixed charges included in the calculation of this ratio consist of: (i) interest expensed, plus (ii) interest capitalized (when applicable), plus (iii) a reasonable estimation of the interestfactor included in rental expense.

Exhibit 21
Dell Inc. Subsidiary List
Other U.S. Entities Jurisdiction
Alienware Corporation Florida
Alienware Labs Corporation Florida
ASAP Software Express Inc. Illinois
Boomi, Inc Delaware
Bracknell Boulevard (Block C) L.L.C. Delaware
Bracknell Boulevard (Block D) L.L.C. Delaware
Compellent Technologies Inc. Delaware
DCC Executive Security Inc. Delaware
Dell America Latina Corp. Delaware
Dell Asset Revolving Trust Delaware
Dell Asset Securitization GP L.L.C. Delaware
Dell Asset Securitization Holding L.P. Delaware
Dell Colombia Inc. Delaware
Dell Computer Holdings L.P. Texas
Dell Conduit Funding L.P. Delaware
Dell Conduit GP L.L.C. Delaware
Dell DFS Corporation Delaware
Dell DFS Holdings L.L.C. Delaware
Dell Equipment Funding L.P. Delaware
Dell Equipment GP L.L.C Delaware
Dell Federal Systems Corporation Delaware
Dell Federal Systems GP L.L.C. Delaware
Dell Federal Systems L.P. Texas
Dell Federal Systems LP L.L.C. Delaware
Dell Financial Services L.L.C. Delaware
Dell Funding L.L.C. Nevada
Dell Global Holdings IV L.L.C. Delaware
Dell Global Holdings IX L.L.C. Delaware
Dell Global Holdings L.L.C. Delaware
Dell Global Holdings VI L.L.C. Delaware
Dell Global Holdings VII L.L.C. Delaware
Dell Global Holdings VIII L.L.C Delaware
Dell International Holdings I L.L.C. Delaware
Dell International L.L.C. Delaware
Dell Marketing Corporation Delaware
Dell Marketing GP L.L.C. Delaware
Dell Marketing L.P. Texas
Dell Marketing LP L.L.C. Delaware
Dell Products Corporation Delaware
Dell Products GP L.L.C. Delaware
Dell Products L.P. Delaware
Dell Products LP L.L.C. Texas
Dell Protective Services Inc. Delaware
Dell Receivables Corporation Delaware

1
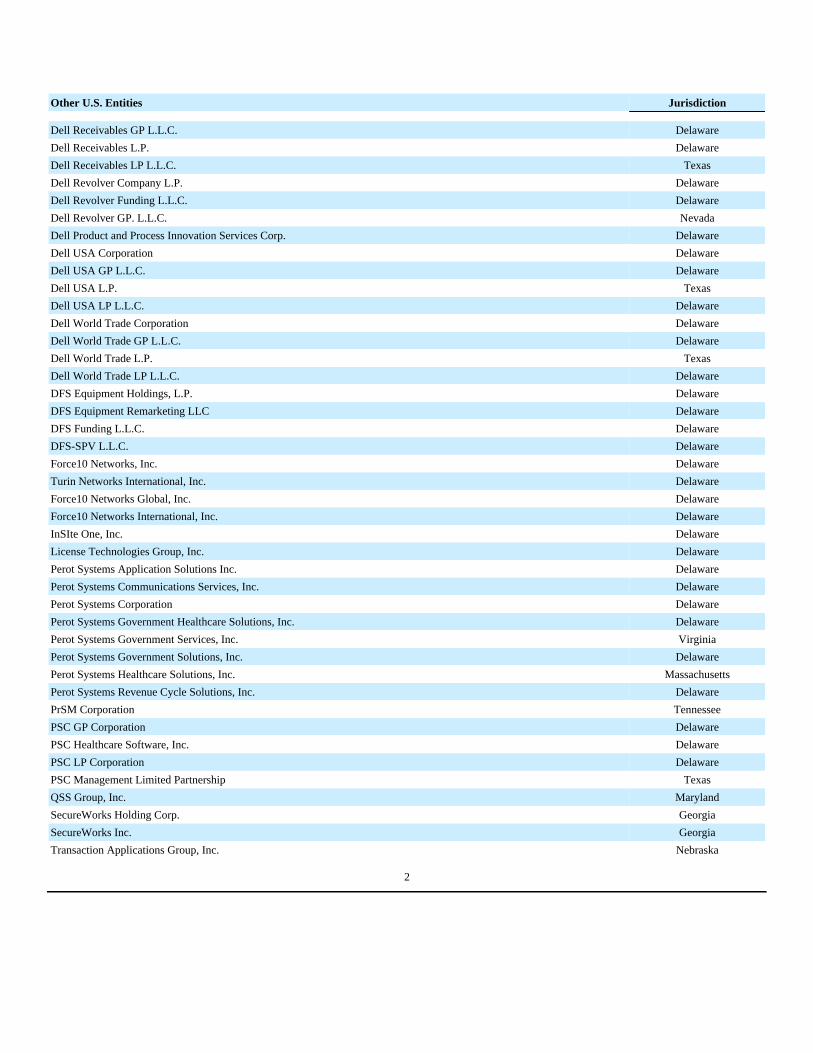
Other U.S. Entities Jurisdiction
Dell Receivables GP L.L.C. Delaware
Dell Receivables L.P. Delaware
Dell Receivables LP L.L.C. Texas
Dell Revolver Company L.P. Delaware
Dell Revolver Funding L.L.C. Delaware
Dell Revolver GP. L.L.C. Nevada
Dell Product and Process Innovation Services Corp. Delaware
Dell USA Corporation Delaware
Dell USA GP L.L.C. Delaware
Dell USA L.P. Texas
Dell USA LP L.L.C. Delaware
Dell World Trade Corporation Delaware
Dell World Trade GP L.L.C. Delaware
Dell World Trade L.P. Texas
Dell World Trade LP L.L.C. Delaware
DFS Equipment Holdings, L.P. Delaware
DFS Equipment Remarketing LLC Delaware
DFS Funding L.L.C. Delaware
DFS-SPV L.L.C. Delaware
Force10 Networks, Inc. Delaware
Turin Networks International, Inc. Delaware
Force10 Networks Global, Inc. Delaware
Force10 Networks International, Inc. Delaware
InSIte One, Inc. Delaware
License Technologies Group, Inc. Delaware
Perot Systems Application Solutions Inc. Delaware
Perot Systems Communications Services, Inc. Delaware
Perot Systems Corporation Delaware
Perot Systems Government Healthcare Solutions, Inc. Delaware
Perot Systems Government Services, Inc. Virginia
Perot Systems Government Solutions, Inc. Delaware
Perot Systems Healthcare Solutions, Inc. Massachusetts
Perot Systems Revenue Cycle Solutions, Inc. Delaware
PrSM Corporation Tennessee
PSC GP Corporation Delaware
PSC Healthcare Software, Inc. Delaware
PSC LP Corporation Delaware
PSC Management Limited Partnership Texas
QSS Group, Inc. Maryland
SecureWorks Holding Corp. Georgia
SecureWorks Inc. Georgia
Transaction Applications Group, Inc. Nebraska
2
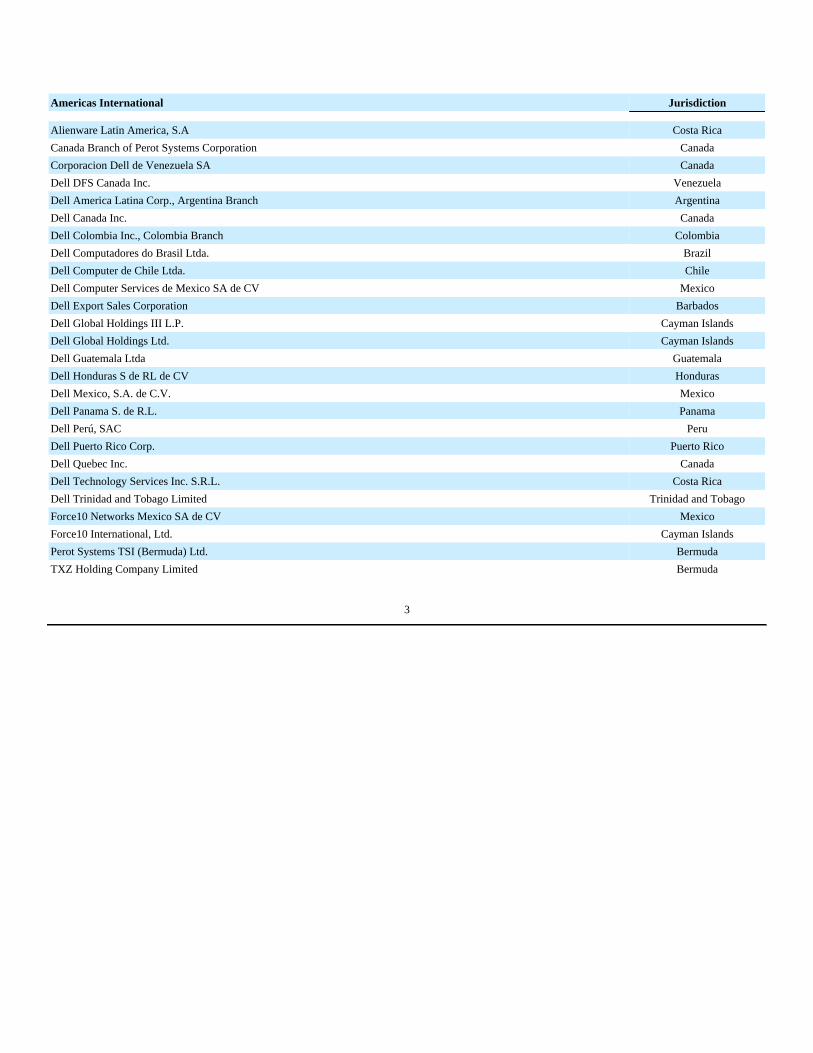
Americas International Jurisdiction
Alienware Latin America, S.A Costa Rica
Canada Branch of Perot Systems Corporation Canada
Corporacion Dell de Venezuela SA Canada
Dell DFS Canada Inc. Venezuela
Dell America Latina Corp., Argentina Branch Argentina
Dell Canada Inc. Canada
Dell Colombia Inc., Colombia Branch Colombia
Dell Computadores do Brasil Ltda. Brazil
Dell Computer de Chile Ltda. Chile
Dell Computer Services de Mexico SA de CV Mexico
Dell Export Sales Corporation Barbados
Dell Global Holdings III L.P. Cayman Islands
Dell Global Holdings Ltd. Cayman Islands
Dell Guatemala Ltda Guatemala
Dell Honduras S de RL de CV Honduras
Dell Mexico, S.A. de C.V. Mexico
Dell Panama S. de R.L. Panama
Dell Perú, SAC Peru
Dell Puerto Rico Corp. Puerto Rico
Dell Quebec Inc. Canada
Dell Technology Services Inc. S.R.L. Costa Rica
Dell Trinidad and Tobago Limited Trinidad and Tobago
Force10 Networks Mexico SA de CV Mexico
Force10 International, Ltd. Cayman Islands
Perot Systems TSI (Bermuda) Ltd. Bermuda
TXZ Holding Company Limited Bermuda
3
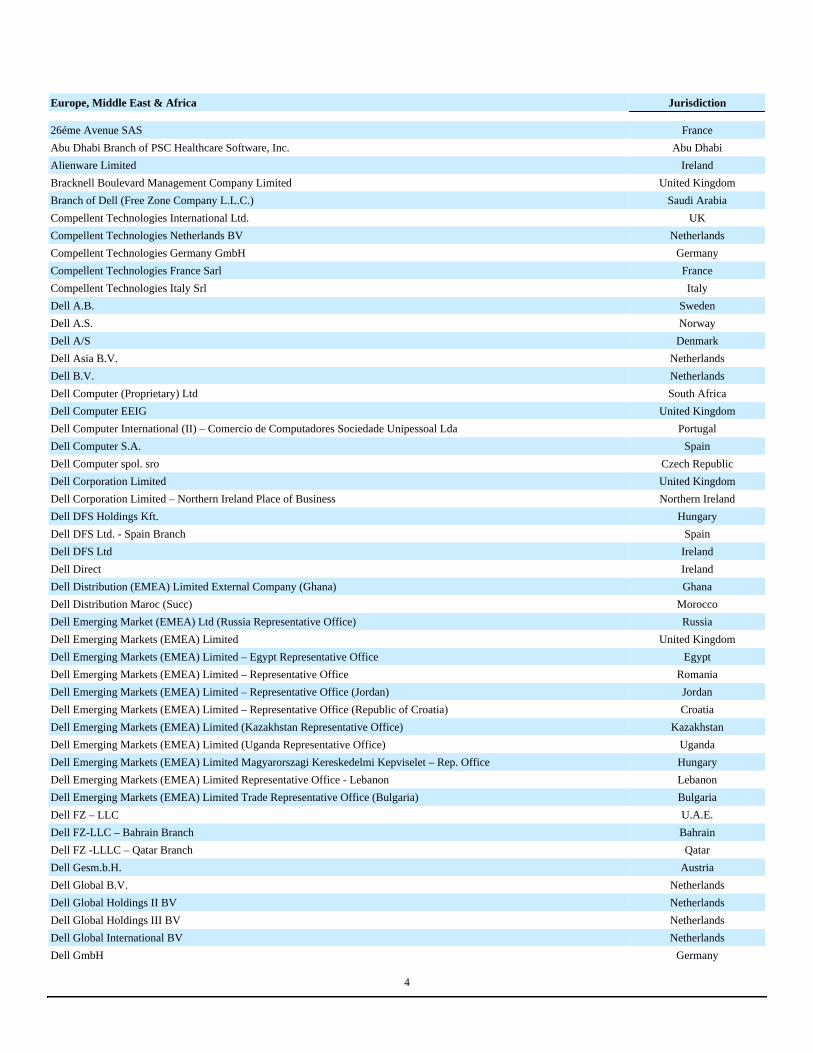
Europe, Middle East & Africa Jurisdiction
26éme Avenue SAS France
Abu Dhabi Branch of PSC Healthcare Software, Inc. Abu Dhabi
Alienware Limited Ireland
Bracknell Boulevard Management Company Limited United Kingdom
Branch of Dell (Free Zone Company L.L.C.) Saudi Arabia
Compellent Technologies International Ltd. UK
Compellent Technologies Netherlands BV Netherlands
Compellent Technologies Germany GmbH Germany
Compellent Technologies France Sarl France
Compellent Technologies Italy Srl Italy
Dell A.B. Sweden
Dell A.S. Norway
Dell A/S Denmark
Dell Asia B.V. Netherlands
Dell B.V. Netherlands
Dell Computer (Proprietary) Ltd South Africa
Dell Computer EEIG United Kingdom
Dell Computer International (II) – Comercio de Computadores Sociedade Unipessoal Lda Portugal
Dell Computer S.A. Spain
Dell Computer spol. sro Czech Republic
Dell Corporation Limited United Kingdom
Dell Corporation Limited – Northern Ireland Place of Business Northern Ireland
Dell DFS Holdings Kft. Hungary
Dell DFS Ltd. - Spain Branch Spain
Dell DFS Ltd Ireland
Dell Direct Ireland
Dell Distribution (EMEA) Limited External Company (Ghana) Ghana
Dell Distribution Maroc (Succ) Morocco
Dell Emerging Market (EMEA) Ltd (Russia Representative Office) Russia
Dell Emerging Markets (EMEA) Limited United Kingdom
Dell Emerging Markets (EMEA) Limited – Egypt Representative Office Egypt
Dell Emerging Markets (EMEA) Limited – Representative Office Romania
Dell Emerging Markets (EMEA) Limited – Representative Office (Jordan) Jordan
Dell Emerging Markets (EMEA) Limited – Representative Office (Republic of Croatia) Croatia
Dell Emerging Markets (EMEA) Limited (Kazakhstan Representative Office) Kazakhstan
Dell Emerging Markets (EMEA) Limited (Uganda Representative Office) Uganda
Dell Emerging Markets (EMEA) Limited Magyarorszagi Kereskedelmi Kepviselet – Rep. Office Hungary
Dell Emerging Markets (EMEA) Limited Representative Office - Lebanon Lebanon
Dell Emerging Markets (EMEA) Limited Trade Representative Office (Bulgaria) Bulgaria
Dell FZ – LLC U.A.E.
Dell FZ-LLC – Bahrain Branch Bahrain
Dell FZ -LLLC – Qatar Branch Qatar
Dell Gesm.b.H. Austria
Dell Global B.V. Netherlands
Dell Global Holdings II BV Netherlands
Dell Global Holdings III BV Netherlands
Dell Global International BV Netherlands
Dell GmbH Germany
4

Europe, Middle East & Africa Jurisdiction
Dell Halle GmbH Germany
Dell Hungary Technology Solutions Trade LLC Hungary
Dell III – Comercio de Computadores, Unipessoal LDA Portugal
Dell International Holdings IX B.V. Netherlands
Dell International Holdings Kft. Hungary
Dell International Holdings SAS France
Dell International Holdings VIII B.V. Netherlands
Dell International Holdings X B.V. Netherlands
Dell International Holdings XII Coöperatoef U.A. Netherlands
Dell International Services SRL Romania
Dell L.L.C. Russia
Dell N.V. Belgium
Dell Products Ireland
Dell Products (Europe) B.V. Netherlands
Dell Products (Poland) Sp. z o.o Poland
Dell Products Manufacturing Ltd. Ireland
Dell Research Ireland
Dell (Switzerland) GmbH Switzerland
Dell S.A. Switzerland
Dell S.A. France
Dell S.p.A. Italy
Dell s.r.o. Slovakia
Dell SA Luxembourg
Dell SAS Morocco
Dell Services S.r.l. Italy
Dell Solutions (UK) Ltd. United Kingdom
Dell Sp.z.o.o. Poland
Dell Taiwan B.V. Netherlands
Dell Technology & Solutions (Nigeria) Limited Nigeria
Dell Technology & Solutions Israel Ltd. Israel
Dell Technology & Solutions Ltd. (Formerly Original Solutions Limited) Ireland
Dell Technology Products and Services S.A Greece
Dell Teknoloji Limited Şirketi Turkey
DFS BV Netherlands
DIH IX CV Netherlands
DIH VI CV Netherlands
DIH VII CV Netherlands
DIH VIII CV Netherlands
Force10 Networks France SARL France
Force10 Networks Germany (Branch) Germany
Force10 Networks Spain (Rep office) Spain
Force10 Networks Ltd. UK
LLC Dell Ukraine Ukraine
Oy Dell A.B. Finland
Dell Services GmbH (FKA. Perot Systems (Germany) GmbH) Germany
Perot Systems (Slovakia) s.r.o. Slovakia
Perot Systems (Switzerland) GmbH Switzerland
Perot Systems (UK) Ltd. United Kingdom
5
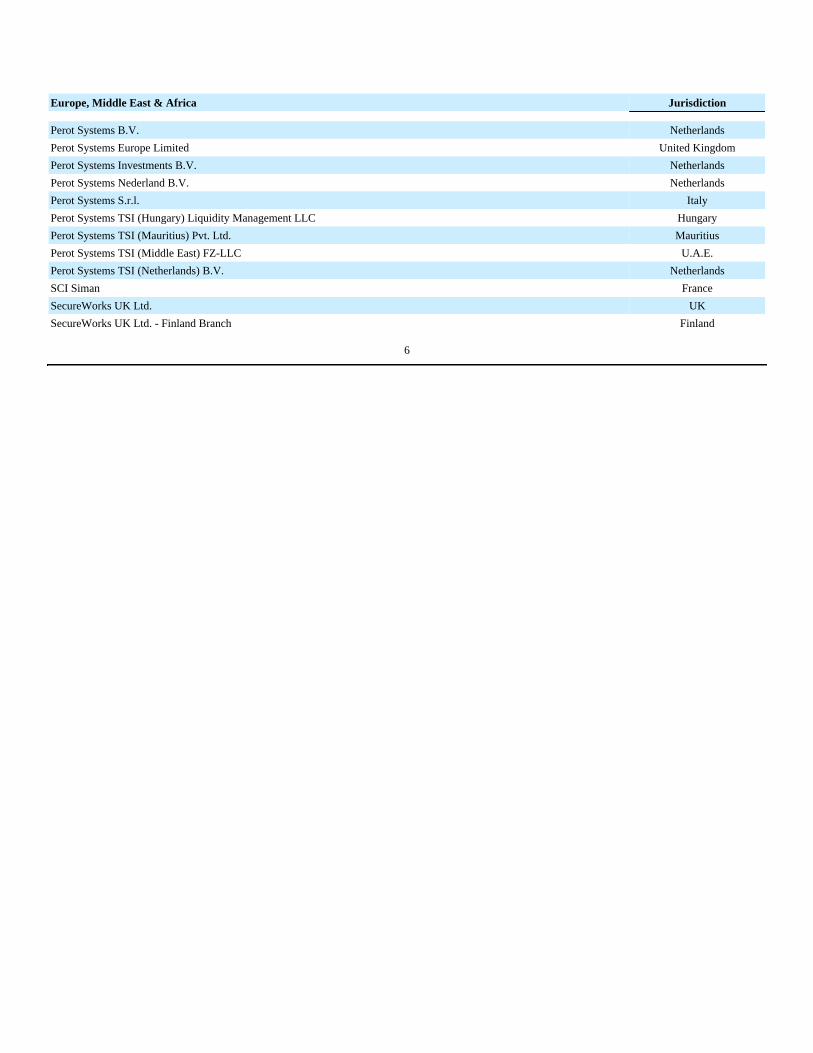
Europe, Middle East & Africa Jurisdiction
Perot Systems B.V. Netherlands
Perot Systems Europe Limited United Kingdom
Perot Systems Investments B.V. Netherlands
Perot Systems Nederland B.V. Netherlands
Perot Systems S.r.l. Italy
Perot Systems TSI (Hungary) Liquidity Management LLC Hungary
Perot Systems TSI (Mauritius) Pvt. Ltd. Mauritius
Perot Systems TSI (Middle East) FZ-LLC U.A.E.
Perot Systems TSI (Netherlands) B.V. Netherlands
SCI Siman France
SecureWorks UK Ltd. UK
SecureWorks UK Ltd. - Finland Branch Finland
6
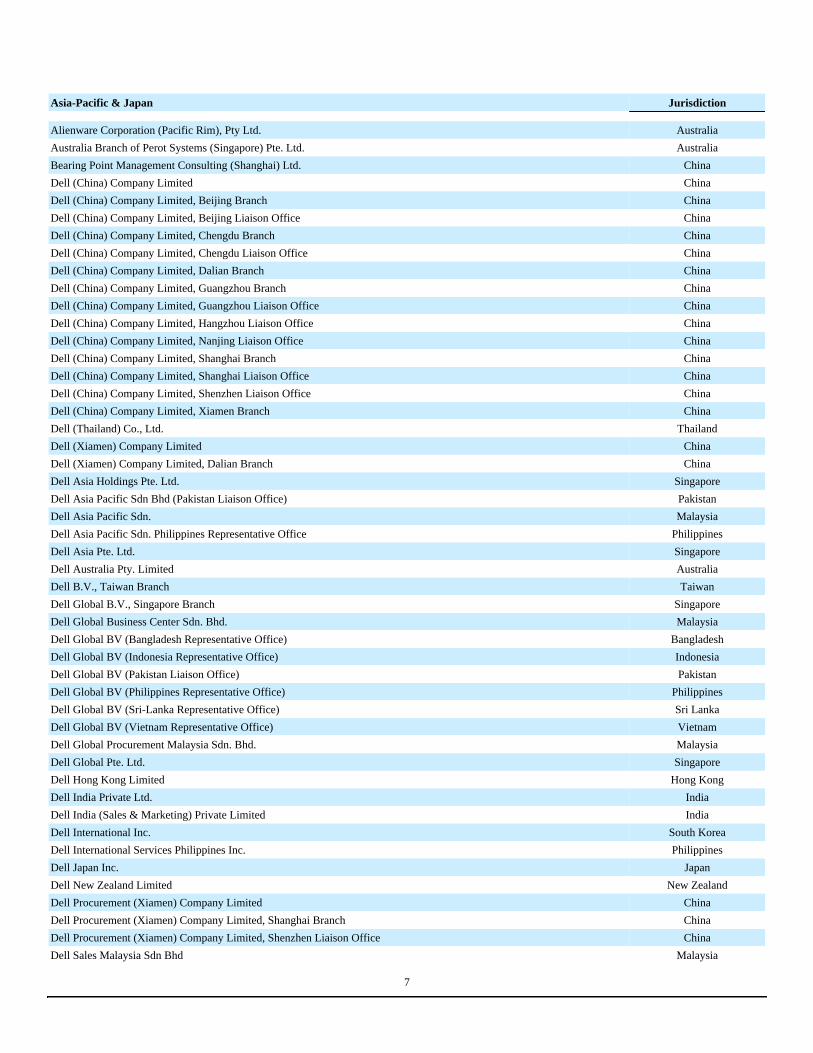
Asia-Pacific & Japan Jurisdiction
Alienware Corporation (Pacific Rim), Pty Ltd. Australia
Australia Branch of Perot Systems (Singapore) Pte. Ltd. Australia
Bearing Point Management Consulting (Shanghai) Ltd. China
Dell (China) Company Limited China
Dell (China) Company Limited, Beijing Branch China
Dell (China) Company Limited, Beijing Liaison Office China
Dell (China) Company Limited, Chengdu Branch China
Dell (China) Company Limited, Chengdu Liaison Office China
Dell (China) Company Limited, Dalian Branch China
Dell (China) Company Limited, Guangzhou Branch China
Dell (China) Company Limited, Guangzhou Liaison Office China
Dell (China) Company Limited, Hangzhou Liaison Office China
Dell (China) Company Limited, Nanjing Liaison Office China
Dell (China) Company Limited, Shanghai Branch China
Dell (China) Company Limited, Shanghai Liaison Office China
Dell (China) Company Limited, Shenzhen Liaison Office China
Dell (China) Company Limited, Xiamen Branch China
Dell (Thailand) Co., Ltd. Thailand
Dell (Xiamen) Company Limited China
Dell (Xiamen) Company Limited, Dalian Branch China
Dell Asia Holdings Pte. Ltd. Singapore
Dell Asia Pacific Sdn Bhd (Pakistan Liaison Office) Pakistan
Dell Asia Pacific Sdn. Malaysia
Dell Asia Pacific Sdn. Philippines Representative Office Philippines
Dell Asia Pte. Ltd. Singapore
Dell Australia Pty. Limited Australia
Dell B.V., Taiwan Branch Taiwan
Dell Global B.V., Singapore Branch Singapore
Dell Global Business Center Sdn. Bhd. Malaysia
Dell Global BV (Bangladesh Representative Office) Bangladesh
Dell Global BV (Indonesia Representative Office) Indonesia
Dell Global BV (Pakistan Liaison Office) Pakistan
Dell Global BV (Philippines Representative Office) Philippines
Dell Global BV (Sri-Lanka Representative Office) Sri Lanka
Dell Global BV (Vietnam Representative Office) Vietnam
Dell Global Procurement Malaysia Sdn. Bhd. Malaysia
Dell Global Pte. Ltd. Singapore
Dell Hong Kong Limited Hong Kong
Dell India Private Ltd. India
Dell India (Sales & Marketing) Private Limited India
Dell International Inc. South Korea
Dell International Services Philippines Inc. Philippines
Dell Japan Inc. Japan
Dell New Zealand Limited New Zealand
Dell Procurement (Xiamen) Company Limited China
Dell Procurement (Xiamen) Company Limited, Shanghai Branch China
Dell Procurement (Xiamen) Company Limited, Shenzhen Liaison Office China
Dell Sales Malaysia Sdn Bhd Malaysia
7
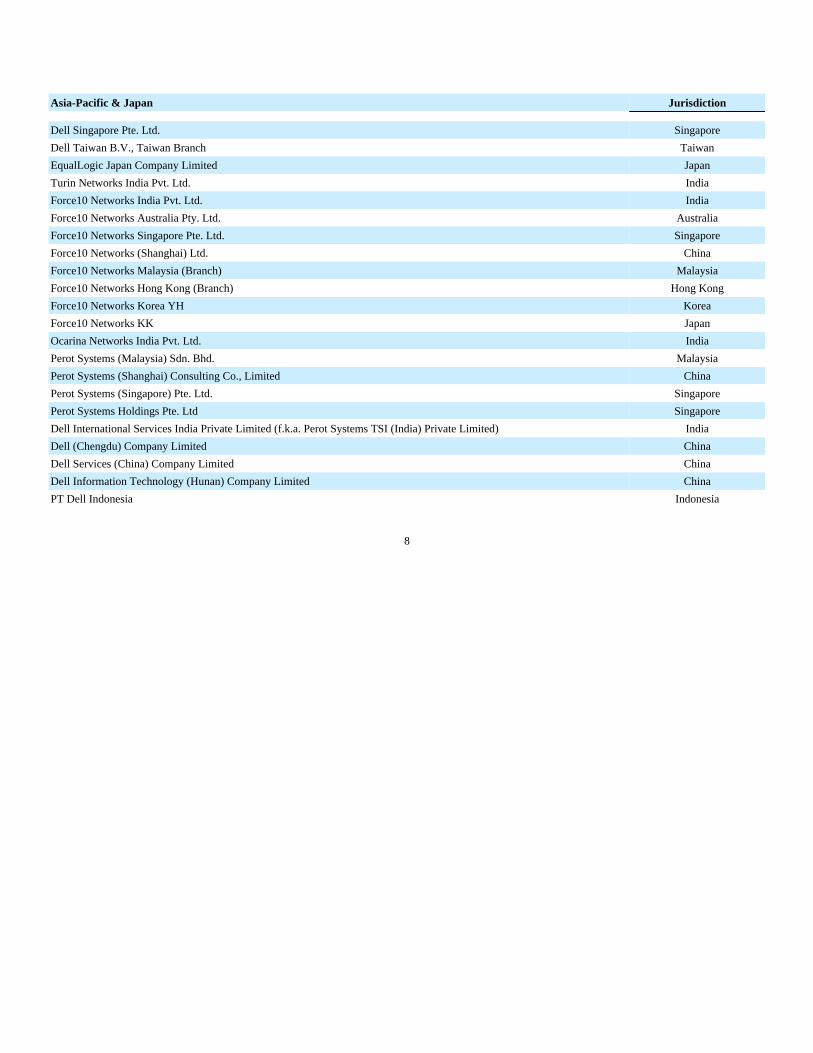
Asia-Pacific & Japan Jurisdiction
Dell Singapore Pte. Ltd. Singapore
Dell Taiwan B.V., Taiwan Branch Taiwan
EqualLogic Japan Company Limited Japan
Turin Networks India Pvt. Ltd. India
Force10 Networks India Pvt. Ltd. India
Force10 Networks Australia Pty. Ltd. Australia
Force10 Networks Singapore Pte. Ltd. Singapore
Force10 Networks (Shanghai) Ltd. China
Force10 Networks Malaysia (Branch) Malaysia
Force10 Networks Hong Kong (Branch) Hong Kong
Force10 Networks Korea YH Korea
Force10 Networks KK Japan
Ocarina Networks India Pvt. Ltd. India
Perot Systems (Malaysia) Sdn. Bhd. Malaysia
Perot Systems (Shanghai) Consulting Co., Limited China
Perot Systems (Singapore) Pte. Ltd. Singapore
Perot Systems Holdings Pte. Ltd Singapore
Dell International Services India Private Limited (f.k.a. Perot Systems TSI (India) Private Limited) India
Dell (Chengdu) Company Limited China
Dell Services (China) Company Limited China
Dell Information Technology (Hunan) Company Limited China
PT Dell Indonesia Indonesia
8
EXHIBIT 23
CONSENT OF INDEPENDENT REGISTERED PUBLIC ACCOUNTING FIRM
We hereby consent to the incorporation by reference in the Registration Statements on Form S-3 (No. 333-172872) and Form S-8 (Nos. 033-54583,033-63273, 333-58039, 333-66415, 333-49014, 333-49016, 333-69724, 333-69726, 333-100342, 333-111214, 333-147882, 333-158216 and 333-177202) ofDell Inc. of our report dated March 13, 2012 relating to the financial statements, and the effectiveness of internal control over financial reporting, whichappears in this Form 10-K.
/s/ PRICEWATERHOUSECOOPERS LLP
Austin, TexasMarch 13, 2012
EXHIBIT 31.1
CERTIFICATION OF MICHAEL S. DELL, CHAIRMAN ANDCHIEF EXECUTIVE OFFICER, PURSUANT TO RULE 13a-14(a) UNDER
THE SECURITIES EXCHANGE ACT OF 1934, AS ADOPTEDPURSUANT TO SECTION 302 OF THE SARBANES-OXLEY ACT OF 2002
I, Michael S. Dell, certify that:
1. I have reviewed this Annual Report on Form 10-K of Dell Inc.;
2. Based on my knowledge, this report does not contain any untrue statement of a material fact or omit to state a material fact necessary to make thestatements made, in light of the circumstances under which such statements were made, not misleading with respect to the period covered by this report;
3. Based on my knowledge, the financial statements, and other financial information included in this report, fairly present in all material respects thefinancial condition, results of operations and cash flows of the registrant as of, and for, the periods presented in this report;
4. The registrant's other certifying officer(s) and I are responsible for establishing and maintaining disclosure controls and procedures (as defined inExchange Act Rules 13a-15(e) and 15d-15(e)) and internal control over financial reporting (as defined in Exchange Act Rules 13a-15(f) and 15d-15(f))for the registrant and have:
(a) Designed such disclosure controls and procedures, or caused such disclosure controls and procedures to be designed under our supervision, toensure that material information relating to the registrant, including its consolidated subsidiaries, is made known to us by others within thoseentities, particularly during the period in which this report is being prepared;
(b) Designed such internal control over financial reporting, or caused such internal control over financial reporting to be designed under oursupervision, to provide reasonable assurance regarding the reliability of financial reporting and the preparation of financial statements for externalpurposes in accordance with generally accepted accounting principles;
(c) Evaluated the effectiveness of the registrant's disclosure controls and procedures and presented in this report our conclusions about theeffectiveness of the disclosure controls and procedures, as of the end of the period covered by this report based on such evaluation; and
(d) Disclosed in this report any change in the registrant's internal control over financial reporting that occurred during the registrant's most recent fiscalquarter (the registrant's fourth fiscal quarter in the case of an annual report) that has materially affected, or is reasonably likely to materially affect,the registrant's internal control over financial reporting; and
5. The registrant's other certifying officer(s) and I have disclosed, based on our most recent evaluation of internal control over financial reporting, to theregistrant's auditors and the audit committee of the registrant's board of directors (or persons performing the equivalent functions):
(a) All significant deficiencies and material weaknesses in the design or operation of internal control over financial reporting which are reasonablylikely to adversely affect the registrant's ability to record, process, summarize and report financial information; and
(b) Any fraud, whether or not material, that involves management or other employees who have a significant role in the registrant's internal controlover financial reporting.
March 13, 2012 /s/ MICHAEL S. DELL
Michael S. Dell
Chairman and Chief Executive Officer

EXHIBIT 31.2
CERTIFICATION OF BRIAN T. GLADDEN, SENIOR VICE PRESIDENT ANDCHIEF FINANCIAL OFFICER, PURSUANT TO RULE 13a-14(a) UNDER
THE SECURITIES EXCHANGE ACT OF 1934, AS ADOPTEDPURSUANT TO SECTION 302 OF THE SARBANES-OXLEY ACT OF 2002
I, Brian T. Gladden, certify that:
1. I have reviewed this Annual Report on Form 10-K of Dell Inc.;
2. Based on my knowledge, this report does not contain any untrue statement of a material fact or omit to state a material fact necessary to make thestatements made, in light of the circumstances under which such statements were made, not misleading with respect to the period covered by this report;
3. Based on my knowledge, the financial statements, and other financial information included in this report, fairly present in all material respects thefinancial condition, results of operations and cash flows of the registrant as of, and for, the periods presented in this report;
4. The registrant's other certifying officer(s) and I are responsible for establishing and maintaining disclosure controls and procedures (as defined inExchange Act Rules 13a-15(e) and 15d-15(e)) and internal control over financial reporting (as defined in Exchange Act Rules 13a-15(f) and 15d-15(f))for the registrant and have:
(a) Designed such disclosure controls and procedures, or caused such disclosure controls and procedures to be designed under our supervision, toensure that material information relating to the registrant, including its consolidated subsidiaries, is made known to us by others within thoseentities, particularly during the period in which this report is being prepared;
(b) Designed such internal control over financial reporting, or caused such internal control over financial reporting to be designed under oursupervision, to provide reasonable assurance regarding the reliability of financial reporting and the preparation of financial statements for externalpurposes in accordance with generally accepted accounting principles;
(c) Evaluated the effectiveness of the registrant's disclosure controls and procedures and presented in this report our conclusions about theeffectiveness of the disclosure controls and procedures, as of the end of the period covered by this report based on such evaluation; and
(d) Disclosed in this report any change in the registrant's internal control over financial reporting that occurred during the registrant's most recent fiscalquarter (the registrant's fourth fiscal quarter in the case of an annual report) that has materially affected, or is reasonably likely to materially affect,the registrant's internal control over financial reporting; and
5. The registrant's other certifying officer(s) and I have disclosed, based on our most recent evaluation of internal control over financial reporting, to theregistrant's auditors and the audit committee of the registrant's board of directors (or persons performing the equivalent functions):
(a) All significant deficiencies and material weaknesses in the design or operation of internal control over financial reporting which are reasonablylikely to adversely affect the registrant's ability to record, process, summarize and report financial information; and
(b) Any fraud, whether or not material, that involves management or other employees who have a significant role in the registrant's internal controlover financial reporting.
March 13, 2012 /s/ BRIAN T. GLADDEN
Brian T. Gladden
Senior Vice President and Chief Financial Officer
EXHIBIT 32.1
CERTIFICATIONS OF MICHAEL S. DELL, CHAIRMAN AND CHIEF EXECUTIVE OFFICER,AND BRIAN T. GLADDEN, SENIOR VICE PRESIDENT
AND CHIEF FINANCIAL OFFICER, PURSUANT TO 18 U.S.C. SECTION 1350,AS ADOPTED PURSUANT TO SECTION 906 OF THE SARBANES-OXLEY ACT OF 2002
The undersigned officers of Dell Inc. hereby certify that (a) Dell Inc.'s Annual Report on Form 10-K for the fiscal year ended February 3, 2012, as filed withthe Securities and Exchange Commission, fully complies with the requirements of Section 13(a) of the Securities Exchange Act of 1934 and (b) informationcontained in the report fairly presents, in all material respects, the financial condition and results of operations of Dell Inc.
Date: March 13, 2012 /s/ MICHAEL S. DELL
Michael S. Dell
Chairman and Chief Executive Officer
Date: March 13, 2012 /s/ BRIAN T. GLADDEN
Brian T. Gladden
Senior Vice President and Chief Financial Officer
Related Documents