eq Z R. &. M. No. 3660 ~"" ; ? Z" ~ : . a ROYAL /:"~ "~ (- :/.£T .c-. • ~, ~'l'M. MINISTRY OF AVIATION SUPPLY AERONAUTICAL RESEARCH COUNCIL REPORTS AND MEMORANDA Further Piloted Simulation Studies of the Handling Characteristics of a Slender-Wing Supersonic Transport Aircraft During Approach and Landing By B. N. TOMLINSON and T. WmCOCK Aerodynamics Dept., R.A.E., Bedford LONDON: HER MAJESTY'S STATIONERY OFFICE 1971 PRICE £1"40 NET

Welcome message from author
This document is posted to help you gain knowledge. Please leave a comment to let me know what you think about it! Share it to your friends and learn new things together.
Transcript
eq
Z
R. &. M. No. 3660
~ " " ; ? Z" ~ : . a
ROYAL /:"~ "~ (- : / . £ T . c - . • ~ , ~ ' l ' M .
MINISTRY OF AVIATION SUPPLY
AERONAUTICAL RESEARCH COUNCIL
REPORTS AND MEMORANDA
Further Piloted Simulation Studies of the Handling Characteristics of a Slender-Wing Supersonic
Transport Aircraft During Approach and Landing
By B. N. TOMLINSON and T. WmCOCK
Aerodynamics Dept., R.A.E., Bedford
LONDON: HER MAJESTY'S STATIONERY OFFICE
1971
PRICE £1"40 NET
Further Piloted Simulation Studies of the Handling Characteristics of a Slender-Wing Supersonic
Transport Aircraft During Approach and Landing
By B. N . TOMLINSON and T. WILCOCK
Aerodynamics Dept., R.A.E., Bedford
Reports and Memoranda No. 3660* January, 1969
Summary. A comprehensive simulation of a slender-wing supersonic transport aircraft during approach and
landing has been flown by a number of pilots from airlines and test establishments. The aim of the simula- tion was to obtain pilots' comments on the handling qualities of the simulated aircraft, to discover problem areas, and to study especially touchdown, and the effect of autostabilizer failures. The touchdown phase was of particular interest as, at the time, it had not been studied in detail. Although useful results were obtained, they are qualified by the inability of the simulation to provide all the cues, particularly visual ones, necegsary for a successful lfinding. Cockpit motion in pitch and roll was used. Principal results were that the handling qualities of the simulated aircraft in its fully autostabilized state were good : loss of the pitch damper provoked the strongest criticisms; loss of autothrottle did not pose any great difficulty. Retaining the autothrottle in operation throughout the landing flare was desirable. Sidestep manoeuvres were performed easily and good landings could be made in calm and turbulent conditions, in cross-winds up to 25 kt.
*Replaces R.A.E. Technical Report 69 003--A.R.C. 31 375.
LIST OF CONTENTS
Section
1.
2.
Approach aids
3. Longitudinal Stability
4. Tests
5. Results for Approach and Touchdown
6. Tailgusts
6.1. Computed responses
6.2. Tailgust experiment
7. Sidestep Manoeuvres
8. Landing in Cross-Winds
9. Pilots' Comments
9.1. The simulation
9.2. Normal operation
9.3. Operation with system failures
9.3.1. No autothrottle
9.3.2. No pitch autostabilizer
9.3.3. No roll autostabilizer
9.3.4. Engine failure
10. Simulator Validation
11. Conclusions
List of Symbols
References
Appendix Aircraft data as used in the simulation
Illustrations--Figs. 1 to 45
Detachable Abstract Cards
Introduction
Description of Simulation
2.1. The aircraft
2.2. Representation of aerodynamic characteristics and equations of motion
2.3. Flying controls, autostabilization and autothrottle
2.4. Cockpit environment and flight instruments
2.5.
1. Introduction. This Report describes tests on a simulated slender-wing supersonic transport aircraft in the approach
and landing phases of flight. Aerodynamic and other characteristics of the simulated aircraft were based on the prototype Concorde design using data available at December 1965. The tests were conducted in the Aero Flight simulator 1 at R.A.E. Bedford during early 1967, following a study 2 of the take-off man- oeuvre. Although the cockpit and flight instruments used were not representative of the aircraft, and only single-pilot operation was possible, the Aero Flight simulator provided the best simulation facility available at the time. More recently, detailed studies of flying qualities and control characteristics have been undertaken by the British Aircraft Corporation and Sud Aviation using their simulators at Filton and Toulouse. Many changes and improvements, especially to the stability augmentation systems, have resulted from this work, so that the results described in this Report do not necessarily apply to the current Concorde design.
The work described here is part of a sequence 3'4 of investigations to study the handling characteristics of slender-wing supersonic transport aircraft at low speeds. As the simulator capability improved, the scope of the experiments widened so that the present work, using a moving cockpit and a closed circuit television display, provided a close representation of the entire approach and landing task.
Earlier work by Perry a and by Perry and McPherson 4 had studied the handling qualities of large, slender-wing aircraft during the landing approach under instrument 3'4 and visuaP conditions but limitations of the equipment prevented satisfactory continuation to touchdown. With the development of realistic-looking visual displays by closed-circuit television it was hoped that the landing-flare and touchdown phases could now be studied. This was particularly important as several papers 5-9 had highlighted potential difficulties in this area. The aim of the work reported here was to repeat some of the previous tests with more recent information on aerodynamics and autostabilizers, to obtain pilots' comments on the handling qualities of the simulated aircraft, and to study the approach, landing-flare and touchdown with particular attention to the effects of winds, gusts and autostabilizer failures.
As part of the continuous process of simulator validation, a current large jet transport aircraft was set up on the simulator as a preliminary test of the TV visual display for landing. After the Concorde landing study had finished, a simulation of the BAC 221 slender-wing research aircraft was programmed to provide a direct flight-simulator comparison of the handling behaviour associated with slender-wing aircraft. Good qualitative agreement was obtained both for the transport aircraft and for the BAC 221.
2. Description of the Simulation. 2.1. The Aircraft.
Aerodynamic and physical characteristics of the simulated aircraft were derived from wind tunnel and theoretical data 1°-15 relevant to the Concorde prototype design at December 1965. Details of data used are given in the Appendix; fuller details appear ha Ref. 2. Aerodynamic changes to the actual proto- type aircraft since that date are confined to the addition of vortex generators on the forward fuselage, designed to improve the directional stability of the aircraft at high incidence. There are also differences in the controls and autostabilization systems which will be described in Section 2.3. The production aircraft will differ from the prototype primarily in having a longer fuselage and revised outer wing.
In order to prevent structural damage to the aircraft at high pitch attitude during take-offand landing, a compressible tail bumper is fitted. With the main undercarriage oleos fully extended and wheels just touching the ground, tail bumper contact occurs at a pitch attitude of 12"2 ° and the bumper is fully compressed at 13-6 °. The simulation included a representation of this tail bumper.
2.2. Representation of Aerodynamic Characteristics and Equations of Motion. Continuous solution on an analogue computer of the equations of motion 16,17 for the rigid aircraft in
six degrees of freedom determined the aircraft's behaviour in response to control inputs and external disturbances. Details of data used in the simulation are given in Appendix A. The aim was an accurate simulation of the aircraft's handling and performance over the speed range 125-225 kt, corresponding to 5-20 ° incidence; variations in the aerodynamics due to ground proximity were included. Approximate
representation of the aircraft's ground beliaviour (due to tail bumper, tyre sideforces, nosewheel steering, undercarriage oleos, etc.) was provided to enable complete flight from take-offground roll to touchdown to be performed.
Atmospheric disturbances in the form of steady head-, tail- or cross-winds, wind shear and turbulence could be represented. The turbulence was obtained 1 by filtering white noise from three independent random noise generators to correspond to known power spectra for atmospheric turbulence, and apply- ing these filtered outputs as fluctuations in incidence, sideslip and airspeed. This representation assumes that all portions of the aircraft are simultaneously subjected to the same variations of incidence, sideslip and airspeed, whereas in practice the aircraft will take time to penetrate a disturbance, each fluctuation travelling down the length of the aircraft. These 'immersion' effects may not be negligible for a large slender aircraft v.
The selected level of random turbulence was 5-6 ft/sec rms, for all components; the vertical component of the turbulence was attenuated linearly with height from 100 ft to ground level, the value at ground level being 1/10 of that at 100 ft. On some approaches the sideslip turbulence spectrum was modified to have peak values of around 22 ft/sec, still maintaining an rms value of 5-6 ft/sec. This was provided in response to pilot criticism that the number of large gusts experienced with the standard turbulence was low in comparison with flight, where relatively more large gusts are experienced.
2.3. Flying Controls, Autostabilization and Autothrottle. Control of pitch and roll in the aircraft is by means of elevons rather than by separate elevators and
ailerons; as a result, available lateral control travel is a function of the longitudinal control position, as shown in Fig. 41. Since this simulation, the mixing envelope has been modified to give equal (18 °) amounts of up and down elevator. The control force gradients and gearings used are shown in Figs. 42-44 com- pared with those proposed at the time of preparation of the simulation. Trim in pitch was by means of a thumb-operated switch on the left-hand 'ram's horn'; there was no provision for trim in roll or yaw.
Autostabilization was provided about all three axes, and an interconnection between aileron and rudder produced rudder movements proportional to the pilot's demanded aileron angle. Roll and yaw autostabilizers acted simply to improve the aircraft's damping but the pitch autostabilizer quickened the aircraft's pitch response to stick movements in a way described by Pinsker (Section 8.1 of Ref. 9). The control laws are listed in the Appendix. The simulator operator could fail any of the autostabilizers.
A single engine-lever, mounted on the right-hand console, controlled the thrust of all four engines. This feature is, of course, not representative of the real aircraft. An autothrottle was fitted; details of the control law and method of operation are given in the Appendix. Either outboard engine could be failed by the simulator operator, the failure being represented by an instantaneous total loss of power on the appropriate engine.
It should be noted that reliability of the aircraft's autostabilization and autothrottle is intended to be such that the probability of loss of an entire channel is less than 10- 5 per hour for a three hour flight. The autostabilization laws proposed for the aircraft have been revised since this series of tests ; mention of the changes is made in Section 5.
2.4. Cockpit Environment and Flight Instruments.
The simulator was equipped with a small single-seat cockpit (Fig. l) in which a 'ram's horns' control column was fitted. The cockpit was somewhat cramped, the stick and instruments panel being too close to the pilot, and was not representative of a large transport aircraft.
The flight instruments used are shown in Fig. 2 but their positions on the instrument panel were not as shown in this figure. The layout used is illustrated in Fig. 3. The instruments are:
single pointer airspeed indicator 0-610 kt F.4B director/artificial horizon, _+25 ° pitch attitude, sensitivity I6°/inch radio altimeter, 0-500 ft 3-pointer pressure altimeter G.4 compass
4
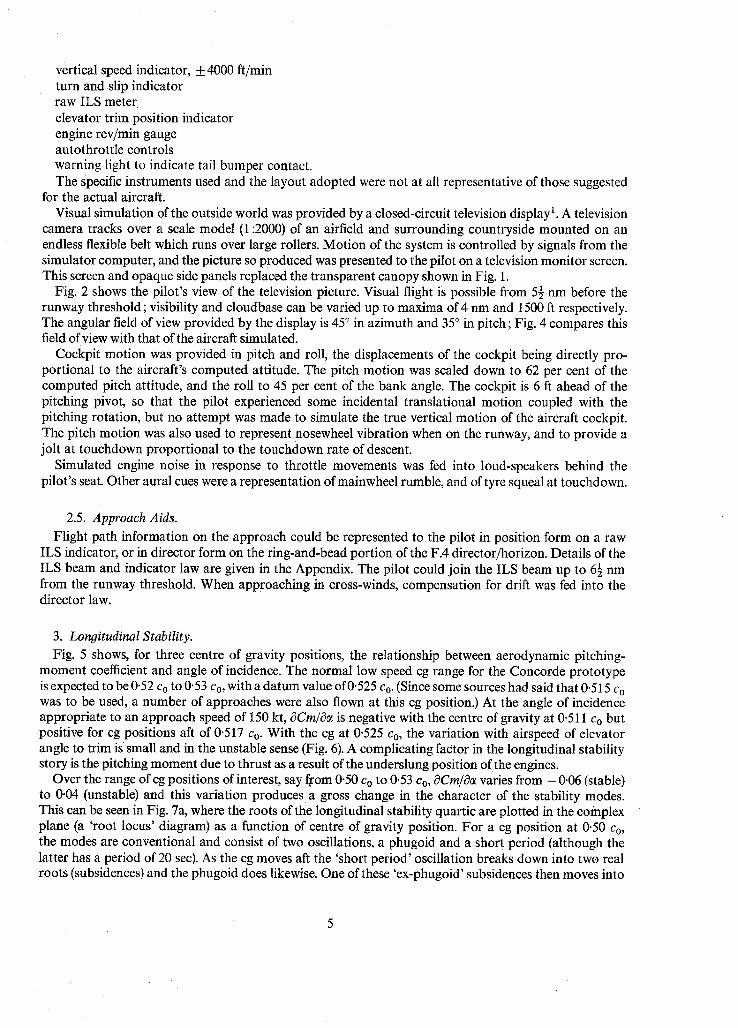
vertical speed indicator, _ 4000 ft/min turn and slip indicator raw ILS meter elevator trim position indicator engine rev/min gauge autothrottle controls warning light to indicate tail bumper contact. The specific instruments used and the layout adopted were not at all representative of those suggested
for the actual aircraft. Visual simulation of the outside world was provided by a closed-circuit television display 1. A television
camera tracks over a scale model (1:2000) of an airfield and surrounding countryside mounted on an endless flexible belt which runs over large rollers. Motion of the system is controlled by signals from the simulator computer, and the picture so produced was presented to the pilot on a television monitor screen. This screen and opaque side panels replaced the transparent canopy shown in Fig. 1.
Fig. 2 shows the pilot's view of the television picture. Visual flight is possible from 5½ nm before the runway threshold; visibility and cloudbase can be varied up to maxima of 4 nm and 1500 ft respectively. The angular field of view provided by the display is 45 ° in azimuth and 35 ° in pitch; Fig. 4 compares this field of view with that of the aircraft simulated.
Cockpit motion was provided in pitch and roll, the displacements of the cockpit being directly pro- portional to the aircraft's computed attitude. The pitch motion was scaled down to 62 per cent of the computed pitch attitude, and the roll to 45 per cent of the bank angle. The cockpit is 6 ft ahead of the pitching pivot, so that the pilot experienced some incidental translational motion coupled with the pitching rotation, but no attempt was made to simulate the true vertical motion of the aircraft cockpit. The pitch motion was also used to represent nosewheel vibration when on the runway, and to provide a jolt at touchdown proportional to the touchdown rate of descent.
Simulated engine noise in response to throttle movements was fed into loud-speakers behind the pilot's seat. Other aural cues were a representation of mainwheel rumble, and of tyre squeal at touchdown.
2.5. Approach Aids. Flight path information on the approach could be represented to the pilot in position form on a raw
ILS indicator, or in director form on the ring-and-bead portion of the F.4 director/horizon. Details of the ILS beam and indicator law are given in the Appendix. The pilot could join the ILS beam up to 6½ nm from the runway threshold. When approaching in cross-winds, compensation for drift was fed into the director law.
3. Longitudinal Stability. Fig. 5 shows, for thi:ee centre of gravity positions, the relationship between aerodynamic pitching-
moment coefficient and angle of incidence. The normal low speed cg range for the Concorde prototype is expected to be 0.52 Co to 0.53 Co, with a datum value of 0.525 c o. (Since some sources had said that 0.515 Co was to be used, a number of approaches were also flown at this cg position.) At the angle of incidence appropriate to an approach speed of 150 kt, ~Cm/~ is negative with the centre of gravity at 0.511 c o but positive for cg positions aft of 0.517 Co. With the cg at 0.525 Co, the variation with airspeed of elevator angle to trim is small and in the unstable sense (Fig. 6). A complicating factor in the longitudinal stability story is the pitching moment due to thrust as a result of the underslung position of the engines.
Over the range ofcg positions of interest, say from 0.50 c o to 0.53 Co, OCm/Oe varies from -0.06 (stable) to 0.04 (unstable) and this variation produces a gross change in the character of the stability modes. This can be seen in Fig. 7a, where the roots of the longitudinal stability quartic are plotted in the complex plane (a 'root locus' diagram) as a function of centre of gravity position. For a cg position at 0.50 c o, the modes are conventional and consist of two oscillations, a phugoid and a short period (although the latter has a period of 20 sec). As the cg moves aft the 'short period' oscillation breaks down into two real roots (subsidences) and the phugoid does likewise. One of these 'ex-phugoid' subsidences then moves into
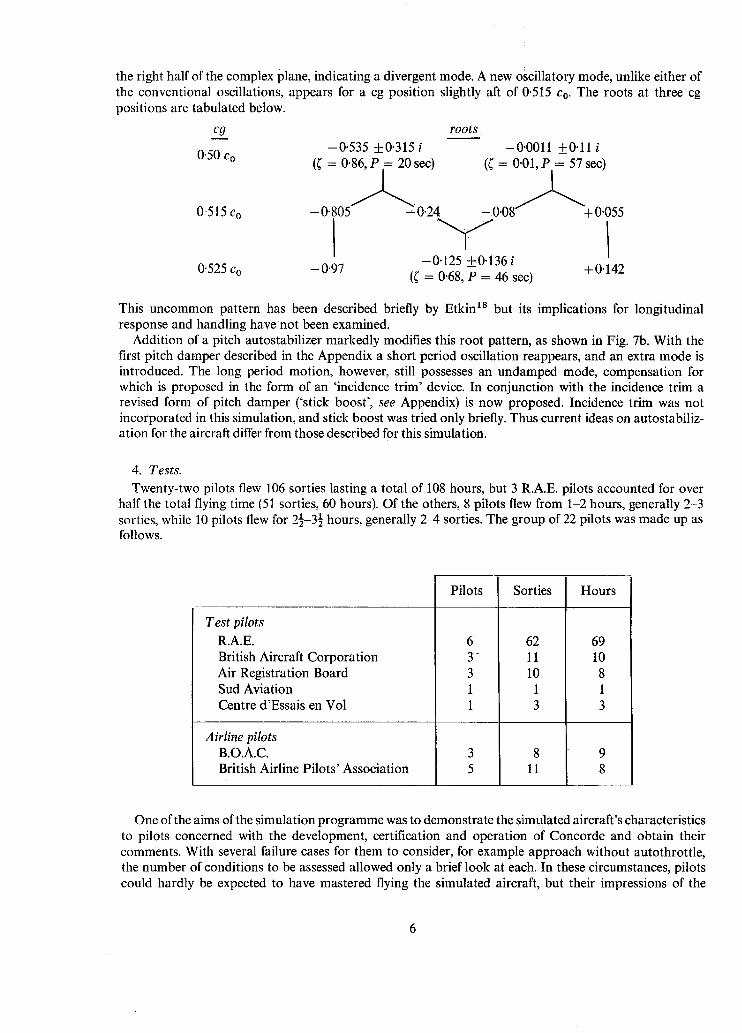
the right half of the complex plane, indicating a divergent mode. A new oscillatory mode, unlike either of the conventional oscillations, appears for a cg position slightly aft of 0.515 c o. The roots at three cg positions are tabulated below.
cg roots
-0.535 +_0.315 i -0'0011 _+0.11 i 0.50 Co (( = 0.86, P = 20 sec) (( = 0.01, P = 57 sec)
0..515 Co - 0 " 8 0 5 ~ " 1 ' 0 " 2 " 0 8 ~ + 0.055
-0.125 _+0-136 i 0.525 c o -0"97 (( = 0.68, P = 46 sec) +0.142
This uncommon pattern has been described briefly by Etkin 18 but its implications for longitudinal response and handling have not been examined.
Addition of a pitch autostabilizer markedly modifies this root pattern, as shown in Fig. 7b. With the first pitch damper described in the Appendix a short period oscillation reappears, and an extra mode is introduced. The long period motion, however, still possesses an undamped mode, compensation for which is proposed in the form of an 'incidence trim' device. In conjunction with the incidence trim a revised form of pitch damper ('stick boost', see Appendix) is now proposed. Incidence trim was not incorporated in this simulation, and stick boost was tried only briefly. Thus current ideas on autostabiliz- ation for the aircraft differ from those described for this simulation.
4. Tests.
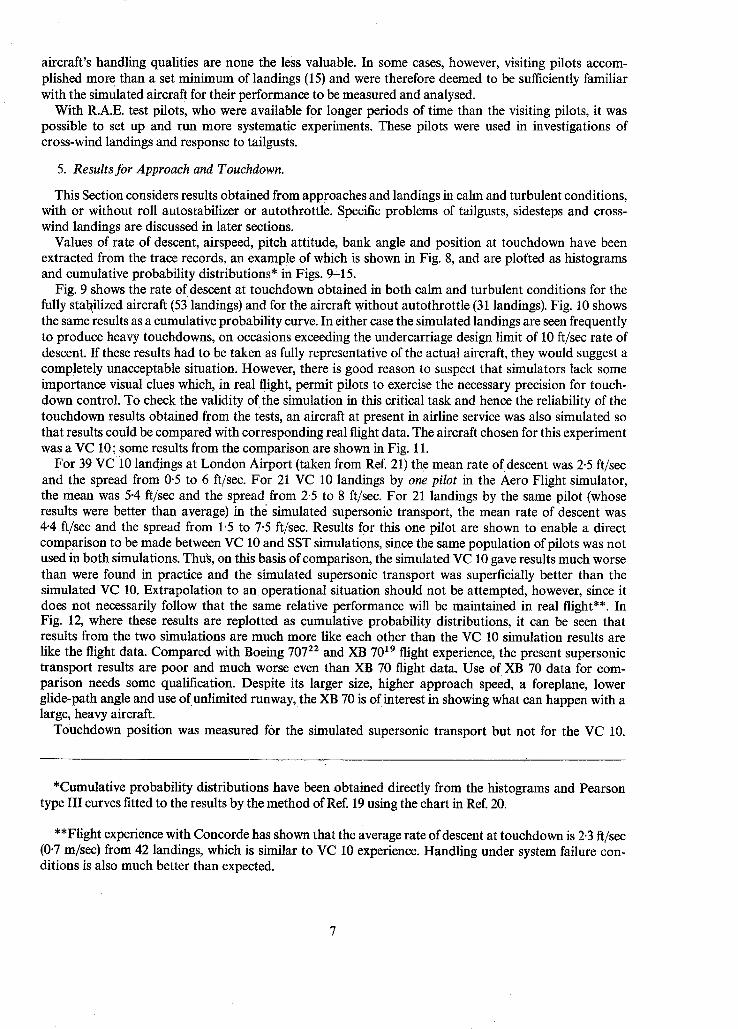
Twenty-two pilots flew 106 sorties lasting a total of 108 hours, but 3 R.A.E. pilots accounted for over half the total flying time (51 sorties, 60 hours). Of the others, 8 pilots flew from 1-2 hours, generally 2-3 sorties, while 10 pilots flew for ~ 2~-3~ hours, generally 2-4 sorties. The group of 22 pilots was made up as follows.
Test pilots
R.A.E. British Aircraft Corporation Air Registration Board Sud Aviation Centre d'Essais en Vol
Airline pilots B.O.A.C. British Airline Pilots' Association
Pilots
6 . , ,
3 1 1
Sorties
62 11 10
1 3
8 11
Hours
69 10 8 1 3
One of the aims of the simulation programme was to demonstrate the simulated aircraft's characteristics to pilots concerned with the development, certification and operation of Concorde and obtain their comments. With several failure cases for them to consider, for example approach without autothrottle, the number of conditions to be assessed allowed only a brief look at each. In these circumstances, pilots could hardly be expected to have mastered flying the simulated aircraft, but their impressions of the
aircraft's handling qualities are none the less valuable. In some cases, however, visiting pilots accom- plished more than a set minimum of landings (15) and were therefore deemed to be sufficiently familiar with the simulated aircraft for their performance to be measured and analysed.
With R.A.E. test pilots, who were available for longer periods of time than the visiting pilots, it was possible to set up and run more systematic experiments. These pilots were used in investigations of cross-wind landings and response to tailgusts.
5. Results for Approach and Touchdown.
This Section considers results obtained from approaches and landings in calm and turbulent conditions, with or without roll autostabilizer or autothrottle. Specific problems of tailgusts, sidesteps and cross- wind landings are discussed in later sections.
Values of rate of descent, airspeed, pitch attitude, bank angle and position at touchdown have been extracted from the trace records, an example of which is shown in Fig. 8, and are plofted as histograms and cumulative probability distributions* in Figs. 9=15.
Fig. 9 shows the rate of descent at touchdown obtained in both calm and turbulent conditions for the fully stal~ilized aircraft (53 landings) and for the aircraft without autothrottle (31 landings). Fig. 10 shows the same results as a cumulative probability curve. In either case the simulated landings are seen frequently to produce heavy touchdowns, on occasions exceeding the undercarriage design limit of 10 ft/sec rate of descent. If these results had to be taken as fully representative of the actual aircraft, they would suggest a completely unacceptable situation. However, there is good reason to suspect that simulators lack some importance visual clues which, in real flight, permit pilots to exercise the necessary precision for touch- down control. To check the validity of the simulation in this critical task and hence the reliability of the touchdown results obtained from the tests, an aircraft at present in airline service was also simulated so that results could be compared with corresponding real flight data. The aircraft chosen for this experiment was a VC 10; some results from the comparison are shown in Fig. 11.
For 39 VC i0 landings at London Airport (taken from Ref. 21) the mean rate of descent was 2.5 ft/sec and the spread from 0.5 to 6 ft/sec. For 21 VC 10 landings by one pilot in the Aero Flight simulator, the mean was 5.4 ft/sec and the spread from 2"5 to 8 ft/sec. For 21 landings by the same pilot (whose results were better than average) in the simulated supersonic transport, the mean rate of descent was 4.4 ft/sec and the spread from 1.5 to 7.5 ft/sec. Results for this one pilot are shown to enable a direct comparison to be made between VC 10 and SST simulations, since the same population of pilots was not used in both simulations. Thu~, on this basis of comparison, the simulated VC 10 gave results much worse than were found in practice and the simulated supersonic transport was superficially better than the simulated VC 10. Extrapolation to an operational situation should not be attempted, however, since it does not necessarily follow that the same relative performance will be maintained in real flight**. In Fig. 12, where these results are replotted as cumulative probability distributions, it can be seen that results from the two simulations are much more like each other than the VC 10 simulation results are like the flight data. Compared with Boeing 70722 and XB 7019 flight experience, the present supersonic transport results are poor and much worse even than XB 70 flight data. Use of XB 70 data for com- parison needs some qualification. Despite its larger size, higher approach speed, a foreplane, lower glide-path angle and use of unlimited runway, the XB 70 is of interest in showing what can happen with a large, heavy aircraft.
Touchdown position was measured for the simulated supersonic transport but not for the VC 10.
*Cumulative probability distributions have been obtained directly from the histograms and Pearson type III curves fitted to the results by the method of Ref. 19 using the chart in Ref. 20.
**Flight experience with Concorde has shown that the average rate of descent at touchdown is 2-3 ft/sec (0'7 m/sec) from 42 landings, which is similar to VC 10 experience. Handling under system failure con- ditions is also much better than expected.

Results, in cumulative frequency form, are shown in Fig. 14 and compared with Boeing 707 flight data. The simulated supersonic transport touched down further along the runway than the Boeing 707 in airline operation. Use of the autothrottle reduced this distance, but does not align the curve with the flight results. Figs. 13 and 14 taken together show that although the touchdowns were well down the runway, this did not result in low rates of descent. It is clear that pilots' judgement and hence control of touchdown was not good. Their comments (Section 9.1) bear this out.
Histograms of speed and pitch attitude at touchdown are shown in Fig. 15 for the fully stabilized aircraft, labelled 'autothrottle in', and for autothrottle inoperative for the whole approach. With the autothrottle working, the mean speed at touchdown was 151 kt (target is 150 kt) and the spread was 16 kt from 143- 159 kt, but 68 per cent of landings were within the range 148-153 kt. Speed control deteriorated markedly when the autothrottle was out of action. The mean dropped to 147 kt, the spread increased to 35 kt (132- 167 kt) and two thirds of landings resulted in a touchdown speed below 150 kt, compared with one fifth when autothrottle was working. Pitch attitude at touchdown tended to be higher (Fig. 15b) without autothrottle than with it, thus increasing the probability of the tail bumper striking the ground (with the main-wheels just touching the ground, tail bumper contact occurred at a pitch attitude of 12.2°). In fact seven out of thirty-two landings (22 per cent) without autothrottle resulted in the tail bumper touching the ground, whereas no instances of bumper contact occurred with the autothrottle operating.
The same target speed of 150 kt was used regardless of whether or not the autothrottle was in use. As the touchdown speed was consistently low without autothrottle, it might be necessary in practice to raise the target approach speed, when the autothrottle is out of action, by 10-15 kt to avoid tail bumper contact. The low touchdown speed with autothrottle out was due mainly to deceleration in the final stages of the landing (the target approach speed was also 150 kt). In 34 per cent of landings the touchdown speed was more than 10 kt less than the speed at 100 ft, whereas with autothrottle working the speed loss was never more than 8 kt. Speed change between a wheel height of 100 ft and touchdown is illustrated in Fig. 16 for calm and turbulent conditions with autothrottle in and out.
Speed and rate of descent at a wheel height of 100 ft are shown in Fig. 17. The large spread in rate of descent was unaffected by availability of autothrottle. Not surprisingly, use of autothrottle kept speed much closer to the target value than manual operation of throttle.
Accuracy of speed control during instrument approach is illustrated in Fig. 18, which shows maximum and minimum speeds for individual approaches recorded in the height interval from 1500 ft to 200 ft. The speed excursions are arranged in order of increasing minimum speed and are grouped as a function of autothrottle and turbulence conditions. In calm air the speed variation during any single approach was less than 6 kt with autothrottle but between 5 and 22 kt without it. In turbulence (3 kt rms, _+ 9 kt peaks) use of the autothrottle kept the speed variation to less than 24 knots compared with up to 40 kt variation with manual throttle. Some pilots said that with autothrottle inoperative they were quite happy to keep speed in a 25 kt band on the high side of 150 kt. It should not be forgotten that each pilot had to operate his own engine controls. In airline operation, the second pilot would probably manipulate the throttle levers, resulting perhaps in increased accuracy of speed control. More pilot comments on this task are given in Section 9.3.
Insufficient approaches were made with pitch damper failed for any quantitative results to be pre- sented, but pilot comments on this task are given in Section 9.3. Several approaches were performed with an alternative pitch damper law ('stick boost'), pilot comments appear in Section 9.2.
Bank angle at touchdown is shown in Fig. 19 for Boeing 707 and XB 70 measured in flight and for the simulated supersonic transport with roll damper in and out. Roll damper in, the distribution of the bank angle at touchdown for the simulated aircraft is very close to that for the XB 70, which is itself some- what worse than the Boeing 707. Many of the landings in the simulator included sidestep manoeuvres ; if these are not included the distribution for roll damper in is modified to one which is closer to the Boeing 707 curve. Paradoxically, the opposite happens with roll damper out but only 10 landings are involved. Although the results for the simulated supersonic transport include some runs when both autothrottle and roll damper were inoperative, which should be an extremely unlikely occurrence, preliminary analysis showed that failure of the autothrottle had no influence on the bank angle at touchdown and therefore the two conditions could be combined.
6. Tailgusts. Pinsker has shown 8'9 that recovery from the effects of a tailgust, experienced in the final stages of an
approach to land, severely tests an aircraft's longitudinal controllability. Increasing aircraft size, implying a high moment of inertia in pitch and hence sluggish response to elevator, aggravates the difficulty. If the aircraft is also of delta wing planform, as in the present case, pitch control may be provided by large flap-type surfaces at the wing trailing edge, which produce significant changes in lift. This elevator lift tends further to delay the response of the aircraft in a vertical plane.
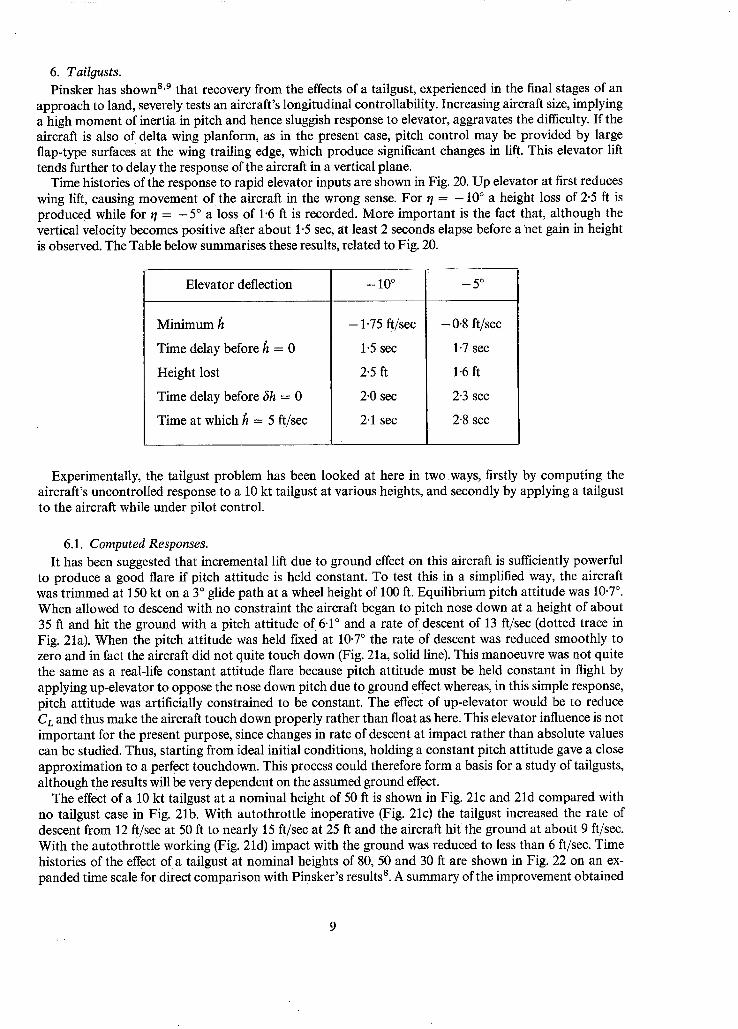
Time histories of the response to rapid elevator inputs are shown in Fig. 20. Up elevator at first reduces wing lift, causing movement of the aircraft in the wrong sense. For 71 = - 10 ° a height loss of 2-5 ft is produced while for t / = - 5 ° a loss of 1.6 ft is recorded. More important is the fact that, although the vertical velocity becomes positive after about 1.5 sec, at least 2 seconds elapse before a 'net gain in height is observed. The Table below summarises these results, related to Fig. 20.
Elevator deflection - 10 ° - 5 °
Minimum h
Time delay before ~ = 0
Height lost
Time delay before 6h = 0
Time at which h = 5 ft/sec
- 1.75 ft/sec
1.5 sec
2.5 ft
2.0 sec
2.1 sec
- 0.8 ft/sec
1-7 sec
1-6 ft
2.3 sec
2.8 sec
Experimentally, the tailgust problem has been looked at here in two ways, firstly by computing the aircraft's uncontrolled response to a 10 kt tailgust at various heights, and secondly by applying a tailgust to the aircraft while under pilot control.
6.1. Computed Responses. It has been suggested that incremental lift due to ground effect on this aircraft is sufficiently powerful
to produce a good flare if pitch attitude is held constant. To test this in a simplified way, the aircraft was trimmed at 150 kt on a 3 ° glide path at a wheel height of 100 ft. Equilibrium pitch attitude was 10-7 °. When allowed to descend with no constraint the aircraft began to pitch nose down at a height of about 35 ft and hit the ground with a pitch attitude of 6.1 ° and a rate of descent of 13 ft/sec (dotted trace in Fig. 21a). When the pitch attitude was held fixed at 10.7 ° the rate of descent was reduced smoothly to zero and in fact the aircraft did not quite touch down (Fig. 21a, solid line). This manoeuvre was not quite the same as a real-life constant attitude flare because pitch attitude must be held constant in flight by applying up-elevator to oppose the nose down pitch due to ground effect whereas, in this simple response, pitch attitude was artificially constrained to be constant. The effect of up-elevator would be to reduce Cz and thus make the aircraft touch down properly rather than float as here. This elevator influence is not important for the present purpose, since changes in rate of descent at impact rather than absolute values can be studied. Thus, starting from ideal initial conditions, holding a constant pitch attitude gave a close approximation to a perfect touchdown. This process could therefore form a basis for a study of tailgusts, although the results will be very dependent on the assumed ground effect.
The effect of a 10 kt tailgust at a nominal height of 50 ft is shown in Fig. 21c and 21d compared with no tailgust case in Fig. 2lb. With autothrottle inoperative (Fig. 21c) the tailgust increased the rate of descent from 12 ft/sec at 50 ft to nearly 15 ft/sec at 25 ft and the aircraft hi t the ground at abotit 9 ft/sec. With the autothrottle working (Fig. 21d) impact with the ground was reduced to less than 6 ft/sec. Time histories of the effect of a tailgust at nominal heights of 80, 50 and 30 ft are shown in Fig. 22 on an ex- panded time scale for direct comparison with Pinsker's results 8. A summary of the improvement obtained

from use of autothrottle is shown in Fig. 23. The higher the tailgust is met, the more improvement is obtained since more lost speed is regained before touchdown. Even for gusts in the critical height band of 2(~50 ft the autothrottle still produces a worthwhile reduction in rate of descent at impact.
In all these calculations engine thrust response to throttle lever movement was represented as a simple first order lag with a time constant of 1-25 sec. A 10 kt tailgust leads to a maximum thrust change of ! 5 000 lb in about 2 sec (Fig. 21d) which is well within the assumed authority limit of 25 000 lb. It was not possible to study the effect of varying the engine response time. This still needs to be done.
A 10 kt headgust was also applied at 50 ft (Figs. 21e and 21t"). Without autothrottle a long float resulted but with autothrottle operating this tendency was opposed.
These simplified calculations using the simulator only as an analogue computer have shown that using the autothrottle during the landing flare provides worthwhile benefits in the event of sudden head or tailgusts. The next Section describes what happened with a pilot flying the aircraft.
6.2. Tailgust Experiment. According to Pinsker s'9 the critical height band for the onset of a tailgust during the flare is 30-80 ft.
Outside this range either there is insufficient time for the aircraft to respond, or the pilot has plenty of time to react. For the purposes of a simulator experiment, therefore, it was decided to apply a tailgust at a height of 50 ft in half the landings. Since the value of an autothrottle was also to be examined, half of the runs had autothrottle operating and half were with manual throttle control. Thus there were four conditions to be tested: autothrottle in or out combined with the presence or absence of a tailgust at 50 ft. Twelve approaches could conveniently be completed in one trial, so that each condition was re- peated three times. The test conditions were arranged in three blocks of four, each block containing the different combinations in a random order. Two pilots each flew one trial of twelve runs, all runs being in turbulence. Tailgusts were not mentioned in the briefing: the aim of the experiment was stated as being to study the influence of the autothrottle on landing impact.
The results are summarised in Figs. 24-26. Fig. 24 shows the effect of tailgust and autothrottle on the rate of descent at touchdown. Although a tailgust sometimes severely upset the landing, causing the tail bumper to touch the ground on 3 occasions with pilot B, two points stand out in these results. First no catstrophes occurred (although a landing impact of 10 ft/sec combined with striking the tail bumper is on the verge of being catastrophic) and second, using the autothrottle throughout the flare seemed to produce a consistent improvement in the rate of descent at touchdown. This improvement has been obtained without too much runway being used (Fig. 25).
An analysis of variance shows that the difference between the mean rate of descent of touchdown with and without autothrottle is statistically significant at the 5 per cent significance level but statistically the experiment has failed to show any effect of tailgusts. This last result is surprising and is perhaps due to the small number of runs made.
The improvement in touchdown impact attributed to the autothrottle could result either from the autothrottle responding immediately to the loss of airspeed or from a general improvement in the tight- ness of control over speed and rates of descent. The second point is illustrated in Fig. 26, which shows the speed and rate of descent at a height of 100 ft. With the autothrottle in, the speed was much more closely controlled.
Fig. 27 shows time histories in the four conditions. Considering that the aircraft was flying the approach at a speed well below minimum drag speed, there was unusually little manual throttle activity during the run illustrated in Fig. 27a. From breaking cloud at about 400 ft altitude (which is where the traces start) the throttle was hardly touched. The height trace is in two parts, a coarse trace down to 100 ft (left-hand scale) and a fine trace below 100 ft (right-hand scale). The flare phase, starting at about 70 ft, is notable for a nearly constant pitch attitude, maintained by about 6 ° elevator. When he experienced a tailgust (Fig. 27b), pilot A reacted 1 second later by applying engine power. This was the only occasion on which this pilot touched the throttles below 100 ft. Pilot B, however, tended to make more frequent use of throttle and on 2 out of 3 occasions reacted to a tailgust by applying power. Figs. 27c and 27d show the effect of autothrottle on the approach and landing. The autothrottle managed to restore a large part of the speed loss due to the taiigust (Fig. 27d).
10
Some qualifying remarks are necessary concerning the simulation. Without exception, pilots com- plained that the visual scene provided by the closed-circuit television display did not include all the visual cues normally available in real life. In particular they found it difficult to assess height and rate of descent when close to the ground, and hence to arrest the descent before touchdown. Perhaps as a result of practice, some pilots including those used in the tailgust experiment, were able to judge the landing be, tter than others. Although it is accepted that judgement of the flare did not match real life, arrangement of this experiment should permit the relative influence of autothrottle on tailgusts to be shown.
For the autothrottle to yield the benefits shown here it is important that the lags in the system be small. In a real system there are lags associated with the airspeed sensor, the throttle actuator and the engine response to throttle movement. In this simulation a single first order lag of value 1.25 sec was used to repre- sent the entire system. Its effect on the thrust response can be seen in Fig. 27d. If overall lags are equivalent to a larger value than this then the autothrottle will be less useful in countering tailgusts than has been shown here. Every effort is needed to keep system response times as short as possible.
A second factor related to the engines is that in the simulation the line of action of thrust was assumed to pass 2.3 ft below the aircraft's centre of gravity, thus producing a nose-up pitch change with increased thrust. In responding to a tailgust, therefore, the autothrottle would lead to an increase of incidence which helps to arrest the higher rate of descent due to the tailgust. (This effect was not present, of course, in the constant attitude flares reproduced on the computer.) Some sources, however, say that the airflow at the engine intake induces a nose-down pitching moment with increased thrust, so that the net pitch change with thrust is zero. If this is borne out in practice the autothrottle will perhaps be less effective in countering tailgusts than has been shown here. There was unfortunately insufficient time to repeat the experiment without thrust line offset.
7. Sidestep Manoeuvres.
During the simulation a number of approaches were flown with a low cloudbase (400-450 ft) and a laterally offset ILS azimuth beam, so that on breaking cloud it was necessary to sidestep to reach the runway. Sidesteps from lateral displacements of up to 375 ft were performed. Fig. 28 shows the times taken to perform the manoeuvres and the lateral distances covered. Also plotted are the manoeuvre called for in the flying qualities document TSS-523 (a sidestep s of 100 metres in a distance of 1000 metres, i.e. 12.8 sec at 150 kt) and the theoretical minimum manoeuvre time with a bank limit of 20 ° (from Ref. 25). On all but two of the approaches, peak bank angles ofl.ess than 20 ° were used.
Theoretical calculations 24 of the ability of slender wing aircraft to perform sidestep manoeuvres had indicated that large rudder angles would be required to co-ordinate a sidestep; failure to apply rudder would result in the development of adverse sideslip and hence a need for further aileron to obtain the required roll response. In these calculations the manoeuvre was specified by the bank angle time history; the control surface motions necessary to achieve this time history were computed. The three chosen bank angle functions and their resulting lateral displacement time histories are shown in Fig. 29.
Similar calculations have been performed using aerodynamic data relevant to this simulation and including the effects of autostabilization (but assuming that the autostabilizers had unlimited authority); the control angles required to perform the sidesteps, while suppressing sideslip exactly, have been calcu- lated. These angles, expressed as degrees of aileron per 100 ft of sidestep, are plotted as functions of manoeuvre time in Fig. 30 (curves A, B and C). Most of the sidesteps flown in the simulator were per- formed with roll autostabilizer effective, although in several of these manoeuvres rates of roll in excess of 4°/see were used, thus exceeding the authority of the roll damper. When the authority of the damper is exceeded or the damper is inoperative, the steady rate of roll obtainable per degree of aileron applied by the pilot is more than four times that obtainable with damper effective. Since the damper opposes the rate of roll generated by the ailerons by applying opposite aileron, the amount of aileron control surface movement obtained for a given control wheel displacement is reduced by the dampers, and hence the aircraft's response is reduced. The response to a given surface deflection is of course the same whether or not the damper is operational. In Figs. 30 and 31 the aileron angles referred to are the pilot's demanded angles, and do not equal the control surface angles if the damper is in use.
The peak control angles used during sidestep manoeuvres are plotted in Fig. 30, the points being
11
classified according to the amount of rudder used and the state of the roll damper. The simulator results for damper operational are grouped largely in the area between curves B and C whereas TSS-5 effectively calls for a vlue of~/s of less than 6.1 ° per 100 ft in 12.8 sec (as maximum ~ is 20°), which is somewhat better than the values of curve B. To achieve a low value of i/s, the pilot would have to perform a sidestep which was as near to being symmetrical, and preferably sinusoidal, as possible. However, in these tests the pilots were not specifically instructed to perform such a manoeuvre but to treat the situation as they would in normal operation, and as a result the values of ~/s obtained are not necessarily optimum ones. Some values are large because the pilot, although positioning the aircraft in line with the runway fairly rapidly, used the available time before touchdown to continue the sidestep until the aircraft was aligned closer to the runway centreline (see Fig. 31a, also shown as point (a) on Figs. 28 and 30). On other approaches the pilot performed highly unsymmetrical manoeuvres in which the peak bank angle for one part of the manoeuvre was very different from that for the second part (Fig. 31b). Other difficulties in interpretation of the sidesteps are the lack of definition of the end of the manoeuvre and the change of effective sidestep distance with heading error at the start of the manoeuvre (Fig. 2 Ref. 25). Corrections for initial heading have been made for the simulator results of Figs. 28 and 30; sidesteps with an initial error greater than 1-5 ° have not been plotted.
Thus for assessment of the largest sidestep possible in a given time, the optimum experimental values of ~/,s obtained should be considered. Fig. 31c shows a run for which a value of ~/s close to curve A was obtained ; the manoeuvre is well co-ordinated and the bank angle response is close to sinusoidal. The best values of ~/s for runs in which little rudder was used and roll stabilizer was effective throughout are in the area between curves B and C (e.g. Fig. 31 d). If rapid rates of roll were used and the autostabilizer saturated, more favourable values orals could be obtained (because the values of~/s are in terms ofpiloI's demanded angle and not of surface angle). Fig. 31e shows a manoeuvre where the pilot was trying to perform a large sidestep as rapidly as possible. Although little co-ordinating rudder was used and quite large sideslip angles developed, a sidestep which was close to the requirement of TSS-5 was performed with three- quarters of the available aileron.
Sidesteps with roll autostabilizer failed were still accelStable (though care was needed to avoid over- control), and were performed in similar times to those with damper effective. Values of ~/s were lower because of the higher roll rate available, and aileron angles were small (peak aileron angles for the 5 approaches shown were less than 6°).
Thus satisfactory sidesteps were performed with and without roll autostabilizer and the manoeuvre called for in TSS-5 was accomplished without using maximum aileron.
A revised form of roll autostabilizer, 'aileron stick boost', is now proposed for the prototype Concorde. This applies additional aileron proportional to the rate of control-wheel movement to counteract the effect of the damper while manoeuvring. Thus some of the aircraft's roll response lost to the damper will be restored by the stick boost and more favourable values of~/s should be possible.
8. Landings in Cross-Winds.
The same features that make a slender-wing aircraft sensitive to sideslip in its normal rolling behaviour are also important during landings in a cross-wind. These characteristics are a large value of rolling moment due to sideslip and a small moment of inertia in roll. With a conventional drifting technique 26, the controls are neutral and the aircraft points into wind while crabbing along the extended runway centreline. Just before touchdown the pilot must point the aircraft down the runway by 'kicking off drift', i.e. yawing the aircraft out of wind. Exposed to the full strength of the cross-wind, the aircraft will tend to roll and it has been suggested that the wing tip would be in danger of striking the ground. Judging when to apply the necessary rudder to 'kick off drift' had been difficult even in a small delta-wing aeroplane 26. Consequently there was great interest in studying the manoeuvre during this simulation exercise.
Several pilots landed in simulated cross-winds of up to 30 kt, with associated turbulence gusting about 10 kt. Results have been analysed for the two pilots most experienced in this simulation. Fig. 32a illustrates a landing by each pilot using a drifting technique in a cross-wind of 25 kt. In each case a rudder move- ment of 15. ° 5 sec before touchdown resulted in near zero drift angle at impact. An aileron input of about 7 stopped any tendency to roll out of wind. These pilots commented that holding wings level was not
12
difficult as roll control was good but yawing the aircraft required care as it responded slowly to rudder inputs. Achievement of a small drift angle at touchdown was difficult as lack of definition in the simulated external visual scene resulted in poor height and rate of descent judgement close to the ground. Pilots also commented that they lacked any strong sense of which way the aircraft was heading.
An alternative technique of sideslipping was also tried. With this method the aircraft points at the run- way and must be held in this position by using crossed controls (right rudder and left aileron for a cross- wind from the left). Just before touchdown the pilot must level the wings. Fig. 32b illustrates the final phase of a successful landing using this technique. Just over 1 sec before touchdown the bank angle was 10 °, but was reduced to zero at touchdown. Pilots commented that levelling the wings was very easy and preferable to yawing straight but that holding large control deflections (about half aileron and half rudder) for some time was most uncomfortable. The cramped simulator cockpit prevented free use of ailerons when large rudder angles were applied.
A landing using a mixture of these two techniques is shown in Fig. 32c. To reduce the drift in a 25 kt cross-wind to 5 ° required a bank angle of about 5 °. This mixed method had some advantages over either of the other techniques as it gave a quick manoeuvre to level the wings and avoided having large stick and pedal deflections during approach and flare.
Results for all techniques from a number of landings are shown in Figs. 33 and 34. Fig. 33 shows maxi- mum rudder and aileron angles used during each approach and landing. The theoretical value to trim the appropriate sideslip is also shown, together with dashed lines indicating limits of control travel used. A drifting approach made least demand on the controls and a sideslipping approach required the largest control angles. In many landings the pilot failed to remove all the drift (Fig. 34) but his difficulty in judging the moment of touchdown complicated the issue.
These tests showed, however, that a large slender wing aircraft could be landed successfully with a cross-wind of 25 kt without exceedii-ig touchdown limitations of drift angle, ground clearance or rate of descent.
9. Pilots' Comments.
This Section has been compiled from comments made by the pilots while flying the simulator, and from reports written later by many of them. Their remarks have been gathered into three sections concerning simulation validity, normal operation of the aircraft and operation under system failure conditions.
9.1. The Simulation.
Most pilot comments on, and criticisms of, the simulation, were concerned with the visual display. 'Height cues seem to disappear once you cross the threshold.' 'The visual presentation.., was good, but I found it very difficult to cope with pitch oscillations (with pitch damper disengaged) during the last 200 ft due to the lack of a natural horizon a n d . . , the complete lack of peripheral vision.' 'There is a lack of rate of descent information during the flare.' 'Pitch attitude is rather difficult to assess on the TV display.' Nearly all the pilots felt initially that the picture gave insufficient information of height and rate of descent in the flare and that, as a result, judgement of touchdown position and rate of descent was very difficult. This same result was obtained in flight tests 29 using a TV system, rather than direct vision, to provide an outside world display. Inadequate height and height rate information was available from the TV display, and other instruments had to be used. In the simulator, most pilots produced a marked improvement in touchdown performance after a few approaches had been flown. 'Initially the quality of definition of the pictorial display, with particular reference to the texture of the runway surface, made it very hard to make accurate depth assessment during the flare. This became progressively easier.' Another pilot wrote after the trial; 'I found that judgement of the height to commence flare was quite easy and that a reason- ably smooth touchdown could be achieved.' However, all pilots felt that their judgement of height and rate of descent, even with practice, was not as good as in real life. 'The limitations of the visual presentation prevented a consistent or accurate assessment of height.' Judgement of height appeared better than that of rate of descent, as some pilots were able tO predict correctly that they would touchdown within the next second or so, but were not aware that their touchdown rates of descent were high. These visual difficulties
13
should be borne in mind when considering the absolute values of touchdown data. Such problems are not unique to this simulator and simulation; they have been found in other facilities a°, in U.K. and U.S.A.
Many pilots also complained that the visual display gave the impression that they were flying on a glide path shallower than 3 °. As a result they tended to fly above the glide path once they transferred from instrument to visual flight, thus producing a steep final approach path when they neared the runway threshold and became aware that they were high. No positive reason has been found for this visual discrepancy, but it may be due to apparent foreshortening of the display, the 'horizon' being only 4 nm from the pilot, rather than at infinity.
The display was considered by most pilots to be satisfactory for performing a sidestep manoeuvre, although there were a few complaints of difficulty in assessing final alignment with the runway; pilots commented that this could occur in some real aircraft. Also, during cross-wind approaches, pilots often touched down with a substantial amount of drift, although they thought that they had kicked off all the drift. There were no real problems in setting up the drift angle required on the approach to follow the runway centreline.
A few of the taller pilots complained of the cramped nature of the cockpit and of the limited amount of seat and rudder pedal adjustment. Occasionally, particularly in cross-wind landings when large rudder angles were applied, the pilot's knee restricted the available aileron control.
Further criticisms of the simulator included deficiencies of the instrument display. It was felt that the rpm gauge and ILS indicator were rather too far from the centre of scan of the instruments; this increased the workload during raw ILS approaches. One pilot said that the scaling of the VSI was not sensitive enough for accurate flying.
9.2. Normal Operation.
In general, the handling of the simulated aircraft with all dampers and autothrottle engaged attracted little criticism. The light control forces were popular-- ' I found that the simulator handled very pleasantly. Aileron and elevator stick forces were very light and response was excellent.' 'The control forces were pleasantly light and control harmonization was good ' - - although the 'ram's horn' control wheel received some criticism from a few pilots. 'With a conventional wheel, pivoted near the centre of the wheel, one hand is tempering the force of the other hand. With the ram's horn and a low pivot point, one does not seem to have the same matching of hands and consequently has less fine roll control.' Because of the light stick forces and low static margin there was no need to retrim through the flight regime covered (approach, take-off or overshoot) (Fig. 6). The autothrottle system provided satisfactory speed holding in both calm and turbulent conditions although, with the system used, a little care was needed to ensure that the auto- throttle was engaged at the correct power setting and speed. Sidestep manoeuvres were performed 'with little more difficulty than with present jet aircraft.'
If the centre of gravity was moved further aft, control in pitch, especially in turbulence, became a little tiring: it was harder to find a suitable trim position, and there was a tendency for the pitch attitude to wander. More gentle control inputs were required to prevent over-controlling, and closer monitoring of the instruments was necessary to hold the glide path.
On several approaches an alternative form of pitch autostabilizer known as 'stick boost' was used (see Appendix A.4). This modified law had been proposed to counter some deficiencies of the standard autostabilizer law in steady turning flight. Details were received at too late a date for the law to be incor- porated in the main tests but two pilots flew approaches with this law for comparison. No real differences between the two laws were found for the approach though less stick movement was needed to initiate the flare with stick boost and it was possible to delay the start of the flare or to flare more rapidly if required.
9.3. Operation with System Failures. In addition to describing the handling of the aircraft with system failures, the pilots were asked to
consider under what operational conditions they would tolerate the failure. They were subjected to these failures in both calm air and turbulence. Since the probability of losing the autothrottle or an entire autostabilizer channel (pitch, roll or yaw) is intended to be no higher than 10-5 per hour for a 3 hour flight, the combination of such a failure with heavy turbulence is even less likely.
14
9.3.1. No autothrottle. Pilots were unanimous on two points of operation without autothrottle; firstly, that the workload was far higher than with autothrottle, and secondly that coarse throttle move- ments were required to correct all but the smallest speed errors. However, those airline pilots who had heard of the possible problem of speed control during flight below minimum drag speed thought the task was easier than they expected. (Test pilots who have flown the BAC 221 slender-wing research aircraft have also been pleasantly surprised 27 by the ease of speed control in the BAC 221 on the 'backside of the drag curve'.) All pilots felt that a satisfactory performance could be achieved without autothrottle, although a number of airline pilots stated that they would not wish to take-off with an unserviceable autothrottle. (In this exercise the pilot was flying the aircraft unaided. If control of speed were delegated to a second crew member the above restriction might not apply.)
Fig. 35 shows attempts to correct a speed error with the use of gentle (trace A) and coarse (trace B) throttle movements. In trace A the slow power reduction is insufficient to compensate for the reduction in drag due to the speed increase, and speed continues to rise. In trace B a sharp thrust reduction soon corrects the speed error and the trim power setting can be reapplied. Fig. 36 shows the need for frequent throttle corrections to obtain good speed holding; for comparison an approach with the simulator representing a current jet transport aircraft (VC 10) in a similar turbulence level is also shown. The pilots stressed the need for frequent monitoring of airspeed as speed errors could build up quite rapidly and large thrust changes would be needed to recover to the required condition. Speed behaviour under autothrottle control is shown in Fig. 37. Fig. 38 illustrates an inadvertent speed excursion which occurred between approaches; the pilot was supposed to be at 1200 ft height and 150 kt. While discussing his previous approach he allowed the speed to decrease; the gentle throttle increases prior to A did not check the speed decay, and at A he realised the need for a large increase in power. The initial effect of this power increase was to increase the pitch attitude (due to the trim change with power) and the speed showed little tendency to recover; only by pushing forward on the stick as well as by application of full power was speed recovered.
9.3.2. No pitch autostabilizer. Handling with pitch autostabilizer failure provoked the most adverse comments. 'The aircraft appeared to be unstable in pitch and I found it very easy to aggravate this condition.' 'Whilst the aircraft was controllable, only very light control pressures were required and any attempt to chase the oscillations resulted in an increase in amplitude.' Fig. 39 shows part of an approach in calm conditions; note the comparative steadiness of the attitude trace at B, when elevator activity is low, compared with that at A where the pilot inputs are tending to force the pitching oscillation. Almost all the pilots felt that an approach and landing would be possible in calm conditions, but assess- ments of the task in turbulence varied greatly among pilots. Most test pilots and some airline pilots thought that a safe landing could be achieved, even in moderte to heavy turbulence, but other airline pilots suggested diverting to an airfield with a low turbulence level. On the basis of this simulation and his limited experience, one pilot stated that even in calm conditions he would wish to divert to the longest available runway. Some pilots considered that complete pitch autostabilizer failure must be an extremely remote possibility and that careful thought about training demonstration would be necessary.
Much of the difficulty encountered by the pilots occurred during the final visual phase of the approach ; control while on instruments was more satisfactory. The difficulty of assessing pitch attitude and glide path from the TV visual system may have complicated the task. In reality there might be more time to set up and hold a steady approach path thus avoiding any major last-minute corrections to the flight path to achieve a satisfactory touchdown.
9.3.3. No roll autostabilizer. Lack of roll autostabilizer in calm conditions presented no major difficulties as long as control inputs Were kept to a minimum, and only mild use made of the ailerons to correct bank errors. Even gentle control inputs tended to produce a steady rocking of the aircraft in roll, and pilots found it wise to accept this rocking and not to try to damp out the motion. Fig. 40 shows the roll behaviour of the aircraft in calm air. In Fig. 40b the pilot is attempting to check the oscillation ; aileron activity is high but excursions in bank angle are no smaller than when he accepts the oscillation and only uses the aileron to correct the mean flight path (Fig. 40a).
15
The same comments apply to flight in turbulent conditions; pilots preferred to tolerate the rocking of the aircraft while the bank excursions remained less than 5 or 6 °, and to use the aileron only for larger bank errors and for obtaining wings level at touchdown. It was noticed that even though the bank angle might oscillate through + 5 °, there was little deterioration in heading performance, and that following of the ILS beam was only slightly harder than with fully stabilized aircraft. These comments are sup- ported 2v by experience in the HP 115 and BAC 221 slender-wing research aircraft. In rough air pilots prefer to allow these aircraft to rock by up to _+ 10 ° of bank, with a low pilot workload. Roll response to gusts was so rapid that pilots felt that a large sidegust just before touchdown could produce a bank angle which would endanger the wing tip or engine box.
A few pilots felt th~lt their tendency to overcontrol in roll might be :~ggravated by the ram's horn stick and that with a conventional control wheel it might be possible to provide the precise inputs needed to counter the roll oscillation.
Because of the behaviour in turbulence of the simulated aircraft without a roll (or pitch) autostabilizer, several pilots suggested that it might be necessary, if the handling characteristics in a failure situation were realistic, to divert to another airfield to find more suitable weather conditions. Such action is taken now in certain aircraft if a yaw damper fails completely. With the proposed reliability levels in the Con- corde, such a diversion would be rare, and the aircraft handling may, in any case, prove to be better than in the simulation for the final phases of the approach.
9.3.4. En.~line failure. On a number of approaches an engine was failed without warning at heights in the range 200-500 ft. No difficulties were experienced either in completing the approach and touchdown or in overshooting. A few pilots thought that the yaw resulting from engine failure was rather large, but these were pilots currently flying VC 10 aircraft, in which the engines are close to the aircraft centreline.
10. Simulator Validation. To assess the validity of various aspects of this simulation, two other simulations, of aircraft that had
acf?fally flown, were set up. The first of these, a VC 10, was programmed as a calibration exercise prior to the SST.landing study as landings using the TV display had not been tried before on this simulator. Few detailed flight records were available for comparison with simulator results but assessment of the simulation by test pilots from the aircraft manufacturer was generally favourable. The simulated aircraft was described as 'a near relative of the VC 10' in terms of its response. Landing was found to be difficult as pilots could not judge height above the ground nor detect high rates of descent close to the ground. Performing sidestep manoeuvres and lining up with the runway, however, were found to be quite straight- forward.
The second relevant simulation, set up after the Concorde study, was of the BAC 221, an aircraft used by R.A.E. Bedford for research into the behaviour of slender-wing configurations. The handling qualities of this aircraft should be similar to those of Concorde in many respects, particularly in its lateral behaviour, although the great difference in size and hence in the time scale of some of the aircraft's responses should be remembered. As the BAC 221 has no autostabilization, its handling is more akin to Concorde without autostabilizers than to the fully stabilized aircraft. Two of the R.A.E. pilots who flew the Concorde simulation were familiar with the BAC 221 aircraft and also took part in the BAC 221 simulation. Quantit- ative results from the actual aircraft were few, so comparison had to be largely on a qualitative basis, although the aircraft had not flown during the 10 months prior to the simulation.
The overall impression of the simulation was that the lateral handling and speed stability were well represented within the limits of the pilots' memories, but that the pitch response of the simulated aircraft was too lively. Comparison of flight and simulator records supported this impression. Recent wind-tunnel tests suggest that the elevator power used may have been high. Other possible reasons for the discrepancy could be errors in the estimate of aircraft pitch inertia or effects resulting from the lack of correct motion cues, of greater importance in the simulation of a small, responsive aircraft than in that of a large one. It should be noted that this simulation was prepared entirely on the basis of wind tunnel and theoretical data; no flight results were used.
16

As mentioned in Section 9, control problems associated with the speed stability characteristics of the BAC 221 aircraft were not as severe as expected; the simulation matched the aircraft in this respect. Sidestep manoeuvres and cross-wing landings were performed in the simulator lbr comparison wlm flight; control usages in the aircraft and simulator were similar. In the sidestep manoeuvres the same ability to perform sidesteps without co-ordinating rudder that was noticed in the Concorde simulation was also found in flight on the BAC 221.
A more detailed discussion of the comparison between BAC 221 aircraft and simulation is given in Ref. 31. Handling qualities of the BAC 221 in flight are described by Barnes 32 and Dee 33.
11. Conclusions.
A simulation of the prototype Concorde has been flown by 14 test pilots and 8 airline pilots. Aircraft data available at December 1965 was used to set up the simulation. As the general purpose research simulator at R.A.E. Bedford was used, neither the cockpit environment nor the flight instruments matched the design but aircraft responses closely resembled Concorde behaviour expected at that time. Much detailed work has since been undertaken on the simulators at Filton and Toulouse, with the result that many changes and improvements have been made to Concorde's flying qualities.
The tests described in this Report have examined the handling qualities of the aircraft during the instrument approach and visual landing phases of flight and included flying without autostabilizers. The principal results are as follows.
(1) The handling qualities of the simulated aircraft in its fully autostabilized state were good. (2) Loss of the pitch damper provoked the strongest criticisms. (3) Despite the approach speed being more than 60 kt below minimum-drag speed, loss of the auto-
throttle did not pose insurmountable difficulties, even with single pilot operation. Manual speed during the approach required coarse use of throttle lever. This may be a feature requiring special attention during training.
(4) Retaining the autothrottle in operation throughout the landing flare seems to be desirable to prevent large speed losses and hence high pitch attitude at touchdown, with its associated danger of the tail bumper striking the ground.
(5) The autothrottle can also compensate for the hazardous aircraft response to tailgusts during landing but for this benefit fully to be realised the autothrottle and engines must have good response characteristics.
(6) Rates of descent at touchdown were generally high. A comparative simulation of a subsonic jet transport aircraft in current airline service produced equally unsatisfactory results. It seems that the deficiencies lie with the simulator rather than with the aircraft simulated. Failure to produce a truly satisfactory simulation of touchdown was disappointing but not unexpected in view of experiences in other simulators. The main problem was a visual display from which pilots found it difficult to judge height and rate of descent close to the ground. Nevertheless, good landings, with a low rate of descent at touchdown, were performed on a number of occasions, indicating that the aircraft is capable of being landed smoothly, but in view of the difficulties associated with the simulator an assessment of the probable statistical spread of touchdown conditions is not possible on the basis of the present results.
(7) Sidesteps manoeuvres were performed easily with and without roll damper operating. The TSS-5 requirement of a 100 m sidestep in 1000 m along the ground was met without difficulty.
(8) Cross-wind landings were made satisfactory with a 25 kt cross component. Low drift and low rate of descent at touchdown were obtained but the proviso of item (6) also applies. Crabbed approaches made least demand on aileron and rudder, while sideslipping approaches made most demand, as well as being uncomfortable.
This supersonic transport simulation has revealed no new problem areas in the approach and landing phases of flight but compared with earlier results has disclosed a shift of emphasis from lateral difficulties to longitudinal ones. On the credit side the simulation has shown that in some areas the handling situation is perhaps better than had been predicted by theory.
17
CO
CL, CD, Cy
Ct, Cm, Cn
By
Dz
F(h)
#
h
hw
h~
Ixx, lrr, lzz
kl, k2, ks
k4, k5
L , M , N
I v, 1. nv, n,
P
p, q, r
S
S
S
T
T
ATo
t
V
Vro
Vo
X
Y
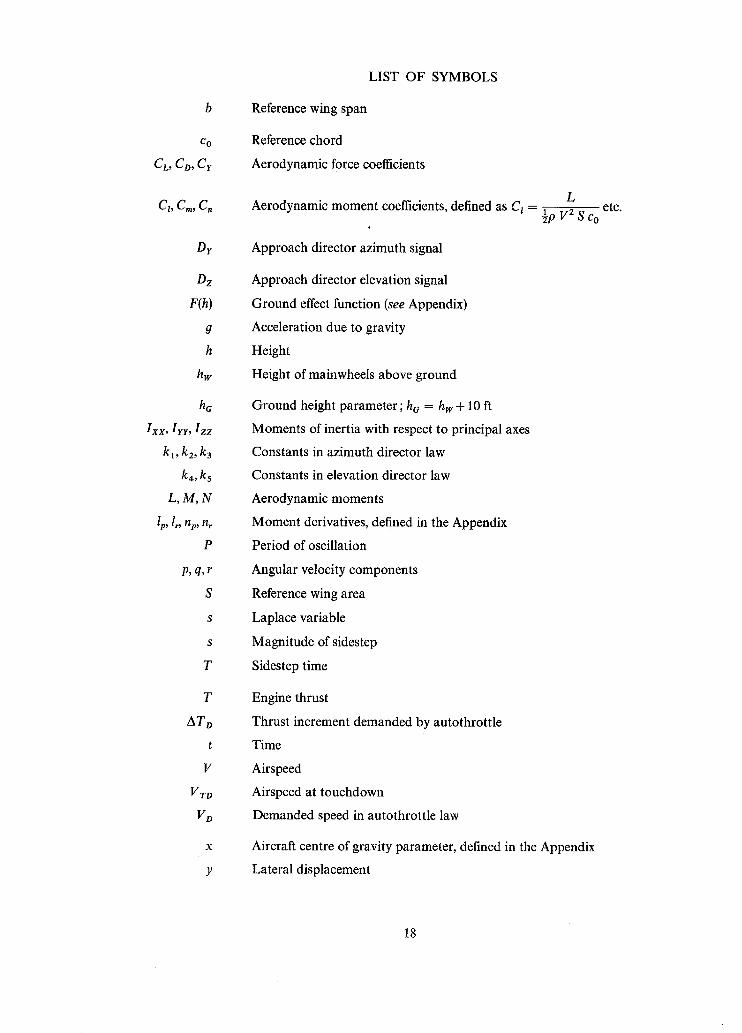
LIST OF SYMBOLS
Reference wing span
Reference chord
Aerodynamic force coefficients
Aerodynamic moment coefficients, defined as C, = L
½p V 2 S Co
Approach director azimuth signal
Approach director elevation signal
Ground effect function (see Appendix)
Acceleration due to gravity
Height
Height of mainwheels above ground
Ground height parameter; ha = hw+ 10 ft
Moments of inertia with respect to principal axes
Constants in azimuth director law
Constants in elevation director law
Aerodynamic moments
Moment derivatives, defined in the Appendix
Period of oscillation
Angular velocity components
Reference wing area
Laplace variable
Magnitude of sidestep
Sidestep time
Engine thrust
Thrust increment demanded by autothrottle
Time
Airspeed
Airspeed at touchdown
Demanded speed in autothrottle law
Aircraft centre of gravity parameter, defined in the Appendix
Lateral displacement
etc.
18
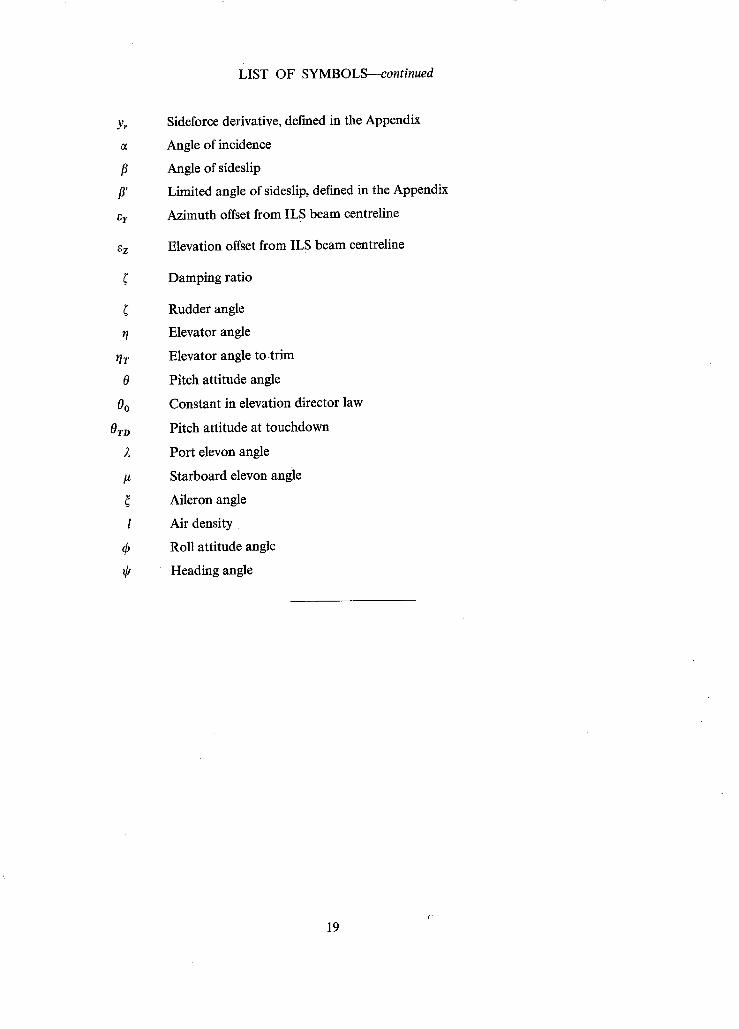
LIST OF SYMBOLS--continued
Yr
8'
8Z
~r
0
Oo
OTo
l
Sideforce derivative, defined in the Appendix
Angle of incidence
Angle of sideslip
Limited angle of sideslip, defined in the Appendix
Azimuth offset from ILS beam centreline
Elevation offset from ILS beam centreline
Damping ratio
Rudder angle
Elevator angle
Elevator angle to-trim
Pitch attitude angle
Constant in elevation director law
Pitch attitude at touchdown
Port elevon angle
Starboard elevon angle
Aileron angle
Air density
Roll attitude angle
Heading angle
f-
19
No. Author(s) 1 D.H. Perry, L. H. Warton
and C. E. Welbourn
2 B.N. Tomlinson and .. T. Wilcock
3 D.H. Perry . . . . . .
4 D.H. Perry and A. McPherson
M. D. White, R. S. Bray a n d . . G. E. Cooper
M. D. White, M. Sadoff, .. R. S. Bray and G. E. Cooper
7 W.J .G. Pinsker . . . .
8 W.J .G. Pinsker . . . .
9 W.J .G. Pinsker . . . .
10 T.J. Williams
11 T.J. Williams . . . . . .
12 BAC/Sud . . . . . .
REFERENCES
Title, etc. A flight simulator for research into aircraft handling characteristics. A.R.C.R. & M. 3566 (1966).
A piloted simulation of the take-off of a supersonic transport aircraft, with and without a take-off director.
A.R.C.R. & M. 3594 (1967).
Flight simulators and the study of aircraft handling characteristics. Contained in Symposium on aircraft take-off and landing
problems. R.A.E. Report DDI, p. 84 (1963).
A flight simulation study of the handling characteristics of a slender wing supersonic transport aircraft at landing approach speeds.
A.R.C.R. & M. 3616 (1966).
Some design problems of supersonic transport as identified in piloted-simulator studies.
IAS Paper ICAS-50 (1962).
Assessment of critical problem areas of the supersonic transport by means of piloted simulators.
IAS Paper 62-20 (1962).
Features of large transport aircraft affecting control during approach and landing.
AGARD Report 421 (1963). Also in Symposium on aircraft take-off and landing problems. R.A.E. Report DD1 (1963).
Some observations on the dynamics of large slender aircraft. AGARD Flight Mechanics Panel, Cambridge (1966). AGARD Conference Proceedings No. 17. A.R.C. 28 439.
The landing flare of large transport aircraft. A.R.C.R. & M. 3602.
Supersonic transport aircraft--low speed wind tunnel tests. British Aircraft Corporation (Operating) Ltd., Filton Division,
Wind Tunnel Service Report WT460. SST/B-76D-24/3133 (1964).
Supersonic transport aircraft--low speed wind tunnel tests on the prototype aircraft configuration.
British Aircraft Corporation (Operating) Ltd., Filton Division, Wind Tunnel Service Report WT470.
SST/B-76D-24/3223 (1965).
SST Aerodynamic Data Volume I. Sheets 1.16.6, 1.16.9, 1.17.16, 1.1.4, 1.1.5, 1.1.6 (1964).
20
No. Author(s)
13
14 D.J. Lerman . . . .
15 T.W. Brown . . . .
16 R.M. Howe . . . . . .
17 H.R. Hopkin . . . . . .
18 B. Etkin . . . . . .
19 R.J. Wilson and R. R. Larson
20 A.M. Peiser and W. Wilkerson
21
22 J.W. Stickle and N. S. Silsby..
23
24 B.N. Tomlinson . . . .
25 D.H. Perry, W. G. A. Port .. and J. C. Morrall
REFERENCES--continued
Title, etc.
Supersonic transport--Take-off and landing performance--basic da ta and assumptions.
British Aircraft Corporation (Operating) Ltd., Filton Division, SST/B72A-02.1/1960 Issue 2 (1964).
Side forces and braking on rolling tyres. British Aircraft Corporation (Operating) Ltd., Filton Division,
Aero Note/Misc/156 Issue 1 (1966).
Supersonic transport--Take-off simulation equations. British Aircraft Corporation (Operating) Ltd., Filton Division,
SST/B72A-04.2/2764 (1965).
Coordinate systems for solving the three-dimensional flight equations.
WADC Technical Note 55-747, TIL P.65160 (1956).
A scheme of notation and nomenclature for aircraft dynamics and associated aerodynamics.
To be published as A.R.C.R. & M. 3562 (1966).
Dynamics of flight, pp. 213-221. John Wiley & Sons Inc. New York (1959).
Statistical analysis of landing-contact conditions for the XB 70 airplane.
NASA TN D-4007 (A.R.C. 29941) (1967).
A method of analysis of V-G records from transport operations. NACA Report 807 (1945).
HS 121 Trident--Landing measurements at Heathrow during BEA Service.
HS Auto Controls/RNB/50 Issue 2. Hawker Siddeley Aviation Ltd. Hatfield.
An investigation of landing-contact conditions for a large turbojet transport during routine daylight operations.
NASA TN D-527 (1960).
Supersonic transport aeroplane flying qualities. TSS Standard No. 5 (1964).
An extensive theoretical study of the ability of slender-wing aircraft to perform sidestep manoeuvres at approach speeds.
A.R.C.R. & M. 3359 (1962).
A flight study of the sidestep manoeuvre during landing. A.R.C.R. & M. 3347 (1961).
21
No. Author(s)
26 K.J. Staples ..
27 R.W. Millward .. ..
28 J.W. Stickle . . . . . .
29 B.R. Kibort and .. F. J. Drinkwater III
30 B.D. Armstrong . . . .
31 T. Wilcock . . . . . .
32 C.S. Barnes and O. P. Nicholas
33 F.W. Dee, R. Rose and O. P. Nicholas
REFERENCES--continued
Title, etc.
Some flight measurements of crosswind landings on a small delta aircraft (Avro 707A).
A.R.C.R. & M. 3476 (1965).
Low speed handling of slender deltas. Presented at International Technological Session of the Society
of Experimental Test Pilots Symposium, Los Angeles, Sept. 1967. A.R.C. 29 899.
An investigation of landing-contact conditions for two large turbojet transports and a turboprop transport during routine daylight operations.
NASA TN D-899 (1961).
A flight study of manual blind landing performance using dosed circuit television display.
NASA TN D-2252 (1964).
Difficulties with the simulation of aircraft landings. R.A.E. Technical Report 68116 (t968) A.R.C. 30557.
A simulation of the low speed handling of the BAC 221 slender wing research aircraft.
R.A.E. Technical Report 69257 (1969).
Preliminary flight assessment of the low-speed handling of the BAC 221 ogee-wing research aircraft.
A.R.C.C.P. 1102 (1967).
Brief flight tests of crosswind landings and side-step manoeuvres on the BAC 221 aircraft.
R.A.E. Technical Report 68251 (1968) A.R.C. 30959.
22
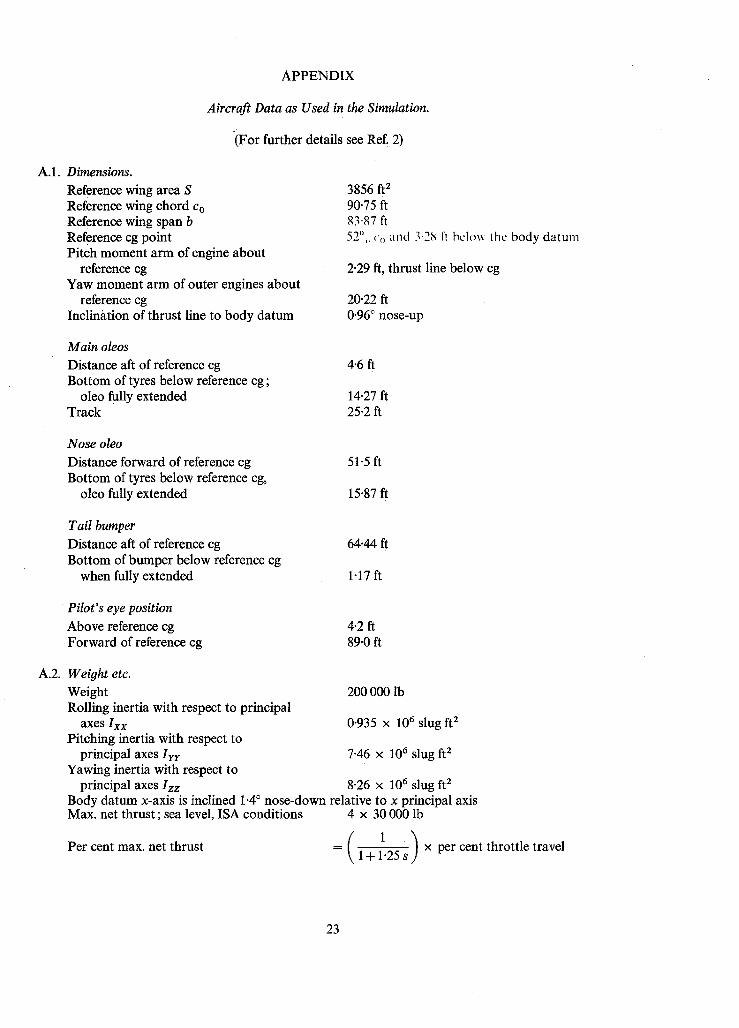
APPENDIX
Aircraft Data as Used in the Simulation.
(For further details see Ref. 2)
A.1. Dimensions. Reference wing area S Reference wing chord c o Reference wing span b Reference cg point Pitch moment arm of engine about
reference cg Yaw moment arm of outer engines about
reference cg Inclimttion of thrust line to body datum
3856 ft 2 90.75 ft 83.87 ft 52",, ~,, and 3.28 ft below lhc body datum
2.29 ft, thrust line below cg
20.22 ft 0.96 ° nose-up
Main oleos Distance aft of reference cg Bottom of tyres below reference cg;
oleo fully extended Track
4.6 ft
14.27 ft 25.2 ft
Nose oleo Distance forward of reference cg Bottom of tyres below reference cg,
oleo fully extended
51-5 ft
15.87 ft
Tail bumper Distance aft of reference cg Bottom of bumper below reference cg
when fully extended
64.44 ft
1.17 ft
Pilot's eye position
Above reference cg Forward of reference cg
4'2 ft 89"0 ft
A.2. Weight etc. Weight 200 000 lb Rolling inertia with respect to principal
axes Ixx 0-935 × 10 6 slug ft 2 Pitching inertia with respect to
principal axes Iyr 7-46 × 106 slug ft z Yawing inertia with respect to
principal axes Izz 8.26 × 10⁶ slug ft 2 Body datum x-axis is inclined 1.4 ° nose-down relative to x principal axis Max. net thrust; sea level, ISA conditions 4 × 30 000 lb
Per cent max. net thrust - 1 + 1.25 s x per cent throttle travel
23
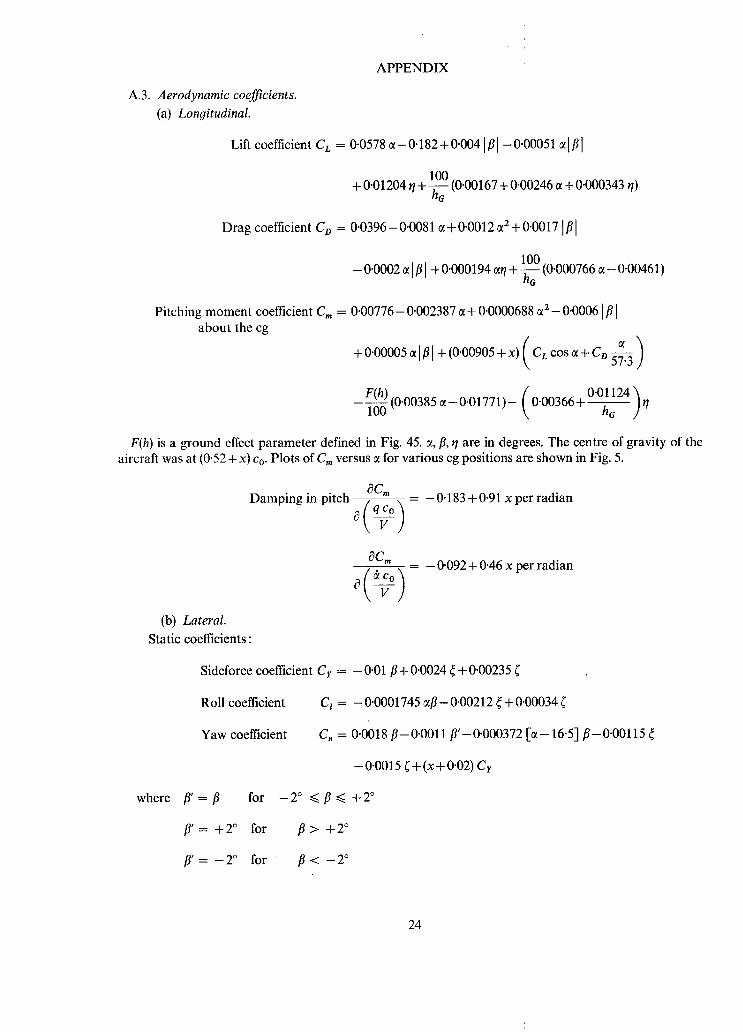
APPENDIX
A.3. Aerodynamic coefficients. (a) Lonoitudinal.
Lift coefficient CL = 0-0578 ~--0.182+0.0041/31-000051 ~l~l
+ 0"01204 r/+ lh~ (0'00167 + 0"00246 ~t + 0"000343 q)
Drag coefficient CD = 0.0396- 0.0081 ct + 0.0012 ~2 + 0.0017 I fll
0.0002 ct I fl I + 0.000194 ~q + ~--~ (0.000766 ~ - 0.00461)
Pitching moment coefficient Cm = 0.00776- 0.002387 ~ + 0.0000688 ~2 __ 0"0006 I/3 I about the cg
+ 0.00005 ~ I~1 + (0.00905 + x) c~ cos ~ + c o ~
( 0"00366-t 0"01124 "It/ -F(h---~)(0"00385100 :¢-0"01771)- he ,]
F(h) is a ground effect parameter defined in Fig. 45. a, fl, r/are in degrees. The centre of gravity of the aircraft was at (0.52 + x) c o. Plots of C,, versus ~ for various cg positions are shown in Fig. 5.
0c,. Damping in pitch 0 ( __~/t -0.183 + 0.91 x per radian
OC,, - 0-092 + 0.46 x per radian
(b) Lateral. Static coefficients:
Sideforce coefficient Cr = - 0.01/3 + 0.0024 ~ + 0.00235 (
Roll coefficient C~ = -0.0001745 ~/3-0.00212 4+0"00034 (
Yaw coefficient C, = 0.0018/3-0.0011 fl'-0.000372 [ ~ - 16.5]/3-0.00115
-0-0015 ~+(x+0"02) Cr
where f l ' = f l for - 2 ° ~<fl~< +2 °
i f = +2 ° for f l > +2 °
f l ' = - 2 ° for f l < - 2 °
24
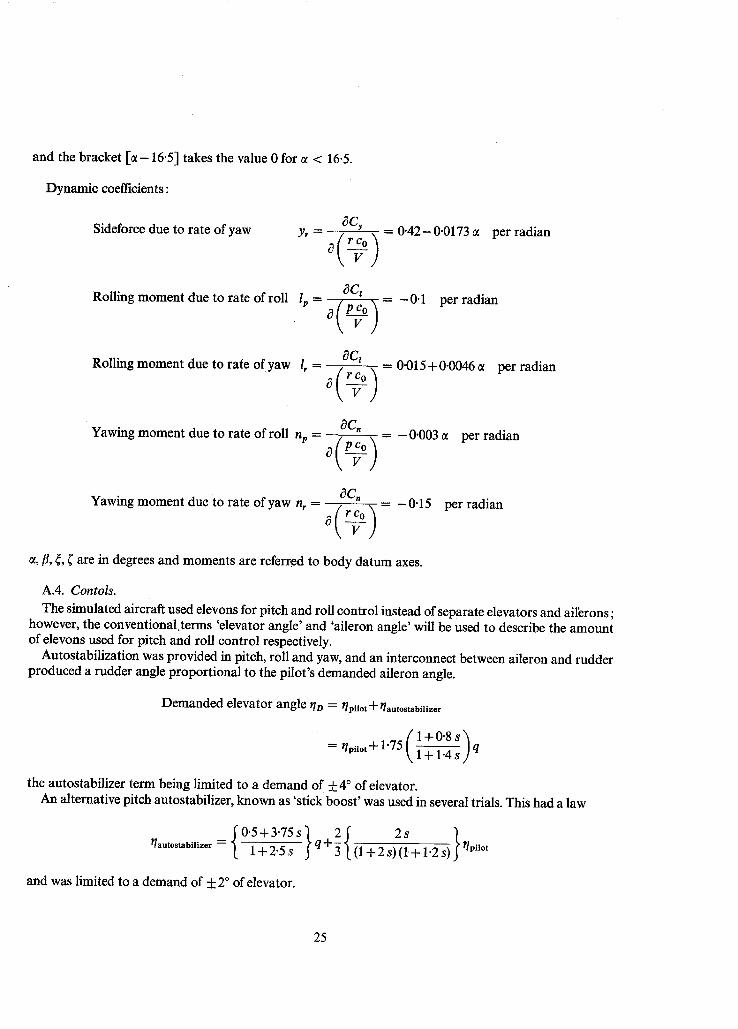
and the bracket [ ~ - 16.5] takes the value 0 for ~ < 16.5.
Dynamic coefficients:
Sideforce due to rate of yaw y, = - - = 0"42-0.0173 per radian
Rolling moment due to rate of roll Ip = t3C~ = -0 .1 per radian
Rolling moment due to rate of yaw l , = ~Cz
= 0.015+0.0046 a per radian
Yawing moment due to rate of roll np = - - = -0"003 ~ per radian
Yawing moment due to rate of yaw n, = - - = -0 .15 per radian
¢¢,fl, ~, ( are in degrees and moments are referred to body datum axes.
A.4. C o n t o l s .
The simulated aircraft used elevons for pitch and roll control instead of separate elevators and ailerons; however, the conventional.terms 'elevator angle' and 'aileron angle' will be used to describe the amount of elevons used for pitch and roll control respectively.
Autostabilization was provided in pitch, roll and yaw, and an interconnect between aileron and rudder produced a rudder angle proportional to the pilot's demanded aileron angle.
Demanded elevator angle t/O = t/pilot31-t/autostabilizer
1 + 0 . 8 s ) = t/pilot + 1.75 1 + 1-4 s q
the autostabilizer term being limited to a demand of + 4 ° of elevator. An alternative pitch autostabilizer, known as 'stick boost ' was used in several trials. This had a law
= ~ 0'5+3.75 s t/autostabiliz©r ~ 1 ~--"~'5 S
and was limited to a demand of __+ 2 ° of elevator.
25

APPENDIX
Demanded aileron angle ¢o = ~pilot + ~autostabilizer
= ~pilot + P
the autostabilizer term being limited to a demand of ___ 4 ° of aileron. %ilot and ~vilot were subject to the control mixing envelope of Fig. 41 which shows the maximum avail-
able aileron as a function of elevator angle. The elevon control system lags were represented by a first order lag of time constant 0.1 sec and a rate limit of 30°/sec.
and
Port elevon angle 2 = - - l + 0 . 1 s (~D"~?~D)
Starboard elevon angle # - - - l + O - l s (¢o-~to)
resultant 'elevator angle' r/ -
resultant 'aileron angle' ~ = - -
2
2 + #
2
The rudder control system was assumed to have no lags and the rudder angle was given by
= ~pilot + ~autostabilizer + ~interconnect
4$ ~-- ~pilot+ 1~ - ~ r + 0 " 2 ~pilot
the autostabilizer term being limited to a demand of +4.5 ° of rudder. Details of feel forces and gearings for each control are given in Figs. 42-44.
A.5. Autothrottle law.
Demanded thrust AT D = - 2000 1 + ~ ( V - VD) + 2500 1 + 10 S
where V = airspeed in knots
V D = selected airspeed in knots
0 = pitch rate in degrees/sec
s = Laplace operator.
ATD is limited to +_25 000 lb.
1 When I V - VDI is greater than 6 kt the ~ ( V - VD) term is prevented from integrating.
26
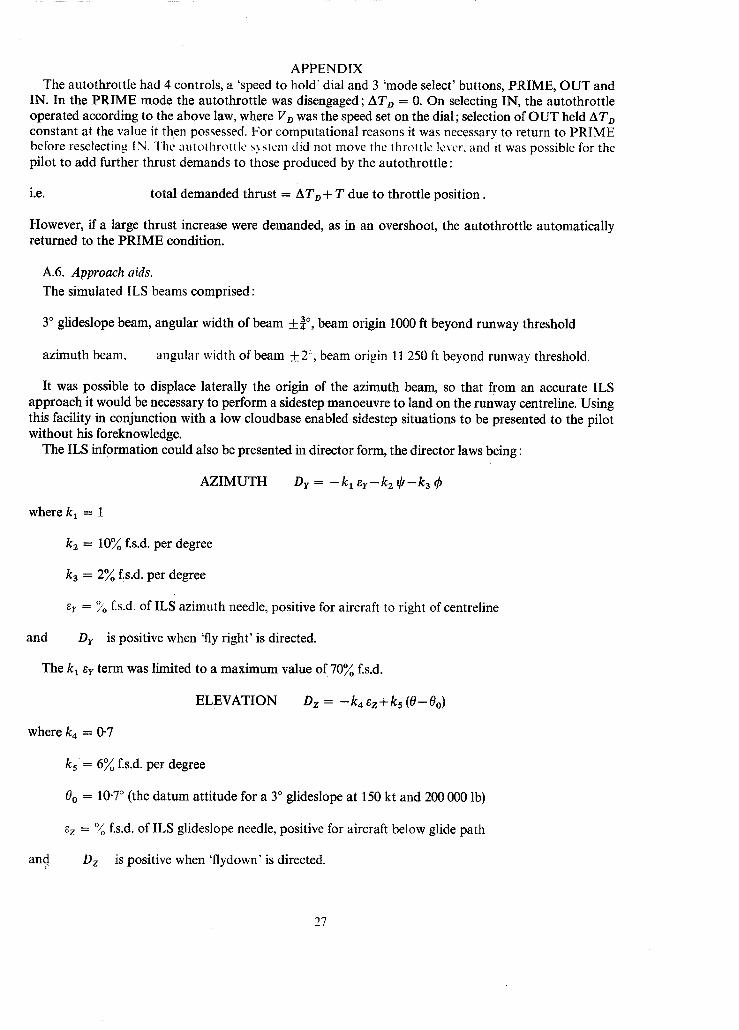
APPENDIX The autothrottle had 4 controls, a 'speed to hold" dial and 3 'mode select' buttons, PRIME, O U T and
IN. In the PRIME mode the autothrottle was disengaged; ATD = 0. On selecting IN, the autothrottle operated according to the above law, where Vo was the speed set on the dial; selection of O U T held AT D constant at the value it then possessed. For computational reasons it was necessary to return to PRIME before reselecting IN. The autolhrottlc .~ stcna did not move the throltlc lever, and it was possible for the pilot to add further thrust demands to those produced by the autothrottle:
i.e. total demanded thrust = A T o + T due to throttle position.
However, if a large thrust increase were demanded, as in an overshoot, the autothrottle automatically returned to the PRIME condition.
A.6. Approach aids.
The simulated ILS beams comprised:
3 ° glideslope beam, angular width of beam -F~ °, beam origin 1000 ft beyond runway threshold
azimuth beam, angular width of beam +2 ~, beam origin 11 250 ft beyond runway threshold.
It was possible to displace laterally the origin of the azimuth beam, so that from an accurate ILS approach it would be necessary to perform a sidestep manoeuvre to land on the runway centreline. Using this facility in conjunction with a low cloudbase enabled sidestep situations to be presented to the pilot without his foreknowledge.
The ILS information could also be presented in director form, the director laws being :
AZIMUTH
where kl = 1
k 2 = 10~o f.s.d, per degree
k a = 2 ~ f.s.d, per degree
Dr = - k l 8r-k2 C-k3 4'
and
The kl er term was limited to a maximum value of 70~ f.s.d.
ELEVATION Dz = - k4 ez + ks ( 0 - 0o)
~r = ~o f.s.d, of ILS azimuth needle, positive for aircraft to right of centreline
Dr is positive when 'fly right' is directed.
where k4 = 0.7
and
k s = 6~o f.s.d, per degree
0 o = 10.7 ° (the datum attitude for a 3 ° glideslope at 150 kt and 200 000 lb)
ez = ~ f.s.d, of ILS glideslope needle, positive for aircraft below glide path
D z is positive when 'flydown' is directed.
27
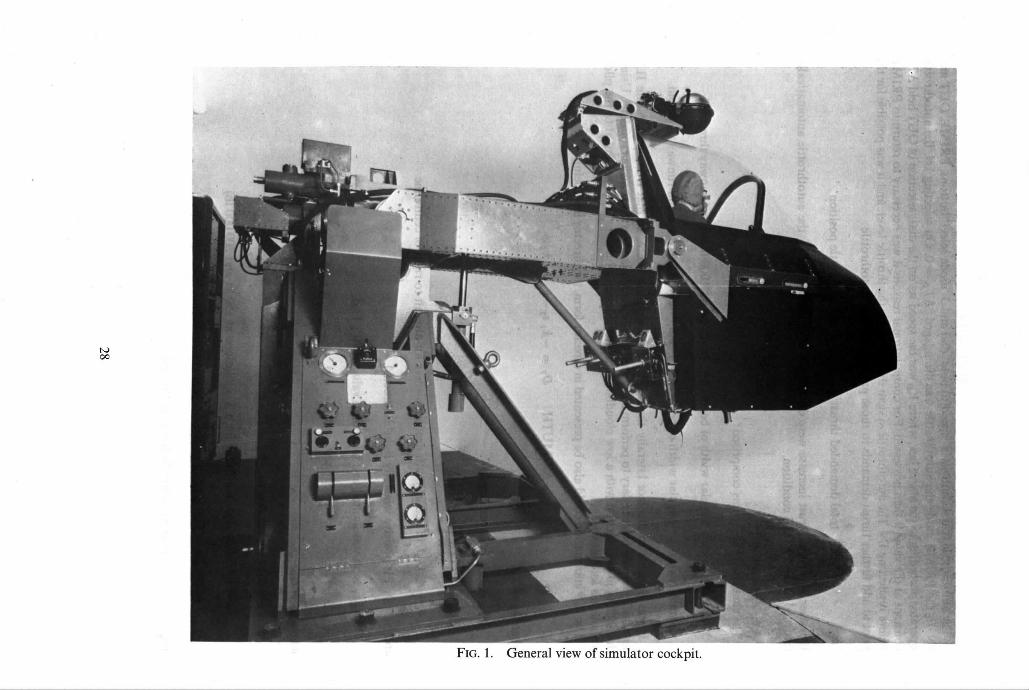
r l l
. . ~FI
FIG. 1.
e \
• i;: ~.
General view of simulator cockpit.
+5 , ~-+,
. . . . %
r . . . ~ i l
: .. :tTiJ~; • u ~ , ) i ~ : - , ~ , ~
• ;q
, : . . .

t,O
. t
,¢,
FIG. 2. Flight instruments and television display.
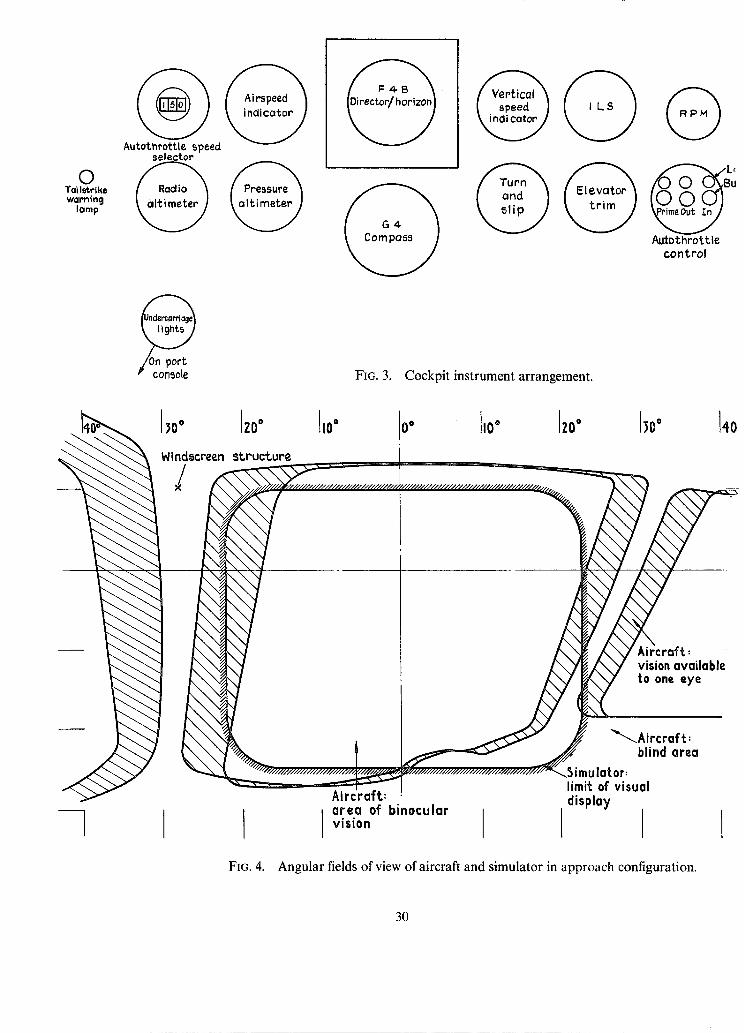
© Toi I~rike warning
lamp
Autothrottle speed selector @
FIG. 3. Cockpit instrument arrangement.
U
Autothrottte control
}0 ° ZO o
Windscreen s t ruc tu re
I10 0 ° I0 ° ZO ° 300
Ai rc ra f t : -~- vision available to one eye
FIG. 4.
Airc';raft: ' ar.e.a of b inocu lar v is ion
" " - - .A i r c ra f t : blind area
..Simulator: limit of visual display
I Angular fields of view of aircraft and simulator in approach configuration.
30
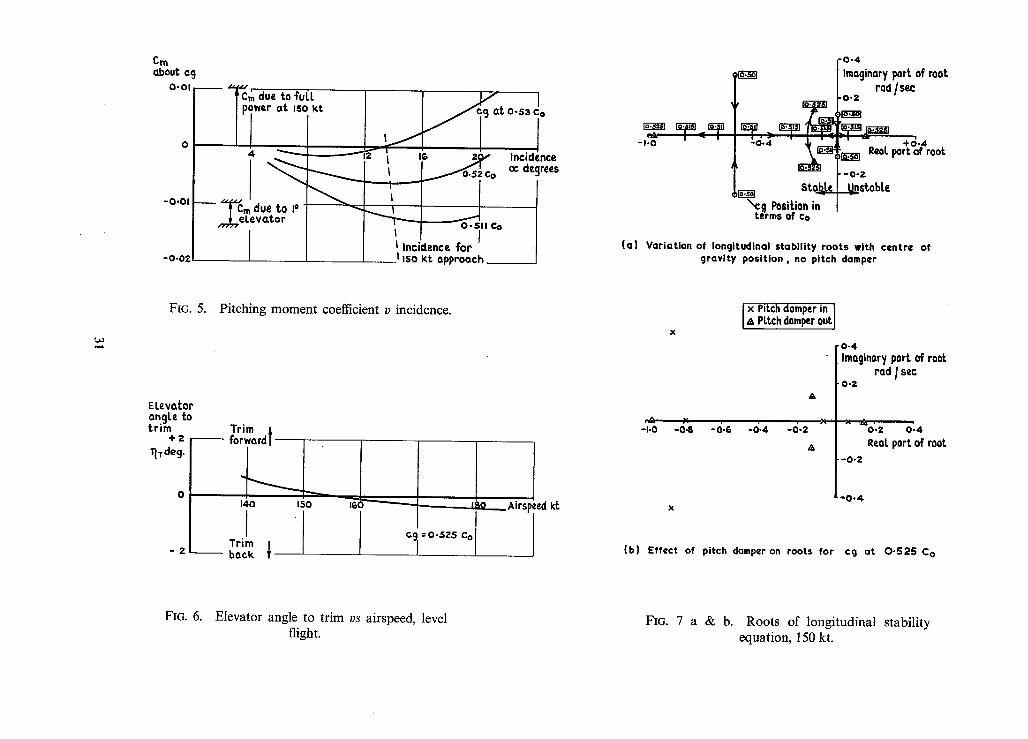
Cm about Cd
0-01 ~'~m due. to Tuff I ~ " I
I power at ,so kt , J i 9 at o-s, c.
II I I 4 . ~ ~ | 'p ~ Incidence
' ~ d u : t ~ , ' ~ ~ | ~ Co OC de.grees - o . o ,
-o.oz I iso kt approach
FIG. 5. Pitching moment coefficient v incidence.
ELevator angLe to trim
+ 2 'q-r deg.
0
- , ? . ~
Trim 1 f o r ~
J4o iso
I Trim back
os :F 0̧ seie, kt
FIG. 6. Elevator angle to trim v s airspeed, level flight.
P A I ~ i -I°0 ,.(~.4 , ~ ,
Iw~ $toJp~_~ Ncg Position in
terms of co
f~ .~l°mo'gino,y Port of root o-z t ad / see
o - S o I
I O , 5 2 ~ 1 . ! -x
[ +0.4 ~1¢~ Red port of root -O-Z
~stobLe
(a ) Var ia t ion of longitudinal s tab i l i ty roo ts with centre of g rav i t y pos i t i on , no pitch damper
e& -J.o -o.s -o.~ -o:4
x Pitch damper in l A PLt.ch domper 0ut I
0.4 • [ Imaginary port of root
A . . . . . Jo.a rodlsec
-o.z "'1 ^ - % . z o:4 A I ReoL part of root
-0 .2
- 0 . 4
(b) Effect of pitch damper on roots for cg Qt 0 " 5 2 5 C O
FIG. 7 a & b. Roots of longitudinal stability equation, 150 kt.
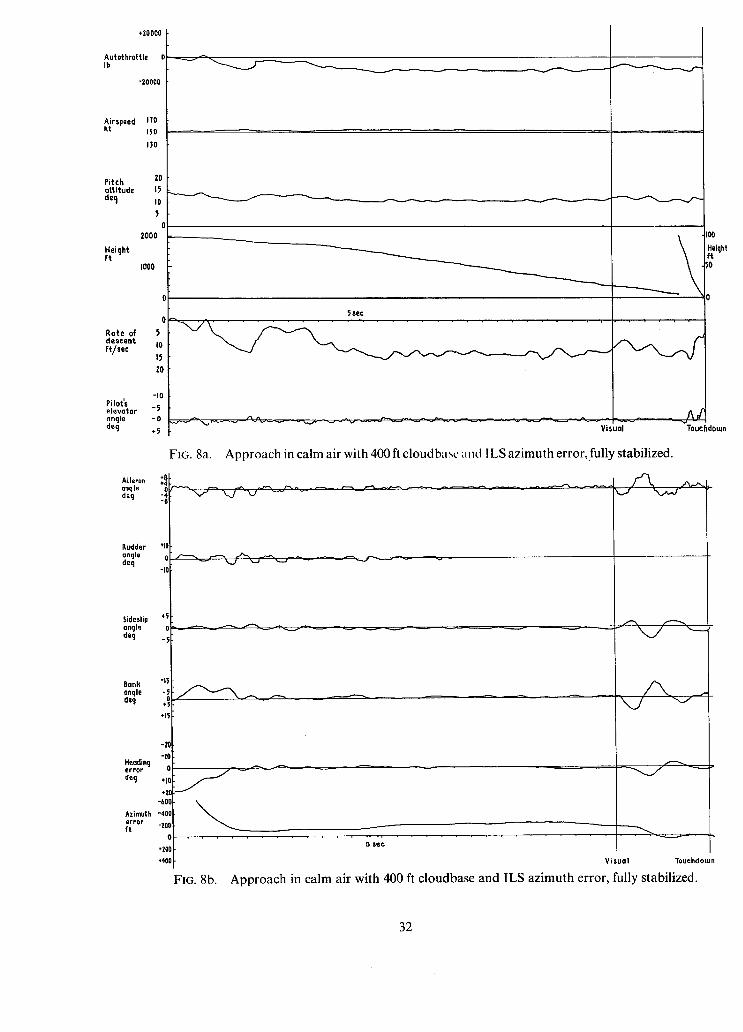
+200O0
Autothrottle Ib
-zooo0
Airspeed 170 kt 150
130
Pitch 20 attitude 15 decj 10
5 0
2000
Heiqht Pt
I000
0
Rate of 5 descent tO ft/sec 15
ZO
-I0 Pilots elevator -5 angle -0 deg +~
ALleron ~0 anqle de9 :4
Rudder +I0 ongle 0 deq
-I0
Sideslip +5 ancjle 0 dec] . ,
Bank -t~ onqle - I de9 + 5
-10 -I0
Heading error 0 de9 +I0
+.'2C -h0O
Azimuth -400 error -ZOO f t
0 +200 -'400
se¢
100
50
0
Visual TouchdoLun
FIG. 8a.
x , ; x . f ' v
Approach in calm air with 400 ft cloudbasc und 1LS azimuth error, fully stabilized.
~ w ~ v A A
J " , 3 v
f
F I G . 8 b .
. . . . . I . I I
g OeC
Visual Touchdouan
Approach in calm air with 400 ft cloudbase and ILS azimuth error, fully stabilized.
32
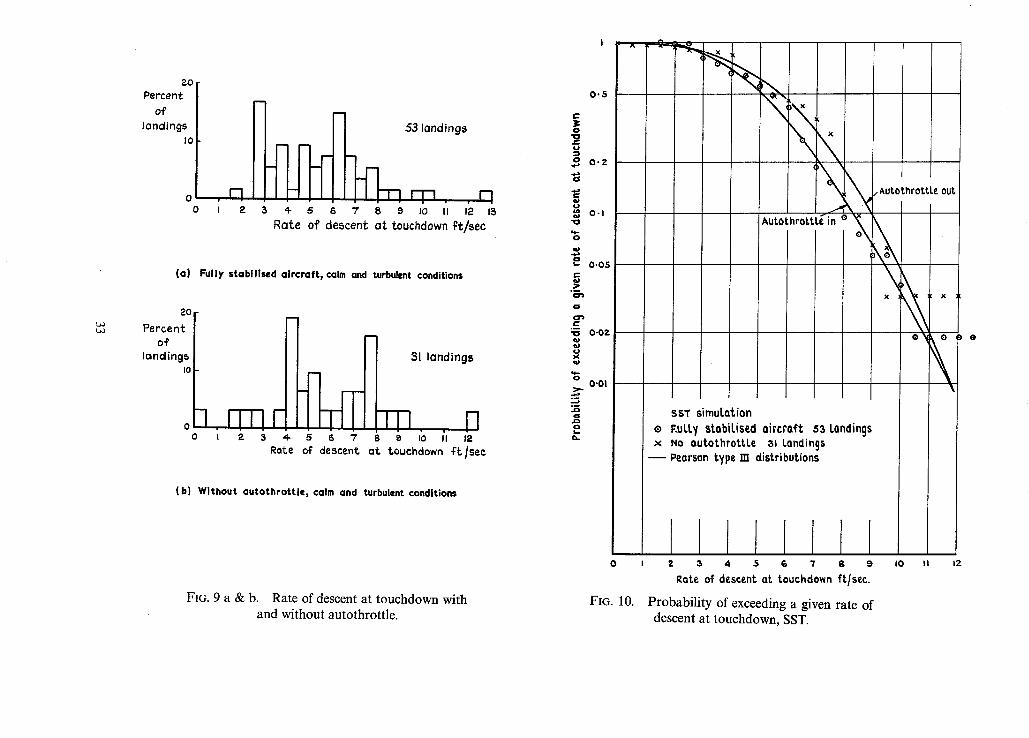
L#J
2 O
Percent of
landings I0
o I--I o i z
~ 53 landings
3 ~. s 6 7 8 s Jo I'l 1"2 I~ Rate of descent at touchdown t~t/sec
(a ) Fully stabil ised a i rcra f t , calm and turbulent conditions
2 O
P e r c e n t of'
landing~ I0
o VTTIF o i a 3 4.
m
31 landings
s 6 7 8 ~ ~b ii Iz Rote of descent, at, touchdown ¢'L/Sec
(b) Without au to thro t t l e , calm and turbulent conditions
FIG. 9 a & b. Rate of descent at touchdown with and without autothrottle.
0 . 5
c-
O .C #.)
0 0 " 2
g u
"O
~'- 0 " 0 5
o ~
¢-
" 0 0 . 0 2
u
O'Ol
..Q
P
FIG. 10.
AUtothrottt~in o o~ S~~o
SsT simulation o F.ully stabilised aircraft s3 londinos x No outothrottLe 3i Landings
Pearson type ill distributions
,AutothrottLe 0ut
I 2 3 4 5 G 7 8 9
Rote of descent at touchdown ft/sec.
Probability of exceeding a given rate of descent at touchdown, SST.
I0 i| t?.
0
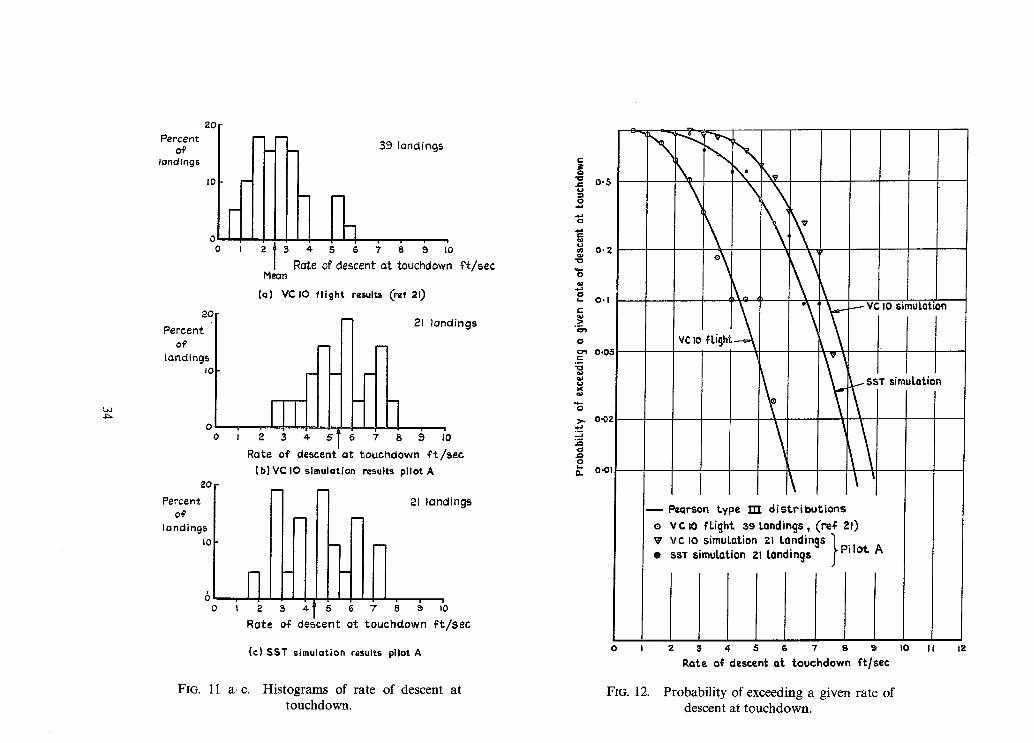
Percent of
landings
20
20 Percent
of,
landings Io
iO
0 0
o 0
20 Percent
o¢ landings
I0
6 o ;
=
/ 2
_ 39 landings
4 s 6 ÷ ~ ~ i'o Rote of descent at touchdown {'t/sec
Mean (a) VC IO fllsht resul~ (ref 20
21 landings
6 7 s ~ ,b
Rate of descent at touchdown f t / s e c (b) VC I0 simulation results pilot A
R 2
m
5 4
m
5 6 N 7
21 landings
Rote o~ descent at touchdown f t /sec
(c) SST simulation results pilot A
FIG. 11 a-c. Histograms of rate of descent at touchdown.
r-
"0 ~= 0"5
0"2
0 0°1
0 - -
0
cn 0.05 c
~ 0 , 0 2
a
P O. 0-01
\
VC io f L i g h t - ~
\ " Ivi'°"iu'ai'fn
T simulation
Pearson type rn distributions e VC l0 fLight 39 Landings, (re# 21) V vc IO simuLation Zl Landings ~Pilot A e SST simuLGtion Zl Landings
O I
FIG. 12.
2 3 4 5 6 ? 8 S Rote Of descent Ot touchdown f t /sec
Probability of exceeding a given rate of descent at touchdown.
I 0 I I 1 2

0 - 5
¢::
o '10
:~ O-Z o
O- I
" o
o c
c l= j
1:3
.~"~ 0-02 "10 ~J
" - 0-01 o
, _ . a
.o
,
0 o ,
\ ,
O "~ 0 -02
5s'r I ~ XS 70 ~,PiLOt A ALL piLo ~,
O.Ol
Pearson type m distributions ® 5ST simuLation,caLm oir ond turbuLence, fuLLy s[obi[ised. . ~>"
(53 tonaings) ".--2 X XB-70 fLight, results (2G landings ) o . D
• SST simuLoti0n pilot. A onLy (Zl Londin9s ) o
O I
FIG. 13.
z 3 4 s 6 7 s s io u iz Rote of descent of. touchdown ftlsec
Probability of exceeding a given rate of descent at touchdown.
>,,.
0 - 2 P
¢ ;
0
¢ -
o
- o c -
o
SST / AUtOthr0ttLP. out
/ x ~ x jAut0throt t .Le in
\ 0
Pearson type TTT dist.ribut, ions ® SST simuLotion, fuLLy stobiLised
cQtm ond turbulent condLtions (53 LQndings) X AutothroU.Le out. (29 Londings)
iooo 2000 3ooo 4000 5000
Distonce to touchdown point, Trom runwoy threshold
FIG. 14. Probability of touching down beyond a given point on the runway.
GO00 f t
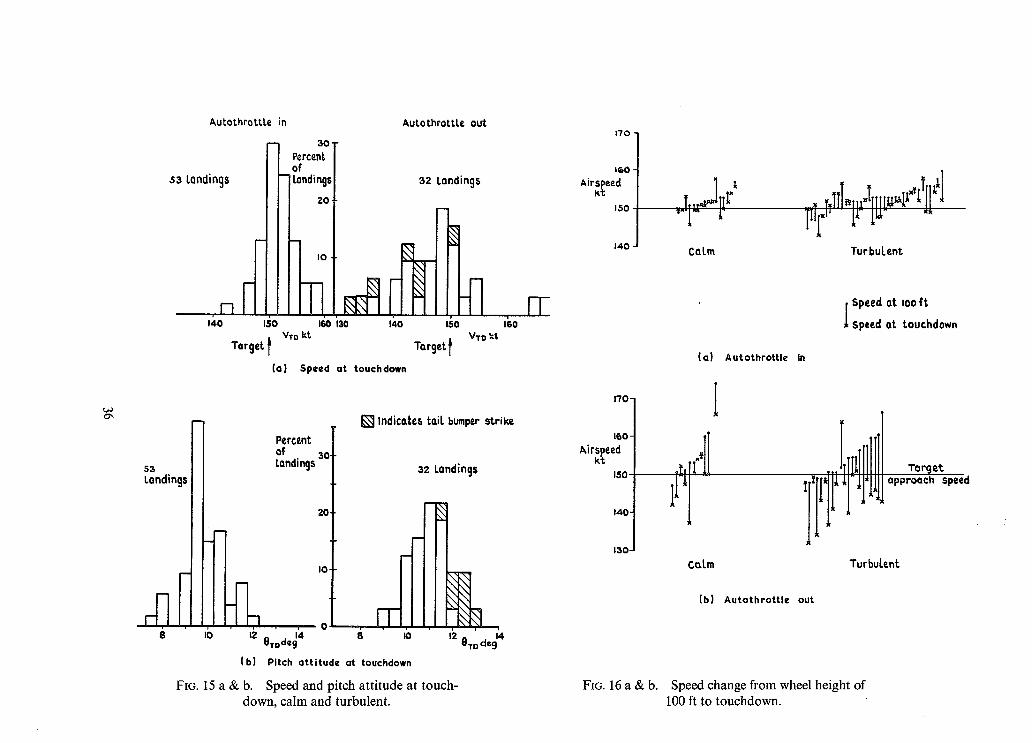
0 ~,
A u t o t h r o t t t e in Au to th ro t t l . e ou t
53 t0ndings
- - 30 ¸ Percent of
- Londings
ZO
I IO.
I ~ 130
Ter9et I vTo kt
32 Landings
n
140 150
Torcjet I Vxn at
(o ) Speed a t touchdown
Percent of 30 tondings
n
20
. , . . .
s Jo iz e,.d~:4 o s
(b ) Pi tch a t t i t u d e at touchdown
FIG. 15 a & b. Speed and pitch attitude at touch- down, calm and turbulent.
I ~ Indicates taiL bumper strike.
32 Landincjs
12 0.rD deg14
I-I-
1 7 0
IGO Airspeed
I~O
140
I ' / 0 -
160-
"ir~pteed
150
140 -
130
FIG. 16a&b.
x I. T.,.a.~ lI I~
Calm TurbuLent
(o)
I
CQLm
A u t o t h r o t t l ¢ In
lli
i Speed at ioo ft speed ot touchdown
I , lillll Torg,
TurbuLent
(b) A u t o t h r o t t l e ou t
Speed change from wheel height of 100 ft to touchdown.
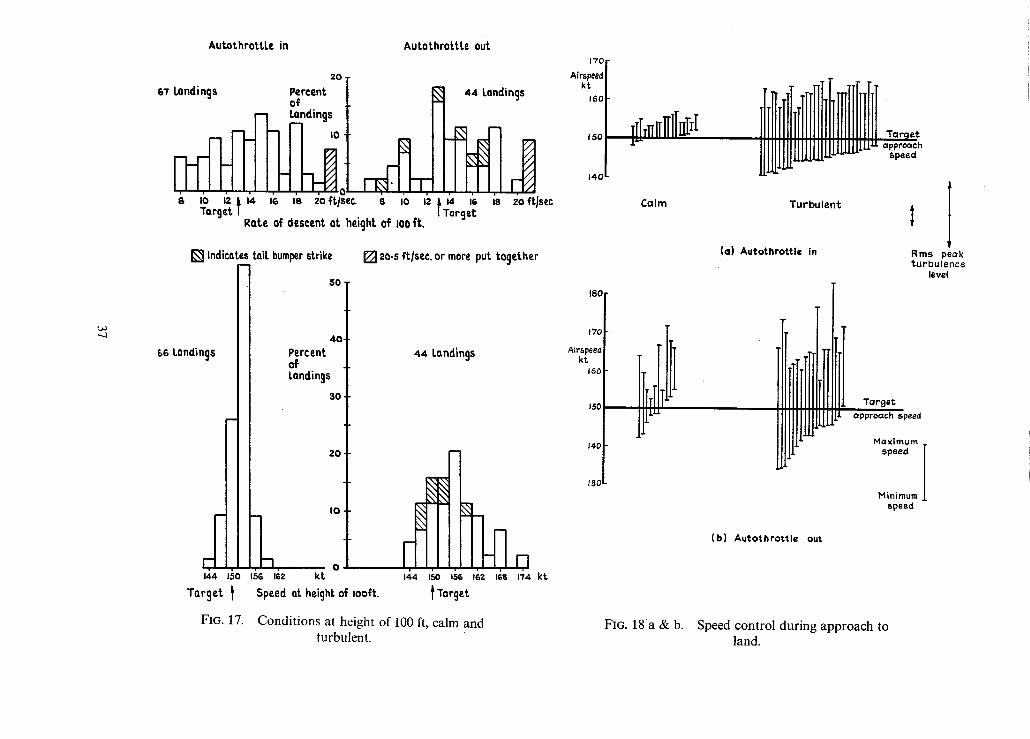
AUtothrottL¢ in Autothrottte out
2O
S't Landings Percent o~
44 Landings
i~ ,~14 ,~ 18 zoft/sec 8 IO Iz I 14 Ig 18 20 f t rsec. 8 I 14 Torget l Tor¢jet
Rote of descent ot height of IO0 ~t.
1 ' 7 0
Airspeed kt
16~
150
140
.L ~
Calm Turbulent
Target approQch
Speed
[ ] Indicates tail bumper strike
B6 Londings
m
1~4 aso is~ 16z Target I
5 0 ,
4 o
Percent o~ Landings
30
zo
IO
o kt
Speed Qt heicjht of ioo~t.
[ ] zo.s ~t/sec. or more put together
44 Landings
t Tarter
R ,'~4 kt
180
170
Airspeed kt
16D
I5C
140
t3C
(a) Autothrottl¢ in Rms peak turbulence
level
[[I•I[TIII f i l l T°rget
(b) Autothrottl¢ out
Minimum speed
FIG. 17. Conditions at height of 100 ft, calm and turbulent.
FIG. 18a & b. Speed control during approach to land.
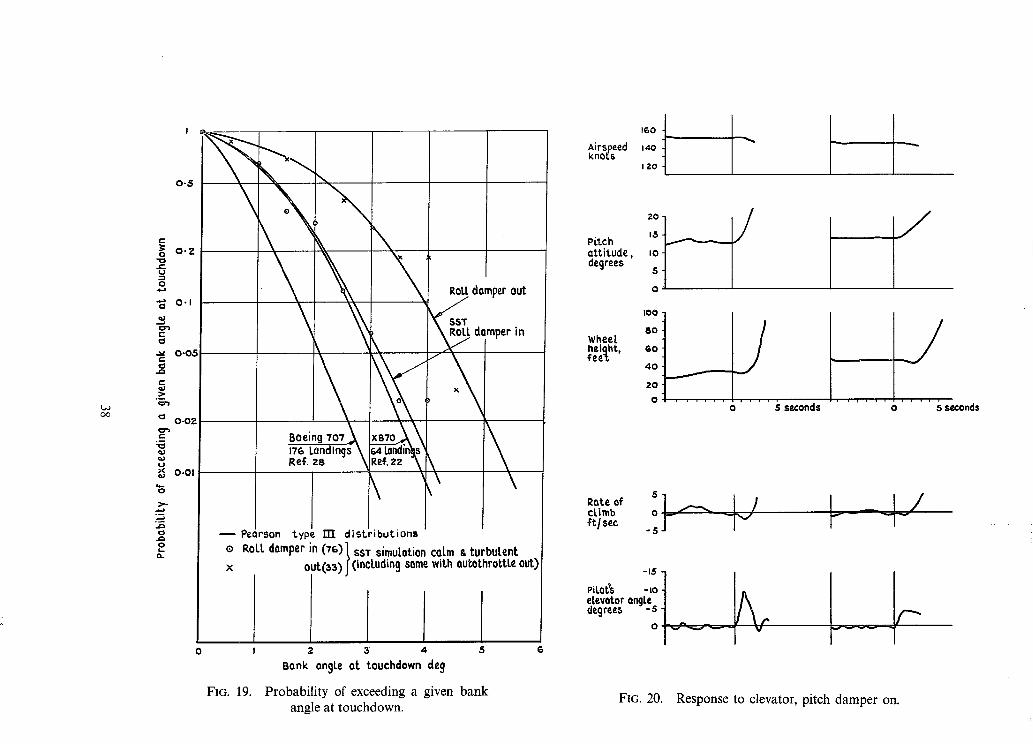
t ~
0 . 5
c
u : ) o
o.,
• -~ 0 - 0 5 C
¢ , ,
l a l
° ~
o 0 - 0 2 g-
~ o.ol
. _ , . , , ,o
Pearson type T1"r distributions
e RoLL damper in (7e)~ SST simulation calm x out(~3) [(includin9 some with
turbulent outothrottte out)
FIG. 1 9 .
2 3 4 5
Bonk angle at touchdown deg
Probability of exceeding a given bank angle at touchdown.
Airspeed knot:s
1 6 0
140
I Z O I I I-
pLt,ch attit,ude, degrees
15
I0
s
o
/
wheel. lleiqht, f e e t
' .o .o .o I I o 5 seconds o 5 seconds
Rate of s I f ft,/sec -5 ~
,,<:<,:-',{1 I. e.tevator angle / I I \ ilegrees "~ 1 II
FIG. 20. Response to elevator, pitch damper on.
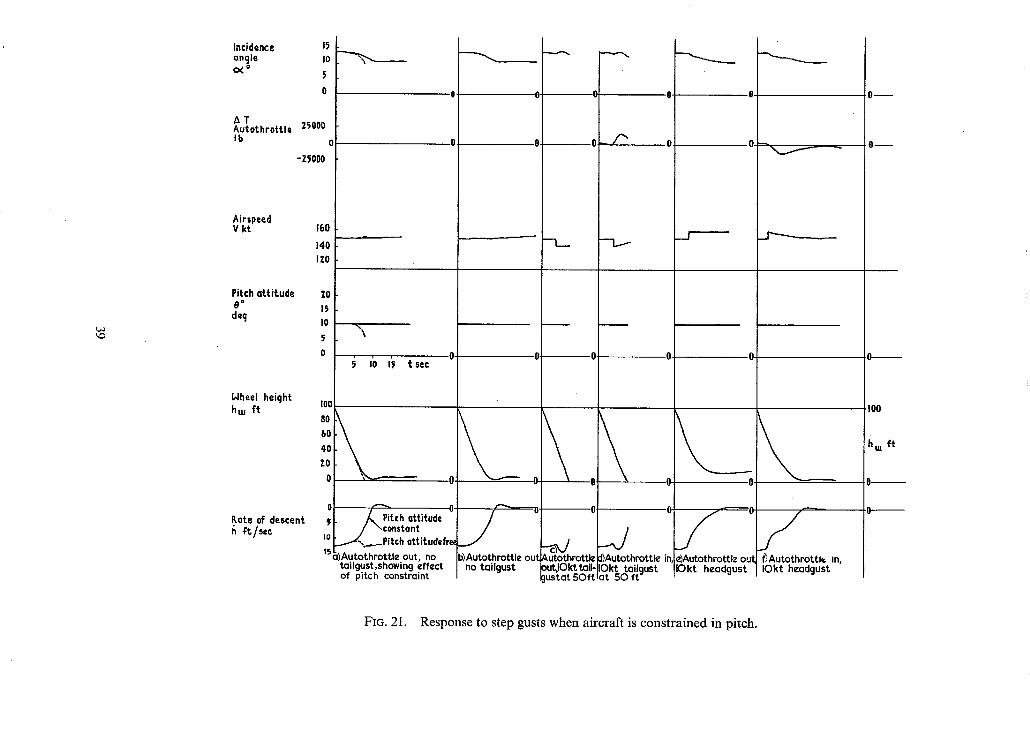
Incidence I~ anqle 10 o<* 5
A T AutothrotUe 25000 Ib 0
-ZS000
Airspeed V kt 160
140 IZO
Pitch att i tude ZO
0* 15 decj I0
Nheel height 100 hm f t
80
60
40
Z0 0
0 Rate of descent
at/see ,o
0 ,~ b t,ec
0
tch attitude 0 nstant tch attitudefre~
~Autothrottle out, no tailgust,showin 9 effect of pitch constraint
/ ~)Autothrottle out
no tailgust
u
0 0
- - 1 - -
O O
ol
C
~ut~othrott~ out,lOkt tail-
ustat 5Oft
0
0 0- - -
0 0
0
e)Autothrott~ out ~Autothrottl~ in, }Okt headgust IOkt hcadgust
0
S |)Autothrottl¢ in Okt tailgust 3t 50 f t
O m
I00
hcu f t
FIG. 21. Response to step gusts when aircraft is constrained in pitch.
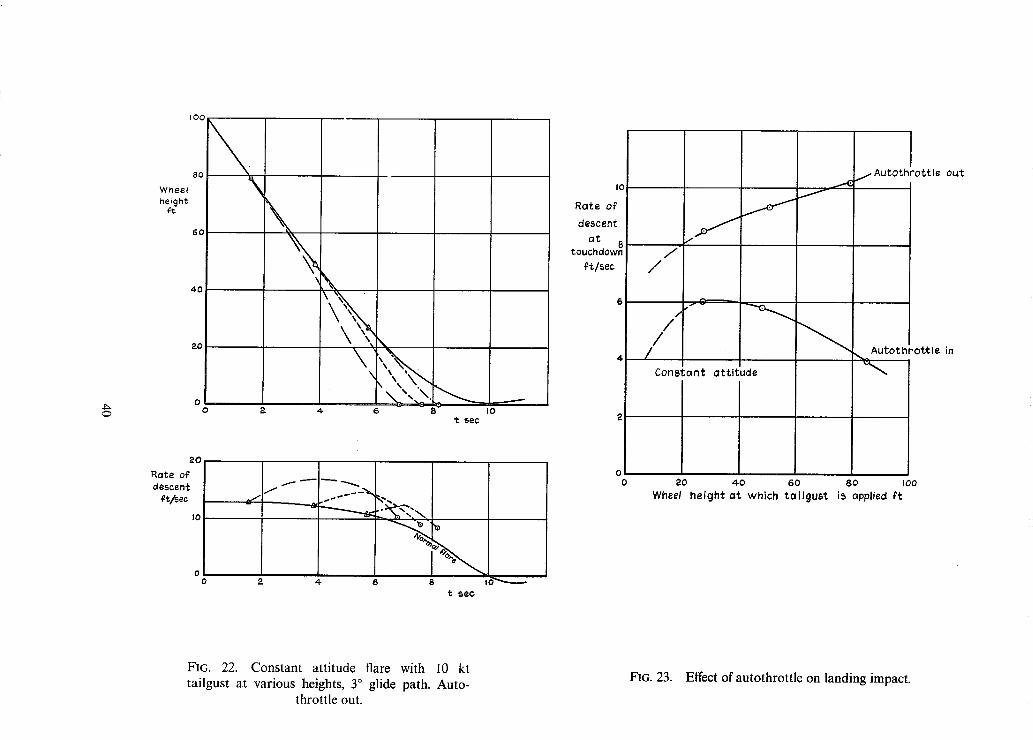
4~
I00
8o
Wheel height
60
4.0
ZO
0 0
20 Rote of descen~
~/see tO
'L
4, 6
• j
IO t ,~ec
f f
"e 'o
4 6 t O ~ t sec
IO Rate o~
descent
at 8 touchdown
Ct/sec
f / /
/
f
,~ / Autot~
/
/ ~ Autoth
Constant attltude
2O 40 60 8O
Wheel he ight a t which tOilgtlSt is oppiisd Ft
ttle out
ottle in
IOO
FIG. 22. Constant attitude flare with i0 kt tailgust at various heights, 3 ° glide path. Auto-
throttle out.
FIG. 23. Effect of autothrottle on landing impact.
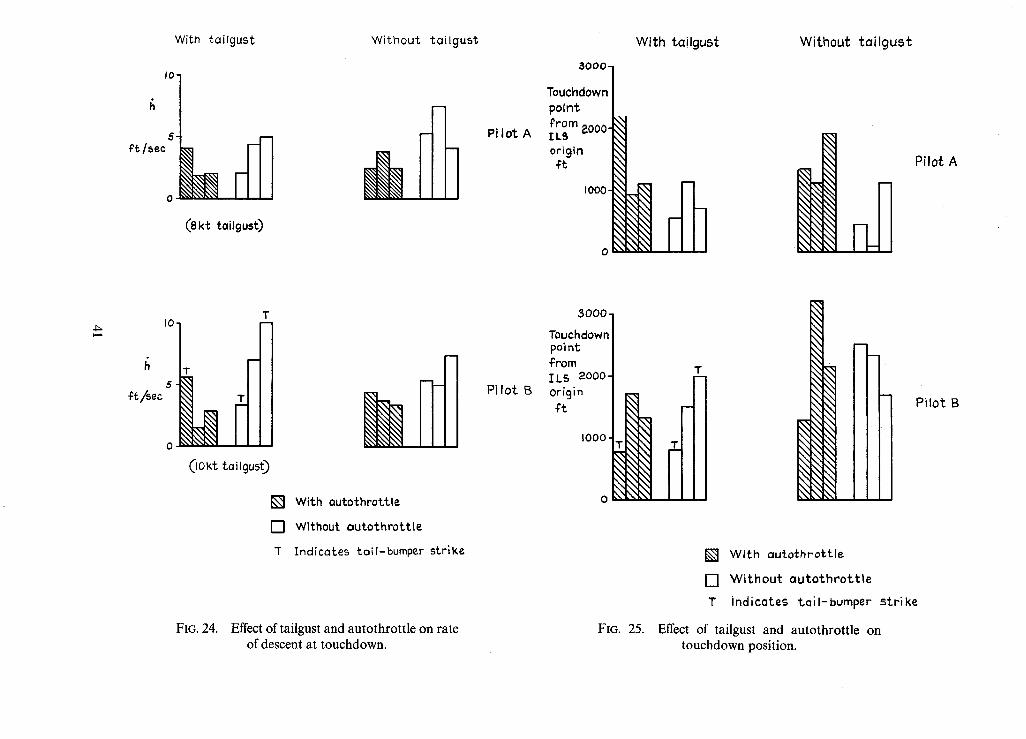
With tailgust
I 0 "
(8kt tailgust)
Without tailgust
I000-
SO00-
Touchdown point from 2000" ILS orioin Ct
4~
With tailgu5t Without tailgust
Pilot A
~/sec 5 ¸
T I0
Pi lot B
T
(lOkt tailgust~
[ ] With outo~hrottle
[ ] Without autothrottle
T Indicates tail-bumper strike
FIG. 24. Effect of tailgust and autothrottle on rate of descent at touchdown.
I000-
3000,
Touchdown poi nt from ILS 20O0- origin #t
T__
Fio. 25.
Pilot A
Pilot B
[ ] With auto~hrottl¢
[ ] Without auto thro t t le
T indicotes tail-bumper -~trike
Effect of tailgust and autothrottle on touchdown position.
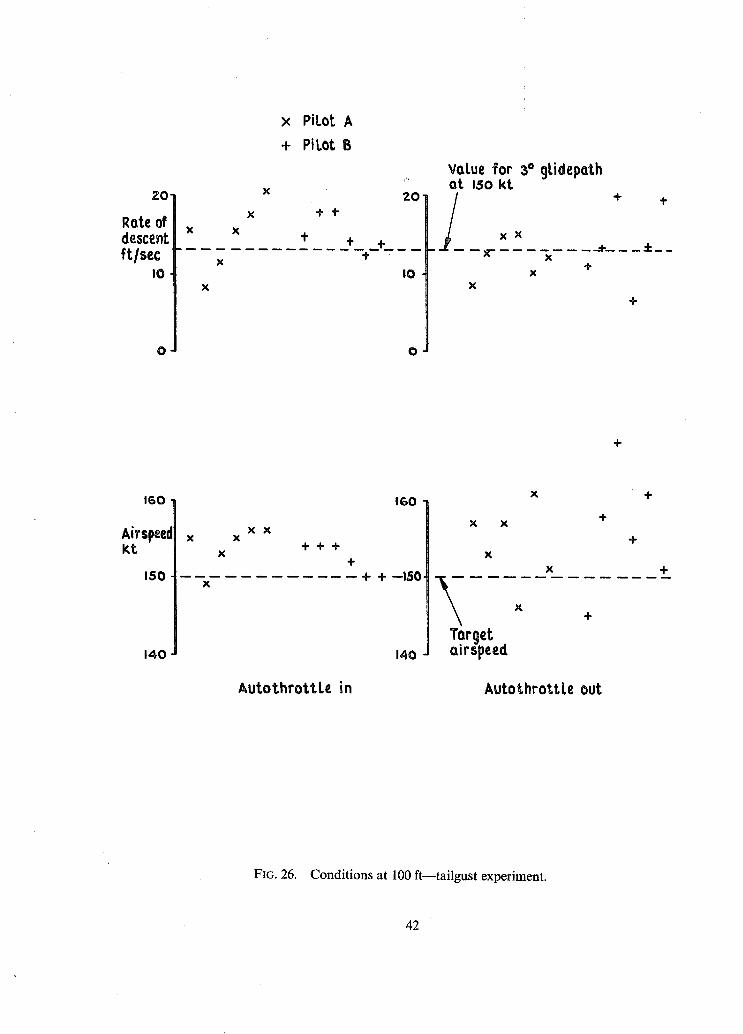
20.
Rote of descent if/see
I0
0
× PiLot A
+ PiLot B
x
x + +
× + ÷
x I 0
X
0
value for 3* 9tidepath at 150 k t
÷
X X _ _ + _ _ 4 - _ _
4-
4-
÷
160
Airspeel k t
15o
140
x x x
÷4.÷ x
X
AutothrottLe in
OGO
q.
+ +- -150
1 4 0
x ÷
4. x x
÷
x
x ÷ u m . . . . . . . . . . .
x ÷
Torget airspeed
AutothrottLe out
FIG. 26. Conditions at 100 ft--tailgust experiment.
42
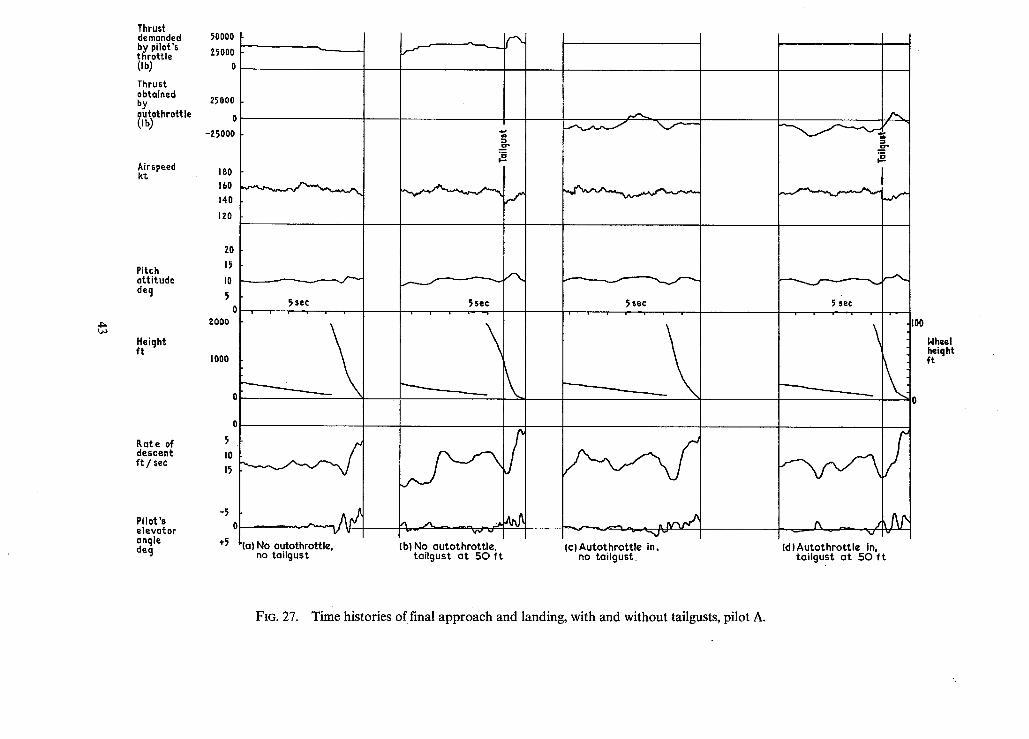
Thrust demanded by pilot's throttle Oh) Thrust obtained by outothrottle 0b)
Airspeed kt
50000
Z,O00 ' 0 "---- '----~ ~ " - " " ' - " ' - ~ ] '
25000
180 160
140
IZO
~o
4~
Pitch attitude de 9
Heiqht ft
Z0 15 10
5
tO00
I000
5 see 5se¢ ~ sec 5 sec
\ I00
Nheel h:iqht
Rate of descent f t / see
Pilot's elevator angle de 9
0 - - - - , , - - - . ~ _ _ _ . ~ d ~ _ _ _ . ~ , e ~
*5 (a) No outothrottl¢, (blNo autothrott l¢, (c lAutothrot t l¢ in, no tailgust tai lgust a t 50 f t no ta i lgust
r~ J~J~
(d)Autothrott l¢ in, tai lgust a t 50 f t
FIG. 27. Time histories of final approach and landing, with and without tailgusts, pilot A.
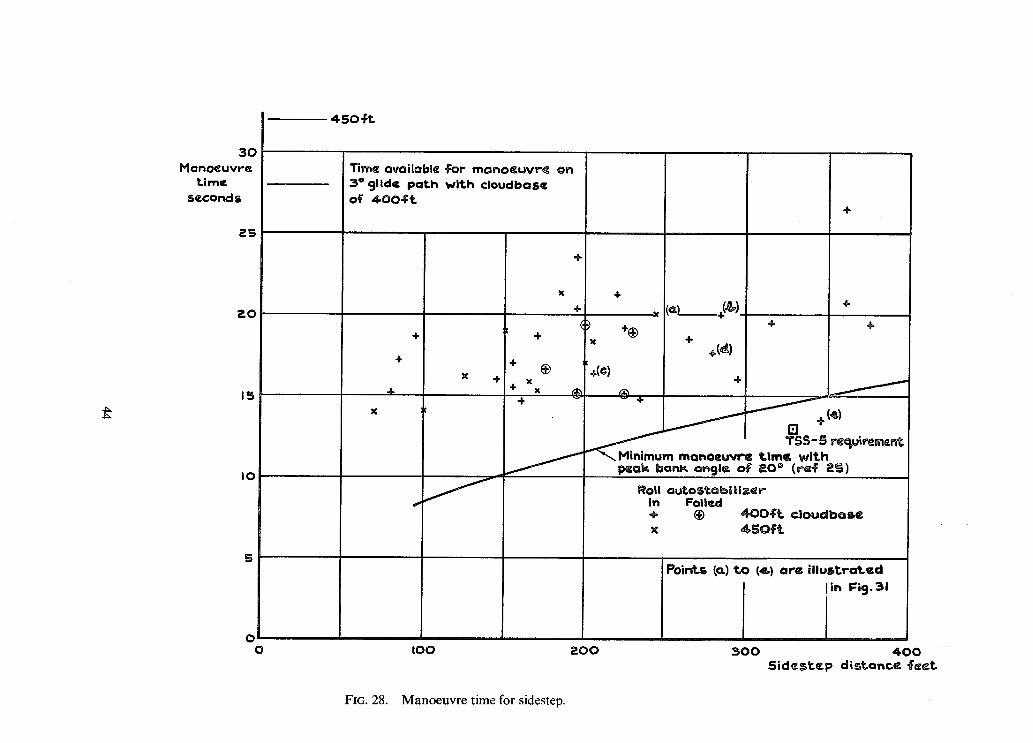
3O M a n o e u v r e
t l m c second s
~ 5
P.o
15
I o
r~
o o
4 5 o T t
Time available For m o n o c u v r ( on 3o ¢jllde p a t h w | t h ¢louclbose o f ~ 0 0 ~ ¢
+
+ +
X
x
÷
x
W
'+(c)
÷
x (a),
+ +(d)
÷
I 0 0
T S S - 5 rcqu'tr2ment m m a n o e u v r e ¢ | m t w i t h
peol¢ bank a . g l e o f 20 ° (re(25)
Roll a u t a S t a b i iizGr In Foiled ÷ (~ 4 0 0 .~'lt,, ¢ louc lbas¢ x 4 S O f t
200
Points (o . ) to (4.) o r e i l l u s t r a t e d
in Fi 9. 3 !
~ 0 0 4 0 0 S i d e s t e p d i s t a n c e fG~t.
FIG. 28. Manoeuvre time for sidestep.
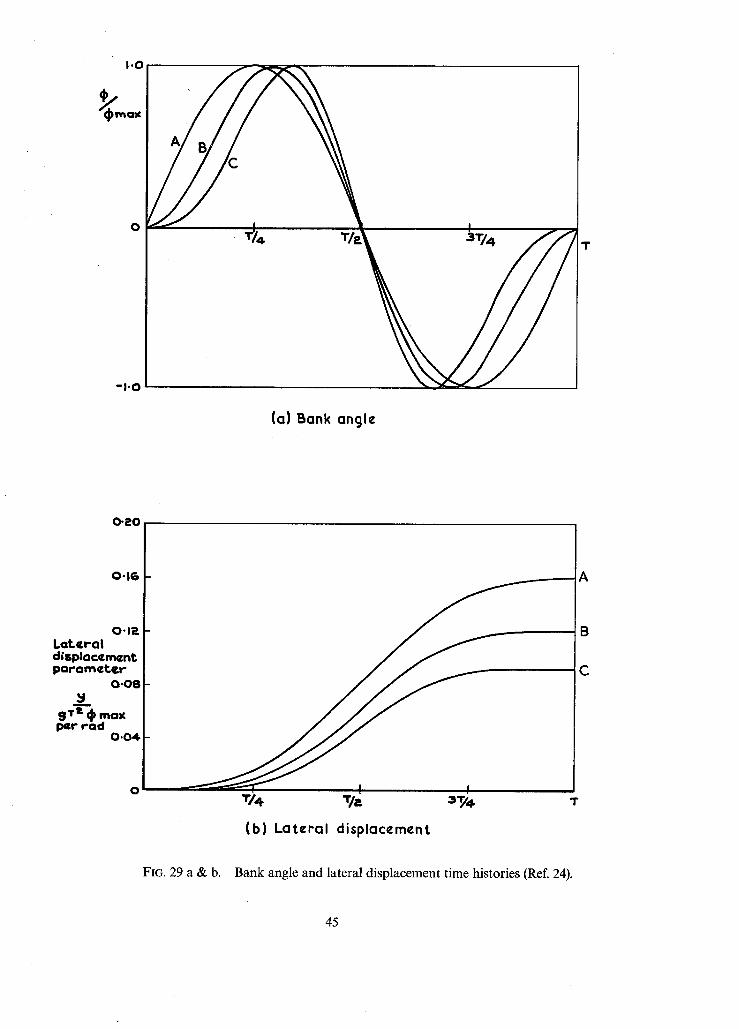
I.O
~¢m,x
o
-I.O
(0) Bank angle
T
O'EO
O'IG
0"1~ Lateral displacement parameter
0.08
S T'~'~ mox I~r tad 0 . 0 4
0 T/4 T/2 3T/' 4
A
B
C
T
(b) L a t e r a l d isp lacement
FIG. 29 a & b. Bank angle and lateral displacement time histories (Ref. 24).
45
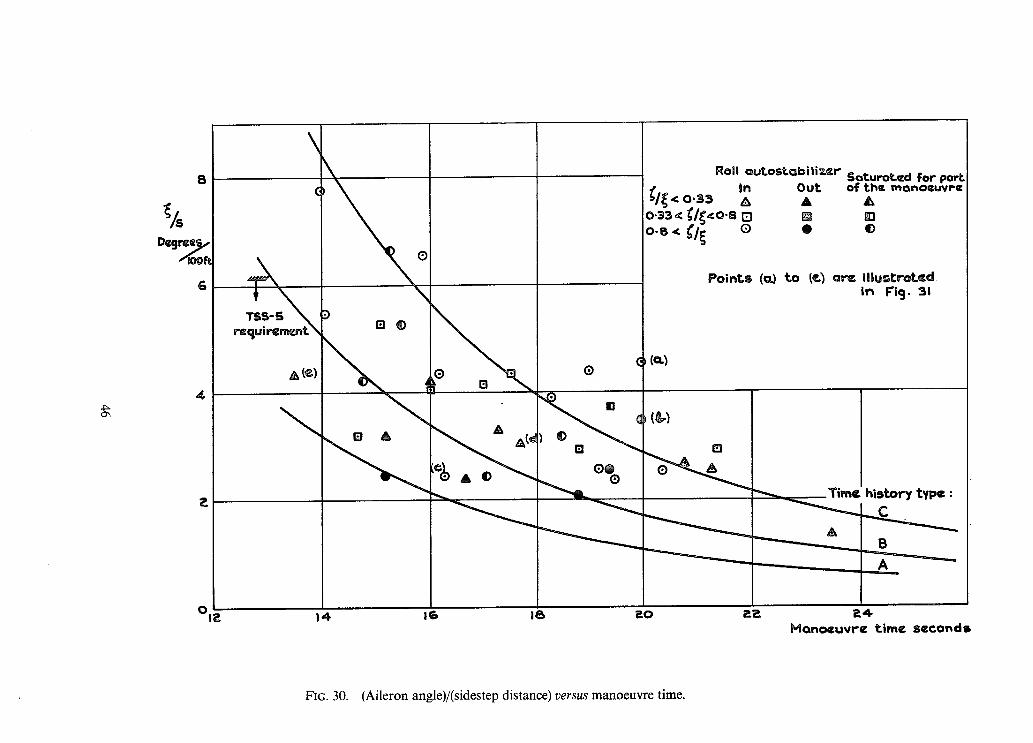
C ~
8
Dcgre~, /IDOl(
G
4
o,~
\
(
r tqu l remcnt \ B ~D
Roll a u t o s t o b i l i z e r Saturot~d for part. In Out of th~ monoeuvPc
~/~< 0-33 /X A ~x 0.33 < ~/~ ~o.8 [] m o . ~ < ~ / i o o ©
Po in t s ( ~ t o (¢~ a r c i l lustralL~d in Fi 9. 31
|
"
14 |G 18 ~0 ~ P-~ H o n o e u v r e t i m ¢ s e c o n d s
FIG. 30. (Aileron angle)/(sidestep distance) v e r s u s manoeuvre time.
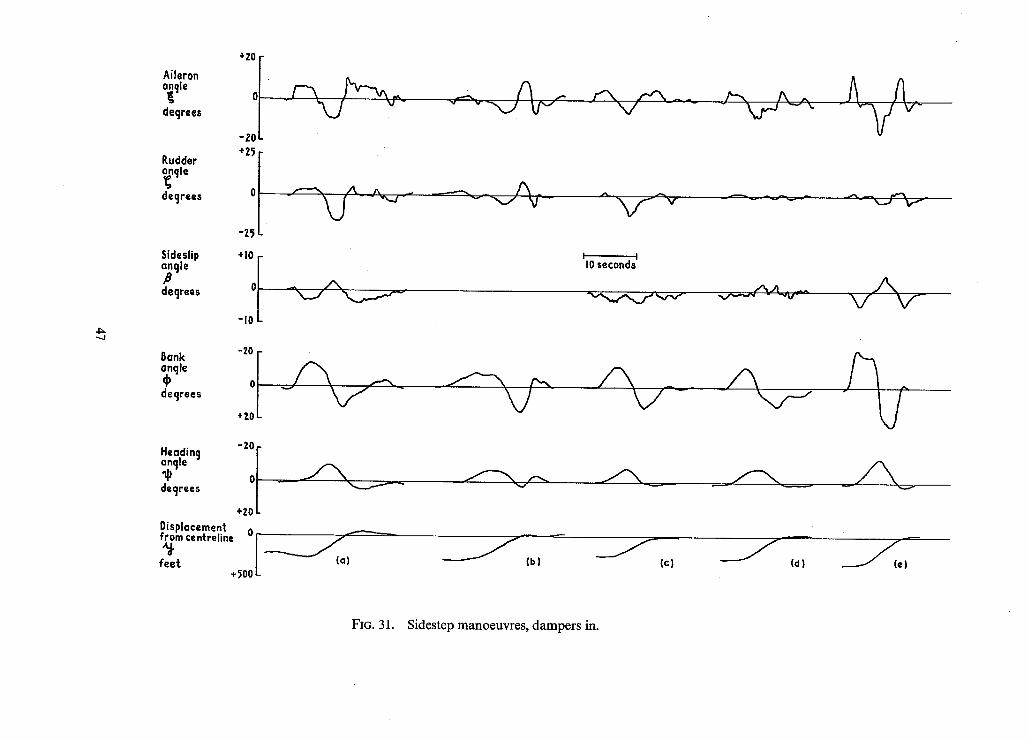
Aileron °~9 le
degrees
Rudder nclle
degrees
Sideslip ~ 91e
degrees
+ZO [.
-Z~i [
+I0 [
_,:[
- V - ~ t , -.J "-" " " - ' V w
~ V ~. /~ " V ''~- "w - - ",--..' 'v-""
I I I0 seconds
Sank ngle
deqrees
-Z0
Headin 9 -20[
declrees [ ~ - - ~
÷ZO
~ , . - ~ . _,.../'N v . / " - ~ , _ / / ' ~
(c) (O)
FIG. 31. Sidestep manoeuvres, dampers in.
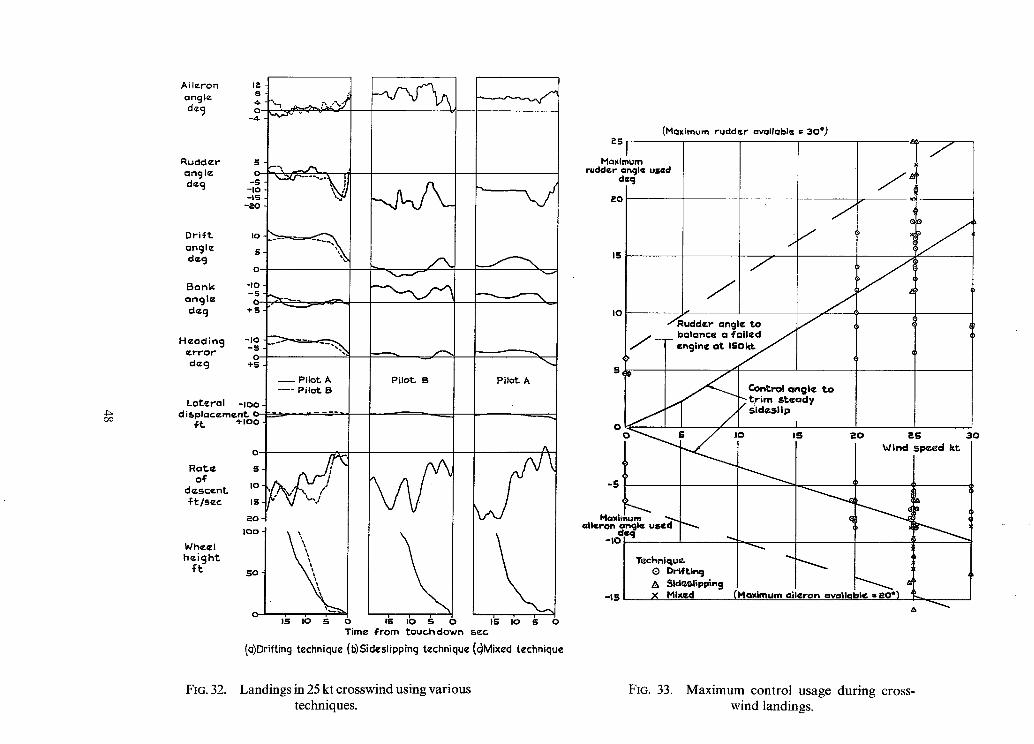
Ailcr 'on m~- • ongl e s 4- ~ .,~..,.~,~-,..J~ de, 3
P, u d d c r 5 --~ _ . . j *~_ ang le - ~ . r . . . . . ~ ;I dcq -g
-IO -m'S
-P..O
D r i T t mo ang le S de 9
~ o . k ? - on91= "~-~ - ~ . / ~.._.=~.,,-.-- ~--~'~ dcg ÷ s
H ¢ ° d l n 9
d¢9 + s -
L o t u - o l -moo d isp lacement ,
~t, + moo
Pilot. A .... Pilot. B
Pilot. B Pilot A
R o t e S.
descenL Io- , / ~t /sec IS-
~0- I00"
Wheel h gh,
,b mb s o
i. 0-
15 I0 S 0 Time ~rom t o u c h d o w n see
(a)Drifting technique (b)Sideslipping technique (c)Mixed technique
15 IO 5 0
~S (Moximum r'udder avoilobl¢ = 30*)
Maximum rudder =ngl¢ used
£o
15
I0
J
J
J p
/~Rudde'r angle to loolgnc¢ o . foi led
J --- engine at I S O ~
J J
i ' ) ~ Control ang le t o b ' i m s t e a d y
j / s ides l i p
, I
k - - -
Technique " Q Dr~f t.,Ir~j A Sldesllpp~ng
-15 X Mixed
ZO i~S 30 Wind Spc4~d k t
L
(Hoximum ai leron ovoi labl¢ = eO') -~
FIG. 32. Landings in 25 kt crosswind using various techniques.
FIG. 33. Maximum control usage during cross- wind landings.
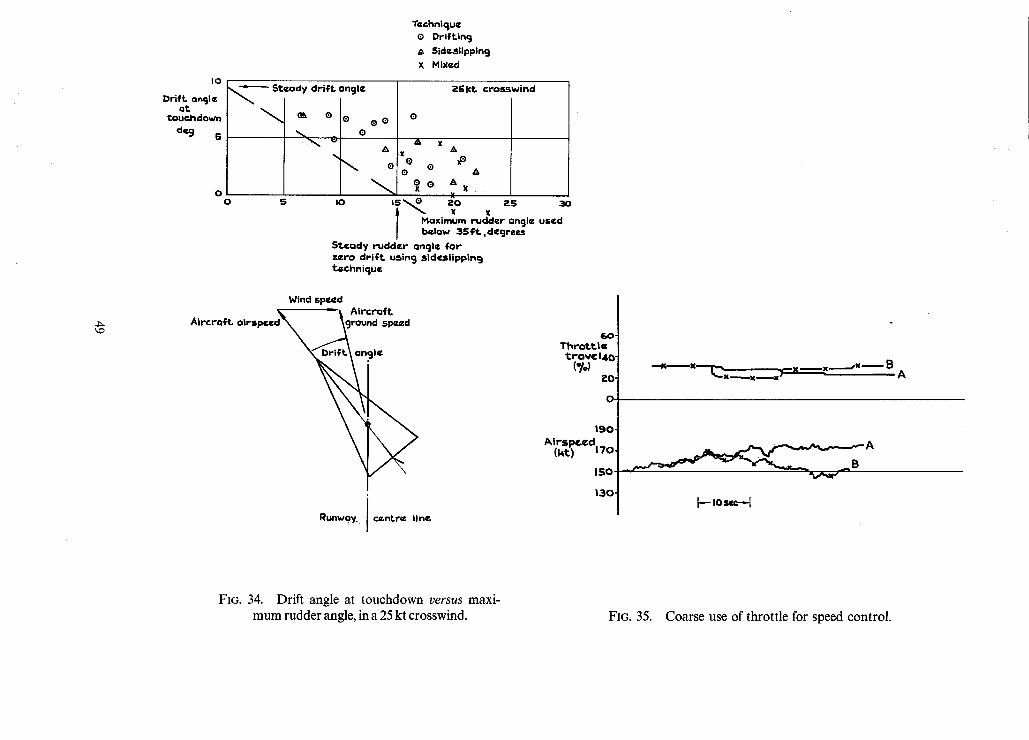
4~ ~D
IO
Dr i f t angle a t
l:our.hdown dog 5
Technique ® Dr l f t in 9
5idos|ipp|ng X Mixed
Steady d r i l l ongl¢
®
%
0 0 5
® 0
&
®
2~; Ict croSswind
0
& ,x o e o @A
I0 ® X l , ' ~ ~O ~ 2S 30
l Haximum rudder angl~ used [ b~,,lo~ 35t :¢, d¢cjree~
5t .¢ady r udde r Qncjle { o r z e r o dPi-ft, usln 9 sidcsl lppincj t~chn ique
Wind speed ~ - - - - - - - - ' ~ A i r c r a f t
Runway i centre l ine I
T h r o t t . l ¢ l : r o v ( 1 4 0
( ' / ' } eO
O.
190. A i r s p e e d
( k t ) 1 7 0
ISo
130,
,x B x ~ x ~ x i - x x A
~ A
J-- to s,=--I
FIG. 34. Drift angle at touchdown v e r s u s maxi- mum rudder angle, in a 25 kt crosswind. FIG. 35. Coarse use of throttle for speed control.
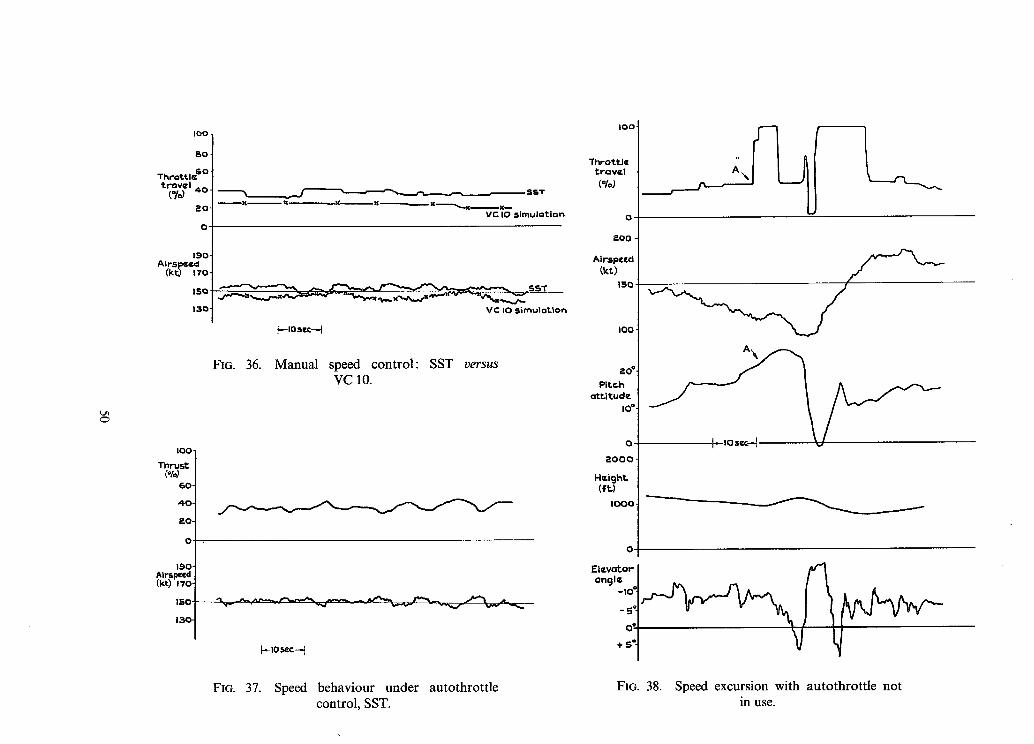
L~h C~
| G o .
8 o -
Thr-ott . l~ O" t r o v e l (o/~ 4o -
2 0 -
0
Air.speed (kt) 170
ISO
13o
IO0.
Thrust (*1~
6 o -
4 0 -
~mO"
O"
l~O- Air Slx~d (kt) 170-
150
130-
_,_J , ~ SST x ~ _ x x x
V r I0 5 tmul=t lon
VC I0 simulot. lo~
t---io scc--I
FIG. 36. Manual speed control: SST v e r s u s
VC 10.
FIG. 37. Speed behaviour under autothrottle control, SST.
IO0
Th ro t t l e t rQv¢ | (%)
0
;=00 •
Air=p¢cd ~kt)
150
I00
P i t ch o t t i t u d (
mo*
P . o O Q
H e i g h t .
I00O
O-
E l e v a t o r ong le
- t o "
o*
+ 5*
FIG. 38. Speed excursion with autothrottle not in use.
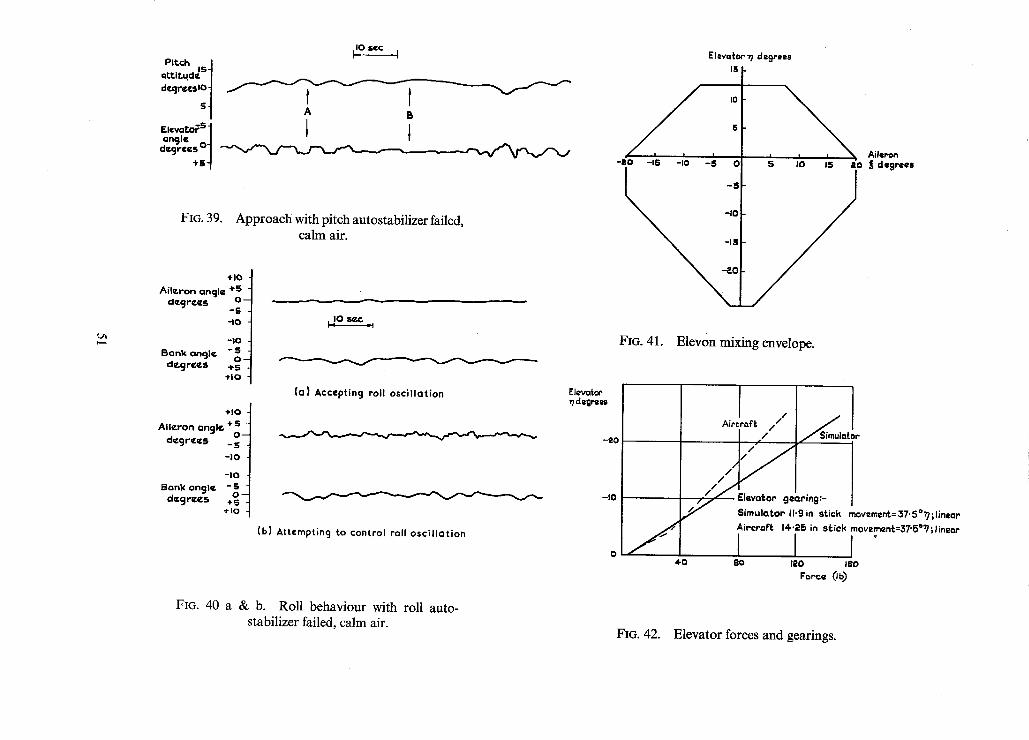
tj~
l*o scc I Pitch IsJ
qttiLud¢ m
oncJle _m degrees o]
+ s - !
Fro. 39. Approach with pitch autostabilizer failed, calm air.
+lO Aileron onqle +o ~-
d~grF.eS -S -tO
-Io Bank angle -5 degrees +S
÷10
÷1o Aileron on91¢,
degrees +i- -IO
-IO Bank ongl• "0~ degeeCs + -
Jo scc
(a) Acceptin 9 roll oscillation
(b) Attemptin 9 to control roll oscillation
ElevutoP 7 d¢flr,es 15
10
5
, ~ Aileron 5 I0 15 ;l'o ~ degrees
I -JO -15 -I0 -5 0
-5
-I0
-IS
FIG. 41. Elevon mixing envelope.
[levQtor degre88
- 2 0
-I0
J 4-O
Aircraft / / / / Qf.
.¢
/ / . / ' /
/ ~/'/Elevator ~arlng:- / ~ Simulator II.g in stick movemeNc=37.Sor/;lin~ar ,
AircraFt 14-.25 in st;ick m o v e m e n J c = 3 7 . S ° r l ; l i n e o t .
I 80 120 #BO
force (tb~
FIG. 40 a & b. Roll behaviour with roll auto- stabilizer failed, calm air.
FIG. 42. Elevator forces and gearings.
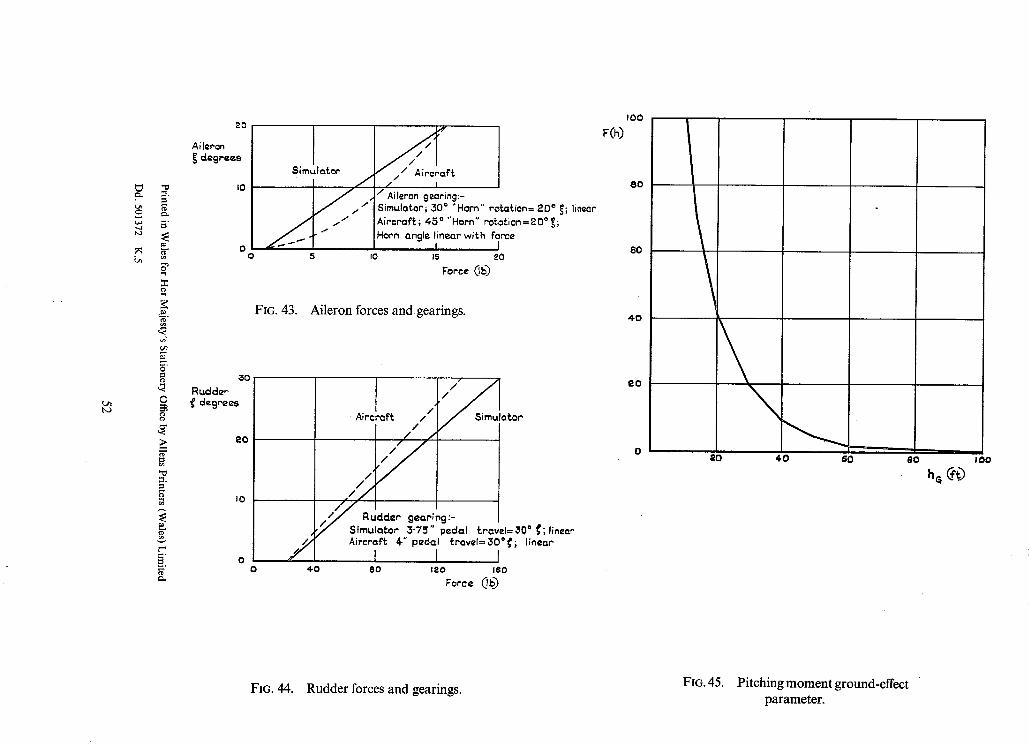
R e ~
5
5
0
t ~
_> N"
g
g,- e ~
20
Aileron dagre~,,s
IO
Rudder d=gre~
0 0
2 0
I0
Slmulm£or /
5
/ I / Aileron gearing:- Simulator; 30* "Horn" ro~a£ion= 20 ~ ~; linear Aircrof~; 45 ° "Horn" roto~.ion=2O* ~; Horn ongle linear w;th ?c ce
I I0 15 20
Force Oh3
FIG. 43. Aileron forces and gearings.
/ Aireraf~ /
/ /
/ , / / ' / ~ I
/ / Rudder gearing :- , ~ Simulator 3"75" pedal ~.rav
Aircraft ~" p=dol ~.ravel= 3C
I I o ~o 80 12o 16o
Force 0b)
)* ~; linear C; linear
I0o
F(h)
8 0
80
4 0
2 0
i ~o 4 0 60 80 I oo
FIG. 44. Rudder forces and gearings. FIG. 45. Pitching moment ground-effect parameter.
R. & M. No. 3660
~) Crown copyright 1971
Published by HER MAJESTY'S STATIONERY OFFICE
To be purchased from 49 High Holborn, London WCIV 6HB 13a Castle Street, Edinburgh EH2 3AR 109 St Mary Street, CardiffCF1 1JW
Brazennose Street, Manchester M60 8AS 50 Fairfax Street. Bristol BSI 3DE
258 Broad Street, Birmingham BI 2HE 80 Chichester Street. Belfast BTI 4JY
or through booksellers
R. & Mo No. 3660
S B N 11 470380 9
Related Documents