FUNCTIONAL CONNECTIVITY EIGENNETWORKS REVEAL DIFFERENT BRAIN DYNAMICS IN MULTIPLE SCLEROSIS PATIENTS Nora Leonardi 1,2 , Jonas Richiardi 1,2,3 , Dimitri Van De Ville 1,2 1 Medical Image Processing Lab, Ecole Polytechnique F´ ed´ erale de Lausanne, Lausanne, CH 2 Department of Radiology and Medical Informatics, University of Geneva, Geneva, CH 3 Functional Imaging in Neuropsychiatric Disorders Lab, Stanford University, Palo Alto, USA ABSTRACT Resting state functional connectivity is defined as correlations in brain activity measured by functional magnetic resonance imaging without any stimulation paradigm. Such connectiv- ity is dynamic, even over the course of minutes, and the de- velopment of tools for its analysis is an important challenge in neuroscience. We propose a novel data-driven technique to extract connectivity patterns from dynamic whole-brain net- works of multiple subjects. Our technique is based on singu- lar value decomposition and decomposes a collection of net- works into linearly independent “eigennetworks” and associ- ated time courses. To deal with the temporal redundancy of networks, we propose a novel subsampling method based on the standard deviation of the connectivity strength. We apply the proposed technique to dynamic resting-state networks of healthy subjects and multiple sclerosis patients, and show its potential to detect aberrant connectivity patterns in patients. Index Terms— fMRI, dynamic functional connectivity, complex networks, matrix decomposition, multiple sclerosis 1. INTRODUCTION Understanding how human brain networks evolve over time, even across time spans as short as a couple of minutes, is a crucial challenge in neuroscience. Functional brain net- works are typically estimated from functional magnetic res- onance imaging (fMRI) data, which is a proxy for brain ac- tivity. Functional connectivity (FC) is defined as temporal correlations between the activity of distinct brain areas, and resting-state (RS) FC is estimated from data in the absence of a task. Interestingly, the activity of areas with similar func- tional properties, such as the primary motor cortex, is also co- herent during RS [1]. Similar results have since been reported for other functional networks, leading to novel insights about the functional organisation of the brain. Most studies assume FC to be stationary across the duration of a RS scan. How- ever, recent studies have shown that RSFC is highly dynamic This work was supported by the Swiss National Science Foundation (grant PP00P2-123438), the Soci´ et´ e Acad´ emique de Gen` eve, the FORE- MANE foundation, the Center for Biomedical Imaging (CIBM). [2, 3, 4] and that these fluctuations persist in the absence of conscious, cognitive processing in anesthetized monkeys [5]. These results suggest that the dynamic nature of RSFC re- flects an inherent property of the brain’s functional organi- zation and that common stationary analyses are an oversim- plification. Most studies analyzing dynamic FC focus on a single brain region or functional network and how its connec- tivity changes over time. Discovering FC patterns in dynamic whole-brain networks is a challenging task. Since the nature of RS is unconstrained, any patterns need to be identified in a data-driven manner. Allen et al. [6] recently extracted con- nectivity states from dynamic whole-brain RSFC networks in a data-driven manner using k-means clustering. In this work, we propose a novel approach to extract con- nectivity patterns from multi-subject, dynamic whole-brain FC networks. Our technique is based on the singular value decomposition (SVD) and decomposes a set of networks into “eigennetworks”, or building blocks of functional connec- tivity, and associated time courses. To deal with the re- dundancy of networks that are close in time, we subsam- ple the set of networks by retaining only networks at “peak times”, which we define as those having a large standard de- viation of FC strength. This selection procedure is inspired by electroencephalogram (EEG) topographical analysis, where global field power is computed as standard deviation of volt- ages across electrodes [7]. We apply the proposed technique to dynamic RSFC net- works from healthy subjects and minimally disabled relapse- remitting multiple sclerosis (MS) patients. MS is an autoim- mune disease of the central nervous system and disturbs both structural and functional connectivity [8]. Altered station- ary FC has been linked with disease progression and cog- nitive impairment in MS patients and the analysis of RSFC promises to yield novel insights into the functional impact of MS [9, 10]. The paper is organized as follows. In Sect. 2, we describe the complete data processing and analysis pipeline. In Sect. 3, we demonstrate the potential of the proposed approach to identify differences in RSFC dynamics between controls and patients. 2013 IEEE 10th International Symposium on Biomedical Imaging: From Nano to Macro San Francisco, CA, USA, April 7-11, 2013 978-1-4673-6454-6/13/$31.00 ©2013 IEEE 524

Welcome message from author
This document is posted to help you gain knowledge. Please leave a comment to let me know what you think about it! Share it to your friends and learn new things together.
Transcript
FUNCTIONAL CONNECTIVITY EIGENNETWORKS REVEAL DIFFERENTBRAIN DYNAMICS IN MULTIPLE SCLEROSIS PATIENTS
Nora Leonardi1,2, Jonas Richiardi1,2,3, Dimitri Van De Ville1,2
1Medical Image Processing Lab, Ecole Polytechnique Federale de Lausanne, Lausanne, CH2Department of Radiology and Medical Informatics, University of Geneva, Geneva, CH
3Functional Imaging in Neuropsychiatric Disorders Lab, Stanford University, Palo Alto, USA
ABSTRACTResting state functional connectivity is defined as correlationsin brain activity measured by functional magnetic resonanceimaging without any stimulation paradigm. Such connectiv-ity is dynamic, even over the course of minutes, and the de-velopment of tools for its analysis is an important challengein neuroscience. We propose a novel data-driven technique toextract connectivity patterns from dynamic whole-brain net-works of multiple subjects. Our technique is based on singu-lar value decomposition and decomposes a collection of net-works into linearly independent “eigennetworks” and associ-ated time courses. To deal with the temporal redundancy ofnetworks, we propose a novel subsampling method based onthe standard deviation of the connectivity strength. We applythe proposed technique to dynamic resting-state networks ofhealthy subjects and multiple sclerosis patients, and show itspotential to detect aberrant connectivity patterns in patients.
Index Terms— fMRI, dynamic functional connectivity,complex networks, matrix decomposition, multiple sclerosis
1. INTRODUCTION
Understanding how human brain networks evolve over time,even across time spans as short as a couple of minutes, isa crucial challenge in neuroscience. Functional brain net-works are typically estimated from functional magnetic res-onance imaging (fMRI) data, which is a proxy for brain ac-tivity. Functional connectivity (FC) is defined as temporalcorrelations between the activity of distinct brain areas, andresting-state (RS) FC is estimated from data in the absenceof a task. Interestingly, the activity of areas with similar func-tional properties, such as the primary motor cortex, is also co-herent during RS [1]. Similar results have since been reportedfor other functional networks, leading to novel insights aboutthe functional organisation of the brain. Most studies assumeFC to be stationary across the duration of a RS scan. How-ever, recent studies have shown that RSFC is highly dynamic
This work was supported by the Swiss National Science Foundation(grant PP00P2-123438), the Societe Academique de Geneve, the FORE-MANE foundation, the Center for Biomedical Imaging (CIBM).
[2, 3, 4] and that these fluctuations persist in the absence ofconscious, cognitive processing in anesthetized monkeys [5].These results suggest that the dynamic nature of RSFC re-flects an inherent property of the brain’s functional organi-zation and that common stationary analyses are an oversim-plification. Most studies analyzing dynamic FC focus on asingle brain region or functional network and how its connec-tivity changes over time. Discovering FC patterns in dynamicwhole-brain networks is a challenging task. Since the natureof RS is unconstrained, any patterns need to be identified ina data-driven manner. Allen et al. [6] recently extracted con-nectivity states from dynamic whole-brain RSFC networks ina data-driven manner using k-means clustering.
In this work, we propose a novel approach to extract con-nectivity patterns from multi-subject, dynamic whole-brainFC networks. Our technique is based on the singular valuedecomposition (SVD) and decomposes a set of networks into“eigennetworks”, or building blocks of functional connec-tivity, and associated time courses. To deal with the re-dundancy of networks that are close in time, we subsam-ple the set of networks by retaining only networks at “peaktimes”, which we define as those having a large standard de-viation of FC strength. This selection procedure is inspired byelectroencephalogram (EEG) topographical analysis, whereglobal field power is computed as standard deviation of volt-ages across electrodes [7].
We apply the proposed technique to dynamic RSFC net-works from healthy subjects and minimally disabled relapse-remitting multiple sclerosis (MS) patients. MS is an autoim-mune disease of the central nervous system and disturbs bothstructural and functional connectivity [8]. Altered station-ary FC has been linked with disease progression and cog-nitive impairment in MS patients and the analysis of RSFCpromises to yield novel insights into the functional impact ofMS [9, 10].
The paper is organized as follows. In Sect. 2, we describethe complete data processing and analysis pipeline. In Sect. 3,we demonstrate the potential of the proposed approach toidentify differences in RSFC dynamics between controls andpatients.
2013 IEEE 10th International Symposium on Biomedical Imaging:From Nano to MacroSan Francisco, CA, USA, April 7-11, 2013
978-1-4673-6454-6/13/$31.00 ©2013 IEEE 524
2. ESTIMATION OF EIGENNETWORKS
2.1. Data processing and dynamic FC estimation
Functional imaging data was realigned and motion-correctedusing SPM8, linearly detrended, low-pass filtered and nui-sance variables regressed out (6 head realignment parameters,averaged cerebrospinal fluid and white matter signal). Theanatomical image was parcellated into N = 90 regions cor-responding to the Automated Anatomic Labeling atlas [11].Due to signal dropout in ventral regions, the globus palliduswas excluded from the analysis, resulting in N = 88 regionsbeing kept. Regional time series were estimated by averagingthe functional data in each anatomical region.
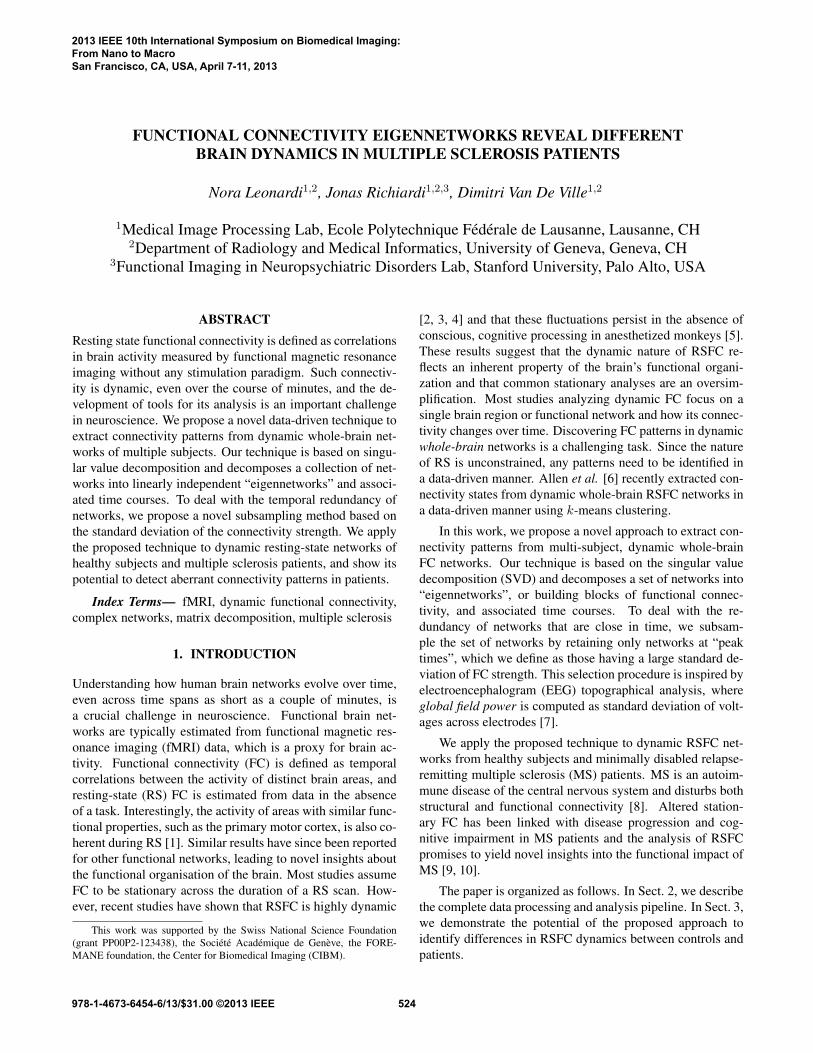
To estimate dynamic connectivity we used a sliding-window technique [2]. We computed pair-wise windowed in-terregional correlations ρxy(t) = corr(x[t, t + ∆t], y[t, t +∆t]), where t = 1, 2, ..., 400 and ∆t = 40 is the windowsize, which includes typical RSFC fluctuations [4, 5, 6]. EachN × N correlation matrix A was approximately Gaussian-ized by using the Fisher R-to-Z transform and normalized byits `1-norm.
2.2. Estimation of connectivity patterns
We describe the set of dynamic networks by vectoriz-ing and concatenating the correlation matrices across win-dows and subjects to form a N2−N
2 × TS matrix A =[triu(A1)|triu(A2)|...|triu(ATS)], where we keep only theupper triangular part because of symmetry, T is the numberof windows and S the number of subjects (Fig. 1). Since thereis no temporal correspondence across subjects for RS scans,we concatenated the correlation vectors a = triu(A) acrosssubjects instead of forming a third-order array.
Because of the sliding-window technique adjacent corre-lation matrices are similar. To deal with this redundancy, wepropose to subsample the TS networks using an approach in-spired by EEG topographical analysis [7]: We retained cor-relation vectors a corresponding to peaks of “global connec-tivity power” (GCP), where GCP was defined as the standarddeviation of each a, and peaks as local maxima of GCP. GCPis high for correlation vectors with pronounced variability andlow for ones with similar strength (Fig. 1).
We then balanced the number of vectors a in the healthyand patient groups by randomly subsampling the patientgroup. We decomposed the reduced matrix containing onlythe correlation vectors marked as peaks after subsampling inthe patient group using SVD, i.e., Areduced = USVT , whereU contains spatial maps of connectivity patterns, which wecall eigennetworks and that can be interpreted as buildingblocks of dynamic RSFC, and V the associated time courses.We then projected A onto the eigennetworks, i.e., T = UTA,to obtain time courses of length T for each subject and eigen-network. We tested for significant differences in the timecourse means associated with the first 10 eigennetworks of
Fig. 1: Example dynamic functional connectivity estimation for ahealthy subject: vectorized and temporally concatenated correlationmatrices; and GCP of each correlation vector.
the two groups using Hotelling’s T2 multivariate test and post-hoc two-sample t tests. We compared only the mean since in-dividual windows can not be assumed to be consistent acrosssubjects.
From the loadings w of Hotelling’s T2 test, we con-structed a difference network, i.e., the weighted sumU[1,10]w across the first 10 eigennetworks, where theweights were such that the group difference was maximised:maxw
wTµHC −wTµMS , s.t. ||w|| = 1, with µ the vector oftime course means.
2.3. Relationship with motion
To investigate relationships between motion and non-stationarity in whole-brain connectivity, we converted eachsubject’s head realignment parameters into two measures ofdisplacement in 3-D space between adjacent scans: D1 =√
∆x2 + ∆y2 + ∆z2, and D2 = |∆x| + |∆y| + |∆z| +|∆α|+ |∆β|+ |∆γ|, where rotational displacements α, β, γwere converted to millimetres by calculating the displacementon the surface of a sphere of radius 50 mm [12]. We convertedD1 and D2 to a measure for each window by estimating theintensity (average) and fluctuation of motion (standard devia-tion) in each window.
We then computed Pearson’s correlation coefficient be-tween the motion statistics time series and the GCP peak timeseries as well as the V time series for each subject. Statis-tically significant correlations with motion were determinedby estimating a maximal statistic under the null hypothesis:i.e., observed correlations in the 95th percentile of the nulldistribution of phase randomised time series are significant atthe 5% level (n = 1′000 randomisations, corrected p value)[13]. Phase-randomised time series preserve mean, varianceand autocorrelation properties [4, 14].
525
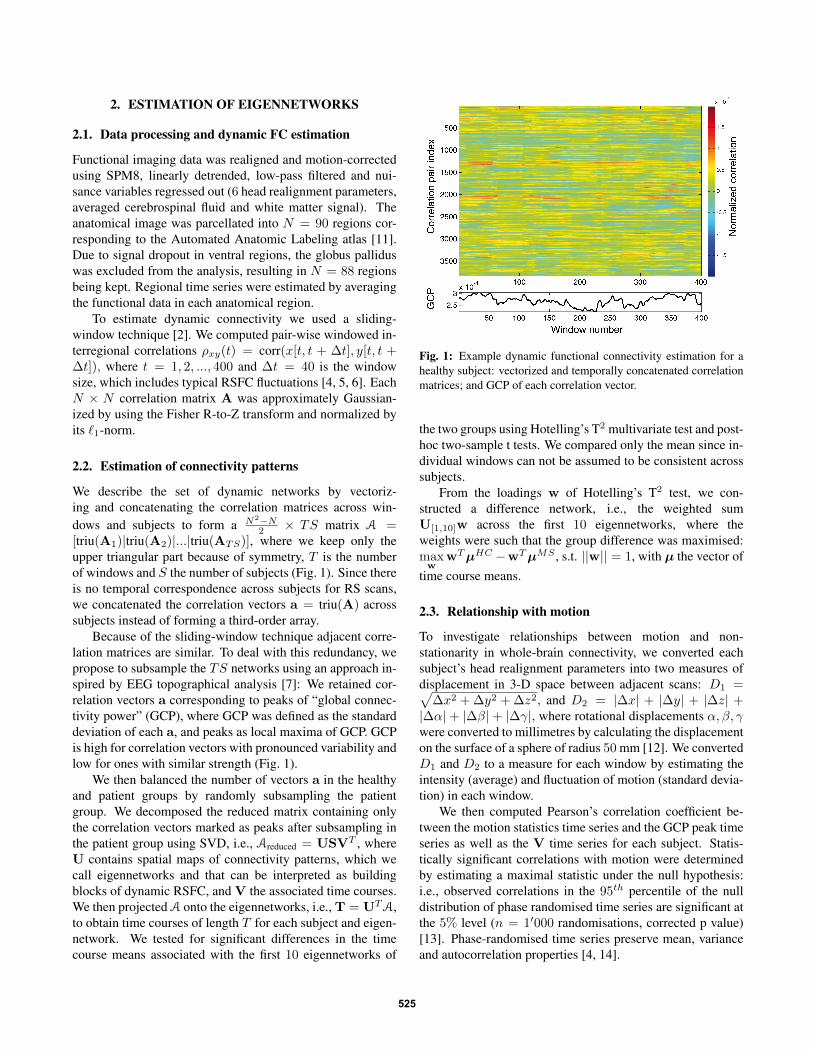
(a) Eigennetwork 1 (b) Eigennetwork 2 (c) Eigennetwork 3 (d) Eigennetwork 4 (e) Eigennetwork 5
(f) Eigennetwork 6 (g) Eigennetwork 7 (h) Eigennetwork 8 (i) Eigennetwork 9 (j) Eigennetwork 500
Fig. 2: Eigennetworks 1− 9 and 500 and the average time course of healthy subjects (black line) and MS patients (gray line). The columnsof U were reshaped as upper triangular matrices and symmetrized. Colorbars are symmetric around zero, red thus corresponds to positiveand blue to negative signs. Brain regions are arranged with homologous regions adjacent to each other and are ordered by lobe (central1, 2, 57, 58, frontal 3− 28, limbic 29− 42, occipital 43− 56, parietal 59− 68, subcortical 71− 76, temporal 77− 88).
3. EXPERIMENTAL RESULTS
3.1. Participants and data acquisition
The dataset included 13 healthy subjects and 22 minimallydisabled relapsing-remitting MS patients (mean ± SD Ex-panded Disability Status Scale 1.9 ± 0.4) [10]. The restingstate functional scan was acquired on a Siemens 3T TrioTIM(TR/TE/FA = 1.1 s/27 ms/90◦, matrix = 64×64, voxel size =3.75×3.75×5.63 mm3, 21 contiguous transverse slices, 450volumes). Subjects were instructed to lie still with their eyesclosed and to let their mind wander. The anatomical scanwas acquired using a 3-D T1-weighted MPRAGE sequence(160 slices, TR/TE/FA= 2.4 s/2.98 ms/9◦, matrix = 256×240,voxel size = 1×1×1.2 mm3).
3.2. Eigennetworks
The 4 motion measures were not significantly different be-tween healthy subjects and MS patients (p > 0.05) and notsignificantly correlated with GCP (p > 0.05).
Fig. 2 shows some of the connectivity patterns cap-tured by the SVD, which represent connections with coher-ent (same sign) or incoherent fluctuations (different signs).
The first eigennetworks, which explain most of the varianceacross the dynamic FC matrices, identify large-scale struc-tures. The average network contains well-known functionalclusters (Fig. 2a): a strongly connected visual cortex (nodes43−56), auditory processing areas (79−86), and motor areas(1, 2, 19, 20, 57, 58). Coherently fluctuating connections arefor example connections between the visual cortex (43− 56)and motor areas (1, 2, 17, 18, 57, 58, 69, 70, blue in eigennet-work 2) or between regions belonging to the default modenetwork (23 − 26, 31, 35, 36, 65, 67, 68, red in eigennetwork5). Eigennetworks of very high components correspond tonoise (Fig. 2j). The time courses of the eigennetworks (i.e.,the corresponding columns in V) were not significantly cor-related with the 4 motion measures (p > 0.05).
The average projected time course T of each group isshown atop the eigennetworks in Fig. 2 and represents thecontribution of this eigennetwork or building block to thecorrelation matrix at any given window. Even though RSbehavior cannot be assumed temporally consistent betweensubjects, visual inspection of the mean time courses revealssome differences already. Next, we tested for significant dif-ferences in the mean of the 10 first time courses between thetwo groups using Hotelling’s T2 test. (The subset of 10 eigen-
526
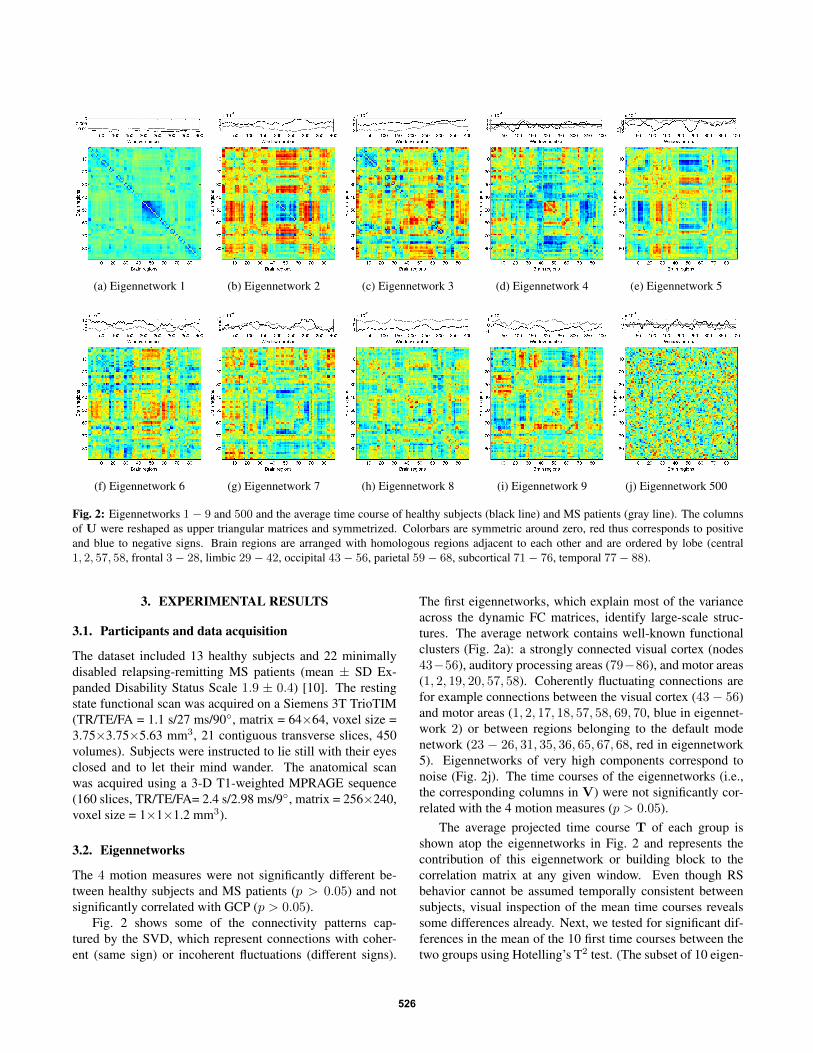
Fig. 3: Discriminative network: weighted sum of eigennetworks1 − 10, where the weights were according to their importance inseparating the two groups in Hotelling’s T2 test.
networks retained 49% of the total variance.) Hotelling’s T2
test detected significant group (p = 0.006) and interaction ef-fects (p = 0.004). Post-hoc t tests identified differences ineigennetworks 1 and 8 (p < 0.001, p = 0.01, respectively).We observe that (1) the overall connectivity strength is re-duced in patients (|µMS
1 | < |µHC1 |, Fig. 2a), in accordance
with previous studies [9, 10], and (2) eigennetwork 8 cap-tures coherent dynamic connectivity that is either increasedin patients (red areas in Fig. 2h since µMS
8 > 0) or healthysubjects (blue areas since µHC
8 < 0).The difference network, which highlights differently con-
tributing eigennetworks, shows that most regions are morestrongly connected in healthy subjects (Fig. 3). To identifythe brain regions with the largest connectivity differences, wecalculated the degree of each brain region by summing overall its weighted connections. Regions with increased con-nectivity in healthy subjects included the pre- and postcentralgyri (1, 2, 57, 58), the cuneus (45, 46), lingual gyrus (47, 48),superior parietal gyrus (59, 60), right superior temporal pole(82), and left paracentral lobule (69). Regions with increasedconnectivity in patients included the right insula (30), rightamygdala (42), left posterior cingulate gyrus (35), left thala-mus (75), and left parahippocampus (39).
4. CONCLUSION
We have presented a novel approach to identify whole-brainFC patterns, so-called “eigennetworks”, from dynamic net-works in a data-driven manner, and shown that they representmeaningful functional clusters. The comparison of FC dy-namics between healthy subjects and MS patients revealeddifferences in the contribution of these eigennetworks acrossthe duration of the scan. While the stationary FC profile ofsome of these regions has previously been reported to be dis-criminative between the two groups [10], our analysis of dy-
namic FC complements this study by identifying further re-gions with aberrant FC. The proposed data-driven techniquefor dynamic brain networks holds promise for the study ofhow brain dynamics are altered in disease.
5. ACKNOWLEDGEMENTS
The authors thank P. Schluep, S. Simioni, J.-M. Annoni, M.Gschwind and P. Vuilleumier for sharing the data.
6. REFERENCES
[1] B. Biswal, F. Z. Yetkin, V. M. Haughton, and J. S. Hyde,“Functional connectivity in the motor cortex of resting humanbrain using echo-planar mri.,” Magn Reson Med, vol. 34, no.4, pp. 537–541, Oct 1995.
[2] C. Chang and G. Glover, “Time-frequency dynamics ofresting-state brain connectivity measured with fMRI,” Neu-roImage, vol. 50, no. 1, pp. 81–98, Mar. 2010.
[3] V. Kiviniemi, T. Vire, J. Remes, A. A. Elseoud, T. Starck,O. Tervonen, and J. Nikkinen, “A sliding time-window ICAreveals spatial variability of the default mode network in time,”Brain Connect, vol. 1, no. 4, pp. 339–347, Oct 2011.
[4] D. A. Handwerker, V. Roopchansingh, J. Gonzalez-Castillo,and P. A. Bandettini, “Periodic changes in fMRI connectivity,”Neuroimage, vol. 63, no. 3, pp. 1712–1719, Jul 2012.
[5] R. M. Hutchison, T. Womelsdorf, J. S. Gati, S. Everling,and R. S. Menon, “Resting-state networks show dynamicfunctional connectivity in awake humans and anesthetizedmacaques,” Hum Brain Mapp, Mar 2012.
[6] E. A. Allen, E. Damaraju, S. M. Plis, E. B. Erhardt, T. Eichele,and V. D. Calhoun, “Tracking whole-brain connectivity dy-namics in the resting state,” Cerebral Cortex, 2012.
[7] R. D. Pascual-Marqui, C. M. Michel, and D. Lehmann, “Seg-mentation of brain electrical activity into microstates: modelestimation and validation.,” IEEE Trans Biomed Eng, vol. 42,no. 7, pp. 658–665, Jul 1995.
[8] M. Filippi, F. Agosta, E. G. Spinelli, and M. A. Rocca, “Imag-ing resting state brain function in multiple sclerosis.,” J Neurol,Oct 2012.
[9] M. A. Rocca, P. Valsasina, M. Absinta, G. Riccitelli, M. E.Rodegher, P. Misci, P. Rossi, A. Falini, G. Comi, and M. Fil-ippi, “Default-mode network dysfunction and cognitive im-pairment in progressive MS,” Neurology, vol. 74, no. 16, pp.1252–1259, Apr 2010.
[10] J. Richiardi, M. Gschwind, S. Simioni, J.-M. Annoni,B. Greco, P. Hagmann, M. Schluep, P. Vuilleumier, and D. VanDe Ville, “Classifying minimally disabled multiple sclerosispatients from resting state functional connectivity,” NeuroIm-age, vol. 62, no. 3, pp. 2021–2033, Sep 2012.
[11] N. Tzourio-Mazoyer, B. Landeau, D. Papathanassiou, F. Criv-ello, O. Etard, N. Delcroix, B. Mazoyer, and M. Joliot, “Au-tomated anatomical labeling of activations in SPM using amacroscopic anatomical parcellation of the MNI MRI single-subject brain,” NeuroImage, vol. 15, no. 1, pp. 273–289, Jan.2002.
[12] J. D. Power, K. A. Barnes, A. Z. Snyder, B. L. Schlaggar, andS. E. Petersen, “Spurious but systematic correlations in func-tional connectivity MRI networks arise from subject motion,”Neuroimage, vol. 59, no. 3, pp. 2142–2154, Feb 2012.
[13] T. E. Nichols and A. P. Holmes, “Nonparametric permutationtests for functional neuroimaging: a primer with examples.,”Hum Brain Mapp, vol. 15, no. 1, pp. 1–25, Jan 2002.
[14] J. Theiler, S. Eubank, A. Longtin, B. Galdrikian, and J. D.Farmer, “Testing for nonlinearity in time series: the methodof surrogate data,” Physica D: Nonlinear Phenomena, vol. 58,no. 14, pp. 77 – 94, 1992.
527
Related Documents