Review Article Frontiers in optical imaging of cerebral blood flow and metabolism Anna Devor 1,2,3 , Sava Sakadz ˇic ´ 3 , Vivek J Srinivasan 3 , Mohammad A Yaseen 3 , Krystal Nizar 1 , Payam A Saisan 1 , Peifang Tian 1,4 , Anders M Dale 1,2 , Sergei A Vinogradov 5 , Maria Angela Franceschini 3 and David A Boas 3 1 Department of Neurosciences, UCSD, La Jolla, California, USA; 2 Department of Radiology, UCSD, La Jolla, California, USA; 3 Martinos Center for Biomedical Imaging, MGH, Harvard Medical School, Charlestown, Massachusetts, USA; 4 Department of Physics, John Carroll University, University Heights, Ohio, USA; 5 Department of Biochemistry and Biophysics, University of Pennsylvania, Philadelphia, Pennsylvania, USA In vivo optical imaging of cerebral blood flow (CBF) and metabolism did not exist 50 years ago. While point optical fluorescence and absorption measurements of cellular metabolism and hemoglobin concentrations had already been introduced by then, point blood flow measurements appeared only 40 years ago. The advent of digital cameras has significantly advanced two- dimensional optical imaging of neuronal, metabolic, vascular, and hemodynamic signals. More recently, advanced laser sources have enabled a variety of novel three-dimensional high-spatial- resolution imaging approaches. Combined, as we discuss here, these methods are permitting a multifaceted investigation of the local regulation of CBF and metabolism with unprecedented spatial and temporal resolution. Through multimodal combination of these optical techniques with genetic methods of encoding optical reporter and actuator proteins, the future is bright for solving the mysteries of neurometabolic and neurovascular coupling and translating them to clinical utility. Journal of Cerebral Blood Flow & Metabolism advance online publication, 18 January 2012; doi:10.1038/jcbfm.2011.195 Keywords: energy metabolism; hemodynamic; homeostasis; in vivo imaging; neurovascular Introduction With this Special Issue we celebrate 50 years of dedicated symposia on Cerebral Blood Flow and Metabolism. During the past half century we, as a research community, have accumulated a consider- able body of experimental and theoretical knowledge on cellular metabolic pathways in health and disease, identified a variety of vasoactive substances, established correlations between vascular, metabolic, and neuronal parameters, developed computational models and took aboard a broad suite of methodo- logies. Yet, a central piece of the cerebrovascular puzzle is missing: Despite a number of hypotheses (for recent reviews see Attwell et al, 2010; Cauli and Hamel, 2010; Hamilton et al, 2010; Iadecola and Nedergaard, 2007; Kleinfeld et al, 2011; Paulson et al, 2010), we still do not have a clear mechanistic understanding of local regulation of cerebral blood flow (CBF) and metabolism by neuronal activity. By ‘mechanistic’ we mean determining causal relation- ships and identifying molecular messengers, which communicate a change in neuronal activity to the vasculature causing dilation or constriction. What makes the neurovascular signaling so difficult to grasp and what is required for a breakthrough? In this essay, we argue that further advancement in a mechanistic understanding of neurovascular com- munication and dynamic regulation of blood flow critically depends on the advent of new imaging technologies with microscopic resolution applicable to in vivo studies. Received 16 September 2011; revised 18 November 2011; accepted 29 November 2011 Correspondence: Dr A Devor, Departments of Neurosciences and Radiology, University of California San Diego, San Diego, La Jolla, CA, USA. E-mail: [email protected] or Dr DA Boas, Martinos Center for Biomedical Imaging, MGH, Harvard Medical School, Charlestown, MA 02129, USA. E-mail: [email protected] The authors gratefully acknowledge support from the National Institute of Health: NS051188, NS057198, NS057476, NS055104, EB00790, EB009118, EB007279, and K99NS067050; American Heart Association: 11SDG7600037 and 11IRG5440002; and the Glaucoma Research Foundation. Journal of Cerebral Blood Flow & Metabolism (2012), 1–18 & 2012 ISCBFM All rights reserved 0271-678X/12 $32.00 www.jcbfm.com

Welcome message from author
This document is posted to help you gain knowledge. Please leave a comment to let me know what you think about it! Share it to your friends and learn new things together.
Transcript
Review Article
Frontiers in optical imaging of cerebral blood flowand metabolism
Anna Devor1,2,3, Sava Sakadzic3, Vivek J Srinivasan3, Mohammad A Yaseen3, Krystal Nizar1,Payam A Saisan1, Peifang Tian1,4, Anders M Dale1,2, Sergei A Vinogradov5,Maria Angela Franceschini3 and David A Boas3
1Department of Neurosciences, UCSD, La Jolla, California, USA; 2Department of Radiology, UCSD, La Jolla,California, USA; 3Martinos Center for Biomedical Imaging, MGH, Harvard Medical School, Charlestown,Massachusetts, USA; 4Department of Physics, John Carroll University, University Heights, Ohio, USA;5Department of Biochemistry and Biophysics, University of Pennsylvania, Philadelphia, Pennsylvania, USA
In vivo optical imaging of cerebral blood flow (CBF) and metabolism did not exist 50 years ago.While point optical fluorescence and absorption measurements of cellular metabolism andhemoglobin concentrations had already been introduced by then, point blood flow measurementsappeared only 40 years ago. The advent of digital cameras has significantly advanced two-dimensional optical imaging of neuronal, metabolic, vascular, and hemodynamic signals. Morerecently, advanced laser sources have enabled a variety of novel three-dimensional high-spatial-resolution imaging approaches. Combined, as we discuss here, these methods are permitting amultifaceted investigation of the local regulation of CBF and metabolism with unprecedented spatialand temporal resolution. Through multimodal combination of these optical techniques with geneticmethods of encoding optical reporter and actuator proteins, the future is bright for solving themysteries of neurometabolic and neurovascular coupling and translating them to clinical utility.Journal of Cerebral Blood Flow & Metabolism advance online publication, 18 January 2012; doi:10.1038/jcbfm.2011.195
Keywords: energy metabolism; hemodynamic; homeostasis; in vivo imaging; neurovascular
Introduction
With this Special Issue we celebrate 50 years ofdedicated symposia on Cerebral Blood Flow andMetabolism. During the past half century we, as aresearch community, have accumulated a consider-able body of experimental and theoretical knowledgeon cellular metabolic pathways in health anddisease, identified a variety of vasoactive substances,
established correlations between vascular, metabolic,and neuronal parameters, developed computationalmodels and took aboard a broad suite of methodo-logies. Yet, a central piece of the cerebrovascularpuzzle is missing: Despite a number of hypotheses(for recent reviews see Attwell et al, 2010; Cauli andHamel, 2010; Hamilton et al, 2010; Iadecola andNedergaard, 2007; Kleinfeld et al, 2011; Paulsonet al, 2010), we still do not have a clear mechanisticunderstanding of local regulation of cerebral bloodflow (CBF) and metabolism by neuronal activity. By‘mechanistic’ we mean determining causal relation-ships and identifying molecular messengers, whichcommunicate a change in neuronal activity to thevasculature causing dilation or constriction. Whatmakes the neurovascular signaling so difficult tograsp and what is required for a breakthrough? Inthis essay, we argue that further advancement in amechanistic understanding of neurovascular com-munication and dynamic regulation of blood flowcritically depends on the advent of new imagingtechnologies with microscopic resolution applicableto in vivo studies.
Received 16 September 2011; revised 18 November 2011; accepted29 November 2011
Correspondence: Dr A Devor, Departments of Neurosciences andRadiology, University of California San Diego, San Diego, La Jolla,CA, USA.E-mail: [email protected] orDr DA Boas, Martinos Center for Biomedical Imaging, MGH,Harvard Medical School, Charlestown, MA 02129, USA.E-mail: [email protected]
The authors gratefully acknowledge support from the National
Institute of Health: NS051188, NS057198, NS057476, NS055104,
EB00790, EB009118, EB007279, and K99NS067050; American
Heart Association: 11SDG7600037 and 11IRG5440002; and the
Glaucoma Research Foundation.
Journal of Cerebral Blood Flow & Metabolism (2012), 1–18& 2012 ISCBFM All rights reserved 0271-678X/12 $32.00
www.jcbfm.com
The most intuitive scenario for neurovascularcoupling might be that in which consumption ofenergy by neuronal tissue provides a feedback signalto the feeding vasculature: Changes in neuronalactivity drive changes in energy metabolism, whichthen drive vasodilation/constriction and the asso-ciated changes in blood flow. This idea, usuallyreferred to as the ‘metabolic hypothesis,’ comes indifferent flavors with relation to the putative mole-cular mediators, including lactate, NAD+/NADH(nicotinamide adenine dinucleotide) ratio, ATP/ADP ratio, adenosine, and an (unidentified) O2
sensor (Paulson et al, 2010; Raichle and Mintun,2006). As an alternative hypothesis, changes inneuronal activity can drive vasodilation and vaso-constriction by feed-forward mechanisms releasingneurotransmitter and neuropeptide moleculesrelated to neuronal signaling (Attwell et al, 2010;Cauli and Hamel, 2010). In this ‘neurogenic hypo-thesis,’ blood flow and energy metabolism are drivenin parallel by neuronal activity. Astrocytes, ‘morethan a glue’ of the central nervous system (Allamanet al, 2011; Fiacco et al, 2009; Giaume et al, 2010;Iadecola and Nedergaard, 2007; Koehler et al, 2009),can potentially have a role in both scenarios: viarelease of vasoactive metabolic biproducts (meta-bolic) or synthesis and release of vasoactive glio-transmitters in response to neurotransmitters andneuropeptides (neurogenic). Supportive evidence forboth hypotheses has been derived from experimentsin isolated tissue: brain slices, excised vessels, andeven cell cultures. Of these, brain slice preparationproduced a wealth of data in experiments withcontrolled perfusion, pharmacological manipula-tions, and excitation of single neurons with identi-fied phenotypes (Cauli et al, 2004; Gordon et al,2008; Zonta et al, 2003). However, homeostasis ofbrain slices departs from that in vivo in many ways(Huchzermeyer et al, 2008; Turner et al, 2007).Significantly, many of these departures are unknownor difficult to quantify, sometimes making extrapola-tion of the observed phenomena to the in vivosituation uncertain.
The ability to descend to the single-cell and single-capillary levels in vivo and observe firing ofindividual neurons, vasodilation, glucose uptake,and infusion of O2 into the tissue—all while directlycontrolling neuronal activity—has long been a dreamof scientists interested in understanding the complexregulation of blood flow and metabolism as relatedto neuronal activity. However, in contrast to thedetailed and elegant mechanistic studies in isolatedtissue, in vivo reports have, in the main, focusedsimply on correlations between the ‘observables,’limited by the available methods. This ‘too hard todo’ status quo for mechanistic studies in vivo isstarting to change, due to rapid developments inoptical microscopy. In fact, already today, a versatilesuite of optical tools is available for high-resolution,high-sensitivity measurements of vascular, meta-bolic, and neuronal parameters in deep tissue and
local, cell-type specific manipulations of neuronalactivity. Below, we consider the current state of theart of a number of key optical microscopy technol-ogies that will be critical in the effort of graduatingfrom correlation driven to mechanistic approachesfor studies in vivo. The technological requirementsnecessary for this endeavor include
� Resolving single cells and single blood vessels;distinguishing local effects from global effects—‘spatial resolution’
� Sampling fast enough to reconstruct the time courseof dynamic processes—‘temporal resolution’
� Directly measuring variables of interest takingadvantage of natural changes in the optical proper-ties of tissue—‘intrinsic optical contrasts’
� Developing ‘optical reporters’ or ‘probes’ with highsensitivity and specificity
� Directly manipulating neuronal, vascular, andmetabolic activity—‘optical actuators’
� Imaging deep under the cortical surface—‘depthpenetration’
The tools suitable for unraveling the mechanics ofneurovascular and neurometabolic coupling will becomplemented by other noninvasive optical technol-ogies that will enable translation of the physiologicalfindings from animal to human studies and clinicalapplication. Importantly, these noninvasive opticaltechnologies can be used in both animals andhumans and thus can facilitate the connection ofmicroscopic to macroscopic observables from ani-mals to humans.
The arsenal of optical tools forneurovascular and neurometabolicstudies
The use of novel optical technologies has beeninstrumental for a number of central discoveries inboth basic and clinical neuroscience. Examples frombasic neuroscience include the fine mapping ofcortical functional organization (Grinvald et al,1986) and the discovery of glial calcium excitability(Cornell-Bell et al, 1990; Nedergaard, 1994). Amongthe clinical applications, optical tools playedan important role in the study of neurovascularand neurometabolic disregulation in animal modelsof stroke (Zhang and Murphy, 2007), epilepsy(Schwartz and Bonhoeffer, 2001), migraine (Bolayet al, 2002), and cancer (Barretto et al, 2011).Likewise, noninvasive optical technologies havestarted making inroads into bedside imaging of bloodflow and oxygen consumption in human patients(Grant et al, 2009; Mesquita et al, 2011).
Below, we highlight many of the optical methodsused for vascular, hemodynamic, metabolic, andneuronal imaging at different resolution scales—from cellular to macroscopic—with an emphasison in vivo methodology (Figure 1). We apologize in
Optical imaging of blood flow and metabolismA Devor et al
2
Journal of Cerebral Blood Flow & Metabolism (2012), 1–18
advance for the less-than-comprehensive coverage ofthis exceedingly broad topic. We have had to cite theliterature sparsely, but have strived to includesufficient citations to lead the reader to moredetailed information. Subcellular optical imagingmethods (e.g., fluorescence resonance energy transfer(FRET)-based fluorescent methods to track protein–protein interactions) are beyond the scope of thecurrent review.
Vascular and hemodynamic imaging
Optical imaging can utilize several endogenouscontrast mechanisms for vascular imaging, includinghemoglobin absorption, red blood cell (RBC) motion-induced Doppler shifts, and many exogenous fluor-escent contrast agents for labeling the blood plasmaor RBC. These different contrast mechanisms areused to image hemoglobin concentration and oxyge-nation changes, to image blood flow, and to obtainangiograms of the microvascular network (Table 1).
Hemoglobin Concentration and Oxygenation
Optical intrinsic signal imaging: Since hemoglobin isa dominant absorber in the brain tissue in the visibleand near-infrared spectrum, changes in hemoglobinconcentration and oxygenation associated withneuronal activity can be monitored and imaged viaoptical intrinsic signal imaging (OISI) (Figure 2A).Imaging of cerebral function using these intrinsicabsorption changes in vivo was demonstrated over 25years ago (Grinvald et al, 1986).
Optical intrinsic signal imaging is limited toimaging of the cortical surface, generally requiringa cranial window or thinned skull to illuminate thecortex with light and image the reflected light witha camera. The amount of light reflected from thecortical surface is modulated by changes in theabsorption coefficient of the tissue. These changesare related to changes in the concentrations ofHbO (oxy-hemoglobin) and Hb (deoxy-hemoglobin).Estimating the hemoglobin concentration changes,
Figure 1 Comparison of spatial resolution, temporal resolution,and penetration depth of neurovascular and neurometabolicoptical imaging techniques. Plot of the spatial and temporalresolutions of different optical techniques, with color-codedpenetration depth. These are guidelines, intended to relate thecurrently reported capabilities of different optical methods.Technological advances continue to improve the resolution andpenetration depth of each technique. Consequently, this figuredoes not constitute a definitive comparison of these techniques.
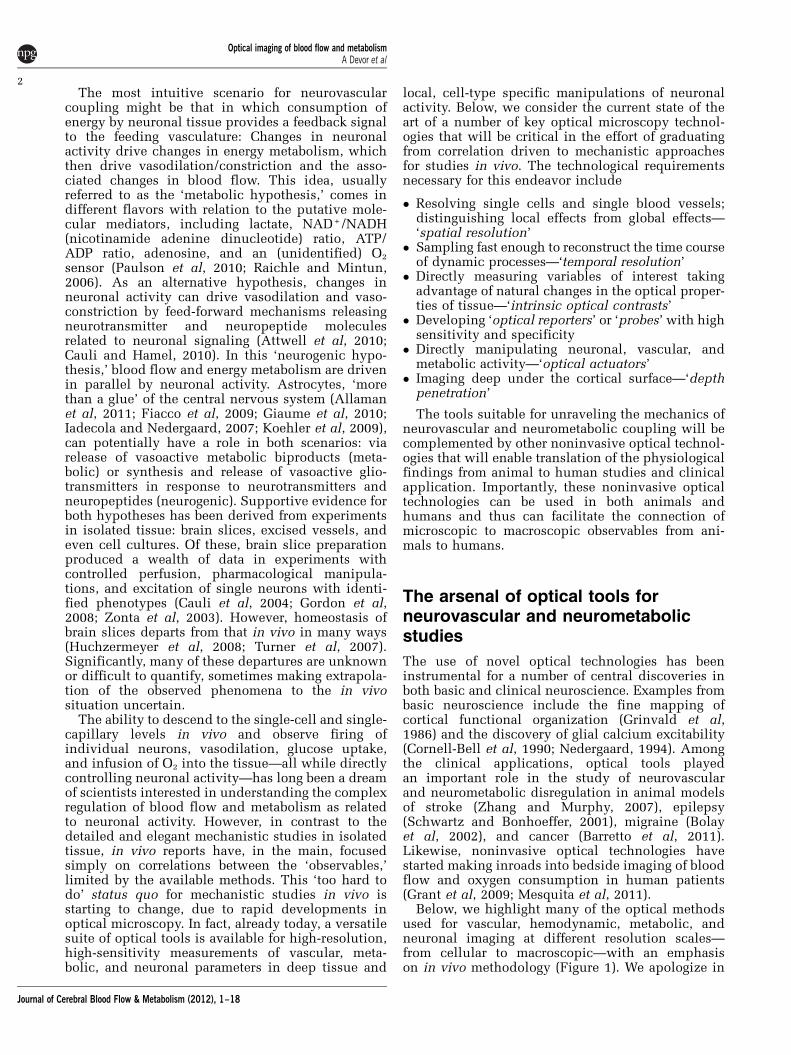
Table 1 Overview of measurable parameters of cerebral metabolism obtainable using optical techniques, and their associatedcontrast mechanisms
Measured parameter
Hb/SO2 Flow/velocity Angiograms Energy metabolism Electrical activity,ionic concentrations,and synaptic release
pO2, NADH,FAD, glucose
Cytochromes CMRO2a
Contrast mechanismAbsorption NIRS
OISIPAT
PAT NIRSOISI
NIRSOISIPAT
Widefield (CCD)(VSD)
Fluorescence/phosphorescence
TPM TPM TPMWidefield (CCD)
TPMWidefield(CCD)
TPMWidefield (CCD)(VSD, ionic indicators,pH dyes)
Scattering/Doppler
OCT LSCIDoppler OCTDCS
OCT OISI (fast signals)
CCD, charge-coupled device; CMRO2, cerebral metabolic rate of oxygen; DCS, diffuse correlation spectroscopy; FAD, flavin adenine dinucleotide; Hb, deoxy-hemoglobin; LSCI, laser speckle contrast imaging; NADH, nicotinamide adenine dinucleotide; NIRS, near-infrared spectroscopy; OCT, optical coherencetomography; OISI, optical intrinsic signal imaging; PAT, photoacoustic tomography; pO2, partial pressure of oxygen; SO2, hemoglobin oxygen saturation; TPM,two-photon microscopy; VSD, voltage-sensitive probes or dyes.Widefield imaging (CCD) represents a technique nearly identical to OISI, with the distinction that an exogenous contrast agent is observed.aObtainable when oxygenation measurements are coupled with flow measurements.
Optical imaging of blood flow and metabolismA Devor et al
3
Journal of Cerebral Blood Flow & Metabolism (2012), 1–18
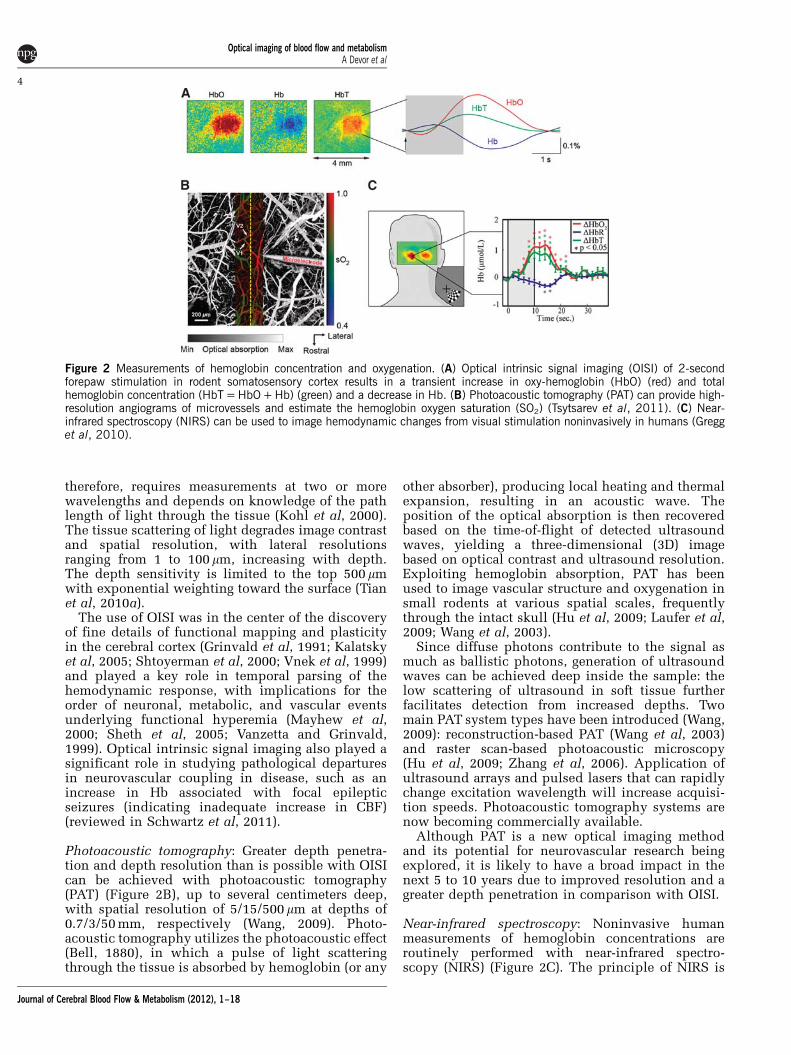
therefore, requires measurements at two or morewavelengths and depends on knowledge of the pathlength of light through the tissue (Kohl et al, 2000).The tissue scattering of light degrades image contrastand spatial resolution, with lateral resolutionsranging from 1 to 100 mm, increasing with depth.The depth sensitivity is limited to the top 500 mmwith exponential weighting toward the surface (Tianet al, 2010a).
The use of OISI was in the center of the discoveryof fine details of functional mapping and plasticityin the cerebral cortex (Grinvald et al, 1991; Kalatskyet al, 2005; Shtoyerman et al, 2000; Vnek et al, 1999)and played a key role in temporal parsing of thehemodynamic response, with implications for theorder of neuronal, metabolic, and vascular eventsunderlying functional hyperemia (Mayhew et al,2000; Sheth et al, 2005; Vanzetta and Grinvald,1999). Optical intrinsic signal imaging also played asignificant role in studying pathological departuresin neurovascular coupling in disease, such as anincrease in Hb associated with focal epilepticseizures (indicating inadequate increase in CBF)(reviewed in Schwartz et al, 2011).
Photoacoustic tomography: Greater depth penetra-tion and depth resolution than is possible with OISIcan be achieved with photoacoustic tomography(PAT) (Figure 2B), up to several centimeters deep,with spatial resolution of 5/15/500 mm at depths of0.7/3/50 mm, respectively (Wang, 2009). Photo-acoustic tomography utilizes the photoacoustic effect(Bell, 1880), in which a pulse of light scatteringthrough the tissue is absorbed by hemoglobin (or any
other absorber), producing local heating and thermalexpansion, resulting in an acoustic wave. Theposition of the optical absorption is then recoveredbased on the time-of-flight of detected ultrasoundwaves, yielding a three-dimensional (3D) imagebased on optical contrast and ultrasound resolution.Exploiting hemoglobin absorption, PAT has beenused to image vascular structure and oxygenation insmall rodents at various spatial scales, frequentlythrough the intact skull (Hu et al, 2009; Laufer et al,2009; Wang et al, 2003).
Since diffuse photons contribute to the signal asmuch as ballistic photons, generation of ultrasoundwaves can be achieved deep inside the sample: thelow scattering of ultrasound in soft tissue furtherfacilitates detection from increased depths. Twomain PAT system types have been introduced (Wang,2009): reconstruction-based PAT (Wang et al, 2003)and raster scan-based photoacoustic microscopy(Hu et al, 2009; Zhang et al, 2006). Application ofultrasound arrays and pulsed lasers that can rapidlychange excitation wavelength will increase acquisi-tion speeds. Photoacoustic tomography systems arenow becoming commercially available.
Although PAT is a new optical imaging methodand its potential for neurovascular research beingexplored, it is likely to have a broad impact in thenext 5 to 10 years due to improved resolution and agreater depth penetration in comparison with OISI.
Near-infrared spectroscopy: Noninvasive humanmeasurements of hemoglobin concentrations areroutinely performed with near-infrared spectro-scopy (NIRS) (Figure 2C). The principle of NIRS is
Figure 2 Measurements of hemoglobin concentration and oxygenation. (A) Optical intrinsic signal imaging (OISI) of 2-secondforepaw stimulation in rodent somatosensory cortex results in a transient increase in oxy-hemoglobin (HbO) (red) and totalhemoglobin concentration (HbT = HbO + Hb) (green) and a decrease in Hb. (B) Photoacoustic tomography (PAT) can provide high-resolution angiograms of microvessels and estimate the hemoglobin oxygen saturation (SO2) (Tsytsarev et al, 2011). (C) Near-infrared spectroscopy (NIRS) can be used to image hemodynamic changes from visual stimulation noninvasively in humans (Gregget al, 2010).
Optical imaging of blood flow and metabolismA Devor et al
4
Journal of Cerebral Blood Flow & Metabolism (2012), 1–18
equivalent to that of OISI, described above, in thatnear-infrared light is used to monitor the changes inhemoglobin concentration via absorption spectro-scopy. While OISI is generally performed through acranial window or thinned skull to provide directviewing of the cortical surface, NIRS measurementsare usually obtained through the intact skull andscalp. Near-infrared spectroscopy measurements ofhemoglobin concentration changes in the humanbrain through the intact scalp and skull are feasiblebecause of the weak absorption of near-infrared lightby hemoglobin and sufficiently small tissue scatter-ing, as first demonstrated by Jobsis (1977). By 1993,NIRS was being used to measure hemoglobinresponses to brain activation in humans (Hoshi andTamura, 1993; Villringer et al, 1993) similar to bloodoxygen level-dependent functional magnetic reso-nance imaging (fMRI). While fMRI has the advantageof spatial resolution and whole brain sensitivity,NIRS has the physiological advantage of sensitivityto HbO and Hb as well as the advantage of being aportable instrument suitable for continuous bedsidemeasurements. While continuous-wave NIRS isused to measure changes in hemoglobin, frequency-domain and time-domain NIRS devices enableestimation of the absolute hemoglobin concentra-tions (Wolf et al, 2007).
Because of the ease in applying NIRS to infantsrelative to fMRI, it is enabling the identification of
neural regions associated with and responsiblefor the emergence of various behavioral traits indeveloping human infants (Lloyd-Fox et al, 2010).Clinically, it has revealed a hypermetabolic responseto acute brain injury in newborn infants, potentiallyproviding a tool to guide therapies aimed at reducingmetabolic burden (Grant et al, 2009). Further, NIRSis broadly important in studying language functionin healthy and psychiatric populations, as it permitsnatural language production and conversation(Dieler et al, 2011).
Blood Flow
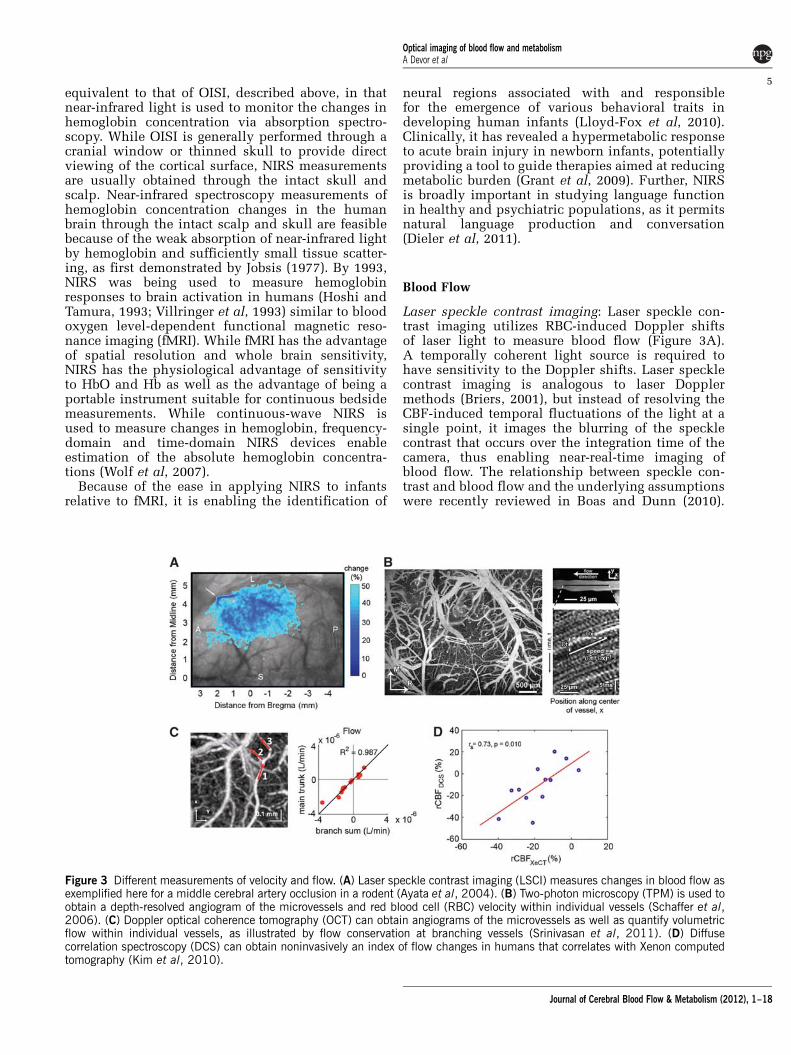
Laser speckle contrast imaging: Laser speckle con-trast imaging utilizes RBC-induced Doppler shiftsof laser light to measure blood flow (Figure 3A).A temporally coherent light source is required tohave sensitivity to the Doppler shifts. Laser specklecontrast imaging is analogous to laser Dopplermethods (Briers, 2001), but instead of resolving theCBF-induced temporal fluctuations of the light at asingle point, it images the blurring of the specklecontrast that occurs over the integration time of thecamera, thus enabling near-real-time imaging ofblood flow. The relationship between speckle con-trast and blood flow and the underlying assumptionswere recently reviewed in Boas and Dunn (2010).
Figure 3 Different measurements of velocity and flow. (A) Laser speckle contrast imaging (LSCI) measures changes in blood flow asexemplified here for a middle cerebral artery occlusion in a rodent (Ayata et al, 2004). (B) Two-photon microscopy (TPM) is used toobtain a depth-resolved angiogram of the microvessels and red blood cell (RBC) velocity within individual vessels (Schaffer et al,2006). (C) Doppler optical coherence tomography (OCT) can obtain angiograms of the microvessels as well as quantify volumetricflow within individual vessels, as illustrated by flow conservation at branching vessels (Srinivasan et al, 2011). (D) Diffusecorrelation spectroscopy (DCS) can obtain noninvasively an index of flow changes in humans that correlates with Xenon computedtomography (Kim et al, 2010).
Optical imaging of blood flow and metabolismA Devor et al
5
Journal of Cerebral Blood Flow & Metabolism (2012), 1–18
A recent advance of note is the ability to measure thetemporal speckle contrast instead of spatial contrast.Temporal contrast affords better spatial resolutionat the expense of temporal resolution and is lesssensitive to the contaminating effects of staticscattering from, for example, the skull. The spatialresolution and depth sensitivity of laser specklecontrast imaging (LSCI) are comparable to thoseof OISI.
Our own work with LSCI has revealed that corticalspreading depression during the aura preceding amigraine headache, activates trigeminal afferents,which results in inflammation of the pain sensitivemeninges generating the migraine (Bolay et al, 2002),and that cortical spreading depression results in aprolonged state of hypoperfusion in mouse strokemodels that results in further growth of ischemiccortex (Shin et al, 2006). Others have used LSCI toshow local retinal vasodilation in response to focallight stimulation, revealing a neurovascular couplingsimilar to that observed in cortex (Srienc et al, 2010).
Two-photon microscopy: The technical aspects oftwo-photon microscopy (TPM) (Denk et al, 1990) andthe spectrum of its applications in neuroscience havebeen extensively covered elsewhere (Svoboda andYasuda, 2006). In the context of blood flow, thetechnique has enabled depth-resolved measurementsof RBC velocities (Kleinfeld et al, 1998) and vasculardiameters (Devor et al, 2007; Tian et al, 2010b)routinely at depths of up to 500 mm deep in the cortexand as deep as 1 mm when utilizing advanced lasersystems (Kobat et al, 2009). In contrast with LSCI,which utilizes Doppler contrast from RBC motion,TPM velocity measurements typically utilize afluorescent dye to image the blood plasma and trackthe RBC ‘shadows’ to estimate velocity in individualcapillaries (Figure 3B). While LSCI is generallyperformed through a thin skull, TPM typicallyrequires a cranial window, although thin skullmeasurements are now being conducted at theexpense of depth penetration (Drew et al, 2010).Velocity and diameter measurements are performedon no more than a few vessel segments at a time. As aresult, studies that require measurements throughoutthe vascular geometry to ascertain the collectivebehavior are not practical with TPM.
Two-photon microscopy vascular measurementswere instrumental in studying the reorganizationof blood flow following experimental disruption ofthe vascular network (targeted ‘microstrokes’)(Nishimura et al, 2006, 2007, 2010; Schaffer et al,2006) and of dilation of cortical microvasculaturebelow the confocal reach (Stefanovic et al, 2008; Tianet al, 2010b).
Optical coherence tomography: Doppler opticalcoherence tomography (OCT) enables depth-resolvedimaging of blood flow in individual diving arteriolesand ascending venules (Figure 3C). The penetrationdepth of OCT in highly scattering media can exceed
1 mm (Izatt et al, 1994). Full volumetric imaging ofblood flow over a cortical surface area of 1 mm2 ispossible in B1 minute. Commercial systems are nowavailable, facilitating widespread adoption of OCT.Doppler OCT promises to be an important tool forstudying cerebrovascular pathology.
Optical coherence tomography is in many waysanalogous to ultrasound, though instead of measur-ing the scattering of sound waves by tissue, itmeasures the scattering of light waves. Opticalcoherence tomography uses the principle oflow-coherence interferometry to resolve the delaybetween different light scattering ‘echoes.’ A low-temporal-coherence light source provides a coher-ence gate that rejects multiply scattered light (Izattet al, 1994) to improve contrast of tissue structure atdepths greater than can be achieved with confocalmicroscopy, with a typical depth resolution ofB5 mm and diffraction-limited lateral resolutiontypically ranging from 1 to B20 mm. In commonpractice, OCT is implemented as a scanning methodlike confocal or TPM and forms images by movingthe light beam over the surface of the tissue.
All scanning methods result in a tradeoff betweenfield of view and image acquisition rate. Whileconfocal and TPM form an image at a singledepth, OCT and PAT form images over a range ofdepths simultaneously. Simultaneous measurementsover this range of depths is achieved in OCT byimplementing recently developed Fourier domaindetection techniques (Choma et al, 2003; Leitgebet al, 2003), which offer tremendous improvementsin the volumetric image acquisition rate relative totime-domain OCT (Huang et al, 1991). Importantly,OCT is sensitive to Doppler shifts in the scatteredlight that arise from moving RBCs, enabling high-resolution measurements of RBC velocities (Chenet al, 1997) and blood flow (Srinivasan et al, 2011;Wang et al, 2007b).
While the spectrum of brain OCT applications isstill being explored, its utility for minimally invasivequantitative measurements of blood flow in vivo(Srinivasan et al, 2011) will become an importanttool because of its improved spatial and temporalresolution over conventional gold-standard methodsand because it can be applied in longitudinal studies.
Diffuse correlation spectroscopy: Diffuse correlationspectroscopy (DCS) offers the ability to noninva-sively measure CBF in humans through the intactscalp and skull (Kim et al, 2010), albeit with onlysuperficial cortical sensitivity, lateral resolution of1 to 3 cm, and no depth resolution. It has been exten-sively crossvalidated against other blood flowmeasures (Kim et al, 2010) (Figure 3D). Diffusecorrelation spectroscopy measurements are generallyobtained using a long-coherence-length laser ataround 800 nm to exploit the weak absorption oftissue and enable light to propagate through thicktissues. A long-coherence-length laser is used so thelight paths that travel long distances through the
Optical imaging of blood flow and metabolismA Devor et al
6
Journal of Cerebral Blood Flow & Metabolism (2012), 1–18
tissue still interfere with the short light paths. Thetissue spatial sensitivity profile is identical to that ofNIRS measurements; therefore, the partial volumeeffects of the overlying scalp and skull must beconsidered when estimating CBF. Diffuse correlationspectroscopy is similar to arterial spin labeling fMRIin that it provides a measure of blood flow. Near-infrared spectroscopy and DCS both hold the sameadvantage over fMRI: that of being portable andsuitable for continuous bedside measurements.
Diffuse correlation spectroscopy has been cross-validated extensively against other blood flow mea-sures (Mesquita et al, 2011). It has been shown in acutestroke patients that cerebral perfusion varies with theelevation of the patient’s head in the bed and thatwhile optimal perfusion is usually achieved with thepatient lying down, that some patients are optimized ina more elevated position. Diffuse correlation spectro-scopy has also demonstrated a flow—volume uncou-pling in newborn infants during the first 8 weeks of lifethat is a result of dramatic reductions in hematocrit asfetal hemoglobin is replaced with adult hemoglobin(Roche-Labarbe et al, 2010).
Angiogram
Two-photon microscopy and OCT, in addition toproviding measures of RBC velocity and blood flow,are able to provide high-resolution angiograms of themicrovasculature. Two-photon microscopy angio-grams are commonly performed (Kleinfeld et al,1998) (Figure 3B); OCT angiograms have recentlyappeared in the literature (Wang et al, 2007a) (Figure3C). In contrast with TPM, OCT angiography does notrequire the administration of dyes or extrinsiccontrast agents. Also, OCT angiography performs3D imaging on time scales of minutes, whereas TPMrequires time scales of hours to achieve comparablefields of view (Vakoc et al, 2009). While OCT is ableto penetrate deeper than TPM can, the limit isslightly > 1 mm. Photoacoustic tomography (Figure2B) offers the ability to obtain angiograms at depthsof several millimeters (Hu and Wang, 2010). Inall cases, greater depth penetration requires acraniotomy.
Using TPM angiograms, Nishimura et al (2007)have demonstrated that while pial arteries provide amesh network of redundant blood flow, penetratingarterioles are bottlenecks of flow to deeper levels,such that occlusion of a penetrating arteriole willresult in downstream ischemic damage. Opticalcoherence tomography is playing an important rolein longitudinally quantifying angiogenesis followingbrain injury and investigating the effect of differentagents on promoting angiogenesis (Jia et al, 2011).
Metabolic imaging
Optical methods are well suited to measure oxygendelivery by blood, and through multimodal ap-
proaches, estimating oxygen consumption by tissue.Because of the autofluorescence of the coenzymesNADH and flavin adenine dinucleotide (FAD), it ispossible to monitor cellular energetics directly.Fluorescent analogs of glucose have recently becomeavailable and these will likely enable more directmeasures of glycolysis with optical resolution.
Phosphorescence Lifetime Imaging of Oxygen
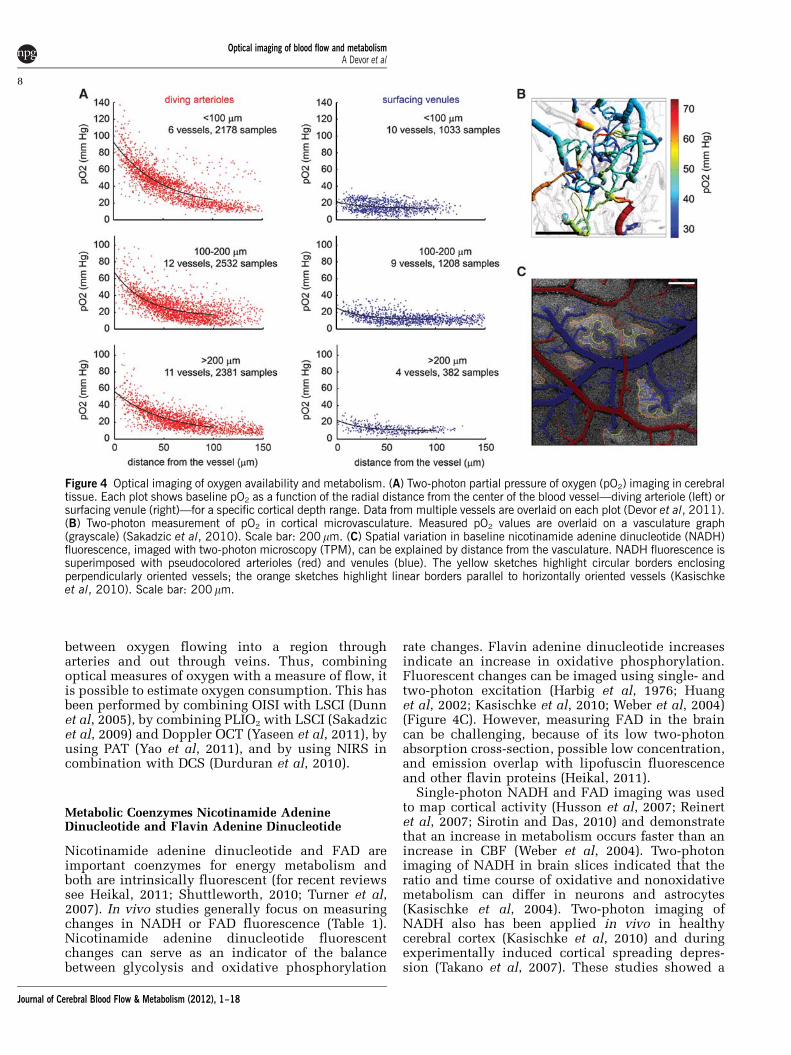
Phosphorescence lifetime imaging of oxygen (PLIO2)measures oxygen-dependent phosphorescence life-times of an exogenous contrast agent (Rumsey et al,1988; Vanderkooi et al, 1987). It can be used to imageboth cerebral intravascular and tissue oxygenationusing widespread optical imaging systems such aswidefield charge-coupled device (CCD) imaging(Sakadzic et al, 2009) or different microscopymodalities (Sakadzic et al, 2010; Yaseen et al, 2009)(Table 1). Combining PLIO2 with TPM (Finikova etal, 2008; Sakadzic et al, 2010) enables measurementof cortical oxygen delivery with subcapillary resolu-tion in tissue and deep microvasculature (Devor et al,2011; Lecoq et al, 2011; Sakadzic et al, 2010) (Figures4A and 4B).
The phosphorescence lifetime of a probe dependson the partial pressure of oxygen (pO2) in theimmediate vicinity of the probe, providing a spatiallylocalized measurement of dissolved oxygen. Probemolecules were specially designed for either linearor two-photon excitation regimes, with a high degreeof encapsulation that ensures stability of lifetimecalibration in a complex biological environment(Finikova et al, 2008; Lebedev et al, 2009). Unlikespectroscopy-based hemoglobin saturation measure-ments, PLIO2 lifetime imaging is insensitive tochanges in tissue optical properties during imaging.The acquisition speed is currently limited to 0.2 to1 second per measurement point by relatively longphosphorescence lifetimes and the number of decayaverages required at each point.
Through combination of PLIO2 with TPM, werecently demonstrated that the increase in bloodoxygenation during the hemodynamic response,which has been perceived as a paradox, may serveto prevent a sustained oxygenation drop at tissuelocations remote from the vascular feeding sources(Devor et al, 2011). We have also observed that asignificant amount of oxygen is delivered to thetissue from the arteries, and that venous intravascu-lar pO2, surprisingly, is higher than that in thecapillary bed on average (Sakadzic et al, 2010).
Oxygen Consumption
As noted above, OISI, PAT, and NIRS are all able tomeasure hemoglobin oxygenation through absorp-tion spectroscopy, while PLIO2 can measure pO2 inblood and tissue. Tissue oxygen consumptionis commonly estimated based on the difference
Optical imaging of blood flow and metabolismA Devor et al
7
Journal of Cerebral Blood Flow & Metabolism (2012), 1–18
between oxygen flowing into a region througharteries and out through veins. Thus, combiningoptical measures of oxygen with a measure of flow, itis possible to estimate oxygen consumption. This hasbeen performed by combining OISI with LSCI (Dunnet al, 2005), by combining PLIO2 with LSCI (Sakadzicet al, 2009) and Doppler OCT (Yaseen et al, 2011), byusing PAT (Yao et al, 2011), and by using NIRS incombination with DCS (Durduran et al, 2010).
Metabolic Coenzymes Nicotinamide AdenineDinucleotide and Flavin Adenine Dinucleotide
Nicotinamide adenine dinucleotide and FAD areimportant coenzymes for energy metabolism andboth are intrinsically fluorescent (for recent reviewssee Heikal, 2011; Shuttleworth, 2010; Turner et al,2007). In vivo studies generally focus on measuringchanges in NADH or FAD fluorescence (Table 1).Nicotinamide adenine dinucleotide fluorescentchanges can serve as an indicator of the balancebetween glycolysis and oxidative phosphorylation
rate changes. Flavin adenine dinucleotide increasesindicate an increase in oxidative phosphorylation.Fluorescent changes can be imaged using single- andtwo-photon excitation (Harbig et al, 1976; Huanget al, 2002; Kasischke et al, 2010; Weber et al, 2004)(Figure 4C). However, measuring FAD in the braincan be challenging, because of its low two-photonabsorption cross-section, possible low concentration,and emission overlap with lipofuscin fluorescenceand other flavin proteins (Heikal, 2011).
Single-photon NADH and FAD imaging was usedto map cortical activity (Husson et al, 2007; Reinertet al, 2007; Sirotin and Das, 2010) and demonstratethat an increase in metabolism occurs faster than anincrease in CBF (Weber et al, 2004). Two-photonimaging of NADH in brain slices indicated that theratio and time course of oxidative and nonoxidativemetabolism can differ in neurons and astrocytes(Kasischke et al, 2004). Two-photon imaging ofNADH also has been applied in vivo in healthycerebral cortex (Kasischke et al, 2010) and duringexperimentally induced cortical spreading depres-sion (Takano et al, 2007). These studies showed a
Figure 4 Optical imaging of oxygen availability and metabolism. (A) Two-photon partial pressure of oxygen (pO2) imaging in cerebraltissue. Each plot shows baseline pO2 as a function of the radial distance from the center of the blood vessel—diving arteriole (left) orsurfacing venule (right)—for a specific cortical depth range. Data from multiple vessels are overlaid on each plot (Devor et al, 2011).(B) Two-photon measurement of pO2 in cortical microvasculature. Measured pO2 values are overlaid on a vasculature graph(grayscale) (Sakadzic et al, 2010). Scale bar: 200 mm. (C) Spatial variation in baseline nicotinamide adenine dinucleotide (NADH)fluorescence, imaged with two-photon microscopy (TPM), can be explained by distance from the vasculature. NADH fluorescence issuperimposed with pseudocolored arterioles (red) and venules (blue). The yellow sketches highlight circular borders enclosingperpendicularly oriented vessels; the orange sketches highlight linear borders parallel to horizontally oriented vessels (Kasischkeet al, 2010). Scale bar: 200 mm.
Optical imaging of blood flow and metabolismA Devor et al
8
Journal of Cerebral Blood Flow & Metabolism (2012), 1–18
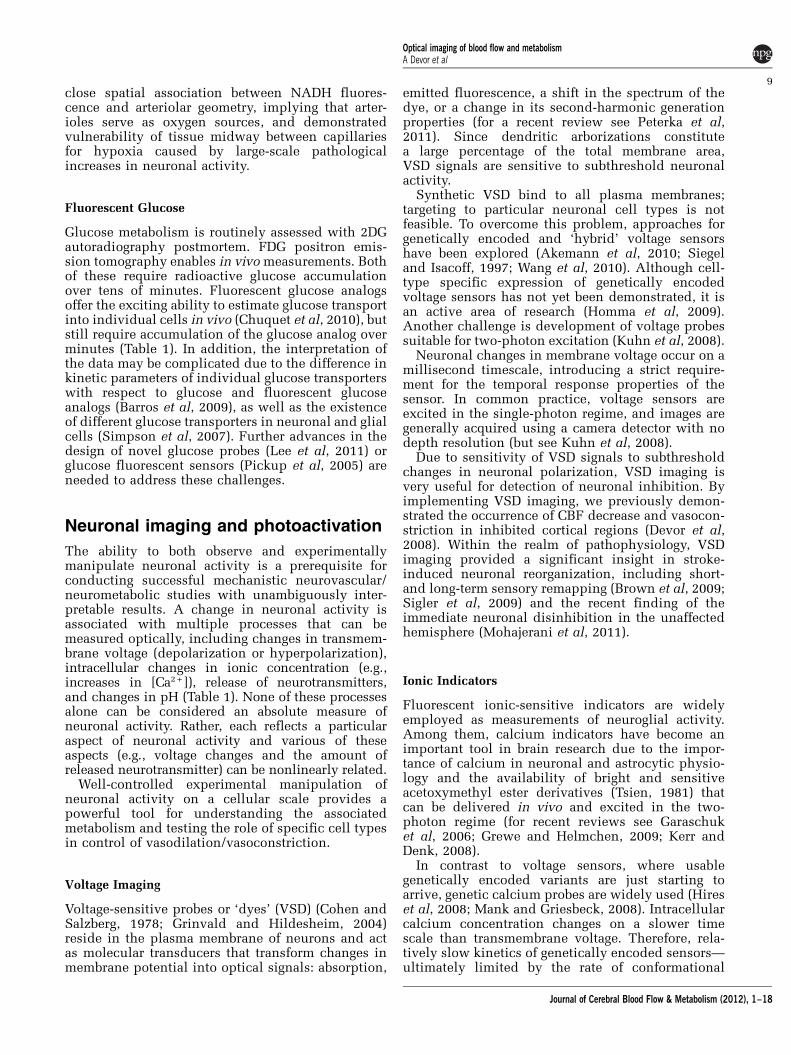
close spatial association between NADH fluores-cence and arteriolar geometry, implying that arter-ioles serve as oxygen sources, and demonstratedvulnerability of tissue midway between capillariesfor hypoxia caused by large-scale pathologicalincreases in neuronal activity.
Fluorescent Glucose
Glucose metabolism is routinely assessed with 2DGautoradiography postmortem. FDG positron emis-sion tomography enables in vivo measurements. Bothof these require radioactive glucose accumulationover tens of minutes. Fluorescent glucose analogsoffer the exciting ability to estimate glucose transportinto individual cells in vivo (Chuquet et al, 2010), butstill require accumulation of the glucose analog overminutes (Table 1). In addition, the interpretation ofthe data may be complicated due to the difference inkinetic parameters of individual glucose transporterswith respect to glucose and fluorescent glucoseanalogs (Barros et al, 2009), as well as the existenceof different glucose transporters in neuronal and glialcells (Simpson et al, 2007). Further advances in thedesign of novel glucose probes (Lee et al, 2011) orglucose fluorescent sensors (Pickup et al, 2005) areneeded to address these challenges.
Neuronal imaging and photoactivation
The ability to both observe and experimentallymanipulate neuronal activity is a prerequisite forconducting successful mechanistic neurovascular/neurometabolic studies with unambiguously inter-pretable results. A change in neuronal activity isassociated with multiple processes that can bemeasured optically, including changes in transmem-brane voltage (depolarization or hyperpolarization),intracellular changes in ionic concentration (e.g.,increases in [Ca2 +]), release of neurotransmitters,and changes in pH (Table 1). None of these processesalone can be considered an absolute measure ofneuronal activity. Rather, each reflects a particularaspect of neuronal activity and various of theseaspects (e.g., voltage changes and the amount ofreleased neurotransmitter) can be nonlinearly related.
Well-controlled experimental manipulation ofneuronal activity on a cellular scale provides apowerful tool for understanding the associatedmetabolism and testing the role of specific cell typesin control of vasodilation/vasoconstriction.
Voltage Imaging
Voltage-sensitive probes or ‘dyes’ (VSD) (Cohen andSalzberg, 1978; Grinvald and Hildesheim, 2004)reside in the plasma membrane of neurons and actas molecular transducers that transform changes inmembrane potential into optical signals: absorption,
emitted fluorescence, a shift in the spectrum of thedye, or a change in its second-harmonic generationproperties (for a recent review see Peterka et al,2011). Since dendritic arborizations constitutea large percentage of the total membrane area,VSD signals are sensitive to subthreshold neuronalactivity.
Synthetic VSD bind to all plasma membranes;targeting to particular neuronal cell types is notfeasible. To overcome this problem, approaches forgenetically encoded and ‘hybrid’ voltage sensorshave been explored (Akemann et al, 2010; Siegeland Isacoff, 1997; Wang et al, 2010). Although cell-type specific expression of genetically encodedvoltage sensors has not yet been demonstrated, it isan active area of research (Homma et al, 2009).Another challenge is development of voltage probessuitable for two-photon excitation (Kuhn et al, 2008).
Neuronal changes in membrane voltage occur on amillisecond timescale, introducing a strict require-ment for the temporal response properties of thesensor. In common practice, voltage sensors areexcited in the single-photon regime, and images aregenerally acquired using a camera detector with nodepth resolution (but see Kuhn et al, 2008).
Due to sensitivity of VSD signals to subthresholdchanges in neuronal polarization, VSD imaging isvery useful for detection of neuronal inhibition. Byimplementing VSD imaging, we previously demon-strated the occurrence of CBF decrease and vasocon-striction in inhibited cortical regions (Devor et al,2008). Within the realm of pathophysiology, VSDimaging provided a significant insight in stroke-induced neuronal reorganization, including short-and long-term sensory remapping (Brown et al, 2009;Sigler et al, 2009) and the recent finding of theimmediate neuronal disinhibition in the unaffectedhemisphere (Mohajerani et al, 2011).
Ionic Indicators
Fluorescent ionic-sensitive indicators are widelyemployed as measurements of neuroglial activity.Among them, calcium indicators have become animportant tool in brain research due to the impor-tance of calcium in neuronal and astrocytic physio-logy and the availability of bright and sensitiveacetoxymethyl ester derivatives (Tsien, 1981) thatcan be delivered in vivo and excited in the two-photon regime (for recent reviews see Garaschuket al, 2006; Grewe and Helmchen, 2009; Kerr andDenk, 2008).
In contrast to voltage sensors, where usablegenetically encoded variants are just starting toarrive, genetic calcium probes are widely used (Hireset al, 2008; Mank and Griesbeck, 2008). Intracellularcalcium concentration changes on a slower timescale than transmembrane voltage. Therefore, rela-tively slow kinetics of genetically encoded sensors—ultimately limited by the rate of conformational
Optical imaging of blood flow and metabolismA Devor et al
9
Journal of Cerebral Blood Flow & Metabolism (2012), 1–18
change of proteins—is less of an issue in the designof calcium probes.
When imaged with TPM, calcium increases withinindividual neuronal cell bodies can be used toreconstruct spike trains (Vogelstein et al, 2010).Different types of neurons vary in their expressionlevel of particular calcium channels, and multipletypes of calcium channels exist (Tsien et al, 1995).Although cytosolic calcium can fluctuate within thesubthreshold range of membrane potentials (Rosset al, 2005), calcium imaging is believed to reflectspiking and not subthreshold (e.g., synaptic) activity(Cossart et al, 2005).
The use of calcium indicators enabled the dis-covery of astrocytic excitability (Cornell-Bell et al,1990; Nedergaard, 1994), and, in combination withTPM, has truly revolutionized both basic andapplied neuroscience allowing visualization of mi-croscopic cortical functional organization (Ohkiet al, 2005), abnormal waves of astrocytic activityin Alzheimer’s disease (Kuchibhotla et al, 2009), andfunctional rewiring after a stroke (Winship andMurphy, 2008), just to name a few.
Synaptic Release
Synaptic release of (potentially vasoactive) neuro-transmitters and neuropeptides involves depolariza-tion of the presynaptic terminal, calcium entrythrough voltage-gated channels located on the plas-ma membrane in the vicinity of docked and ready-to-release synaptic vesicles, fusion of the vesicleswith the plasma membrane, and loss of the acidicintravesicular environment. The change of pHexperienced by the luminal side of a vesicle upon
fusion provides the foundation for pHluorin-basedreporters of synaptic release (Miesenbock et al,1998). These reporters are genetically encoded andhave been used extensively in the olfactory bulb.Another approach is to target genetically encodedcalcium indicators to the cytoplasmic side ofvesicular membranes (Dreosti et al, 2009). Imagingthe release of specific transmitters requires specificoptical probes. One such probe, suitable for TPM,has recently been developed for imaging of extra-cellular glutamate (Okubo et al, 2010). Geneticallyencoded probes have been applied in the olfactorybulb to demonstrate that functional hyperemia washighly correlated with glutamate release but not withpostsynaptic activity (Petzold et al, 2008).
Optogenetic Actuators
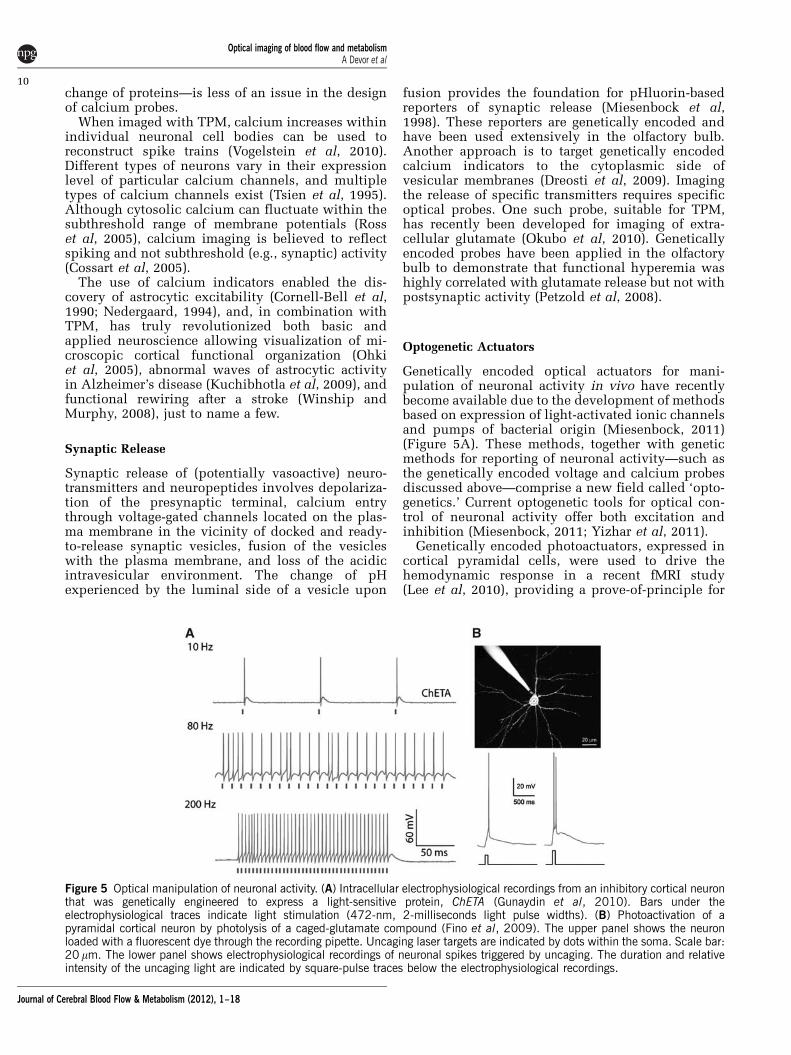
Genetically encoded optical actuators for mani-pulation of neuronal activity in vivo have recentlybecome available due to the development of methodsbased on expression of light-activated ionic channelsand pumps of bacterial origin (Miesenbock, 2011)(Figure 5A). These methods, together with geneticmethods for reporting of neuronal activity—such asthe genetically encoded voltage and calcium probesdiscussed above—comprise a new field called ‘opto-genetics.’ Current optogenetic tools for optical con-trol of neuronal activity offer both excitation andinhibition (Miesenbock, 2011; Yizhar et al, 2011).
Genetically encoded photoactuators, expressed incortical pyramidal cells, were used to drive thehemodynamic response in a recent fMRI study(Lee et al, 2010), providing a prove-of-principle for
Figure 5 Optical manipulation of neuronal activity. (A) Intracellular electrophysiological recordings from an inhibitory cortical neuronthat was genetically engineered to express a light-sensitive protein, ChETA (Gunaydin et al, 2010). Bars under theelectrophysiological traces indicate light stimulation (472-nm, 2-milliseconds light pulse widths). (B) Photoactivation of apyramidal cortical neuron by photolysis of a caged-glutamate compound (Fino et al, 2009). The upper panel shows the neuronloaded with a fluorescent dye through the recording pipette. Uncaging laser targets are indicated by dots within the soma. Scale bar:20 mm. The lower panel shows electrophysiological recordings of neuronal spikes triggered by uncaging. The duration and relativeintensity of the uncaging light are indicated by square-pulse traces below the electrophysiological recordings.
Optical imaging of blood flow and metabolismA Devor et al
10
Journal of Cerebral Blood Flow & Metabolism (2012), 1–18
the utility of optogenetics in neurovascular andneurometabolic research.
Photolysis of ‘Caged’ Compounds
Another approach for photoactivation (with a longerhistory of applications) is based on the use ofsynthetic derivatives of transmitters and secondmessengers in which addition of a chemical bondmakes them biologically inert (Adams and Tsien,1993). Photolysis (‘uncaging’) breaks a bond, liberat-ing active properties of the compound. Cagedcompounds designed for two-photon photolysisallow targeted manipulations on a cellular and evensubcellular level (e.g., mimicking a synaptic input toa single spine) (Figure 5B). The large majority ofuncaging studies have been performed in brainslices and cell cultures. This is because the need todeliver extrinsic caged molecules presents a chal-lenge for in vivo studies (Noguchi et al, 2011). Never-theless, future improved delivery strategies andtechnical advances in two-photon photostimulation(Nikolenko et al, 2007) are likely to promote two-photon uncaging to a valuable manipulation methodin microscopic studies of the neurovascular unitphysiology in vivo.
Future directions in development andapplication of optical tools: progresstoward a mechanistic understanding ofneurovascular and neurometabolicphysiology
The spectrum of optical technologies outlined aboveoffers a comprehensive set of tools for measurementof a wide range of physiological parameters. How canwe use these optical tools to make progress toward amechanistic understanding of the regulation of flowand metabolism? First, let us consider the followingspecific Questions, significant for achieving thisunderstanding, which can be tackled with the useof optical imaging tools:
(1) What is the specificity, or biological relevance, ofknown vasoactive messengers (neurotransmitters,neuromodulators, gliotransmitters, and metabolicbiproducts) with regards to normal or pathophy-siological conditions and particular phases in theoverall hyperemic response (e.g., initiation ofdilation/constriction, maintenance of sustaineddilation, or propagation of dilation along thearteriolar walls)?
(2) What is the primary vascular target of specificneurovascular messengers: capillaries, precapil-lary arterioles or larger diving arterioles? What isthe origin of the depth dependence of hyperemicresponse? Is it related to differences in neuro-vascular coupling mechanisms or in responseproperties of the target vessels?
(3) What is the metabolic cost of neuronal activityacross different modes of healthy brain functionand in pathological conditions and how is it met?What is the ratio of oxidative phosphorylation toglycolysis, and to what degree are these metabolicprocesses compartment-specific (i.e., occur inneurons versus astrocytes)?
(4) What modulatory systems regulate the gain ofhyperemic response and how? What happenswith disregulation of this gain control in neuro-logical disease?
(5) What are the fundamental principles that des-cribe the healthy hyperemic response of the3D vascular network: what is the location of theinitial dilation, what are the summation rulesof locally induced and propagated dilation/constriction, how diameter changes within thevascular network translate into changes in tissueoxygenation? How is this organization altered inneurological disease and stroke?
(6) What is the biological significance of astrocyticexcitability, including calcium transients, cal-cium waves, and gliotransmission in healthyand diseased brain?
(7) How is microscopic neurovascular and neuro-metabolic function of the neurovascular unitreflected in noninvasive macroscopic signalsrelevant for human imaging? How can theinsights from animal models be translated tohuman studies?
Below are a number of approaches, which, in ourview, will be essential in addressing these questions.
Descending to a Single-Cell Level In Vivo
Availability of high-resolution optical microscopytools will have a central role in addressing Questions1 to 6 in the list above. In the context of Question 1,recent reports in brain slices have demonstrated thatstimulation of neurons of different types producesspecific responses in the embedded vascular seg-ments: dilation or constriction (Cauli et al, 2004;Rancillac et al, 2006). Can these experiments betranslated in vivo? In other words, can we identifythe microscopic in vivo vascular ‘signature’ ofactivation in neurons with known phenotype andneurotransmitter content? While one-photon excita-tion of photoactuators currently used in optogeneticsaffects a population of cells, eliciting spikes in asingle cell can be achieved by two-photon uncagingas has been demonstrated in vitro (Fino et al, 2009)(Figure 5B). Two-photon photoactivation of chan-nelrhodopsin-2 (Rickgauer and Tank, 2009) anddelivery of a transgene to a single cell in vivo(Kitamura et al, 2008) have also been demonstrated.
Another potential strategy for evaluating vasculardiameter changes induced by the firing of specificneurons in vivo is based on triggering the diametermeasurements on spikes in a particular cell. Spiketiming can be estimated from calcium imaging
Optical imaging of blood flow and metabolismA Devor et al
11
Journal of Cerebral Blood Flow & Metabolism (2012), 1–18
(Vogelstein et al, 2010). Identification of cell types invivo can also be achieved through the use ofgenetically encoded fluorescent markers (Tsien,2005), postmortem immunolabeling (Kerlin et al,2010), or single-cell PCR if activation is achieved by atargeted whole-cell patch recording (Margrie et al,2003). This strategy requires that firing in the neuronof interest does not temporally coincide with firingin other neighboring neurons to avoid release ofadditional types of vasoactive substances. Therefore,the analysis would be limited to spontaneous firing,rather than firing in response to stimulation, and useof either awake animals or anesthesia that does notinduce neuronal synchronization.
Merging Advanced Optical Imaging with OpticalManipulation
Combining novel and improved optical imagingtechnologies with the recent revolutionary advancesin optogenetics (Miesenbock, 2011; Yizhar et al, 2011)will allow in vivo measurement of vascular andmetabolic consequences of controlled experimentalmanipulation of neuronal activity, critical for addres-sing Questions 2 and 3. Already today, a number oftransgenic mouse lines with cell-type specific expres-sion of light-gated ionic channels have been devel-oped; some are already commercially available.Photoactivation of these and other geneticallyencoded optical actuators results in activation (orinhibition) of cells expressing the transgene. There-fore, when expression is specific to a particular celltype, it might be well suited to addressing theneuronal cell-type specificity of vascular regulation:which cell types induce vasodilation/constrictionupon depolarization (firing), and which vasoactiveneurotransmitters are released. To ensure specificity insuch an experiment, one has to prevent propagation ofactivation to other neuronal cell types. For example,unless synaptic communication is inhibited, photo-activation of excitatory pyramidal neurons is instruc-tive in elucidating connectivity between the brainregions (Lee et al, 2010) but might not provide anyadvantage for the study of neurovascular couplingover a sensory stimulation: in both cases firing ofmany neuronal cell types results in release of amixture of neurotransmitters and peptides.
Optogenetic activation of specific modulatory (e.g.,cholinergic) projections will have an important rolein addressing Question 4. In this respect, transgenicmouse lines with targeted expression of photoactua-tor proteins in cholinergic and serotonergic neuronshave been developed (Zhao et al, 2011) and areavailable from Jackson Laboratory (http://jaxmice.jax.org/).
Further Progress in the Design of Novel OpticalReporters
Our ability to grasp a physiological process andmacroscopic ‘observables,’ relevant for noninvasive
imaging in humans, critically depends on under-standing the behavior of the underlying microscopicparameters. The most recent example illustrating theimportance of specific, selective, and sensitive opticalprobes for high-resolution microscopic measurementis a new phosphorescent probe to measure pO2
(Finikova et al, 2008), which will be instrumental isaddressing Question 5. This probe, applicable for two-photon imaging, has already been utilized to studyintravascular and extravascular oxygenation at base-line and during neuronal activation (Devor et al, 2011;Lecoq et al, 2011; Sakadzic et al, 2010). Otherexamples include a two-photon excitable probe thathas also been recently developed for imaging ofextracellular glutamate (Okubo et al, 2010) and novelcell-based fluorescent reporters for detection ofacetylcholine release (Nguyen et al, 2010). Furtherprogress in design of existing optical reporters(glucose) (Lee et al, 2011) and future development ofnew optical sensors—among them the ones for lactateand adenosine, important for addressing Question 6—will open unprecedented opportunities to visualizedirectly neurovascular and neurometabolic processes.
Combining Different Imaging Modalities
In the context of cortical function, even the mostspecific, sensitive and high-resolution measurementon its own provides only a descriptive view of a singleaspect of the underlying multifaceted physiologicalprocesses. This being the case, integration of two ormore imaging technologies, each sensitive to adifferent aspect of the physiological process understudy (the ‘multimodal’ imaging approach) will allowsimultaneous measurements of multiple relevantphysiological and biophysical parameters and compu-tational inference of processes that cannot be mea-sured directly. For example, a combination of PLIO2
(Sakadzic et al, 2010) with OCT (Srinivasan et al,2011) may provide a microscopic measure of oxygenconsumption. The multimodal principle is of coursenot limited to optical technologies—one can combineoptical imaging with, for example, electrophysiologi-cal recordings (Berwick et al, 2008; Sheth et al, 2004)or MRI measurements (Kennerley et al, 2005).
Further Improvement in Resolution and SamplingEfficiency of the Available Methods
Optical technological innovation continually strivesto improve spatial resolution, image acquisition rate,and depth penetration. We are now seeing tremen-dous advances on these fronts for scanning micro-scopies. The heterogeneous structure of the tissuedistorts the optical wave front, degrading the spatialresolution from the diffraction limit. Adaptive opticsis developing as a robust approach to counterbalancethe tissue distortions and restore diffraction-limitedresolution for TPM (Ji et al, 2010) and OCT.
Optical imaging of blood flow and metabolismA Devor et al
12
Journal of Cerebral Blood Flow & Metabolism (2012), 1–18
The image acquisition rate is dictated by the rasterscanning rate divided by the image volume. Scan-ning rate can be increased by using acousto-opticdeflectors (Grewe et al, 2010). However, one mustconsider the implementation of acousto-optic de-flectors so as not to degrade spatial resolution(Kirkby et al, 2010). Two-photon microscopy imagingin 3D is slow because of the need to physically movethe objective, although piezo-electric resonators nowenable rapid z-translation (Gobel et al, 2007). Fasterz-scanning is being demonstrated by using adaptiveoptic strategies to dynamically adjust the focal depthof an objective with no moving parts (Grewe et al,2011). Scanning rate is ultimately limited by thenumber of photons detected. Photon collectionefficiency can be improved using novel approachesto increasing the effective numerical aperture of themicroscope collection optics (Engelbrecht et al,2009). More efficient excitation of fluorophores canbe achieved by increasing the repetition of thepulsed laser sources used in TPM (Ji et al, 2008;Li et al, 2010). Larger image volumes can be scannedfaster by essentially dividing the larger volume intosmaller subvolumes that are imaged in parallel(Bewersdorf et al, 1998).
Tissue scattering is wavelength dependent andlimits depth penetration. Reducing tissue scatterwould therefore enable greater penetration. Whiletissue-clearing methods can be used ex vivo, we canuse longer excitation wavelengths in vivo where theoptical scattering is reduced. The penetration depthhas been shown to increase from B600 to 1,000mmwhen moving from 800 to 1,300 nm excitation withTPM (Kobat et al, 2009). Similar advantages havebeen shown for OCT. The challenge is to ensure thatthe fluorophore excitation extends out to theselonger wavelengths. Even greater penetration depthsare being achieved with TPM and OCT by usingGRIN lenses and microprisms to invasively providean optical window to deeper tissue structures(Barretto et al, 2011).
New Emerging Approaches for In Vivo Imaging
Several approaches not detailed here are worthmentioning because of their potential impact whenapplied in vivo. Intensity-based ionic imaging cannotbe used to quantify absolute concentration of ionsbecause the intensity depends on the ionic concen-tration and dye concentration. This limitation can beovercome by measuring fluorescent lifetime, as hasbeen demonstrated for calcium (Wilms et al, 2006).Specifically, fluorescent lifetime provides an absolutemeasure when the ionic concentration alters the probeconformation, resulting in a change in lifetime that isnot dependent on probe concentration. Fluorescentlifetime can also be used to distinguish differentconformations of fluorescent molecules, such asbound and free NADH (Vishwasrao et al, 2005).
The fundamental diffraction limit of optical ima-ging has recently been shattered by a variety of clever
solutions that achieved resolution of better than20 nm (Hell, 2009; Huang, 2010). These new nano-scopic methods reveal fine-scale subcellular struc-tures in culture, and have the potential to be appliedin vivo with depth penetrations likely comparable toconfocal microscopy of 50 to 100 mm.
Translation to human studies
We have described advances of optical imaging inobtaining microscopic measures of cellular andvascular functioning. For the foreseeable future,though, noninvasive human neuroimaging will onlybe able to access the collective behavior of largegroups of cells and vessels. Thus, translation of ourmicroscopic mechanistic understanding of neuro-vascular and neurometabolic coupling will dependon our understanding of how this microscopicbehavior is reflected in macroscopic observables(Question 7). Because of their overlapping spatialand temporal resolutions, optical technologies enableus to perform experiments that step incrementallyfrom the cell/capillary level to the few cell/capillarylevel and all the way to noninvasive imaging of cubiccentimeters of tissue relevant to human studies. Thistransition can be made in an animal from super-resolution microscopy to NIRS/DCS to characterizethe micro–macro relationship. Near-infrared spectro-scopy/DCS, combined with noninvasive electrophy-siological recordings, can then be used in humans toverify the physiological findings, and finally put intoclinical utility. As an example, NIRS has been used inrodents to test whether neurovascular coupling isdriven by cortico-cortical connections or thalamicinputs in the somatosensory cortex (Franceschini et al,2010) and then translated to humans to confirm thefindings (Ou et al, 2009). Confirming that the vascularresponse is driven by cortico-cortical processing ratherthan by thalamic inputs would have profound clinicalimportance because vascular-based neuroimagingmethods (fMRI, NIRS, and DCS) could then be usedto assess the integrity of the sensory system at the levelof cortico-cortical circuits in injury (stroke andtrauma) and disease, and when those systems becomeactive in development or turn off due to aging.
Conclusions
The arsenal of available optical imaging technologiesoffers the ability to measure a spectrum of parametersrelated to vascular, metabolic, and neuronal activityat multiple scales. Merging these technologies withrecent revolutionary methods in genetic labelingand remote control of neuronal activity, allowingtargeted activation of identified neuronal cells andcellular populations, is going to be a hallmark ofcerebrovascular research in the next decade, ormaybe even the next ‘50 years of dedicated CBFand metabolism’ research. In parallel, findings fromanimal imaging will be translated to human studies
Optical imaging of blood flow and metabolismA Devor et al
13
Journal of Cerebral Blood Flow & Metabolism (2012), 1–18
through application of the noninvasive opticalmethods NIRS, DCS, and PAT. Although opticaltechnologies are already broad and versatile, theirperformance is going to improve. In combinationwith continuous efforts in the development of noveloptical sensors, and in expanding the array oftransgenic animals with genetically encoded struc-tural and functional fluorescent labels, the future ofthe brain imaging division of biomedical optics is asbright and exciting as ever before.
Disclosure/conflict of interest
The authors declare no conflict of interest.
References
Adams SR, Tsien RY (1993) Controlling cell chemistry withcaged compounds. Annu Rev Physiol 55:755–84
Akemann W, Mutoh H, Perron A, Rossier J, Knopfel T(2010) Imaging brain electric signals with geneticallytargeted voltage-sensitive fluorescent proteins. NatMethods 7:643–9
Allaman I, Belanger M, Magistretti PJ (2011) Astrocyte-neuron metabolic relationships: for better and for worse.Trends Neurosci 34:76–87
Attwell D, Buchan AM, Charpak S, Lauritzen M, MacvicarBA, Newman EA (2010) Glial and neuronal control ofbrain blood flow. Nature 468:232–43
Ayata C, Dunn AK, Gursoy OY, Huang Z, Boas DA,Moskowitz MA (2004) Laser speckle flowmetry for thestudy of cerebrovascular physiology in normal andischemic mouse cortex. J Cereb Blood Flow Metab24:744–55
Barretto RP, Ko TH, Jung JC, Wang TJ, Capps G, Waters AC,Ziv Y, Attardo A, Recht L, Schnitzer MJ (2011) Time-lapse imaging of disease progression in deep brain areasusing fluorescence microendoscopy. Nat Med 17:223–8
Barros LF, Bittner CX, Loaiza A, Ruminot I, Larenas V,Moldenhauer H, Oyarzun C, Alvarez M (2009) Kineticvalidation of 6-NBDG as a probe for the glucosetransporter GLUT1 in astrocytes. J Neurochem109(Suppl 1):94–100
Bell AG (1880) On the production and reproduction ofsound by light. Am J Sci 20:305–24
Berwick J, Johnston D, Jones M, Martindale J, Martin C,Kennerley AJ, Redgrave P, Mayhew JE (2008) Fine detailof neurovascular coupling revealed by spatiotemporalanalysis of the hemodynamic response to single whiskerstimulation in rat barrel cortex. J Neurophysiol 99:787–98
Bewersdorf J, Pick R, Hell SW (1998) Multifocal multi-photon microscopy. Opt Lett 23:655–7
Boas DA, Dunn AK (2010) Laser speckle contrast imagingin biomedical optics. J Biomed Opt 15:011109
Bolay H, Reuter U, Dunn AK, Huang Z, Boas DA,Moskowitz MA (2002) Intrinsic brain activity triggerstrigeminal meningeal afferents in a migraine model.Nat Med 8:136–42
Briers JD (2001) Laser Doppler, speckle and relatedtechniques for blood perfusion mapping and imaging.Physiol Meas 22:R35–66
Brown CE, Aminoltejari K, Erb H, Winship IR, Murphy TH(2009) In vivo voltage-sensitive dye imaging in adult
mice reveals that somatosensory maps lost to stroke arereplaced over weeks by new structural and functionalcircuits with prolonged modes of activation withinboth the peri-infarct zone and distant sites. J Neurosci29:1719–34
Cauli B, Hamel E (2010) Revisiting the role of neurons inneurovascular coupling. Front Neuroenergetics 2:9
Cauli B, Tong XK, Rancillac A, Serluca N, Lambolez B,Rossier J, Hamel E (2004) Cortical GABA interneuronsin neurovascular coupling: relays for subcortical vaso-active pathways. J Neurosci 24:8940–9
Chen Z, Milner TE, Dave D, Nelson JS (1997) OpticalDoppler tomographic imaging of fluid flow velocity inhighly scattering media. Opt Lett 22:64–6
Choma M, Sarunic M, Yang C, Izatt J (2003) Sensitivityadvantage of swept source and Fourier domain opticalcoherence tomography. Opt Express 11:2183–9
Chuquet J, Quilichini P, Nimchinsky EA, Buzsaki G (2010)Predominant enhancement of glucose uptake in astro-cytes versus neurons during activation of the somato-sensory cortex. J Neurosci 30:15298–303
Cohen LB, Salzberg BM (1978) Optical measurement ofmembrane potential. Rev Physiol Biochem Pharmacol83:35–88
Cornell-Bell AH, Finkbeiner SM, Cooper MS, Smith SJ(1990) Glutamate induces calcium waves in culturedastrocytes: long-range glial signaling. Science 247:470–3
Cossart R, Ikegaya Y, Yuste R (2005) Calcium imaging ofcortical networks dynamics. Cell Calcium 37:451–7
Denk W, Strickler JH, Webb WW (1990) Two-photon laserscanning fluorescence microscopy. Science 248:73–6
Devor A, Hillman EM, Tian P, Waeber C, Teng IC,Ruvinskaya L, Shalinsky MH, Zhu H, Haslinger RH,Narayanan SN, Ulbert I, Dunn AK, Lo EH, Rosen BR,Dale AM, Kleinfeld D, Boas DA (2008) Stimulus-induced changes in blood flow and 2-deoxyglucoseuptake dissociate in ipsilateral somatosensory cortex.J Neurosci 28:14347–57
Devor A, Sakadzic S, Saisan PA, Yaseen MA, Roussakis E,Srinivasan VJ, Vinogradov SA, Rosen BR, Buxton RB,Dale AM, Boas DA (2011) ‘Overshoot’ of O is required tomaintain baseline tissue oxygenation at locations distalto blood vessels. J Neurosci 31:13676–81
Devor A, Tian P, Nishimura N, Teng IC, Hillman EM,Narayanan SN, Ulbert I, Boas DA, Kleinfeld D, Dale AM(2007) Suppressed neuronal activity and concurrentarteriolar vasoconstriction may explain negative bloodoxygenation level-dependent signal. J Neurosci 27:4452–9
Dieler AC, Tupak SV, Fallgatter AJ (2011) Functional near-infrared spectroscopy for the assessment of speechrelated tasks. Brain Lang; e-pub ahead of print;doi:10.1016/j.bandl.2011.03.005
Dreosti E, Odermatt B, Dorostkar MM, Lagnado L (2009) Agenetically encoded reporter of synaptic activity in vivo.Nat Methods 6:883–9
Drew PJ, Shih AY, Driscoll JD, Knutsen PM, Blinder P,Davalos D, Akassoglou K, Tsai PS, Kleinfeld D (2010)Chronic optical access through a polished and rein-forced thinned skull. Nat Methods 7:981–4
Dunn AK, Devor A, Dale AM, Boas DA (2005) Spatialextent of oxygen metabolism and hemodynamic changesduring functional activation of the rat somatosensorycortex. Neuroimage 27:279–90
Durduran T, Zhou C, Buckley EM, Kim MN, Yu G, Choe R,Gaynor JW, Spray TL, Durning SM, Mason SE, Mon-tenegro LM, Nicolson SC, Zimmerman RA, Putt ME,
Optical imaging of blood flow and metabolismA Devor et al
14
Journal of Cerebral Blood Flow & Metabolism (2012), 1–18
Wang J, Greenberg JH, Detre JA, Yodh AG, Licht DJ(2010) Optical measurement of cerebral hemodynamicsand oxygen metabolism in neonates with congenitalheart defects. J Biomed Opt 15:037004
Engelbrecht CJ, Gobel W, Helmchen F (2009) Enhancedfluorescence signal in nonlinear microscopy throughsupplementary fiber-optic light collection. Opt Express17:6421–35
Fiacco TA, Agulhon C, McCarthy KD (2009) Sorting outastrocyte physiology from pharmacology. Annu RevPharmacol Toxicol 49:151–74
Finikova OS, Lebedev AY, Aprelev A, Troxler T, Gao F,Garnacho C, Muro S, Hochstrasser RM, Vinogradov SA(2008) Oxygen microscopy by two-photon-excited phos-phorescence. Chemphyschem 9:1673–9
Fino E, Araya R, Peterka DS, Salierno M, Etchenique R,Yuste R (2009) RuBi-glutamate: two-photon and visible-light photoactivation of neurons and dendritic spines.Front Neural Circuits 3:2
Franceschini MA, Radhakrishnan H, Thakur K, Wu W,Ruvinskaya S, Carp S, Boas DA (2010) The effect ofdifferent anesthetics on neurovascular coupling. Neuro-image 51:1367–77
Garaschuk O, Milos RI, Grienberger C, Marandi N,Adelsberger H, Konnerth A (2006) Optical monitoringof brain function in vivo: from neurons to networks.Pflugers Arch 453:385–96
Giaume C, Koulakoff A, Roux L, Holcman D, Rouach N(2010) Astroglial networks: a step further in neuroglialand gliovascular interactions. Nat Rev Neurosci 11:87–99
Gobel W, Kampa BM, Helmchen F (2007) Imaging cellularnetwork dynamics in three dimensions using fast 3Dlaser scanning. Nat Methods 4:73–9
Gordon GR, Choi HB, Rungta RL, Ellis-Davies GC,MacVicar BA (2008) Brain metabolism dictates thepolarity of astrocyte control over arterioles. Nature456:745–9
Grant PE, Roche-Labarbe N, Surova A, Themelis G, Selb J,Warren EK, Krishnamoorthy KS, Boas DA, FranceschiniMA (2009) Increased cerebral blood volume and oxygenconsumption in neonatal brain injury. J Cereb BloodFlow Metab 29:1704–13
Gregg NM, White BR, Zeff BW, Berger AJ, Culver JP (2010)Brain specificity of diffuse optical imaging: improve-ments from superficial signal regression and tomo-graphy. Front Neuroenergetics 2010 July 14;2.pii:14
Grewe BF, Helmchen F (2009) Optical probing of neuronalensemble activity. Curr Opin Neurobiol 19:520–9
Grewe BF, Langer D, Kasper H, Kampa BM, Helmchen F(2010) High-speed in vivo calcium imaging revealsneuronal network activity with near-millisecond preci-sion. Nat Methods 7:399–405
Grewe BF, Voigt FF, van ‘t Hoff M, Helmchen F (2011) Fasttwo-layer two-photon imaging of neuronal cell popula-tions using an electrically tunable lens. Biomed OptExpress 2:2035–46
Grinvald A, Frostig RD, Siegel RM, Bartfeld E (1991) High-resolution optical imaging of functional brain architec-ture in the awake monkey. Proc Natl Acad Sci USA88:11559–63
Grinvald A, Hildesheim R (2004) VSDI: a new era infunctional imaging of cortical dynamics. Nat RevNeurosci 5:874–85
Grinvald A, Lieke E, Frostig RD, Gilbert CD, Wiesel TN(1986) Functional architecture of cortex revealed byoptical imaging of intrinsic signals. Nature 324:361–4
Gunaydin LA, Yizhar O, Berndt A, Sohal VS, Deisseroth K,Hegemann P (2010) Ultrafast optogenetic control. NatNeurosci 13:387–92
Hamilton NB, Attwell D, Hall CN (2010) Pericyte-mediatedregulation of capillary diameter: a component ofneurovascular coupling in health and disease. FrontNeuroenergetics 2010 May 21;2.pii:5
Harbig K, Chance B, Kovach AG, Reivich M (1976) In vivomeasurement of pyridine nucleotide fluorescence fromcat brain cortex. J Appl Physiol 41:480–8
Heikal AA (2011) Intracellular coenzymes as naturalbiomarkers for metabolic activities and mitochondrialanomalies. Biomark Med 4:241–63
Hell SW (2009) Microscopy and its focal switch. NatMethods 6:24–32
Hires SA, Tian L, Looger LL (2008) Reporting neuralactivity with genetically encoded calcium indicators.Brain Cell Biol 36:69–86
Homma R, Baker BJ, Jin L, Garaschuk O, Konnerth A,Cohen LB, Zecevic D (2009) Wide-field and two-photonimaging of brain activity with voltage- and calcium-sensitive dyes. Philos Trans R Soc Lond B Biol Sci364:2453–67
Hoshi Y, Tamura M (1993) Detection of dynamic changes incerebral oxygenation coupled to neuronal functionduring mental work in man. Neurosci Lett 150:5–8
Hu S, Maslov K, Tsytsarev V, Wang LV (2009) Functionaltranscranial brain imaging by optical-resolution photo-acoustic microscopy. J Biomed Opt 14:040503
Hu S, Wang LV (2010) Photoacoustic imaging andcharacterization of the microvasculature. J Biomed Opt15:011101
Huang B (2010) Super-resolution optical microscopy:multiple choices. Curr Opin Chem Biol 14:10–4
Huang D, Swanson EA, Lin CP, Schuman JS, Stinson WG,Chang W, Hee MR, Flotte T, Gregory K, Puliafito CA,Fujimoto JG (1991) Optical coherence tomography.Science 254:1178–81
Huang S, Heikal AA, Webb WW (2002) Two-photonfluorescence spectroscopy and microscopy of NAD(P)Hand flavoprotein. Biophys J 82:2811–25
Huchzermeyer C, Albus K, Gabriel HJ, Otahal J, Tauben-berger N, Heinemann U, Kovacs R, Kann O (2008)Gamma oscillations and spontaneous network activityin the hippocampus are highly sensitive to decreases inpO2 and concomitant changes in mitochondrial redoxstate. J Neurosci 28:1153–62
Husson TR, Mallik AK, Zhang JX, Issa NP (2007) Func-tional imaging of primary visual cortex using flavo-protein autofluorescence. J Neurosci 27:8665–75
Iadecola C, Nedergaard M (2007) Glial regulation of thecerebral microvasculature. Nat Neurosci 10:1369–76
Izatt JA, Hee MR, Owen GM, Swanson EA, Fujimoto JG(1994) Optical coherence microscopy in scatteringmedia. Opt Lett 19:590–2
Ji N, Magee JC, Betzig E (2008) High-speed, low-photo-damage nonlinear imaging using passive pulse splitters.Nat Methods 5:197–202
Ji N, Milkie DE, Betzig E (2010) Adaptive optics via pupilsegmentation for high-resolution imaging in biologicaltissues. Nat Methods 7:141–7
Jia Y, Grafe MR, Gruber A, Alkayed NJ, Wang RK (2011)In vivo optical imaging of revascularization after braintrauma in mice. Microvasc Res 81:73–80
Jobsis FF (1977) Noninvasive, infrared monitoring ofcerebral and myocardial oxygen sufficiency and circu-latory parameters. Science 198:1264–7
Optical imaging of blood flow and metabolismA Devor et al
15
Journal of Cerebral Blood Flow & Metabolism (2012), 1–18
Kalatsky VA, Polley DB, Merzenich MM, Schreiner CE,Stryker MP (2005) Fine functional organization ofauditory cortex revealed by Fourier optical imaging.Proc Natl Acad Sci USA 102:13325–30
Kasischke KA, Lambert EM, Panepento B, Sun A, GelbardHA, Burgess RW, Foster TH, Nedergaard M (2010) Two-photon NADH imaging exposes boundaries of oxygendiffusion in cortical vascular supply regions. J CerebBlood Flow Metab 31:68–81
Kasischke KA, Vishwasrao HD, Fisher PJ, Zipfel WR, WebbWW (2004) Neural activity triggers neuronal oxidativemetabolism followed by astrocytic glycolysis. Science305:99–103
Kennerley AJ, Berwick J, Martindale J, Johnston D,Papadakis N, Mayhew JE (2005) Concurrent fMRI andoptical measures for the investigation of the hemo-dynamic response function. Magn Reson Med 54:354–65
Kerlin AM, Andermann ML, Berezovskii VK, Reid RC(2010) Broadly tuned response properties of diverseinhibitory neuron subtypes in mouse visual cortex.Neuron 67:858–71
Kerr JN, Denk W (2008) Imaging in vivo: watching the brainin action. Nat Rev Neurosci 9:195–205
Kim MN, Durduran T, Frangos S, Edlow BL, Buckley EM,Moss HE, Zhou C, Yu G, Choe R, Maloney-Wilensky E,Wolf RL, Grady MS, Greenberg JH, Levine JM, Yodh AG,Detre JA, Kofke WA (2010) Noninvasive measurement ofcerebral blood flow and blood oxygenation using near-infrared and diffuse correlation spectroscopies incritically brain-injured adults. Neurocrit Care 12:173–80
Kirkby PA, Srinivas Nadella KM, Silver RA (2010) Acompact acousto-optic lens for 2D and 3D femtosecondbased 2-photon microscopy. Opt Express 18:13721–45
Kitamura K, Judkewitz B, Kano M, Denk W, Hausser M(2008) Targeted patch-clamp recordings and single-cellelectroporation of unlabeled neurons in vivo. NatMethods 5:61–7
Kleinfeld D, Blinder P, Drew PJ, Driscoll JD, Muller A, TsaiPS, Shih AY (2011) A guide to delineate the logic ofneurovascular signaling in the brain. Front Neuro-energetics 3:1
Kleinfeld D, Mitra PP, Helmchen F, Denk W (1998)Fluctuations and stimulus-induced changes in bloodflow observed in individual capillaries in layers 2through 4 of rat neocortex. Proc Natl Acad Sci USA95:15741–6
Kobat D, Durst ME, Nishimura N, Wong AW, Schaffer CB,Xu C (2009) Deep tissue multiphoton microscopy usinglonger wavelength excitation. Opt Express 17:13354–64
Koehler RC, Roman RJ, Harder DR (2009) Astrocytes andthe regulation of cerebral blood flow. Trends Neurosci32:160–9
Kohl M, Lindauer U, Royl G, Kuhl M, Gold L, Villringer A,Dirnagl U (2000) Physical model for the spectroscopicanalysis of cortical intrinsic optical signals. Phys MedBiol 45:3749–64
Kuchibhotla KV, Lattarulo CR, Hyman BT, Bacskai BJ(2009) Synchronous hyperactivity and intercellularcalcium waves in astrocytes in Alzheimer mice. Science323:1211–5
Kuhn B, Denk W, Bruno RM (2008) In vivo two-photonvoltage-sensitive dye imaging reveals top-down controlof cortical layers 1 and 2 during wakefulness. Proc NatlAcad Sci USA 105:7588–93
Laufer J, Zhang E, Raivich G, Beard P (2009) Three-dimensional noninvasive imaging of the vasculature in
the mouse brain using a high resolution photoacousticscanner. Appl Opt 48:D299–306
Lebedev AY, Cheprakov AV, Sakadzic S, Boas DA, WilsonDF, Vinogradov SA (2009) Dendritic phosphorescentprobes for oxygen imaging in biological systems. ACSAppl Mater Interfaces 1:1292–304
Lecoq J, Parpaleix A, Roussakis E, Ducros M, Houssen YG,Vinogradov SA, Charpak S (2011) Simultaneous two-photon imaging of oxygen and blood flow in deepcerebral vessels. Nat Med 17:893–8
Lee HY, Lee JJ, Park J, Park SB (2011) Development offluorescent glucose bioprobes and their application onreal-time and quantitative monitoring of glucose uptakein living cells. Chemistry 17:143–50
Lee JH, Durand R, Gradinaru V, Zhang F, Goshen I, Kim DS,Fenno LE, Ramakrishnan C, Deisseroth K (2010)Global and local fMRI signals driven by neuronsdefined optogenetically by type and wiring. Nature465:788–92
Leitgeb R, Hitzenberger C, Fercher A (2003) Performance offourier domain versus time domain optical coherencetomography. Opt Express 11:889–94
Li D, Demirbas U, Birge JR, Petrich GS, Kolodziejski LA,Sennaroglu A, Kartner FX, Fujimoto JG (2010) Diode-pumped passively mode-locked GHz femtosecondCr:LiSAF laser with kW peak power. Opt Lett 35:1446–8
Lloyd-Fox S, Blasi A, Elwell CE (2010) Illuminating thedeveloping brain: the past, present and future offunctional near infrared spectroscopy. Neurosci Bio-behav Rev 34:269–84
Mank M, Griesbeck O (2008) Genetically encoded calciumindicators. Chem Rev 108:1550–64
Margrie TW, Meyer AH, Caputi A, Monyer H, Hasan MT,Schaefer AT, Denk W, Brecht M (2003) Targeted whole-cell recordings in the mammalian brain in vivo. Neuron39:911–8
Mayhew J, Johnston D, Berwick J, Jones M, Coffey P,Zheng Y (2000) Spectroscopic analysis of neural activityin brain: increased oxygen consumption followingactivation of barrel cortex. Neuroimage 12:664–75
Mesquita RC, Durduran T, Yu G, Buckley EM, Kim MN,Zhou C, Choe R, Sunar U, Yodh AG (2011) Directmeasurement of tissue blood flow and metabolism withdiffuse optics. Philos Transact A Math Phys Eng Sci369:4390–406
Miesenbock G (2011) Optogenetic control of cells andcircuits. Annu Rev Cell Dev Biol 27:731–58
Miesenbock G, De Angelis DA, Rothman JE (1998) Visuali-zing secretion and synaptic transmission with pH-sensi-tive green fluorescent proteins. Nature 394:192–5
Mohajerani MH, Aminoltejari K, Murphy TH (2011)Targeted mini-strokes produce changes in interhemi-spheric sensory signal processing that are indicative ofdisinhibition within minutes. Proc Natl Acad Sci USA108:E183–91
Nedergaard M (1994) Direct signaling from astrocytes toneurons in cultures of mammalian brain cells. Science263:1768–71
Nguyen QT, Schroeder LF, Mank M, Muller A, Taylor P,Griesbeck O, Kleinfeld D (2010) An in vivo biosensor forneurotransmitter release and in situ receptor activity.Nat Neurosci 13:127–32
Nikolenko V, Poskanzer KE, Yuste R (2007) Two-photonphotostimulation and imaging of neural circuits.Nat Methods 4:943–50
Nishimura N, Rosidi NL, Iadecola C, Schaffer CB (2010)Limitations of collateral flow after occlusion of a single
Optical imaging of blood flow and metabolismA Devor et al
16
Journal of Cerebral Blood Flow & Metabolism (2012), 1–18
cortical penetrating arteriole. J Cereb Blood Flow Metab30:1914–27
Nishimura N, Schaffer CB, Friedman B, Lyden PD,Kleinfeld D (2007) Penetrating arterioles are a bottleneckin the perfusion of neocortex. Proc Natl Acad Sci USA104:365–70
Nishimura N, Schaffer CB, Friedman B, Tsai PS, Lyden PD,Kleinfeld D (2006) Targeted insult to subsurface corticalblood vessels using ultrashort laser pulses: three modelsof stroke. Nat Methods 3:99–108
Noguchi J, Nagaoka A, Watanabe S, Ellis-Davies GC,Kitamura K, Kano M, Matsuzaki M, Kasai H (2011)In vivo two-photon uncaging of glutamate revealing thestructure-function relationships of dendritic spines inthe neocortex of adult mice. J Physiol 589:2447–57
Ohki K, Chung S, Ch’ng YH, Kara P, Reid RC (2005)Functional imaging with cellular resolution revealsprecise micro-architecture in visual cortex. Nature433:597–603
Okubo Y, Sekiya H, Namiki S, Sakamoto H, Iinuma S,Yamasaki M, Watanabe M, Hirose K, Iino M (2010)Imaging extrasynaptic glutamate dynamics in the brain.Proc Natl Acad Sci USA 107:6526–31
Ou W, Nissila I, Radhakrishnan H, Boas DA, HamalainenMS, Franceschini MA (2009) Study of neurovascularcoupling in humans via simultaneous magnetoencepha-lography and diffuse optical imaging acquisition.Neuroimage 46:624–32
Paulson OB, Hasselbalch SG, Rostrup E, Knudsen GM,Pelligrino D (2010) Cerebral blood flow response tofunctional activation. J Cereb Blood Flow Metab 30:2–14
Peterka DS, Takahashi H, Yuste R (2011) Imaging voltage inneurons. Neuron 69:9–21
Petzold GC, Albeanu DF, Sato TF, Murthy VN (2008)Coupling of neural activity to blood flow in olfactoryglomeruli is mediated by astrocytic pathways. Neuron58:897–910
Pickup JC, Hussain F, Evans ND, Rolinski OJ, Birch DJ(2005) Fluorescence-based glucose sensors. BiosensBioelectron 20:2555–65
Raichle ME, Mintun MA (2006) Brain work and brainimaging. Annu Rev Neurosci 29:449–76
Rancillac A, Rossier J, Guille M, Tong XK, Geoffroy H,Amatore C, Arbault S, Hamel E, Cauli B (2006)Glutamatergic control of microvascular tone by distinctGABA neurons in the cerebellum. J Neurosci 26:6997–7006
Reinert KC, Gao W, Chen G, Ebner TJ (2007) Flavoproteinautofluorescence imaging in the cerebellar cortexin vivo. J Neurosci Res 85:3221–32
Rickgauer JP, Tank DW (2009) Two-photon excitation ofchannelrhodopsin-2 at saturation. Proc Natl Acad SciUSA 106:15025–30
Roche-Labarbe N, Carp SA, Surova A, Patel M, Boas DA,Grant PE, Franceschini MA (2010) Noninvasive opticalmeasures of CBV, StO(2), CBF index, and rCMRO(2) inhuman premature neonates’ brains in the first six weeksof life. Hum Brain Mapp 31:341–52
Ross WN, Nakamura T, Watanabe S, Larkum M, Lasser-Ross N (2005) Synaptically activated ca2+ release frominternal stores in CNS neurons. Cell Mol Neurobiol25:283–95
Rumsey WL, Vanderkooi JM, Wilson DF (1988) Imaging ofphosphorescence: a novel method for measuring oxygendistribution in perfused tissue. Science 241:1649–51
Sakadzic S, Roussakis E, Yaseen MA, Srinivasan VJ,Mandeville ET, Devor A, Lo EH, Vinogradov SA, Boas
DA (2010) Two-photon high-resolution 3D imaging ofpartial pressure of oxygen in cerebral vasculature andtissue. Nat Methods 7:755–9
Sakadzic S, Yuan S, Dilekoz E, Ruvinskaya S, VinogradovSA, Ayata C, Boas DA (2009) Simultaneous imaging ofcerebral partial pressure of oxygen and blood flowduring functional activation and cortical spreadingdepression. Appl Opt 48:D169–77
Schaffer CB, Friedman B, Nishimura N, Schroeder LF, TsaiPS, Ebner FF, Lyden PD, Kleinfeld D (2006) Two-photonimaging of cortical surface microvessels reveals a robustredistribution in blood flow after vascular occlusion.PLoS Biol 4:e22
Schwartz TH, Bonhoeffer T (2001) In vivo optical mappingof epileptic foci and surround inhibition in ferretcerebral cortex. Nat Med 7:1063–7
Schwartz TH, Hong SB, Bagshaw AP, Chauvel P, Benar CG(2011) Preictal changes in cerebral haemodynamics:review of findings and insights from intracerebral EEG.Epilepsy Res 97:252–66
Sheth SA, Nemoto M, Guiou M, Walker M, Pouratian N,Toga AW (2004) Linear and nonlinear relationshipsbetween neuronal activity, oxygen metabolism, andhemodynamic responses. Neuron 42:347–55
Sheth SA, Nemoto M, Guiou MW, Walker MA, Toga AW(2005) Spatiotemporal evolution of functional hemody-namic changes and their relationship to neuronalactivity. J Cereb Blood Flow Metab 25:830–41
Shin HK, Dunn AK, Jones PB, Boas DA, Moskowitz MA,Ayata C (2006) Vasoconstrictive neurovascular couplingduring focal ischemic depolarizations. J Cereb BloodFlow Metab 26:1018–30
Shtoyerman E, Arieli A, Slovin H, Vanzetta I, Grinvald A(2000) Long-term optical imaging and spectroscopyreveal mechanisms underlying the intrinsic signal andstability of cortical maps in V1 of behaving monkeys.J Neurosci 20:8111–21
Shuttleworth CW (2010) Use of NAD(P)H and flavoproteinautofluorescence transients to probe neuron and astro-cyte responses to synaptic activation. Neurochem Int56:379–86
Siegel MS, Isacoff EY (1997) A genetically encoded opticalprobe of membrane voltage. Neuron 19:735–41
Sigler A, Mohajerani MH, Murphy TH (2009) Imaging rapidredistribution of sensory-evoked depolarization throughexisting cortical pathways after targeted stroke in mice.Proc Natl Acad Sci USA 106:11759–64
Simpson IA, Carruthers A, Vannucci SJ (2007) Supply anddemand in cerebral energy metabolism: the role ofnutrient transporters. J Cereb Blood Flow Metab27:1766–91
Sirotin YB, Das A (2010) Spatial relationship betweenflavoprotein fluorescence and the hemodynamic res-ponse in the primary visual cortex of alert macaquemonkeys. Front Neuroenergetics 2:6
Srienc AI, Kurth-Nelson ZL, Newman EA (2010) Imagingretinal blood flow with laser speckle flowmetry. FrontNeuroenergetics 2010 September 15;2.pii:128
Srinivasan VJ, Atochin DN, Radhakrishnan H, Jiang JY,Ruvinskaya S, Wu W, Barry S, Cable AE, Ayata C, HuangPL, Boas DA (2011) Optical coherence tomography forthe quantitative study of cerebrovascular physiology.J Cereb Blood Flow Metab 31:1339–45
Stefanovic B, Hutchinson E, Yakovleva V, Schram V,Russell JT, Belluscio L, Koretsky AP, Silva AC (2008)Functional reactivity of cerebral capillaries. J CerebBlood Flow Metab 28:961–72
Optical imaging of blood flow and metabolismA Devor et al
17
Journal of Cerebral Blood Flow & Metabolism (2012), 1–18
Svoboda K, Yasuda R (2006) Principles of two-photonexcitation microscopy and its applications to neuro-science. Neuron 50:823–39
Takano T, Tian GF, Peng W, Lou N, Lovatt D, Hansen AJ,Kasischke KA, Nedergaard M (2007) Cortical spreadingdepression causes and coincides with tissue hypoxia.Nat Neurosci 10:754–62
Tian P, Devor A, Sakadzic S, Dale AM, Boas DA (2010a)Monte Carlo simulation of the spatial resolution anddepth sensitivity of two-dimensional optical imaging ofthe brain. J Biomed Opt 16:016006
Tian P, Teng IC, May LD, Kurz R, Lu K, Scadeng M, HillmanEM, De Crespigny AJ, D’Arceuil HE, Mandeville JB,Marota JJ, Rosen BR, Liu TT, Boas DA, Buxton RB, DaleAM, Devor A (2010b) Cortical depth-specific micro-vascular dilation underlies laminar differences in bloodoxygenation level-dependent functional MRI signal.Proc Natl Acad Sci USA 107:15246–51
Tsien RW, Lipscombe D, Madison D, Bley K, Fox A (1995)Reflections on Ca(2+)-channel diversity, 1988–1994.Trends Neurosci 18:52–4
Tsien RY (1981) A non-disruptive technique for loadingcalcium buffers and indicators into cells. Nature290:527–8
Tsien RY (2005) Building and breeding molecules to spy oncells and tumors. FEBS Lett 579:927–32
Tsytsarev V, Hu S, Yao J, Maslov K, Barbour DL, Wang LV(2011) Photoacoustic microscopy of microvascularresponses to cortical electrical stimulation. J BiomedOpt 16:076002
Turner DA, Foster KA, Galeffi F, Somjen GG (2007)Differences in O2 availability resolve the apparentdiscrepancies in metabolic intrinsic optical signalsin vivo and in vitro. Trends Neurosci 30:390–8
Vakoc BJ, Lanning RM, Tyrrell JA, Padera TP, Bartlett LA,Stylianopoulos T, Munn LL, Tearney GJ, Fukumura D,Jain RK, Bouma BE (2009) Three-dimensional micro-scopy of the tumor microenvironment in vivo usingoptical frequency domain imaging. Nat Med 15:1219–23
Vanderkooi JM, Maniara G, Green TJ, Wilson DF (1987) Anoptical method for measurement of dioxygen concentra-tion based upon quenching of phosphorescence. J BiolChem 262:5476–82
Vanzetta I, Grinvald A (1999) Increased cortical oxidativemetabolism due to sensory stimulation: implications forfunctional brain imaging. Science 286:1555–8
Villringer A, Planck J, Hock C, Schleinkofer L, Dirnagl U(1993) Near infrared spectroscopy (NIRS): a new tool tostudy hemodynamic changes during activation of brainfunction in human adults. Neurosci Lett 154:101–4
Vishwasrao HD, Heikal AA, Kasischke KA, Webb WW(2005) Conformational dependence of intracellularNADH on metabolic state revealed by associatedfluorescence anisotropy. J Biol Chem 280:25119–26
Vnek N, Ramsden BM, Hung CP, Goldman-Rakic PS, RoeAW (1999) Optical imaging of functional domains in thecortex of the awake and behaving monkey. Proc NatlAcad Sci USA 96:4057–60
Vogelstein JT, Packer AM, Machado TA, Sippy T, Babadi B,Yuste R, Paninski L (2010) Fast nonnegative deconvolu-tion for spike train inference from population calciumimaging. J Neurophysiol 104:3691–704
Wang D, Zhang Z, Chanda B, Jackson MB (2010) Improvedprobes for hybrid voltage sensor imaging. Biophys J99:2355–65
Wang LV (2009) Multiscale photoacoustic microscopy andcomputed tomography. Nat Photonics 3:503–9
Wang RK, Jacques SL, Ma Z, Hurst S, Hanson SR, Gruber A(2007a) Three dimensional optical angiography. OptExpress 15:4083–97
Wang X, Pang Y, Ku G, Xie X, Stoica G, Wang LV (2003)Noninvasive laser-induced photoacoustic tomographyfor structural and functional in vivo imaging of thebrain. Nat Biotechnol 21:803–6
Wang Y, Bower BA, Izatt JA, Tan O, Huang D (2007b)In vivo total retinal blood flow measurement by Fourierdomain Doppler optical coherence tomography.J Biomed Opt 12:041215
Weber B, Burger C, Wyss MT, von Schulthess GK,Scheffold F, Buck A (2004) Optical imaging of thespatiotemporal dynamics of cerebral blood flow andoxidative metabolism in the rat barrel cortex. Eur JNeurosci 20:2664–70
Wilms CD, Schmidt H, Eilers J (2006) Quantitative two-photon Ca2+ imaging via fluorescence lifetime analysis.Cell Calcium 40:73–9
Winship IR, Murphy TH (2008) In vivo calcium imagingreveals functional rewiring of single somatosensoryneurons after stroke. J Neurosci 28:6592–606
Wolf M, Ferrari M, Quaresima V (2007) Progress of near-infrared spectroscopy and topography for brain andmuscle clinical applications. J Biomed Opt 12:062104
Yao J, Maslov KI, Zhang Y, Xia Y, Wang LV (2011) Label-freeoxygen-metabolic photoacoustic microscopy in vivo.J Biomed Opt 16:076003
Yaseen MA, Srinivasan VJ, Sakadzic S, Radhakrishnan H,Gorczynska I, Wu W, Fujimoto JG, Boas DA (2011)Microvascular oxygen tension and flow measurementsin rodent cerebral cortex during baseline conditions andfunctional activation. J Cereb Blood Flow Metab 31:1051–63
Yaseen MA, Srinivasan VJ, Sakadzic S, Wu W, RuvinskayaS, Vinogradov SA, Boas DA (2009) Optical monitoring ofoxygen tension in cortical microvessels with confocalmicroscopy. Opt Express 17:22341–50
Yizhar O, Fenno LE, Davidson TJ, Mogri M, Deisseroth K(2011) Optogenetics in neural systems. Neuron71:9–34
Zhang HF, Maslov K, Stoica G, Wang LV (2006) Functionalphotoacoustic microscopy for high-resolution and non-invasive in vivo imaging. Nat Biotechnol 24:848–51
Zhang S, Murphy TH (2007) Imaging the impact of corticalmicrocirculation on synaptic structure and sensory-evoked hemodynamic responses in vivo. PLoS Biol5:e119
Zhao S, Ting JT, Atallah HE, Qiu L, Tan J, Gloss B,Augustine GJ, Deisseroth K, Luo M, Graybiel AM, FengG (2011) Cell type-specific channelrhodopsin-2 trans-genic mice for optogenetic dissection of neural circuitryfunction. Nat Methods 8:745–52
Zonta M, Angulo MC, Gobbo S, Rosengarten B, HossmannKA, Pozzan T, Carmignoto G (2003) Neuron-to-astrocytesignaling is central to the dynamic control of brainmicrocirculation. Nat Neurosci 6:43–50
Optical imaging of blood flow and metabolismA Devor et al
18
Journal of Cerebral Blood Flow & Metabolism (2012), 1–18
Related Documents