Frequency based Algorithm for Robust Contour Extraction of Blue Whale B and D calls Shyam Kumar Madhusudhanat, Erin M. Olesont, Melissa S. Soldevillat, Marie A. Rocht, John A. Hildebrandt t Department of Computer Science, San Diego State University, 5500 Campanile Drive, San Diego, CA 92182-7720 t Scripps Institution of Oceanography, The University of California at San Diego, La Jolla, CA 92093-0205 Abstract-The sea is home to a myriad of marine animal species, many of which use sound as a primary means of communication, navigation and foraging. Of particular interest are the Blue whales (Balaenoptera musculus) of the cetacean family. Massive commercial whaling prior to 1960 brought the species close to extinction and its population still remains very low. Passive acoustic monitoring of baleen whales has recently been used to provide long-term information about their presence and behavior, and provides an attractive complement to traditional visual based monitoring. In this work we present a frequency domain based algorithm developed for extracting the frequency contours of the dominant harmonic in tonal calls of blue whales (B and D calls). The algorithm uses a two pass approach to contour extraction. In the first pass, partial candidate contours are formed, followed by a second pass which uses the partial information to construct complete contours. When evaluated on a one hour labeled recording, the algorithm had 90% recall and 76% precision. I. INTRODUCTION Baleen whales are thought to use vocalizations for various purposes - to establish territories, locate conspecifics and to attract mates [1]. Blue whales in the eastern north Pacific are known to produce at least three types of tonal calls and one pulsed call [1]. Of particular interest to us are two classes of tonal calls, namely B and D calls. Adaptation of existing detection algorithms is complicated by the high variability of several call parameters including duration, frequency content, and sweep rate. The blue whale D call contour sweeps steeply downwards within an approximate frequency range of 30 to 95 Hz and lasts 1-4 s [2] (Fig. la). D calls are primarily associated with feeding and are produced by both sexes [1]. B calls are quite long ( 20 s) with their third harmonic being the most prominent, sweeping downwards within a relatively smaller frequency range of approximately 40 to 55 Hz [3] (Fig. lb). Although their exact purpose is unknown, they are mostly associated with migration and are known to be produced only by males [1]. Acoustic based methods of monitoring marine mammals are complementary to visual methods and have been used for the purpose of studying behavioral patterns such as migration [3]. However, several factors make it difficult to detect these call types 1 automatically using conventional acoustic approaches. The presence of temporal characteristics and irregularities in these call types are some of the primary factors [2]. Spectrogram correlation [4] has been shown to be effective for tonal B calls, but frequency modulated D calls exhibit high variability in sweep range and slope, making it difficult to generate a suitable kernel for recognition by spectrogram correlation. Some calls have observed dropouts (see for example Fig. lb between 12 and 17 s). These dropouts were examined in [5] where calls were analyzed to determine if any portion of the call could not be attributed to interference effects resulting from Lloyd's mirror. While interference effects did play a role, in some cases it was likely that variations in the call amplitude were due to variations in the production by the whale. Regardless of the cause, for the purposes of call counting these should be counted as a single call and our strategy is to bridge the contour. Other noise sources also contribute to the difficulty of call detection and contour extraction. The low frequency components (those below 100 Hz) in the sound of passing ships and the line-induced buzz/hum (50-60 Hz) add to the problems making 100 100 I 80 N 80 6 60 60 40 40 2 4 6 2 4 6 8 10 12 14 16 18 20 22 Time (s) Time (s) a) D call b) B call Fig 1. Spectrograms showing call contours. Spectrograms produced using 256 ms Hanning window and 1024 point FFT with an overlap of 50%. Throughout this literature, we will use the term "call" to refer to the vocalizations of interest to this study- namely the blue whale B and D calls. 978-1-4244-2126-8/08/$25.00 ©2008 IEEE Authorized licensed use limited to: Univ of Calif San Diego. Downloaded on October 12, 2008 at 21:29 from IEEE Xplore. Restrictions apply.

Welcome message from author
This document is posted to help you gain knowledge. Please leave a comment to let me know what you think about it! Share it to your friends and learn new things together.
Transcript
Frequency based Algorithm for Robust ContourExtraction of Blue Whale B and D calls
Shyam Kumar Madhusudhanat, Erin M. Olesont, Melissa S. Soldevillat, Marie A. Rocht, John A. Hildebrandtt Department of Computer Science, San Diego State University, 5500 Campanile Drive, San Diego, CA 92182-7720
t Scripps Institution of Oceanography, The University of California at San Diego, La Jolla, CA 92093-0205
Abstract-The sea is home to a myriad of marine animal species, many of which use sound as a primary means of communication,navigation and foraging. Of particular interest are the Blue whales (Balaenoptera musculus) of the cetacean family. Massive commercialwhaling prior to 1960 brought the species close to extinction and its population still remains very low. Passive acoustic monitoring ofbaleen whales has recently been used to provide long-term information about their presence and behavior, and provides an attractivecomplement to traditional visual based monitoring. In this work we present a frequency domain based algorithm developed forextracting the frequency contours of the dominant harmonic in tonal calls of blue whales (B and D calls). The algorithm uses a two passapproach to contour extraction. In the first pass, partial candidate contours are formed, followed by a second pass which uses thepartial information to construct complete contours. When evaluated on a one hour labeled recording, the algorithm had 90% recall and76% precision.
I. INTRODUCTION
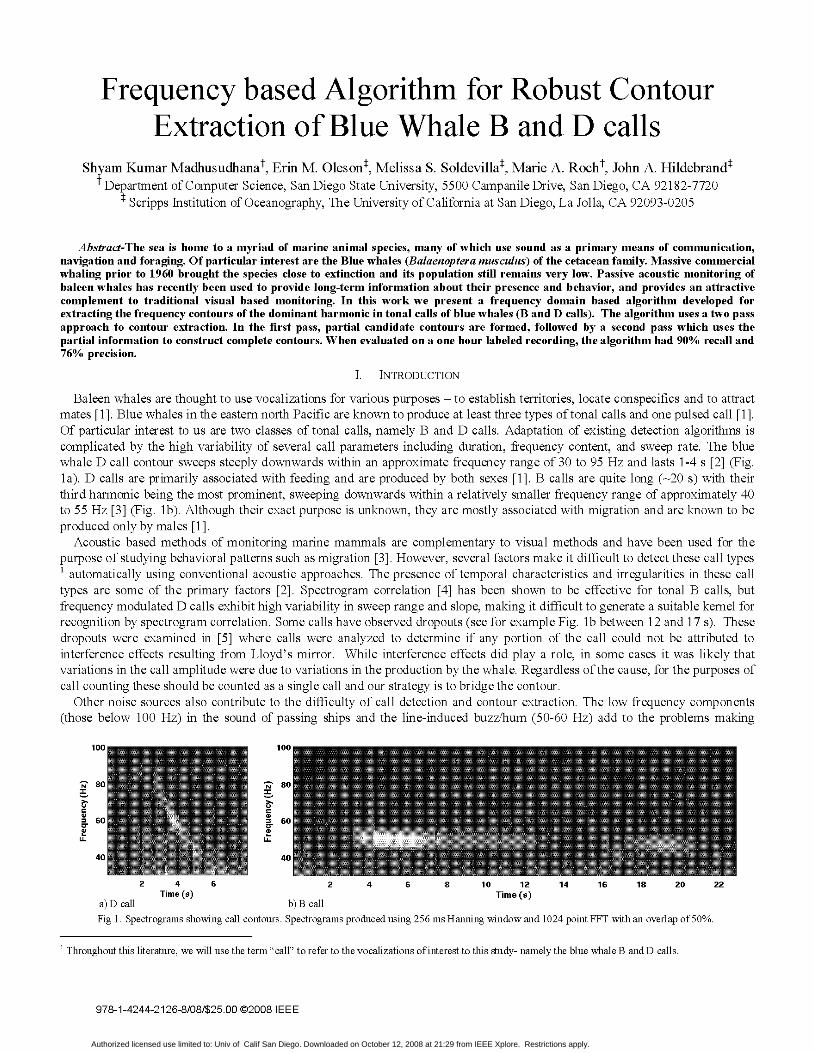
Baleen whales are thought to use vocalizations for various purposes - to establish territories, locate conspecifics and to attractmates [1]. Blue whales in the eastern north Pacific are known to produce at least three types of tonal calls and one pulsed call [1].Of particular interest to us are two classes of tonal calls, namely B and D calls. Adaptation of existing detection algorithms iscomplicated by the high variability of several call parameters including duration, frequency content, and sweep rate. The bluewhale D call contour sweeps steeply downwards within an approximate frequency range of 30 to 95 Hz and lasts 1-4 s [2] (Fig.la). D calls are primarily associated with feeding and are produced by both sexes [1]. B calls are quite long ( 20 s) with theirthird harmonic being the most prominent, sweeping downwards within a relatively smaller frequency range of approximately 40to 55 Hz [3] (Fig. lb). Although their exact purpose is unknown, they are mostly associated with migration and are known to beproduced only by males [1].
Acoustic based methods of monitoring marine mammals are complementary to visual methods and have been used for thepurpose of studying behavioral patterns such as migration [3]. However, several factors make it difficult to detect these call types1 automatically using conventional acoustic approaches. The presence of temporal characteristics and irregularities in these calltypes are some of the primary factors [2]. Spectrogram correlation [4] has been shown to be effective for tonal B calls, butfrequency modulated D calls exhibit high variability in sweep range and slope, making it difficult to generate a suitable kernel forrecognition by spectrogram correlation. Some calls have observed dropouts (see for example Fig. lb between 12 and 17 s). Thesedropouts were examined in [5] where calls were analyzed to determine if any portion of the call could not be attributed tointerference effects resulting from Lloyd's mirror. While interference effects did play a role, in some cases it was likely thatvariations in the call amplitude were due to variations in the production by the whale. Regardless of the cause, for the purposes ofcall counting these should be counted as a single call and our strategy is to bridge the contour.
Other noise sources also contribute to the difficulty of call detection and contour extraction. The low frequency components(those below 100 Hz) in the sound of passing ships and the line-induced buzz/hum (50-60 Hz) add to the problems making
100 100
I 80 N 80
660 60
40 40
2 4 6 2 4 6 8 10 12 14 16 18 20 22Time (s) Time (s)
a) D call b) B callFig 1. Spectrograms showing call contours. Spectrograms produced using 256 ms Hanning window and 1024 point FFT with an overlap of 50%.
Throughout this literature, we will use the term "call" to refer to the vocalizations of interest to this study- namely the blue whale B and D calls.
978-1-4244-2126-8/08/$25.00 ©2008 IEEE
Authorized licensed use limited to: Univ of Calif San Diego. Downloaded on October 12, 2008 at 21:29 from IEEE Xplore. Restrictions apply.
contour extraction more difficult. Also, fin whale (Balaenoptera physalus) calls that are downswept and are in the range of 15-50Hz [2] fall in close frequency ranges of blue whale D calls.
II. BACKGROUND
An effective and widely used technique for many mysticete calls is spectrogram correlation [4, 6]. The spectrogram of aprototype call is used to form a kernel which is correlated with an audio stream. When the correlation exceeds a user-definedthreshold, a call is said to be detected. The technique has been successfully used on B calls (see [3] as an example), but is notcapable of recognizing calls that vary significantly from the prototype in duration, shape, or frequency range. An alternative hasbeen proposed for odontocete whistles which are also tonal in nature, but tend to be more complex and overlap due to largegroupings of animals. A very brief description of an unpublished semiautomatic algorithm developed by Lammers for odontocetewhistles appears in [7]. Given a pair of endpoints, spectral frames are analyzed for non-overlapping contours with evidence ofharmonic structure. In [8], a two stage method is proposed where the first stage extracts a variable number ofpeaks based upon ananalysis of spectral variance and forms segments from the connected peaks based on a local search of peak neighborhoods. Thesecond stage assembles contours based upon the fit of contour statistics whose distributions are estimated from a set of trainingcontours.
The spectrogram correlation method has been used effectively for B calls, but variations in the D calls prevent the constructionof an effective D call kernel. Lammers' algorithm was tried, but could not really extract these low frequency calls. With non-trivial modifications to heuristics and constraints, the algorithm of [8] could be extended to function with mysticete calls.However, the simpler structure of mysticete calls and sparsity of call overlap make the proposed algorithm a viable alternativewhich can execute an order of magnitude faster than real time on modest general purpose hardware. The proposed algorithm isbased upon ideas used to extract fundamental frequency contours in human speech (e.g. [9]) which rely on dynamicprogramming.
III. DATA COLLECTION
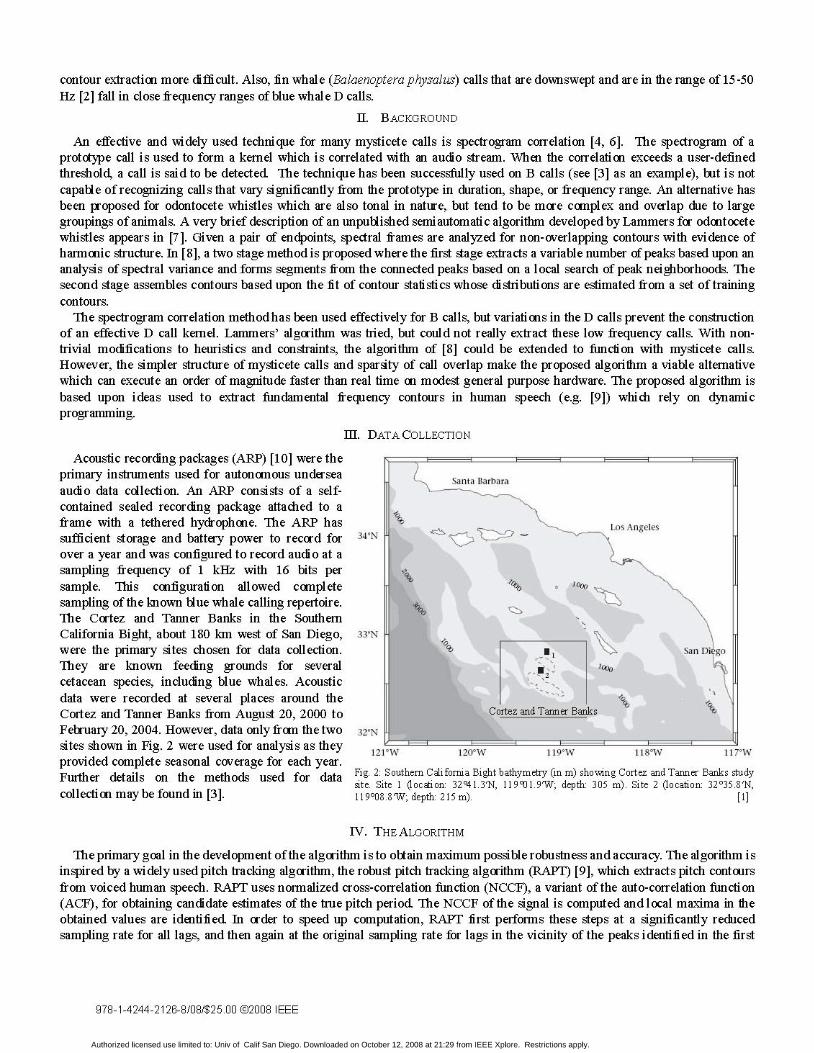
Acoustic recording packages (ARP) [10] werethe._primary instruments used for autonomous undersea S intirbtaaudio data collection. An ARP consists of a self-contained sealed recording package attached to aframe with a tethered hydrophone. The ARP has __... A E t~~~~~~~~~oSAn.gelessufficient storage and battery power to record for Nover a year and was configured to record audio at asampling frequency of 1 kHz with 16 bits persample. This configuration allowed completesampling of the known blue whale calling repertoire.The Cortez and Tanner Banks in the SouthernCalifornia Bight, about 180 km west of San Diego, 33 Nwere the primary sites chosen for data collection. santThey are known feeding grounds for severalcetacean species, including blue whales. Acousticdata were recorded at several places around the.......Cortez and Tanner Banks from August 20, 2000 to CortezandTannerBahksFebruary 20, 2004. However, data only from the two 32NNsites shown in Fig. 2 were used for analysis as they _ [t lv
1621.W :120OW l. 191W IIKW I. L 7"Wprovided complete seasonal coverage for each year.Furthier dopetailseon othe moethosguedfordahyata Fig. 2: Southern California Bight bathymetry (in m) showing Cortez and Tanner Banks study
site. Site I (location: 32'41.3gN, 11901.9'W; depth: 305 m). Site 2 (location: 32035.8N,collection may be found in [3]. 119°08.8'W; depth: 215 m). [1]
IV. THE ALGORITHM
The primary goal in the development ofthe algorithm is to obtain maximum possible robustness and accuracy. The algorithm isinspired by a widely used pitch tracking algorithm, the robust pitch tracking algorithm (RAPT) [9], which extracts pitch contoursfrom voiced human speech. RAPT uses normalized cross-correlation function (NCCF), a variant of the auto-correlation function(ACF), for obtaining candidate estimates of the true pitch period. The NCCF of the signal is computed and local maxima in theobtained values are identified. In order to speed up computation, RAPT first performs these steps at a significantly reducedsampling rate for all lags, and then again at the original sampling rate for lags in the vicinity of the peaks identified in the first
978-1-4244-2126-8/08/$25.00 ©2008 IEEE
Authorized licensed use limited to: Univ of Calif San Diego. Downloaded on October 12, 2008 at 21:29 from IEEE Xplore. Restrictions apply.
step, thereby producing refined peak location and amplitude estimates. Our algorithm operates in the spectral domain instead, andobtains the estimates of energy and location of peak frequencies using the discrete Fourier transform of the signal. In RAPT,selection among candidate contours is based on a cost function which penalizes candidates with low energy and those that changerapidly. In our algorithm, a two pass dynamic programming approach is employed for selecting the best contour among thecandidates.
A. Algorithm UutlineIn a first pass, the frequency content of each frame is analyzed for spectral peaks after normalization by spectral means
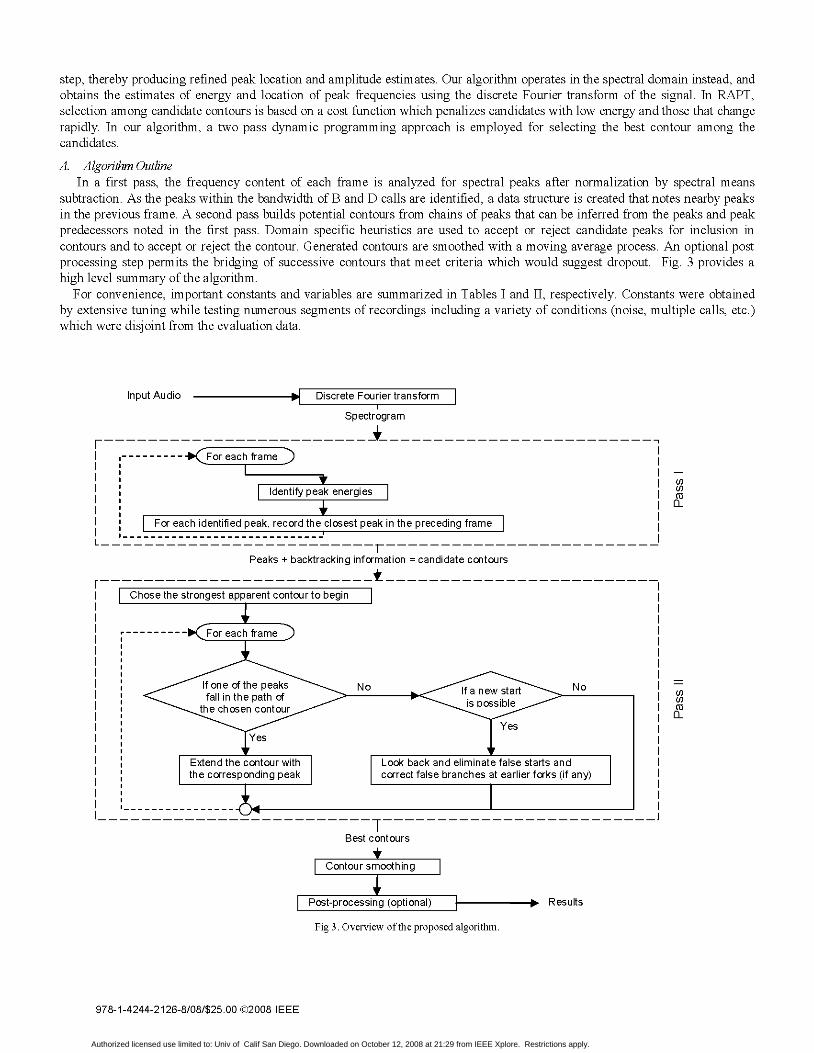
subtraction. As the peaks within the bandwidth ofB and D calls are identified, a data structure is created that notes nearby peaksin the previous frame. A second pass builds potential contours from chains of peaks that can be inferred from the peaks and peakpredecessors noted in the first pass. Domain specific heuristics are used to accept or reject candidate peaks for inclusion incontours and to accept or reject the contour. Generated contours are smoothed with a moving average process. An optional postprocessing step permits the bridging of successive contours that meet criteria which would suggest dropout. Fig. 3 provides ahigh level summary of the algorithm.
For convenience, important constants and variables are summarized in Tables I and II, respectively. Constants were obtainedby extensive tuning while testing numerous segments of recordings including a variety of conditions (noise, multiple calls, etc.)which were disjoint from the evaluation data.
Input Audio 1| Discrete Fourier transform
Spectrogram
,- --------<For each frame
Identify peak energies |I
, t CLFor each identified peak, record the closest peak in the precedingframe
*__ -------~----------------r----------Peaks + backtracking information = candidate contours
Chose the strongest apparent contour to begin
--------- r each
: ' s;Yes 4 |~~~~~~~~~~~~~~~eExtend the contour with Look back and eliminatle starts and
I the corresponding peak correct false branches at earlier forks (if any)
Best contours
Contour smoothing
Post-processing (optional) [ Results
Fig 3. Overview ofthe proposed algorithm.
978-1-4244-2126-8/08/$25.00 ©2008 IEEE
Authorized licensed use limited to: Univ of Calif San Diego. Downloaded on October 12, 2008 at 21:29 from IEEE Xplore. Restrictions apply.
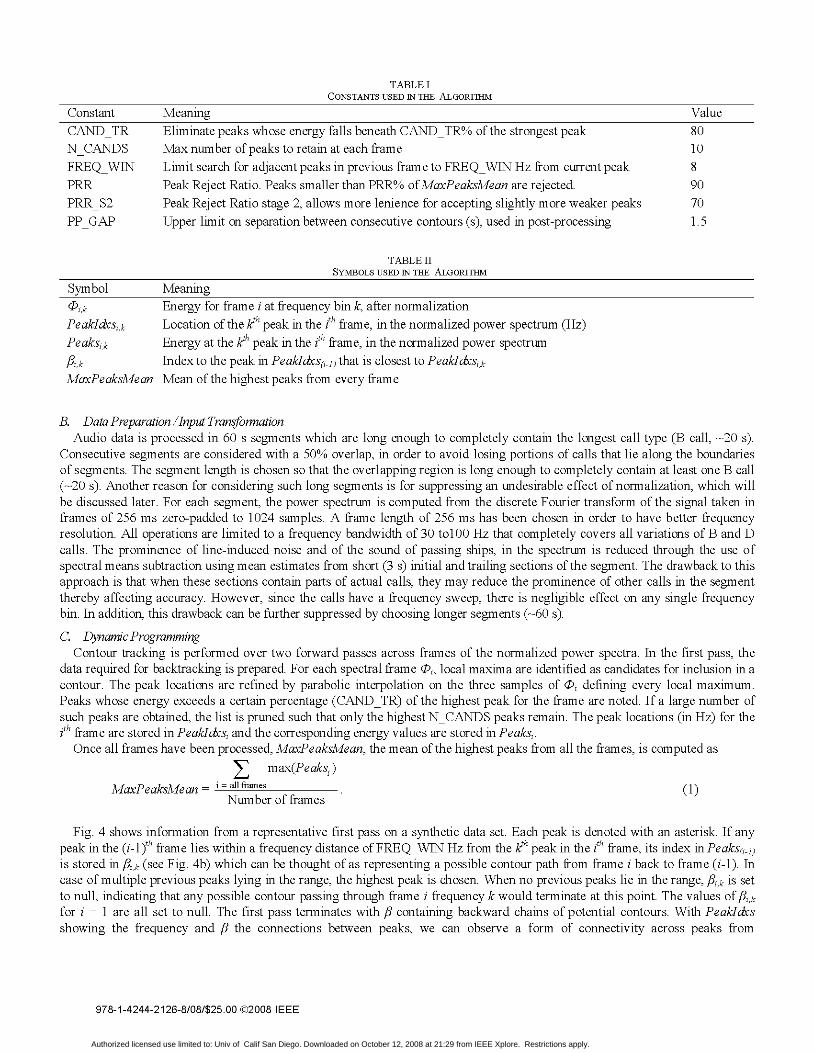
TABLE ICONSTANTS USED IN THE ALGORITHM
MeaningEliminate peaks whose energy falls beneath CAND_TR%o ofthe strongest peakMax number ofpeaks to retain at each frameLimit search for adjacent peaks in previous frame to FREQ_WIN Hz from current peakPeak Reject Ratio. Peaks smaller than PRR%o ofMaxPeaksMean are rejected.Peak Reject Ratio stage 2, allows more lenience for accepting slightly more weaker peaksUpper limit on separation between consecutive contours (s), used in post-processing
Symbol(PiP,k
PeakIdxsi,kPeaksi,k
MaxPeaksMean
TABLE II
SYMBOLS USED IN THE ALGORITHM
MeaningEnergy for frame i at frequency bin k, after normalizationLocation of the kth peak in the ith frame, in the normalized power spectrum (Hz)Energy at the kth peak in the ith frame, in the normalized power spectrum
Index to the peak in PeakIdxs(, l) that is closest to PeakIdxsi,kMean of the highest peaks from every frame
B. Data Preparation Input TransformationAudio data is processed in 60 s segments which are long enough to completely contain the longest call type (B call, -20 s).
Consecutive segments are considered with a 500O overlap, in order to avoid losing portions of calls that lie along the boundariesof segments. The segment length is chosen so that the overlapping region is long enough to completely contain at least one B call( 20 s). Another reason for considering such long segments is for suppressing an undesirable effect of normalization, which willbe discussed later. For each segment, the power spectrum is computed from the discrete Fourier transform of the signal taken inframes of 256 ms zero-padded to 1024 samples. A frame length of 256 ms has been chosen in order to have better frequencyresolution. All operations are limited to a frequency bandwidth of 30 tot 00 Hz that completely covers all variations of B and Dcalls. The prominence of line-induced noise and of the sound of passing ships, in the spectrum is reduced through the use ofspectral means subtraction using mean estimates from short (3 s) initial and trailing sections of the segment. The drawback to thisapproach is that when these sections contain parts of actual calls, they may reduce the prominence of other calls in the segmentthereby affecting accuracy. However, since the calls have a frequency sweep, there is negligible effect on any single frequencybin. In addition, this drawback can be further suppressed by choosing longer segments ( 60 s).
C. Dynamic ProgrammingContour tracking is performed over two forward passes across frames of the normalized power spectra. In the first pass, the
data required for backtracking is prepared. For each spectral frame Oi, local maxima are identified as candidates for inclusion in a
contour. The peak locations are refined by parabolic interpolation on the three samples of Oi defining every local maximum.Peaks whose energy exceeds a certain percentage (CAND TR) of the highest peak for the frame are noted. If a large number ofsuch peaks are obtained, the list is pruned such that only the highest N CANDS peaks remain. The peak locations (in Hz) for theith frame are stored in PeakIdxsi and the corresponding energy values are stored in Peaksi.Once all frames have been processed, MaxPeaksMean, the mean of the highest peaks from all the frames, is computed as
E max(Peaksi)MaxPeaksMean= i= all frames (1)
Number of frames
Fig. 4 shows information from a representative first pass on a synthetic data set. Each peak is denoted with an asterisk. If anypeak in the (i-l )th frame lies within a frequency distance ofFREQ_WIN Hz from the kth peak in the ith frame, its index in Peaks(il)is stored in /ik (see Fig. 4b) which can be thought of as representing a possible contour path from frame i back to frame (i-1). Incase of multiple previous peaks lying in the range, the highest peak is chosen. When no previous peaks lie in the range, /ik iS setto null, indicating that any possible contour passing through frame i frequency k would terminate at this point. The values of pinkfor i = 1 are all set to null. The first pass terminates with ,B containing backward chains of potential contours. With PeakIdccsshowing the frequency and, the connections between peaks, we can observe a form of connectivity across peaks from
978-1-4244-2126-8/08/$25.00 ©2008 IEEE
ConstantCAND_TRN_CANDSFREQ_WINPRRPRR S2PP GAP
Value8010890701.5
Authorized licensed use limited to: Univ of Calif San Diego. Downloaded on October 12, 2008 at 21:29 from IEEE Xplore. Restrictions apply.
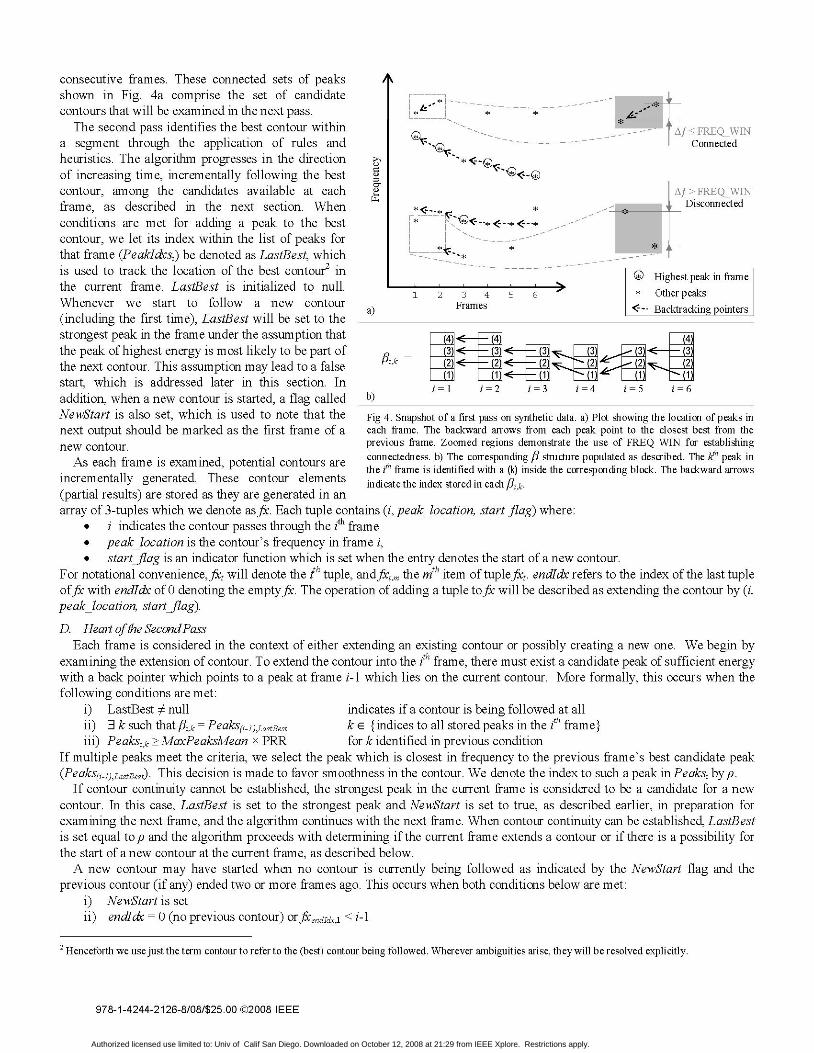
consecutive frames. These connected sets of peaksshown in Fig. 4a comprise the set of candidatecontours that will be examined in the next pass.
The second pass identifies the best contour withina segment through the application of rules andheuristics. The algorithm progresses in the directionof increasing time, incrementally following the bestcontour, among the candidates available at eachframe, as described in the next section. Whenconditions are met for adding a peak to the bestcontour, we let its index within the list of peaks forthat frame (PeakIdxsi) be denoted as LastBest, whichis used to track the location of the best contour2 inthe current frame. LastBest is initialized to null.Whenever we start to follow a new contour(including the first time), LastBest will be set to thestrongest peak in the frame under the assumption thatthe peak of highest energy is most likely to be part ofthe next contour. This assumption may lead to a falsestart, which is addressed later in this section. Inaddition, when a new contour is started, a flag calledNewStart is also set, which is used to note that thenext output should be marked as the first frame of anew contour.As each frame is examined, potential contours are
incrementally generated. These contour elements(partial results) are stored as they are generated in an
'4
0
a)
a),D
a)
b)
,* *
* ! * < *G .1 2 3 4 5 6
Frames
Connected
Af > FREQ WINDisconnected
Highest peak in frame
Other peaksBacktracking pointers
(4)1 < - (4) 4
fik= 3)< - 3 < - (3 _3/- J3 < - (3)
i= I i=2 i=3 i=4 i=5 i=6
Fig 4. Snapshot of a first pass on synthetic data. a) Plot showing the location of peaks ineach frame. The backward arrows from each peak point to the closest best from theprevious frame. Zoomed regions demonstrate the use of FREQ_WIN for establishingconnectedness. b) The corresponding ,B structure populated as described. The kth peak inthe ith frame is identified with a (k) inside the corresponding block. The backward arrowsindicate the index stored in each /i, k.
array of 3-tuples which we denote asfx. Each tuple contains (i, peak location, start flag) where:* i indicates the contour passes through the ith frame* peak location is the contour's frequency in frame i,* startJlag is an indicator function which is set when the entry denotes the start of a new contour.
For notational convenience,fx, will denote the tth tuple, andfrt,m the mth item of tuplefx,. endIdx refers to the index ofthe last tupleoffx with endIdx of 0 denoting the emptyfx. The operation of adding a tuple tofx will be described as extending the contour by (i,peak location, startflag).D. Heart ofthe SecondPass
Each frame is considered in the context of either extending an existing contour or possibly creating a new one. We begin byexamining the extension of contour. To extend the contour into the ith frame, there must exist a candidate peak of sufficient energywith a back pointer which points to a peak at frame i-I which lies on the current contour. More formally, this occurs when thefollowing conditions are met:
i) LastBest # null indicates if a contour is being followed at allii) 3 k such that 1Ai,k =Peaks(i-]),LastBest k E {indices to all stored peaks in the ith frame}iii) Peaksi,k>> MaxPeaksMean x PRR for k identified in previous condition
If multiple peaks meet the criteria, we select the peak which is closest in frequency to the previous frame's best candidate peak(Peaks(i ]),LastBest). This decision is made to favor smoothness in the contour. We denote the index to such a peak in Peaksi by p.
If contour continuity cannot be established, the strongest peak in the current frame is considered to be a candidate for a newcontour. In this case, LastBest is set to the strongest peak and NewStart is set to true, as described earlier, in preparation forexamining the next frame, and the algorithm continues with the next frame. When contour continuity can be established, LastBestis set equal to p and the algorithm proceeds with determining if the current frame extends a contour or if there is a possibility forthe start of a new contour at the current frame, as described below.A new contour may have started when no contour is currently being followed as indicated by the NewStart flag and the
previous contour (if any) ended two or more frames ago. This occurs when both conditions below are met:i) NewStart is setii) endIdx = 0 (no previous contour) orfXendldx,I <i1
2 Henceforth we use just the term contour to refer to the (best) contour being followed. Wherever ambiguities arise, they will be resolved explicitly.
978-1-4244-2126-8/08/$25.00 ©2008 IEEE
Authorized licensed use limited to: Univ of Calif San Diego. Downloaded on October 12, 2008 at 21:29 from IEEE Xplore. Restrictions apply.
If the above conditions are not satisfied, the algorithm skips to examining conditions at the next frame after extending the currentcontour by (i, PeakIdxsi,p, 0) as the peak at Peaksi,p satisfies continuity of an existing contour. Otherwise, it attempts to confirmthe possibility a new start. IffXend1dx,2 and PeakIdxsi,p are within FREQ_WIN Hz range of each other and they are both separatedby only one or two frames, then it may not be a true new start but one longer contour with small segmentation which can berealized by joining the two ends. In such a case, we will not treat this as a new start. These segmentation gaps may have beencaused by an absence of peaks at those locations in the intermediate frames, due to the presence of too many higher peaks at otherlocations or due to the strategy of selecting closer peaks over stronger ones employed at an earlier frame. Joining the two endsinvolves extending the contour by (i- I, intermediate-peak-location, 0) followed by(i, PeakIdxsi,p, 0). The intermediate peak location is obtained utilizing the back pointers stored in ,B and PeakIdxs. In case of a twoframe gap, a pair of intermediate peaks (one from each frame) which exhibit minimum average distortion in their locations arepicked. Then the contour is extended by (i-2, intermediate-peak-1, 0), (i-1, intermediate-peak-2, 0) followed by (i, PeakIdxsi,p, 0)and the algorithm continues with examining conditions at the next frame after resetting NewStart.
If the conditions for a possible new start were met, the algorithm checks if the last recorded contour was a false start or if awrong branch was followed at an earlier choice point (if any) in the contour. Determining and rectifying these two types of errorsare described below. If any of the checks return true, appropriate steps are taken to rectify the corresponding error, and then thecontour is extended by (i, PeakIdxsip, 0). Otherwise, the contour is extended by (i, PeakIdxsip, 1) and NewStart is reset. Thismarks the end of examining conditions at a single frame in the second pass. Repeating the above process for each framecompletes the second pass with raw estimates of the contours present in the audio segment.A false start at an earlier point can be determined as follows. If the last recorded contour ended at (i_ I )th frame, at this point it is
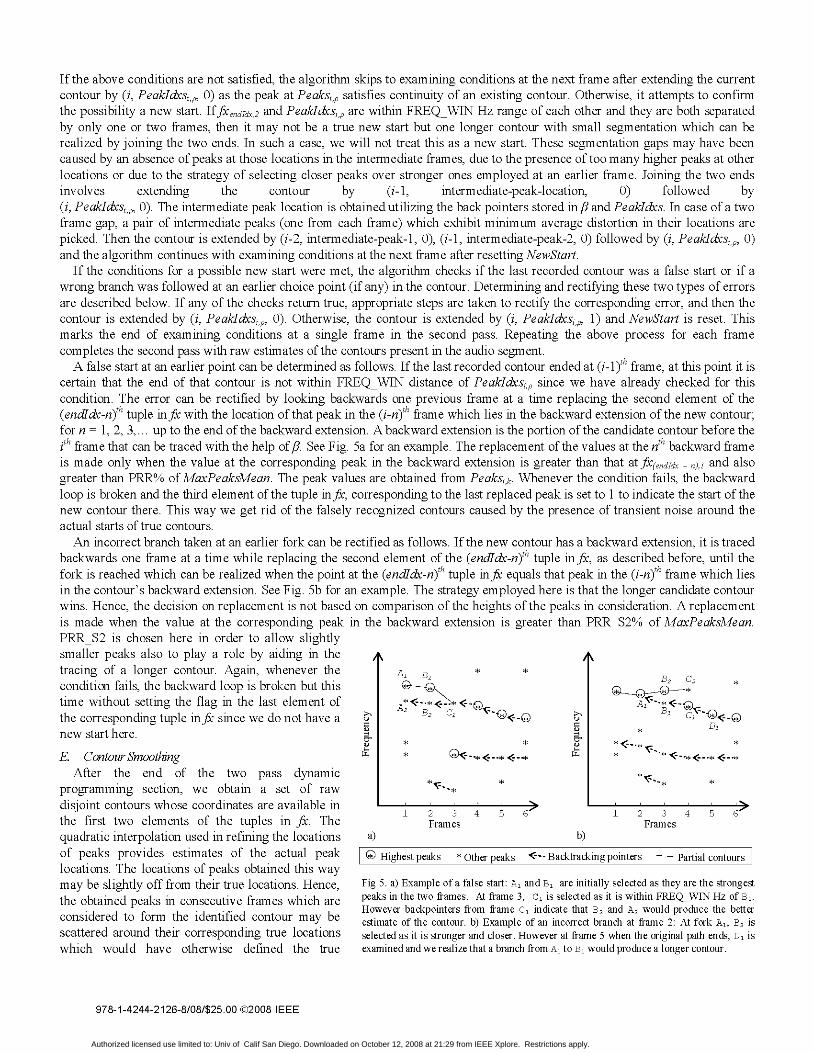
certain that the end of that contour is not within FREQ WIN distance of PeakIdxsi,p since we have already checked for thiscondition. The error can be rectified by looking backwards one previous frame at a time replacing the second element of the(endIdx-n)th tuple infx with the location of that peak in the (i-n)th frame which lies in the backward extension of the new contour;for n = 1, 2, 3,... up to the end of the backward extension. A backward extension is the portion of the candidate contour before theith frame that can be traced with the help of,. See Fig. 5a for an example. The replacement of the values at the nth backward frameis made only when the value at the corresponding peak in the backward extension is greater than that at fX(endldx n),] and alsogreater than PRR%o of MaxPeaksMean. The peak values are obtained from Peaksi,k. Whenever the condition fails, the backwardloop is broken and the third element of the tuple infx, corresponding to the last replaced peak is set to 1 to indicate the start of thenew contour there. This way we get rid of the falsely recognized contours caused by the presence of transient noise around theactual starts of true contours.An incorrect branch taken at an earlier fork can be rectified as follows. If the new contour has a backward extension, it is traced
backwards one frame at a time while replacing the second element of the (endIdx-n)th tuple in fx, as described before, until thefork is reached which can be realized when the point at the (endIdx-n)th tuple infx equals that peak in the (i-n)th frame which liesin the contour's backward extension. See Fig. 5b for an example. The strategy employed here is that the longer candidate contourwins. Hence, the decision on replacement is not based on comparison of the heights of the peaks in consideration. A replacementis made when the value at the corresponding peak in the backward extension is greater than PRR S2% of MaxPeaksMean.PRR S2 is chosen here in order to allow slightlysmaller peaks also to play a role by aiding in thetracing of a longer contour. Again, whenever thecondition fails, the backward loop is broken but thistime without setting the flag in the last element ofthe corresponding tuple infx since we do not have anew start here.
E. Contour SmoothingAfter the end of the two pass dynamic
programming section, we obtain a set of rawdisjoint contours whose coordinates are available inthe first two elements of the tuples in fx. Thequadratic interpolation used in refining the locationsof peaks provides estimates of the actual peaklocations. The locations of peaks obtained this waymay be slightly off from their true locations. Hence,the obtained peaks in consecutive frames which areconsidered to form the identified contour may bescattered around their corresponding true locationswhich would have otherwise defined the true
0
a)
a)
A B 1 * *
B B2--o 0
a)
* @<----e <---e
1 2 3 4 5 6Frames
b)
Q Highest peaks * Other peaks <--- Backtracking pointe
B2 C2 *
AlBDi*
* *
2I~~ ~ ~ ~ o' >
2 3 4 5 6'1Frames
rs - Partial contours
Fig 5. a) Example of a false start: A, and Bs are initially selected as they are the strongestpeaks in the two frames. At frame 3, Cr is selected as it is within FREQ_WIN Hz of Bl.However backpointers from frame C, indicate that Bs and A, would produce the betterestimate of the contour. b) Example of an incorrect branch at frame 2: At fork Al, B2 isselected as it is stronger and closer. However at frame 5 when the original path ends, D, isexamined and we realize that a branch from Al to Bs would produce a longer contour.
978-1-4244-2126-8/08/$25.00 ©2008 IEEE
Authorized licensed use limited to: Univ of Calif San Diego. Downloaded on October 12, 2008 at 21:29 from IEEE Xplore. Restrictions apply.
contour. As a result of this scattering, the identified contour is prone to jitter. Smoothing of this contour reduces jitter and helps usrealize a much closer estimate ofthe true contour in the call. Every identified contour's ordinate sequence (available in the secondelement of the tuples infx) is passed through a 3-point moving average filter to obtain jitter-free equivalents.
F Post ProcessingThis is an optional step. If a pair of consecutive contours have a time separation less than PP GAP (i.e., the end of the first
contour and the start of the next contour are less than PP GAP apart) and the corresponding interior ends are within FREQ_WINdistance of each other, then they may be joined together by linear interpolation of the points in the gap in order to realize, as asingle long contour, the complete call with broken sub-contours. This is particularly helpful with the rather long B calls. Typicallythe contours of these calls appear to be segmented for several reasons, as described earlier. The technique, however, hasdrawbacks where it may end up joining together the contours of two different calls. In any case, this step involves the expansionoffx from the middle in order to accommodate the new points. Once the additional peaks are accommodated, the value in thethird element of the tuple in x, corresponding to the start of the second contour considered is set to zero to indicate that it is nownot the start of a contour.
V. RESULTS AND PERFORMANCE
When evaluated on a randomly chosen segment of the recordings, the algorithm has a recall of 90°O, detecting the contours of56 calls out of the 62 known calls in a 60 minute sample. The precision was 76%, with 18 false positives in sections of data withfairly strong channel noise. The algorithm was also observed identifying contours of other tonal call types, including calls fromother species. Some of the false positives were caused in part by the presence of fin whale calls. Since the algorithm is optimizedto function in the [30Hz, 100Hz] bandwidth, the downswept fin whale calls that are produced in the lower boundary of thisbandwidth affect the performance to some extent. The task of rejecting such detections is considered that of a classifier, which isbeyond the scope of this work.
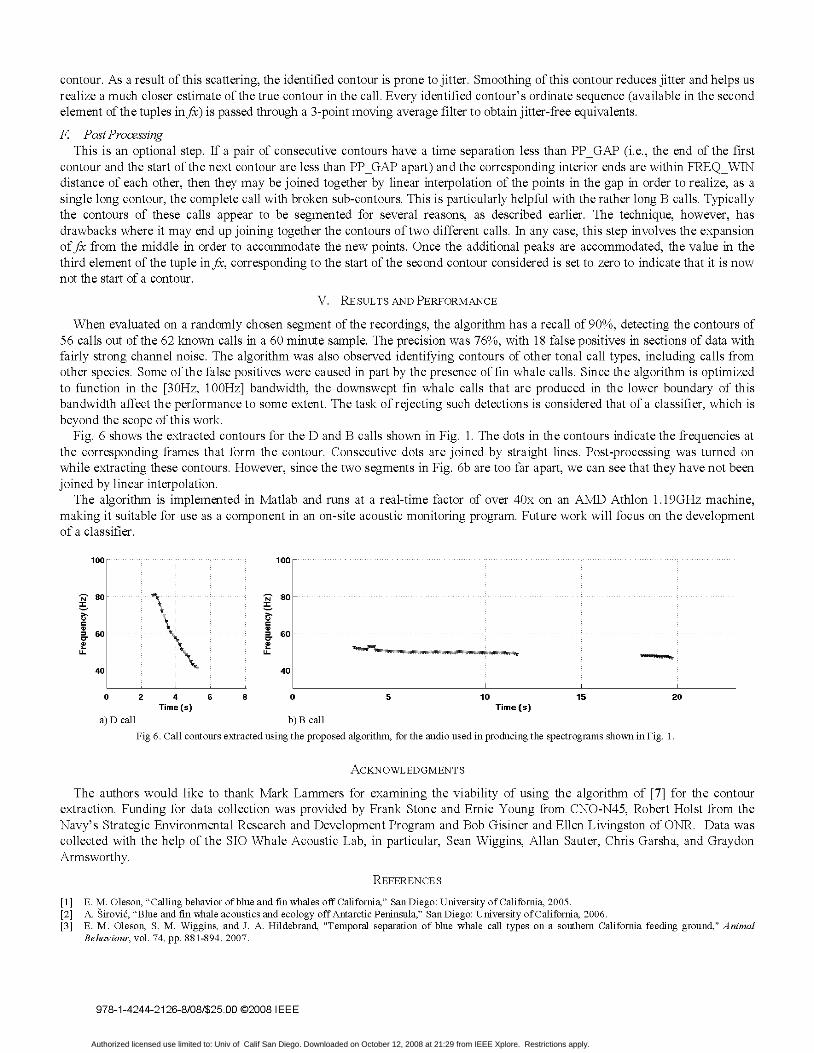
Fig. 6 shows the extracted contours for the D and B calls shown in Fig. 1. The dots in the contours indicate the frequencies atthe corresponding frames that form the contour. Consecutive dots are joined by straight lines. Post-processing was turned onwhile extracting these contours. However, since the two segments in Fig. 6b are too far apart, we can see that they have not beenjoined by linear interpolation.
The algorithm is implemented in Matlab and runs at a real-time factor of over 40x on an AMD Athlon 1.19GHz machine,making it suitable for use as a component in an on-site acoustic monitoring program. Future work will focus on the developmentof a classifier.
100 100
~80 a ~ 80_
=60 I /040 40
0 2 4 6 8 0 5 10 15 20Time (s) Time (s)
a) D call b) B callFig 6. Call contours extracted using the proposed algorithm, for the audio used in producing the spectrograms shown in Fig. 1.
ACKNOWLEDGMENTS
The authors would like to thank Mark Lammers for examining the viability of using the algorithm of [7] for the contourextraction. Funding for data collection was provided by Frank Stone and Ernie Young from CNO-N45, Robert Holst from theNavy's Strategic Environmental Research and Development Program and Bob Gisiner and Ellen Livingston of ONR. Data wascollected with the help of the SIO Whale Acoustic Lab, in particular, Sean Wiggins, Allan Sauter, Chris Garsha, and GraydonArmsworthy.
REFERENCES
[1] E. M. Oleson, "Calling behavior of blue and fin whales off California," San Diego: University of California, 2005.[2] A. sirovi6, "Blue and fin whale acoustics and ecology off Antarctic Peninsula," San Diego: University of California, 2006.[3] E. M. Oleson, S. M. Wiggins, and J. A. Hildebrand, "Temporal separation of blue whale call types on a southern California feeding ground," Animal
Behaviour, vol. 74, pp. 881-894, 2007.
978-1-4244-2126-8/08/$25.00 ©2008 IEEE
Authorized licensed use limited to: Univ of Calif San Diego. Downloaded on October 12, 2008 at 21:29 from IEEE Xplore. Restrictions apply.

[4] D. K. Mellinger and C. W. Clark, "Recognizing transient low-frequency whale sounds by spectrogram correlation," The Journal ofthe Acoustical Society ofAmerica, vol. 107, pp. 3518-3529, 2000.
[5] C. L. Berchok, D. L. Bradley, and T. B. Gabrielson, "St. Lawrence blue whale vocalizations revisited: Characterization of calls detected from 1998 to 2001,"The Journal ofthe Acoustical Society ofAmerica, vol. 120, pp. 2340-2354, 2006.
[6] D. K. Mellinger and C. W. Clark, "Methods for automatic detection of mysticete sounds," Marine and Freshwater Behaviour and Physiology, vol. 29, pp.163-181, 1997.
[7] M. 0. Lammers, W. W. L. Au, and D. L. Herzing, "The broadband social acoustic signaling behavior of spinner and spotted dolphins," The Journal of theAcoustical Society ofAmerica, vol. 114, pp. 1629-1639, 2003.
[8] X. C. Halkias and D. P. W. Ellis, "Call detection and extraction using Bayesian inference," AppliedAcoustics, vol. 67, pp. 1164-1174, 2006.[9] D. Talkin, "A Robust Algorithm for Pitch Tracking (RAPT)," in Speech Coding and Synthesis, W. B. Kleijn and K. K. Paliwal, Eds. Amsterdam, The
Netherlands: Elsevier, 1995, pp. 495-518.[10] S. Wiggins, "Autonomous acoustic recording packages (ARPs) for long-term monitoring of whale sounds," Marine Technology Society Journal, vol. 37, pp.
13-22, 2003.
978-1-4244-2126-8/08/$25.00 ©2008 IEEE
Authorized licensed use limited to: Univ of Calif San Diego. Downloaded on October 12, 2008 at 21:29 from IEEE Xplore. Restrictions apply.
Related Documents