Sensors 2014, 14, 1-x manuscripts; doi:10.3390/s140x0000x sensors ISSN 1424-8220 www.mdpi.com/journal/sensors Article FPGA-Based Smart Sensor for Drought Stress Detection in Tomato Plants Using Novel Physiological Variables and Discrete Wavelet Transform Carlos Duarte-Galvan 1 , Rene de J. Romero-Troncoso 2 , Irineo Torres-Pacheco 1 , Ramon G. Guevara-Gonzalez 1 , Arturo A. Fernandez-Jaramillo 1 , Luis M. Contreras-Medina 1,2 , Roberto V. Carrillo-Serrano 3 and Jesus R. Millan-Almaraz 4, * 1 CA Ingeniería de Biosistemas, División de Investigación y Posgrado, Facultad de Ingeniería, Universidad Autónoma de Querétaro, Cerro de las Campanas s/n, 76010, Querétaro, Qro., México; E-Mails: [email protected] (C.D.-G.); [email protected] (I.T.-P.); [email protected] (R.G.G.-G.); [email protected] (A.A.F.-J.); [email protected] (L.M.C.-M.) 2 HSPdigital-CA Telemática, DICIS, Universidad de Guanajuato, Carr. Salamanca-Valle km 3.5+1.8, Palo Blanco, 36885, Salamanca, Gto, México; E-Mail: [email protected] 3 División de Investigación y Posgrado, Facultad de Ingeniería, Universidad Autónoma de Querétaro, Cerro de las Campanas s/n, 76010, Querétaro, Qro., México; E-Mail: [email protected] 4 Facultad de Ciencias Físico-Matemáticas, Universidad Autónoma de Sinaloa, Av. De las Américas y Blvd. Universitario, Cd. Universitaria, 80000 Culiacán, Sinaloa, México * Author to whom correspondence should be addressed; E-Mail: [email protected]; Tel.: +52-667-716-1154 (ext. 117). Received: 18 June 2014; in revised form: 9 September 2014 / Accepted: 10 September 2014 / Published: Abstract: Soil drought represents one of the most dangerous stresses for plants. It impacts the yield and quality of crops, and if it remains undetected for a long time, the entire crop could be lost. However, for some plants a certain amount of drought stress improves specific characteristics. In such cases, a device capable of detecting and quantifying the impact of drought stress in plants is desirable. This article focuses on testing if the monitoring of physiological process through a gas exchange methodology provides enough information to detect drought stress conditions in plants. The experiment consists of using a set of smart sensors based on Field Programmable Gate Arrays (FPGAs) to monitor a group of plants under controlled drought conditions. The main objective was to use different digital signal processing techniques such as the Discrete Wavelet Transform OPEN ACCESS

Welcome message from author
This document is posted to help you gain knowledge. Please leave a comment to let me know what you think about it! Share it to your friends and learn new things together.
Transcript
Sensors 2014, 14, 1-x manuscripts; doi:10.3390/s140x0000x
sensors ISSN 1424-8220
www.mdpi.com/journal/sensors
Article
FPGA-Based Smart Sensor for Drought Stress Detection in Tomato Plants Using Novel Physiological Variables and Discrete Wavelet Transform
Carlos Duarte-Galvan 1, Rene de J. Romero-Troncoso 2, Irineo Torres-Pacheco 1,
Ramon G. Guevara-Gonzalez 1, Arturo A. Fernandez-Jaramillo 1, Luis M. Contreras-Medina 1,2,
Roberto V. Carrillo-Serrano 3 and Jesus R. Millan-Almaraz 4,*
1 CA Ingeniería de Biosistemas, División de Investigación y Posgrado, Facultad de Ingeniería,
Universidad Autónoma de Querétaro, Cerro de las Campanas s/n, 76010, Querétaro, Qro., México;
E-Mails: [email protected] (C.D.-G.); [email protected] (I.T.-P.);
[email protected] (R.G.G.-G.); [email protected] (A.A.F.-J.);
[email protected] (L.M.C.-M.) 2 HSPdigital-CA Telemática, DICIS, Universidad de Guanajuato, Carr. Salamanca-Valle km 3.5+1.8,
Palo Blanco, 36885, Salamanca, Gto, México; E-Mail: [email protected] 3 División de Investigación y Posgrado, Facultad de Ingeniería, Universidad Autónoma de Querétaro,
Cerro de las Campanas s/n, 76010, Querétaro, Qro., México; E-Mail: [email protected] 4 Facultad de Ciencias Físico-Matemáticas, Universidad Autónoma de Sinaloa, Av. De las Américas
y Blvd. Universitario, Cd. Universitaria, 80000 Culiacán, Sinaloa, México
* Author to whom correspondence should be addressed; E-Mail: [email protected];
Tel.: +52-667-716-1154 (ext. 117).
Received: 18 June 2014; in revised form: 9 September 2014 / Accepted: 10 September 2014 /
Published:
Abstract: Soil drought represents one of the most dangerous stresses for plants. It impacts
the yield and quality of crops, and if it remains undetected for a long time, the entire crop
could be lost. However, for some plants a certain amount of drought stress improves
specific characteristics. In such cases, a device capable of detecting and quantifying the
impact of drought stress in plants is desirable. This article focuses on testing if the
monitoring of physiological process through a gas exchange methodology provides enough
information to detect drought stress conditions in plants. The experiment consists of using
a set of smart sensors based on Field Programmable Gate Arrays (FPGAs) to monitor a
group of plants under controlled drought conditions. The main objective was to use
different digital signal processing techniques such as the Discrete Wavelet Transform
OPEN ACCESS
CADUGA
Resaltado
Sensors 2014, 14 2
(DWT) to explore the response of plant physiological processes to drought. Also, an
index-based methodology was utilized to compensate the spatial variation inside the
greenhouse. As a result, differences between treatments were determined to be independent
of climate variations inside the greenhouse. Finally, after using the DWT as digital filter,
results demonstrated that the proposed system is capable to reject high frequency noise and
to detect drought conditions.
Keywords: drought detection; smart sensor; transpiration dynamic; photosynthesis
measurement; plant water stress monitoring
1. Introduction
Plant stress is any factor that promotes unfavorable growing conditions on plants. Soil drought is an
environmental stress that affects crop productivity more than any other factor. Current monitoring
devices for precision agriculture usually take into account climatic variables. However, it is desirable
to have tools that provide information about plant health in order to explore responses under
unfavorable conditions.
The main responses of plants under drought are photosynthetic dysfunction and overproduction of
Reactive Oxygen Species (ROS) that are highly reactive and deteriorate the normal plant metabolism
through oxidative damage of plant macromolecules [1]. These effects are cumulative; depend on the
crop growth stage and the severity and frequency of the drought event. Fortunately, plants have several
resistance mechanisms to survive under drought conditions; these range going from morphological to
biochemical adaptations at subcellular, cellular, and organ level [2]. The disadvantage of such survival
strategies is that they rely on limited plant development and low yield. However, the study of those
mechanisms allows the development of strategies to increase drought tolerance without losing
productivity, for example: crop varieties associated with high yield can be targeted in breeding
programs to induce drought tolerance. Biotechnology research has made it possible to identify and
change drought-responsive genes inducing some desired qualitative and quantitative traits. Finally, the
exogenous application of plant growth regulators (PGR) have proven to enhance drought tolerance in
plants [3]. Concluding, the impact of drought on agricultural practices and the requirements to
maintain a constant improvement of drought resistant varieties makes the development of
technological tools to detect and monitor drought in plants imperative.
Different methodologies have been proposed for early detection of drought stress in plants. The
predominant tendency is to use thermography and hyperspectral vision [4]. Other methods use
impendence, thermal or gas exchange principles. The thermography utilizes infrared thermometer
sensors or thermal cameras to measure the canopy temperature (Tc) and to define crop water stress
indexes [5,6]. However, Tc measurement presents low resolution and it is susceptible to meteorological
conditions and foliage geometric structure such as leaf angles [7]. On the other hand, hyperspectral
analysis consists of monitoring changes in the chlorophyll fluorescence or in photochemical
reflectance. The problem with chlorophyll fluorescence analysis is that it requires a dark chamber to
isolate a plant sample [8,9]. In this manner, the chlorophyll fluorescence response may occur as
Sensors 2014, 14 3
variations in magnitude or phase [4,10]. Monitoring reflectance has been applied to study entire crops;
several wavelengths have been explored to find better responses and relations with current state of the
crops. 705–750 nm was determined to be a suitable wavelength range to be used to explore plant
response to water stress [11]. The aforementioned results have been supported by many researchers
who have proposed different indexes to detect and even measure the effects of drought [12,13].
Though, the performance of hyperspectral imaging is critically affected by ambient illumination
changes [11], it requires successive monitoring of plants [14], the image acquisition is complicated
where drones or satellites are required [15,16].
Limitations to identify small variations in water stress could be solved using plant-based sensors. In
this manner a simple sensor mounted on the leaf could measure variations in the temperature gradient
according to the water content of the plant [17]. Electrical impedance spectroscopy is robust to
environmental noise and has higher sensitivity than hyperspectral imaging; it has been proven to detect
water stress, even environmental changes and nutrient deficit. However, additional studies are
necessary to understand the environmental effects on plant impedance [18,19].
Gas exchange systems constitute the basis of most photosynthesis measurement tools. This consists
of using Infrared Gas Analyzer (IRGA)-based carbon dioxide (CO2) sensors to measure the difference
between ambient CO2 concentration and the concentration in a transparent chamber where a plant leaf
is isolated [20]. These tools also estimate important phenomena such as transpiration and stomatal
conductance [21,22]. Despite the fact that CO2 exchange method is more sensitive than fluorescence
techniques to environmental changes; a higher amount of information related to plant physiology can
be obtained [23].
The objective of this article is the development of a novel smart sensor that performs a new signal
processing methodology to minimize the noise in a photosynthesis measurement system which is
based on CO2 exchange method. Furthermore, the proposed system is utilized to detect and monitor the
effects of soil drought in tomato plants. The signal processing methodology combines average
decimation and Kalman filters to improve signal quality, and an additional filtering stage based on
Discrete Wavelet Transform (DWT) to explore plants signal response. Therefore, short and long-term
novel indexes were proposed to provide a set of information regarding the response of plants
to drought.
The smart sensor was implemented in a FPGA due to its parallel computation capabilities and
flexible configurability. It made possible to implement the aforementioned algorithms to calculate
in-situ and in real-time the physiological processes of plants for decision making, data storing and
off-line processing purposes. In order to validate the drought detection capabilities of the developed
smart sensor, an experimental setup was carried out using tomato plants in a greenhouse. Because of
this, three smart sensors controlled by a coordinator were installed to monitor specific groups of plants
subjected to induced drought conditions. Finally, interesting relations between drought and plant
physiological responses were obtained.
Sensors 2014, 14 4
2. Background
2.1. Plant Transpiration, Photosynthesis Dynamics and Drought
Photosynthesis and transpiration are two of main physiological processes in plants. Photosynthesis
is a process performed by plants and other organisms to convert light into chemical energy that can
later be released to fuel the organism activities. More specifically, light energy drives the synthesis of
carbohydrates from carbon dioxide and water with the generation of oxygen (O2). On the other hand,
transpiration is an important component of temperature regulation because plants can dissipate the heat
input from sunlight through phase exchange of water that escape into the atmosphere. This process
controls the water movement through the plant and the evaporation from aerial parts, especially from
the leaves [24]. Leaf surfaces contain pores called stomata; the aperture of these pores is conducted by
guard cells. Through the stomata, plants exchange moisture with the atmosphere and permit the
diffusion of CO2; transpiration also changes osmotic pressure of cells and enables the flow of mineral
nutrients and water from roots to shoots. Since both processes share the same pathways, carbon
assimilation carries a loss of water to the atmosphere through the stomata. Consequently, effects of
drought over both physiological processes are closely related with parameters that have been
previously stated [25].
Plant responses to soil drought can change according to the severity and frequency of the stress and
the effects over physiological process does not occur immediately and linearly. Therefore, the severity of
the stress and plant responses to drought can be summarized in three phases. Phase 1: Mild water stress.
A reduction in transpiration is caused by a decline of stomatal conductance (gs) is presented [26]. However, the rate of net CO2 assimilation remains constant because stomatal closure inhibits
transpiration more than it decreases intercellular CO2 concentrations. Even during early stages of
drought stress, the plant increases its water-use efficiency. Phase 2: Moderate water stress. Here, a
further decrease of gs is accompanied by large decrease of mesophyll conductance (gm), and a small
but significant decrease in photosynthetic activity appears [27]. Finally, in phase 3: Severe water
stress. Stomatal conductance drops below its threshold value, the photosynthetic capacity is impaired,
and a permanent damage of photosystems suggests that the leaves are enduring oxidative stress,
senescence and remobilization of leaf nutrients [28]. At this point, the effects of drought are
irreversible and are reflected in the net CO2 assimilation of the plant [29].
Plants response is often affected by different stress conditions. Because of this, monitoring of
multiple plant related variables promises to be a more accurate tool to assess the real plant state.
Furthermore, changes on stomatal conductance and transpiration are more specifically related to soil
water content than leaf water content. Consequently, stomata related changes are far more significant
than changes in net photosynthesis; that could be considered for early detection. However, drought
stress eventually provokes irreversible damage in photosystems and plant efficiency which allows
utilizing this variable as a long-term indicator, principally after water recovery.
2.2. Estimation of Plant Physiological Processes
As aforementioned, the basis of the gas exchange method for photosynthesis (Pn) estimation
involves a comparison between CO2 concentration in the atmosphere (Ci) and CO2 concentration in the
Sensors 2014, 14 5
leaf chamber (Co) where the plant sample is isolated. Additionally, it is necessary to estimate the mass
flow rate per leaf area (W) as stated in its equation in Table 1 [30]. Here, P is the atmospheric pressure
in Bar, V is the volumetric air flow in liters per minute (lpm), TaK is air temperature in Kelvin (K) and
A is leaf area in cm2. The 2005.39 constant is an adjusted coefficient to change mass units to mol,
surface to m2 and time from minutes to seconds. In a similar manner, estimation of transpiration (E) is
performed, but in this case by measuring the H2O vapor exchange. Other important processes such as
stomatal conductance, vapor pressure deficit (VPD) and leaf to air temperature difference (LATD) can
be estimated by using equations that have been previously stated by many authors and are summarized
in Table 1 [22,25,31].
Table 1. Equations for the estimation of physiological processes of plants.
Variable Equation Unit of Measurement
Mass flow rate per area
2005.39a
V PW
T K A
mmol/m2/s
Photosynthesis n i oP W C C µmol/ m2/s
Transpiration
1000 18.02 o i
o
e eE W
P e
mg/m2/s
Stomatal conductance 1000s
leaf o ob
o i
Wg
e e P er W
e e P
mmol/m2/s
Vapor pressure deficit s iVPD e e kPa
Leaf to air temperature difference a leafLATD T T °C
3. Smart Sensor
The proposed smart sensor fuses a water vapor and a CO2 gas exchange system into the same
pneumatic line in order to estimate Pn and E. The system also estimates other phenomena such as gs,
VPD, and LATD. Climatic variables such as solar radiation, temperature and relative humidity can also
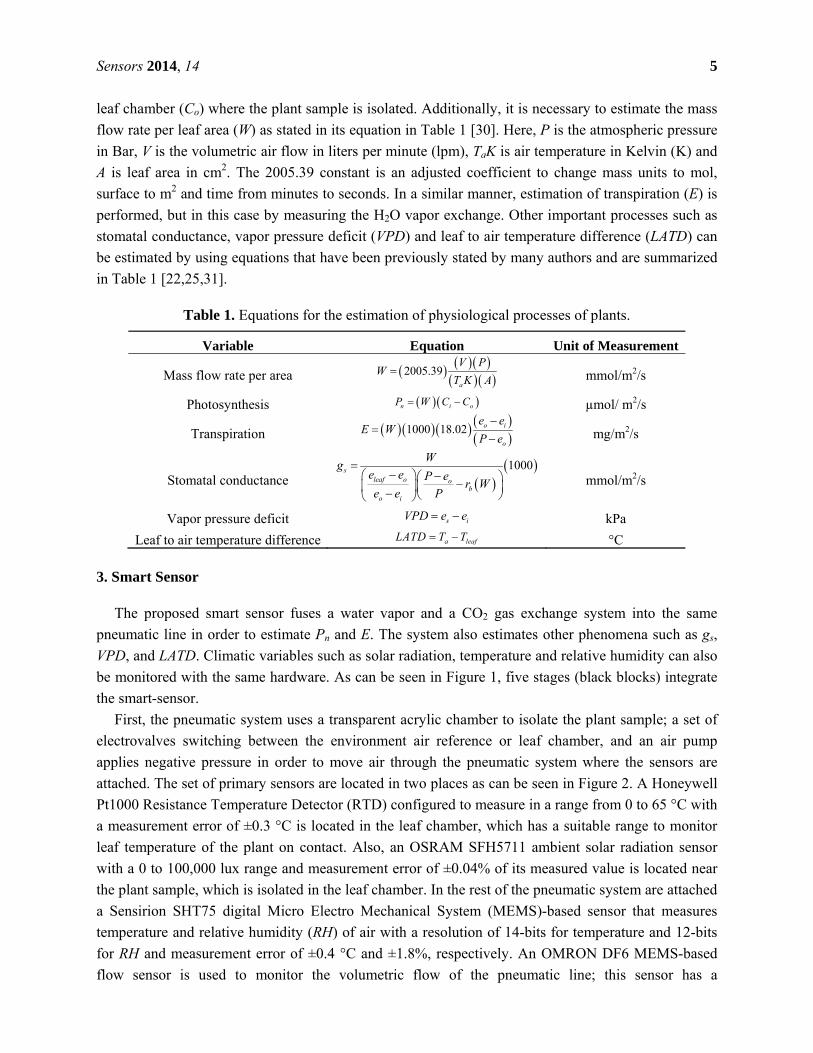
be monitored with the same hardware. As can be seen in Figure 1, five stages (black blocks) integrate
the smart-sensor.
First, the pneumatic system uses a transparent acrylic chamber to isolate the plant sample; a set of
electrovalves switching between the environment air reference or leaf chamber, and an air pump
applies negative pressure in order to move air through the pneumatic system where the sensors are
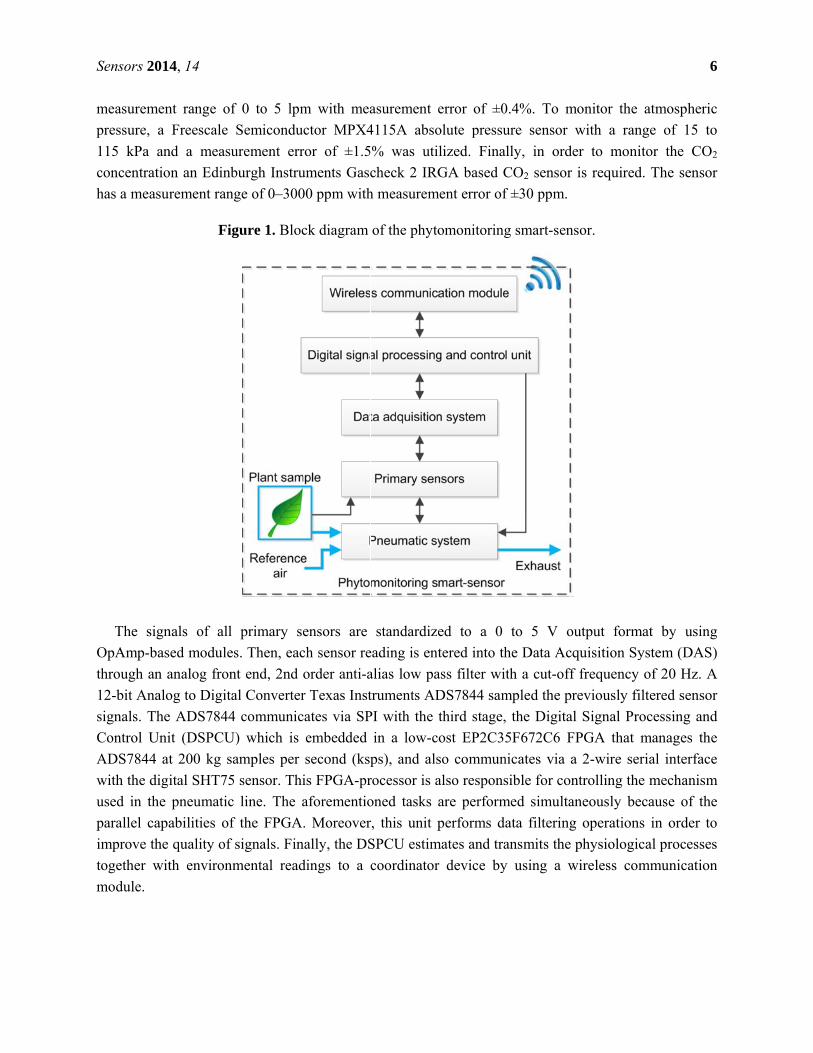
attached. The set of primary sensors are located in two places as can be seen in Figure 2. A Honeywell
Pt1000 Resistance Temperature Detector (RTD) configured to measure in a range from 0 to 65 °C with
a measurement error of ±0.3 °C is located in the leaf chamber, which has a suitable range to monitor
leaf temperature of the plant on contact. Also, an OSRAM SFH5711 ambient solar radiation sensor
with a 0 to 100,000 lux range and measurement error of ±0.04% of its measured value is located near
the plant sample, which is isolated in the leaf chamber. In the rest of the pneumatic system are attached
a Sensirion SHT75 digital Micro Electro Mechanical System (MEMS)-based sensor that measures
temperature and relative humidity (RH) of air with a resolution of 14-bits for temperature and 12-bits
for RH and measurement error of ±0.4 °C and ±1.8%, respectively. An OMRON DF6 MEMS-based
flow sensor is used to monitor the volumetric flow of the pneumatic line; this sensor has a
S
m
p
1
c
h
O
th
1
s
C
A
w
u
p
im
to
m
Sensors 201
measuremen
pressure, a
115 kPa an
concentratio
has a measu
The sign
OpAmp-bas
hrough an a
12-bit Analo
signals. The
Control Uni
ADS7844 at
with the dig
used in the
parallel capa
mprove the
ogether wit
module.
4, 14
nt range of
Freescale
nd a measu
on an Edinb
urement rang
Fig
nals of all
sed modules
analog fron
og to Digita
e ADS7844
it (DSPCU)
t 200 kg sa
ital SHT75
pneumatic
abilities of
quality of s
th environm
f 0 to 5 lpm
Semicondu
urement err
burgh Instru
ge of 0–300
gure 1. Bloc
primary se
s. Then, eac
nt end, 2nd o
al Converter
communic
) which is
amples per
sensor. Thi
line. The a
the FPGA
signals. Fin
mental read
m with mea
ctor MPX4
ror of ±1.5
uments Gasc
00 ppm with
ck diagram
ensors are
ch sensor re
order anti-a
r Texas Inst
cates via SP
embedded
second (ksp
is FPGA-pr
aforementio
. Moreover
nally, the DS
dings to a
asurement
4115A abso
% was uti
check 2 IRG
h measurem
of the phyto
standardiz
eading is ent
alias low pa
truments AD
PI with the
in a low-c
ps), and als
rocessor is a
oned tasks
r, this unit p
SPCU estim
coordinator
error of ±0
olute pressu
ilized. Fina
GA based C
ment error of
omonitoring
ed to a 0
tered into th
ass filter wi
DS7844 sam
third stage,
ost EP2C3
so commun
also respons
are perform
performs d
mates and tra
r device by
0.4%. To m
ure sensor
ally, in ord
CO2 sensor
f ±30 ppm.
g smart-sen
to 5 V o
he Data Ac
th a cut-off
mpled the pr
, the Digita
5F672C6 F
nicates via a
sible for con
med simulta
ata filtering
ansmits the
y using a w
monitor the
with a ran
er to moni
is required
nsor.
output form
quisition Sy
f frequency
reviously fi
al Signal Pro
FPGA that
a 2-wire ser
ntrolling the
aneously be
g operation
physiologic
wireless com
atmospher
nge of 15 t
itor the CO
d. The senso
mat by usin
ystem (DAS
of 20 Hz. A
iltered senso
ocessing an
manages th
rial interfac
e mechanism
ecause of th
s in order t
cal processe
mmunicatio
6
ic
to
O2
or
ng
S)
A
or
nd
he
ce
m
he
to
es
on
S
3
p
a
is
p
r
v
X
e
p
v
E
M
f
th
a
is
im
e
Sensors 201
3.1. Digital
Because
presents sud
are embedde
s illustrated
primary sen
educed in q
versions of
Xosk(k) [32].
As can b
estimator co
proposed sm
variations in
Equation (1)
Meanwhile
from all nod
he time whe
Moreover
and LATD’
s performe
mplemented
estimated:
4, 14
Signal Proc
the experim
dden change
ed inside th
d in Figure
sors pass th
quantization
sensor read
be seen in
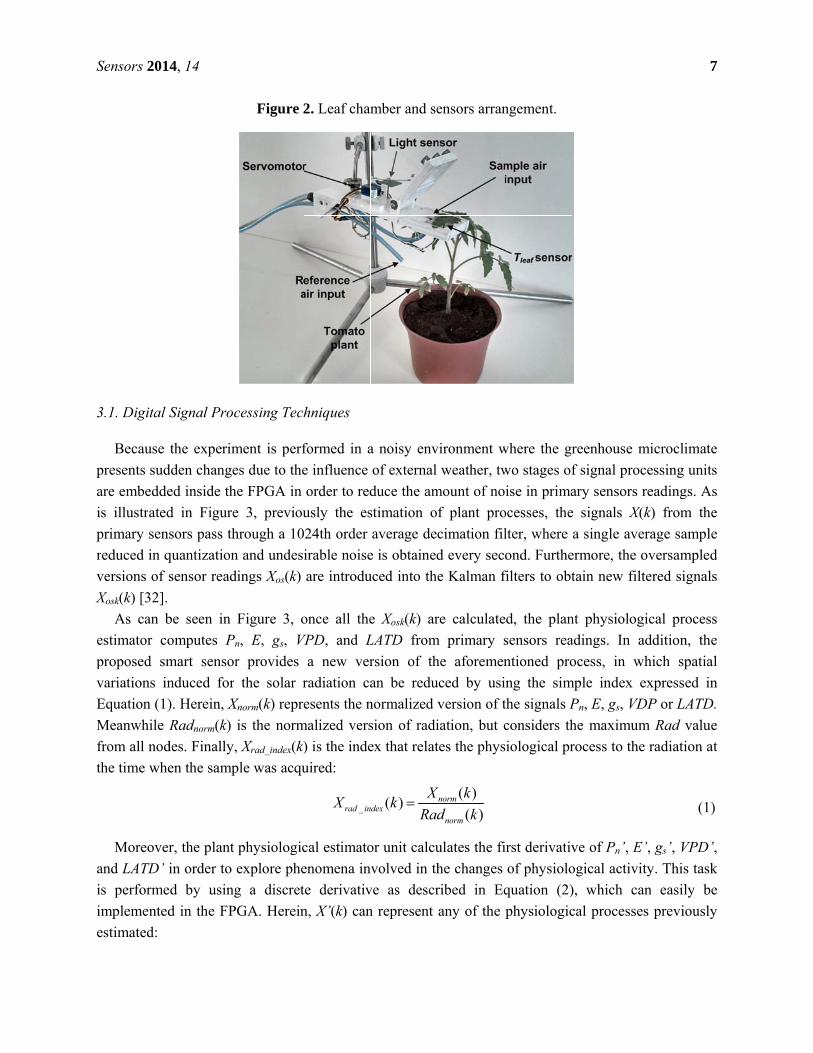
omputes Pn
mart sensor
nduced for
). Herein, X
Radnorm(k)
des. Finally,
en the samp
r, the plant
in order to
ed by using
d in the FP
Figure 2
cessing Tec
ment is perf
es due to the
he FPGA in
e 3, previou
hrough a 10
n and undes
dings Xos(k)
Figure 3, o
n, E, gs, V
r provides
the solar r
Xnorm(k) repr
is the norm
, Xrad_index(k)
ple was acqu
physiologic
explore phe
g a discret
GA. Herein
2. Leaf cham
hniques
formed in a
e influence
order to red
usly the es
024th order
irable noise
are introdu
once all the
VPD, and L
a new ver
radiation ca
esents the n
malized vers
k) is the inde
uired:
_rad inX
cal estimato
enomena in
te derivativ
n, X’(k) can
mber and se
a noisy env
of external
duce the am
stimation o
average dec
e is obtained
uced into the
e Xosk(k) ar
LATD from
rsion of th
an be redu
normalized v
sion of radi
ex that relat
( )ndex
Xk
Rad
or unit calcu
nvolved in th
ve as descr
n represent
ensors arran
vironment w
weather, tw
mount of no
f plant pro
cimation fil
d every seco
e Kalman f
re calculate
m primary s
he aforemen
uced by usi
version of t
iation, but c
tes the phys
( )
( )norm
norm
X k
d k
ulates the fi
he changes
ribed in Eq
any of the
ngement.
where the gr
wo stages of
ise in prima
ocesses, the
lter, where
ond. Furthe
filters to obt
ed, the plan
sensors rea
ntioned pro
ng the sim
the signals P
considers th
siological pr
irst derivativ
of physiolo
quation (2)
physiologic
reenhouse m
f signal pro
ary sensors
e signals X(
a single ave
ermore, the
tain new fil
nt physiolog
adings. In a
ocess, in w
mple index
Pn, E, gs, VD
he maximum
rocess to the
ve of Pn’, E
ogical activi
), which ca
cal processe
microclimat
cessing uni
readings. A
X(k) from th
erage samp
oversample
ltered signa
gical proces
addition, th
which spati
expressed i
DP or LATD
m Rad valu
e radiation
(1
E’, gs’, VPD
ity. This tas
an easily b
es previousl
7
te
its
As
he
le
ed
als
ss
he
al
in
D.
ue
at
1)
D’,
sk
be
ly
S
w
a
s
r
4
4
a
S
g
g
a
r
ir
s
Sensors 201
This unit
was previou
activity. It is
Furtherm
stored and p
esponses at
4. Experime
4.1. Experim
The expe
at an altitude
Sinaloa, Me
ground, equi
genotype to
appropriate
The varia
eference th
rrigation is
sensor node
4, 14
t also comp
usly reporte
s calculated
more, these s
plotted. In a
t different fr
Figure
entation an
mental Setup
eriment illus
e of 54 m, i
exico (24°48
ipped with
omatoes (S
for cultivati
ation factor
hat represen
recurrently
es were used
putes the Re
ed in [22],
d by using E
signals are
addition, the
requencies.
e 3. FPGA f
nd Results
p
strated in Fi
in the Univ
8'0"N, 107°
a commerci
Solanum lyc
ion within g
r in the exp
nts plants ir
y suspended
d to measu
' ( )X k
eal Time-Ca
describes
Equation (3)
RT
transmitted
e PC perfor
filtering stag
igure 4 was
ersidad Aut
°23'0"W). T
ial climate c
copersicum
greenhouse
periment wa
rrigated at f
d one day
re the respo
( )
s
X k X
T
arbon Balan
the accumu
, which is th
0
N
sk
CB T
d to a PC to
rms a DWT
ge and plan
s conducted
tonoma de
The greenho
controller. T
L.) variet
conditions
as the conte
field capac
in order to
onses of pl
( 1)X k
nce (RT-CB
ulation of
he discrete
0
( )nP k
ogether wit
T to Xrad_inde
t physiolog
d during 201
Sinaloa, Sc
ouse was a s
The plants u
ty Raffaello
and it is res
ent of water
ity and (b)
o reach wat
ants to diff
B), by integ
carbon due
time version
th data from
ex(k) signals
ical estimat
13 in a resea
hool of Bio
single span
used for the
o; it is an
sistant to pe
r in the soi
The droug
ter deficit i
ferent irriga
rating Pn, t
e to the ph
n of the inte
m primary s
s in order to
tor unit.
arch greenh
ology, Culia
arch type w
e experimen
n indetermi
ests and dise
il at two lev
ght treatmen
n the soil.
ation levels.
(2
this index, a
hotosynthes
egral:
(3
sensors to b
o explore th
house locate
acan Rosale
with 30 m2 o
nt were singl
inate tomat
eases.
vels: (a) Th
nt where th
Three sma
. In addition
8
2)
as
is
3)
be
he
ed
es,
of
le
to
he
he
art
n,
S
th
c
4
g
c
p
o
to
n
w
th
d
4
m
C
c
g
a
f
Sensors 201
hree tensiom
content of w
F
4.2. Sample
The toma
grown in gr
chambers. T
particles dia
other variati
o the plant
necessary to
were located
he photosyn
drought [33]
4.2. In-Situ N
Due to t
measuremen
CO2 sensors
correspond t
greenhouse
average of c
for this and
4, 14
meters Irrom
water in the s
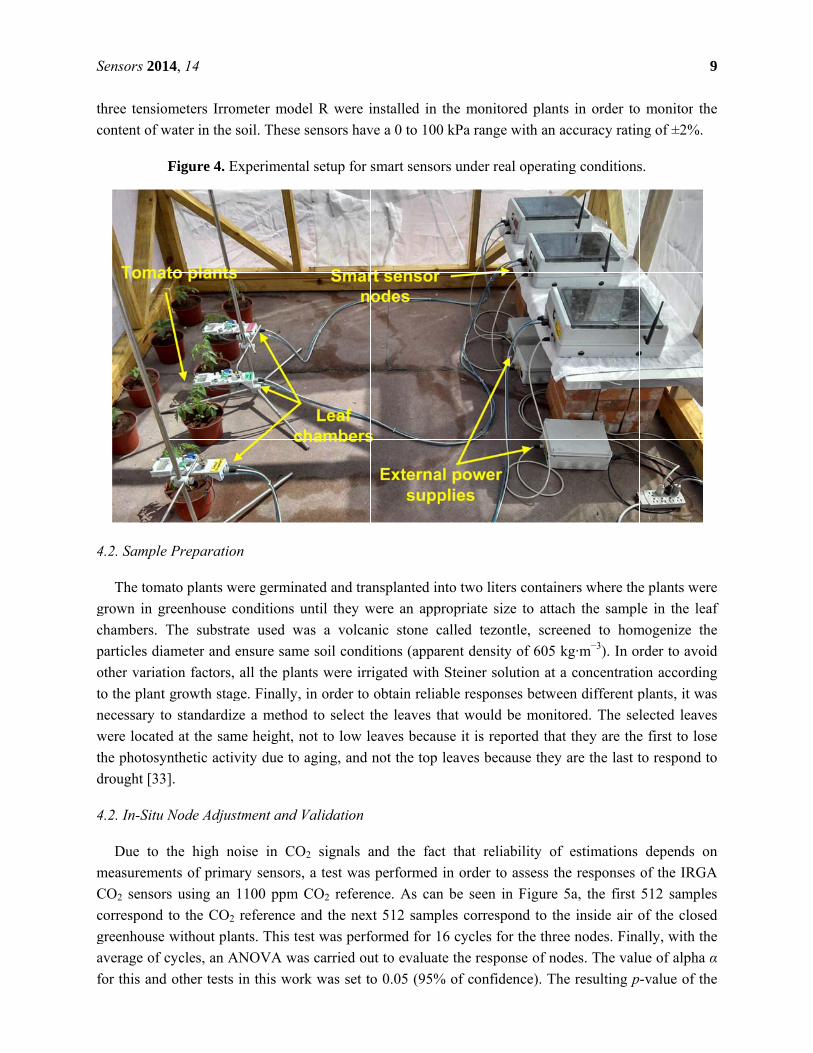
Figure 4. E
Preparatio
ato plants w
reenhouse c
The substra
ameter and e
ion factors,
growth stag
o standardiz
d at the sam
nthetic activ
].
Node Adjus
the high no
nts of prima
s using an
to the CO2
without pla
cycles, an A
other tests
meter mode
soil. These
Experimenta
n
were germina
conditions u
ate used w
ensure same
all the plan
ge. Finally,
ze a method
me height, n
vity due to
stment and V
oise in CO
ary sensors,
1100 ppm
reference a
ants. This te
ANOVA wa
in this wor
el R were i
sensors hav
al setup for
ated and tra
until they w
as a volca
e soil condi
nts were irr
in order to
d to select t
not to low l
aging, and
Validation
O2 signals a
, a test was
CO2 referen
and the nex
est was perf
as carried ou
rk was set to
installed in
ve a 0 to 100
smart senso
ansplanted in
were an app
nic stone c
itions (appa
rigated with
obtain relia
the leaves t
eaves becau
not the top
and the fac
performed
nce. As can
xt 512 samp
formed for 1
ut to evalua
o 0.05 (95%
the monito
0 kPa range
ors under re
nto two lite
propriate siz
called tezon
arent density
h Steiner so
able respon
that would
use it is rep
leaves bec
ct that relia
in order to
n be seen i
ples corresp
16 cycles fo
ate the respo
% of confid
ored plants
e with an ac
al operating
ers container
ze to attach
ntle, screen
y of 605 kg
lution at a c
ses between
be monitor
ported that t
ause they a
ability of e
o assess the
n Figure 5a
pond to the
or the three
onse of node
dence). The
in order to
curacy ratin
g conditions
rs where the
h the sampl
ned to hom
g·m−3). In or
concentratio
n different p
red. The sel
they are the
are the last t
estimations
responses
a, the first
inside air o
nodes. Fina
es. The valu
resulting p
o monitor th
ng of ±2%.
s.
e plants wer
le in the lea
mogenize th
rder to avoi
on accordin
plants, it wa
lected leave
e first to los
to respond t
depends o
of the IRGA
512 sample
of the close
ally, with th
ue of alpha
-value of th
9
he
re
af
he
id
ng
as
es
se
to
on
A
es
ed
he
α
he
S
a
s
s
o
w
4
c
C
b
F
Sensors 201
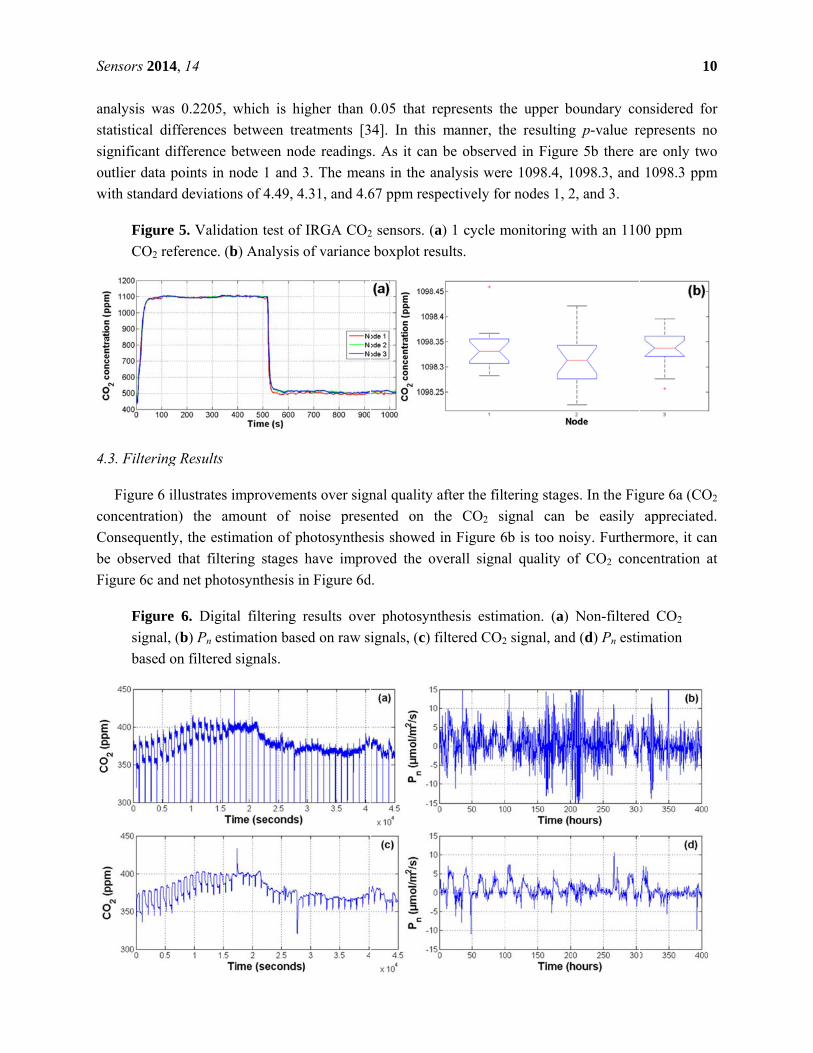
analysis wa
statistical di
significant d
outlier data
with standar
Figure
CO2 re
4.3. Filtering
Figure 6
concentratio
Consequentl
be observed
Figure 6c an
Figure
signal,
based
4, 14
as 0.2205, w
ifferences b
difference b
points in n
rd deviation
e 5. Validat
eference. (b
g Results
illustrates im
on) the am
ly, the estim
d that filter
nd net photo
e 6. Digita
, (b) Pn esti
on filtered
which is hi
between tre
between nod
node 1 and 3
ns of 4.49, 4
tion test of
b) Analysis
mprovemen
mount of n
mation of ph
ing stages
osynthesis in
al filtering r
mation base
signals.
igher than 0
eatments [3
de readings
3. The mea
4.31, and 4.6
IRGA CO2
of variance
nts over sign
noise prese
hotosynthes
have impro
n Figure 6d
results over
ed on raw s
0.05 that re
34]. In this
s. As it can
ans in the an
67 ppm resp
2 sensors. (a
boxplot res
nal quality a
ented on t
sis showed
oved the ov
d.
r photosynt
ignals, (c) f
epresents th
manner, th
be observe
nalysis wer
pectively fo
a) 1 cycle m
sults.
after the filt
the CO2 si
in Figure 6
verall signa
thesis estim
filtered CO2
he upper b
he resulting
ed in Figure
re 1098.4, 1
r nodes 1, 2
monitoring w
tering stage
ignal can
6b is too no
al quality o
mation. (a)
2 signal, and
oundary co
g p-value r
e 5b there a
1098.3, and
2, and 3.
with an 110
es. In the Fig
be easily
oisy. Further
of CO2 con
Non-filtere
d (d) Pn esti
1
onsidered fo
epresents n
are only tw
1098.3 ppm
00 ppm
gure 6a (CO
appreciated
rmore, it ca
ncentration
ed CO2
imation
10
or
no
wo
m
O2
d.
an
at

S
n
p
s
e
c
p
s
s
4
m
s
u
in
e
(
p
Sensors 201
Figure 6
network. In
processes, a
signal was
estimated w
correlation
photosynthe
shows the c
signals.
Table
filterin
4.4. Environ
Because
microclimat
stress treatm
understand t
nside the gr
entire exper
Figure 7c) a
plants. More
Figure
and 3.
humid
4, 14
shows only
n order to
a Pearson c
conducted.
with non-filt
between R
esis with the
orrelation w
2. Correlat
ng.
Varia
CoeffiNodNodNod
nmental Sign
the experim
te produced
ment. Then,
these chang
reenhouse a
riment. This
and RH (Fi
eover, the p
e 7. WSN e
(a) Solar r
dity.
y the result o
quantify ho
correlation
Results pr
tered signal
Rad and th
e subscript
weight whil
tion analysi
ables Pho
cients de 1 0.de 2 0.de 3 0.
nals
ment was c
changes on
, it was ne
ges. Figure
at three diffe
s variable is
gure 7d) of
hotosynthes
environmen
radiation, (b
of 1 node, b
ow the filt
between ra
resented in
s do not co
he Pn estim
osk is the e
le p-values
is results fo
otosynthesis–
R .0672 .2023 .1027
carried out
n physiologi
ecessary to
7 illustrate
erent locatio
s noteworth
f the air insi
sis is more
ntal reading
b) air temp
but similar r
tered signal
aw and filte
Table 2 s
orrespond w
mated with
estimated o
below 0.05
r radiation
–Radiation
p 0.0515
<0.0001 0.0028
in a comm
ical process
monitor th
es the most
ons. Figure
hy because
ide the gree
sensitive to
gs inside the
perature, (c)
results were
ls improved
ered photos
uggest that
with the rad
h filtered
one with filt
5 confirm th
against pho
Photosynt
R 0.51460.53070.6557
mercial gree
ses, even fo
he microclim
important e
7a shows th
it modifies
enhouse and
radiation th
e greenhous
) vapor pres
e obtained fo
d the estim
synthesis si
t the behav
diation patte
signals wa
tered prima
he existence
otosynthesis
thesisosk–Rad
p<0.0<0.0<0.0
enhouse, sp
or plants und
mate relate
environmen
he readings
the temper
d therefore t
han to any o
se at locatio
ssure defici
or the other
mation of p
ignals again
vior of Pn w
ern. In cont
as found.
ary signals.
e of correlat
s with and w
diation
p 0001 0001 0001
patial differ
dergoing the
ed variables
ntal variable
s for radiatio
rature (Figu
the transpira
other factor
ons of Nod
it, and (d) r
1
r nodes of th
physiologic
nst radiatio
when it wa
trast, a bette
In Table 2
The R-valu
tion betwee
without
rences in th
e same wate
s in order t
es monitore
on during th
ure 7b), VPD
ation rates o
.
des 1, 2
relative
11
he
al
on
as
er
2,
ue
en
he
er
to
ed
he
D
of
S
in
b
g
b
e
w
4
s
w
r
d
g
r
li
Sensors 201
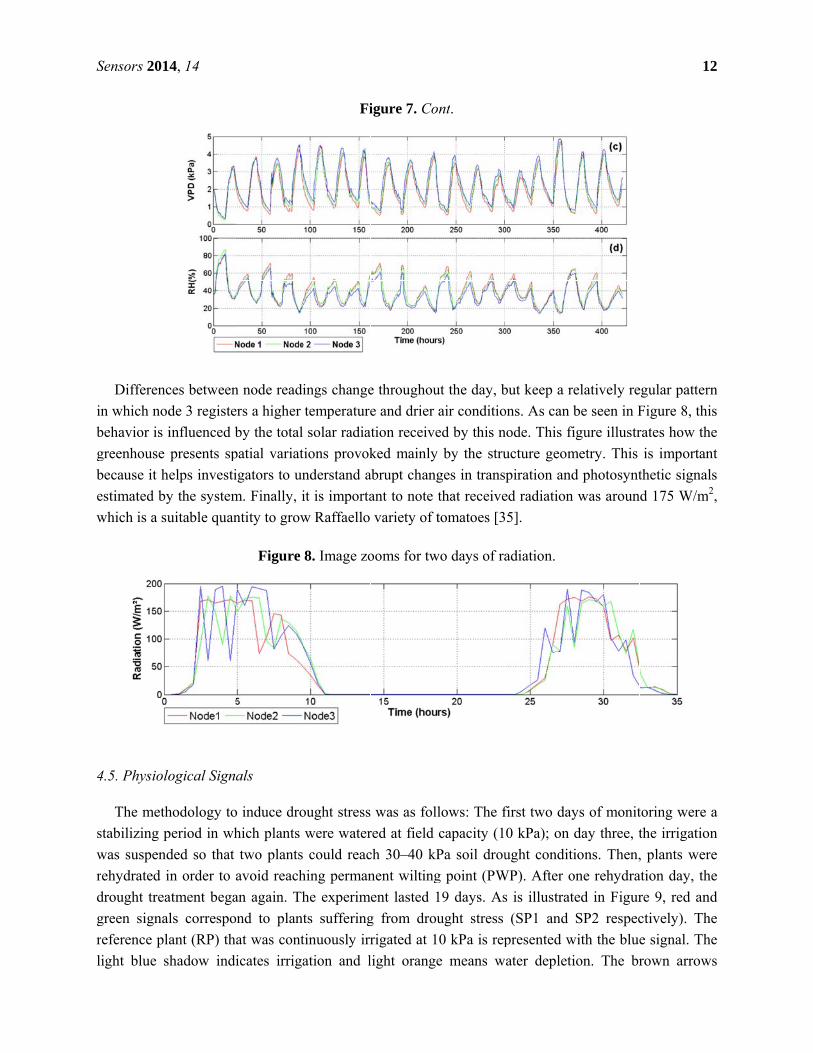
Differenc
n which nod
behavior is i
greenhouse
because it h
estimated by
which is a su
4.5. Physiolo
The meth
stabilizing p
was suspend
ehydrated i
drought trea
green signal
eference pl
ight blue s
4, 14
ces between
de 3 registe
influenced b
presents sp
elps investi
y the system
uitable quan
ogical Signa
hodology to
period in wh
ded so that
in order to a
atment bega
ls correspo
ant (RP) th
hadow indi
n node readi
ers a higher
by the total
patial variat
igators to un
m. Finally, i
ntity to grow
Figure
als
o induce dro
hich plants
two plants
avoid reach
an again. Th
ond to plant
at was cont
icates irriga
Fi
ings change
temperature
solar radia
tions provok
nderstand a
it is importa
w Raffaello
8. Image zo
ought stress
were water
could reac
hing perman
he experim
ts suffering
tinuously irr
ation and l
igure 7. Co
e throughou
e and drier
ation receive
ked mainly
abrupt chang
ant to note t
variety of t
ooms for tw
was as foll
red at field
ch 30–40 kP
nent wilting
ent lasted 1
g from drou
rigated at 1
light orange
ont.
ut the day, b
air conditio
ed by this n
by the stru
ges in trans
that receive
tomatoes [3
wo days of ra
lows: The f
capacity (1
Pa soil drou
g point (PW
19 days. As
ught stress
0 kPa is rep
e means w
but keep a r
ons. As can
node. This fi
ucture geom
piration and
ed radiation
5].
adiation.
first two day
0 kPa); on
ught condit
WP). After o
s is illustrat
(SP1 and
presented w
water depleti
relatively re
be seen in F
figure illustr
metry. This
d photosynt
n was aroun
ys of monit
day three, t
tions. Then,
one rehydra
ted in Figur
SP2 respec
with the blue
ion. The br
1
egular patter
Figure 8, th
rates how th
is importan
thetic signa
nd 175 W/m
toring were
the irrigatio
, plants wer
ation day, th
re 9, red an
ctively). Th
e signal. Th
rown arrow
12
rn
his
he
nt
als
m2,
a
on
re
he
nd
he
he
ws
S
in
b
(P
F
s
a
b
p
th
Sensors 201
ndicate irrig
by the blue a
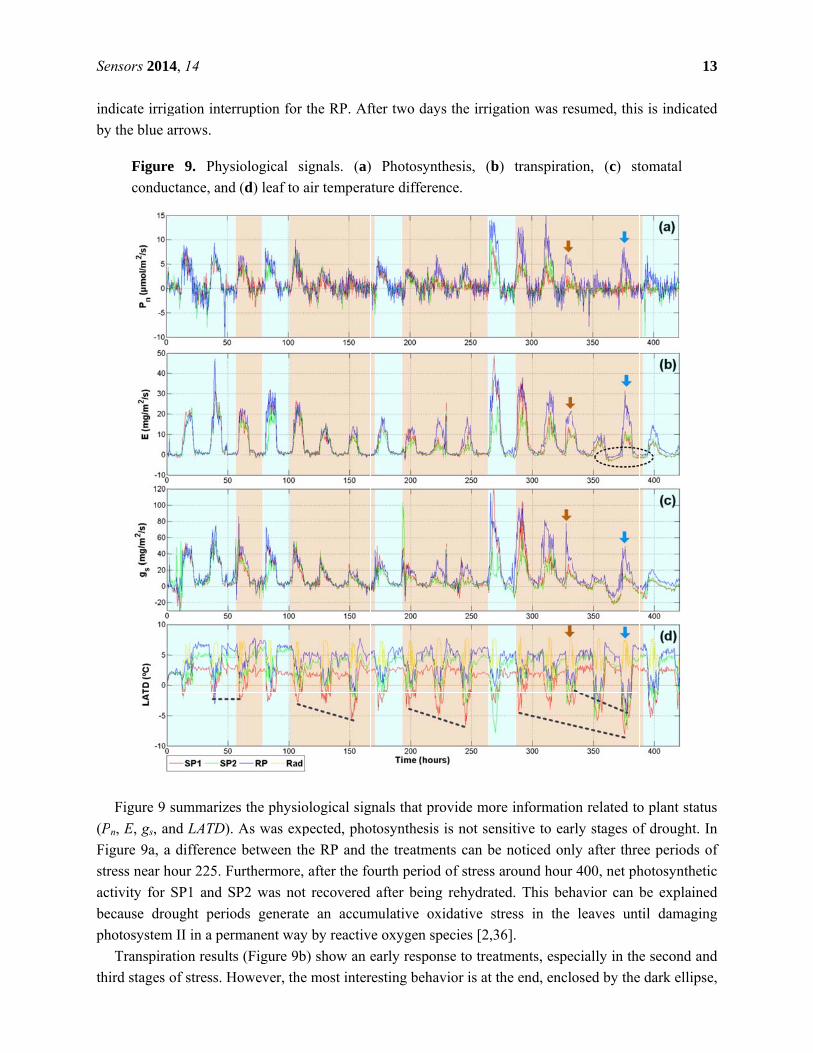
Figure
conduc
Figure 9
Pn, E, gs, an
Figure 9a, a
stress near h
activity for
because dro
photosystem
Transpira
hird stages
4, 14
gation inter
arrows.
e 9. Physi
ctance, and
summarize
nd LATD).
a difference
hour 225. Fu
SP1 and S
ought perio
m II in a perm
ation results
of stress. H
rruption for
iological s
(d) leaf to
s the physio
As was exp
between th
urthermore,
P2 was not
ods generate
manent way
s (Figure 9b
However, the
the RP. Af
signals. (a)
air tempera
ological sig
pected, pho
he RP and t
, after the fo
t recovered
e an accum
y by reactiv
b) show an e
e most inter
fter two day
) Photosynt
ature differe
gnals that pr
otosynthesis
the treatme
ourth period
after being
mulative ox
ve oxygen sp
early respon
resting beha
ys the irriga
thesis, (b)
ence.
rovide more
s is not sens
ents can be
d of stress a
g rehydrate
xidative str
pecies [2,36
nse to treatm
avior is at th
ation was re
transpirati
e informatio
sitive to ear
noticed onl
around hour
d. This beh
ress in the
6].
ments, espe
he end, enclo
esumed, this
ion, (c) st
on related to
rly stages o
ly after thre
400, net ph
havior can b
leaves unt
ecially in the
osed by the
1
s is indicate
tomatal
o plant statu
f drought. I
ee periods o
hotosynthet
be explaine
til damagin
e second an
e dark ellips
13
ed
us
In
of
ic
ed
ng
nd
e,
Sensors 2014, 14 14
a low amplitude negative transpiration rate indicates that leaves are taking water vapor from the
atmosphere instead of expelling it. This is a defense mechanism observed in plants under severe
drought [37]. The stomatal conductance (Figure 9c) presents more marked differences as compared
with Pn. Even in the first day of drought, SP1 and SP2 present a sudden drop in gs. This is explained
because the stomata closure and the decrease of gs are the first defenses plants employ in order to
reduce the amount of water lose through the stomata and it is related more to soil drought than leaf
water status [2]. The higher decrease in the third stage of drought could be related to a decrease of gm
because the leaves are preparing for severe stress conditions.
The final graph (Figure 9d) illustrates the difference between air temperature and leaf temperature.
Herein, a yellow line illustrates the day where the LADT must be zero or slightly positive. This is a
normal behavior because in well-watered plants the Tleaf is cooler than Ta. However, if plants are under
drought conditions, the Tleaf is higher than Ta. This tendency is clearly noticed in Figure 9d, where once
the water depletion begins an increase in negative readings appears. This tendency is illustrated with
the dashed black lines. Nevertheless, despite being under the same conditions, SP2 always presented a
better tolerance to the stress than SP1. This can be noted because the red line presents more negative
and sudden changes in LATD. On the other hand, the reference plant showed stable behavior with zero
or positive values until the irrigation was suspended at hour 330. After this point, the drought was
maintained for two days and a clear drop of blue line appears. After the rehydration day during hour
375, the LATD of RP slowly returns to zero and positive values.
Finally, it is important to mention that a significant reduction in height and the leaf areas of plants
under drought was expressed. At the end of the experiment, plants under drought conditions
maintained heights of approximately 80% of non-stressed plants.
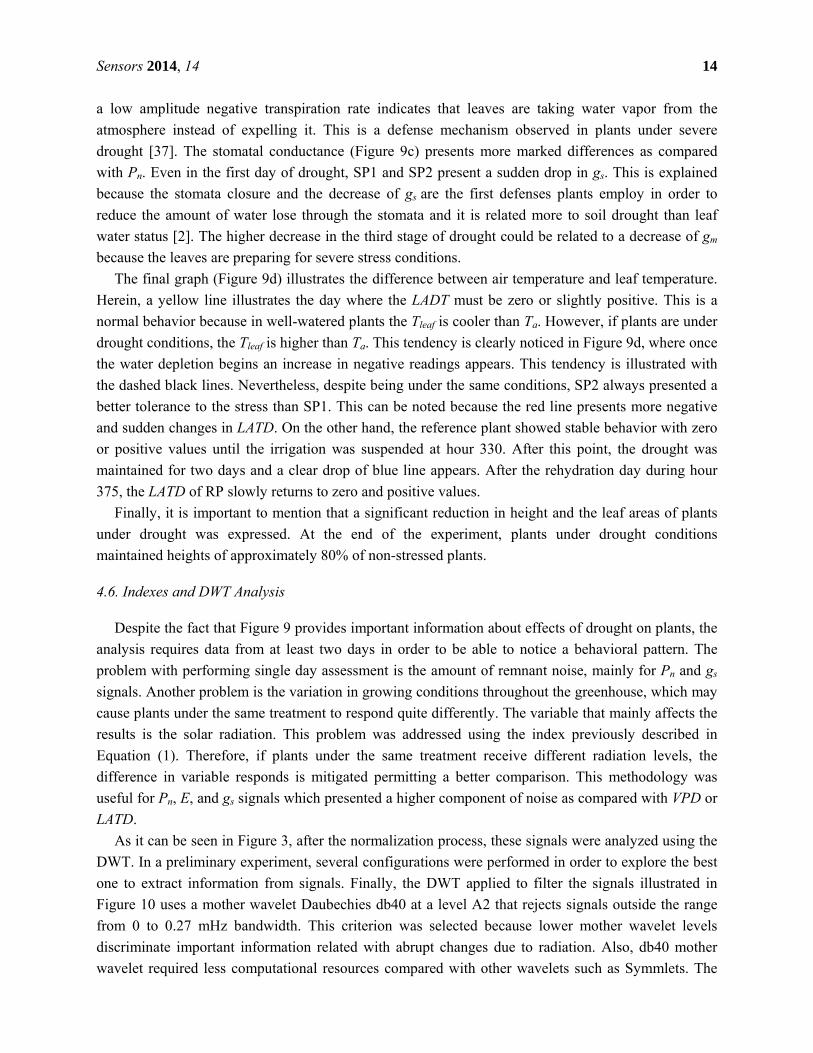
4.6. Indexes and DWT Analysis
Despite the fact that Figure 9 provides important information about effects of drought on plants, the
analysis requires data from at least two days in order to be able to notice a behavioral pattern. The
problem with performing single day assessment is the amount of remnant noise, mainly for Pn and gs
signals. Another problem is the variation in growing conditions throughout the greenhouse, which may
cause plants under the same treatment to respond quite differently. The variable that mainly affects the
results is the solar radiation. This problem was addressed using the index previously described in
Equation (1). Therefore, if plants under the same treatment receive different radiation levels, the
difference in variable responds is mitigated permitting a better comparison. This methodology was
useful for Pn, E, and gs signals which presented a higher component of noise as compared with VPD or
LATD.
As it can be seen in Figure 3, after the normalization process, these signals were analyzed using the
DWT. In a preliminary experiment, several configurations were performed in order to explore the best
one to extract information from signals. Finally, the DWT applied to filter the signals illustrated in
Figure 10 uses a mother wavelet Daubechies db40 at a level A2 that rejects signals outside the range
from 0 to 0.27 mHz bandwidth. This criterion was selected because lower mother wavelet levels
discriminate important information related with abrupt changes due to radiation. Also, db40 mother
wavelet required less computational resources compared with other wavelets such as Symmlets. The
S
h
c
c
F
n
H
r
c
w
th
p
w
c
p
Sensors 201
high frequen
could be a
correspondin
Figure 9a, w
noise, this
However, af
educed allo
Figure
and (c
Furtherm
considering
with Pn befo
hat DWT
photosynthe
when Pn is f
correlation i
p-values sug
4, 14
ncy analysis
consequen
ng to Figure
where after
could be p
fter the use
owing a com
e 10. Wave
) stomatal c
more, in ord
that Pn is h
ore the DWT
rejects the
esis itself. A
filtered with
is not too h
ggest that nu
s of D level
ce of the s
e 10a presen
several sta
probably an
of DWT an
mparison alo
elet of proc
conductance
der to avoid
highly relat
T processin
noise on
As it can be
h the DWT.
high. Table
ull hypothes
ls is not rep
system slow
nts a consid
ages of filte
n aliasing o
nalysis such
ong one sing
esses/Radia
e.
d the remo
ted with Ra
ng. The corr
photosynth
e appreciate
. Only node
3 presents
sis is rejecte
ported becau
w sampling
derable redu
ering, the P
of a freque
h as an extr
gle day.
ation indexe
oval of info
ad, a Pearso
elation resu
hesis signal
ed, the corre
e 3 did not r
the results
ed.
use no clear
g frequency
uction in the
Pn signal m
ency gener
ra filtering s
es. (a) Phot
ormation re
on correlatio
ults are pres
l but it ke
elation betw
repeat this t
of the hyp
r patterns w
y. The new
e high frequ
maintains a
rated for th
stage, this c
tosynthesis,
lated with
on was con
ented in Tab
eeps the in
ween Pn and
trend. Howe
pothesis test
were found; t
w version o
uency noise
considerabl
he IRGA S
component
, (b) transpi
the plant r
nducted to c
able 3 to sup
nformation
d Rad sligh
ever, the de
t of no corr
1
this behavio
of Pn signa
compared t
le amount o
Sensor itsel
of noise wa
iration,
response an
compare Ra
pport the ide
related wit
htly increase
ecrease in th
relation. Th
15
or
als
to
of
lf.
as
nd
ad
ea
th
es
he
he
S
p
p
d
r
p
it
c
th
n
3
a
e
e
te
b
w
w
Sensors 201
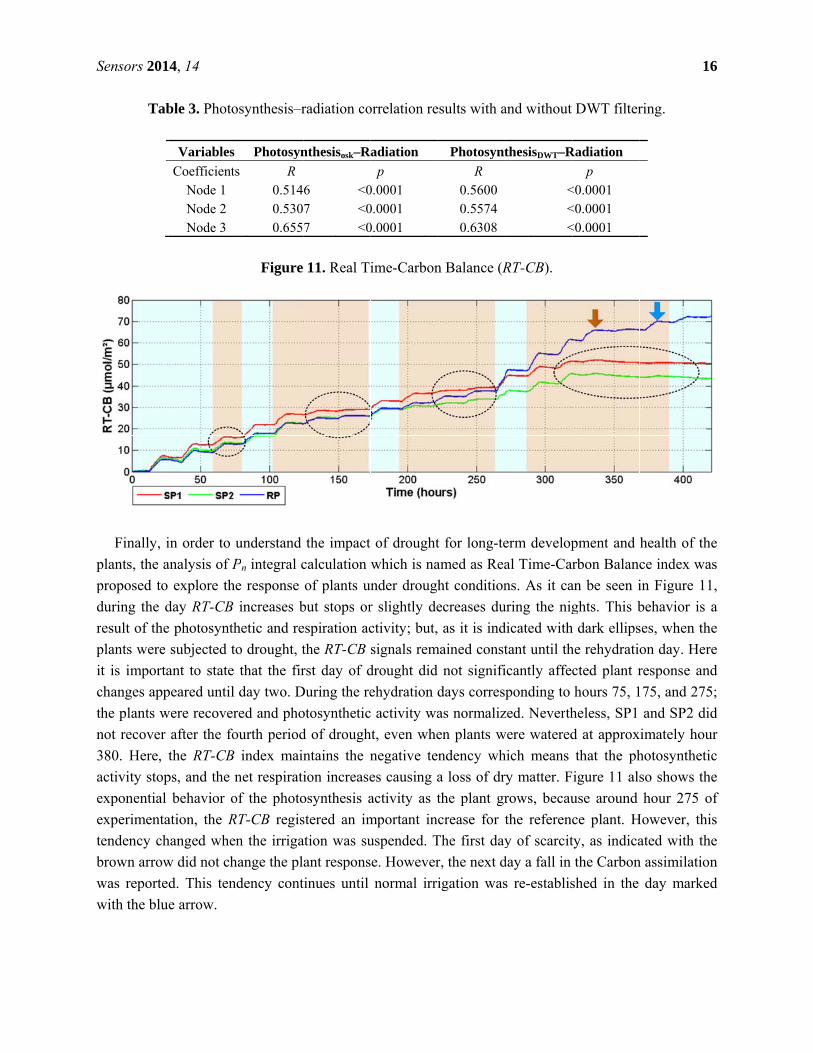
Tab
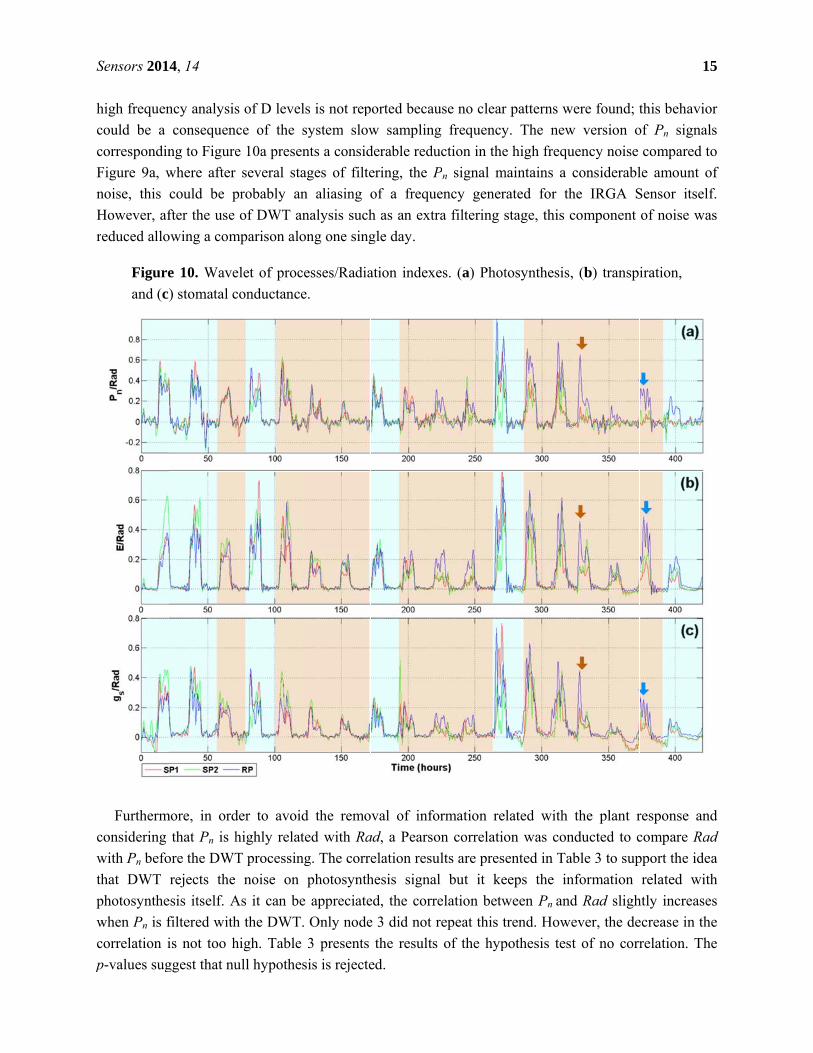
Finally, i
plants, the a
proposed to
during the d
esult of the
plants were
t is importa
changes app
he plants w
not recover
380. Here, t
activity stop
exponential
experimenta
endency ch
brown arrow
was reported
with the blue
4, 14
ble 3. Photo
in order to u
analysis of P
explore the
day RT-CB
e photosynth
subjected to
ant to state
peared until
were recover
after the fo
the RT-CB
ps, and the n
behavior o
ation, the R
hanged when
w did not ch
d. This ten
e arrow.
Variables
CoefficientsNode 1 Node 2 Node 3
osynthesis–r
Figure
understand
Pn integral c
e response
increases b
hetic and re
o drought, t
that the fir
day two. D
red and pho
ourth period
index main
net respirati
of the photo
RT-CB regis
n the irriga
hange the pl
dency cont
Photosyn
s R 0.5140.5300.655
radiation co
11. Real Ti
the impact
calculation
of plants un
but stops or
espiration ac
the RT-CB
rst day of d
During the re
otosynthetic
d of drough
ntains the n
ion increase
osynthesis a
stered an im
ation was su
ant respons
tinues until
nthesisosk–R
6 <07 <07 <0
orrelation re
ime-Carbon
of drought
which is na
nder drough
r slightly de
ctivity; but,
signals rem
drought did
ehydration d
c activity wa
ht, even whe
negative te
es causing a
activity as t
mportant in
uspended. T
e. However
normal irri
adiation
p 0.0001 0.0001 0.0001
esults with a
n Balance (R
t for long-te
amed as Rea
ht condition
ecreases du
as it is ind
mained const
not signifi
days corres
as normaliz
en plants w
ndency wh
a loss of dr
the plant gr
crease for t
The first day
r, the next d
igation was
Photosynt
R 0.5600 0.5574 0.6308
and without
RT-CB).
erm develop
al Time-Car
ns. As it ca
uring the nig
dicated with
tant until th
icantly affec
ponding to
zed. Neverth
were watered
hich means
ry matter. F
rows, becau
the referenc
y of scarcit
day a fall in
s re-establis
thesisDWT–R
<<<
DWT filter
pment and
rbon Balanc
an be seen i
ghts. This b
h dark ellips
he rehydratio
cted plant r
hours 75, 1
heless, SP1
d at approx
that the ph
igure 11 als
use around
ce plant. H
ty, as indica
the Carbon
shed in the
Radiation
p <0.0001 <0.0001 <0.0001
1
ring.
health of th
ce index wa
in Figure 1
behavior is
ses, when th
on day. Her
response an
175, and 275
and SP2 di
ximately hou
hotosynthet
so shows th
hour 275 o
However, th
ated with th
n assimilatio
day marke
16
he
as
1,
a
he
re
nd
5;
id
ur
ic
he
of
his
he
on
ed
Sensors 2014, 14 17
5. Conclusions
In this investigation, a smart sensor system was developed to monitor primary variables in plants.
Then, this information was then used to estimate physiological processes such as photosynthesis,
transpiration, and stomatal conductance. The proposed experiment demonstrates the capabilities of the
system to detect stress in plants submitted to soil drought conditions. It also reveals that even under
real operation conditions (greenhouse applications) the system properly estimates the aforementioned
physiological processes. However, important considerations must be taken into account if the system
pretends to be operated outside due to sunlight and rain conditions. But it is important to state that this
is a prototype that can be improved in a future. Another central consideration relies on the leaf
chamber design and stress conditions that are produced on isolated leaves. During the experiment, it
was necessary to periodically changed between leaves. However, during periods of three days not
important damage over the samples was appreciated. This may be due to the Nylamid-acrilic materials
utilized in the leaf chamber design, which do not overheat under sunlight such as aluminum based
chambers that are used in commercial devices.
In addition, the DWT was used to process the signal combined with an index that adjusts the
estimation according to the plants surrounding environment. It resulted useful in order to perform a
day by day comparison for drought detection, which is important because conventional analysis
requires long time to detect drought conditions. Moreover, the RT-CB index provides an alternative
method for monitoring plant growth without using destructive laboratory analysis. Therefore, RT-CB
provides information about irregular growing circumstances such as drought. Finally, the proposed
digital signal processing methodology implemented in the gas exchange system represents an
alternative that can be used to detect and monitor drought under real growth conditions. Also, this
methodology can be utilized for filtering purposes in precision agriculture applications where the
signal-to-noise ratio is high (like chlorophyll fluorescence or impedance sensor applications).
Furthermore, it can be utilized to explore time-frequency properties of different kinds of signals.
Acknowledgments
This project was partially supported by CONACYT scholarship 231946, PROINNOVA-20501059,
and by PROFAPI 2012-111 and PROFAPI 2013-116. The authors wish to thank Ismael Urrutia for his
support and advice related with the biological part of this investigation. Also thanks to M.C. Gilberto
Marquez Salazar for providing the greenhouse where the experiments were conducted and Texas
Instruments for providing device samples tested in this project. Finally, the authors wish to thank
Silvia C. Stroet for her support by doing the English language edition.
Author Contributions
Guevara-Gonzalez and Carrillo-Serrano designed the study. The experiments and the signal
processing and analysis were performed by Duarte-Galvan, Millan-Almaraz, and Romero-Troncoso.
All authors discussed the results and implication and everyone provided helpful feedback and
commented on the manuscript at all stages.
Sensors 2014, 14 18
Conflicts of Interest
The authors declare no conflict of interest.
References
1. Taiz, L.; Zeiger, E. Plants Physiology; Sinauer Associates, Incorporated: Sunderland, MA, USA,
2010.
2. Aroca, R. Plant Responses to Drought Stress: From Morphological to Molecular Features;
Springer: Berlin Heidelberg, Germany, 2012.
3. García-Mier, L.; Guevara-González, R.G.; Mondragón-Olguín, V.M.; del Rocío Verduzco-Cuellar, B.;
Torres-Pacheco, I. Agriculture and bioactives: Achieving both crop yield and phytochemicals. Int. J.
Mol. Sci. 2013, 14, 4203–4222.
4. Fernandez-Jaramillo, A.A.; Duarte-Galvan, C.; Contreras-Medina, L.M.; Torres-Pacheco, I.;
Romero-Troncoso, R.D.J.; Guevara-Gonzalez, R.G.; Millan-Almaraz, J.R. Instrumentation in
developing chlorophyll fluorescence biosensing: A review. Sensors 2012, 12, 11853–11869.
5. Agam, N.; Cohen, Y.; Berni, J.A.J.; Alchanatis, V.; Kool, D.; Dag, A.; Yermiyahu, U.; Ben-Gal, A.
An insight to the performance of crop water stress index for olive trees. Agric. Water Manag.
2013, 118, 79–86.
6. Udompetaikul, V.; Upadhyaya, S.K.; Slaughter, D.; Lampinen, B.; Shackel, K.; House, G. Plant
Water Stress Detection Using Leaf Temperature and Microclimatic Information. In Proceedings
of 2011 ASABE Annual International Meeting Sponsored by ASABE Galt House, Louisville,
KY, USA, 7–10 August 2011.
7. Jiménez-Bello, M.A.; Ballester, C.; Castel, J.R.; Intrigliolo, D.S. Development and validation of
an automatic thermal imaging process for assessing plant water status. Agric. Water Manag. 2011,
98, 1497–1504.
8. Abboud, T.; Bamsey, M.; Paul, A.-L.; Graham, T.; Braham, S.; Noumeir, R.; Berinstain, A.;
Ferl, R. Deployment of a fully-automated green fluorescent protein imaging system in a high
arctic autonomous greenhouse. Sensors 2013, 13, 3530–3548.
9. Millan-Almaraz, J.R.; Guevara-Gonzalez, R.G.; Romero-Troncoso, R.; Osornio-Rios, R.A.;
Torres-Pacheco, I. Advantages and disadvantages on photosynthesis measurement techniques: A
review. Afr. J. Biotechnol. 2009, 8, 7340–7349.
10. Hsiao, S.-C.; Chen, S.; Yang, I.C.; Chen, C.-T.; Tsai, C.-Y.; Chuang, Y.-K.; Wang, F.-J.;
Chen, Y.-L.; Lin, T.-S.; Lo, Y.M. Evaluation of plant seedling water stress using dynamic
fluorescence index with blue led-based fluorescence imaging. Comput. Electron. Agric. 2010, 72,
127–133.
11. Kim, Y.; Glenn, D.M.; Park, J.; Ngugi, H.K.; Lehman, B.L. Hyperspectral image analysis for
water stress detection of apple trees. Comput. Electron. Agric. 2011, 77, 155–160.
12. Mirzaie, M.; Darvishzadeh, R.; Shakiba, A.; Matkan, A.A.; Atzberger, C.; Skidmore, A.
Comparative analysis of different uni- and multi-variate methods for estimation of vegetation
water content using hyper-spectral measurements. Int. J. Appl. Earth Obs. Geoinf. 2014, 26, 1–11.
Sensors 2014, 14 19
13. Senay, G.; Budde, M.; Verdin, J.; Melesse, A. A coupled remote sensing and simplified surface
energy balance approach to estimate actual evapotranspiration from irrigated fields. Sensors 2007,
7, 979–1000.
14. Ghulam, A.; Li, Z.-L.; Qin, Q.; Yimit, H.; Wang, J. Estimating crop water stress with ETM+ NIR
and SWIR data. Agric. Forest Meteorol. 2008, 148, 1679–1695.
15. Barbagallo, S.; Consoli, S.; Russo, A. A one-layer satellite surface energy balance for estimating
evapotranspiration rates and crop water stress indexes. Sensors 2009, 9, 1–21.
16. Suárez, L.; Zarco-Tejada, P.J.; González-Dugo, V.; Berni, J.A.J.; Sagardoy, R.; Morales, F.;
Fereres, E. Detecting water stress effects on fruit quality in orchards with time-series pri airborne
imagery. Remote Sens. Environ. 2010, 114, 286–298.
17. Atherton, J.J.; Rosamond, M.C.; Zeze, D.A. A leaf-mounted thermal sensor for the measurement
of water content. Sens. Actuators A Phys. 2012, 187, 67–72.
18. Wang, Z.-Y.; Leng, Q.; Huang, L.; Zhao, L.-L.; Xu, Z.-L.; Hou, R.-F.; Wang, C. Monitoring
system for electrical signals in plants in the greenhouse and its applications. Biosyst. Eng. 2009,
103, 1–11.
19. Tomkiewicz, D.; Piskier, T. A plant based sensing method for nutrition stress monitoring. Precis.
Agric. 2012, 13, 370–383.
20. Passaro, V.; De Leonardis, F. Investigation of soi raman lasers for mid-infrared gas sensing.
Sensors 2009, 9, 7814–7836.
21. Escalona, J.M.; Fuentes, S.; Tomás, M.; Martorell, S.; Flexas, J.; Medrano, H. Responses of leaf
night transpiration to drought stress in vitis vinifera l. Agric. Water Manag. 2013, 118, 50–58.
22. Millan-Almaraz, J.R.; Torres-Pacheco, I.; Duarte-Galvan, C.; Guevara-Gonzalez, R.G.;
Contreras-Medina, L.M.; Romero-Troncoso, R.d.J.; Rivera-Guillen, J.R. Fpga-based wireless
smart sensor for real-time photosynthesis monitoring. Comput. Electron. Agric. 2013, 95, 58–69.
23. Schmidt, U. Low-cost system for on-line measurement of plant transpiration and photosynthesis
in greenhouse production. Acta Hortic. 1998, 421, 249–258.
24. Sánchez, J.A.; Rodríguez, F.; Guzmán, J.L.; Arahal, M.R. Virtual sensors for designing irrigation
controllers in greenhouses. Sensors 2012, 12, 15244–15266.
25. Millan-Almaraz, J.R.; Romero-Troncoso, R.D.J.; Guevara-Gonzalez, R.G.; Contreras-Medina, L.M.;
Carrillo-Serrano, R.V.; Osornio-Rios, R.A.; Duarte-Galvan, C.; Rios-Alcaraz, M.A.;
Torres-Pacheco, I. Fpga-based fused smart sensor for real-time plant-transpiration dynamic
estimation. Sensors 2010, 10, 8316–8331.
26. Centritto, M.; Brilli, F.; Fodale, R.; Loreto, F. Different sensitivity of isoprene emission,
respiration and photosynthesis to high growth temperature coupled with drought stress in black
poplar (populus nigra) saplings. Tree Physiol. 2011, 31, 275–286.
27. Flexas, J.; Ribas‐Carbó, M.; Hanson, D.T.; Bota, J.; Otto, B.; Cifre, J.; McDowell, N.;
Medrano, H.; Kaldenhoff, R. Tobacco aquaporin NtAQP1 is involved in mesophyll conductance
to CO2 in vivo. Plant J. 2006, 48, 427–439.
28. Munné-Bosch, S.; Mueller, M.; Schwarz, K.; Alegre, L. Diterpenes and antioxidative protection
in drought-stressed Salvia officinalis plants. J. Plant Physiol. 2001, 158, 1431–1437.
29. Munné-Bosch, S.; Alegre, L. Plant aging increases oxidative stress in chloroplasts. Planta 2002,
214, 608–615.
Sensors 2014, 14 20
30. Hubbard, R.; Ryan, M.; Stiller, V.; Sperry, J. Stomatal conductance and photosynthesis vary
linearly with plant hydraulic conductance in ponderosa pine. Plant Cell Environ. 2001, 24,
113–121.
31. CI-340. Hand-Held Photosynthesis System Instruction Manual; CID Inc.: Camas, WA, USA,
2008.
32. Rodriguez-Donate, C.; Osornio-Rios, R.A.; Rivera-Guillen, J.R.; Romero-Troncoso, R.D.J. Fused
smart sensor network for multi-axis forward kinematics estimation in industrial robots. Sensors
2011, 11, 4335–4357.
33. Ton, Y.; Kopyt, M. Phytomonitoring information and decision-support system for crop growing.
In Proceedings of the 2nd IS on Intelligent Information Technology in Agriculture, Beijing,
China, Oct. 2003.
34. Goodman, S.N. Toward evidence-based medical statistics. 1: The p value fallacy. Ann. Intern.
Med. 1999, 130, 995–1004.
35. Vazquez-Cruz, M.A.; Luna-Rubio, R.; Contreras-Medina, L.M.; Torres-Pacheco, I.;
Guevara-Gonzalez, R.G. Estimating the response of tomato (solanum lycopersicum) leaf area to
changes in climate and salicylic acid applications by means of artificial neural networks. Biosyst.
Eng. 2012, 112, 319–327.
36. Sharma, P.; Jha, A.B.; Dubey, R.S.; Pessarakli, M. Reactive oxygen species, oxidative damage,
and antioxidative defense mechanism in plants under stressful conditions. J. Bot. 2012, 2012, doi:
10.1155/2012/217037.
37. Beebe, S.E.; Rao, I.M.; Blair, M.W.; Acosta-Gallegos, J.A. Phenotyping common beans for
adaptation to drought. Front. Physiol. 2013, 4, doi: 10.3389/fphys.2013.00035.
© 2014 by the authors; licensee MDPI, Basel, Switzerland. This article is an open access article
distributed under the terms and conditions of the Creative Commons Attribution license
(http://creativecommons.org/licenses/by/3.0/).
Related Documents


![Identificación de variables asociadas al éxito ...sistemanodalsinaloa.gob.mx/archivoscomprobatorios/_30_conferencias... · Es una implementación del algoritmo C4.5 [6] desarrollado](https://static.cupdf.com/doc/110x72/5d066d5188c9933c618db6c9/identificacion-de-variables-asociadas-al-exito-es-una-implementacion.jpg)