FOUNDATIONS OF RATIO AND FINANCIAL ANALYSIS CHAPTER OUTLINE INTRODUCTION Dr.saggi.egution ((ROE a i ~ d Its Rela/iolz,ship lo KO,-1 Purpose and lJse of Ratlo Analys~s Ratlo Analysis: Crlutlo~~ary Kotes Ecoiionzrc .4s~r1171ptlon\ - Rc~lchrlrar.kr T~~~~~~~~ ( I I I ~ ~ v ~ ~ ~ d ( ) ~ ~ r)l.(~(pL5~l~g 7\ieeyarr~*c, 'I rtinhci-5 COMMON-SIZE STATEMENTS DISCUSSION OF RATIOS BY CATEGORY Acti1.1ty Analys~s hhol-t- Tor~ir (Op~l'~lll/lg) 4cf11 rti li(rl10r Long- T ~JI~I (Iii~*csti~~erlt) .-lctrl.rr~l Ratio\ Liquidity Analysis Leilpth of Crr ~h C~-calc I.lh~ Xrrip Cuj?rtol RU!IOJ uird Deletz5119~ lnle1.1~11\ Long-Term Dcbt and Solvency Analysis L)c.hr C ~ I ' L J I I L I I I W Capi/ull:~ltro~r Tublr ~zriil Deht Rutros Inro-c.sr Co1.c.r.upc Rafio.c C(ryilrl1Evpcndit1ir.e ~ ~ n d CFO-ro-Dclhr Ratios Profitability Analysis lierrir-11 or1 S~/lc,.v RcJ~uI.~~ oil lti\~e.s~nic~nr P~-nfi/c~hilitv uiztl Cusll Flo11.s Operating and Financial Le\ erage Oj7crnrl17g Lei cr-ogc Flnunc /(ti LC~IY>I-L~,~CJ RATIOS: AN INTEGRATED ANALYSIS Analysis of Film Performance Dls~rggi.eguriorl of RO;1 T~EIICI~ III ROE ui~d ROA Economic Characteristics and Strategies Conipetlizg Strategr PA PI-odzrct Lift. C:~,clc Ii~/cnnditsti:l. Ecolzonlic Fucrors Classification and Selection of Ratios EARNINGS PER SHARE AND OTHER RATIOS USED IN VALUATION Earnings per Share Slnyple Capitul St~.uctzrr-c Con~ylcv Cupltal Srnrclrtl-r ..ldjzt.stinrnts for- Optrons und 6tu1.r-unlr Lii~~rrations ofEPS Calc~i~lutiol?~ Cash Flow per Share EBITDA per Share Book Value per Share Price-to-Earnings and Price-to-Book-Value Rat~os Dividend Payout Ratio PATTERNS OF RATIO DISCLOSURE AND USE Perceived I~nportance and Classificatio~~ Disclosure of Ratios and Motivation SUMMARY ( , > APPENDIX 4-A APPENDIX 4-B CASE 4-1 CHAPTER OBJECTIVES This chapter ~~itroduces ratios, the basic tools of financial analysis. The ob-iectives of Cliaptcr 4 are to: 1. Exainine the purpose and use of ratios and provide some cautionary notes. 2. Explain tlie use of common-size statements. 3. Discuss tlie construction and use of Short-term and long-te11ll activity (turno~~er) ratios that measure the efficiency with which the firm uses its resources. Liquidity ratios. including working capital ratios, the cash cycle. and the defensive interval. that assess tlie f i l l ' s ability to meet its near-term obligations.

Welcome message from author
This document is posted to help you gain knowledge. Please leave a comment to let me know what you think about it! Share it to your friends and learn new things together.
Transcript
FOUNDATIONS O F RATIO AND FINANCIAL ANALYSIS
CHAPTER OUTLINE
INTRODUCTION Dr.saggi.egution ((ROE a i ~ d Its Rela/iolz,ship lo KO,-1
Purpose and lJse of Ratlo Analys~s
Ratlo Analysis: Crlutlo~~ary Kotes Ecoiionzrc .4s~r1171ptlon\ - Rc~lchrlrar.kr T~~~~~~~~ ( I I I ~ ~ v ~ ~ ~ d ( ) ~ ~ r ) l . ( ~ ( p L 5 ~ l ~ g 7\ieeyarr~*c, 'I rtinhci-5
COMMON-SIZE STATEMENTS
DISCUSSION OF RATIOS BY CATEGORY Acti1.1ty Analys~s hhol-t- Tor~ir (Op~l '~ l l l / lg ) 4cf11 rti li(rl10r Long- T ~ J I ~ I (Iii~*csti~~erlt) .-lctrl.rr~l Ratio\
Liquidity Analysis Leilpth of Crr ~h C~-calc I.lh~ Xrrip Cuj?rtol RU!IOJ uird Deletz5119~ lnle1.1~11\
Long-Term Dcbt and Solvency Analysis L)c.hr C ~ I ' L J I I L I I I W Capi/ull:~ltro~r Tublr ~zriil Deht Rutros Inro-c.sr Co1.c.r.upc Rafio.c C(ryilrl1 Evpcndit1ir.e ~ ~ n d CFO-ro-Dclhr Ratios
Profitability Analysis lierrir-11 or1 S~/lc,.v R c J ~ u I . ~ ~ oil lti\~e.s~nic~nr P~-nfi/c~hilitv uiztl Cusll Flo11.s
Operating and Financial Le\ erage Oj7crnrl17g Lei cr-ogc Flnunc /(ti LC~IY>I-L~ ,~CJ
RATIOS: AN INTEGRATED ANALYSIS Analysis of Film Performance Dls~rggi.eguriorl of RO;1
T ~ E I I C I ~ I I I ROE u i ~ d ROA
Economic Characteristics and Strategies Conipetlizg Strategr PA
PI-odzrct Lift. C:~,clc Ii~/cnnditsti:l. Ecolzonlic Fucrors
Classification and Selection of Ratios
EARNINGS PER SHARE AND OTHER RATIOS USED IN VALUATION Earnings per Share Slnyple Capitul St~.uctzrr-c Con~ylcv Cupltal Srnrclrtl-r ..ldjzt.stinrnts for- Optrons und 6tu1.r-unlr Lii~~rrations o fEPS Calc~i~lutiol?~
Cash Flow per Share EBITDA per Share Book Value per Share Price-to-Earnings and Price-to-Book-Value Rat~os Dividend Payout Ratio
PATTERNS OF RATIO DISCLOSURE AND USE Perceived I~nportance and Classificatio~~ Disclosure of Ratios and Motivation
SUMMARY
(,> APPENDIX 4-A APPENDIX 4-B CASE 4-1
CHAPTER OBJECTIVES
This chapter ~~itroduces ratios, the basic tools of financial analysis. The ob-iectives of Cliaptcr 4 are to:
1. Exainine the purpose and use of ratios and provide some cautionary notes.
2. Explain tlie use of common-size statements.
3. Discuss tlie construction and use o f
Short-term and long-te11ll activity ( tu rno~~er ) ratios that measure the efficiency with which the firm uses its resources.
Liquidity ratios. including working capital ratios, the cash cycle. and the defensive interval. that assess tlie f i l l ' s ability to meet its near-term obligations.
INTRODUCTION 1 1 1
Solvency ratlos that examine capital structure and 5. Show how tlic inlegrated analys1s of' r;ttlos ~ ~ 1 1 1 he the firni's a b ~ l ~ t y to meet long-tznn obliga~ions and used to e v a l ~ ~ a i e corporate perf'oinancc. capital needs. 6. Rclate rat~os to coq3orate str:ltcgy i~nd the product lifc Profitabtll ty ratios that mcasurc incorr~e relati\ c to cycle. re~~enucs and ~nvested capitril. 7 . Exam~nc: tbc comp~itat~on ancl uxcf'tulnt.ss of carn-
4. Dcfinc and compute measures of operatlrig and iinan- ings pel. sl~al-e anci otiier rattos usecl for valuation clal Ic\/erage purposes.
INTRODUCTION
Finailcia1 ratios are used to compare the risk and return of different firms In order to help eq- uity investors and creditors make intelligent investment and credit decisions. Such dec~sions require both an evaluation of changes in performance over time fbr a pal-t~culrzr ~nvestinent and a cornpanson among all firms u7ithii1 a single industry at a specific polnt In time.
The infor~liational needs and appropriate analytical techniques used for these invcct- ~nen t and credit dec~sions depend on thc decislon inalter's tinle horizon. Sllort-tern3 bank and trade creditors are primarily interested lri the ~mn~edla te liquidity of the fir111. Lon, (rer-ten11 creditors (e.g., bondholders) art. interested in long-term solvency. Creditors seek to mlnl- inize I-lsk and ensure that resources are akailable for tile payment of interest and prtncipal obligations.
Equity in\rcstors are primarily interested in the long-tern? earning pov;el- of'tl.te ern]. Ar- the equity investor bears the residual risk (which can be defined as the return from operations after all claims from suppliers and creditors have been satisfied). it requires a return con?- nieiisurate to that risk. The residual risk is highly volatile and difficult to quantify. as is the equity investor's time horizon. Thus, analysis by the equity investor nceds to bc tlle I I IOS~
co~npreliensive, and i t subslii~iec the analysis carried out b y other users.
Purpose and Use of Ratio Analysis
A pr1rnal-y adbantagc of rat~os is that they call be uscd to colllpare the risk and return rcla- tlonships of f i m s of different sizes. Ratios can nlso pro\?iil't, n profile qf cr f i n 1 2 , 11.r cJc20no~?lrc i.huructc.r.istics u/7d col~zpetiti~*c .vt~.ufc>gies, uud it5 zini~i~ie oj>~t-uti~lg, ~ ~ ~ ~ I I c ' I L I I , a17cI i/z\'t).$t- I ~ I ~ I I ~ C ~ I Q I ~ U C ~ ~ I - ~ J ~ ~ L ~ S .
This process of' standardization may. however, be deceptive as it ignores differencec anlong industries, the effect of varying capital structures. and difSercnccs in accounting and reporting methods (especialiy when cornpari sons are ~nteixational in scope). G I \.en thesc di f- ferences, cllanges (treildc) in a ratio and variability over time may be more ~nforrnati\ e than tlie level of the ratio at any point in time.
Four broad ratio categories measure the different aspccts of risk and return relationships:
I . .4(-ti\,itj. unul~.,iis: evaluates revenue and output generated by the firm's assets.
2. Lryuililt~? ul1a1ji.s.i.s: llleasures the adequacy of a fir~n's cash resources to meet its near-tern1 cash obligations.
3. Lo l zg - f cm~ cJc)ht und , s o l ~ : ~ n c ~ ~ ulzcl(\lsis: exali~ines thc firm's capital structure, includ- ing the mix of its financing sources and tlie ability of the firm to satisfy its longer- teri~i debt and investment obligations.
4. PI-qfitubilic~? ~lnlrljlsis: measures the income of the fir111 relative to its revenues and invested capital.
Tllese categories are interrelated rather than independent. For example, profitability af- fects liquidity and solvency, and tlie efficiency with which assets are used (as n~eas~l red by activity analysis) impacts profitability. Thus, financial analysis relies 011 a11 integrated use of many ratios, rather than a selected few.
Ratio Analysis: Cautionary Notes
Ratlo analysis I S essential to co1nl7rehcns1\ e financial analyh~s. tiowe\rer, rat~os art: based on i~iii~llcit assuniptions tliat do not alkj ays apply. Ratlo computat~ons and con~par~sons are f i r - ther confounded by the lack or inappropriate use of benchmarks, the t~ming of trai~sactions, i~cgative nuinbers. and drft'crences 1 1 ) reporting methods. This sectlon presents some impol- tant caveats that must be considered when iriterl~ret~ng ratms I
Economic Assumptior~s
Ratio analysis is deslgned to filcilitate comparisons by ~111ii111at11ig size d~fferences across finlls and over time. Tmpl~cit in this process is the proj)or-trontrlrr\? ussur~zytio~~ that the cco- Ilornlc relat~onsli~p bet~ieeil numerator and deno~n~nator does not depend on slze. This as- sunlptlon ignores the existence of fixed costs. When there are fixed costs. changes in total costs (and t h ~ ~ s profits) are not propoi-tional to changes in sales
Morco~~ei-, the il~iplicit assLIli1ptlon of a l~near relat~onship between numerator and de- nom~nator Inay be incorrect even 111 tlie absence of a fixed component. For exa~nple. the In- \icntor~i turnover ratio. COGSi~iiventory, implies a constant relationship between the \olunle of sales and in\~etitory levels. Vianagenlent science theory. h ~ > ~ e v e r , indicates that the optl- mum relationship is nonl1iiea1 and inventory le\lels mliy be proportional to the square root of demand.' Thus. a doubling 111 demand should increase ~ii\~entnry by only 40°/6 (approxi- mately) ~ ~ i l 1 1 a consequent 40'>0 increase in the turnover ratio. Tile I / I \ ~ ~ ~ I ~ c I I ~ I ~ ~ U I " I I O \ ' ~ I . I ' L L ~ ~ O 1 5
( iccll.1~) /lot six. illc/epc~rzdc~rtt.
Benchmarks
Ratlo analysis often lacks appropriate benchmarks to ~ndicare optlinai levels. The e~~a lua t lo~ l of a ratio often depends on the point of' view of the analyst. For exan~plc, 101- a short-tenn lender, a 111gi1 Ilquidity ratlo may be a positive indicator. I-loueber, from the perspective of an equlty investor, it may indicate poor cash or working capital n~anagenlent
/ndustr)/ Norms as Eench17i~1rks. One relevant benchmark is tlie ~ndustry nornm' as em- j)incal ek idcnce4 ind~cates tliat ( 1 ) ~iidustry classification is thc primary factor In explain~ng ratlo dispcrsron and ( 2 ) ratlob of ~ n d ~ \ ldual films tend to converge tonlard the 11ldustryw1de average.
Two differing explanations are ofi-red:'
1 . lndustl-ywide econoniic charactel-ist~cs operate 011 the firm to correct del~iations fi.om the industi-3) norni.
2 . Managers vie- 11~e ~ndustry nornis as targets and a1111 tllcir ratios accordingly. T h ~ s is do~le by the ciio~ce of accounting nietliod, allocatton of resources. or both.
I,slng ail industry a17eragc as the benchmarl< may be uszlul for comparisons ~vlthin an indust~y, but not for cornpansons between companies 111 d~fferent ~ndustr~es. Even for in- traindustry analysis, the bench~iiarl\ may ]la\ e l l~n~ ted usef~~lness if the \bliole industry 01-
inajor fi17-11~ 111 tliat industry are perforni~ng poorly.
'For explanatory purposes. this discuss~ori uses specific ratios as examples: these ratios are defined later in the chapter.
'See C'hapter 6 for a lnore detailcd dlsouscion of'this i ss~lc .
'lndustrq. 110r1ns may be calculated directly through thc use oi 'computeri~ed databases such as Sta~idard ni I'oor's C'ompustat database. Xltcrnnti~~ely, industry proiiles ai-e a\'ailable froin sources such as Robert Morris Associates ( RbtA) and Dun & Br~dstreet 's ( D S B ) I/ztll~,sn~iul Hu~rlhooX. Thcsz sources pro\ ide common-size balance sheet. income statements. and selected ratios on an industry basis.
'l'he industl! factor was f i ~ r t documented hy Horr~gdn ( 1965). and the tend en^) f c ~ ratlos to coliverge to 1ndusti-y 11orms was documented by LC\/ (1969). Frccka and Lee (l983), Peles and Schneller ( 1 9h9), and inore recently Da\ IS
2nd Pclcs ( 1993 )
'Davls and Peles ( I993), extcndlrlg edr l~er morh b~ Peles and Schncllei (1989). found t11'1t on a\icr.age the manage- ment eficct is faslel than the ~ndustrq one, although both contr~bute signlflcantl> to the totd adjustinent.
Timing and Window Dressing
Data used to compute ratios are a~lailable only at specific points In tltne when financial statc- ~iients are issued. For annual reports, the fiscal year-end may correspond to tlie low point of a firm's operating cycle. when reported levels of asscts and liabilit~es may 1101 reflect tlie levels typlcal of norl~ial opcratlons. As a result, especially In the case of seasonal businesses, ratlos may not reflect nol~iial operating relatio~lships. For cxample. ~nventories and accounts payable ]nay be understated. Reference to interim statements is one way of alleviating this problem. However, no st foreign countries either do not requu-e lnterinl statements o r require then1 less fi-equentJy.' Moreover, foreign filings are generally less t~iiiely than U.S. repoi-tb.
The t im~ng issue leads to another problem. Transactions at year-end can lead to manipu- lation of the ratios to show the firm in a more favorable light, often called ~ ' ~ t 7 1 1 0 1 1 : ~ I . c ' . Y . Y L ) ~ ~ .
For example, a firm with a current ratio (current assets/current liabilities) of 1.5 ($300/$200) can increase it to 2.0 (S100:$100) by simply using cash of $100 to reduce accounts payable immediately prior to tile period's end.
Generally, any ratio where a transaction affects the nulnerator and derlolninator equally can be ~ilaliipulated as f o l l o ~ ~ s . If the ratio is greater than 1, it can be ~licreased by a transac- tlon that subtracts the same amount fro111 both the numerator and deiion~inator. If it is less than 1 , it can be ~ncl-eased by a transaction that adds the same amount to both the numerator and den~rnina tor .~
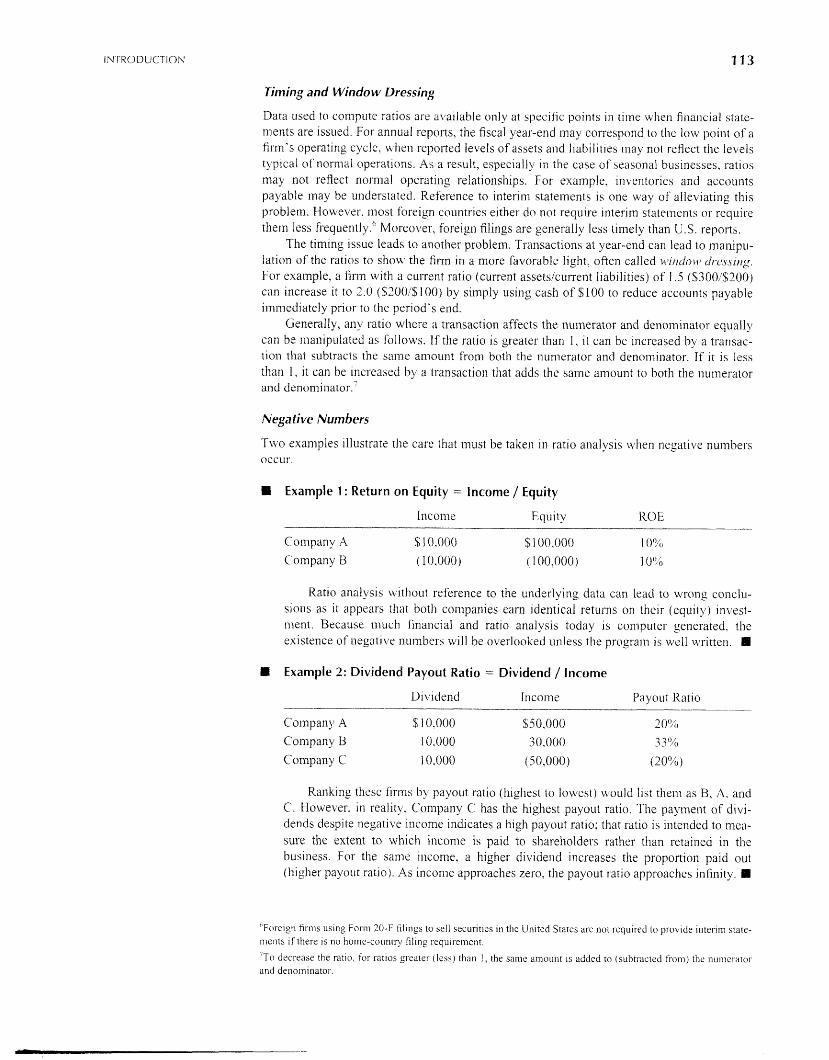
Negative Numbers
Two exainples illustrate tlie care that must be taken in ratio analysis when negative numbers occur.
E Example 1 : Return on Equity = Income / Equity
Incon~e Equity R O F,
Company A S 10,000 $100,000 1 094
Coinpany B ( 10,000 ) ( 100.000) I 000
Ratio analysis without reference to the underlying data can lead to wrong conclu- sions as it appears that both companies earn identical returns on t h e ~ r (equity) l n ~ ~ e s t - nlent. Because 111ucl1 f i l~anc~al and ratio analysis today is computes generated. the existence of negative nurnber~ will be overloo1;ed unless tlie program is well writte~l. II
Example 2: Dividend Payout Ratio = Dividend / income
Divide~id Income Payout fiatio
Companji A $10.000 $50,000
Company B 10,000 30,000
Con~pany C 10,000 (50.000)
Rarik~ng t ime fir111s by p a y o ~ ~ t ratio (highest to lowest) would list the111 as B, A. and C. Howeker. in reality. Company C has tlie highest payout ratio. The payment o f divi- dends despite negative income indicates a high payout ratlo: that ratio is intended to mea- sure the extent to which income is paid to sliareholders rather than retained in tlie bus~ness. For tlie same incon~e, a higher dividerld increases the proportion paid out (higher payout ratio). As incoi~le approaches zero, the payout ratio apl3roaches infinity.
" ~ o r e i ~ n firnis using Fol-rn 20-F fil~ngs to sell securities in the United Statcs are not required to provide interim stalc- ments if there is no home-country filing requirement.
'To decrease the ratio. for ratios greater (less) than 1, the same amou~lt is added to (subtracted from) the numerator and denominator.
CHAPTER 4 FOUNDATIONS CIF RATIO AND FINANCIAL ANALYSIS
Accounting Methods
The choice of accounting methods and estimates can greatly affect reported finallcia1 state- illent ailloi~nts. 111 addition, as described in Chapter 3, even "pure" numbers such as cash fln\?!s from operatic?ns may be affected by accounting choices. Thus, ratios are not compara- l?le between firms ( ~ ' ~ t h differing accounting metl~ods) or for the same firm over time (\vliei~ it changes accounting methods). To interpret such ratios, it may be necessary to convert from one accounting method to another. A strong understanding of accounting rules and a judi- cious eye for infol-n~ation contained in the notes to financial statements are required for this typc of analysis. Subsequent chapters will detail the impact of specific accounti~lg methods on affected ratios.
The balance of t h ~ s chapter describes specific ratios, primarily in narrative form. We illustrale the calculatioil and interpretation of these ratios in Exhibits 4-4, 4-6, 4-8. 4- 10. 4- 12. and 3- 14. using the financial statements of Pfizer, a leading firm in the pharmaceuti- cal ~ndustr~l ."
The calculations in these exhibits are intended for illustrative purposes; in most cases. they are based on data taken directly fi-om ii~~aneial statements without any adjustnients. The required adjustments will become ciearer as we progress through the book. Ratios should no1 be .criewed as an end unto thcmselvcs, but rather as a starting point for further analysis. Ratios highlight \?,here further investigation and adjustment may be needed. 111 that sense, e\jeii ra- tios calculated wit11 unadjusted data can s e n e a useful purpose.
COMMON-SIZE STATEMENTS
A pervasi\~e ~x-oblec? \vhen conlparing a firin's pcrformance over time is that the firm's size i~ alwavs changing. Firms of different sizes are also difficult to compare. Common-size statenlents are used to standardize financial statemeilt components by expressing them a i a percentage of a relevant base. For exalllple. balance sheet components can be shown as a percentage of total assets: revenues and expenses can be computed as a percentage of total sales. and in ihc direct i-nethod cash flow statement, the components of cash flom f~-oni opcra- tiolls can be related to cash collections.
Common-size statements should not, howe\~er, be viewed soleiy as a scaling factor for standardization. T11ev provide the analyst wit11 useful infornlation as a iirst step in d ~ v e l o p i ~ ~ ; ; 117 sig/zls inro f l z c ~ ~ C ' O M O I T I ~ C ' ~ ' ~ ~ n ~ - a c t e l - i ~ t i c s o f diff&.cnt i l~dus tr ie~ and ofdiffkt-ent f i 1 . 1 1 1 ~ 111 111~' sunle i~zdus i~:~ ' . For example, significant changes in net income over time 111ay be traced to variations in cost of goods sold (COGS) as a percentage of sales. Changes in this ratio nlay indicate the efficacy of the firm's efforts to streamline its operations and/or a change in pric- 1112 strategies. Additio~lally, differences over time i r ~ a single fir111 or bet~veen firms tfuc to operating, financing. and ~nvesting decisio~ls n ~ a d e by management as well as external eco- 11onlic factors are often llighl~glited by common-size statements.
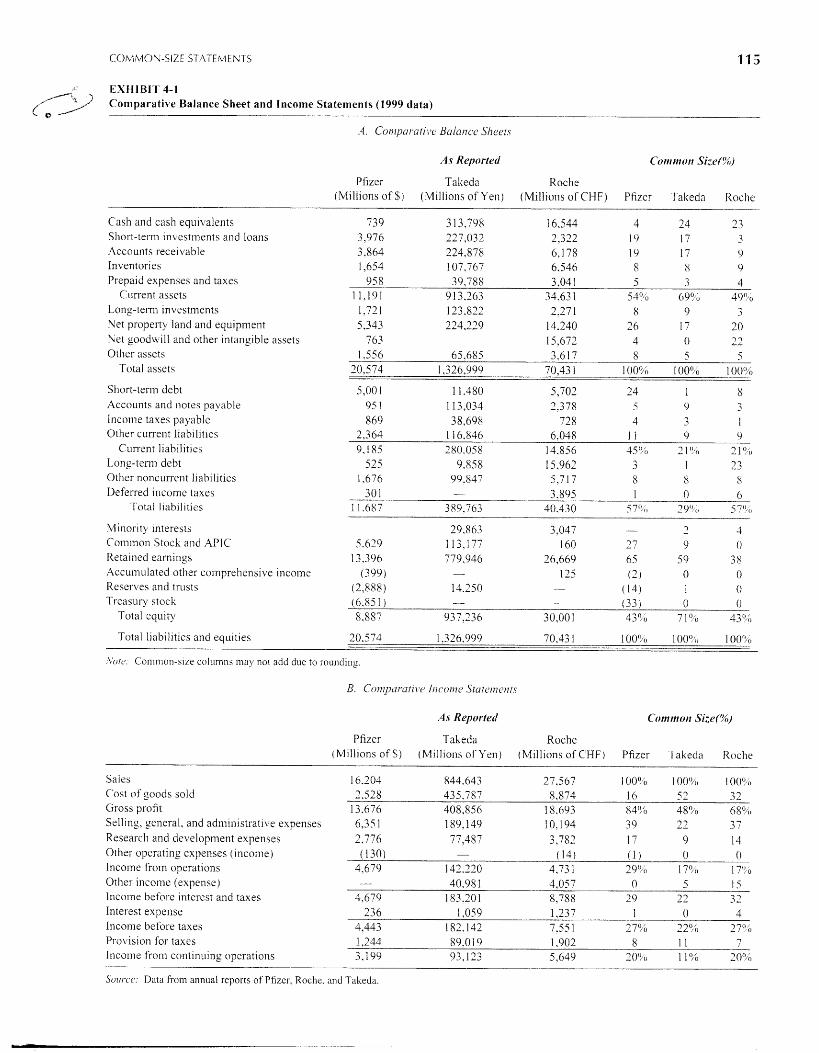
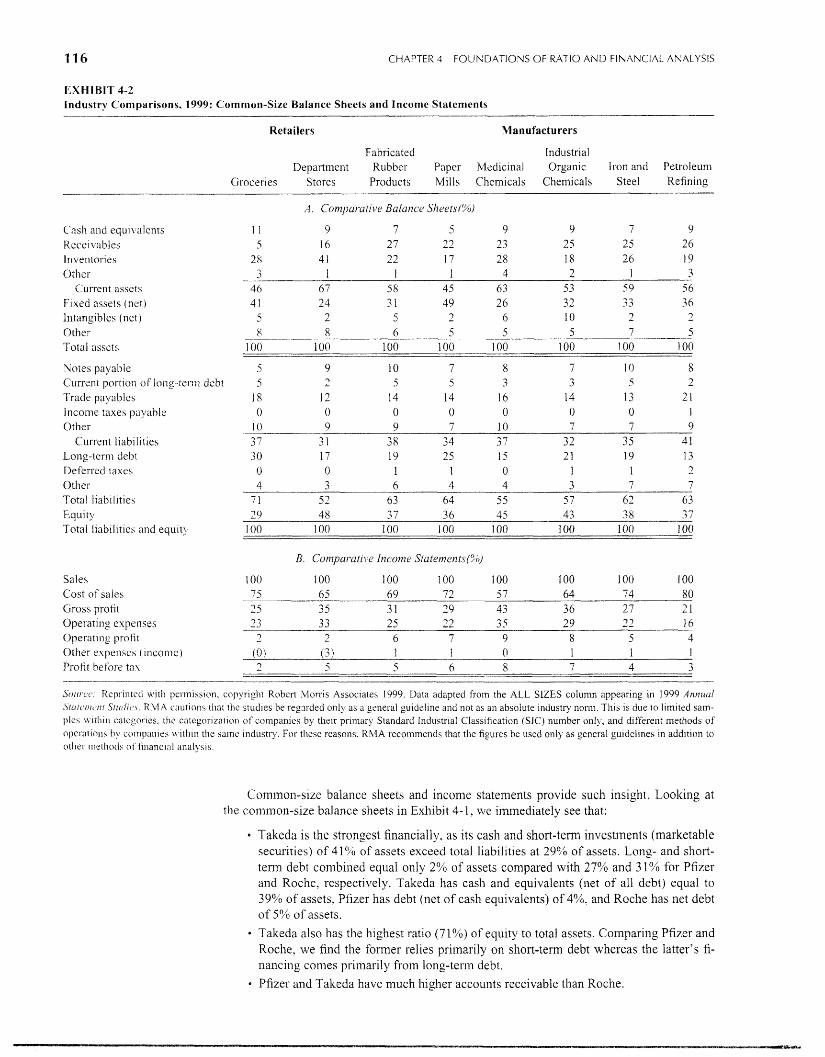
Exhibit 3-1 compares the 1999 balance sheets and Income statements of three phanua- celltical col~ipanies: Pfizer, Talceda, and Roche. Both actual data and common-size state- nlents are presented. Exhibit 4-2 presents common-size balance sheets and income statements for the pharmaceutical industry and selected other industries. The scaling factors are total assets for the balance sl~eets and sales for the income statements.
Cross-Sectional Comparisons. Comparison of the three cornpallies based on actual re- ported data is fraught with probleins because of the currency differentials as well as the dis- parity in size." Coinparisons of assets, working capital, and income cannot provide much insight unless the numbers are scaled.
q-h t . C'D and websltc accompanying the book contain the financ~al statements of Pfizer, Roche. and Takeda.
"he combina~ion of the t.wo also masks thesc relationships. Takeda is by far the sn~allest of the three companies. but that is not apparent from the raw data. Takeda provides "convenience" translations converting its yen finnncials into doliars on the basis of the I\ en-dollar relationsliip at the 1999 year-end. Total assets were approximately $ 1 I billion. one-half that of Piizer.
COMMON-SIZE STATEMENTS
EXHIBIT 4-1 " C7omparative Balance Sheet and Income Statements (1999 data) (.I
.4. Con~poru f i~~a Ba1a11c.e S11eer.c
As Reported Coninton Size(%)
Pfizer Takeda Roche (Millions of 9;) (Millions of Yen) (Millions of CHF) Pfizer Talteda Roche
Cash and cash e q u ~ ~ ~ a l e n t s Short-tesm ~n\estments and loans .4ccounts receivable Inventor~es Prepa~d expenses and taxes
Current asscts Long-remm investments Net property land and equ~pi~ient he1 goodw~ll and other intangible assets Other assets
Total assets
Short-tern1 debt Accounts and notes payable Income taves payable Other current l iab~lit~es
Current liabilities Long-tenn debt Othcr noncurrent liabilities Deferred inconie taxes
Total liabil~ties
h4 ~ n o r ~ t y interests 29,863 3,047 - - 7 3 Common Stock and APIC 5.629 113,177 160 3 7 9 O Reta~ned earnings 13,396 779,946 26,669 65 59 3 8 Accuin~~lated other comprehcns~ve income (3 99 ) - 125 (2) 0 0 fieserves and trusts (2.888) (14) I 0 13.250 -
Treasury stock (6.85 1 ) - - --- (33) 0 0 Total equlty 8,887 937,236 30,001 43Oc0 71'6 43°,0
Total l~abillties and equltles 20.5 74 1.326,999 70.43 1 1 0019/o 1 OOoO 1 00S0
,"\otc~ C oI1llnon-slLe colunlila 111ay not add due to rounding.
.4s Reported C o m ~ ~ t o n Six(%)
Pfizer Talieda Roche (Millions of S) (Millions of Yen) (Millions of CHF) Pfizer Takeda Koche
Sales Cost of ~ o o d s sold Gross profit Sell~ng, general, and adminlstrat~ve expenses Researcli and de\/elopment expenses Other operating expenses (~ncome) Incolne from operations Other incornc (expense) Illco~ne before ~nterest and taxes Interest expense Incon~e before taxes Provis~on for taxes Income fiom contlnu~ng operations
Sullrcc: Data fiom annual reports of Pfizer. Rochc. and Takeda.
116 CHAPTER 4 FOUNDATIONS OF RATIO A N D F I N A N C I A L ANALYSIS
EXHIBIT 4-2 industry Comparisons, 1999: Common-Size Balance Sheets and Income Statements
Retailers Manufacturers
Fabricated Industrial Deparllvellt Rubber Paper Medicinal Orga~lic lron and I'etroleulu
Groceries Stores Products Mills Chemicals Chelllicals Steel Refining
C'nsli and cqu11 alcnts Kcce~vables Inventones Ot11cr
Current asqcts F~xed acsets (net) lntang~blcs (lict) Otlier Total asscts
Notes payable Current portlon ol'lorig-tcl-111 debt Trade payablcs Income taxe\ payable Other
Currcnt I~abll~ties Long-term deb^ Defcrrcd laves Other Total l~ab~llt~es E q u ~ iy
Total lrabil~t~es and eqult?
Sales Cost of saies Gross protit Operat~ng expenses Operat~ng profit Other expense\ ( ~ncotne) Profit before tax
A. Conzpur-utille Balance Slzc.c~ts(%)
S~I I I .L . ( ' : Kcl~rinlcd \vitll pel-mission, copyright Robert hlorris Associates 1999. Data adapted from the ALL SIZES column appearing in 1999 AIIMU(II S i ~ i f ~ ' 1 i 1 t ~ 1 7 1 . S i ~ ~ t i i c , \ . 1iMA cautions that thc studies be reprded only as a general guideline and not as an absolute industry norln. This is due to limited sam- ples thin catcgones. thc categorizatio~.i of colnpanies by their prilnary Standard Industrial Classification (SIC) number only, and different methods of c~pcsalicms companies u.ithin the sanlc industry. For these reasons, RhlA recommends that the figwres be used only as general guidelines in addition to other methods oi'financlnl analysis.
Comixon-size balance sheets and income statements provide such insight. Loolting at the common-size balance sheets in Exhibit 4-1, we immediately see that:
Takeda is the strongest financially, as its cash and short-term investments (marketable securities) of 41'20 of assets exceed total liabilities at 29% of assets. Long- and short- term debt conibined equal only 2% of assets compared with 27% and 3 1% for Pfizer and Roche, respectively. Takeda has cash and equivalents (net of all debt) equal to 39% of assets, Pfizer has debt (net of cash equivalents) of 4%. and Roche has net debt of 5% of assets.
Takeda also has the highest ratio (71%) of equity to total assets. Comparing Pfizer and Roche. we find the former reliss primarily on short-term debt whereas the latter's fi- nailcillg comes prinlarily from long-term debt.
Pfizer and Talteda have much higher accounts receivable than Roche.
COMMON-SIZE STATEMEhTS
Pfizer has the largest relative property in~~estment, at 26% of total assets, followed by Roche (20%)) and Takeda ( 17%). These differences may be due to either differences in depreciation rnethods or differences in the use oi' and the accounting for off-balance- sheet leasing.
Roche has the highest proportion of goodwill and intangible assets, suggesting that j t has been the most ac t~ve ofthe three companies in acquir~ng other companies (directly or pul-chasing their patents). Talceda's lack of such assets may either reflect a lacli of acquisition activity or be a reflection of Japanese GAAP concerning accounting for goodwill.
Takeda has the highest ratio of accounts payable.
Takeda has no deferred income taxes, reflecting the Japanese requiren~ent for confor- mity between tax and financial reporting.
Turning to the illcome statement, we find that:
Pfizer has the lowest ratio of cost of goods sold to sales at 16%. whereas Roche at 32% and Talceda at 52% are much higher.
Pfizer and Roche have the h~gliest ratios of selling expense to sales, mith Takeda's ratio far lower. Pfizer reports the highest investment 111 research and development ( 1 7% of sales), fol- lowed by Roche and Talteda.
Reflecting these differences, Pfizer has the highest income from operations (299'0 of sales), while Takeda and Iioche each report 177.0.
* Roche has the most significant "other income" ( 15% of sales). which in 1999 m7as due to Roche's sale of shares in Genentech. As a result, its pretax inco117e margin of 27% equals that of Pfizer.
As Takeda has a higher tax r@e than both Pfizer and Roche. its net income margin is 1 1%, barely half that of its tu70 competitors.
A number of factors can explain these differences in profitability components:
Japan, to solne extent, has price controls on its drug industry, limiting its profit margins.
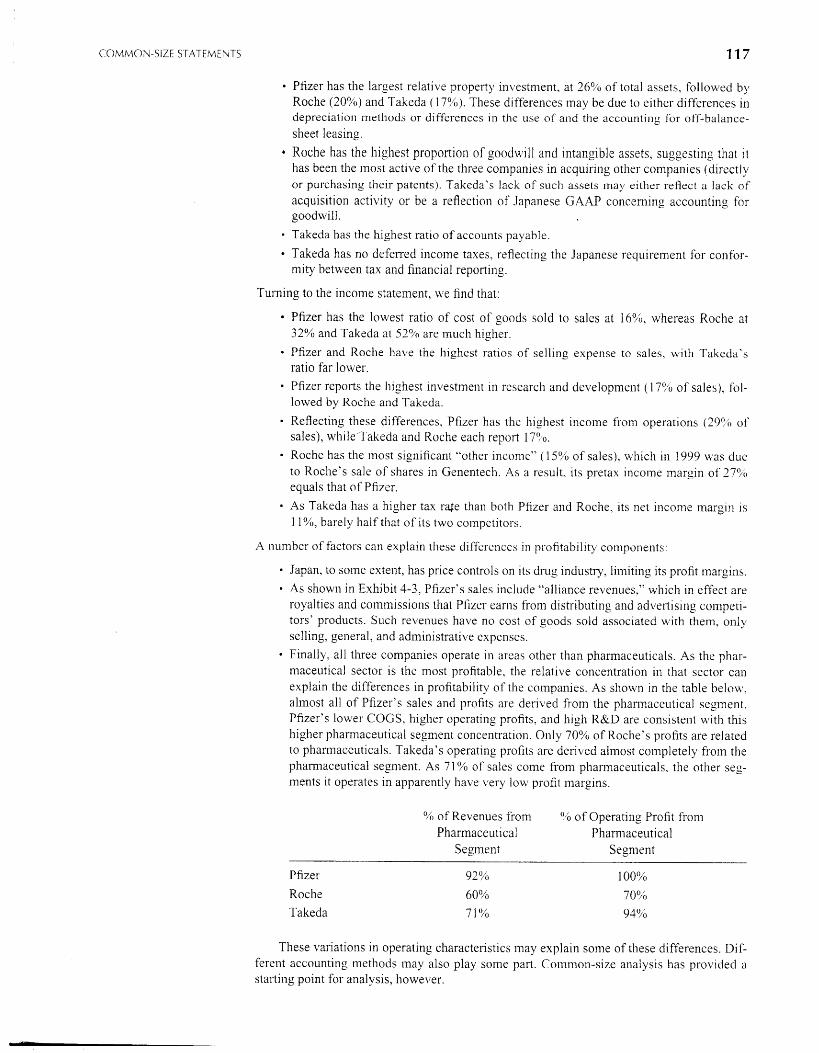
As shown in Exhibit 4-3. Pfizer's sales include "alliance revenues," which in effect are royalties and commissions that Pfizer earns fro111 distributing and advertising competi- tors' products. Such revenues have no cost of goods sold associated \+,it11 them, only selling, general, and administrative expenses. Finally. all three companies operate in areas other than pharmaceuticals. As the phar- nlaceutical sector is the most profitable, the relative concentration in that sector can explain the differences in profitability of the companies. As shown in the table below, allnost all of Pfizer's sales and profits are derived from the phannaceutical segment. Pfizer's lower COGS, higher operating profits. and high R&D are consistent with this higher pliarmaceutical segment concentration. Only 70% of Roche's profits are related to pharmaceuticals. Takeda's operating profits are derived almost conlpletely from the pharmaceutical segment. As 71 % of sales come from phalmaceuticals, the other seg- ments it operates in apparently have very low profit margins.
941 of Revenues from ?/o of Operating Profit from Pharmaceutical Phar~naceutical
Segment Segment
Pfizer
Roche
Takeda
These variations in operating cl~aracteristics may explain solne of these differences. Dif- ferent accounting methods inay also play some part. Common-size analysis has provided a starting point for analysis, however.
L H A P T t K 4 FOCINDATIOY5 O F RATIO AKD FINANC IAL ANAI-YSIS
lildustt-y C ~ r n p ~ ~ r i o n s . As noted. some o f the differences among the three firms niay reflect d i fkre l lces 111 the industry seglnents 111 which they operate. Industry compai-isons in Es l l~b i t 4-2 shovl that b a l a ~ ~ c e shect compositions d ~ f f e r ~ ' i d e l y . For example:
The two retailer categosics (groceries and depart men^ s t a -e s ) show ( a h would be cx- pected) the lo~ves t l c ~ e l s of receivables and highest inventory balances. Custonicrs
EXHIBIT 4-3. PFIZER 13C. AND SUBSIDIARY COMPAhIES Common-Si~e Income Statements ( 1 995-1 999)
1tur.s ElzCIL'd Decenzber 31
Net sales Al l la~~ce re\ enue\ l'otal sales C ost of sales Gross profit Sell~ng. ~nformrll~onal, and ad i -~ l l~ i i~ t r~~ t l \ i' e x j ~ e n s e ~ liescarcl~ and dcveloptnent expenses Other deduct~oni ( ~ n ~ w r n e ) . nct Operating I1?come I ntercst elrpen\e Inco117e before taxes Pro\ ision for taxes I nccvne from c o n t ~ n u ~ i ~ g operattoils
Net sales Allicinc.e re\ en im 'Total sales Cost of salzs GI-oss profit Selling. tnfor~natioi~al. and adm~nistrati\/e expenses Research and de\ elopmcnt expense\ Other deductions (~ncoiiie). nct Operat~ng Income Interest expense Income before taxes Pro\ 1sio11 for taxes 7 8 7 5 S
Incomc from contiiiulng operations 16 I8 19 14 20
.4 v "(: of' 1995 1e1.c.l (selected ~tern.s)
hct sales l'otal sale\ Cost of sales Gsos\ pi-ofit Sclllng. ~nforiiiat~onal. allti admln~~tra t i \ t : expenses Kescarcli and de\~elopment expenses
(J l l l C 0 1 1 1 ~ Operati n, liitere~t cxpcnst: Income befoi-e taxes Income from contiiiulng operation5
- - - - -
Sol,r.c,~r: Data from F'tizel- annual reports
DISCUSSION OF RATIOS B Y CAT EGORY 119
generally pay for purchases with cash (or with credit cards), keeping receivables leu,.
Inventories are relatively high, as custo~ners denland a variety of goods.
Paper mills report the highest fixed assets, reflecting large rciluired lnvestrnents in plants and natural resources.
The medicinal che~nicals sector (~rhich includes pharmaceuticals) and thc industrial chemicals sectors report the highest intangibles, probably due to patents and acquisi- tion intangibles.
Common-size income statements also delineate some critical income statement dif'fer- ences. Groceries show low gross margins and drugs tile highest, reflecting the econo~nic characteristics and cost structures of these industries. Groceries have the lowest operating profit margin, typical of a low-111ar~in. high-tui-never business. Medicinal chemicals have the highest operating margins, reflecting their high-research, patent-protected position.
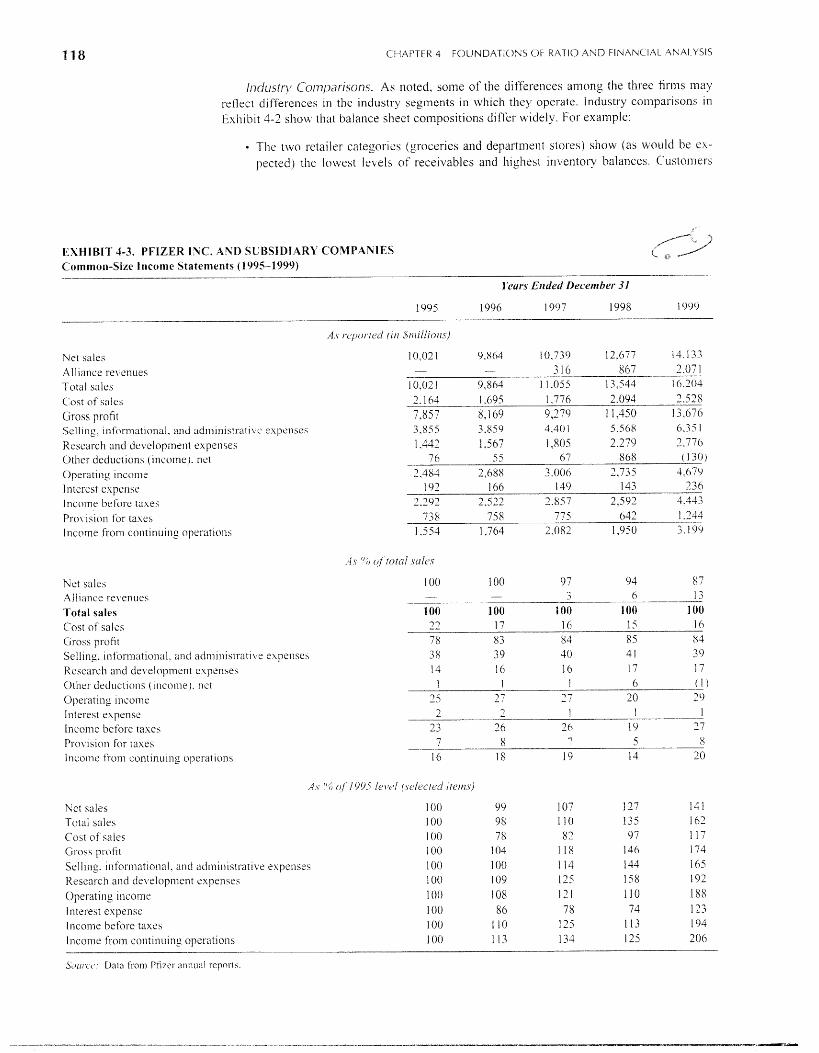
Conlparisons Over Tinie. Common-size statements can also be used to coinl?a~-u the performance of a s~ngle company over tirne. Exhibit 4-3 shows actual and common-size in- come statements for Pfizer o\ er the period 1995 to 1999. Sales in this exhibit are d~saggre- gated between regular. sales and alliance revenues described previously. Total sales i~~crtxased 60°4 from $10 to $16 billion, wit11 one-third of the increase conling from alliance revenues. Profits, on the other hand, increased 100% from $1.5 to o17er $3 billion. An examination of the components indicates that the increased profitability (relative to sales) is primarily due to efficiencies in cost of goods sold. -4s a percentage of sales. COGS decreased fro111 22% of sales in 1995 to 1690 of sales in 1999, whereas all other 11ne items iliaintai~led or inci.eascd their levels as a percentage of sales.
Exhibit 4-3 also illustrates the use of common-size statements for- trend rznalj.sis. A basc year is selected, 1995 in this case, and data for all subsequent years (1996-1994 for Phzer) are shown as percentages of base-year data. This stateinent confirms our previous findings. Relative to 1995, COGS increased by only 17%, whereas net sales ~ncreased by 4 l ?O and total sales increased 609'0. All other line items (except interest expense) ere\\ at least as fast as sales.
Changes in balance sheet and cash flow statement con~ponents can also be analyzed ()\el. time. For common-size cash flow statements, cash collectioris is the appropriate scaling factor-. The insights obtained fro111 the analysis of con~mon-size statements fiicilitate detailed analysis of the firm and comparative analysis of firms-issues discussed in the folloming sections.
QIISCUSSION OF RATIOS BY CATEGORY
The ratios presented here and their modes of calculation are neither e x h a u s r i ~ ~ nor- un~qucly "correct." The definition of many ratios is not standardized and nzay vary froin analyst to ana- lyst, textbook to textbook. and annual report to annual report. Not all such var~ations are Iogi- cal or usefill; we believe that the ratios presented in this book meet both of these criteria. "'
The analyst's primary focus should be the relationships indicated by the ratios, not the details of their calculation. As we proceed through this book, we will suggest many adjust- mei~ts to and inodifications of these basic ratios.
Activity Analysis
A firm's operating activities require investments in both short-term (~nventory and accounts receivable) and long-term (property, plant, and equipment) assets. Activity ratios describe the relationship between the firm's level of operations (usually defined as sales) and the as- sets needed to sustain operating activities.
"'ln t h ~ s chapter, when one of the components of the ratlo comes from the bala~icc sheet and tllc other tronl tile 111- collie or cash flow statement, the balancc sheet component 1s an avsrage of the beginn~ng and end~ng balances 411
exceptloll is the cash flow fro111 operations to debt ratlo. In psactlce, some analysts L I ~ C beg~nnlllg 01. cndlng b'llanccs for such m~xed ratios.
CHAPTER 4 F0UNDATIC)NS OF RATIO A N D FINANCIAL ANAL\IISIS
The hlgher the ratio. the more efficient the firm's operations, as relatively fewer as- sets are required to n~ailltain a given level of operatioils (sales). Trends in these ratios over time and in con~parison to other firms in the same industry can indicate potential de- ficiencies or opportunities. Furthern~ore, although these ratios do not lneasure profitabil- ity or l~quidlty directly. they are important factors affecting those performance ~ndlcators. For exainple, low inventory turn01 er results in lzigh carrylng costs that reduce profits and declining inventory turnover should also alert the analyst to an increased probability of falling de~nand.
Activity ratios can also be used to forecast a firnl's cap~tal requirements (both operating and long-tenn). Increases in sales will require investnlents in additional assets. Activity ra- tios enable the analyst to forecast these requirelne~lts and to assess the firm's ability to ac- quire the assets needed to sustaln the forecasted growth.
Short- Term (Operating) Activity Ratios
The ir.ll\>entol*j* trrrnover. rutio. defined as
Inventor!; Turnover = Cost of Goods Sold Average Inventor!.
measures the efficiency of the firnl's inventory management. A higher ratio indicates that in- irentory does not remain in warehouses or on the shelves but rather turns over rapidly from the time of acquisition to sale. This ratio is affected by the choice of accounting metl~od; an explanation and an adjusted ratio are discussed in Chapter 6.
The inverse of this ratio can be used to calculate the average number of days inventory is held until it is sold:"
365 Average No. Days Inventory In Stock = Inventory Turnover
The r-ecei~?nble.r tzir-tzovcr- r-utio and the n13e1.agc 71tlnlber q j dq-s c!J'r.ecei\?ahles outstand- irzg can be calculated similarly as
Sales Receivables Turnover = Average Trade ~eceivahl;
and
Average No. Days Receivables Outstanding Recei\,ables Turnover
The recei~rables tu~-no\~er ratios:
Measure the effectiveness of the firm's credit policies. Indicate the level of investment in receivables needed to maintain the firm's sales level.
Rccei\jubles rul.llo13er .~1'1oz11d be L ' o I ~ I ~ z ~ ~ ~ L I ' 11sil1,g O M ~ I J trade 1.ccc.ivnh1e.s in the l?tlnie~-ato~. i1i O I ' C I ' ~ ~ tc) c \~a lu~~te opel-atitlg ~ ? e l ~ f o ~ - ~ i ~ a r ~ c c . Receivables generated from financing (unless customer financing is pro~fided as a nolnnal conlponerlt of sales activities) and investment ac- tivities (e.g.. receivables fro111 the sale of an investment) should be excluded, as they do not represent normal recurring operating transactions. Adjustments may also be necessary if the fir111 has sold receivables during the period.12
or nianufacturing films. the conlputation is less straightforward. See the discussion in Box 3- 1 .
"see Chapter I 1 for a discussion of this issue.
DISCUSSICIN OF RATIOS B Y CATECOKY 121
The occortlzts yy\ul?le tzrrnol)el- i'utir, and ~zzrmher. qf 'dq) .~ yu~~ub les U I . ~ or~tLstundi~~g can be conlputed in a similar fashion as
Purchases13 Payables Turnover - Average Accounts Payable
and
Average Days Payables Outstanding = 365
Payables Turnover
Althougl~ accounts payable are liabilities rather than assets. their trend is significant as they represent an ilnportant source of financing for operating activities. The time spread be- tween when suppliers must be paid and when payment is received fiom custon~ers is critical for holesa sale and retail firms with their large inventory balances. The relationship aillong ac- counts payable, accounts receivable, and inventories will be seen shortly when we examine the operating and cash cycles.
The ~ '~l . / i l l lg ca/?it~I tur1loi9er rutio, defined as
Working Capita .I Turnover Sales Average Working Capital
is a sumn~ary ratio that reflects the alnoullt of operating capital needed to lnaii~triin a given level of sales. Only operating assets and liabilities should be used to compute this measure. Shol-t-term debt, marketable securities, and excess cash should be excluded, as they are not required for operating activities.
In Chapter 1 . wc discussed the going-concern assumption, a basic tenet of accrual ac- counting. The deferral of inventory cost until the item is sold and recognition of rcvenues prior to cash collection assulned that the inventories will be sold and the receivables collected.
Similarly. the use of operating capital as a proxy for cash flow (and liquidity-see the next section) is contingent on this assui21ption. The level and trends of turnover ratios pro- \.ide infornlation as to the validity of this assumption. Declining turnover ratios, indicating longer shelf time for inventory and/or slower collection of receivables, could be indicators of reduced demand for a firm's products or of sales to custoluers uil?ose ability to pay is less certain. This might signal one or more of the follom.ing:
The firm's income may be overstated because reserves are required for obsolete inven- tory or uncollectibie receivables.
Future productioil cutbaclcs may be required.
Potential liquidity problems may exist.
\;1;hen activity ratios decline, the statenlent of cash flows helps assess whether irlconle is overstated relative to cash collections. As will be discussed shortly, profitability and liquidity ratios can also improve our understandi~~g of the cause(s) of lower tul-nover ratios.
Long- Term (Investment) Activity Ratios
The,fi-~ed asset I Z I I - M O V ~ I ~ ratio measures the efficiency of (long-term) capital investment. The ratio. defined as
Fixed Assets Turnover = Sales
Average Fixed Assets
reflects the level of sales generated by investments in productive capacity. The level and trend of this ratio are affected by cllaracteristics of its components. First.
sales growth is continuous, albeit at varying rates. Increases in capacity to meet that sales
' '~urcl iases are computed as cost of good sold plus the change i n inventor).
CHAPTER 4 FOUNDATIONS OF RATIO AND FINANCIAL ANALYSIS
growth, however. are discrete, depending on the addition of new factories. warehouses, stores, and so forth. Col~lpoundillg this issue is the fact that management often has discretion over the timing. form, and financial reporting of the acquisition of incremental capacity.
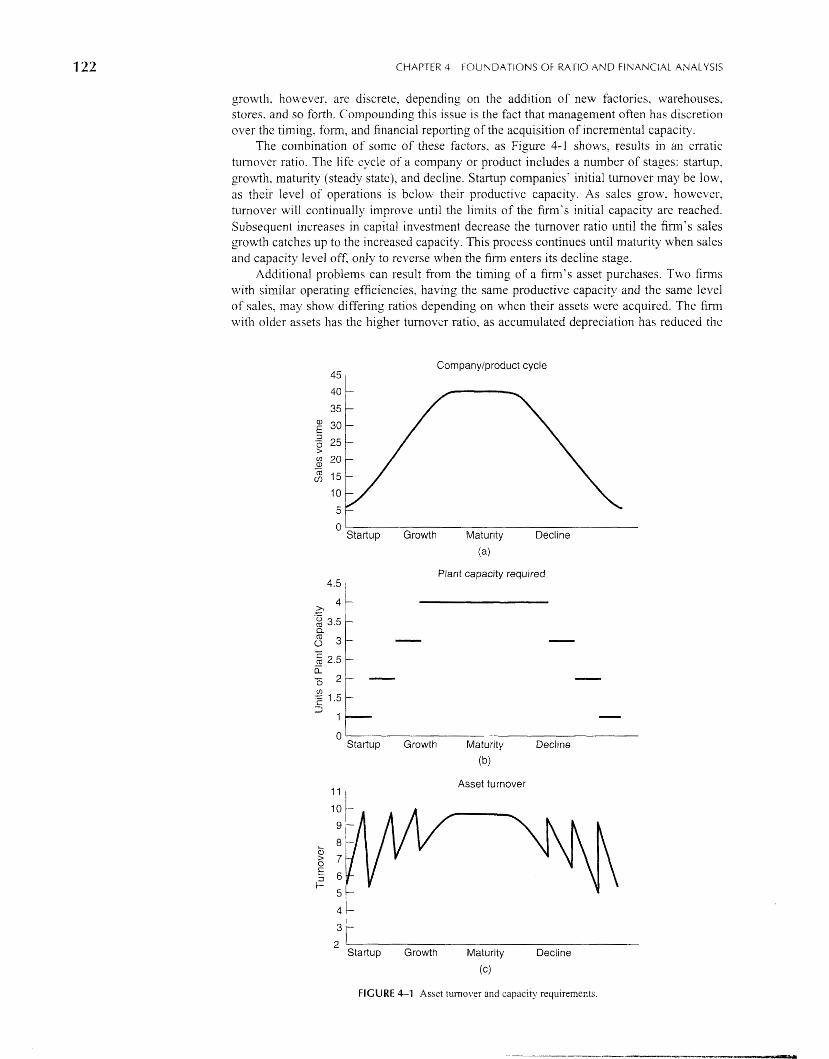
The combination of some of these factors, as Figure 4-1 shows, results in an erratic tun~o \~c r ratio. The life cycle of a company or product includes a number of stages: startup, growth. maturity (steady state). and decline. Startup companies' initial turnover may be low, as their level of operations is below their productive capacity. As sales grolv, however. turnoller will continually improve until the lin~its of the firm's initial capacity are reached. Subsequent increases in capital investment decrease the turnover ratio until the firnl's sales growth catches up to the increased capacity. This process continues ui~til maturity when sales and capacity level off. only to reverse when the f i m ~ enters its decline stage.
Additional problems can result from the timing of a firm's asset purchases. Two firms \nth similar operating efficiencies, having the same productive capacity and the same level of sales, ]nay show differing ratios depending on when their assets were acquired. The finn \wth oldcr assets has the higher turnover ratio, as accumulated depreciation has reduced the
Companylproduct cycle
0 Startup Growth Maturity Decline
Plant capacity required
4.5 I
0 Startup Growth Maturity Decline
(b)
Asset turnover I
:: 2 Startup Growth Maturity Decline
(c)
FIGURE 4-1 Asset tuinover and capacity requirements.
DISCUSSIC)N O F RATIOS B Y Ci-\TE(;ORY 123
carrying \~alue of its assets. Over time, for any firm, the accumulation of depreciation ex- pense improves the t ~ r n o \ ~ e r ratio (faster for firms that use accelerated depreciation methods or- sl~ort deprccjable lives) without a corresponding i~nprove~i~ent in actual effjcienc~~. The use of gross (before depreciation) rather than net fixed assets al le~iates this shortcoini~~g. However, this is rarely done in practice.
An offsetting and complicating factor is that newer assets generally operate more effi- ciently due to improved technology. Hourever, due to inflation, newer assets may be more expensive and thus decrease the turnover ratio. Using current or replacemeilt cost rather than historical cost to compute the turnover ratio is one solution to this problem. Finally. ~t should be noted that methods of acquisition (lease versus purchase) and subsequent financial report- ing choices (capitalizatioi~ versus operating lease reporting) also affect turnover ratios for otherivise similar firms. See Cllapter 1 1 for a discussion of these issues.
Toral a.vset tzrl-rzoller. is an overall activity measure relatillg sales to total assets:
Total Asset Turnover = Sales Average Total Assets
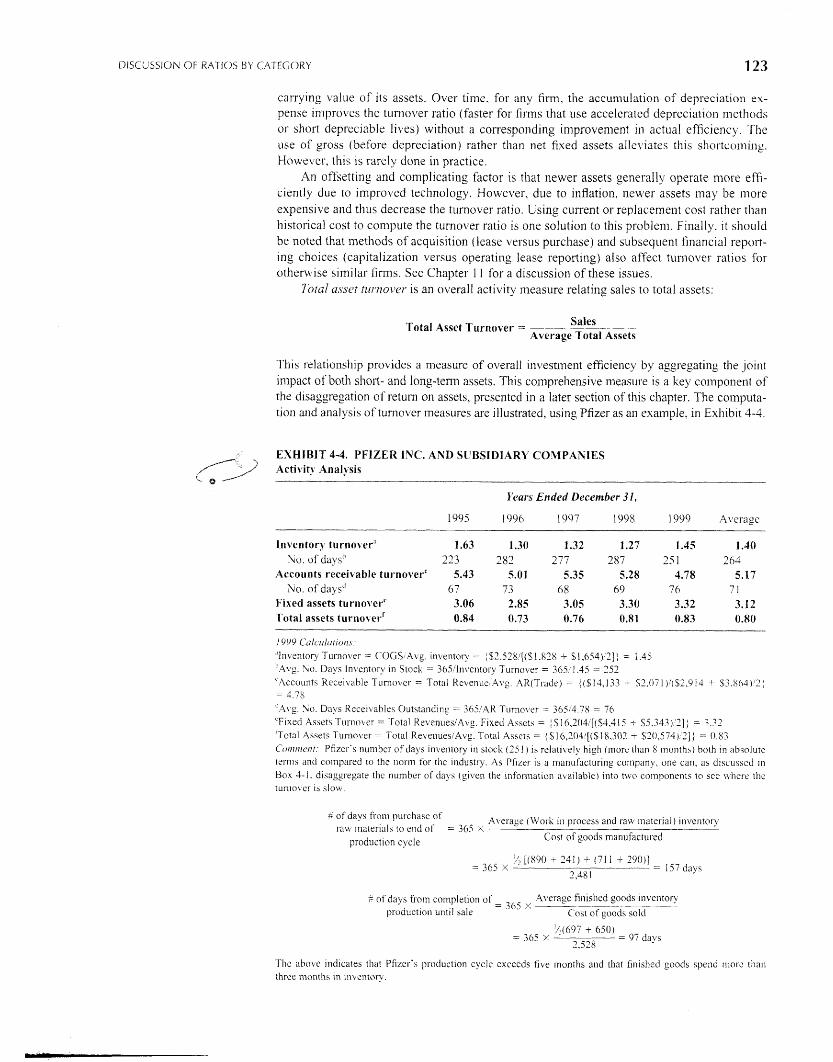
This relationship provides a measure of overall investment efficiency by aggregating the joint inipact of both short- and long-tenn assets. This comprehensive iileasure is a key component of the disaggregation of retun1 on assets, presented in a later section of this chapter. The computa- tion and analysis of turnover measures are illustrated, using Pfizer as an example, in Exhib~t 4-4.
EXHIBIT 4-4. PFIZER INC. AND SUBSIDlARY COh/lPANIES 2 .4ctivity -\nalysis
$'. * /"" Years Ended December 3 1,
1905 I996 1997 1098 1999 Average
Invcrmtoq. turnover" 1.63 1.30 1.32 1.27 1.45 I .40 Ku. of days" 223 282 277 287 25 1 263
Accounts receivable turnoverc 5.43 5.01 5.35 5.28 4.78 5.17 No. of days" 67 73 68 69 76 7 I
Fixed assets turno\'erC 3.06 2.85 3.05 3.30 3.32 3.12 Total assets turnover' 0.84 0.73 0.76 0.81 0.83 0.80
1999 Colcliltrrio11.r: "lnventor)~ Turiio\ler = COGS!tlvg. inventoi-y = i $2.528/[($1 .K2X + S1,654):'1] 1 = 1.45 ".4vg. ho. Days inventory in Stocl; = 365!lnventory Turnover = 365: 1.45 - 752 'Accounts Receivable Turnover = Total Revenuz:A\~g. AK(T1-ade) = /($14,133 + $2.07I)/(S;2.914 +- $?.803)':!; = 4.78 '',9\,g. No. Days Kccei\;ablrs Outstanding = 365!,4K Turnover = 365;4.78 = 76 'Fixctf Assets Turnover = Total RevenueslA\ig. Fixeci Assets = 1 % 1 (,.204/[(S4,4 1 i- 6,343), '2]; = 7.32 'Total Assets l ' ~~ lnover = Total Re\,enuesiAvg. Total Assets = S 16,2041[($18,307 T S20,574),7]) = 0.83 C'v,nincnt: Pfizer's nuniber of days inventory in stock (251 ) is reiati\,ely high (moi-e than S months) both in absolute tci-ms and compared to the norm for thc industry. A s Pfizcr is a manufacturing company. one can, as disci~sscd in Box 3-1. disaggregate the number of clays (given the infbnnation available) into t\vo components to scc \vJlere thc tun~o \c r is sIom1.
P of days fio111 purchase of A\ erage (Woi h in process and raw n ~ ~ t e n a l ) inventor!) ram mater~als to end of = 365 X ---------- - - - - - -
product~on cycle Cost of goods manufactured
',I [(890 - 741) + (71 1 r 290)] = 3 6 x - - 157 dayc
2,481
of days from completion of - Average fin~shed goods inventory
pruduct~os until sale - "" Cost of goods sold
'/2(697 + 650) = 365 x - = 97 days
2.528
I'hc above ~ndlcates that Pfizcr's product~on cycle exceeds five months and that finished goods spend Inore than three inonths In inventory.
124
Liquidity Analysis
CtiAT'TER 4 FOUNDATIONS OF RATIO AND FINANCIAL ANALYSIS
Short-tern? lenders and creditors (such as suppliers) must assess thc ability of a fin11 to meet its current obligations. That ability depends on the cash resources available as of the balance sheet date and the cash to be generated tlirough the operating cycIe of the firm.
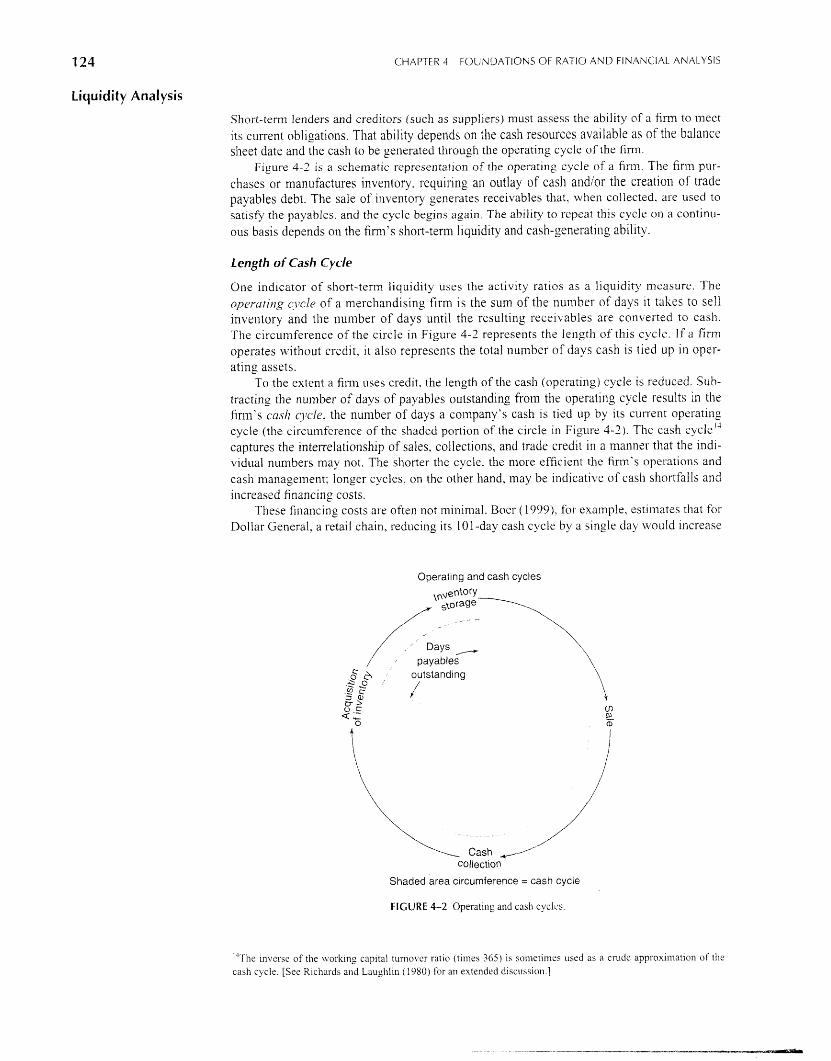
Figure 4-3 is a scl-iematic representatlo11 of the operating cycle of a fii-111. The firm pur- chases or manufactures inventory. requiring an outlay of cash andlor the creation of trade payables debt. The sale of inventory generates receivables that. wl~eil collected. are used to satisfy the payables. and the cycle begins again. The ability to repeat this cycle on a continu- ous basis depends on the fiml's short-term l~quidity and cash-generating ability.
Length of Cash Cycle
One indicatol- of short-term liquidity uses the activity ratios as a liquidity nleasure. The opercrri~lg c:~'cle of a merchandising firm is the sum of the nunlber of days ~t takes to sell inventoi-y and the number of days until the resulting receivables are converted to cash. The circumference of the circle 111 Figure 4-2 represents the ler~gtl-! of this cycle. If a firm operates vlithout credit. it also represents the total number of days cash is tied icp in oper- ating assets.
To the extent a fir111 uses credit. the length of the cash (operat~ng) cycle is reduced. Sub- tracting the number of days of payables outstanding from the operating cycle results in the firm's cusll qlcle, the number of days a company's cash is tied up by ~ t s current operating cycle (the circunlference of the shaded portion of the circle in Figure 4-2). The cash cycle" captures the interrelationship of sales, collections, and trade credit in a manner that the 1nd1- vidual numbers may not. The shorter the cycle. the more efficient the firm's operatlolls and cash management; longer cycles. on the other hand. may be indicative of cash shortfalls and increased financing costs.
These financing costs are often not minimal. Boer ( 1999). for example. estimates that for Dollar General. a retail chain, reducing its 101 -day cash cycle by a single day would increase
Operating and cash cycles
collection
Shaded area circumference = cash cycle
FIGURE 4-2 Operating and cash cycles.
'%e Inverse of the orki king capital tuiilo\ler ratlcl (times 365) IS sonletlmes used as a crude appsox1matlo1-7 of the ca4-7 C ) cle [See Kich;\~.ds and Laughlln ( 1980) for an extended d1sc~1ss1oi-7 ]
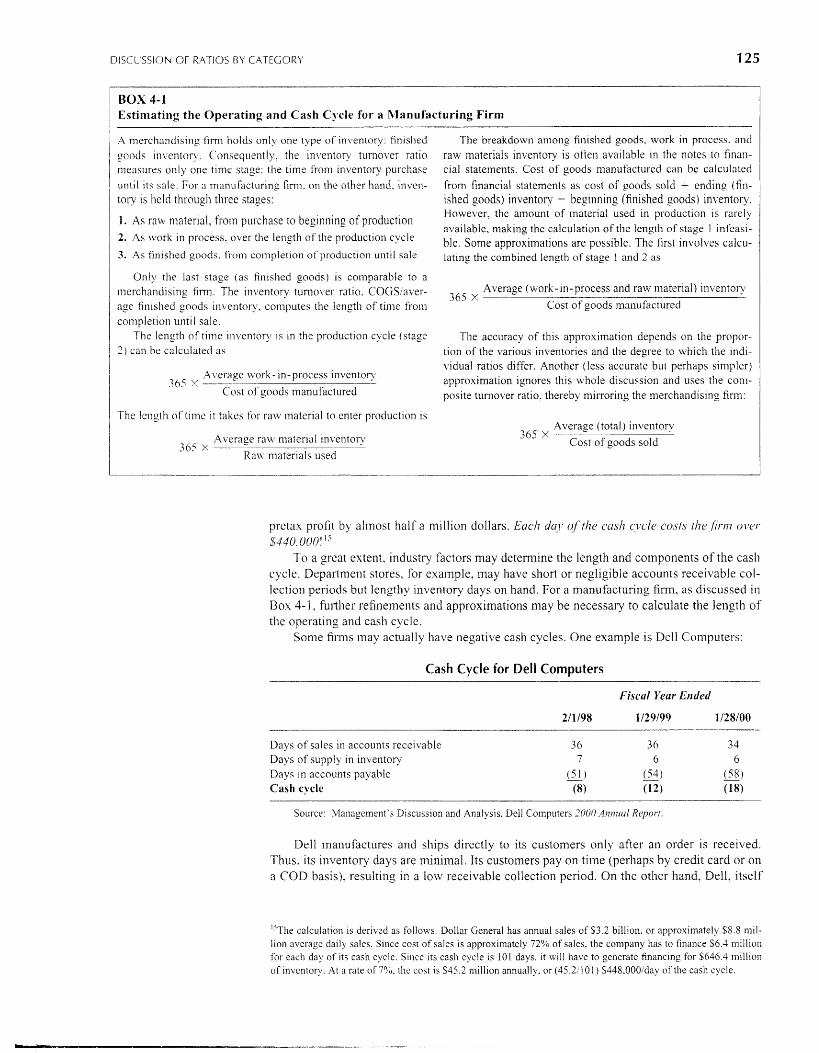
DISCLISSION OF RATIOS B Y CATEGORY 125
Source: Management's Dlscuss~on and Analysis, Dell Computers 2000.411nnul Report.
Dell lnanufactures and ships directly to its customers onl). after an order is received. Thus, its inventory days are minimal. Its custo~llers pay on time (perhaps by credit card or on a COD basis), resulting in a low receivable collection period. On the other hand, Dell. itself
"The calculation is derived as follows. Dollar General has annual sales of $3.2 billion, or approximately $8.5 111il- lion average daily sales. Since cost of sales is approximately 72% of sales, the company has to finance $6.3 million for each day of its cash cycle. Since its cash cycle is 101 days, it will have to gcneratc financing for $646.4 million of inventory. .At a rate of 7Y0, the cost is $45.2 illillion annually. or (45.2:101) $348.000iday of the cash cycle.
Ct-IAPTFII 4 FOIJl\ i l lATION< O F I IATIO AND FINANC'IAL ANALYSIS
EXHIBIT 3-5. AIJRORA FOODS Analysis of' Operating Cash Cycle
I n \ entory 111 stoclc Receivables outstanding Length of operating c?cle Less payablcs outstand~ng
I ,ength of cash cycle
.Sor/~.c r Data fi.0111 Aurora Food\ ;tnnual reports
(give11 its market poLber) can take it5 time in paying i t s wppl~ers. The net rccult is a negatibt. ca\h cycle.
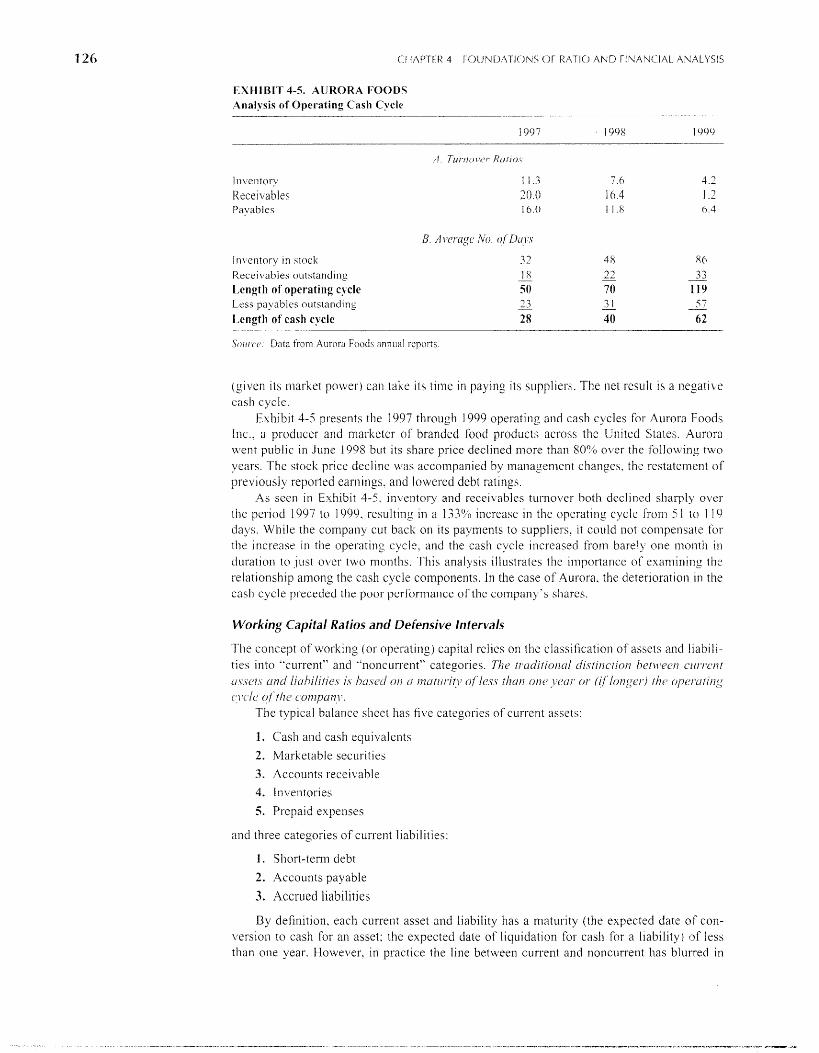
Exhibit 4-5 presents the 1997 through 1999 operating and cash cycles for Aurora Foods Inc.. a pl-oduccr and n~arkcter of branded food products across the Ln~ tcd States. Aurora vi7ent publ~c 11-1 June 1998 but its share price declined more than 80'6 over the follotvin, c r two years. The stock price decl~ne was accompanied by management changes, the restatement of previously reported earillngs. and lowered debt ratlngs.
As seen in Exhibit 4-5, 111telito1-y and rccer\ables turnover both declined slia~-ply over tile period 1997 to l(399, result~ng in a 1.33?0 increase in the operating cycle from 5 1 lo 1 19 days. While the company cut back on ~ t s payments to suppliers, it could not compensate for tlie illcrease in tlie operating cycle. and the cash cycle increased from bare') one nio11t11 ilk
duration to just ojrer two nionths. This analys~s illustrates the i~nportance of examini~lg the relationship among the cash cycle components. I11 the case of Aurora, the dcter~orat~on In the cash cycle 131-eceded the 13oor performance of tlie c o m p a ~ i ~ . ' ~ shares.
Working Capital Ratios and Defensive Intervals
Tlie concept of worlting (or operating) capital relies on the classificat~oii of assets and liabili- ties into "current" and '"noncurrent" categories. The 17-uditio~zcrl c/l.stinction hc7r11)ecn C Z I I - ~ - O I I ~
L I \ S C ~ . \ L U I ~ l i i~hi / i f ie~ is hatcc/ o/? (1 ~~zutr~r.itj. o f /c.ss //?a11 onc2 . ~ j c ~ u / - or (i/'/ongcir,) i j ? ~ 0]7e/vrli/1g (' \ ' I /C o/ '~/?c COM1,VUll\'.
7 he typ~cal balance sheet has five categories of'current assets:
1 . Cash and cash equivalents
2. Marl<etable securities
3. Accounts recei\rable 4. Inventories
5. Prepaid expenses
and three categories of current liabilities:
I . Short-term debt
2. Accounts payable
3. Accrued liabilities
By defil~ition. each current asset and liability has a maturity (the expected date of con- version to cash for an asset; the expected date of licluidatiori for cash for a liability) of less than o11c year. Howe\ier, in practice the line betm'een current and noncurrent has blurred in
DISCUSSION OF RATIOS B Y CATEGORY 127
recent years. Marketable securities and debt are particularIy susceptible to arbitrary classifi- catioii. For this reason, working capital ratios should be used urith caution.
Short-tenn liquidity analysis cornpares thc firm's cash resources with its cash obliga- tions. Conceptually, the ratios differ in whether 1c.vc.I~ (amounts shown on the balance sheet) or f i~tvs (cash inflow7 and outflows) are used to gauge the relationship per the following table:
Nuinerator Cash Resources
Denominator Cash Obligations
Level Current assets Current liabilities
Flow Cash flow fro111 operations Cash outflows for operations
Three ratios co~npare levels of cash resources wit11 current liabilities as the measure of cash obligations. The cur-rer~t ratio defines cash resources as all current assets:
Current Assets C u r re n t Ratio = ------- Current Liabilities
A inore conservative nleasure of liquidity is the qlrick ratio,
Cash + Marketable Securities + Accounts Receivable Quick Ratio = -- Current Liabilities
which excludes inventory and prepaid expenses from cash resources, recognizing that the conversion of inventory to cash is less certain both in tenns of timing and amount.'" and that prepaid expenses reflect past cash outflows rather than expected inflows. The included assets are "quick assets" because they can be quickly converted to cash.
Finally. the cash ratio, defined as
Cash + Marketable Securitig! Cash Ratio = Current Liabilities
is the most consen;ative of these nleasures of cash resources, as only actual cash and securi- ties easily convertible to cash are used to measure cash resources.
The use of either the current or quick ratio ilnplicitly assumes that the current assets will be converted to cash. I11 reality. however, finns do not actually liquidate their cursent assets to pay their cul-rent liabilities. Minimum levels of inventories and I-eceivables are always needed to lnaiiltain operations. If all current assets are liquidated, the fir111 has effectively ceased operations. As suggested earlier by Figure 4-2. the process of generating inventories. collecting receivables. and paying suppliers is ongoing. These ratios therefore measure the margin of safety provided by the cash resources relative to obligations rather than expected cash flows.
Liquidity analysis, moreover. is not independent of activity analysis. Poor receiv- ables or inventory turnover limits the usefulness of the current and quick ratios. Obsolete inventory or uncollectible receivables are unlikely to be sources of cash. Thus. levels and changes in short-term liquidity ratios over time should be examined in coi?junction with turnoker ratios.
The caslz flo~t>,fi-orn operariotzs ratio,
Cash Flow from Operations Cash Flow from Operations Ratio =
Current Liabilities
"'lnventorl; balances of actl~tely traded commod~t~es such as 011, ~nctals. or wheat call bc considered I ery llquld and s170uld bc included In the quick ratio
128 CHAPTER 3 FC)UNDATIC)NS OF RATIO A N D F I N A N C I A L ANALYSIS
EXHIBIT 4-6. PFIZEK IKC. AND SURSIDIARI' COMPANIES Liquidity Analysis
1'ear.s Ended Dece~~iber 3 I
A \ erage no. of days ~nventory 111 stochc' (p lus ) Days of r e c e ~ v a b l c s outstandung'
Length of operating cycle (minus) Payables ou t s t and~ng"
Length of cash cycle Current ratio" Qulch ratlo" Cash ratio' Cash fro111 operations ratlo' Defensi~e interval no. of da) sg
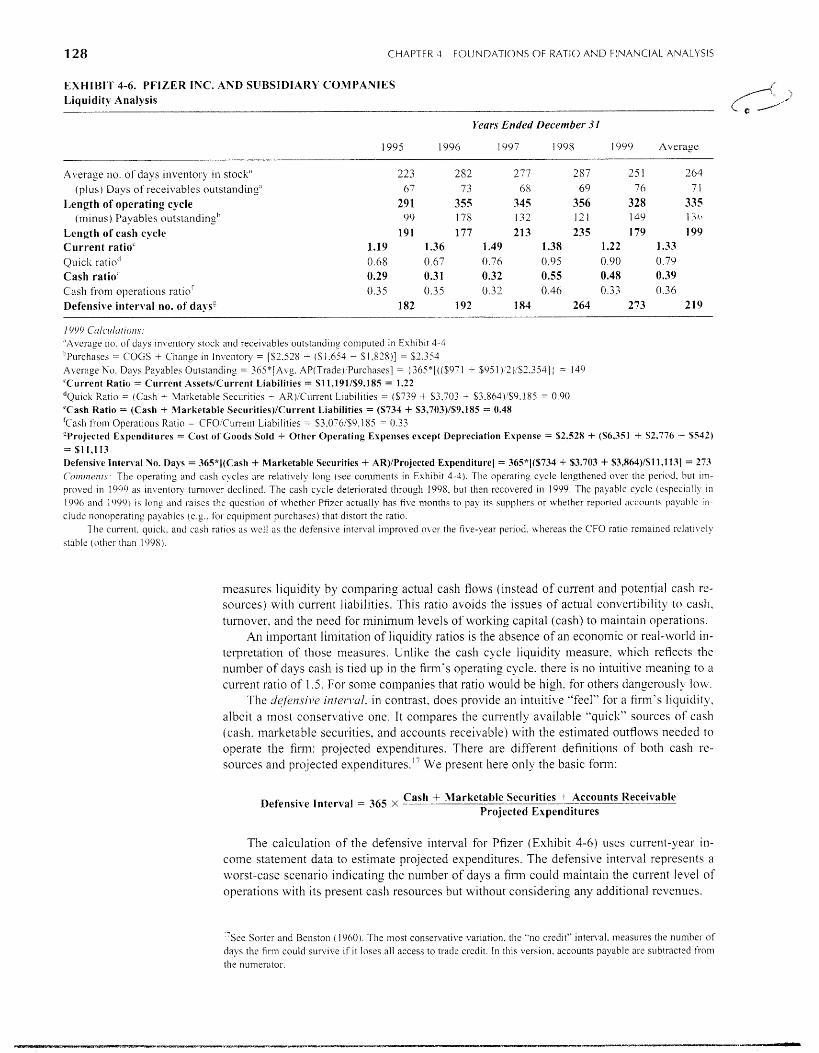
l YY Y C:~rlczrlurioil.v: "Average no. of days in\'entnry stock and receivables outstanding coniputed in Exhibit 4-4 h~urchases = COGS + Change in In\;cntol-y = [S2.528 A ($1.654 - $1,818)] = $2.354 A\ crage h;o. Days Payables Outstanding = 365"lAvg. AP(Trade);Purchasesl = :365*[(($97 1 + $95 1 ) ? )!S7.354] i = I49 'Current Ratio = CUI-rent Assets/Current Liabilities = $1 1,191/$9.185 = 1.22 *(>uicli Iiatio = (Cash - Marketable Securities - AR)!Ci~rrent Liabilities = (S739 + $3.703 + $3.864).'S9.185 = 0.90 'Cash Ratio = (Cash + .llarketable Securities)/Current Liabilities = (5734 + S3,703)/$9,185 = 0.48 ' ~ a s l ~ fi-om Operat jo~~s Ratio = CFO!Current Liabilities = S3.076i$C).1 85 = 0.33 :Projected Exprnditures = Cost ol'Goods Sold + Other Operating Expenses except Depreciation Expense = $2.528 + ($6.351 + $2,776 - $5.12) = $11,113 Defensive Inter\.al No. Days = 365*I(Cash + Marketable Securities + iiR)lProjected Expenditure/ = 365*1($734 + 53,703 + S3,864)/%11,113] = 273 ('011711ic~nrs: The operating and cash cycles are relatively 101ig (see comments in Exhibit 4-4). The operating cycle lengthened over the period, but im- proved In 1 9c)') as in\.entory turnover declined. The cash cycle deteriorated through 1998, but then recovered in 1999. The payable cycle (especially in 1996 and 1')99~ is long and raises the question of\rhcthcr Pfizcr actually has five months to pay its suppl~ers or m.hether reported accounts payablc in- clude nonoperatin:! payables (e.g.. lor cq~iipmrnt ~3urchases) that distort the ratio.
The current. quick. and cash ratios as \{]ell as the dej'cns~\.e interval impro\.ed obcr the five-year period. whereas the CFO ratio remaincd relati\ ely stable (other than 1998).
measures liquidity by comparing actual cash flows (instead of current and potential cash re- sources) with current liabilities. This ratio avoids the issues of actual con~e~~tibi l i t j . to cash, turnover, and the need for minimuin levels of working capital (cash) to maintain operations.
An important li~n~tation of liquidity ratios is the absence of an econo~nic or real-~vorld in- terpretation of those measures. Unlike the casli cycle liquidity measure. which reflects the number of days cash is tied up in tlie finu's operating cycle, there is 110 intuitive meaning to a current ratio of 1.5. For solme companies that ratio would be high. for others dangerously low.
The dqfeimi~v ii7fel-1-ul, in contrast, does provide an int t t i t i \~ "feel" for a fir~n's liquidity. albeit a most conservative one. It compares the currently available "quick" sources of cash (cash, marketable securities, and accounts receivable) with the estimated outflows needed to operate the firni: projected expenditures. There are different definitions of botli cash re- sources and projected expenditures." We present here only the basic form:
Cash + Marketable Securities + Accounts Receivable Defensive Interval = 365 X - Projected Expenditures
The calculation of tlre defensive interval for Pfizer (Exhibit 4-6) uses current-year in- come statement data to estimate pro-jected expenditures. The defensive interval represents a worst-case scenario indicating tlie number of days a fin11 could maintain the current level of operations with its present cash resources but without considering any additional revenues.
7 ~ e e Sostcr and Benston ( 1960) The most conservative var~at~on. the "no crcdit" ~nten.al, measures the number of days the fir111 could survlve if it loses all access to tradc cred~t. In t111s verslon. accounts payable arc subtracted from the numerator.
DISCUSSION OF RATIOS B Y CATEGORY 129
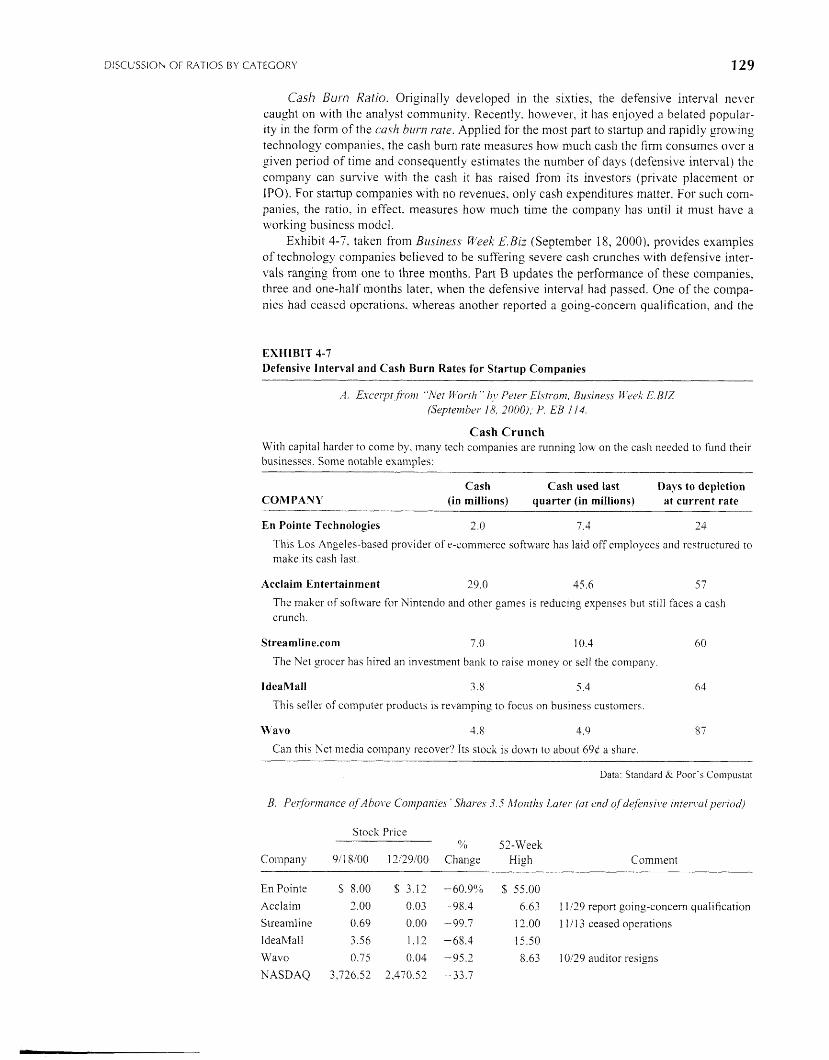
Cash Burn Ratio. Originally developed in the sixties, the defensive interval never caugl~t on with the analyst community. Recently, however, it has enjoyed a belated popular- ity in the fonn of the clrslz h11177 m e . Applied for the most part to startup and rapidly grovl-ing technology companies, the cash burn rate measures how niuch cash the finn consul-nes over- a given period of time and consequently estinlates the number of days (defensive interval) the company can survive with the cash it has raised from its investors (private placen~ent 01- IPO). For sta~qup companies with no revenues, only cash expenditures matter. For such corn- panies, the ratio. in effect, measures how n~uch time the conlpany has until it must have a working business nlodel.
Exhib~t 4-7. taken from Bzrsitless Week E. Biz (September 18, 2000), provides exa~l~ples of technology companies believed to be suffering severe cash crunches uith defensive inter- vals ranging fro117 one to three months. Part B updates the performance of these companies, three and one-half months later, when the defensive interval had passed. One of the coinpa- nies had ceased operations, whereas another reported a going-concern qualjfication, and the
EXHIBIT 4-7 Defensive Interval and Cash Burn Rates tbr Startup Companies
A. Exccrpr fron~ "Net Fl'orih " I?!. Peter. Elslrom. Bu.riness W'ecX E.BIZ (Septernbor 18, 21)00), P. EB 114.
Cash Crunch With capital harder to coine by, rnaily tech conipanies arc sunning low on the cash needed to fund their businesses. Some notable examples:
Cash Cash used last Days to depletion COMPANY (in millions) quarter (in miilions) at current rate
En Pointe Technologies 2.0 7.4 23
This Los Angelcs-based provider of e-commerce software has laid off crnployees and restructured to rllake ~ t s cash last.
Acclaim Entertainment 29.0 45.6 5 7
The malter of software for Nintendo and other games is reducing expe~~ses but still faces a cash crunch.
The Yet grocer has hired an investment bank to raise nioney or sell the company
This seller of cornputer products is re\/ainping to focus 011 business customers.
M'avo 1 .8 4.9 87
Can this Net inedia co~npany recover? Its stock is doum to about 69d a share.
Data: Standard & Poor's Cornpustat
B. Ptcrfon~lu~~ce c!f .4hol'e Coinparz~c.~ ' Shnros 3 3 hlorztlz~ Later. (cxt end of de f i~zc l~v 111ter~1~ul~~cri0~1)
Stock Price O/b 52-Week
Company 1 8 0 0 12/29/00 Change High Comment
En Pointe S 8.00 S 3.12 -60.9(?0 S 55.00
Acclaim 3.00 0.03 -98.4 6.63 11 129 report going-concer~~ qualification
Streamline 0.69 0.00 -99.7 1 2.00 1 1 / 1 3 ceased operatioils
ldeaMall 3.56 1.12 -68.3 15.50
M7avo 0.75 0.04 -95.2 8.63 10/29 auditor resigns
NASDAQ 3,726.52 2,470.52 -33.7
CHAPTER 4 FOUNDATIONS OF RATIO AND FINANCIAL ANALYSIS
auditor of a third had resigned. All the companies suffered declines 111 their stocli price rang- ing from 60°/b to nearly 10090. The NASDAQ index fell by one-third during the same period, undoubtedlj. contributing to these declines but not fully explaining their severity.
Long-Term Debf and Solvency Analysis
The analysis of a firm's capital structure is essential to evaluate its long-term rish and re- turn prospects. Leveraged firnis accrue excess returns to their sharellolders as long as the rate of return on the investments financed by debt is greater than the cost of debt. The ben- efits of financial leverage bring additional risks, however, in the form of fixed costs that adversely affect profitability (see the next section) if demand or profit nlargins decline. Moreover. the priority of interest and debt claims can have a severe negative impact on a firm when adversity strikes. The inability to meet these obligations can lead to default and possible banlcruptc~..
Debf Covenan fs
To protect themseltes, creditors often impose restrictions on the borrowing company's abil- ity to incur additional debt and make dividend payments. These debt co~~e~zcr~zts are often based 011 working capital, cuinulative profitability. and net worth. It is, therefore, important to monitor the firm to ensure that ratios co~~ip ly with levels specified in the debt agreements. \'iolations of debt covenants are frequently an "event of default" under loan agreements, making the debt due immediately. N'hen coveilailts are violated, therefore, bo~rowers must either repay the debt (not usually possible) or obtain waivers from lenders. Such waivers often require additional collateral, restrictions on fir111 operations. or higher interest rates.'"
Capifalizafion Table and Debf Ratios
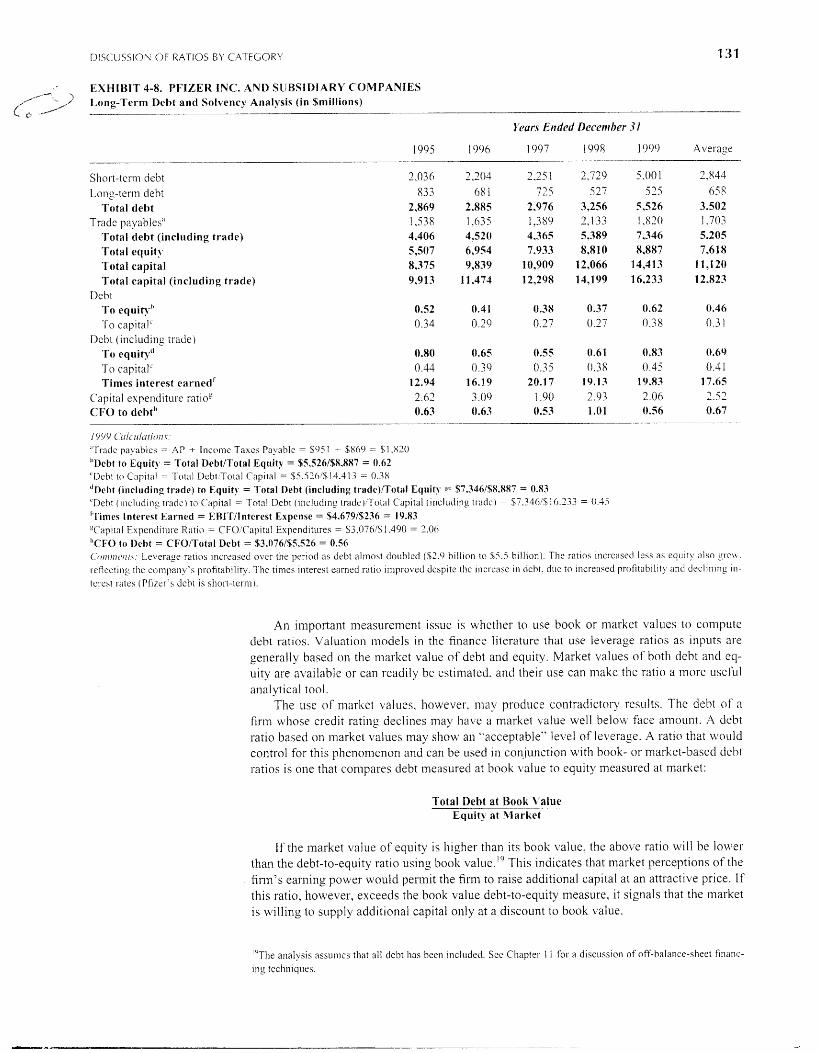
Long-term debt and solvency analysis evaluates the level of risk borne by a firm. cha~iges over time, and risk relative to comparable investlnents. A higher proportion of debt relative t o equity increases the risltiness of the firm. Exhibit 4-8 presents capitalization tables for Pfizer. Two ilnpoi-tant factors should be noted:
1. The relative debt levels themselves.
2. The trend over time in the proportion of debt to equity
Debt ratios are expressed either as
Total Debt (Current + Long-Term) Debt to Total Capital = --
Total Capital (Debt + Equity)
Total Debt Debt to Equity = --7 Total Equity
'The definition of shoi-t-te1-111 debt used in practice may include operating debt (accounts payable and accrued liabilities). The short-term debt shown in Exhibi14-8 excludes operating debt because it is a function of the fir~ii's operatiol~s and its essential business and colitractual relatioilship to its suppliers rather than external lenders. However, many lenders define debt as equal to total liabilities.
As with other ratios, industry and economywide factors affect both the level of debt aiid the nature of the debt (maturities and variable or fixed rate). Capital-intensi\.e industries tend to incur high levels of debt to finance their property, plant, and equipment. Such debt should be long-tenn to match the long time horizon of the assets acquired.
"The rclatlonship between debt cove~~a i~ t s and ratios is cxplored in greater detail ln Chapter 10
DISCl!SSl(lh O F RATIOS B Y C'ATFGORY
EXHIBIT 4-8. I'FIZEK INC. AVD Sl lBSlDl ARY COMPANIES I-
,----- . ;j Long-Term Dcbt and Solvency Analysis (in $millions)
( #-----,/
Y ~ u r s Ended Dcccnther 3 1
1995 1906 1 907 1998 1909 Average
Shot-t-ten11 debt Long-ten11 debt
Total deht Tsadc payables"
'Total debt (including trade) Total equity Total capital Total capital (including trade)
Debt '1-0 equityh -Po cap~tal'
Dcbt (including trade) To equity'' .Po capital' Times interest earned'
Capital cxpentlitiu-e ratlop CFO to debth
1 Y!/Y ( ' ~ 1 1 ~ 1 4 / ~ 1 1 0 1 / ~ ~ . .$.]-,. j ac c payablcs = AP + Incomc Taxcs Payable = $95 1 - S869 = $1,820 "l)cbt to Equity = 'fotal DrbtITotal Equity = $5,526/$8,887 = 0.62 'Dcbt to Capital = 7 otai I)cht'Total Capital = $5.530~$14.413 = 0.38 " ~ c h t (including trade) to Equit! = Total Debt (including trade)/Total Equity = $7.346/S8.887 = 0.83 '1)cbt (includilig trade) to C';tpital = Totit1 Debt (inclt~ding 1radc)'Total Capital (inclutfing trade, = S7.34(7!$16.?3? = 0.35 I'~imrs Interest Earned = ERITilnterest Expense = $4.679/$236 = 19.83 V~al-7ilal Expencliture 1i;itio = C'F;O!C'apit;ll Espenditltres = $3.07hiS1.490 = 1.00 "CFO to Ilcbt = CFOITotal Dcbt = $3,076/S5.526 = (1.56 C o n ~ n l c ~ ~ ~ l . ~ : Leverage ratios incl-cnscd over the period as debt almost doubled ($2.0 billion to S5 .5 billion). Tlie ratios increased less as t ' (1~1i t~ ~ I S O g 1 . c ~ . I-eflecting the compaiiy's profitability. 'I'he times interest earned ratio irnp~-o\~cd dcspite the Increase i i ~ deht. due to increased profitability and declining In- tel-cst rates (Pfircr's debt is shol-t-tcrmr.
An important measurement Issue is u hether to use book or market values to compute debt ratios. Valuation models in the finance literature that use leverage ratios as ~nputs ar-e generally based 011 the niarltet value of debt and equity. Market values of both debt and eq- uity are available or can readily be estimated, and their use can make the ratlo a iliore useful aria1 ytical tool.
The use of market values, however. may produce contradictory results. The debt of a firm wllose credit rating declines liiay hale a market value well belom facc a~i~oiunt. A debt ratio based on market values nlay show an "acceptable" lel~el of l e ~ el-age. A ratlo that would control for this phenome~ion and can be used 111 conjunction with hook- or market-based del~t ratios is one that compares debt 11ieasured at booli value to equity ~~ieasured at ~ ~ i a r l ~ e t :
Total Debt at Rook \'slue Equity at l larket
If the market value of equity is higher tlian its book value. the abo\;e ratio will be lower than the debt-to-equity ratio using book value.'' This indicates that market perceptions of the fi1311's earning power would perillit the fir111 to raise additional capital at an attractive price. If this ratio, however, exceeds the book value debt-to-equity measure, it signals that the market is willing to supply additional capital only at a discount to book l1alue.
!"The analysis assumes that all debt has been included. See Chapter I 1 f ~ r a discussion of off-balance-sheet financ- ing techniques.
CHAPTER 4 FOUNDATIONS O F RATIO A N D FINANCIAL ANALYSIS
The nieasurenie~~t of debt and equity used to co~iipute leverage ratios may require ad- justments to reported data. Leases (whether capitalized or operating), other off-balance-sheet transactions such as contractual obligations not accorded accounting recognition. deferred taxes. financial instruments with debt and equity characteristics. and other innovative financ- 11111 techniques must all be considered ivlien making these calculations. These issues are dis- cussed 111 later chapters.
Interest Coverage Ra fios
Debt-to-equity ratios exalnine the finn's capital structure and, indirectly. ~ t s ability to meet cur- rent debt obligations. A rnore direct measure of the fi1111's ability to meet interest paynients is
Earnings Before interest and Taxes (EBIT) Times Interest Earned = Interest Expense
This ratio, often referred to as the iilte7'est coverage ratio. ineasures the protection available to creditors a5 the e ~ t e n t to which earnings available for interest coker interest expense.'" A nlore comprehensive measure. the fzied cl~ar*gc~ co~jei-age ratio. includes all fixed charges.
Earnings Before Fixed Charges and Taxes Fixed Charge Coverage -
Fixed Charges
u+~ere fixed charges include contractually conilnitted interest and principal payments on leases as well as funded debt.
This coverage ratio niay also be computed using adjusted operating cash flours (cash from ol3erations - fiked charges + tas payments) as the numerator:
Adjusted Operating Cash Flolqr Times Intcrest Earned (Cash Basis) =
Interest Expense
Adjusted Operating Cash Flow Fixed Charge Coverage Ratio (Cash Basis) = -- --
Fixed Charges
Capital Expenditure and CFO-to-Debt Ratios
A fin11's long-tcm~ sol~cncy is a function of its ability to:
Finance the replacement and expansion of its investment in productive capacity. as well as
Generate cash for debt repayment.
Cash flows generated intennally are needed for in\ estment as well as debt service. The cover- age ratios discussed do not take this into consideration. Cash flow fl-om operations, as noted in Chapter 3, ignores the cost of additions to operating capacity. Net income. with its provi- sion for depreciation, amortizes the original cost of existing fixed assets. However, given their relati\.ely long service life, the rcplace~nent costs of these assets (even with illiili~nal in- flation) Inay be significantly h~gher. and historical cost depreciation cannot adequately pro- vide for their replacement." Neither net income nor cash from operations, of course, nlaltes any provision for the capital required for growth.
The capital esl7e77dit1rr-c ~-ulio
Cash from Operations (CFO) Capital Expenditure Ratio = -- Capital Expenditures
' "~ccause firms niay capitalize some interest expense, using reported interest expense may overstate the coverage ratio. See Chapter 7 for a discussioti of capitalized interest and adjustments to co\~erage ratios.
"see Chapter 8 for ;I discussio~i of these issues.
DISCUSSION OF RATIOS BY CATEGORY 133
measures the relationship between the firin's cash-generating ability arid ~ t s iii\~cstmciit ex- penditures. To the extent the ratio exceeds 1 , it indicates 111e f i m ~ has cash left fix- debt repay- ment or dividends after capital expenditures.
The CFO-to-debt ratio''
CFO CFO to Debt = Total Debt
measures the coverage of principal repayllient requireme~its by the current CFO. A low CFO-to-debt ratio could signal a long-tern1 solvency problem, as the finn does not generate enough cash internally to repay its debt. Exhibit 4-8 shows the con~putatio~i and intcrpreta- tion of long-term debt and solvency n~easurements for Pfizer.
Prof itability Analysis
Equity investors are concenied with the firm's ability to generate, sustain. and increase prof- its. Profitability can be ~neasured in several differing but interrelated diniensions. First, there is the relationship of a firm's profits to sales. that is, the residual return to the finn per sales dollar. Another measure, returx on investment (ROI), relates profits to the investment re- quired to generate them. We briefly define these ratios and then elaborate oil thcir use in fi- llalicial statement analysis.
Return on Sales
One measure of profitability is the relationship between the firm's costs and its sales. The ability to control costs in relation to revenues enhances earnings power. A corninon-size iii- come statement shows the ratio of each cost component to sales. In addition, six sum111a1-y ]-a- tios measure the relationship between different measures of profitability and sales:
1. The gross (profit) ?17a;;oifi captures the relatioiisli~p bet\veen sales and n~anufacturing or merchandising costs:
Gross Profit Gross Margin = Sales
2. The oper.ating ruargir?, calculated as
Operating Income Operating Margin = --
Sales
pro\rides information about a firm's profitabilitv from the operations of its core busi- ness, excluding the effects of:
Investments (income from affiliates or asset sales)
* Financing (interest expense)
Tax position
3. A profit margin measure that is independent of both the firm's financing and tax posi- tion is the
EBhT Margin Before interest and Tax = - Sales
4. The pretax margin is calculated after financing costs (interest) but prior to income taxes:
Earnings Before Tax (EBT) Pretax Margin = - Sales
?he definition of debt niql depend on the objective of the analysis. It sliould include all short- and long-term debt and may include trade debt.
CHAPTER 4 FOUNDATIONS OF RATIO AND FINANCIAL ANAL-YSIS
5. Finally, the overall profit 111argir-1 is net of all expenses:
Net Income Profit Margin = Sales
The five ratios listed above can be coinp~~ted directly from a fir111's financial statements.
6. Another useful profitability measure is the contribution lnargin ratio, defined as
Contribution Contribution Margin = Sales
where Contribution = Sales - Variable costs.
T l ~ e contribution margin ratio, however, cannot be computed directly from a film's fi- nancial statements as the breakdo~zr1.l betweell fixed and variable costs is rarely provided.
Return on Investment
Return on investment (R01) measures the relationship between profits and the in\ estrnent rc- quired to generate them. Diverse measures of that investment result in different f o r t ~ ~ s ofR01.
Return 017 Assets. The return on assets (ROA) compares income with total assets (equi~calently, total liabilities and equity capital). It can be interpreted in two ways. First, it measures management's ability and efficiency in using the fir1-n'~ assets to generate (operat- ing) profits. Second, it reports the total return accruing to all providers of capital (debt and equity). lndependent of the source of capital.
The return is measured by net income prior to the cost of financing and is conlputed by 11
adding back (after-tax) interest expense to net income:-'
ROA = Net Income - After-Tax Interest Cost
Average Total Assets
ROA can also be computed on a pretax basis using ERJT as the return measure. This re- sults in a ROT measure that is unaffected by differences in a film's tax position as wcll as fi- nancial policy:
Earnings Before Interest and Taxes (EBIT) R 0 , 4 =
Average Total .4ssets
In practice, however. the ROA measure is sometimes computed using either net in- coine or EBT as the numel-atoi-. Such postinterest ROI ratios make leveraged firms appear less profitable by charging earnings for payments (interest) to some capital providers (lenders) but not others (stockholders). Preinterest R01 ratios. in contrast, facilitate thc comparison of firms uritli different degrees of leverage. Therefore, ROi ratios thtrt t ~ s c total cls.s.cts ill the denor711'1mtor. shot~lu' r r l ~ ~ ~ j ' s irzclude totczl eur.nirig-s bejorc interest i17 the rl~/nler.ator.. '4s i~ltere.rt is tax deu'zlctihlt., post-tax profir nlcasures slzould add back net-of: tax interest yuj.nzel1t.s.
Retnrn on Total Capital. One particularly useful ROI measure is the ~.etur.~~ o1.1 total c*uj)ital (ROTC). This ratio uses the sunl of e.-\-ternal debt and equity instead of total assets as the base against which the film's return is measured. ROTC measures profitability relative to all (nontrade) capital providers.
he after-tax interest cost i s calculated by niultiplying the interest cost by ( 1 - t ) , where t is the film's marginal tau ratc.
DISCUSSIC)N OF RATIOS BY CATEGORY 135
Return can be measured either (pretax) by EBTT or (after tax) by net income plus after- tax interest:"
ROTC = EBlT
Average (Total Debt + Stockholders' Equity)
Net Income + After-Tax Interest Expense ROTC =
Average (Total Debt + Stockholders' Equity)
Return 017 Equity. The return on total stockholders' equity (ROE) excludes debt in the deno~~~inator and uses either pretax income (qjter. interest costs) or net Income:
Pretax Income ROE = - Average Stockholders' Equity
ROE = Net Income
Average Stockholders' Equity
For companies with preferred equity, another RO1 measure focuses on the return accru- ing to the residual owners of the finn--cormnon shareholders:
Return on Common Equity (KOCE) = Net Income - Preferred Dividends
Average Common Equity,
The relationship between KOA and ROE reflects the firm's capital structure. As shown 111 Exhibit 4-9, creditors and shareholders provide the capital needed by the fin11 to acquire the assets used in the business. In return, they receive their share of the firm's profits.
KOA (and ROTC) measure retuins to all providers of capital. ROE measures returns to the firm's shareliolders and is calculated after deducting the returns paid to creditors (inter- est). The equity shareholder can earn higher returns by "leveraging" the investment provided by the debt holders as long as the returns earned by the company's assets (ROA) are greater than the cost of debt.
Profifability and Cask Flows
Profitability ratios traditionally use accrual-based income measures, as shown for Pfizer in Exhibit 4-1 0. Cash flow analogues for these ratios should also be calculated. Examples in- clude cash gross margin (cash collections less cash paid for inputs) and ROT measures using CFO in the nuinerator (either before or after interest. depending on the denominator). A di- rect method cash flow statement is required for ratios such as cash gross margin and operat- ing margin. There is enlpirical evidence that sucli cash-flow-based ratios have different properties from traditional profitability measures."
Operating and Financial Leverage
Profitability ratios imply that profits are proportional to sales, which may misstate the true re- lationship among sales, costs, and profits. Generally, a doubling of sales would be expected to double income only if all expenses were variable. Conceptually, expenses can be classified
"AS In tile case of ROA, preinterest llleasures of profitability should be used to co~~lpute ROTC. as total capital 111- cludes debt obligations.
"See the discuss~oll of Go~nbola and Ketz (1983) that follows.
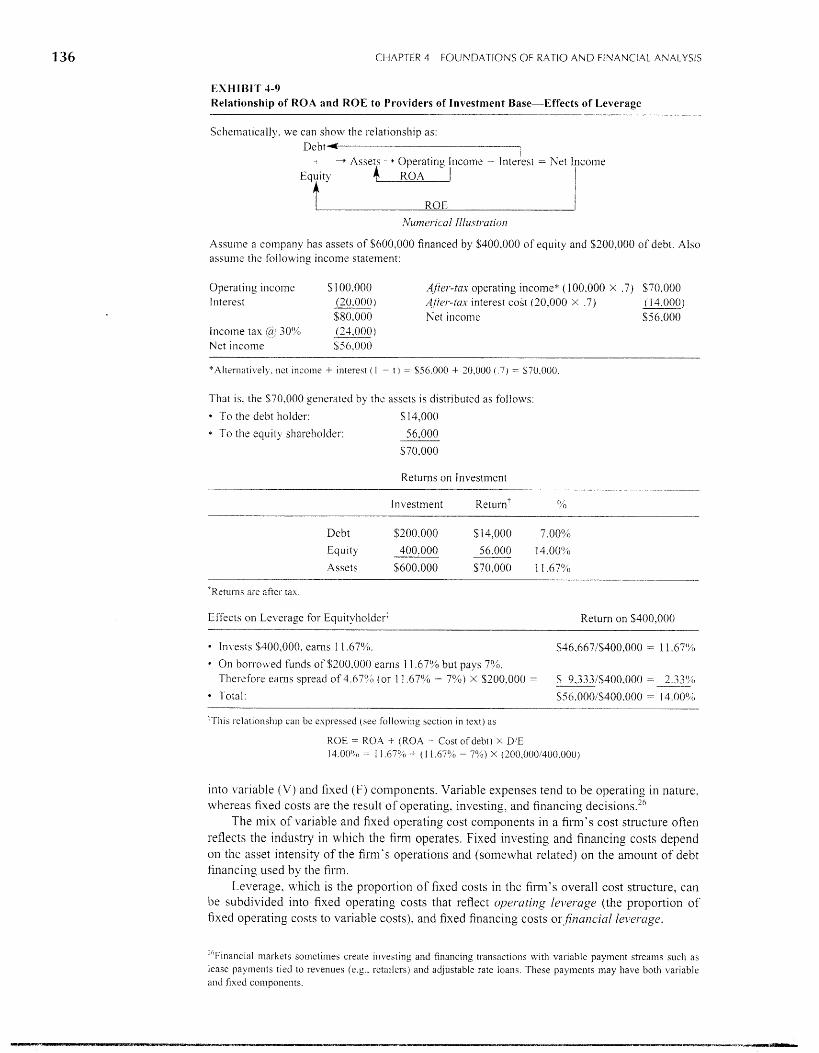
CHAPTER 4 FOUNDATIONS OF RATIO AND FINANCIAL ANAILYSIS
EXHIBIT 3-9 Relationstlip of' ROA and ROE to Providers of Investment Base-Effects of Level-age
Sclieniat~cally, we can show the rela~ionsliip as:
- + Assets --+ Operating Income - lnteiest = Net 111come Equity 4 ROA I
Assume a coinpany has assets of $600.000 financed by $400.000 of equity and $200,000 of debt. Also assume the f o l l o ~ ~ n g income statement:
Operat~ng income $100,000 Alter--tnx operat~ng income* (100.000 X .7) $70.000 Interest (20.000 j Attcr-trm lntercst cost (20.000 X .7) ( 14.000)
$80.000 Ket income $56,000 Income t a ~ G! 30°4 (23.000) Nct income $56.000
"Al t r rna t~~ el). nct Income + ~ntercst i 1 - t ) = $56.000 + 20,000 ( 7) = 670.000.
That is. the $70.000 generated by the assets is distributed as follows:
To the deb1 holder: 9; 13.000
To thc equitj shareholder: 56,000
570.000
Retunis on Investment
Investment ~etul-n' (5 .b
Debt $200,000 $14:000 7.00%
Equlty 400.000 56.000 13.004'~
Assets %600.000 $70,000 1 1.6790
'Returns are after tax.
Effects on Leverage for ~quityliolder: Return on $400,000
* Inxnests $400,000. earns 1 1.6796. $46,6671$400,000 = 1 1.67'1/0
On borrou ed funds of $200.000 earns 1 1.6756 but pays 770. Therefore earns spread of 4.670,;) (or 11.6756 - 7%) X $200,000 = $ 9,333iS3400.000 = 2.33'141 Total: ,R56.000iS400.000 = 1 4.000/;1
-Thla relat~onshlp can bc expressed (see follnw~ng scctlon in text) as
ROE = ROA + (ROA -- Cost of debt) X D'E 1 4.0Or',o = 1 1.679'0 + ( 1 1.6796 - 7% j X (200,OC)O/400,000 )
into variable (I/) and fixed (F) components. Variable expenses tend to be operatin, in ' nature, \vhereas fixed costs are the result of operating. in~resting, and financing decisions."
The mix of variable and fixed operating cost colnporlents in a firm's cost structure often reflects the industry in which the firm operates. Fixed investing and financing costs depend on the asset intensity of the firm's operations and (somewhat related) 011 the amount of debt financing used by the finn.
Leverage, which is the propol-tion of fixed costs in the fil-nl's overall cost structure, can be subdivided into fixed operating costs that reflect operating lel,er.age (the proportion of fixed operating costs to variable costs), and fixed financing costs orjrqancial lelw-age.
'"~inancial markets so~nctinles create investing and financing transactions with variable payment streams such as lcase payments tied to revenues (e.g.. retailers) and adjustable rate loans. These payments inay have both variable and fixed components.
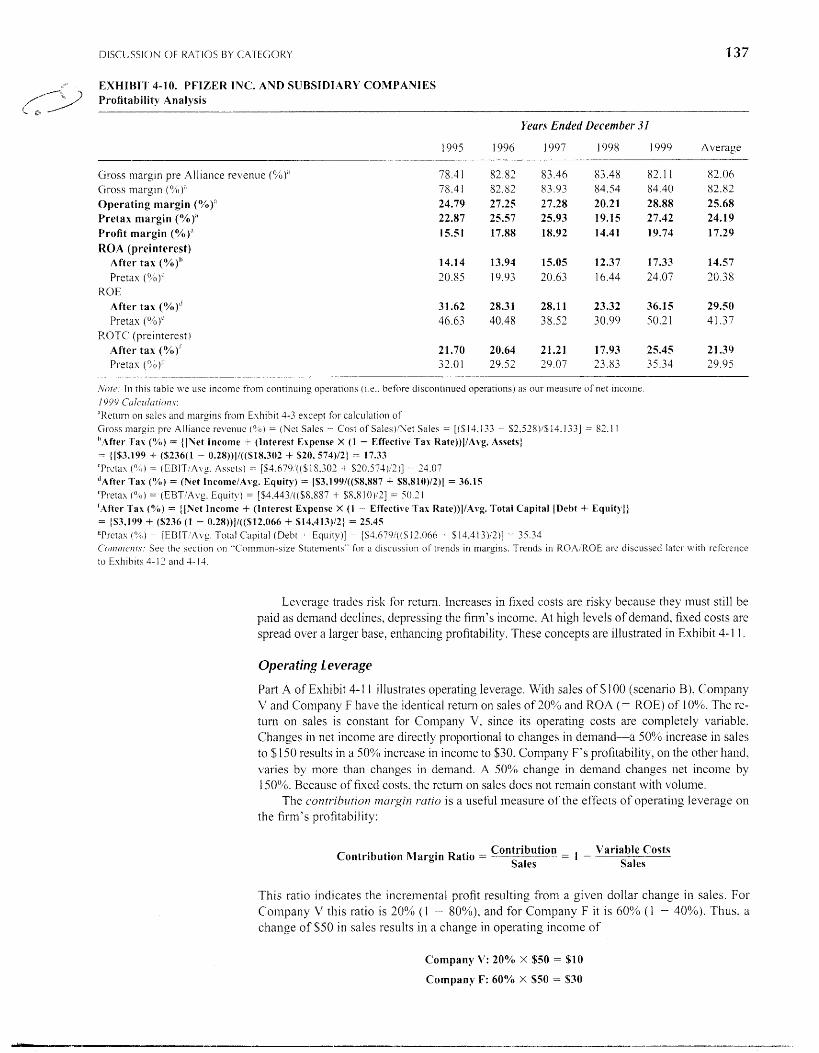
DISCUSSION OF KA1 IOS BY CATEGOK)'
EXHIBIT 4-10. PFIZER INC. AND SUBSIDIARY COMPANIES rofitabilily Analysis
Yrcrrs Eitded Decenzher 31
1995 1996 1997 1998 1999 Average
Gross niargln pre Alllance rc\'enue ( % I " Gross niargln ('YO )" Operating margin (O/O)" Pretax margin ('YO)" Profit margin (%)"
ROA (preinterest) After tax ('9'6)'' Pretax ('I")'
ROE After tax (Oh)'' Pretax ( O ' o 1''
ROTC (pl.elnterest) After tax (%)' Pretax (*/o)'
,vo~c~: 111 this tablc wc usc income from continuing operations ( i . ~ . . before discontinued operations) as our measure of net incolnc. 1999 c u 1 c 1 i l ~ ~ t i i ~ l 7 ~ s :
"Rctu~n on snlcs and margins from Exhibit 4-3 except for calculation of Gross margin pre Alliance revenue ( ? o ) = (Nct Sales -- Cost of Sales)'Net Sales = [(S 14,133 - $2,52X)iS;i4.133] = 82.1 1 " ~ f t e r Tax (Oh) = {\%el income + (Interest Ehpcnse X ( 1 - Effective Tar Katc))]/A\,g. Assets) = {[$3.199 + (%236(1 - 0.28))]/((S28.302 + $20. 574)12] = 17.33 ' P rc t a~ (?,:I) = (EBIT!Avy. Assets) - [$3.679,((SlS.302 - $3CJ.573)12)] = 23.07 " ~ f t e r Tax ('A) = (het Inrome/A\:g. Equity) = IS3.199/((S8.887 + $8,810)/2)1 = 36.15 cl'retax (4.0) = (EBTiAvg. Equ~t!,) = [$4.443/(($8,857 + $8.8 I O)2] = 50.2 1 'After Tax (Oh)) = {INet Income + (Intcrcst Expense X ( I Efi'ecti\,e Tax Rate))l/Avg. Total Capital [Deht + Equity]) = ($3.1 99 + ($236 (1 - 0.28)))/((S12,066 + !$14.413)/2) = 25.45 Vrctax ('!/(I) = [EBIT,'A\.g. Total Capital (Deht - Eclultyj] = [S4.67O/((S;12.066 - $14.41 3 ) i 2 ) ] = 35.34 C'orilrirc~~i/ .v: Sec thc section on "C'ornrnon-size Statements" for a discussion ol'trends in margins. Trends in R0A:'ROE are discussed later with refcrcncc to Exhibits 4- 12 and 4- 11.
Leverage trades risk for return. Increases in fixed costs are risky because they must still be paid as denland declines, depressing the firm's income. At high levels of demand, fixed costs are spread over a larger base. enhancing profitability. These concepts are illustrated in Exhibit 4- 1 1.
Operating 1 everage
Part A of Exhibit 4-1 1 illustrates operating leverage. With sales of $100 (scenario R), Conlpany V and Company F have the identical return on sales of 20% and ROA (= ROE) of lo0/". The re- turn on sales is constant for Company V. since its operating costs are co~npletely variable. Changes in riet income are directly propo~tional to chaiiges in demand-a 50% illcrease in sales to $150 results in a 5O0/0 increase in income to $30. Company F's profitability, on the other hand, varies bj, more thail changes in demand. A 50% change in dellland changes net income by 1 50°/b. Because of fixed costs, the return on sales does not remain constant with volume.
The c~or~trihzrtiou 171~1i-gi~i ~'utiu is a useful measure of the effects of operating leverage on tlie firm's profitability:
Variable Costs Contribution = Contribution Margin Ratio = ------------ Sales Sales
This ratio indicates tlie incremental profit resulting from a given dollar change in sales. For Company V this ratio is 20% ( 1 - 80%), and for Conlpany F it is 6096 (1 - 40%). Tllus, a change of $50 in sales results in a change in operating incolile of
Company V: 20°/0 X $50 = $10
Company F: 60% X $50 = S30
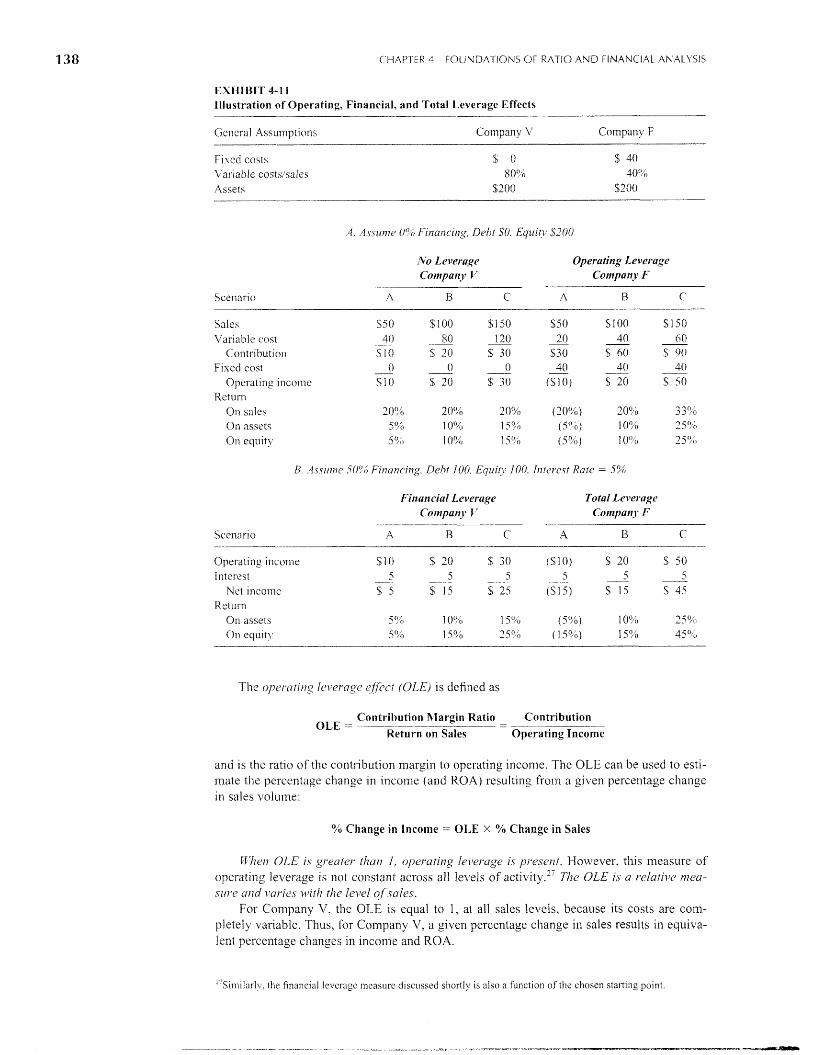
CHAPTER 4 FOUNDATIONS OF RATIO AND FINANCIAL AKALk'SIS
EXtflBIT 4-1 1 Illustration of Operating, Financial, and Total Leverage Effects
C;clicral As~i~~iiptio~is Company V Company F
Fivcd costs Variable costs/sales Assets
'4. .4sslrme 0'0 F.'inancii~g. Debt SO. Equzt.1. ,$200
No Leveruge Operating Leverage
Salch L'ariablc cost
Contribution P ~ x e d cost
0pcratt"ig Income T~ct11r11
On sales On nsscts On equltj
Financial Leverage Total Leve~.ugc Co ~ n p a ~ i y ? ' Cornpatij. F
- Scenario A B C A B C
Operat~ng inco~iie S 1 0 5 20 $ 30 ($10) $ 2 0 5 50 111tcrcst - 5 5 5 5 5 5 - -
Nct ~nconic $ 5 $ 15 S 25 ($15) F 15 S 45 [isturn
On assets 5n/ o 1 0'4 15'/0 (5%) 10% 2 5 O/C
011 eqult), 5 ($6 159b 2S0b (1 5%) 1 S(>o 45010
The operalirlg lc\-eragc. efkct (OLE) is defined as
Contribution Margin Ratio Contribution OLE := - - -
Return on Sales Operating Income
and is the ratio of the contribution margin to operating income. The OLE can be used to esti- inate the percentage change in iricoiiie (and ROA) resulting fro111 a given percentage change in sales volume:
% Change in Income = OLE X % Change in Sales
Gl71er1 OLE is greuter- thur? 1, operating lever.uge is present. Ho\vever, this measure of operaling leverage is iiot constant across all levels of activity." The OLE is u rciativc 117cu- szwe urld ~vr-ies ~ ' i t h the level of yules.
For Company V . the OLE is equal to 1 , at all sales levels, because its costs are com- pletely variable. Thus, for Coinpany V, a given percentage change in sales results in equiva- lent percentage changes in illcome and ROA.
27 S~m~larl!~. the finonc~al levcragc lncasure d~scussed shortly 1s also a functlon of the chosen starting polnt.
RATIOS: A N INTEGRATED ANALYSIS 139
For Company F, 11oweve1-, the OLE varies: It is equal to 3 (60%/20%) for scenario B. A 50°/'o change in sales (to scenario A 01- scenario C) ~ l i l l result 111 a threefold percentage change (3 X 50% = 130%) in income and ROA. Uslng sccnano C as the base starting point, I~owever, results in an OLE measure of 1.8 (60°/o/330/o). A 33%) drop in sales fro111 scenario C to scenario B ($150 to $100) results in a 60°4 ( 1.8 ).: 3396) drop in incorne ($50 to $20) and ROA.":
Financial 1 everage
The effects of financial leverage can also be quantified. From the point of view of common sl~areholders, financial leverage is, like operating leverage, a risk and return trade-off. The fir111 takes on the risk of fixed financing costs, anticipating that higher returns will accrue to the co~nnion sharel~olders at higher levels of demand.
In part B of Exhibit 4-1 1 . we assulne that each coinpany is 50% financed by debt and in- terest costs = $5 ( 5 % interest rate). For Co~npany V (\;\ihich has no operating leverage), changes in net incoinc arc no^. proportionally liigher than changes in demand; changes of' 50% in volun~e are accompanied by changes of 67%) in profit and ROE. (Note that ROA, be- cause it 1s coinputed before iiltcrcst expense, is unaffected by financial leverage.)
The fiuzanciul 1ever.uge cfject (FLE) relates operating income to net income:
Operating Income FLE =
Net Income
The FLE for Company V is (at scenario B ) $20/$15 = 1.333. Thus, a 50'% change in sales (and operating income) results in a 67% (1.333 x 50%) shift in inco~ne (from $ 1 5 to $25) and ROE (from 15% to 25%).
For Company F, the changes in income relative to changes ill demand are even higl2er. Were. the effects of both operating and financial leverage coincide. giving a torn1 lt.\vruge efl
f t ~ t (TLE) equal to the product of tlie individual leverage effects:
Contribution TLE = OLE X FI,E = Yet Income
A 50% decline in Company F's sales (from $100 to $50) results in a 200% (4 X 50%) decline in incolne (from $1 5 to S; - 15). This suggests that firms with high operating lever- age take on high financial leverage only at their peril. Traditionally. high debt ratios have beell considered acceptable only for fil-rns with low operating leverage or with stable opera- tions (suc l~ as public utilities), where the risk of combining operating and financial leverage uras lo\%.. In recent years, hom~ever. financial leverage has been applied to companies with high operating leverage as well (airlines, for example), resulting in financial distress or even bankruptcy during periods of econolnic adversity.'"
RATIOS: A N INTEGRATEQ ANALYSIS
The ratios surveyed in this chapter measure such diverse aspects of an enterprise's perfor- inance as its efficiency of operations (activity ratios), liquidity, solvency, and profitability. The discussion thus far has focused on the characteristics of individual ratios. Comprel~en- sive financial analysis requires a review of three interrelationships anlong ratios:
1. Eco~zonzic rclutiorzLshi~~,c. Interdependent changes in various conlponents of the financial statements stem fi-om underlying econo~~lic relationships. For exainple, higher sales are
?';In all cases. tlie ROE is identical to ROA. as we havc assumed no financing in part .4.
'"The growth in off-balance-sheet financing can be partly explained by the desire of firms to report lower levels of operating and financial leverage. The use of operating leases allows tinns to aj~oid the recognition of dcbt and re- lated financing costs. All leverage I-atios sliould be a?justed for operating lcascs and other fol-111s of off-balance-shcct financing. (See Chapter l I . )
CHAPTER 4 FCIUNDATIONS OF RATIO A N D FINANCIAL ANALYSIS
generally associated with higher investment in working capital components such as rc- ceivables and inventory. Ratios comprising these elements should be correlated.
2. O~?rr-icy qf'conlponrr~t.\. The components of many ratios overlap due to the inclusion of an identical tern1 in the numerator or denoninator, or because a te1-m in one ratio is a subset or component of another ratio.30 Change in one of these identical tenns will change a number of ratios in the same direction. Similarly, ratios that aggregate other ratios can be expected to follow patterns over time consistent with those of their components. For example, the total assets tumover ratio is essentially a (weighted) aggregation of the individual t u~~ love r ratios. Trends in this ratio will mirror those observed in the inventory, accounts receivable, and fixed asset tu~mover ratios.
3. Ratios us conzposites of'otlzei~ ratios. Soine ratios are related to other ratios across categories. For example. the ROA ratio is a coinbinatioll of profitability and turnover ratios:
Income - Income Sales Assets Sales Assets
A change in either of the ratios on the right-hand side will change the return on assets as well. The interrelationships among ratios have important implications for financial analysis.
Disaggregation of a ratio into its component eleinents allows us to gain insight into factors affecting a firm's performance; for example, significant changes in ROA may be best under- stood tl~rough an analysis of its components. Further, ratio differences can highlight the eco- nomic characteristics and strategies of:
The same firm over time
- Firms in the same industry
Films in different industries
Firms in different countries
These relationships among ratios imply that one might be able to ignore some colnponent ra- tios and use a composite or representative ratio to capture the inforniation contained in other ratios. For example, in the ROA relationship described earlier, the effect of the two ratios on the riplit side of the equation may bc captured by the ROA ratio. For certain analytical pur- poses, this compositc ROA ratio may suffice.
Analysis of Firm Performance
This section mill exploit some of these interrelationships to analyze a firin's perforlnance by focusing on d~saggregations of the overall profitability rncasures ROA and ROE.
Disaggregation of ROA
The ROA ratio can be disaggregated as follows:
ROA = Total Asset Turriover X Return on Sales
-- Operating Income - S a l e s X Assets Sales
The finn's overall profitability is the product of an activity ratio and a profitability ratio. A low ROA can result fi-om low turnover, indicating poor asset management, lonr profit mas- glns. or a combination of both factors.
Exhibit 4-12 (part A) presents an analysis of Pfizer's ROA for the period 1995 to 1999. Note that in our illustration, we use EBIT to measure profitability. The use of EBIT (rather
10 * f in exainplc of the firs1 t!pc is the use of sales in various activity and profitability ratios. Exalnplcs of the second category include cash as a component of quick assets, \vhich in tuln a7.e a part of current assets.
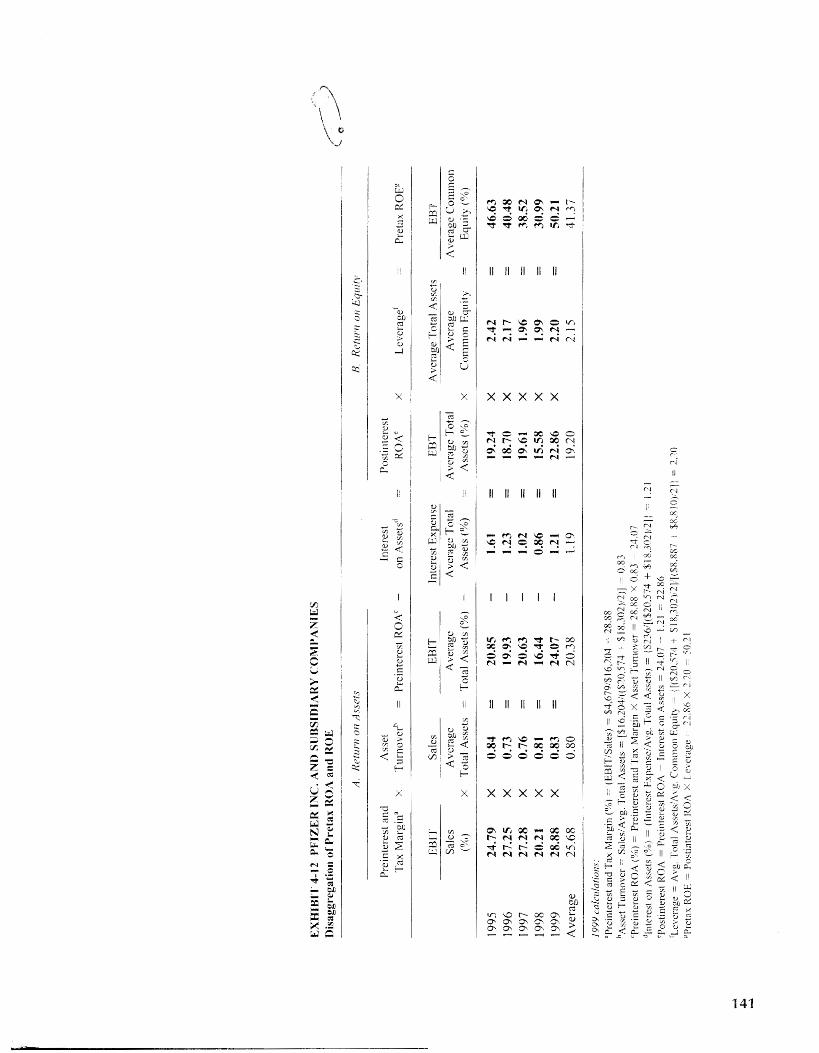
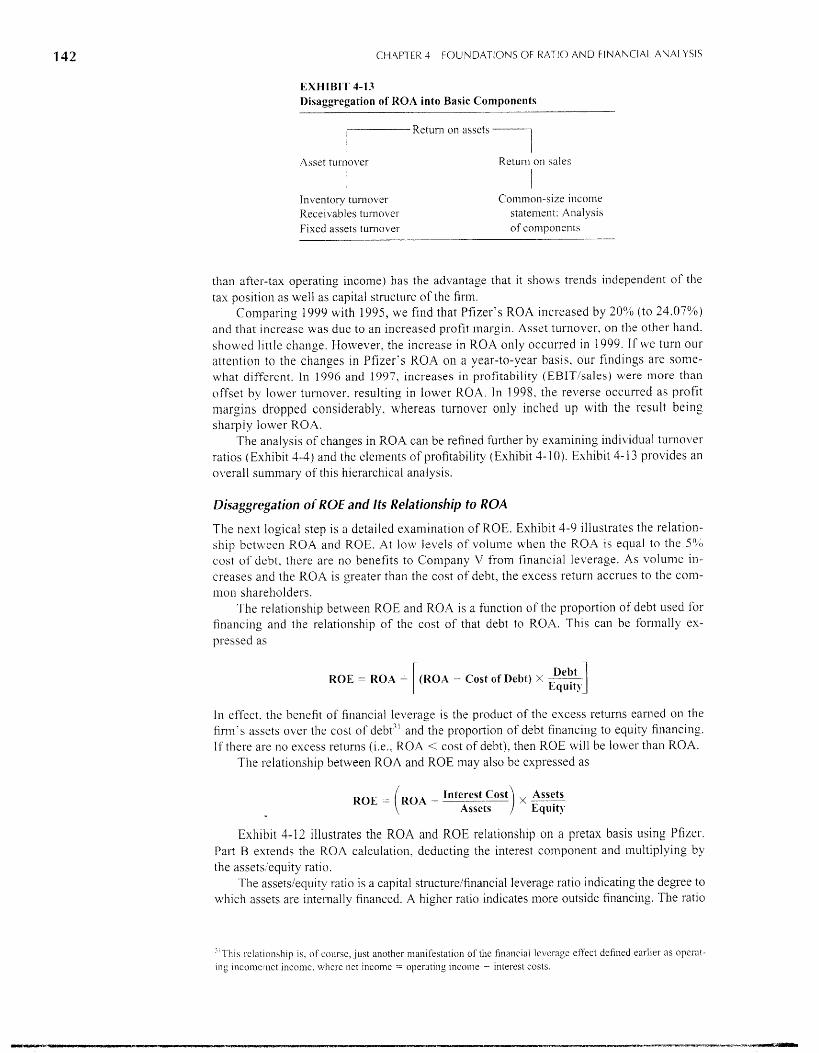
CH.4PTEK 3 FOUNDATIONS OF RATIO AND FINANCIAI- ANALYSIS
EXHIBIT 4-13 Disaggregation of KOA into Basic Components
Return on assets 1 Asset turnover
i I
Return on sales
I Inventory tui-novet- Conlmon-SIZ~ ~ncoilie R z c e ~ ~ ables turnovci statemeilt. Analys~s Fixed assets tunlob er of components
than after-tax operating income) has the advantage that it shows trends independent of the tax position as well as capital structure of the firm.
Comparing 1999 with 1995, we find that Pfizer's ROA increased by 20(% (to 24.07%) and that increase was due to an increased profit margin. Asset turnover, on the other hand. showed l~ t t le change. However, the increase in ROA only occurred in 1990. If \sTe turn our attention to the changes in Pfizer's R0.4 on a year-to-year bas~s . our findings are some- what different. In 1996 and 1997. increases in profitability (EBITIsales) M1ere more than offset by lower turnover. resulting in lower ROA. In 1998. the reverse occurred as profit margins dropped considerably. whereas turnover only inched up with the result being sha113ly lower ROA.
The analysis of changes in ROA can be refined further by examining individual t u r~~o \~e i - ratios (Exhibit 4-4) and the elements of profitability (Exhibit 4- 10). Exl~ibit 4- 13 proiides an overall surn111al-y of this hierarchical analysis.
Disaggregation of ROE and its Relationship to ROA
sl11p cost
next logical step is a detailed examination of ROE. Exhibit 4-9 illustrates the relation- betiyeen ROA and ROE. At low levels of volume \vhen the ROA IS equal to the 500 of debt, there are no benefits to Company \I from financial leverage. As volume in-
creases and the ROA is greater than the cost of debt, the excess return accrues to the com- mon sharel~olders.
The relationship between ROE and KOA is a function of the proportion of debt used for financing and the relationship of the cost of that debt to ROA. This can be formally ex- pressed as
(ROA - Cost sf Debt) X Y Equ~tg Debt I
In effect, the benefit of financial level-age is the product of the excess returns earned 011 the fil-~n's assets over the cost of debt" and the proportion of debt financing to equity financing. i f there are no excess returns (i.e.. ROA < cost of debt). then ROE will be lower than ROA.
The relationship between ROA and ROE may also be expressed as
Exhibit 3-12 illustrates the ROA and ROE relationship on a pretax basis using Pfizer. Part B extends the ROA calculation, deducting the interest component and nlultiplying by the assets/'equity ratio.
The assetslequity ratio is a capital structure/fir~ancial leverage ratio indicating the degree to ~ ~ l i i c h assets are internally financed. A higher ratio indicates more outside financing. The ratio
-"This relationship is, of course, just another manifestation of thc financial leverage effect dcfiiled earlier as opcrat- ing income!uct inco~l~c, where net income = operating income - interest costs.
RA'TIOS: AN INTEGRATED ANALYSIS 143
equals 1 plus the debtiequity ratio. where debt is defined as total liabilities." Thus, if wc recall the components of ROA. ROE is a function of three of the four categories discussed." That IS.
ROE = Profitability X Activitj X Solvency
- - -- Income i( I- Cales Assets x -- Sales Assets Eyu~ty
Exhibit 4-14 (part A) disaggregates Pfizer's (after tax) ROE into these three components for the years 1995 to 1999. The ailalvsis call be expanded by examini~ig the individual com- ponents (fi-om Exhibits 4-4.4-8. and 4-9) making up these categories.
The analysis of the components of ROE, which is frequently lmown as the d~Pol.lt
mod~l ,~ ' enables the analyst to discern the contribution of each fiator to the clia~lge in ROE. Froni Exhibit 4-12 we learn that. from 1995 to 1999, Pfizer's ROE increased from
46.6% to 50.2'! b (we ignore, for the moment, the lower returns in 1996 through 1998). This increase mirrors that of the change in ROA and is also due to increased profitability. Lever- age decreased slightly as the ratio of average total assets to average common equity dc- creased from 2.42 (1 995) to 2.20 ( 1999).
Exliibil 4-14. using post-tax data, shows sr~niiar results. ROE increased from 1995 to 1999 because of an increased after-tax profit margin. On a short-tenn (year-to-year) basis. variations in ROE were due priinarily to increased profit margins being offset by lower turnover and leverage.
Although the three-component model showv is the standard duPo11t analysis, that model can be developed further. In inany cases, i t is w o ~ ~ h ~ r h i l e to look at the effect of interest pay- 11zents or tax payments. To do so. we must disaggregate the profirability ratio fill-ther as follows;
Net Income EBT EBIT = Net Income EBT EBI?' Sales Sales
yielding a five-way breakdown of ROE. This decon~position is presented in Ex hibit 4- 13 (part B); it allows the analyst to view the income tax burden (ratio one is 1 ininus the tax rate) separately frorri the interest burden (ratio two. wlzich shows the percentage of EBIT that I S not paid to debtholders) and each separately fi-om operating profitability (EHITIsales).
For Pfizer, we find that overall increases in profitability were not only (as noted earlier) driven by operating profit (ERIT/sales). The firm's tax and interest burdens also declined over the period.
Trends in ROE and ROA
-4s the duPont model suggests. ROE is an important sun1111ary lneasurc of a firm's profitabil- ity and retuin on iin1estment. It captures inany Pdcets of a fil-in's operating, investing, and fi- nancing characteristics. In Chapter 19, ROE is used as a key input in an accounting-based val~~atioil model.
3 L ~ e c a l l that assets = liabilities (debt) + equity.
- " ~ e l l i ~ ~ g and Stickney ( 1 990) disaggregate ROE as fc)llows:
ROE. = KOA Y AssetsIEqu~ty X Net Incoine~Opcrat~ng lnco~llc
The terms to the right of ROA are clearl!~ measures of financial leverage. Because the assetsiequity ratio (capital srructure leverage) discussed earlier will always be greater than 1. its effect is to increase ROE relative to ROA. The ratio of net income to operating income (the common earnings leverage) is the in\,erse of the financial leveragc and will always be less than 1. tending to drive ROE below KOA. Whether ROE is greater or less than ROA depends un whether the positive effects of capital structure leverage outweigh the nepati\.c effect of earnings le\zerage; do the returns on all assets that accrue to colllmon shareholders (capital structure leverage effects) exceed the cost of exter- nal fkla~lcing (common earnings leverage)?
'4This iuodel v.as originated by duPont. See C. A. Klinc. Jr. and H. L. Hissler, "The duPont Clial-t System for Ap- praising Operating Performance." A!/1CL4 Brllleti~~ (August 1953 ).
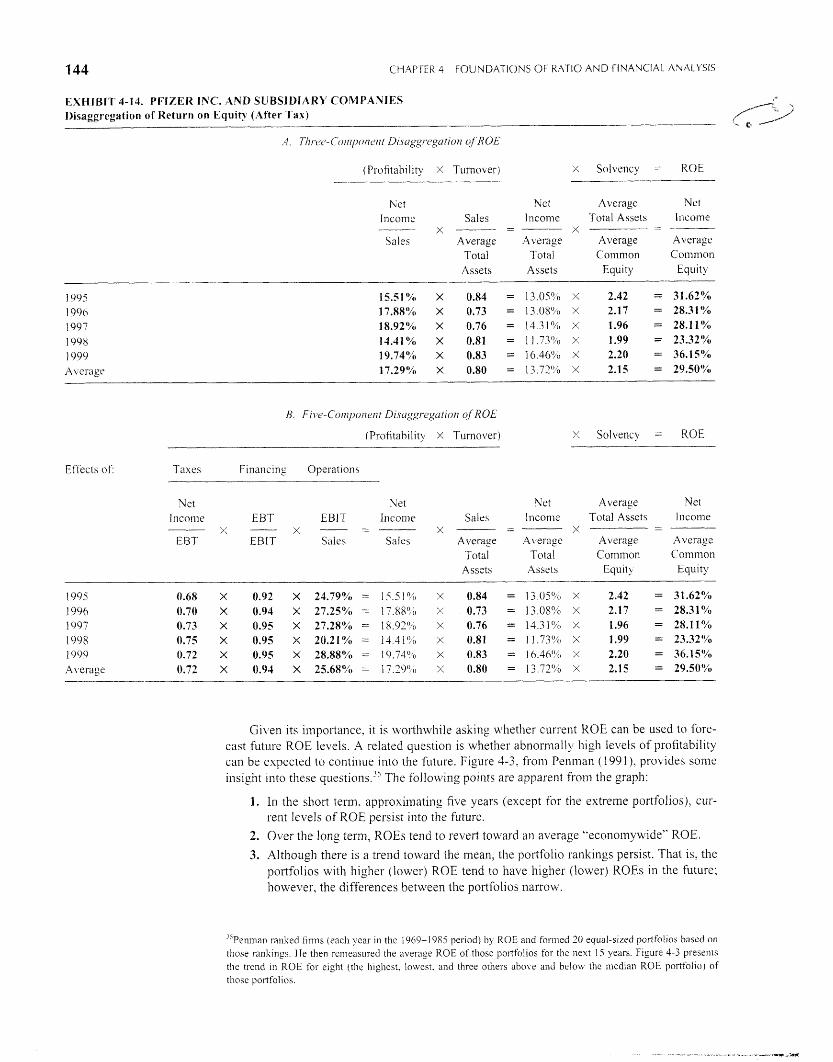
144 CH?\PTER 4 FOUNDATIONS OF RATIO AND FINANCIAL ANALYSIS
INC. AND SUBSIDIARY COMPANIES on Equity (After Tax)
.+I. T/~i,~.c~-C'o/r~po/lc~ilf L)~.,uggl.c~gur~on o j ROE
(Profitability X Turnover) x Solve~icy = ROE
Xct
I~iconle
Sales
Sales X ---
Average Total
Assets
Nct Inconie
- - - X A\ erage
Total Assets
Average Total Assets
-
Average Colllnion
Equity
Nct Incorne
Average Common
Equity
1995 1 906 I997 1998 1 999 A \ el-age
Effects of:
B. FI i v -C 'on~po l~e~~t Dis~~,ggr.eg~rfion of ROE
(Profitability X T u r ~ ~ o \ l e r ) X Solvency = ROE
Taxes F i n a n c ~ n g Operation5
T\] ct Income
Net EBT EBlT Incomc
x - - X - - --- ERIT Sales Salcs
Sales
Average Total
Assets
Net Income
- - -
A \feragc Total
Assets
Average Total Asset$
X - -
Average Common
Equit!
Net lncoine
Average Common
Equity
Given its iinpol-tance, it is wol-thwliile aslcing ~rhether current ROE can be used to fore- cast future ROE levels. A related question is whether abnormally high ie\7els of profitability can be expected to continue into the f ~ ~ t u r e . Figure 4-3, fi-oln Penmall ( 1 99 l ) , provides so~lie insight illto these questions.3' The following points are apparent from the graph:
1. In the sli01-t tern.1, approximating five years (except for the extreme portfolios), cur- rent levels of ROE persist into the future.
2. Over the long term, ROES tend to revert toward an average "econoinywide" ROE.
3. Althougl~ tliere is a trend toward the mean; the poitfolio ranltings persist. That is, the portfolios with higher (lower) ROE tend to have higlieu (lower) ROES in the future: however, the differences between the portfolios narrow.
'5Penman ranked firms (each 1 ear In the 1969-1985 penod) bj ROE and formed 30 equal-s~zed porlfol~os based on those ranklngs He then rcineasured the aver:Ige ROE of those pol-tfolios for the next IS years Figure 4-3 presents the trcnd 111 ROE for c~ght (the h~ghest. lowest. and three others a b o ~ e and b c l o ~ the medlan ROE portfol~o) of those portfol~os.
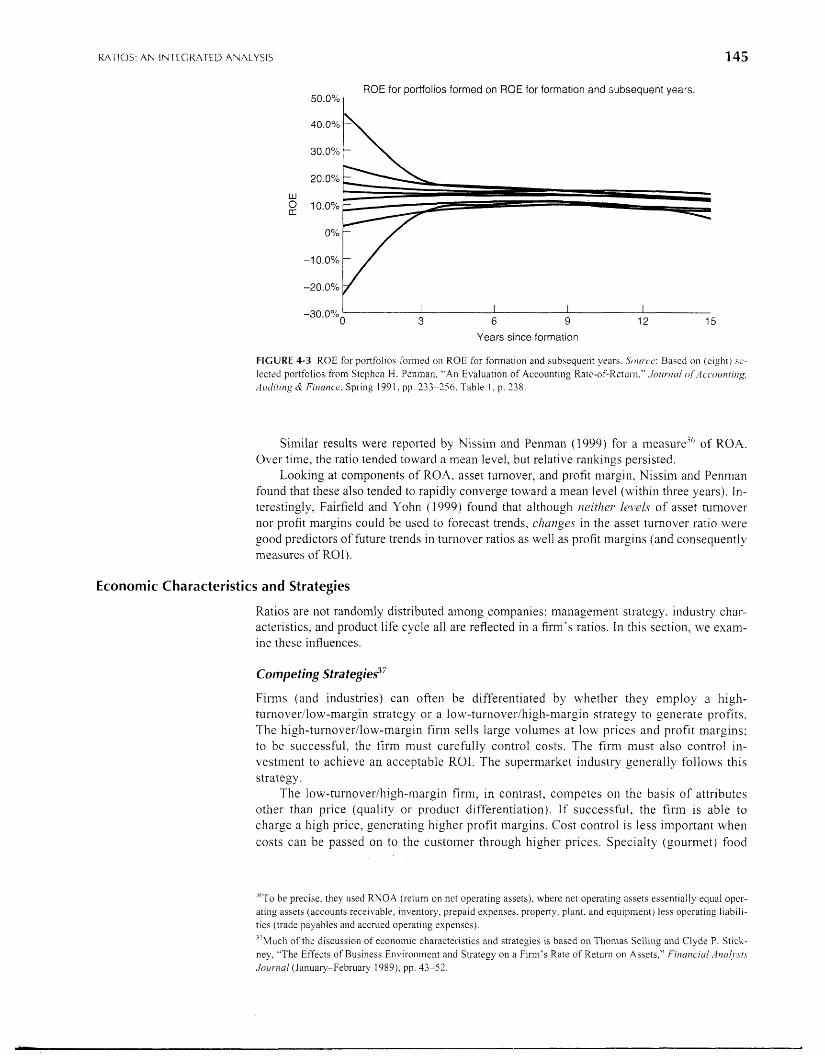
RATIOS: A N INTEGRATED ANALYSIS
ROE for portfolios formed on ROE for formation and subsequent years.
50.0% I
-30.0% I 0 3 6 9 12 15
Years since formation
FIGURE 4-3 ROE for portfol~o< formed or1 ROE for foni~at~on and subsecluerit >ears Soltr-tc, Based on ( e ~ g h t ) st.-
lected portfolios from Stephcn H Penman, "411 Evaluation of Accountillg Rate-of-Retu~li." Jozir17~11 of.-1~collnrzng, A~lt/ l t l~zg & F'ZIIUIICL', Spr~ng 1991. pp 233-256, Table I . p. 338
Silnilar results were reported by Nissim and Penman (1999) for a measure'" of ROA. Over time, the ratio tended towal-d a mean level, but relative I-anliings persisted.
Loolting at components of ROA, asset turnover, and profit n~argin, Nissiin and Peninan found that these also tended to rapidly converge toward a mean level (within three years). In- terestingly, Fairfield and Yohn (1999) found that although izcitlrcr. le\)el.c of asset turnover nor profit margins could be used to forecast trends, c.llunges in the asset turnover ratio were good predictors of future trends in turnover ratios as well as profit margins (and consequently measures of R01).
Economic Characteristics and Strategies
Ratios are not randomly distributed ainong companies: management strategy. industry char- acteristics. and product life cycle all are reflected in a firm's ratios. In this section, \ve exam- ine these influences.
Competing sfrafegie2'
Fil-nls (and industries) can often be differentiated by whether they employ a high- turnover/low-margin strategy or a low-turnoverlhigh-n~argin strategy to generate profits. The high-turnover/lo\\-margin firm sells large volumes at low prices and profit margins; to be s~iccessful, the t3-m must carefully colltrol costs. The firm must also control in- vestment to achieve an acceptable ROI. The supernlarket industry generally follows this strategy.
The low-turnover/high-niiirgin f i rn~, in contrast, competes on the basis of attributes other than price (quality or product differentiation). If successful, the fir111 is able to charge a high price, generating higher profit margins. Cost control is less important w11en costs can be passed on to the customer through higher prices. Specialty (gourmet) food
'"TO be precise, they used RNOA (return on net operating assets), where net operating assets essentially equal opcr- ating assets (accounts receivable, inventory, prepaid expenses, property. plant, and equipment) less operating liabili- ties (trade payables and accrued operating expenses).
" ~ u c h of the discussion of econonlic characteristics and strategies is based on Thomas Selling and Clyde P. Stick- ney. "The Effects of Business Environment and Strategy 011 a Firm's Rate of Return on Assets," Fiii(117~illl , ~ P I L I ~ I * . Y ~ . V
Jo~trrzal (January-February 1989), pp. 43-52.
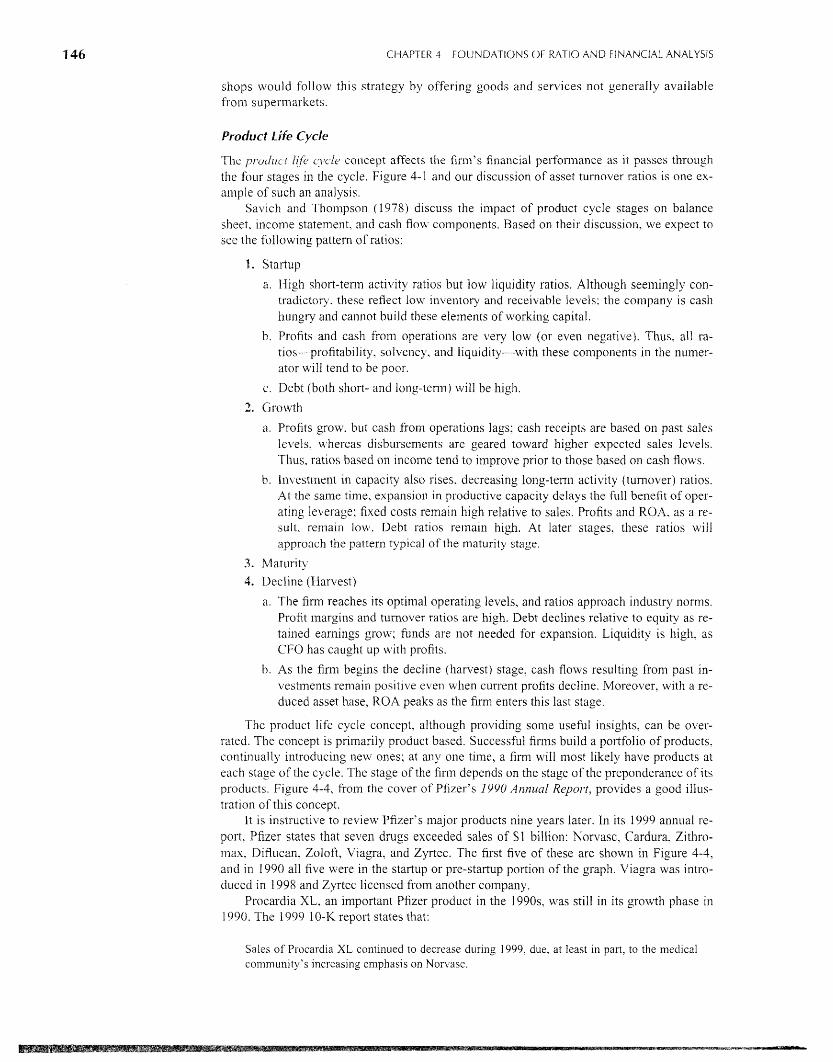
CHAPTER 3 FOUNDATIONS 01- RATIO A K D FINANCIAL ANALYSIS
shops w o ~ ~ l d fbllow this strategy by offering goods and services not generally available from supermarkets.
Product Life Cycle
The prudrrc! life CJ ,C /P concept affects the firm's fiiiancial perfonxance as it passes through the four stages in the cycle. Figure 4-1 and our discussion of asset turnover ratios is one ex- ainple of such an aiialysis.
Savicli and Thompson (1978) discuss the impact of product cycle stages on balance sheet, income statement, and casli flou coniponents. Based on their discussion, we expect to see the following pattern of ratios:
a. High short-tenn activity ratios but low liquidity ratios. Although seelliingly con- tradictory, these reflect low ilivexitory and receivable levels; the company is cash hungry and cannot build these elements of working capital.
b. Profits and cash fro111 operations are very low (or even negative). Thus, all ra- tios--profitability, solvency. and liquidity-with these components in the nunlcr- ator will tend to be poor.
c. Debt (both short- and long-terin) will be high.
2. Growth
a. Profits grow, but cash from operations lags; cash receipts are based on past sales le\,els. mrhereas disbursements are geared toward I~igher expected sales levels. Thus, ratios based 011 income tend to in~prove prior to those based on cash flows.
b. ln\restment in capacity also rises. decreasing long-ten11 activity (turnover) ratios. At the same time. expalision in productive capacity delays the full benefit of oper- ating leverage; fixed costs remain high relative to sales. Profits and ROA, as a re- sult, remain low. Debt ratios remain high. At later stages. these ratios will approach the pattern typical of the maturity stage.
3. Maturit_rv 4. Decline (Harvest)
a. The firm reaches its optimal operating levels, and ratios approach industry norms. Profit ~nargins and turnover ratios are high. Debt declines relative to equity as re- tained earnings grow; funds are not needed for expansion. Liquidity is high, as CFO has caught up ~ v i t l ~ profits.
b. As the fiml begins the decline (harvest) stage, cash flows resulting from past in- vestments remain positive even when current profits decline. Moreo~.er. with a re- duced asset hase, ROA peaks as the firm enters this last stage.
The product life cycle concept, although providing some useful insights. can be over- rated. The concept is primarily product based. Successful firins build a portfolio of products. continually iiitrod~~cing new ones; at ally one time, a firm will 111ost likely have products at each stage of the cycle. The stage of the firm depends on the stage of the preponderance of its ~xoducts. Figure 4-4, froill the cover of Pfizer's 1990.411121~nl Report, provides a good illus- tration of this concept.
It is itlstructive to review Pfizer's major products nine years later. In its 1999 annual re- poi?. Pfizer states that seven drugs exceeded sales of $1 billion: Norvasc, Cardura, Zithro- Inax, Diflucan. Zoloft, Viagra. and Zyrtec. The first five of these are shown in Figure 4-4, and in 1990 all five were in the startup or pre-startup portion of the graph. Viagra was intro- duced in 1998 and Zyrtec licensed from another company.
Procardia XL. an important Pfizer product in the 1990s. was still in its growth phase in 1990. The 1999 10-K report states that:
Sales of Procardia XI, continued to decrease during 1999, due, at least in part, to the medical coin~m~~nity 's increasing einphasis on Norvasc.
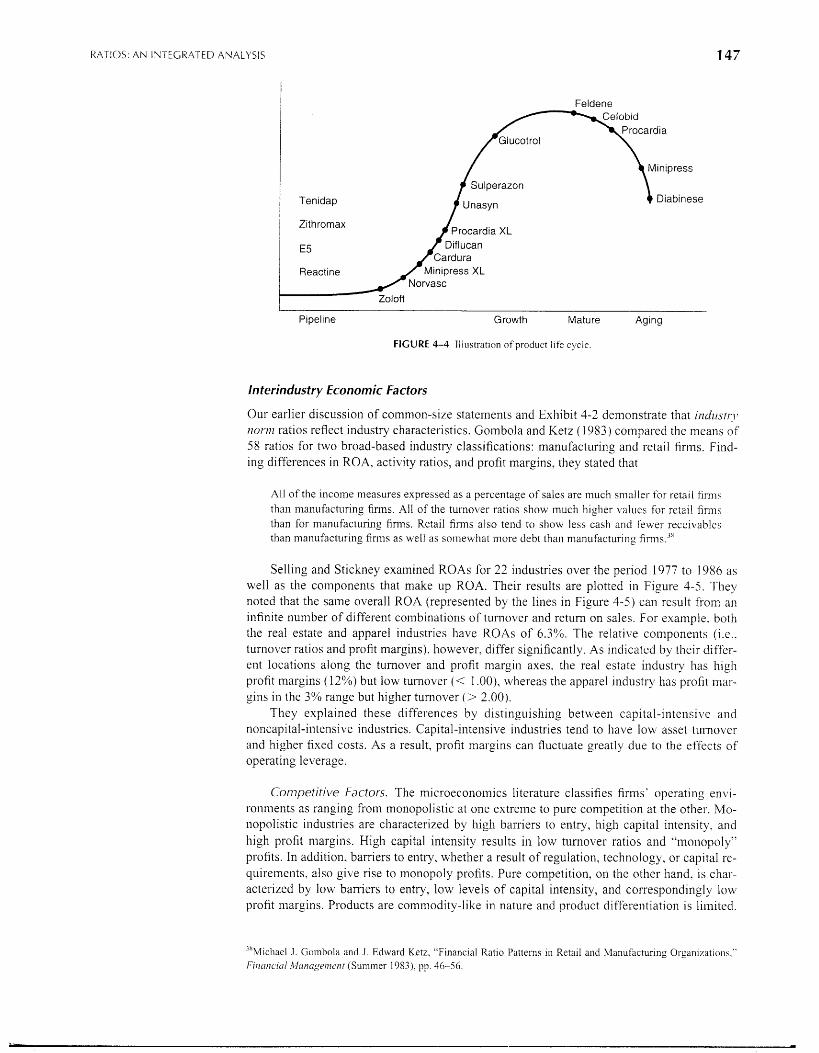
RATIOS: AN INTEGRATED ANALYSIS
1 Feldene
Tenidap
Zithromax Procardia XL
E5
Reactine
I Zoloft
Pipeline Growth Mature Aging
FIGURE 4-4 Illustration of product life cyclc.
interindustry Economic Factors
Our earlier discussion of common-size statements and Exhibit 3-2 demonstrate that ~ I ~ L / L I J I I : I ~
71or171 ratios reflect industry characteristics. Go~nbola and Ketz ( 1 983) compared the means of 58 ratios for two broad-based industry classifications: lnailufact~lri~lg and retail firms. Find- ing differences in ROA, activity ratios. and profit ~~iarg ins , they stated that
All of tile income measures expressed as a percentage of sales are much smallel- for rcta~l fimms than nlanufacturlng firms. All of the turnover ratios show much h~gher \~alucs for retail firlns than for manufacturing firms. Retail fimm also tend to show less cash and feuser recei\~ables than manufacturing firms as well as somewhat more debt than manufacturing firrii~.~"
Selling and Stickney exanlined ROAs for 22 industries over the period 1977 to 1986 as well as tlie con~ponents that make up ROA. Their results are plotted in Figure 4-5. They noted that the saine overall ROA (represented by the lines in Figure 4-5) can result from an infinite number of different combinatioils of turnover and return on sales. For example, both the real estate and apparel industries have ROAs of 6.3%. The relati1.e componeilts (i.e.. t un lo~~er ratios and profit margins), however, differ significantly. As indicated by their differ- ent locatioiis along the turnover and profit margin axes, the real estate industl-y has high profit margins (12%) but low turnover (< 1.00), whereas the apparel industry has profit mar- gins in the 3% range but higher turnover (> 2.00).
They explained these differences by distinguishing between capital-intensive and noncapital-intensive industries. Capital-intensive industries tend to have low asset turnoLrer and higher fixed costs. As a result, profit margins can fluctuate greatly due to the effects of oy erating leverage.
Conipetitive Factors. The microeconon~ics literature classifies firms' operating envi - roninents as ranging from non no pol is tic at one extreme to pure competition at the other. Mo- llopolistic industries are characterized by high barriers to entry, high capital intensity, and high profit margins. High capital intensity results in low turnover ratios and "monopoly" profits. In addition, barriers to entry, whether a result of regulation, technology, or capital re- quirements, also give rise to inoi~opoly profits. Pure competition, on the other hand. is cllar- acterized by low barriers to entry, low levels of capital intensity, and co~respondingly low profit margins. Products are commodity-like in nature and product differentiation is li~nited.
' X ~ i c l ~ a e l J Gombold and J Edward Krtz, "F~nancial Ratlo Patterns In Rctall and Manufacturing Organl/at~on\ " F~~'lnc~nc~trl hl(riicrget~zcnt (Summer 1 983). pp 46-56
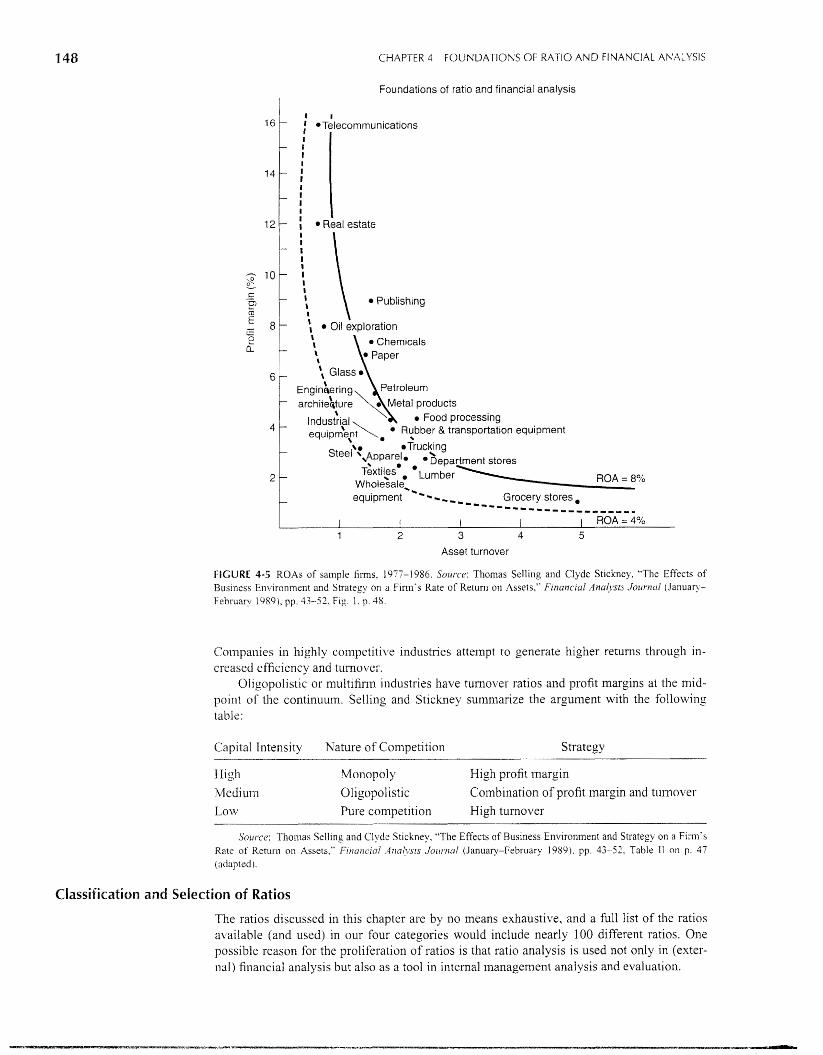
CHAPTER 4 FOUNDATIONS OF RATIO AND FINANCIAL ANALYSIS
Foundations of ratio and financial analysis
I
Telecommunications
Real estate
Food processing equipment
stee"\?ppari'e Department stores
2 Wholesale, . ~ u m b e r i ROA = 8%
equipment -'--, Grocery stores. --------111-11---1
Asset turnover
FIGURE 4-5 ROAs of sample firms. 1977-1986. Sozlr.ce: Thomas Sellillg and Clyde St~ckney, "The Effects of Bus~ness Environment and Strategy on a Firill's Rate of Return on Assets," Fzl?urlc~ul Anuljsrs Joui-nu1 (Januaq- February 1989). pp 43-53. Fig 1. p 48
Companies in highly competitive industries attempt to generate higher returns through in- creased efficiency and turnover.
Oligopolistic or multifirni industries have turnover ratios and profit margins at the mid- point of the continuum. Selling and Stickney sulnmarize the argument with the following table:
Capital Intensity Nature of Competition Strategy
High
Medium Low
Monopoly High profit margin
Oligopolistic Combination of profit margin and tulnover
Pure competition High turnover
Sol~rce: Thomas Sell~ng and Clyde Stickney. "The Effects of Busmess Env~ronment and Strategy on a F11-m'~ Rate of Ketul-n on Assets." F~,iuncinl A I I C I ~ J J ~ J . IOLII-IZU~ (.lanuary-February 1989), pp 43-52. Table I1 01.1 p 37 (adapted ).
Classification and Selection of Ratios
The ratios discussed in this chapter are by no means exhaustive, and a full list of the ratios a\.ailable (and used) in our four categories would include nearly 100 different ratios. One possible reason for the proliferation of ratios is that ratio analysis is used not only in (exter- nal) financial analysis but also as a tool in internal management ailalysis and evaluation.
F A K N l N C j S PER St- i4Rk A N D O T t i E l < I IATIOS 1 ) S E D IN VALO:\~IlON 149
Rat~os d e s ~ g ~ ~ e d for ~na11agerl;ii alialysjs n-iay 1101 add rnli,r~nat~on to thaw ;tlrcacly useti for financial analysis. as the needs of tllese two types o!'uscr\ are not thc srlmc. hlaiiageme~~t nceds detailed ~nfl)rnmilt~on zo l?lnpolnt :ind remcdj spcclfic problem arcas. 7 ' 1 ~ finallc~:~l ;iri;i- lysl's nceds, however, art, tilore ge11era1 and thus may bc satisfic~f wit11 ;i ratlo tlidt ~ilpf111-~>~ thc et'fkcls of othcr ratiu,i or 1s h1gi11y con-eiated v7lth otl~er r ;ttioh. Unfi)rt~i~latcl~,, oncc a ratlo is developed for one purpobc. it tends to be used in way:; ncvcl- intentled. Ratio :irialysis I \ an area \vbere no re is not necc'ss;inl~~ butter.
Much en~pir~cai worI< on ~-atlos has been descriptrvc. to exalnine the propert~cs of' iind correlations among the ratios available in an attempt to find a manageable set of rat~os sultable for anal~ptical purposes. The benefit oi'collinearity among ratios for financ~al analysis 1s a re- ductlon in the number of ratios ihat 111ust be computed and n~onitored. The reduced set call I>c ubed fbr clecisloll making tilrectly'" or as a signal that mol-c detailed analysis ii required.
Ilsins a sinall subsel of r a ~ i o i to represent the wllolc s u ~ reclulres choosing I-atlos that are both:
1 . Highly corre1:ited \villi thosc: ratios excluded, and
2. Not correlated \?,lth tllc other ratios in t l ~ subsct
Condrtlon I ensures tha t any ~nforntatlon ailallable f ~ o m excluded 1.atlos 1s c;tr)t~ircci. wlic~eas condl t~ot~ 2 C I I S ~ I I - ~ ; 110 o\lclrlalr and I-1enc.c ~ l l a x i ~ i ~ u n ~ ~lltnl-rrration 171 o\ ~ d e d by thc ratios ~ncluded.
Academic studies"' have attempted to identlfj. ratlo subsets that meet t h c ~ condition\. Mriltr\?ariatc stat~st~cal :~~ialysis tools such as fixtor an,ilysi.; alld ~ ) r ~ n c ~ p d l C O I T ~ ) O I ~ ~ I I ~ \ Ilii\tc
becn used to part i t io~~ ratios illto ~ I - O L I ~ S and 10 Jlnd r-epr-csel~tati\c~ 1-3t1w for each groiIp t113f meet the two co~lditrons 11s~ed 300\ C. Each of these part~tlons 1s assumt.;d to bc a f i c t c d by an u~~derlyllig factor, the nature of whicl~ is not spec~fied by tile statistical model. liathcr. tile re- ,earclier. after c x a ~ ~ ~ i ~ i ~ n g tile ratios groupcd i11 a g1vc.n part1 lion, attel~ipts to find tllc unlfj/iri~ thome descript~i~e oi the rat~cls 111 tile group.
lntcrestrngly, the results on the whole found that ra t~os prouped then~sel\ es along fhc to~, casl:;istelit (t- g.. Kctu r~~ 011 il?\je~strnent. L_liluld~ty. So!\,ency. Short- and Long-tcrtn A~I~cl iq i ) cclth ciass~iications used in our earlier discusslon~ T ~ L I ~ . the analyst could choose ollc rcprc- sentative ratio from each gi-011p1ng to C D T ~ V ~ ! ~ tht' tnfhnnation available ~fit11111 that gro~lpiiig, thereby reducing the ratios lnonitoreci %om 100 to a Inole managcable seven or clght.
Mcrreover. researchers ~vho 111cluded cash ratlos i l l thc~r pool of ratios also tendeci to jind a cash flout and cash expeiid~ture Fdctor that did not group M i th the other classifications, bug- gesting that cash flow ~r~forrnatio~l I S increl-r~entai to that provided k)y the other ratios. 7hcsc results are cons~stenl w~tll O L I ~ \ / ICW that rat105 basccl on ~ n c u ~ ~ ~ e ; t . x p e n s t-lours sllould also bc. cxarnined 011 a cash flow hli.;l\
EARNINGS PER SHARE AND OTHER R A T D S BkJSED IN VALUATlON
flatros are olien used cxplrcitly or ~ ~ n p l ~ c i t l y for secur~tlcs valuation. Equity \ aluation n~ociclh use ratios such as carnlngs pcr s11;ire and book value per sliarc. I;~xcct-lrlconie ratul~g\ and val- uation techniques also lean l~ea \ /~ ly on ratlos. T h ~ s sectlon I ~ ~ I - C I ~ U C C S thc I-atios ~ i ~ e d 111 thesc ~~locfels; their use In rat~nps ;~nti \ ~ a l u a t ~ o ~ ~ trlodcls is disc~::,scd 111 C'llapttrs 18 and 1'3.
Earnings per Share
Earn~ngs per shai-e (EPS) IS p~-obahly the no st widely available aiid comr~only uscd curpo- ratc pcrfi>rmance statihtic fbx publicly traded firms. I t is used to compare opcratrng pcrlhr- niarlce and for valuation piirposes either directly or together w~t l l inarket prices 1i1 tlic
"'.A sccond elnpirical appl.o:icIi (ticscribed in C'hapter 18) use:; tliest. results to idet~rifj ratios as inputs I r l sptulfic pt-eclicti\.c I I I O ~ C I S of risk in the aiu1)sis of'bankruptcy, bond ratings. and bcta i cqu~ ty riskj. -Ill Utlforti~nately. interest in this line of rcsearch has waned over time and results a\lailable are bssud on studies carried o ~ ~ t t ~ l ~ s t l ! ~ in tilt. 1070s anti 1080s [e.g.. Pincl~es et al. (1 975), .lohnson ( 1070). C'1lc.n and Shinierda ( 198 1 J. and Cioci~- bola ant i Kctr ( 1983)j. hotnitllst:indi~lg tllc ribovc., thc rcs~~l ts would telld t o bc robust ovet- vartolts time p ~ r i o ~ t s .
C'HAPTEK 4 FOUYLDATIONS OF RATIO AN13 FINANCIAL ANAL '1'51s
l i ~ i i ~ l i a r form of'prlce/earnrngs (P,/E) ~-atlc,s. The EPS and P/E rat~os are I-cpol-ted in thc busl- ness section of many newspapers.
Unl11;c other ratios discussecl in tills chapte~, liowever, the calculation of EPS is matldatcd by GAAP. SFAS 128 ( 1997) govci-11s EPS reporting in the Untted States: tllc d~scrlssron below sumniarlres thc important issucs." 1.4s 33 ( 1 0 7 ) governs EPS reportrng under ~ntcrnatloil;ll accounting standards. As the t ~ v o stalldards were developed togetlicr. the computational re- qu~l-ements are ident~cal. Appendlx 4-B providcs details 011 these repol tlng recluil-e~iients.
Simple Capital Structure
For firms that have only con~mon sliaras, the computation of EPS I:, I-elativcly straightfor- ward In such cases, the computation 1s
Eat-nintrs Available for Common Shares Basic E P ~ = - k -----.---.
\+ eighted- A \ er-age Commoti Shares Outstanding
het lricnme - Preferred Dividends Weighted Average Common Shares Outstanding
nrhcre the shares are usually \\ e19hted by the number of mvnt l~s tilose shares were outstand- lng 'Phe nuinerator used to calculate EI'S must equal earnings ava~lable for distribution t o comlxon shareholders. Therefore, prcfcrrsci stock dividends. nvhether declared or c~mlulative, must be deducted from net lncolne. Contingent shares must be ~ncluded ollce thc cond~t~olis req~ilred for their Issue ha\;c been n ~ e t . ~ '
Complex Capital Structure
Conlpanie.; whose capital structures ~nclude options or con\ertible securities (preferred sliares anti debt) ale said to 11a~~t: c ~ l n p l e ~ , ccaprtal structures. Tlrr\c) /'1l.t1rs 1~211st I Y Y ' O ~ , ' I I I S ~ ' / I I L ~
p o ~ e ~ z ~ i u l c$foc*t 011 EPS L / ~ O I [ c o 1 z ~ ~ e 1 - s z o 1 7 of t110.5~ J ~ ~ C Z L ~ I ~ I L ) ~ ~f L\r~cl? u c o t ~ ~ ) o r s 1 o r 1 11 ) /11 1 - c ~ ~ u l t 1t1
~iililt10~1 ( / O H C I - I I I ~ } o f EPS. Tliese fjrnls must report two EPS numbers:
I . Basic EPS as calculatcd abo17c
2. Diluted earnings per shal-e (DEPS) to reflect the potentla1 dllution due to option5 and convel-tible securrt~es on the number of shares outstandrng as well as rncorljc a \ all- able for common shareholders
Adjusted lr~come Available for Comnior~ Sliares L) E p y = -
M'eighted- '4vcrage Common and Potential Comnion Shares Outstanding
The aclju~tlneiits to the 1iumerato1- reflect the fact that if the con\~ertible securities were con- verted to common shares. lnterest and (preferred) dividend payments uiould no longer have
"SFAS 1") ( 1097) requires d isc los~~rcs related to tlic EPS colnpi~tation a ~ l d capital structure. including:
1 . Kigllrs and pro\~isions of all outstanding secur~ties. including debt, conlmon and pi-efcrred shares. optiolis, and ivarrants
2. Number of s1i;ues ~ s s t ~ e d iluri~lg the period d11c to cun\~ersions, cxerciscs. a ~ i d contingent isauanccs
3. I.diquidating value of prefcrrcil sliores when significantly greater than par \ 'alueor statcd amount
3. Call and redemption provisions for prei'erred sl.lal-es
5 . Rcdcn~p t~on sequil-einents by year for the next five yean
6. Dividend an-ears for cumuiative 111-efcrrcd shares
"EI'S calculations may also be based o n daily or uecl<ly weighting. .I : Contingerlt shares are sonietimes issued to the previous owners of acqu~red conipanies when sales or profitab~liry larycts arc 1ile1.
E A R N I N G S P E R S H A R E A N D OTHER RATIOS USED I N \ / A L U A T I ~ N 151
to be made to those security holders, increasing the amount available to common sharehold- ers. Numerator adjustments theref re include
1. Di~ridends on convertible preferred shares
2. lntcrest (after-tax) on convel-ti ble debt
3. Effect of the change resulting lrom 1 and 2 on profit sharing or other expenses4'
Adjustments for Options and Warrants
(Jptions and warrants are also a source of potential dilution. For these instruments, assump- tions must be made with respect to:
* Whether the conversion 01- exercise will actually take place, and
I-low the proceeds of exercise will be used
To calculate the dilutive impact of options and fi8arrants on EPS, the Tveusru:~. stock ~ n c t h o d is used. This method assumes that the proceeds from exercise are used by the firm to (rejpur- chase common shares on the open market at the average market price (MP). As long as MP is greater than the exercise price (EP). the effect will be dilutive and the options and warrants ~ l i l l affect DEPS calculations. Tile derlonlilzatoi. of the EPS r~rtlo is adjl~slcd 1 ~ . ~ ~ J d i l ~ g trllc i~~c.~-snzcnrul fl) shures eqz~ul to
where A; equals the number of shares issuable on exercise. No adjustincnt is inadc to the n urnerator.
Example ot EPS Comp~ltation. An actual calnings per share con~putation is shown in Exhibit 3-15. Note that the effects of the options and convertible bonds enter the calculation of DEPS only. For the options, only the denomil~ator is adj~~sted and the effect will al~vays be di- lutive. For the co~ivertible bonds, adjustments are made to both the nu~nerator and denominator and the effect may not always be dilutive. Only when il is dilutive, as in this case, arc convei-t- ible securities included in the calculation.
Limitafions of EPS Caiculations
The following limitations of EPS as a measure of profitability should bc considered before using that ratio for valuation or cotnparisoll purposes:
The assun~ptions behind t11e Treasury stock method arc unrealistic; they mirror the ac- tual impact of exercise only i n rare cascs.
EPS growth rates can be distorted by a firm's dividend and financing policies. Firmx with lower dividend payout ratios will show higher EI'S gro\;\:tl~ rates than firms with higher payout ratios (see Chapter 19 for further discussion of this point).
Cash Flow per Share
Cash flow per share is calculated using CFO as the numerator. Computed in this manner, it reports on the cash-generating ability of the firnl. Like all summary measures. casli flow per share should be used with caution. CFOIshare suffers from the following problems:
Variability from year to year
Dependence on accounting methods
Does not reflect cash needed for required debt payments
* Does not reflect casli required for maintenance of productive capacity
44 The reduction in interest expense from the assumed conversion of convertible debt increases incomc, and. tlicrc- fore. niigllt increase profit sharing, royalties. or other expcnses based on income.
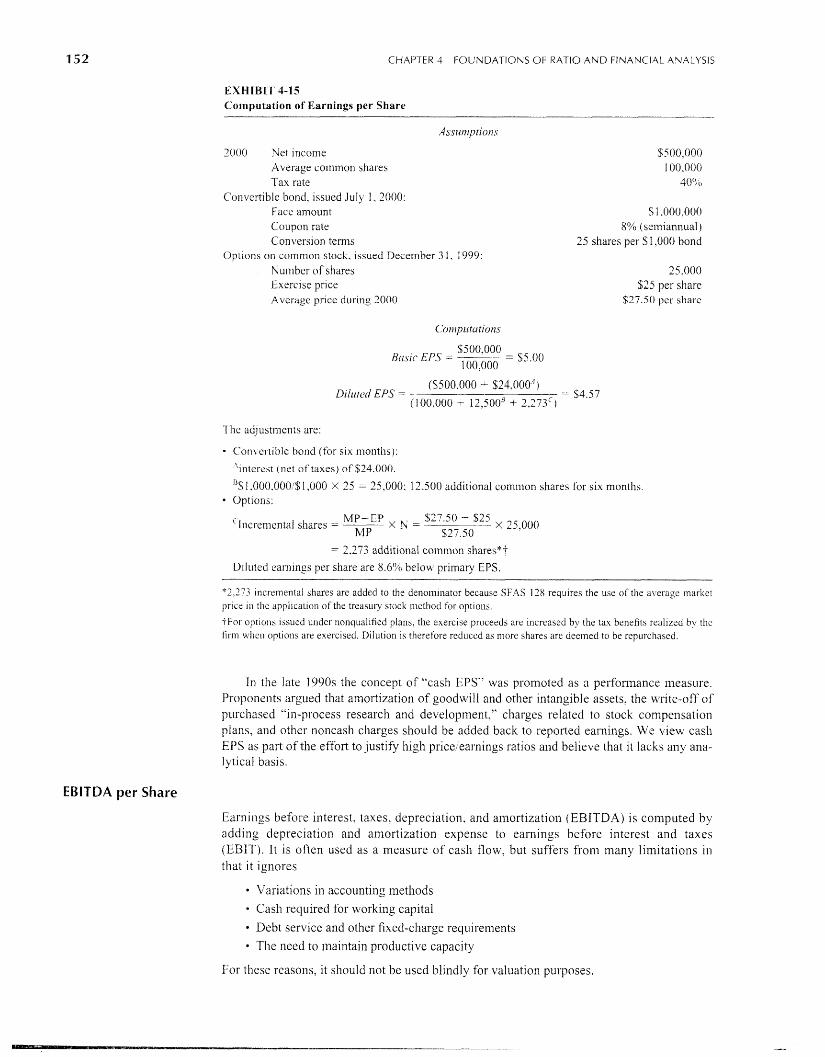
CHAPTER 4 FOUNDATIONS OF RATIO AND FINANCIAL AYALYSIS
EXHIBIT 4-15 Computation of Earnings per Share
7000 Net ~ncome Average coliin~on shares Tax rate
Convertible bond. issued July 1, 2000: Face amount Coupon rate Conversion terms
Options on common stock, Issued December 3 1, 1999: Number of shares Exercise prlce Average price durmg 2000
$ 1 ,0oo.ooo 804 (selniannual )
25 shares per S 1,000 bond
2 ,000 $25 per share
$27.50 pcr share
$500,000 Basic EPS = --------- -
1 00,000 - $5.00
e a ~ ~ . o o o $24.000~) Diluierl EPS = = $4.57
(100,000 T 12,500" + 2,273')
The adjustments are:
Con1 el-tlblc bond (for six n~onths):
'~nterest (net of taxes) of $24.000.
'S 1 .OOO.OOO1$ 1,000 X 25 = 25,000: 12,500 additional cornillon shares for six month>. a Opt1011s:
MP-EP x % I $27.50 - $25 ' Incrementai shares = ---- MP
X 25.000 $27.50
= 2.273 additional common shares*+ Dlluted ear~~ings per share are 8.6% bclou pri~nary EPS.
-
*?.373 ~ncteniental shares arc addcd to the denolillilator because SFAS 138 req~tlres the use of the a\ erage mari;et price ~u thc appl~cation of the treasul? stock iilcthod f o ~ opt~ons.
-i For optlona ~ssucd under nonclual~fied plans, thc exerclse proceeds are l~lcreascd by the ta\ benefits reall~cd by thc firni whcu opt~ons are exercised. D~lu t~on 1s therefole reduccd as more sliarea are deemed to be repurchased
In the late 1990s the concept of "cash EPS" was promoted as a perfoilnance measure. Proponents argued that amortization of goodwill and other intangible assets, the write-off of p~~rchased "in-process research and development," charges related to stock compensation plans, and other noncash charges should be added back to reported earnings. We view cash EPS as part of the effort to justify high pricelearnings ratios and believe that it lacks any ana- lytical basis.
EBITDA per Share
Earnings before interest, taxes, depreciation, and amortization (EBITDA) is computed by adding depreciation and amortization expense to earnings before interest and taxes (EBIT). It is often used as a measure of cash flow, but suffers from many limitations in that it ignores
Variations in accounting nlethods
Cash required for working capital
Debt service and other fixed-charge req~~irenlents
Tlle need to maintain productive capacity
For these reasons, it should not be used blindly for valuation purposes.
PATTERNS OF RATIC) DISCLOSURE AND USE 153
Book Value per Share
This ratio represents the equity of the finn (common equity less preferred shares at I~quida- tion value) on a per-share basis (number of shares outstanding at balance sheet date) and IS
solnetinies used as a benchmark for cornpal-isons with the nlarket price per share. As dls- cussed in Chapter 19, work by Ohlson (1995) has renewed interest in book \ralue (and the price-to-boolc ratio) as a11 ~nput in accounting-based valuation models.
Book \ralue per share. however, has limitations as a valuation tool as it is subject to valu- ation ~neasures based on GAAP
That are bound by historical cost rather than current market value conditions, and
Whose definition of what constitutes an asset or liability may not coincide with eco- llo~nic reality
Thus, the balance sheet may contain goodwill or other intangible assets of uncertain value; the market value of investments and fixed assets may differ markedly fro111 the balance sheet valuation and there may be significant adjustn~ents for off-balance-sheet activities. Adjust- ments to book \ d u e are considered in detail in Chapter 17.
Price-to-Earnings and Price-to-Book-Value Ratios
The PIE ratio measures the degree to which the market capitalizes a firm's earnings. The P!E ratio has been the subject of much scrutiny in the academic as well as the professional world. Its theoretical undeq$nnings, e~npirical behavior. and relationship to the price-to-book-value ratio are discussed in greater detail in Chapter 19.
Book \,slue per shal-e and its relationship to price in the form of the price-to-book (P/H) ratios has received recent attention in the finance and accounting literature. The Ohlson ( 1995) valuation 111odel noted above is one reason. Additionally, Fama and French (1992) found that the P/B ratio (along with size) was the best predictor of future stock returns. Firms with low PIE3 ratios subsequently had consistently higher returns than firms with higll PIB ra- tios. Wc: d iscus this research further in Chapters 18 and 19.
Dividend Payout Ratio
The dividend payout ratio equals the percentage of eai-nings paid out as dividends, that is,
Dividend Payout = DividendsISet Income
Generally, gro\~,th firms have 1 0 ~ 1 dividend payout ratios as they retain most of their in- come to finance Suture expansion. More established. mature firms tend to have higher payout ratios.
PATTERNS OF RATIO DISCLOSURE AND USE
Before concluding this chapter, we remind the reader that the definitions and classificat~ons of ratios we have presented are not set ill stone. The proper definition of a ratio is not man- dated, and these is wide diversity in practice regarding definition, relatil~e importance, and ejJen the categorization of particular ratios (do turnover ratios measure activity, liquidity, or profitability?). This section presents some evidence regarding
How analysts classify and rank ratios Which ratios are most commonly disclosed by firms
Perceived Importance and Classification
Gibson (1987) asked 52 CFAO (Cllartered Financial Analyst) charterholders to classify a set of 60 ratios in terms of whether they measure profitability, liquidity, or debt and to ranl- ( on a scale of 0 to 9) their relative inipox-tance. The analysts agreed on the classification of very
CI--1APTER 4 FOUNDATIOIUS O F RATIO AND FINANCIAL ANALYSIS
few ratios (net profit niargin beibre and after tax and the current, cash, and quick ratios). They gave profitability ratios the highest significance rating of any classification category, followed by debt and then liquidity ratios.
Disclosure of Ratios and Motivation
Ratios arc readily derived fro111 financial statement inforination. There is rarely any ex- plicit disclosure requirenient. When finiis do disclose ratios, the chosen ratios arc con- sistent with those perceived to be most important by the analysts. That 15, ROA, ROE, profit margins, and the debt-to-equity ratio are disclosed ~ n o s t often. liowever, Gibson ( 1982) doculnented the \vide d~sparity in ratio definitions across a sample of 100 annual reports.
Williamson ( 1 984) examined the 1978 annual reports of 141 Fortune 500 f i ~ n ~ s for vol- untary disclosure of ratios. His purpose was to test whether finns engaged in selective disclo- sure; that is, were the ratio values of reporting companies significantly different horn (better than) those of nonreporting companies?
MTi lliamson found e\>idence of selective disclosure fix the three ratios (ROE, current ratio, and ret~lt-11 on sales) that liad the highest frequency of volu~~ta ly disclosure. Williamson's results also provide indirect evidence that the industry norm is a relevant b e l ~ ~ h n ~ a r l i . liis strongest results were consistent with the hypothesis that firrns tend to dis- close a ratio voluntarily when that ratio exceeds the industry nonn.
SUMMARY
This chapter provides an overvic\v of ratios most con~~nonly used in the analysis of financial staten~ents. These ratios, classified as activity. liquidity, solvency, and profitability indica- tors, are designcd to measure different aspects of a firm's operating, investment. and financ- ing acti\ ities. Ratios are used to standardize financial statenlents across filmis and over time, facilitating comparative analysis. Ratios also provide insight into firm l~erfornlance and cco- iloniic relat~onships when evaluated in an integrated analysis.
Ratio analysis is not intended to provide all the answers about a firm, but rather to point to the relevant questions. Throughout the remainder of this book, we will address the clue\- tions raised by these ratios and show how an understanding of the accounting process facili- tates their usc.
Chapter 4 Problems
((;(~11('1-(i1 ,Votc~. For ratlos tha t are generally calculated on aver- age data. usc year-end data M hen prlor-year ~nfonnation 1s not ava~lable )
I . eftects on ratios: CFACl adapted] A company's c ~ i r r e ~ ~ t ratio is 2.0. The company uses some of' its cash io retil-e notcs pnqcable that arc due within one year.
a. Dzscr~bc tlic et'fect o f ~ h i s transaction on the company's
( i ) ( '~ incnt ratio
( i i ) Asset turnover ratio
(iii) Cash burn ratlo
(iv) Debt-to-cqu~ty ratio
b. Redo part a assuming that the company's current ratio was 0.8 at the ~ I I I I C of the transaction.
(Problems 3-2 and 4-3 are based on the financial statc~nents of Walt Disncy in Exhibit 4P- 1 .)
2. [Ratlo calculat~ons; CFAO adapted] Calculate the ra t~os below for D~sney at September 30, 2000 (use ending balance sheet amounts) Br~efly explain the use of each of these ratlos in the el aluat~on of 3 company's operations:
(i) Accounts recell able turno\ er
( i i ) Total asset turnover
(iii) Current ratlo
(iv) CFO to currellt llabillt~es
(w) Dcbt to equ~ty
(vi) T111les interest earned (vii) Operatt'ng Income to sales
Related Documents