THE 3D PRINTING SOLUTIONS COMPANY OVERVIEW Material properties are an important consideration when evaluating additive manufacturing for advanced applications such as production runs of end-use parts. Since these products will be in service for extended periods and in varying conditions, it is imperative to qualify the properties beyond published specifications. To characterize the effects of time, temperature and environment, Loughborough University (Loughborough, UK) performed extensive testing on Fortus ® polycarbonate (PC) thermoplastic. Conducted over a 52-week period, the evaluation measured five properties at temperatures ranging from -40 °C to 140 °C. Additionally, testing evaluated the samples in three environmental conditions: wet (immersed in water), dry (15% relative humidity) and controlled (50% relative humidity). The mechanical properties included: • Tensile strength • Young’s modulus • Flexural strength • Flexural modulus • Elongation at break In accordance with ISO 527 and ISO 178 standards, the evaluation tested 10 samples for each condition. Each sample was produced on a Fortus 400mc 3D Production System using default build parameters* and a T12 tip, which produces a 0.18 mm slice height. To quantify the effects of orientation, test samples used both an upright and on-edge alignment (Figure 1). The university’s comprehensive report, which is available upon request, documents 1500 combinations of mechanical properties and test conditions. To summarize these findings, the following graphs present PC’s performance as time, temperature and environment change while all other factors remain constant. For each condition, graphical illustrations depict the change in tensile strength, flexural modulus and elongation at break for samples built in the on-edge orientation 1 . Also included is a comparison of test values to published properties. *To optimize mechanical properties, Fortus offers user-controls that will alter construction parameters. 1 Part orientation, as well as build parameters, will alter mechanical properties. Please consider the report data accordingly. FORTUS PC (Polycarbonate) CHARACTERIZATION OF MATERIAL PROPERTIES Figure 1: Test sample orientations

Welcome message from author
This document is posted to help you gain knowledge. Please leave a comment to let me know what you think about it! Share it to your friends and learn new things together.
Transcript
THE 3D PRINTING SOLUTIONS COMPANY
OVERVIEWMaterial properties are an important consideration when evaluating additive manufacturing for advanced applications such as production
runs of end-use parts. Since these products will be in service for extended periods and in varying conditions, it is imperative to qualify the
properties beyond published specifications.
To characterize the effects of time, temperature and environment, Loughborough University (Loughborough, UK) performed extensive
testing on Fortus® polycarbonate (PC) thermoplastic. Conducted over a 52-week period, the evaluation measured five properties at
temperatures ranging from -40 °C to 140 °C. Additionally, testing evaluated the samples in three environmental conditions: wet (immersed
in water), dry (15% relative humidity) and controlled (50% relative humidity). The mechanical properties included:
• Tensile strength• Young’s modulus• Flexural strength• Flexural modulus• Elongation at break
In accordance with ISO 527 and ISO 178 standards, the evaluation tested 10 samples for
each condition. Each sample was produced on a Fortus 400mc 3D Production System using
default build parameters* and a T12 tip, which produces a 0.18 mm slice height. To quantify
the effects of orientation, test samples used both an upright and on-edge alignment
(Figure 1).
The university’s comprehensive report, which is available upon request, documents 1500
combinations of mechanical properties and test conditions. To summarize these findings, the
following graphs present PC’s performance as time, temperature and environment change
while all other factors remain constant. For each condition, graphical illustrations depict the
change in tensile strength, flexural modulus and elongation at break for samples built in the
on-edge orientation1. Also included is a comparison of test values to published properties.
*To optimize mechanical properties, Fortus offers user-controls that will alter construction parameters. 1Part orientation, as well as build parameters, will alter mechanical properties. Please consider the report data accordingly.
FORTUS PC (Polycarbonate)C H A R A C T E R I Z AT I O N O F M AT E R I A L P R O P E RT I E S
Figure 1: Test sample orientations
THE 3D PRINTING SOLUTIONS COMPANY
Effects Of AgeP O LY C A R B O N AT E
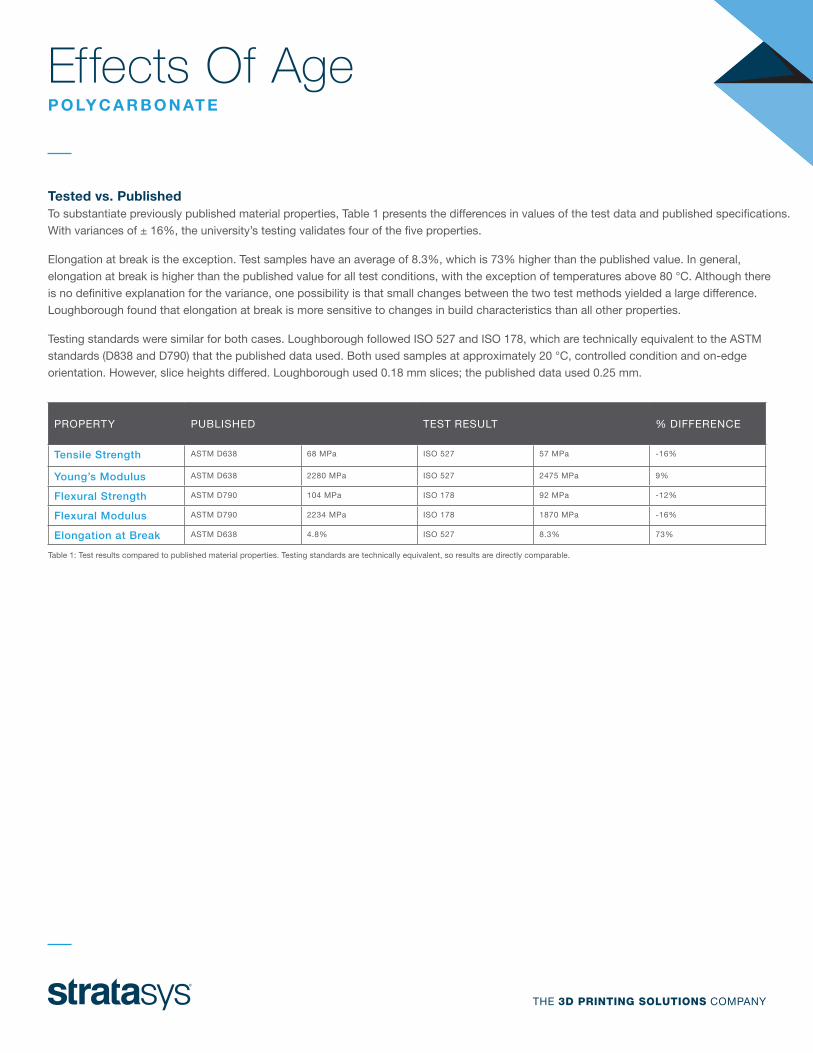
Tested vs. PublishedTo substantiate previously published material properties, Table 1 presents the differences in values of the test data and published specifications.
With variances of ± 16%, the university’s testing validates four of the five properties.
Elongation at break is the exception. Test samples have an average of 8.3%, which is 73% higher than the published value. In general,
elongation at break is higher than the published value for all test conditions, with the exception of temperatures above 80 °C. Although there
is no definitive explanation for the variance, one possibility is that small changes between the two test methods yielded a large difference.
Loughborough found that elongation at break is more sensitive to changes in build characteristics than all other properties.
Testing standards were similar for both cases. Loughborough followed ISO 527 and ISO 178, which are technically equivalent to the ASTM
standards (D838 and D790) that the published data used. Both used samples at approximately 20 °C, controlled condition and on-edge
orientation. However, slice heights differed. Loughborough used 0.18 mm slices; the published data used 0.25 mm.
PROPERTY PUBLISHED TEST RESULT % DIFFERENCE
Tensile Strength ASTM D638 68 MPa ISO 527 57 MPa -16%
Young’s Modulus ASTM D638 2280 MPa ISO 527 2475 MPa 9%
Flexural Strength ASTM D790 104 MPa ISO 178 92 MPa -12%
Flexural Modulus ASTM D790 2234 MPa ISO 178 1870 MPa -16%
Elongation at Break ASTM D638 4.8% ISO 527 8.3% 73%
Table 1: Test results compared to published material properties. Testing standards are technically equivalent, so results are directly comparable.
THE 3D PRINTING SOLUTIONS COMPANY
Effects Of AgeP O LY C A R B O N AT E
INTRODUCTIONTo show the effects of age on PC, mechanical properties were measured at 1, 4, 13, 26 and 52 weeks. The bar graphs for each mechanical
property show the value at 20 °C for samples built on edge and stored in a controlled environment. Each graph also shows reference
markers for wet and dry samples as well as line graphs for temperatures of -40, 0, 40, 80, 120 and 140 °C.
The test results show that all mechanical properties are stable over a 52-week period. Comparing 1-week and 52-week samples, there
is only a 3.5% and 0.2% change for tensile strength and flexural modulus (respectively). While elongation at break declined at the half-
year mark, the total variance over 52 weeks was small (12.0%). Likewise, the variances between wet, dry and controlled environmental
conditions are also small at nearly all combinations of temperature and age.
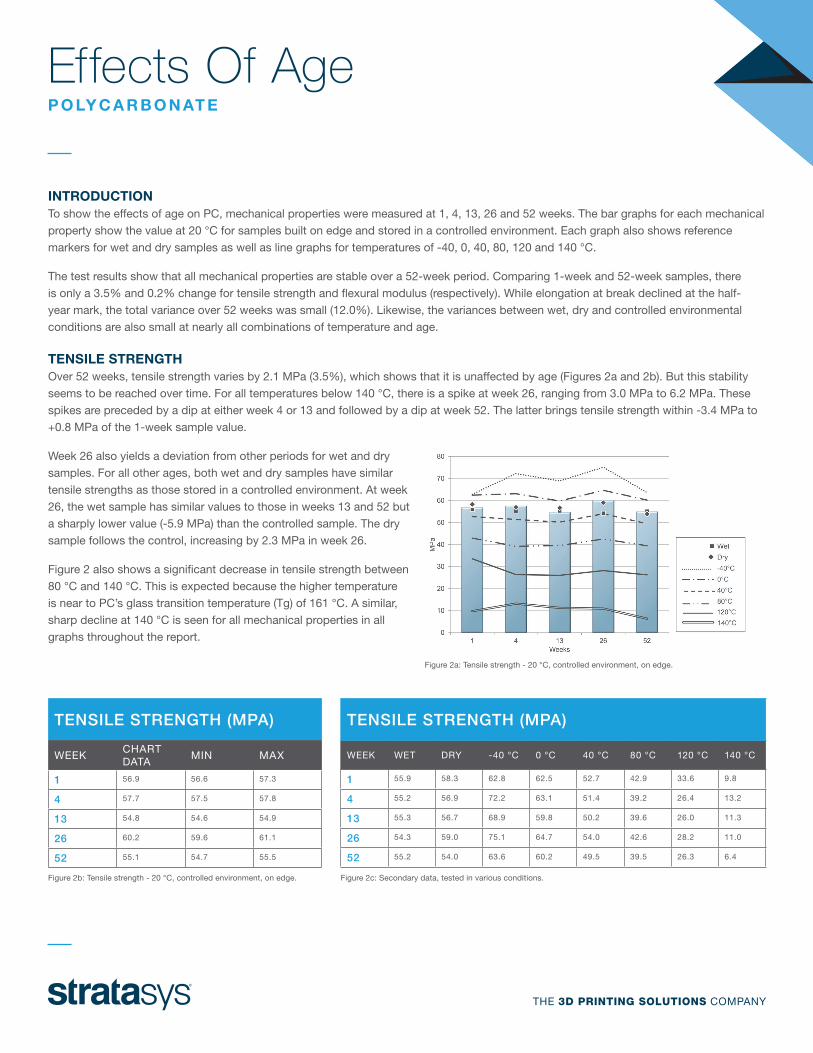
TENSILE STRENGTHOver 52 weeks, tensile strength varies by 2.1 MPa (3.5%), which shows that it is unaffected by age (Figures 2a and 2b). But this stability
seems to be reached over time. For all temperatures below 140 °C, there is a spike at week 26, ranging from 3.0 MPa to 6.2 MPa. These
spikes are preceded by a dip at either week 4 or 13 and followed by a dip at week 52. The latter brings tensile strength within -3.4 MPa to
+0.8 MPa of the 1-week sample value.
Week 26 also yields a deviation from other periods for wet and dry
samples. For all other ages, both wet and dry samples have similar
tensile strengths as those stored in a controlled environment. At week
26, the wet sample has similar values to those in weeks 13 and 52 but
a sharply lower value (-5.9 MPa) than the controlled sample. The dry
sample follows the control, increasing by 2.3 MPa in week 26.
Figure 2 also shows a significant decrease in tensile strength between
80 °C and 140 °C. This is expected because the higher temperature
is near to PC’s glass transition temperature (Tg) of 161 °C. A similar,
sharp decline at 140 °C is seen for all mechanical properties in all
graphs throughout the report.
TENSILE STRENGTH (MPA)
WEEKCHART DATA
MIN MAX
1 56.9 56.6 57.3
4 57.7 57.5 57.8
13 54.8 54.6 54.9
26 60.2 59.6 61.1
52 55.1 54.7 55.5
Figure 2b: Tensile strength - 20 °C, controlled environment, on edge.
TENSILE STRENGTH (MPA)
WEEK WET DRY -40 °C 0 °C 40 °C 80 °C 120 °C 140 °C
1 55.9 58.3 62.8 62.5 52.7 42.9 33.6 9.8
4 55.2 56.9 72.2 63.1 51.4 39.2 26.4 13.2
13 55.3 56.7 68.9 59.8 50.2 39.6 26.0 11.3
26 54.3 59.0 75.1 64.7 54.0 42.6 28.2 11.0
52 55.2 54.0 63.6 60.2 49.5 39.5 26.3 6.4
Figure 2c: Secondary data, tested in various conditions.
Figure 2a: Tensile strength - 20 °C, controlled environment, on edge.
THE 3D PRINTING SOLUTIONS COMPANY
Effects Of AgeP O LY C A R B O N AT E
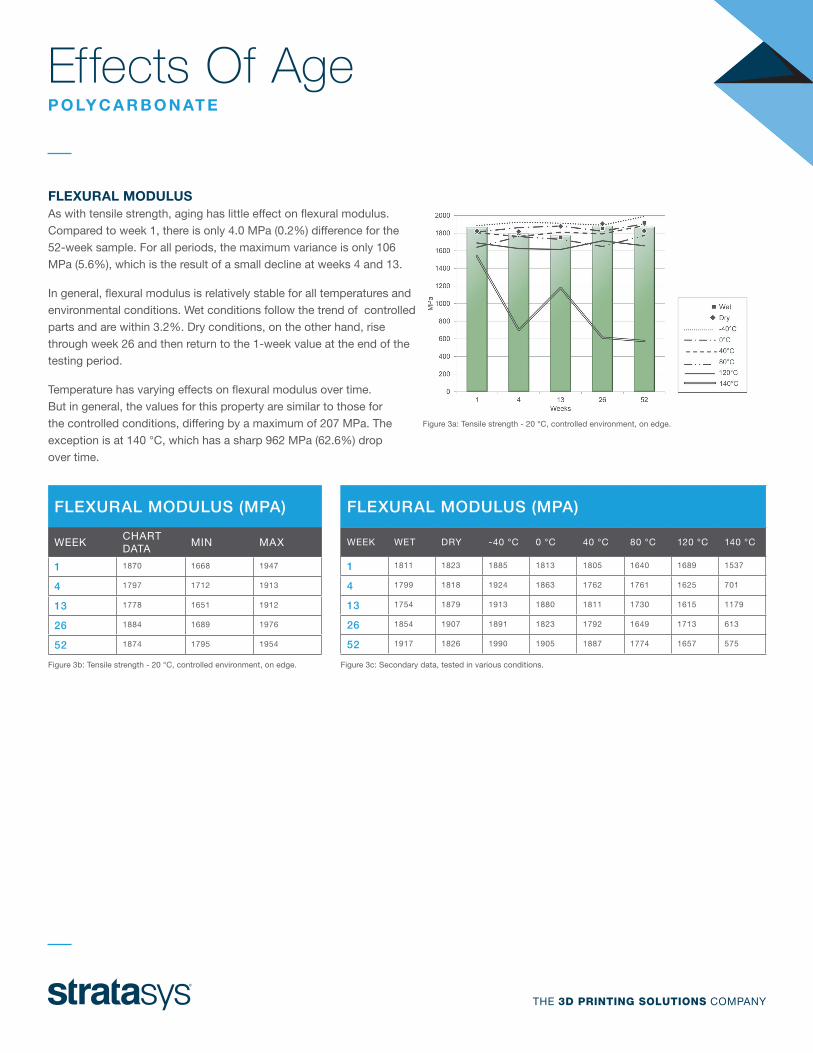
FLEXURAL MODULUSAs with tensile strength, aging has little effect on flexural modulus.
Compared to week 1, there is only 4.0 MPa (0.2%) difference for the
52-week sample. For all periods, the maximum variance is only 106
MPa (5.6%), which is the result of a small decline at weeks 4 and 13.
In general, flexural modulus is relatively stable for all temperatures and
environmental conditions. Wet conditions follow the trend of controlled
parts and are within 3.2%. Dry conditions, on the other hand, rise
through week 26 and then return to the 1-week value at the end of the
testing period.
Temperature has varying effects on flexural modulus over time.
But in general, the values for this property are similar to those for
the controlled conditions, differing by a maximum of 207 MPa. The
exception is at 140 °C, which has a sharp 962 MPa (62.6%) drop
over time.
FLEXURAL MODULUS (MPA)
WEEKCHART DATA
MIN MAX
1 1870 1668 1947
4 1797 1712 1913
13 1778 1651 1912
26 1884 1689 1976
52 1874 1795 1954
Figure 3b: Tensile strength - 20 °C, controlled environment, on edge.
FLEXURAL MODULUS (MPA)
WEEK WET DRY -40 °C 0 °C 40 °C 80 °C 120 °C 140 °C
1 1811 1823 1885 1813 1805 1640 1689 1537
4 1799 1818 1924 1863 1762 1761 1625 701
13 1754 1879 1913 1880 1811 1730 1615 1179
26 1854 1907 1891 1823 1792 1649 1713 613
52 1917 1826 1990 1905 1887 1774 1657 575
Figure 3c: Secondary data, tested in various conditions.
Figure 3a: Tensile strength - 20 °C, controlled environment, on edge.
THE 3D PRINTING SOLUTIONS COMPANY
Effects Of AgeP O LY C A R B O N AT E
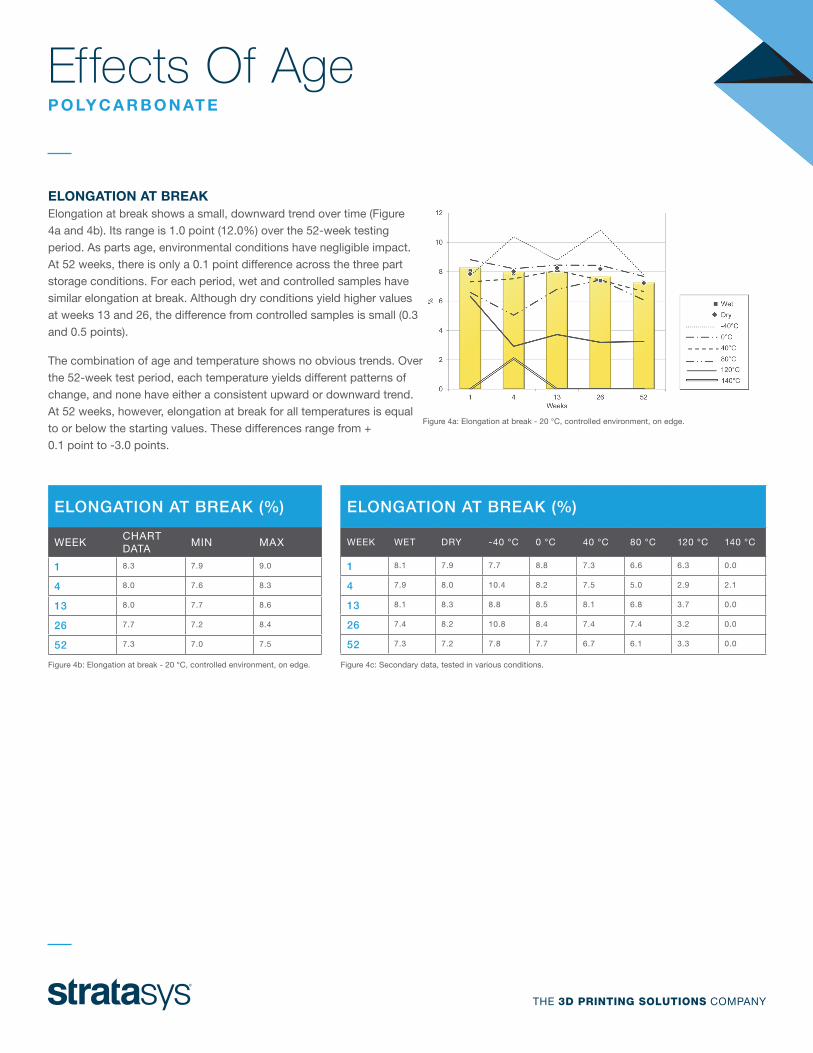
ELONGATION AT BREAKElongation at break shows a small, downward trend over time (Figure
4a and 4b). Its range is 1.0 point (12.0%) over the 52-week testing
period. As parts age, environmental conditions have negligible impact.
At 52 weeks, there is only a 0.1 point difference across the three part
storage conditions. For each period, wet and controlled samples have
similar elongation at break. Although dry conditions yield higher values
at weeks 13 and 26, the difference from controlled samples is small (0.3
and 0.5 points).
The combination of age and temperature shows no obvious trends. Over
the 52-week test period, each temperature yields different patterns of
change, and none have either a consistent upward or downward trend.
At 52 weeks, however, elongation at break for all temperatures is equal
to or below the starting values. These differences range from +
0.1 point to -3.0 points.
ELONGATION AT BREAK (%)
WEEKCHART DATA
MIN MAX
1 8.3 7.9 9.0
4 8.0 7.6 8.3
13 8.0 7.7 8.6
26 7.7 7.2 8.4
52 7.3 7.0 7.5
Figure 4b: Elongation at break - 20 °C, controlled environment, on edge.
ELONGATION AT BREAK (%)
WEEK WET DRY -40 °C 0 °C 40 °C 80 °C 120 °C 140 °C
1 8.1 7.9 7.7 8.8 7.3 6.6 6.3 0.0
4 7.9 8.0 10.4 8.2 7.5 5.0 2.9 2.1
13 8.1 8.3 8.8 8.5 8.1 6.8 3.7 0.0
26 7.4 8.2 10.8 8.4 7.4 7.4 3.2 0.0
52 7.3 7.2 7.8 7.7 6.7 6.1 3.3 0.0
Figure 4c: Secondary data, tested in various conditions.
Figure 4a: Elongation at break - 20 °C, controlled environment, on edge.
THE 3D PRINTING SOLUTIONS COMPANY
Effects Of TemperatureP O LY C A R B O N AT E
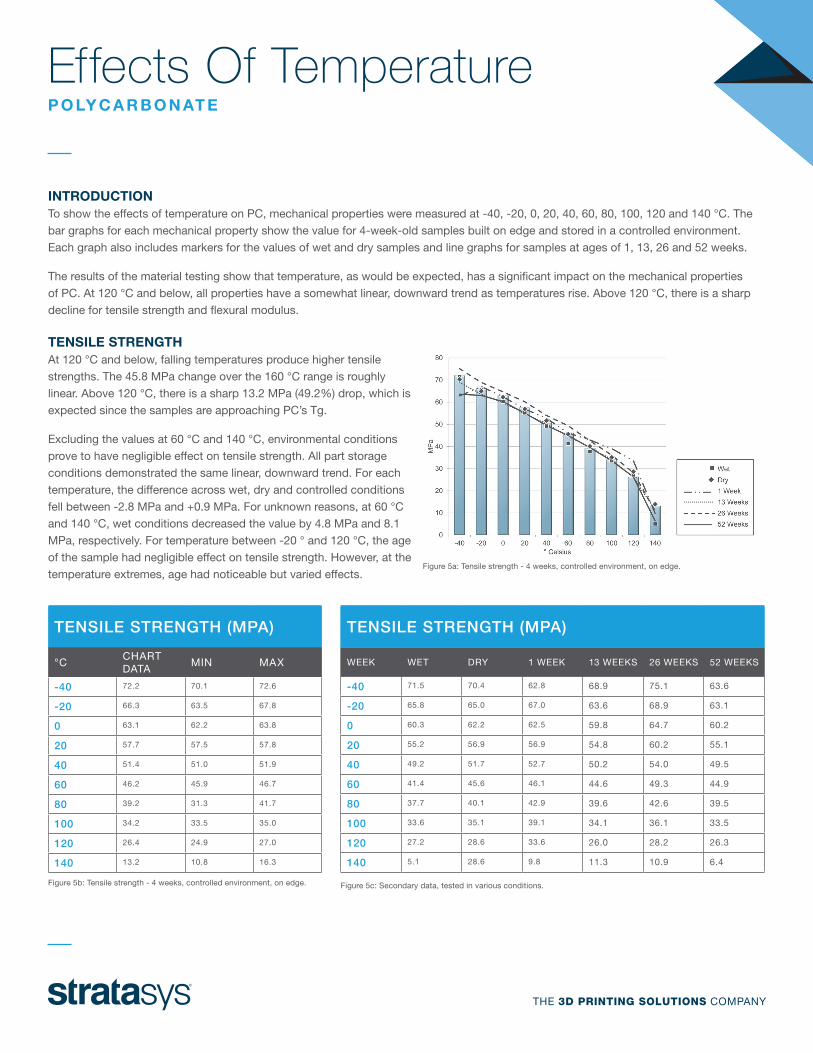
INTRODUCTIONTo show the effects of temperature on PC, mechanical properties were measured at -40, -20, 0, 20, 40, 60, 80, 100, 120 and 140 °C. The
bar graphs for each mechanical property show the value for 4-week-old samples built on edge and stored in a controlled environment.
Each graph also includes markers for the values of wet and dry samples and line graphs for samples at ages of 1, 13, 26 and 52 weeks.
The results of the material testing show that temperature, as would be expected, has a significant impact on the mechanical properties
of PC. At 120 °C and below, all properties have a somewhat linear, downward trend as temperatures rise. Above 120 °C, there is a sharp
decline for tensile strength and flexural modulus.
TENSILE STRENGTHAt 120 °C and below, falling temperatures produce higher tensile
strengths. The 45.8 MPa change over the 160 °C range is roughly
linear. Above 120 °C, there is a sharp 13.2 MPa (49.2%) drop, which is
expected since the samples are approaching PC’s Tg.
Excluding the values at 60 °C and 140 °C, environmental conditions
prove to have negligible effect on tensile strength. All part storage
conditions demonstrated the same linear, downward trend. For each
temperature, the difference across wet, dry and controlled conditions
fell between -2.8 MPa and +0.9 MPa. For unknown reasons, at 60 °C
and 140 °C, wet conditions decreased the value by 4.8 MPa and 8.1
MPa, respectively. For temperature between -20 ° and 120 °C, the age
of the sample had negligible effect on tensile strength. However, at the
temperature extremes, age had noticeable but varied effects.
TENSILE STRENGTH (MPA)
°CCHART DATA
MIN MAX
-40 72.2 70.1 72.6
-20 66.3 63.5 67.8
0 63.1 62.2 63.8
20 57.7 57.5 57.8
40 51.4 51.0 51.9
60 46.2 45.9 46.7
80 39.2 31.3 41.7
100 34.2 33.5 35.0
120 26.4 24.9 27.0
140 13.2 10.8 16.3
Figure 5b: Tensile strength - 4 weeks, controlled environment, on edge.
TENSILE STRENGTH (MPA)
WEEK WET DRY 1 WEEK 13 WEEKS 26 WEEKS 52 WEEKS
-40 71.5 70.4 62.8 68.9 75.1 63.6
-20 65.8 65.0 67.0 63.6 68.9 63.1
0 60.3 62.2 62.5 59.8 64.7 60.2
20 55.2 56.9 56.9 54.8 60.2 55.1
40 49.2 51.7 52.7 50.2 54.0 49.5
60 41.4 45.6 46.1 44.6 49.3 44.9
80 37.7 40.1 42.9 39.6 42.6 39.5
100 33.6 35.1 39.1 34.1 36.1 33.5
120 27.2 28.6 33.6 26.0 28.2 26.3
140 5.1 28.6 9.8 11.3 10.9 6.4
Figure 5c: Secondary data, tested in various conditions.
Figure 5a: Tensile strength - 4 weeks, controlled environment, on edge.
THE 3D PRINTING SOLUTIONS COMPANY
Effects Of TemperatureP O LY C A R B O N AT E
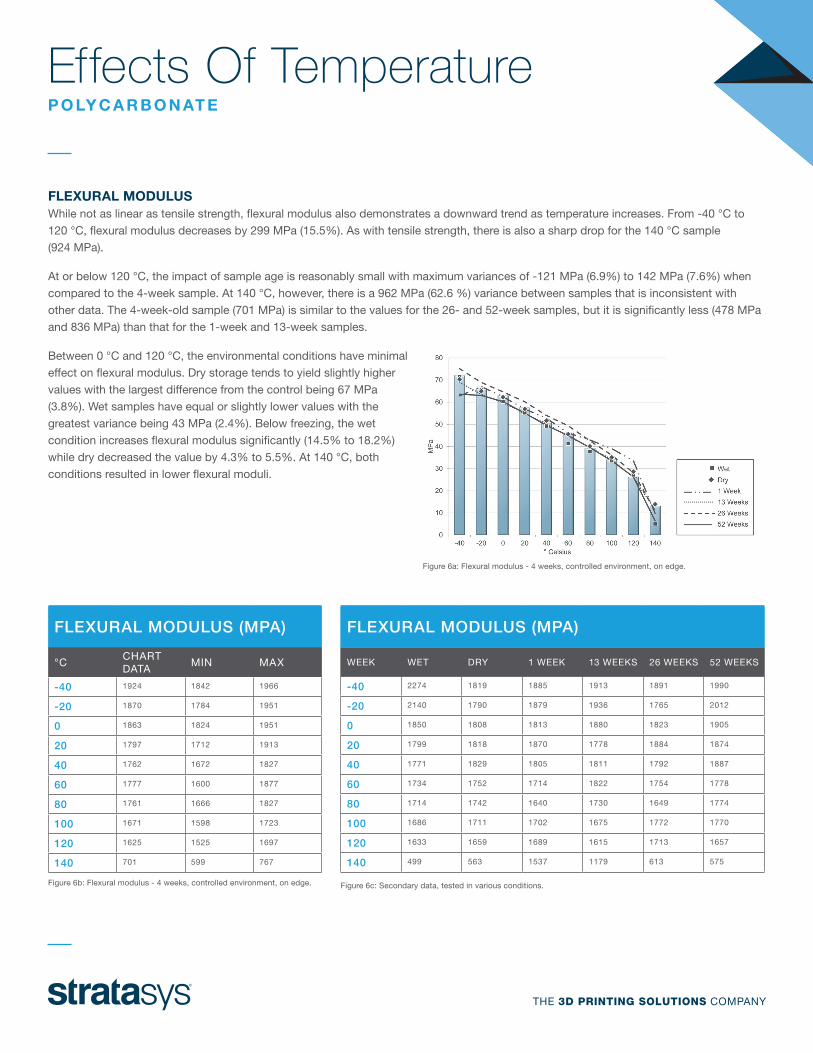
FLEXURAL MODULUSWhile not as linear as tensile strength, flexural modulus also demonstrates a downward trend as temperature increases. From -40 °C to
120 °C, flexural modulus decreases by 299 MPa (15.5%). As with tensile strength, there is also a sharp drop for the 140 °C sample
(924 MPa).
At or below 120 °C, the impact of sample age is reasonably small with maximum variances of -121 MPa (6.9%) to 142 MPa (7.6%) when
compared to the 4-week sample. At 140 °C, however, there is a 962 MPa (62.6 %) variance between samples that is inconsistent with
other data. The 4-week-old sample (701 MPa) is similar to the values for the 26- and 52-week samples, but it is significantly less (478 MPa
and 836 MPa) than that for the 1-week and 13-week samples.
Between 0 °C and 120 °C, the environmental conditions have minimal
effect on flexural modulus. Dry storage tends to yield slightly higher
values with the largest difference from the control being 67 MPa
(3.8%). Wet samples have equal or slightly lower values with the
greatest variance being 43 MPa (2.4%). Below freezing, the wet
condition increases flexural modulus significantly (14.5% to 18.2%)
while dry decreased the value by 4.3% to 5.5%. At 140 °C, both
conditions resulted in lower flexural moduli.
FLEXURAL MODULUS (MPA)
°CCHART DATA
MIN MAX
-40 1924 1842 1966
-20 1870 1784 1951
0 1863 1824 1951
20 1797 1712 1913
40 1762 1672 1827
60 1777 1600 1877
80 1761 1666 1827
100 1671 1598 1723
120 1625 1525 1697
140 701 599 767
Figure 6b: Flexural modulus - 4 weeks, controlled environment, on edge.
FLEXURAL MODULUS (MPA)
WEEK WET DRY 1 WEEK 13 WEEKS 26 WEEKS 52 WEEKS
-40 2274 1819 1885 1913 1891 1990
-20 2140 1790 1879 1936 1765 2012
0 1850 1808 1813 1880 1823 1905
20 1799 1818 1870 1778 1884 1874
40 1771 1829 1805 1811 1792 1887
60 1734 1752 1714 1822 1754 1778
80 1714 1742 1640 1730 1649 1774
100 1686 1711 1702 1675 1772 1770
120 1633 1659 1689 1615 1713 1657
140 499 563 1537 1179 613 575
Figure 6c: Secondary data, tested in various conditions.
Figure 6a: Flexural modulus - 4 weeks, controlled environment, on edge.
THE 3D PRINTING SOLUTIONS COMPANY
Effects Of TemperatureP O LY C A R B O N AT E
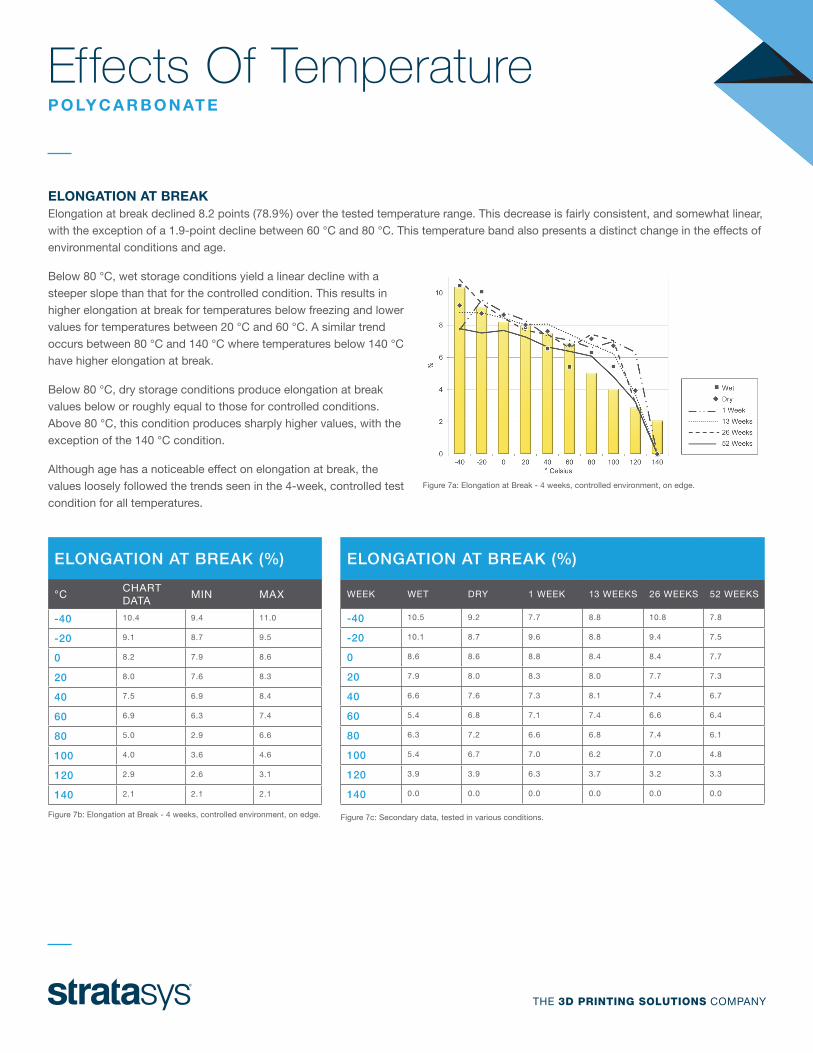
ELONGATION AT BREAKElongation at break declined 8.2 points (78.9%) over the tested temperature range. This decrease is fairly consistent, and somewhat linear,
with the exception of a 1.9-point decline between 60 °C and 80 °C. This temperature band also presents a distinct change in the effects of
environmental conditions and age.
Below 80 °C, wet storage conditions yield a linear decline with a
steeper slope than that for the controlled condition. This results in
higher elongation at break for temperatures below freezing and lower
values for temperatures between 20 °C and 60 °C. A similar trend
occurs between 80 °C and 140 °C where temperatures below 140 °C
have higher elongation at break.
Below 80 °C, dry storage conditions produce elongation at break
values below or roughly equal to those for controlled conditions.
Above 80 °C, this condition produces sharply higher values, with the
exception of the 140 °C condition.
Although age has a noticeable effect on elongation at break, the
values loosely followed the trends seen in the 4-week, controlled test
condition for all temperatures.
ELONGATION AT BREAK (%)
°CCHART DATA
MIN MAX
-40 10.4 9.4 11.0
-20 9.1 8.7 9.5
0 8.2 7.9 8.6
20 8.0 7.6 8.3
40 7.5 6.9 8.4
60 6.9 6.3 7.4
80 5.0 2.9 6.6
100 4.0 3.6 4.6
120 2.9 2.6 3.1
140 2.1 2.1 2.1
Figure 7b: Elongation at Break - 4 weeks, controlled environment, on edge.
ELONGATION AT BREAK (%)
WEEK WET DRY 1 WEEK 13 WEEKS 26 WEEKS 52 WEEKS
-40 10.5 9.2 7.7 8.8 10.8 7.8
-20 10.1 8.7 9.6 8.8 9.4 7.5
0 8.6 8.6 8.8 8.4 8.4 7.7
20 7.9 8.0 8.3 8.0 7.7 7.3
40 6.6 7.6 7.3 8.1 7.4 6.7
60 5.4 6.8 7.1 7.4 6.6 6.4
80 6.3 7.2 6.6 6.8 7.4 6.1
100 5.4 6.7 7.0 6.2 7.0 4.8
120 3.9 3.9 6.3 3.7 3.2 3.3
140 0.0 0.0 0.0 0.0 0.0 0.0
Figure 7c: Secondary data, tested in various conditions.
Figure 7a: Elongation at Break - 4 weeks, controlled environment, on edge.
THE 3D PRINTING SOLUTIONS COMPANY
Effects Of Environmental Conditions P O LY C A R B O N AT E
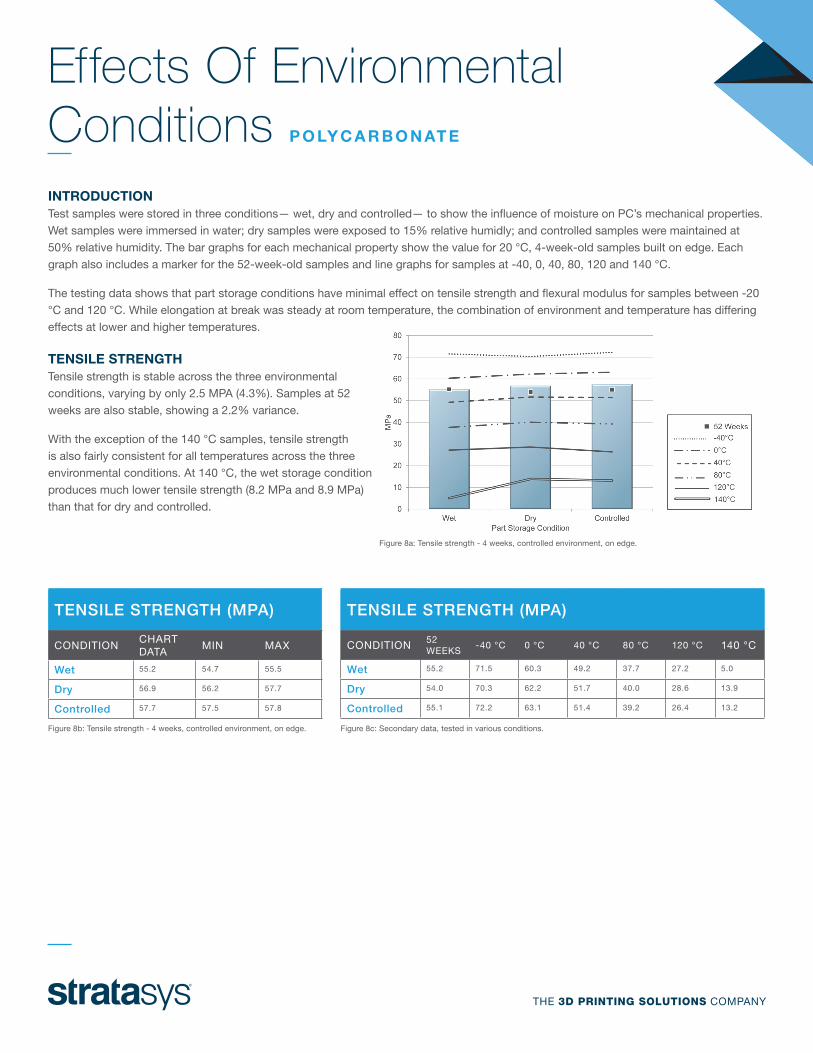
INTRODUCTIONTest samples were stored in three conditions— wet, dry and controlled— to show the influence of moisture on PC’s mechanical properties.
Wet samples were immersed in water; dry samples were exposed to 15% relative humidly; and controlled samples were maintained at
50% relative humidity. The bar graphs for each mechanical property show the value for 20 °C, 4-week-old samples built on edge. Each
graph also includes a marker for the 52-week-old samples and line graphs for samples at -40, 0, 40, 80, 120 and 140 °C.
The testing data shows that part storage conditions have minimal effect on tensile strength and flexural modulus for samples between -20
°C and 120 °C. While elongation at break was steady at room temperature, the combination of environment and temperature has differing
effects at lower and higher temperatures.
TENSILE STRENGTHTensile strength is stable across the three environmental
conditions, varying by only 2.5 MPA (4.3%). Samples at 52
weeks are also stable, showing a 2.2% variance.
With the exception of the 140 °C samples, tensile strength
is also fairly consistent for all temperatures across the three
environmental conditions. At 140 °C, the wet storage condition
produces much lower tensile strength (8.2 MPa and 8.9 MPa)
than that for dry and controlled.
TENSILE STRENGTH (MPA)
CONDITIONCHART DATA
MIN MAX
Wet 55.2 54.7 55.5
Dry 56.9 56.2 57.7
Controlled 57.7 57.5 57.8
Figure 8b: Tensile strength - 4 weeks, controlled environment, on edge.
TENSILE STRENGTH (MPA)
CONDITION 52WEEKS
-40 °C 0 °C 40 °C 80 °C 120 °C 140 °C
Wet 55.2 71.5 60.3 49.2 37.7 27.2 5.0
Dry 54.0 70.3 62.2 51.7 40.0 28.6 13.9
Controlled 55.1 72.2 63.1 51.4 39.2 26.4 13.2
Figure 8c: Secondary data, tested in various conditions.
Figure 8a: Tensile strength - 4 weeks, controlled environment, on edge.
THE 3D PRINTING SOLUTIONS COMPANY
Effects Of Environmental Conditions P O LY C A R B O N AT E
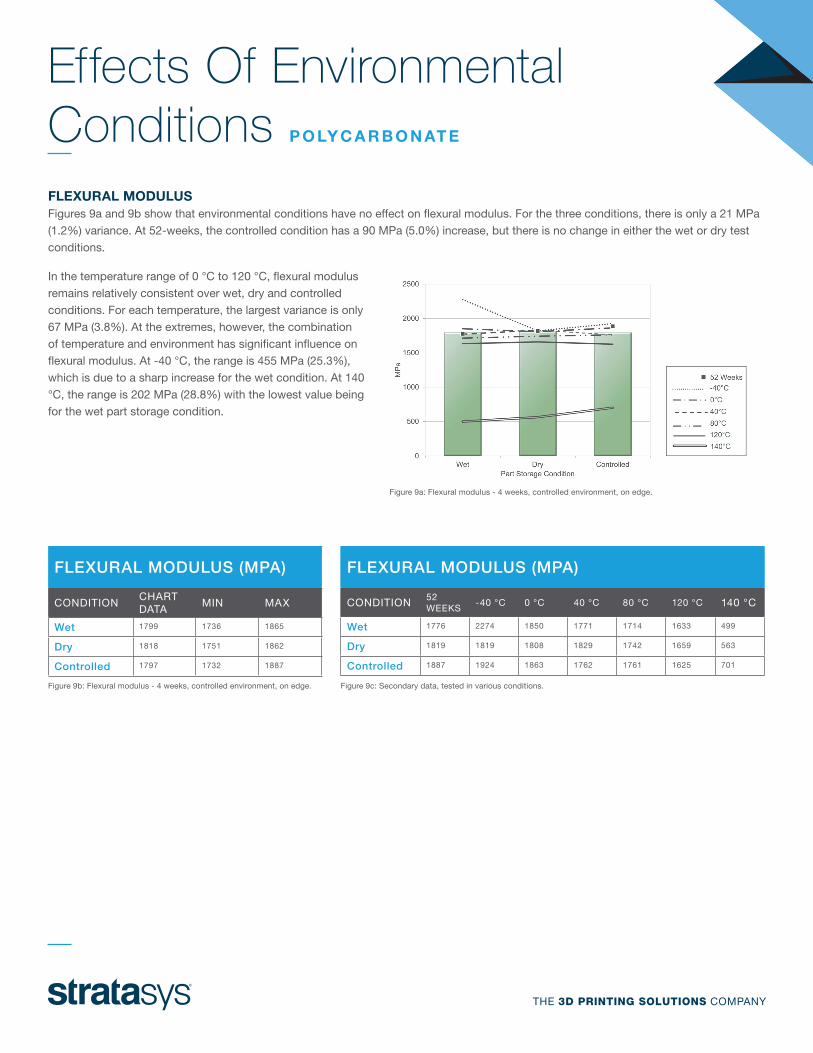
FLEXURAL MODULUSFigures 9a and 9b show that environmental conditions have no effect on flexural modulus. For the three conditions, there is only a 21 MPa
(1.2%) variance. At 52-weeks, the controlled condition has a 90 MPa (5.0%) increase, but there is no change in either the wet or dry test
conditions.
In the temperature range of 0 °C to 120 °C, flexural modulus
remains relatively consistent over wet, dry and controlled
conditions. For each temperature, the largest variance is only
67 MPa (3.8%). At the extremes, however, the combination
of temperature and environment has significant influence on
flexural modulus. At -40 °C, the range is 455 MPa (25.3%),
which is due to a sharp increase for the wet condition. At 140
°C, the range is 202 MPa (28.8%) with the lowest value being
for the wet part storage condition.
FLEXURAL MODULUS (MPA)
CONDITIONCHART DATA
MIN MAX
Wet 1799 1736 1865
Dry 1818 1751 1862
Controlled 1797 1732 1887
Figure 9b: Flexural modulus - 4 weeks, controlled environment, on edge.
FLEXURAL MODULUS (MPA)
CONDITION 52WEEKS
-40 °C 0 °C 40 °C 80 °C 120 °C 140 °C
Wet 1776 2274 1850 1771 1714 1633 499
Dry 1819 1819 1808 1829 1742 1659 563
Controlled 1887 1924 1863 1762 1761 1625 701
Figure 9c: Secondary data, tested in various conditions.
Figure 9a: Flexural modulus - 4 weeks, controlled environment, on edge.
HEADQUARTERS7665 Commerce Way, Eden Prairie, MN 55344+1 888 480-3548 (US Toll Free)+1 952 937-3000 (Intl)+1 952 937-0070 (Fax)
2 Holtzman St., Science Park, PO Box 2496 Rehovot 76124, Israel +972 74 745-4000+972 74 745-5000 (Fax)
©2013 Stratasys Inc. All rights reserved. Stratasys, FDM, Fortus and Finishing Touch are registered trademarks of Stratasys Inc. FDM Technology, Fused Deposition Modeling, Fortus 200mc, Fortus 250mc, Fortus 360mc, Fortus 400mc, Fortus 900mc, Insight, Control Center, FDM Team, Smart Supports, SR-30, SR-100, ABSplus, ABS-ESD7, and TouchWorks are trademarks of Stratasys, Inc. *ULTEM is a trademark of SABIC Innovative Plastics IP BV. All other trademarks are the property of their respective owners, and Stratasys assumes no responsibility with regard to the selection, performance, or use of these non-Stratasys products. Product specifications subject to change without notice. Printed in the USA. MSS_FDM_PCPropertiesReport_EN_0815
E [email protected] / STRATASYS.COM
ISO 9001:2008 Certified
Effects Of Environmental Conditions P O LY C A R B O N AT E
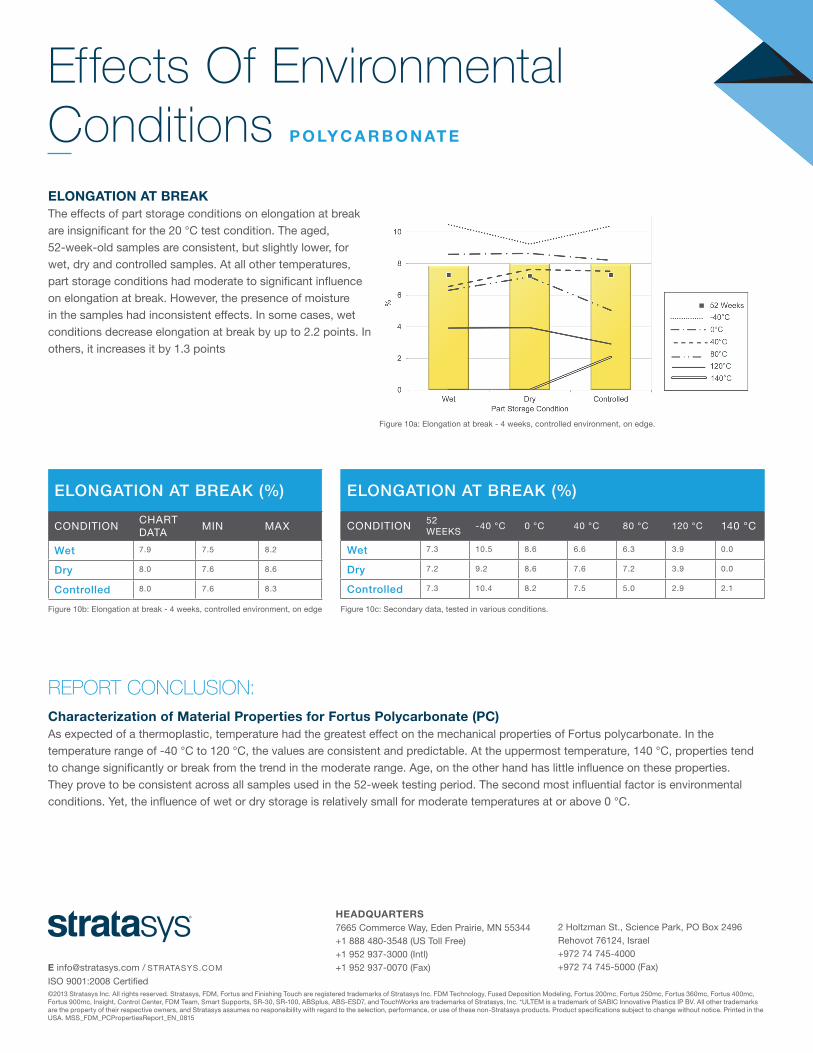
ELONGATION AT BREAKThe effects of part storage conditions on elongation at break
are insignificant for the 20 °C test condition. The aged,
52-week-old samples are consistent, but slightly lower, for
wet, dry and controlled samples. At all other temperatures,
part storage conditions had moderate to significant influence
on elongation at break. However, the presence of moisture
in the samples had inconsistent effects. In some cases, wet
conditions decrease elongation at break by up to 2.2 points. In
others, it increases it by 1.3 points
ELONGATION AT BREAK (%)
CONDITIONCHART DATA
MIN MAX
Wet 7.9 7.5 8.2
Dry 8.0 7.6 8.6
Controlled 8.0 7.6 8.3
Figure 10b: Elongation at break - 4 weeks, controlled environment, on edge
ELONGATION AT BREAK (%)
CONDITION 52WEEKS
-40 °C 0 °C 40 °C 80 °C 120 °C 140 °C
Wet 7.3 10.5 8.6 6.6 6.3 3.9 0.0
Dry 7.2 9.2 8.6 7.6 7.2 3.9 0.0
Controlled 7.3 10.4 8.2 7.5 5.0 2.9 2.1
Figure 10c: Secondary data, tested in various conditions.
Figure 10a: Elongation at break - 4 weeks, controlled environment, on edge.
REPORT CONCLUSION:Characterization of Material Properties for Fortus Polycarbonate (PC)As expected of a thermoplastic, temperature had the greatest effect on the mechanical properties of Fortus polycarbonate. In the
temperature range of -40 °C to 120 °C, the values are consistent and predictable. At the uppermost temperature, 140 °C, properties tend
to change significantly or break from the trend in the moderate range. Age, on the other hand has little influence on these properties.
They prove to be consistent across all samples used in the 52-week testing period. The second most influential factor is environmental
conditions. Yet, the influence of wet or dry storage is relatively small for moderate temperatures at or above 0 °C.
Related Documents


![Specification...Original Properties Tensile Strength, psi (MPa) ASTM D638 1,500 (10.34) Min. (after conditioning Tensile Stress, psi (MPa) ASTM D638 500 (3.45) Min. at 100ºF [37ºC]](https://static.cupdf.com/doc/110x72/612910692aee8938e12dd1fe/specification-original-properties-tensile-strength-psi-mpa-astm-d638-1500.jpg)