Form Four Examinaon Results Cizens report on the learning crisis in Tanzania 1. Introducon On 18 February 2013, the Government of Tanzania announced that 240,903 out of 397,126 students who sat the 2012 Naonal Form Four exams failed, pung the failure rate at 61% (up from 46% in 2011). A further 34% received Division IV, meaning only 6% received a meaningful pass rate of Division I, II and III combined. The 2012 Form Four results have been labelled “disastrous” and “shocking” and have prompted the Prime Minister to form a Commission to invesgate what caused the poor results and to provide recommendaons (as yet unpublished). In this brief Uwazi at Twaweza contributes to the debate, presenng the most recent naonally representave educaon data available to date. The data have been collected by Sau za Wananchi (www.twaweza.org/sau) a mobile phone survey in Tanzania and the first of its kind in Africa. The data used in this brief were collected from 18 March to 3 April 2013. The brief also presents findings from the Sau za Wananchi baseline survey (face to face interviews) which was implemented between October and December 2012. The baseline survey was conducted among 2,000 households across mainland Tanzania, while Round 1 of the mobile phone survey reached 1774 of these households (89% of the baseline survey sample). We also offer evidence using BEST (Basic Educaon Stascs of Tanzania) data, from 1998 to 2012, published by the Ministry of Educaon and Vocaonal Training (MOEVT). Brief No. 2 This note was wrien and produced by Uwazi at Twaweza, housed by Hivos Tanzania. Released May 2013 P.O. Box 38342, Dar es Salaam, Tanzania. Te: +255 22 266 4301 F: +255 22 266 4308. [email protected] www.twaweza.org/sau 1 May 2013 As this brief was going to print, the government announced in parliament that the 2012 Form Four results were annulled and will be revised using the previous grading system.

Welcome message from author
This document is posted to help you gain knowledge. Please leave a comment to let me know what you think about it! Share it to your friends and learn new things together.
Transcript

Form Four Examination Results Citizens report on the learning crisis in Tanzania
1. IntroductionOn 18 February 2013, the Government of Tanzania announced that 240,903 out of 397,126 students who sat the 2012 National Form Four exams failed, putting the failure rate at 61% (up from 46% in 2011). A further 34% received Division IV, meaning only 6% received a meaningful pass rate of Division I, II and III combined.
The 2012 Form Four results have been labelled “disastrous” and “shocking” and have prompted the Prime Minister to form a Commission to investigate what caused the poor results and to provide recommendations (as yet unpublished). In this brief Uwazi at Twaweza contributes to the debate, presenting the most recent nationally representative education data available to date. The data have been collected by Sauti za Wananchi (www.twaweza.org/sauti) a mobile phone survey in Tanzania and the first of its kind in Africa.
The data used in this brief were collected from 18 March to 3 April 2013. The brief also presents findings from the Sauti za Wananchi baseline survey (face to face interviews) which was implemented between October and December 2012. The baseline survey was conducted among 2,000 households across mainland Tanzania, while Round 1 of the mobile phone survey reached 1774 of these households (89% of the baseline survey sample). We also offer evidence using BEST (Basic Education Statistics of Tanzania) data, from 1998 to 2012, published by the Ministry of Education and Vocational Training (MOEVT).
Brief No. 2
This note was written and produced by Uwazi at Twaweza,housed by Hivos Tanzania. Released May 2013
P.O. Box 38342, Dar es Salaam, Tanzania. Te: +255 22 266 4301 F: +255 22 266 [email protected] www.twaweza.org/sauti
1
May 2013
As this brief was going to print, the government announced in parliament that the 2012 Form Four results were annulled and will be
revised using the previous grading system.

This brief’s key findings are:
• 7 out of 10 citizens are aware of the publication of 2012 Form Four results and 8out of 10 perceive a downward trend in the quality of secondary education
•• Mathematics and English reading competency levels are disturbingly low, both at
primary and secondary level•• Students observe that teachers often do not attend all classes and when they
do, they are likely to give an assignment and leave•• Asked to explain the high exam failure rates, parents mention teacher shortages
and call for the government to reduce the pressure on teachers; as well aslow teacher motivation and low teacher qualifications as factors driving poorlearning outcomes
2. Ten facts about learning in TanzaniaFact 1: 2012 results consistent with downward trendThe national Form Four examination (also known as the Certificate of Secondary School Examination or CSSE) results for 2012 are consistent with a downward trend that began in 2007.
Figure 1 presents Form Four results by exam result category between 1998 and 2012 (published by MOEVT). This period can be roughly split in two phases, with 2007 as a turning point. In the phase up to 2007 there was a slight upward movement in Div I-III pass rates towards a maximum of 38%, mirrored by decreasing Div 0 rates. At the turning point, the Div 0 failure rate stood at 10%. After 2007, Div 0 rates shot up to the current 61% over a period of five years.
Figure 1: Certificate of Secondary School Examination Results (1998 - 2012)
2
Source of data: MOEVT, Basic Education Statistics in Tanzania (BEST), 1998-2012.
29%
38% 36%
6%
47%50%
55%
26%24%
12% 10%
61%
0%
10%
20%
30%
40%
50%
60%
70%
80%
1998 2000 2002 2004 2006 2008 2010 2012
Div 1-3
Div 4
Div 0
These changes in results have been accompanied by a large expansion of the education sector. The number of Form Four exam candidates increased by a factor of nine, from 42,887 candidates in 1998 to 397,126 candidates in 2012.
The remainder of this brief reports facts collected by phone from Sauti za Wananchi respondents.
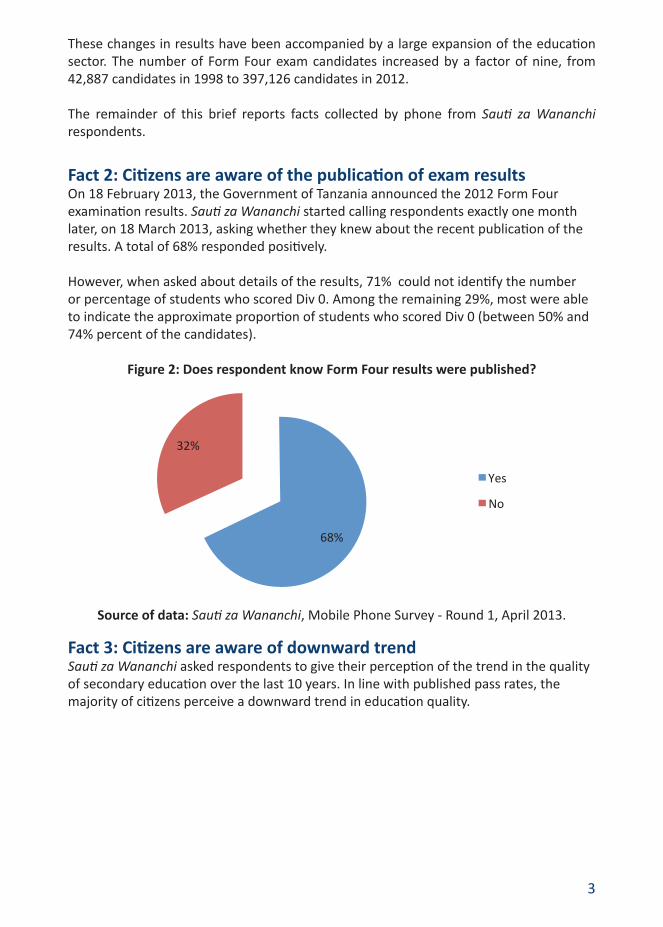
Fact 2: Citizens are aware of the publication of exam resultsOn 18 February 2013, the Government of Tanzania announced the 2012 Form Four examination results. Sauti za Wananchi started calling respondents exactly one month later, on 18 March 2013, asking whether they knew about the recent publication of the results. A total of 68% responded positively.
However, when asked about details of the results, 71% could not identify the number or percentage of students who scored Div 0. Among the remaining 29%, most were able to indicate the approximate proportion of students who scored Div 0 (between 50% and 74% percent of the candidates).
Figure 2: Does respondent know Form Four results were published?
Source of data: Sauti za Wananchi, Mobile Phone Survey - Round 1, April 2013.
Fact 3: Citizens are aware of downward trendSauti za Wananchi asked respondents to give their perception of the trend in the quality of secondary education over the last 10 years. In line with published pass rates, the majority of citizens perceive a downward trend in education quality.
3
32%
68%
Yes
No

Figure 3: Perceived trend in the quality of secondary education over the past 10 years
Source of data: Sauti za Wananchi, Mobile Phone Survey - Round 1, April 2013.
Citizen perceptions are therefore consistent with published data regarding a crisis in learning outcomes in Tanzania. A first step in turning this situation around is to understand the factors and actors driving learning outcomes. This brief examines books, teachers and parents. When seeking parents’ perceptions of school conditions, Sauti za Wananchi first asked respondents whether they had children of school age. Only those who have children currently in primary or secondary school or those whose children left school in the past year were asked to report on school conditions.
Fact 4: Parents report text book shortageOne factor that deserves attention is the supply of books. Without books students depend solely on one-way teaching by the teacher in class, taking notes in their exercise books. When books are available, other avenues of learning open up; for example students reading independently or teachers giving assignments from text books so students can continue studying outside class.
As Figure 4 illustrates, 55% of parents with children in primary school report that their children have no text books at all. The results show that the book situation is better but far from perfect at secondary school. Of the parents with children in secondary school, 32% report that their children do not have any text books; however, 54% report that their child has two or more books. It is also noteworthy that among parents who have children in secondary school, some 10% of parents reported having no idea about access to books. A typical secondary school student takes between six and nine subjects, and is expected to have at least one textbook per subject.
4
5%
12%
83%
Remained the same
Improved
Deteroriated

Figure 4: Text book ownership among students in primary and secondary school
Source of data: Sauti za Wananchi, Mobile Phone Survey - Round 1, April 2013.
Fact 5: Students report that teachers attend only part of lessonsDuring the Sauti za Wananchi Baseline Survey (face to face interviews, November 2012) in each household that had a child or children attending primary or secondary school, one child was randomly selected to provide information about their school. We asked these students whether teachers were present during all the lessons on the last day they attended school.
As Figure 5 illustrates, we found that just over 30% of students in both primary and secondary school reported to have had a teacher in all the lessons taught on the last school day.
Figure 5: Teacher attendance in primary and secondary schools
Source of data: Sauti za Wananchi, Baseline Survey, October 2012.5
55%
32%36%
11%
4%9%
31%
54%
44%
2%
10% 10%
0%
10%
20%
30%
40%
50%
60%
Child(ren) inprimary
Child(ren) insecondary
Child(ren) inboth
No text book
One text book
two or more textbooks
Don’t know
32% 31%
60%57%
8%12%
0%
10%
20%
30%
40%
50%
60%
70%
Primary Secondary
Teacher attended lessons
Teacher attended part/someof the lessons
No teacher attended thelessons
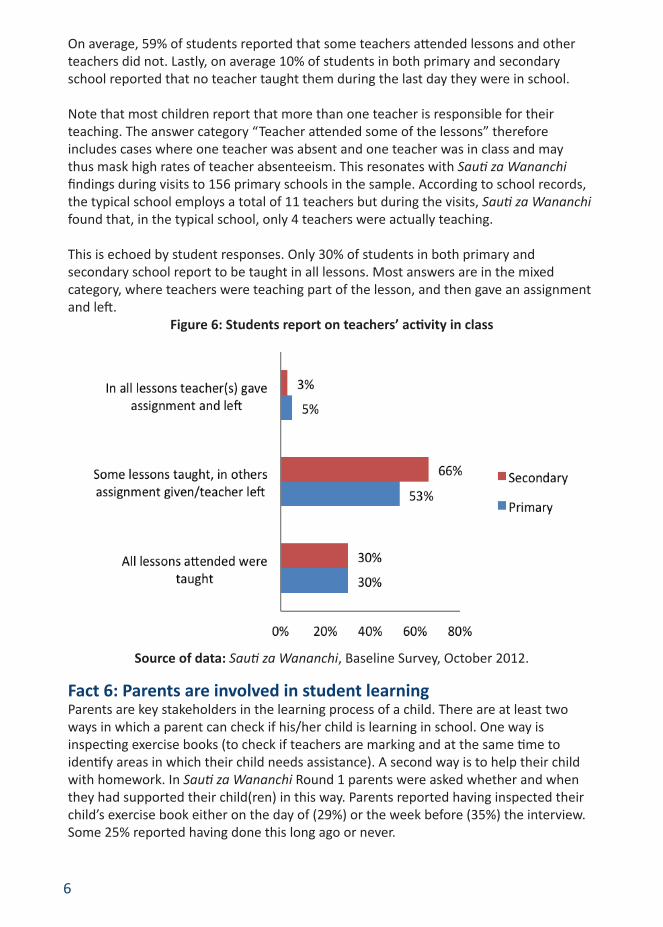
On average, 59% of students reported that some teachers attended lessons and other teachers did not. Lastly, on average 10% of students in both primary and secondary school reported that no teacher taught them during the last day they were in school.
Note that most children report that more than one teacher is responsible for their teaching. The answer category “Teacher attended some of the lessons” therefore includes cases where one teacher was absent and one teacher was in class and may thus mask high rates of teacher absenteeism. This resonates with Sauti za Wananchi findings during visits to 156 primary schools in the sample. According to school records, the typical school employs a total of 11 teachers but during the visits, Sauti za Wananchi found that, in the typical school, only 4 teachers were actually teaching.
This is echoed by student responses. Only 30% of students in both primary and secondary school report to be taught in all lessons. Most answers are in the mixed category, where teachers were teaching part of the lesson, and then gave an assignment and left.
Figure 6: Students report on teachers’ activity in class
Source of data: Sauti za Wananchi, Baseline Survey, October 2012.
Fact 6: Parents are involved in student learningParents are key stakeholders in the learning process of a child. There are at least two ways in which a parent can check if his/her child is learning in school. One way is inspecting exercise books (to check if teachers are marking and at the same time to identify areas in which their child needs assistance). A second way is to help their child with homework. In Sauti za Wananchi Round 1 parents were asked whether and when they had supported their child(ren) in this way. Parents reported having inspected their child’s exercise book either on the day of (29%) or the week before (35%) the interview. Some 25% reported having done this long ago or never.
6

Additionally, some 41% of parents reported to have helped their child with their homework in the last week; 44% state that they have never (or only long ago) done so.
Figure 7: Parental involvement in learning
Source of data: Sauti za Wananchi, Mobile Phone Survey - Round 1, April 2013.
Fact 7: Students know their weaknesses Given the poor examination results, all students were asked to identify the subjects which they find difficult. Students reported that English and Mathematics are the two most difficult single subjects in both primary and secondary school. Furthermore Figure 8 shows that science subjects are difficult to understand for students in secondary school.
Figure 8: Students report the most difficult subjects in primary and secondary school
Source of data: Sauti za Wananchi, Baseline Survey, October 2012.
7
12%
29%
16%
44%
29%
35%
12%
25%
0% 5% 10% 15% 20% 25% 30% 35% 40% 45% 50%
Yesterday
Last Week
Within last 6 months
Long ago/never
Inspected exercise book (%) helped with homework (%)
1%
2%
3%
3%
23%
64%
5%
20%
3%
5%
34%
16%
0% 10% 20% 30% 40% 50% 60% 70%
History
Science
Kiswahili
Other Subjects
Mathematics
English
Secondary
Primary

Fact 8: Learning levels are low To verify the above self-reported strengths and weaknesses of students Sauti za Wananchi carried out a simple learning assessment known as the Uwezo test. This is a Standard 2 level Kiswahili, English, and numeracy test. For samples of tests and more information on the methodology see www.uwezo.net
Figure 9 below presents the outcome of the Uwezo test among the students assessed. Note that the same Standard 2 tests has been used to assess learning levels across all students in our sample, whether enrolled in primary or secondary school.
Figure 9: Standard 2 level learning assesment
Source of data: Sauti za Wananchi, Baseline Survey, October 2012.
The results of the learning assesment show low learning levels in both primary and secondary schools. For example, 72% of primary school students and 66% of secondary school students cannot multiply. Moreover, a large majority of students in primary school could not answer the comprehension question for a story in English or Kiswahili (an example of a story and questions used in the text is presented above). The inability of students in secondary schools to comprehend a Standard 2 level story in English, when English is the language of instruction, is troubling.
Fact 9: Parents blame government and teachersSauti za Wananchi asked parents who they think is responsible for the poor performance of students in the 2012 Form Four results. According to a majority of the citizens both the Government of Tanzania and teachers are responsible, jointly they account for more
8
Example story: Zuberi is our class teacher. He loves our parents. We love our teacher too. He gives his pupils books. The pupils write in the books. Our books are red. We use pencils to write.
Question: 1. What do the pupils write in? 2. Who gives his pupils books?
72%81%
93%
66%
43%
70%
0%
20%
40%
60%
80%
100%
Cannot multiply Cannotcomprehend
story (Kiswahili)
Cannotcomprehend
story (English)
Primary School
Secondary School
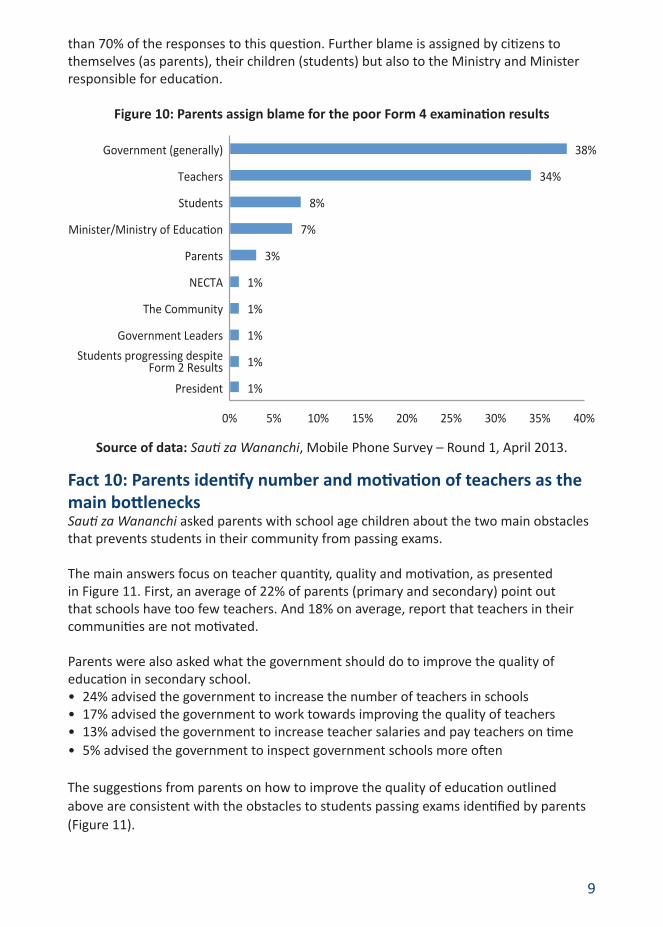
than 70% of the responses to this question. Further blame is assigned by citizens to themselves (as parents), their children (students) but also to the Ministry and Minister responsible for education.
Figure 10: Parents assign blame for the poor Form 4 examination results
Source of data: Sauti za Wananchi, Mobile Phone Survey – Round 1, April 2013.
Fact 10: Parents identify number and motivation of teachers as the main bottlenecksSauti za Wananchi asked parents with school age children about the two main obstacles that prevents students in their community from passing exams.
The main answers focus on teacher quantity, quality and motivation, as presented in Figure 11. First, an average of 22% of parents (primary and secondary) point out that schools have too few teachers. And 18% on average, report that teachers in their communities are not motivated.
Parents were also asked what the government should do to improve the quality of education in secondary school.• 24% advised the government to increase the number of teachers in schools• 17% advised the government to work towards improving the quality of teachers• 13% advised the government to increase teacher salaries and pay teachers on time• 5% advised the government to inspect government schools more often
9
1%
1%
1%
1%
1%
3%
7%
8%
34%
38%
0% 5% 10% 15% 20% 25% 30% 35% 40%
President
Students progressing despite Form 2 Results
Government Leaders
The Community
NECTA
Parents
Minister/Ministry of Education
Students
Teachers
Government (generally)
The suggestions from parents on how to improve the quality of education outlined above are consistent with the obstacles to students passing exams identified by parents (Figure 11).

Figure 11: Parents outline the main obstacles to children passing exams
Source of data: Sauti za Wananchi, Mobile Phone Survey – Round 1, April 2013.
ConclusionA positive consequence of the recent publication of the 2012 Form Four results is that it has led to a national debate, by citizens, in the newspapers and in policy circles, about the state of education in Tanzania. The 10 facts reported in this Sauti za Wananchi brief contribute the most recent nationally representative data and citizens’ views on education to this debate. Sauti za Wananchi’s aim is to take the debate to the individuals behind the statistics and let them speak out.
Parents and school age children from communities across mainland Tanzania provided clear views on education. In summary, these citizens report that they are aware of the publication of the 2012 Form Four results and that they perceive a downward trend in the quality of secondary education; that in many cases their children do not have school books, particularly in primary school; that teachers often do not attend all classes and when they do, they are likely to give an assignment and leave; and that on average
10
parents make an effort to help their children’s learning.
The student learning assessments included in the Sauti za Wananchi survey data further show that Mathematics and English reading competency levels are disturbingly low, confirming the national examination results. Finally, when asked by Sauti za Wananchi about causes of high exam failures, parents focus on the role of teachers. Parents see teacher shortages and call for the government to reduce the pressure on teachers; on the other hand, parents identify low teacher motivation and low qualifications as problematic.

The Form Four national results reflect the extremely low levels of educational attainment in basic education in Tanzania today. The massive investment in education in the last decade has not yet translated into learning gains for students. In moving forward the government will need to review evidence of what drives learning and adjust its policies, programs and goals accordingly. Transforming teacher motivation, effectiveness and accountability are at the heart of this challenge.
11

12
Related Documents