Public Enterprises Survey 2011-2012: Vol-I (i) Foreword The Public Enterprises Survey (2011-12) is the 52nd Survey in the series being laid in the Parliament. The Survey provides a consolidated report on the performance of all the Central Public Sector Enterprises (CPSEs). Out of the 225 operating CPSEs, 161 CPSEs earned net profit amounting to Rs. 1,25,116 crores in 2011-12 (up from Rs.1,13,944 crores in 2010-11) and 63 CPSEs incurred net losses amounting to Rs.27,602 crores during the year (up from Rs.21,817 crores in 2010-11). 2. While ONGC, NTPC Ltd and Coal India Ltd. have been the top three CPSEs in terms of profits, BSNL, Air India Ltd., and MTNL have been the top three loss making CPSEs during the year. The contribution of CPSEs to India’s GDP currently stands in the range of 6-7 percent. This can go up to 10 percent of GDP provided the loss making CPSEs start earning profits and the profit making CPSEs continue with their expansion plans. 3. Despite a relatively slower growth of 6.7 percent in the domestic economy in 2011-12, ‘under recoveries’ of Oil marketing companies and fierce competition in telecom and air lines Sectors, the gross revenue (turnover) of all CPSEs grew by 22.96 percent during 2011-12. 4. On account of their good performance continuously for past several years, a number of CPSEs have large ‘reserves and surplus’ which they can leverage to raise debts from financial institutions for higher investment. Profitable CPSEs, with high growth rates, can also raise funds from the capital market as evident from the recent successes of listed CPSEs. The ceilings of ‘external commercial borrowings’ for infrastructure development have been also raised and ‘private equity’ has emerged as yet another source for raising funds. The CPSEs can take advantage of all these positive developments for higher growth. 5. Concerted efforts continue to be made by the Department of Public Enterprises for greater professionalization of the Boards (of Directors) of CPSEs. Consequent to the Second Pay Revision in CPSEs, furthermore, the Performance Related Pay (PRP) has been introduced in CPSEs to incentivize employees for higher productivity. 6. The sick and loss making CPSEs have greatly benefited from the recommendations of the Board of Reconstruction of Public Enterprises (BRPSE) that was set up in 2004. The number of sick and loss making CPSEs has significantly come down. Out of the 24 CPSEs who posted profits after receiving the revival package from the Government, 13 CPSEs have been declared ‘turn around companies’ as they made profits consecutively for three years. 7. The CPSEs have the presence in diverse sectors of manufacturing, mining, electricity, construction and services. Their growth benefits both the upstream and downstream industries, the various auxiliary units (and vendors), the host regions where they are located and the economy as a whole. 8. I congratulate the Department of Public Enterprises for bringing out yet another comprehensive Survey on the performance of Central Public Sector Enterprises. February, 2013 New Delhi ( PRAFUL PATEL ) ea=h] Hkkjh m|ksx ,oa yksd m|e Hkkjr ljdkj] ubZ fnYyh&110 011 MINISTER OF HEAVY INDUSTRIES & PUBLIC ENTERPRISES GOVERNMENT OF INDIA, URYOG BHAWAN, NEW DELHI-110 011

Welcome message from author
This document is posted to help you gain knowledge. Please leave a comment to let me know what you think about it! Share it to your friends and learn new things together.
Transcript
Public Enterprises Survey 2011-2012: Vol-I (i)
Foreword
The Public Enterprises Survey (2011-12) is the 52nd Survey in the series being laid in the Parliament.The Survey provides a consolidated report on the performance of all the Central Public SectorEnterprises (CPSEs). Out of the 225 operating CPSEs, 161 CPSEs earned net profit amounting toRs. 1,25,116 crores in 2011-12 (up from Rs.1,13,944 crores in 2010-11) and 63 CPSEs incurrednet losses amounting to Rs.27,602 crores during the year (up from Rs.21,817 crores in 2010-11).
2. While ONGC, NTPC Ltd and Coal India Ltd. have been the top three CPSEs in terms ofprofits, BSNL, Air India Ltd., and MTNL have been the top three loss making CPSEs during theyear. The contribution of CPSEs to India’s GDP currently stands in the range of 6-7 percent.This can go up to 10 percent of GDP provided the loss making CPSEs start earning profits andthe profit making CPSEs continue with their expansion plans.
3. Despite a relatively slower growth of 6.7 percent in the domestic economy in 2011-12, ‘underrecoveries’ of Oil marketing companies and fierce competition in telecom and air lines Sectors,the gross revenue (turnover) of all CPSEs grew by 22.96 percent during 2011-12.
4. On account of their good performance continuously for past several years, a number ofCPSEs have large ‘reserves and surplus’ which they can leverage to raise debts from financialinstitutions for higher investment. Profitable CPSEs, with high growth rates, can also raise fundsfrom the capital market as evident from the recent successes of listed CPSEs. The ceilings of‘external commercial borrowings’ for infrastructure development have been also raised and ‘privateequity’ has emerged as yet another source for raising funds. The CPSEs can take advantage ofall these positive developments for higher growth.
5. Concerted efforts continue to be made by the Department of Public Enterprises for greaterprofessionalization of the Boards (of Directors) of CPSEs. Consequent to the Second Pay Revisionin CPSEs, furthermore, the Performance Related Pay (PRP) has been introduced in CPSEs toincentivize employees for higher productivity.
6. The sick and loss making CPSEs have greatly benefited from the recommendations of theBoard of Reconstruction of Public Enterprises (BRPSE) that was set up in 2004. The number ofsick and loss making CPSEs has significantly come down. Out of the 24 CPSEs who postedprofits after receiving the revival package from the Government, 13 CPSEs have been declared‘turn around companies’ as they made profits consecutively for three years.
7. The CPSEs have the presence in diverse sectors of manufacturing, mining, electricity,construction and services. Their growth benefits both the upstream and downstream industries,the various auxiliary units (and vendors), the host regions where they are located and the economyas a whole.
8. I congratulate the Department of Public Enterprises for bringing out yet another comprehensiveSurvey on the performance of Central Public Sector Enterprises.
February, 2013New Delhi ( PRAFUL PATEL )
ea=h] Hkkjh m|ksx ,oa yksd m|e
Hkkjr ljdkj] ubZ fnYyh&110 011
MINISTER OF HEAVY INDUSTRIES & PUBLIC ENTERPRISESGOVERNMENT OF INDIA, URYOG BHAWAN,
NEW DELHI-110 011
Public Enterprises Survey 2011-2012: Vol-I (iii)
Preface
The Department of Public Enterprises (DPE) under the Ministry of Heavy Industries and PublicEnterprises is the nodal Department in the Government of India to provide, inter-alia, an overview onthe financial and physical performance of Central Public Sector Enterprises (CPSEs). The PublicEnterprises (PE) Survey is a consolidated report on the performance of all CPSEs and is being preparedas per the recommendations of the Estimates Committee (2nd Lok Sabha). The Public EnterprisesSurvey is laid in the Parliament every year.
2. Besides statutory corporations, the CPSEs comprise those Government Companies (defined underSection 617 of Companies Act, 1956) wherein more than 50% equity is held by the Central Government.The subsidiaries of these companies registered in India are also categorized as CPSEs. The Survey,however, does not cover departmentally run public enterprises, banking institutions, insurancecompanies and enterprises wherein Central Government equity is less than or equal to 50%. However,a chapter on Public Sector Insurance Companies is included in Volume I of the Survey.
3. The Estimates Committee, in their 73rd Report (1959-60), had recommended that in addition tothe individual annual report of each enterprise laid on the Table of both the Houses of Parliament,a separate comprehensive report should be submitted to the Parliament indicating Government’stotal appraisal of the working of public enterprises. Accordingly, the first “Annual Report” (PublicEnterprises Survey) was prepared by the erstwhile Bureau of Public Enterprises (now Departmentof Public Enterprises) in 1960-61 giving a consolidated picture of the performance of the CentralPublic Sector Enterprises.
4. In February, 2011, the Ministry of Corporate Affairs (MCA) issued a revised version of ScheduleVI for preparing the financial statements of companies (including Government Companies) fromFinancial Year 2010-11 and onwards. Consequently, the Department of Public Enterprises constitutedan “Expert Group to recommend suitable changes in the extant Data Sheet of Public EnterprisesSurvey to accommodate the Revised Schedule VI under the Companies Act 1956” on 1.6.2012 underthe Chairmanship of Shri Amarjeet Chopra, Chairman, Committee on Public Finance & GovernmentAccounting, Institute of Chartered Accountants of India (ICAI). The Expert Group submitted itsreport on 23.7.2012. It was subsequently deliberated upon by the executives of CPSEs dealingwith finance in the Workshop held on 22.8.2012 by the Department. The Public Enterprise Survey(2011-12) is based on Revised Schedule VI and contains the financial data for the two years of2010-11 and 2011-12. I am sure this change would add value to the database presented here-in.
5. The Public Enterprises Survey (2011-12) is the 52nd Survey Report in the series. The basic datafor the Public Enterprises Survey is compiled based on the Annual Reports/Accounts of individualenterprises for the financial year 2011-12 as well as the data provided on line by these enterprisesin the detailed data sheet/questionnaire developed by the Department. The data so compiled havebeen furthermore analyzed and presented in two separate volumes (i.e. Volume I & II).
6. While Volume-I contains the macro appraisal of the performance of CPSEs at the aggregatelevel in terms of the physical and the financial parameters, Volume-II contains enterprise-wise andcognate group-wise data for the two years of 2011-12 and 2010-11. Enterprises-wise data/reportconsists of summarized balance sheet, summarized profit and loss account, important managementratios and analysis of performance of the individual enterprises.
7. There were altogether 261 CPSEs (excluding 7 Insurance Companies) falling within the scopeof the Survey 2011-12 (as on 31.3.2012) as against 248 CPSEs in 2010-11(as on 31.3.2011). During2011-12, two CPSEs were either closed or merged with their Holding Company as decided by theconcerned administrative Ministries.
Hkkjr ljdkj]
yksd m|e foHkkx
Hkkjh m|ksx ,oa yksd m|e ea=ky;
GOVERNMENT OF INDIADEPARTMENT OF PUBLIC ENTERPRISES
MINISTRY OF HEAVY INDUSTRIES &PUBLIC ENTERPRISES
O.P. Rawat, IASSecretary
Public Enterprises Survey 2011-2012: Vol-I(iv)
8. The two enterprises which were covered in PE Survey 2010-11, but have not been covered in the PE Survey 2011-12 are:(i) Maharashtra Electrosmelt Ltd, and (ii) Bihar Drugs & Organic Chemicals Ltd. Whereas Maharashtra Electrosmelt Ltd. hasbeen amalgamated with its Holding Company (SAIL), Bihar Drugs & Organic Chemicals Ltd. has been closed by the order ofthe Department of Pharmaceuticals.
9. Fifteen (15) new public sector enterprises, namely, Bharat Broadband Network Ltd., Biotechnology Industry ResearchAssistance Council, DGEN Transmission Co. Ltd., HLL Biotech Ltd., Irrigation & Water Resource Finance Corporation Ltd. Indian Oil-CREDA Biofuels Ltd., Mahanadi Basin Power Ltd., NMDC Power Ltd., PFC Green Energy Ltd., Power Equity CapitalAdvisers Pvt. Ltd., SAIL Jagdishpur Power Plant Ltd., SAIL Sindri Projects Ltd., SAILRefractory Company Ltd., Prize PetroleumCompany Ltd. and PFC Capital Advisory Services Ltd. have been added to the list of CPSEs as per the information receivedfrom the concerned administrative Ministry/Department. Out of the 15 newly set up CPSEs, one CPSE namely SAIL SindriProjects Ltd. has not been covered in the Survey as no paid up capital was allotted to the entity until 31.3.2012.
10. Among the newly established CPSEs, SAIL Refractory Company Ltd., Prize Petroleum Company Ltd. and PFC CapitalAdvisory Services Ltd. have become operative and CREDA-HPCL BIOFUELS Ltd., HPCL Biofuels Ltd. and BHEL ElectricalMachines Ltd. which were shown as ‘under construction’ in the P E Survey 2010-11, became operative during the year.
11. Rural Electrification Corporation Ltd. and Scooters India Ltd. have been shifted from Power Transmission and TransportationEquipment’s group to Financial Services and Medium and Light Engineering group respectively during 2011-12.
12. The administrative control of Burn Standard Company Ltd. changed from Ministry of Heavy Industries & Public Enterprisesto Ministry of Railways during the year.
13. The data in respect of 50 CPSEs has however, been considered as provisional in 2011-12 as they did not either submit theaudited annual accounts as per Revised Schedule VI of Companies Act, 1956 or did not furnish the complete data for boththe years (2010-11 and 2011-12). A list of these CPSEs is shown at Appendix IV, at the end of this Volume.
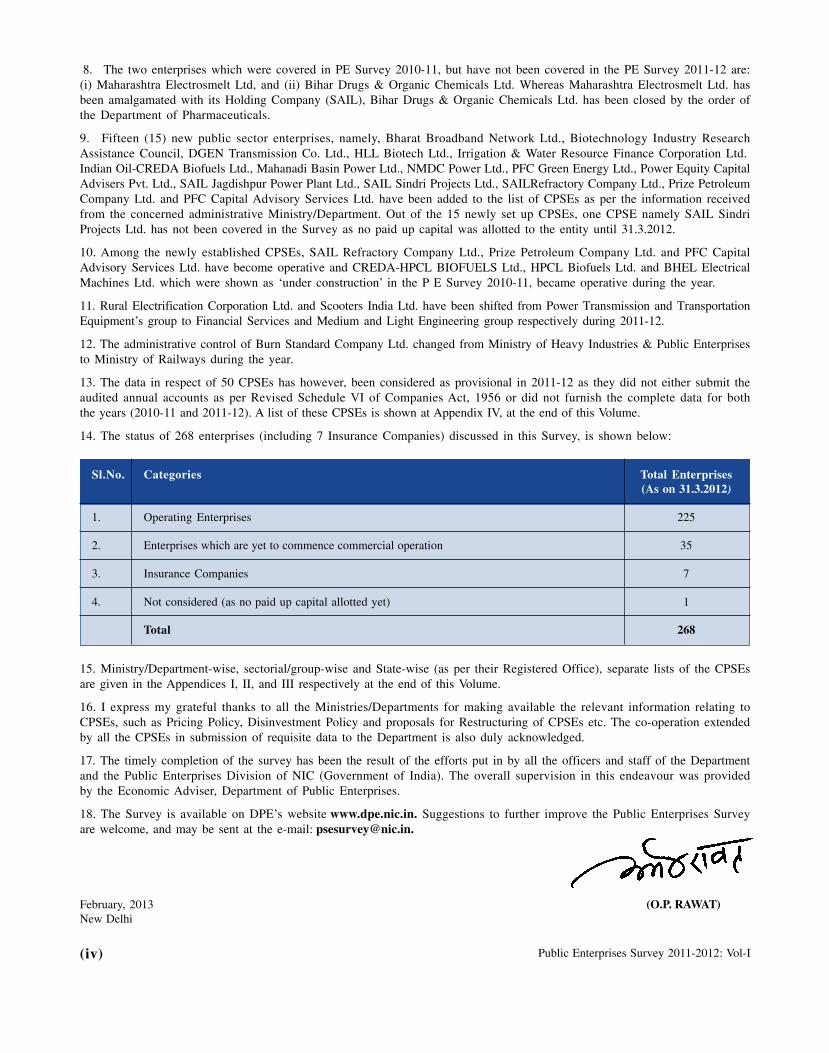
14. The status of 268 enterprises (including 7 Insurance Companies) discussed in this Survey, is shown below:
Sl.No. Categories Total Enterprises(As on 31.3.2012)
1. Operating Enterprises 225
2. Enterprises which are yet to commence commercial operation 35
3. Insurance Companies 7
4. Not considered (as no paid up capital allotted yet) 1
Total 268
15. Ministry/Department-wise, sectorial/group-wise and State-wise (as per their Registered Office), separate lists of the CPSEsare given in the Appendices I, II, and III respectively at the end of this Volume.
16. I express my grateful thanks to all the Ministries/Departments for making available the relevant information relating toCPSEs, such as Pricing Policy, Disinvestment Policy and proposals for Restructuring of CPSEs etc. The co-operation extendedby all the CPSEs in submission of requisite data to the Department is also duly acknowledged.
17. The timely completion of the survey has been the result of the efforts put in by all the officers and staff of the Departmentand the Public Enterprises Division of NIC (Government of India). The overall supervision in this endeavour was providedby the Economic Adviser, Department of Public Enterprises.
18. The Survey is available on DPE’s website www.dpe.nic.in. Suggestions to further improve the Public Enterprises Surveyare welcome, and may be sent at the e-mail: [email protected].
February, 2013 (O.P. RAWAT)New Delhi
Public Enterprises Survey 2011-2012: Vol-I 1
Performance Overview 2011-12Chapter-1
Public sector enterprises have been set up to serve thebroad macro-economic objectives of higher economicgrowth, self-sufficiency in production of goods and services,long term equilibrium in balance of payments and low andstable prices. While there were only five Central PublicSector Enterprises (CPSEs) with a total investment of ` 29.00crore at the time of the First Five Year Plan, there were asmany 260 CPSEs (excluding 7 Insurance Companies) with atotal investment of ` 7, 29,228 crore as on 31st March, 2012.
A large number of CPSEs have been set up asGreenfield projects consequent to the initiatives taken duringthe Five Year Plans. CPSEs such as National TextileCorporation, Coal India Ltd. (and its subsidiaries) have,however, been taken over from the private sector consequentto their ‘nationalization’. Industrial companies such asIndian Petrochemicals Corporation Ltd., Modern FoodIndustries Ltd., Hindustan Zinc Ltd., Bharat AluminumCompany and MarutiUdyog Ltd., on the other hand, whichwere CPSEs earlier, ceased to be CPSEs after their‘privatization’.
Along with other public sector majors such as StateBank of India in the banking sector, Life InsuranceCorporation in the insurance sector and Indian Railways intransportation, the CPSEs are leading companies of Indiawith significant market-shares in sectors such as petroleum,(e.g. ONGC, GAIL and Indian Oil Corporation), mining (e.g.Coal India Ltd. and NMDC), power generation (e.g. NTPCand NHPC), power transmission (e.g. Power GridCorporation of India Ltd.), nuclear energy (e.g. NuclearPower Corporation of India Ltd.), heavy engineering (e.g.BHEL), aviation industry (e.g. Hindustan Aeronautics Ltd.and Air India Ltd.), storage and public distribution system(e.g. Food Corporation of India and Central WarehousingCorporation), shipping and trading (e.g. ShippingCorporation of India Ltd, and State Trading Corporation ofIndia Ltd.) and telecommunication (e.g. BSNL and MTNL).
With economic liberalization, post-1991, sectors thatwere exclusive preserve of the public sector enterprises wereopened to the private sector. The CPSEs, therefore, arefaced with competition from both domestic private sectorcompanies (some of which have grown very fast) and thelarge multi-national corporations (MNCs).
1.1 Indian Economy (2011-12) and CPSEs
The CPSEs play a critical role in the Indian economy.They influence the growth in the economy and are affectedby the overall growth in the economy. As against thenominal GDP growth of 15.0 per cent (at current market price)in 2011-12, the gross value addition by all the CPSEs(exclusive of under-recoveries) grew by 4.24 per cent duringthe year (if however, ‘the under recoveries’ are added, thenthe gross value addition by all CPSEs during the yearincreased by 7.38 per cent). The turnover of petroleum(Refinery & Marketing), Coal, Fertilizers, Electricity(Generation and Transmission), Heavy Engineering, andContract & Construction showed a significant increaseduring the year. Significant gains in terms of net profits weremade by CPSEs in the Coal, Crude Oil, and Transportationequipment, Power Generation, Contract & Construction andConsultancy Services. The net losses, however, increasedfor CPSEs operating in telecommunication andtransportation services. The highlights of performance ofCPSEs, at the aggregate level, during 2011-12 are given inBox 1.
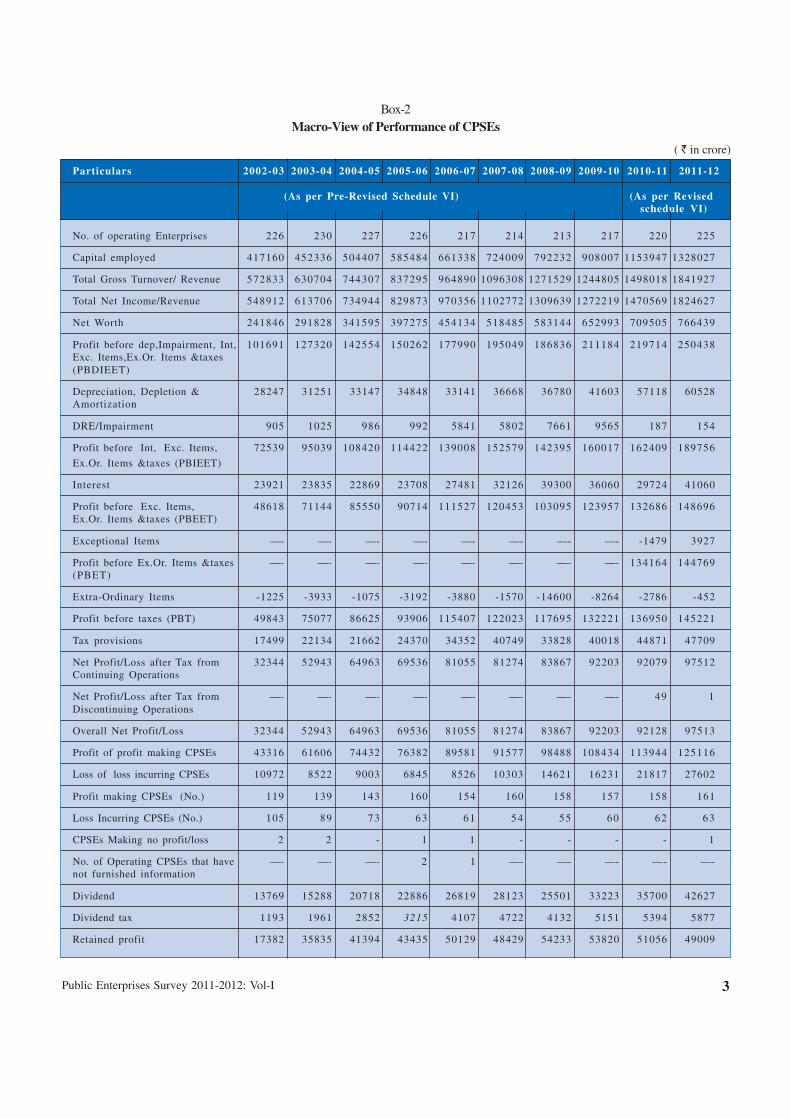
Macro view of the performance of CPSEs, during thelast ten years, is shown in Box 2. The turnover of all 225operating CPSEs during 2011-12 stood at ` 18, 41,927 croreas compared to ` 14, 98,018crore in the previous year. Theshare of earnings through export/deemed export amountedto 6.76 percent of total turnover during the year, and the CPSEs earned foreign exchange equal to ` 1, 24,492crorein2011-12 as compared to ` 91, 774 crore in 2010-11. The foreignexchange outgo on imports and royalty, know-how,consultancy, interest and other expenditure, on the otherhand, increased from ` 5,50,086 crore in 2010-11 to ` 7,33,544crore in 2011-12 showing an increase of 33.35%.
The total employee strength in CPSEs stood at 13.98lakh (excluding contractual & casual labours) in 2011-12 ascompared to 14.40 lakh in 2010-11. The total strength ofemployees in CPSEs has gone down by 41,682 persons dueto superannuation, voluntary retirement etc. The salary andwages in all the CPSEs, at the same time went up during theyear from ` 98,402 crore in 2010-11 to ` 1, 05,407crore in2011-12 showing a growth of 7.12%.

Performance Overview 2011-122
Box – 1
Highlights
� Total paid up capital in 260 CPSEs as on 31.3.2012 stood at `1,63,863 crore compared to `1,57,438crore as on 31.3. 2011 (248 CPSEs), showing a growth of 4.08%.
� Total investment (equity plus long term loans) in all CPSEs stood at `.7, 29,228 crore as on 31.3.2012compared to ` 6, 03,975crore as on 31.3.2011, recording a growth of 20.74%.
� Capital Employed (Paid up capital plus reserve & surplus and long term loans) in all CPSEs stood at`13, 43,176crore as on 31.3.2012 compared to `11, 64,178crore as on 31.3.2011 showing a growth of 15.38%.
� Total turnover/gross revenue from operation of all CPSEs during 2011-12 stood at `18, 41,927crorecompared to `14, 98,018crore in the previous year showing an increase of 22.96%.
� Total income of all CPSEs during 2011-12 stood at `18, 24,627crore compared to `14, 70,569crore in2010-11, showing an increase of 24.08%.
� Under-recoveries borne by the upstream oil producing and oil marketing companies (in retail prices ofpetroleum products) amounted to `55, 041crore in 2011-12 compared to `37, 190crore in 2010-11.
� Profit of profit making CPSEs stood at `1, 25,115crore during 2011-12 compared to `1, 13,944 crore in2010-11, showing a growth of 9.80%.
� Loss of loss incurring CPSEs stood at `27, 602 crore in 2011-12 compared to `21, 817 crore in 2010-11,showing an increase in loss by 26.52%.
� Overall net profit of all 225 CPSEs during 2011-12 stood at `97, 513crore compared to `92, 128 croreduring 2010-11, showing an increase of 5.84%.
� Reserves & Surplus of all CPSEs went up from `5, 60,203crore in 2010-11 to `6, 13,949 crores in2011-12, showing an increase by 9.59%.
� Net worth of all CPSEs went up from `7, 17,641 crore in 2010-11 to `7, 77,812 crore in 2011-12 registeringa growth of 8.38%.
� Contribution of CPSEs to Central Exchequer by way of excise duty, customs duty, corporate tax,interest on Central Government loans, dividend and other duties and taxes increased from `1,56,751 crorein 2010-11 to `1,60,801crore in 2011-12, showing an increase of 2.58%.
� Foreign exchange earnings through exports of goods and services increased from `91, 774 crore in2010-11 to `1, 24, 492 crore in 2011-12, showing a growth of 35.65%.
� Foreign exchange outgo on imports and royalty, know-how, consultancy, interest and other expenditureincreased from `5,50,086 crore in 2010-11 to `7,33,544crore in 2011-12, showing an increase of 33.35%.
� CPSEs employed 13.98 lakh people (excluding contractual &casual labours) in 2011-12 compared to 14.40lakh in 2010-11, showing a reduction in employees by 2.91%.
� Salary and wages went up in all CPSEs from `98, 402 crore in 2010-11 to `1, 05,407crore in 2011-12,showing a growth of 7.12%.
� Total Market Capitalisation (M_Cap) of 44 listed CPSEs, based on the stock price in Mumbai StockExchange, declined from `15,06,698 crore as on 31.03.2011 to `12,53,245crore as on 31.03.2012. MarketCapitalisation of CPSEs during this period, therefore, decreased by 16.82%
� M_Cap of CPSEs as per cent of BSE M_Cap decreased from 22.03% as on 31.3.2011 to 20.17% as on31.3.2012.
Public Enterprises Survey 2011-2012: Vol-I 3
Box-2Macro-View of Performance of CPSEs
( ` in crore)
Particulars 2002-03 2003-04 2004-05 2005-06 2006-07 2007-08 2008-09 2009-10 2010-11 2011-12
(As per Pre-Revised Schedule VI) (As per Revisedschedule VI)
No. of operating Enterprises 226 230 227 226 217 214 213 217 220 225
Capital employed 417160 452336 504407 585484 661338 724009 792232 908007 1153947 1328027
Total Gross Turnover/ Revenue 572833 630704 744307 837295 964890 1096308 1271529 1244805 1498018 1841927
Total Net Income/Revenue 548912 613706 734944 829873 970356 1102772 1309639 1272219 1470569 1824627
Net Worth 241846 291828 341595 397275 454134 518485 583144 652993 709505 766439
Profit before dep,Impairment, Int, 101691 127320 142554 150262 177990 195049 186836 211184 219714 250438Exc. Items,Ex.Or. Items &taxes(PBDIEET)
Depreciation, Depletion & 28247 31251 33147 34848 33141 36668 36780 41603 57118 60528Amortization
DRE/Impairment 905 1025 986 992 5841 5802 7661 9565 187 154
Profit before Int, Exc. Items, 72539 95039 108420 114422 139008 152579 142395 160017 162409 189756
Ex.Or. Items &taxes (PBIEET)
Interest 23921 23835 22869 23708 27481 32126 39300 36060 29724 41060
Profit before Exc. Items, 48618 71144 85550 90714 111527 120453 103095 123957 132686 148696Ex.Or. Items &taxes (PBEET)
Exceptional Items —- —- —- —- —- —- —- —- -1479 3927
Profit before Ex.Or. Items &taxes —- —- —- —- —- —- —- —- 134164 144769(PBET)
Extra-Ordinary Items -1225 -3933 -1075 -3192 -3880 -1570 -14600 -8264 -2786 -452
Profit before taxes (PBT) 49843 75077 86625 93906 115407 122023 117695 132221 136950 145221
Tax provisions 17499 22134 21662 24370 34352 40749 33828 40018 44871 47709
Net Profit/Loss after Tax from 32344 52943 64963 69536 81055 81274 83867 92203 92079 97512Continuing Operations
Net Profit/Loss after Tax from —- —- —- —- —- —- —- —- 49 1Discontinuing Operations
Overall Net Profit/Loss 32344 52943 64963 69536 81055 81274 83867 92203 92128 97513
Profit of profit making CPSEs 43316 61606 74432 76382 89581 91577 98488 108434 113944 125116
Loss of loss incurring CPSEs 10972 8522 9003 6845 8526 10303 14621 16231 21817 27602
Profit making CPSEs (No.) 119 139 143 160 154 160 158 157 158 161
Loss Incurring CPSEs (No.) 105 89 73 63 61 54 55 60 62 63
CPSEs Making no profit/loss 2 2 - 1 1 - - - - 1
No. of Operating CPSEs that have —- —- —- 2 1 —- —- —- —- —-not furnished information
Dividend 13769 15288 20718 22886 26819 28123 25501 33223 35700 42627
Dividend tax 1193 1961 2852 3215 4107 4722 4132 5151 5394 5877
Retained profit 17382 35835 41394 43435 50129 48429 54233 53820 51056 49009
Performance Overview 2011-124
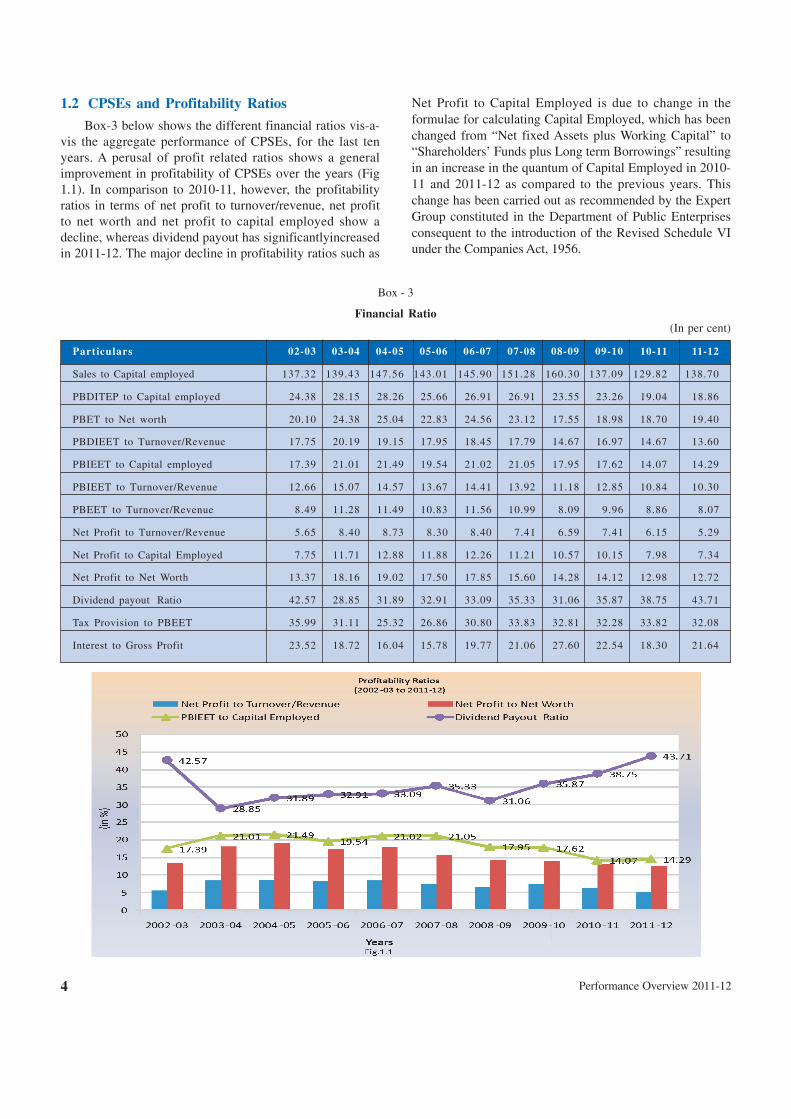
1.2 CPSEs and Profitability Ratios
Box-3 below shows the different financial ratios vis-a-vis the aggregate performance of CPSEs, for the last tenyears. A perusal of profit related ratios shows a generalimprovement in profitability of CPSEs over the years (Fig1.1). In comparison to 2010-11, however, the profitabilityratios in terms of net profit to turnover/revenue, net profitto net worth and net profit to capital employed show adecline, whereas dividend payout has significantlyincreasedin 2011-12. The major decline in profitability ratios such as
Net Profit to Capital Employed is due to change in theformulae for calculating Capital Employed, which has beenchanged from “Net fixed Assets plus Working Capital” to“Shareholders’ Funds plus Long term Borrowings” resultingin an increase in the quantum of Capital Employed in 2010-11 and 2011-12 as compared to the previous years. Thischange has been carried out as recommended by the ExpertGroup constituted in the Department of Public Enterprisesconsequent to the introduction of the Revised Schedule VIunder the Companies Act, 1956.
Particulars 02-03 03-04 04-05 05-06 06-07 07-08 08-09 09-10 10-11 11-12
Sales to Capital employed 137.32 139.43 147.56 143.01 145.90 151.28 160.30 137.09 129.82 138.70
PBDITEP to Capital employed 24.38 28.15 28.26 25.66 26.91 26.91 23.55 23.26 19.04 18.86
PBET to Net worth 20.10 24.38 25.04 22.83 24.56 23.12 17.55 18.98 18.70 19.40
PBDIEET to Turnover/Revenue 17.75 20.19 19.15 17.95 18.45 17.79 14.67 16.97 14.67 13.60
PBIEET to Capital employed 17.39 21.01 21.49 19.54 21.02 21.05 17.95 17.62 14.07 14.29
PBIEET to Turnover/Revenue 12.66 15.07 14.57 13.67 14.41 13.92 11.18 12.85 10.84 10.30
PBEET to Turnover/Revenue 8.49 11.28 11.49 10.83 11.56 10.99 8.09 9.96 8.86 8.07
Net Profit to Turnover/Revenue 5.65 8.40 8.73 8.30 8.40 7.41 6.59 7.41 6.15 5.29
Net Profit to Capital Employed 7.75 11.71 12.88 11.88 12.26 11.21 10.57 10.15 7.98 7.34
Net Profit to Net Worth 13.37 18.16 19.02 17.50 17.85 15.60 14.28 14.12 12.98 12.72
Dividend payout Ratio 42.57 28.85 31.89 32.91 33.09 35.33 31.06 35.87 38.75 43.71
Tax Provision to PBEET 35.99 31.11 25.32 26.86 30.80 33.83 32.81 32.28 33.82 32.08
Interest to Gross Profit 23.52 18.72 16.04 15.78 19.77 21.06 27.60 22.54 18.30 21.64
Box - 3
Financial Ratio(In per cent)
Public Enterprises Survey 2011-2012: Vol-I 5
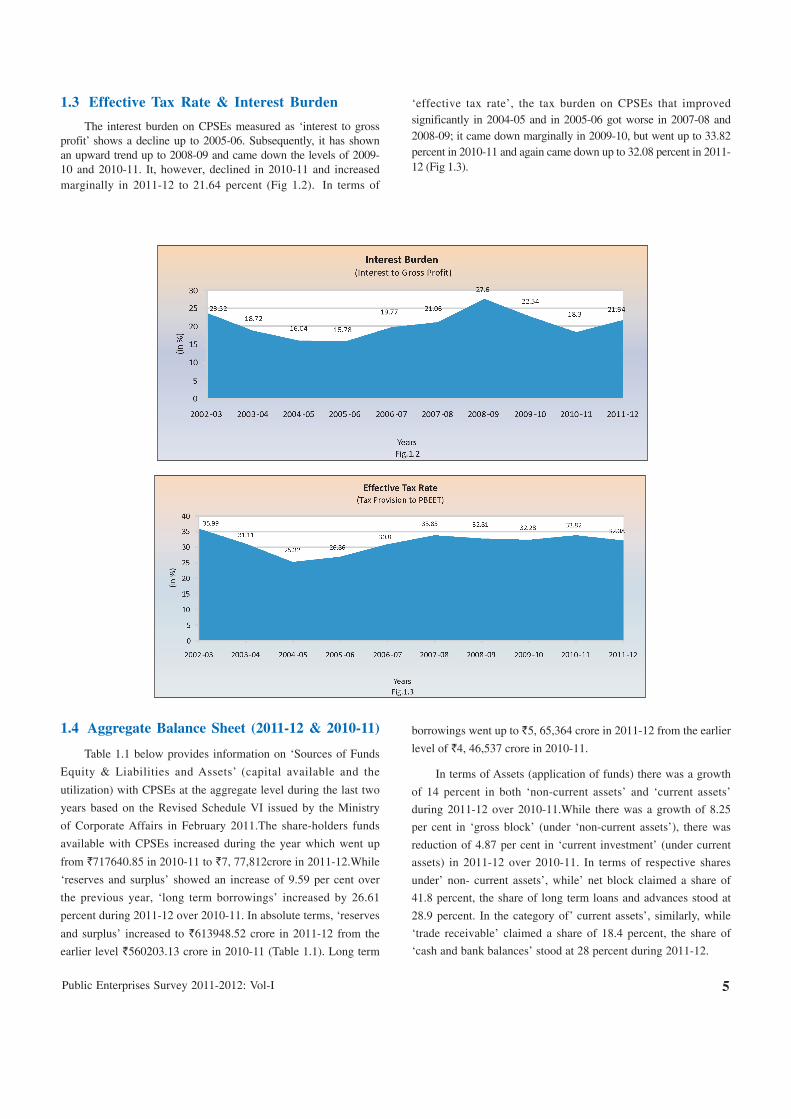
1.3 Effective Tax Rate & Interest Burden
The interest burden on CPSEs measured as ‘interest to grossprofit’ shows a decline up to 2005-06. Subsequently, it has shownan upward trend up to 2008-09 and came down the levels of 2009-10 and 2010-11. It, however, declined in 2010-11 and increasedmarginally in 2011-12 to 21.64 percent (Fig 1.2). In terms of
‘effective tax rate’, the tax burden on CPSEs that improvedsignificantly in 2004-05 and in 2005-06 got worse in 2007-08 and2008-09; it came down marginally in 2009-10, but went up to 33.82percent in 2010-11 and again came down up to 32.08 percent in 2011-12 (Fig 1.3).
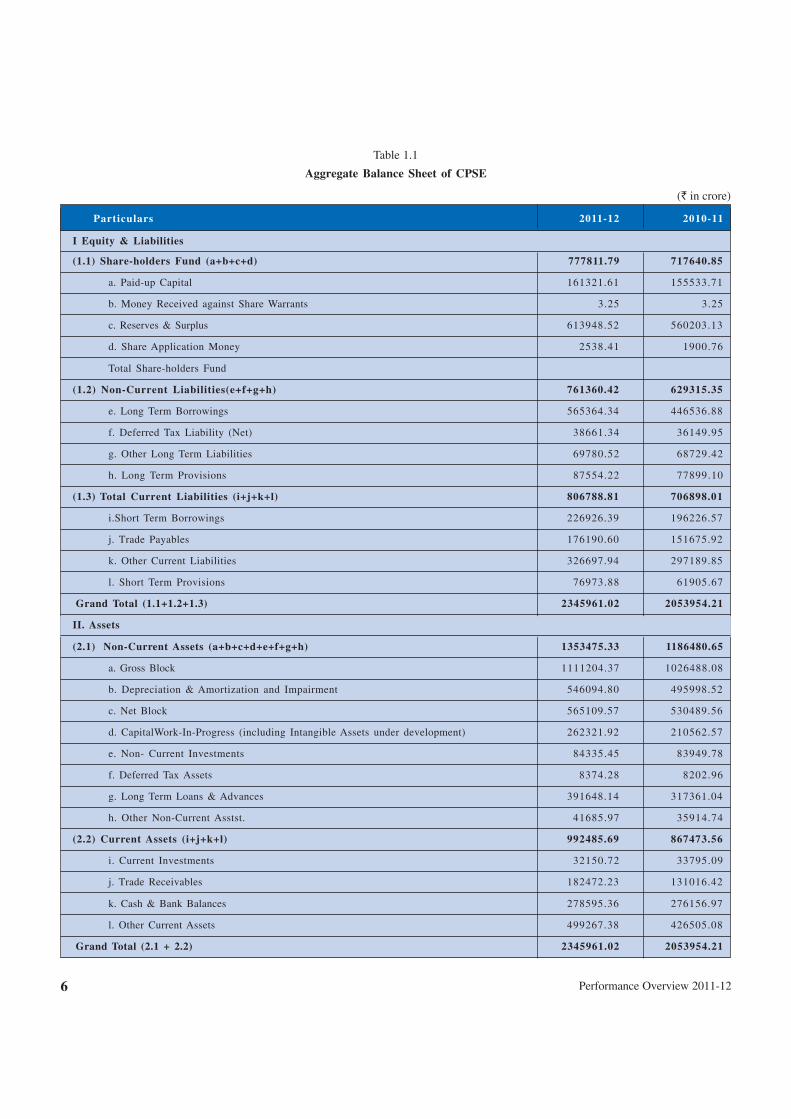
1.4 Aggregate Balance Sheet (2011-12 & 2010-11)
Table 1.1 below provides information on ‘Sources of Funds
Equity & Liabilities and Assets’ (capital available and the
utilization) with CPSEs at the aggregate level during the last two
years based on the Revised Schedule VI issued by the Ministry
of Corporate Affairs in February 2011.The share-holders funds
available with CPSEs increased during the year which went up
from `717640.85 in 2010-11 to `7, 77,812crore in 2011-12.While
‘reserves and surplus’ showed an increase of 9.59 per cent over
the previous year, ‘long term borrowings’ increased by 26.61
percent during 2011-12 over 2010-11. In absolute terms, ‘reserves
and surplus’ increased to `613948.52 crore in 2011-12 from the
earlier level `560203.13 crore in 2010-11 (Table 1.1). Long term
borrowings went up to `5, 65,364 crore in 2011-12 from the earlier
level of `4, 46,537 crore in 2010-11.
In terms of Assets (application of funds) there was a growth
of 14 percent in both ‘non-current assets’ and ‘current assets’
during 2011-12 over 2010-11.While there was a growth of 8.25
per cent in ‘gross block’ (under ‘non-current assets’), there was
reduction of 4.87 per cent in ‘current investment’ (under current
assets) in 2011-12 over 2010-11. In terms of respective shares
under’ non- current assets’, while’ net block claimed a share of
41.8 percent, the share of long term loans and advances stood at
28.9 percent. In the category of’ current assets’, similarly, while
‘trade receivable’ claimed a share of 18.4 percent, the share of
‘cash and bank balances’ stood at 28 percent during 2011-12.
Performance Overview 2011-126
Table 1.1
Aggregate Balance Sheet of CPSE
(` in crore)
Particulars 2011-12 2010-11
I Equity & Liabilities
(1.1) Share-holders Fund (a+b+c+d) 777811.79 717640.85
a. Paid-up Capital 161321.61 155533.71
b. Money Received against Share Warrants 3.25 3.25
c. Reserves & Surplus 613948.52 560203.13
d. Share Application Money 2538.41 1900.76
Total Share-holders Fund
(1.2) Non-Current Liabilities(e+f+g+h) 761360.42 629315.35
e. Long Term Borrowings 565364.34 446536.88
f. Deferred Tax Liability (Net) 38661.34 36149.95
g. Other Long Term Liabilities 69780.52 68729.42
h. Long Term Provisions 87554.22 77899.10
(1.3) Total Current Liabilities (i+j+k+l) 806788.81 706898.01
i.Short Term Borrowings 226926.39 196226.57
j. Trade Payables 176190.60 151675.92
k. Other Current Liabilities 326697.94 297189.85
l. Short Term Provisions 76973.88 61905.67
Grand Total (1.1+1.2+1.3) 2345961.02 2053954.21
II. Assets
(2.1) Non-Current Assets (a+b+c+d+e+f+g+h) 1353475.33 1186480.65
a. Gross Block 1111204.37 1026488.08
b. Depreciation & Amortization and Impairment 546094.80 495998.52
c. Net Block 565109.57 530489.56
d. CapitalWork-In-Progress (including Intangible Assets under development) 262321.92 210562.57
e. Non- Current Investments 84335.45 83949.78
f. Deferred Tax Assets 8374.28 8202.96
g. Long Term Loans & Advances 391648.14 317361.04
h. Other Non-Current Asstst. 41685.97 35914.74
(2.2) Current Assets (i+j+k+l) 992485.69 867473.56
i. Current Investments 32150.72 33795.09
j. Trade Receivables 182472.23 131016.42
k. Cash & Bank Balances 278595.36 276156.97
l. Other Current Assets 499267.38 426505.08
Grand Total (2.1 + 2.2) 2345961.02 2053954.21
Public Enterprises Survey 2011-2012: Vol-I 7
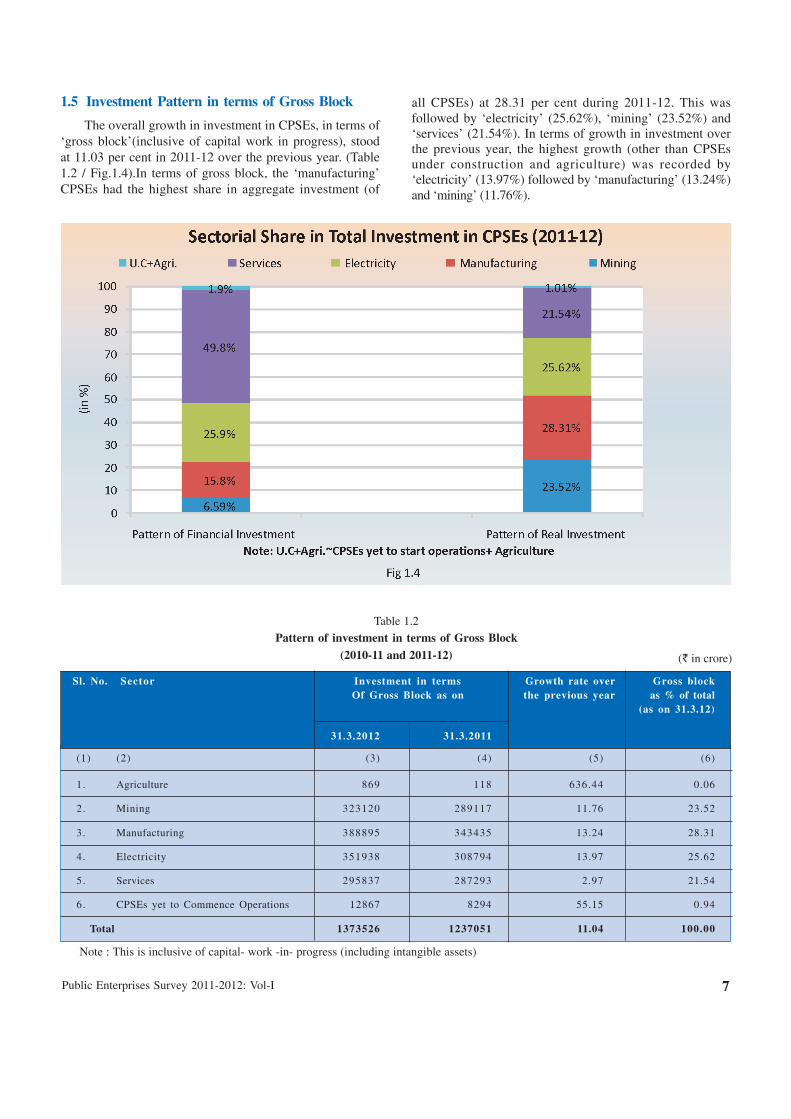
1.5 Investment Pattern in terms of Gross Block
The overall growth in investment in CPSEs, in terms of‘gross block’(inclusive of capital work in progress), stoodat 11.03 per cent in 2011-12 over the previous year. (Table1.2 / Fig.1.4).In terms of gross block, the ‘manufacturing’CPSEs had the highest share in aggregate investment (of
all CPSEs) at 28.31 per cent during 2011-12. This wasfollowed by ‘electricity’ (25.62%), ‘mining’ (23.52%) and‘services’ (21.54%). In terms of growth in investment overthe previous year, the highest growth (other than CPSEsunder construction and agriculture) was recorded by‘electricity’ (13.97%) followed by ‘manufacturing’ (13.24%)and ‘mining’ (11.76%).
Table 1.2
Pattern of investment in terms of Gross Block(2010-11 and 2011-12) (` in crore)
Sl. No. Sector Investment in terms Growth rate over Gross blockOf Gross Block as on the previous year as % of total
(as on 31.3.12)
31.3.2012 31.3.2011
(1) (2) (3) (4) (5) (6)
1. Agriculture 869 118 636.44 0.06
2. Mining 323120 289117 11.76 23.52
3. Manufacturing 388895 343435 13.24 28.31
4. Electricity 351938 308794 13.97 25.62
5. Services 295837 287293 2.97 21.54
6. CPSEs yet to Commence Operations 12867 8294 55.15 0.94
Total 1373526 1237051 11.04 100.00
Note : This is inclusive of capital- work -in- progress (including intangible assets)
Performance Overview 2011-128
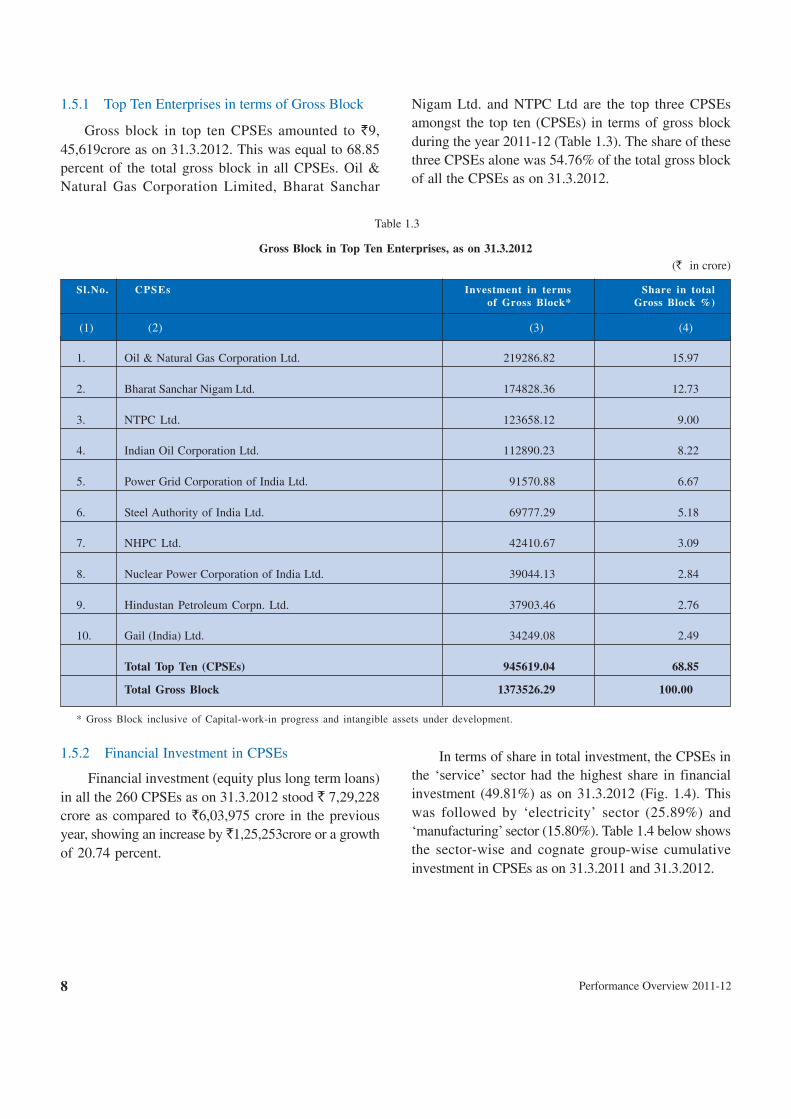
1.5.1 Top Ten Enterprises in terms of Gross Block
Gross block in top ten CPSEs amounted to `9,45,619crore as on 31.3.2012. This was equal to 68.85percent of the total gross block in all CPSEs. Oil &Natural Gas Corporation Limited, Bharat Sanchar
Table 1.3
Gross Block in Top Ten Enterprises, as on 31.3.2012(` in crore)
Sl.No. CPSEs Investment in terms Share in totalof Gross Block* Gross Block %)
(1) (2) (3) (4)
1. Oil & Natural Gas Corporation Ltd. 219286.82 15.97
2. Bharat Sanchar Nigam Ltd. 174828.36 12.73
3. NTPC Ltd. 123658.12 9.00
4. Indian Oil Corporation Ltd. 112890.23 8.22
5. Power Grid Corporation of India Ltd. 91570.88 6.67
6. Steel Authority of India Ltd. 69777.29 5.18
7. NHPC Ltd. 42410.67 3.09
8. Nuclear Power Corporation of India Ltd. 39044.13 2.84
9. Hindustan Petroleum Corpn. Ltd. 37903.46 2.76
10. Gail (India) Ltd. 34249.08 2.49
Total Top Ten (CPSEs) 945619.04 68.85
Total Gross Block 1373526.29 100.00
* Gross Block inclusive of Capital-work-in progress and intangible assets under development.
Nigam Ltd. and NTPC Ltd are the top three CPSEsamongst the top ten (CPSEs) in terms of gross blockduring the year 2011-12 (Table 1.3). The share of thesethree CPSEs alone was 54.76% of the total gross blockof all the CPSEs as on 31.3.2012.
1.5.2 Financial Investment in CPSEs
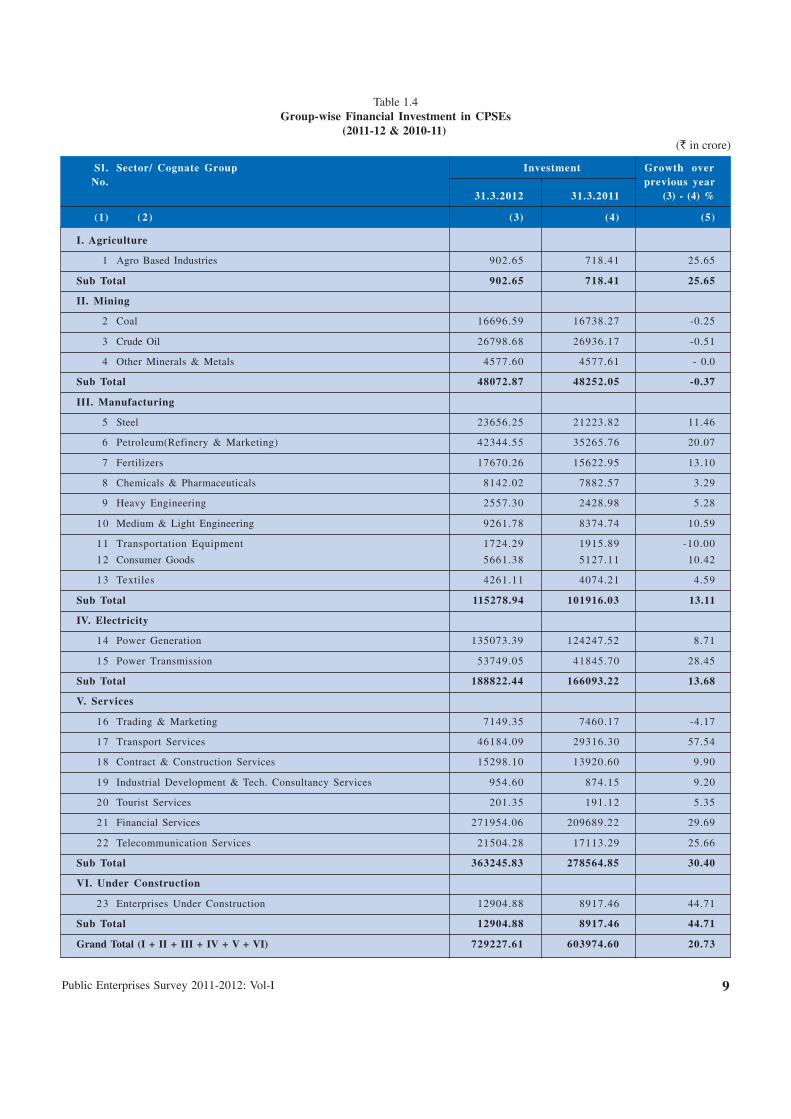
Financial investment (equity plus long term loans)in all the 260 CPSEs as on 31.3.2012 stood ` 7,29,228crore as compared to `6,03,975 crore in the previousyear, showing an increase by `1,25,253crore or a growthof 20.74 percent.
In terms of share in total investment, the CPSEs inthe ‘service’ sector had the highest share in financialinvestment (49.81%) as on 31.3.2012 (Fig. 1.4). Thiswas followed by ‘electricity’ sector (25.89%) and‘manufacturing’ sector (15.80%). Table 1.4 below showsthe sector-wise and cognate group-wise cumulativeinvestment in CPSEs as on 31.3.2011 and 31.3.2012.
Public Enterprises Survey 2011-2012: Vol-I 9
Table 1.4Group-wise Financial Investment in CPSEs
(2011-12 & 2010-11)(` in crore)
Sl . Sector/ Cognate Group Investment Growth overNo. previous year
31.3.2012 31.3.2011 (3) - (4) %
(1) (2 ) (3) (4) (5)
I. Agriculture
1 Agro Based Industries 902.65 718.41 25.65
Sub Total 902.65 718.41 25.65
II. Mining
2 Coal 16696.59 16738.27 -0.25
3 Crude Oil 26798.68 26936.17 -0.51
4 Other Minerals & Metals 4577.60 4577.61 - 0.0
Sub Total 48072.87 48252.05 -0.37
III. Manufacturing
5 Steel 23656.25 21223.82 11.46
6 Petroleum(Refinery & Marketing) 42344.55 35265.76 20.07
7 Fertilizers 17670.26 15622.95 13.10
8 Chemicals & Pharmaceuticals 8142.02 7882.57 3.29
9 Heavy Engineering 2557.30 2428.98 5.28
10 Medium & Light Engineering 9261.78 8374.74 10.59
11 Transportation Equipment 1724.29 1915.89 -10.00
12 Consumer Goods 5661.38 5127.11 10.42
13 Textiles 4261.11 4074.21 4.59
Sub Total 115278.94 101916.03 13.11
IV. Electricity
14 Power Generation 135073.39 124247.52 8.71
15 Power Transmission 53749.05 41845.70 28.45
Sub Total 188822.44 166093.22 13.68
V. Services
16 Trading & Marketing 7149.35 7460.17 -4.17
17 Transport Services 46184.09 29316.30 57.54
18 Contract & Construction Services 15298.10 13920.60 9.90
19 Industrial Development & Tech. Consultancy Services 954.60 874.15 9.20
20 Tourist Services 201.35 191.12 5.35
21 Financial Services 271954.06 209689.22 29.69
22 Telecommunication Services 21504.28 17113.29 25.66
Sub Total 363245.83 278564.85 30.40
VI. Under Construction
23 Enterprises Under Construction 12904.88 8917.46 44.71
Sub Total 12904.88 8917.46 44.71
Grand Total (I + II + III + IV + V + VI) 729227.61 603974.60 20.73
Sl . Sector/ Cognate Group Investment Growth overNo. previous year
31.3.2012 31.3.2011 (3) - (4) %
(1) (2 ) (3) (4) (5)
Performance Overview 2011-1210
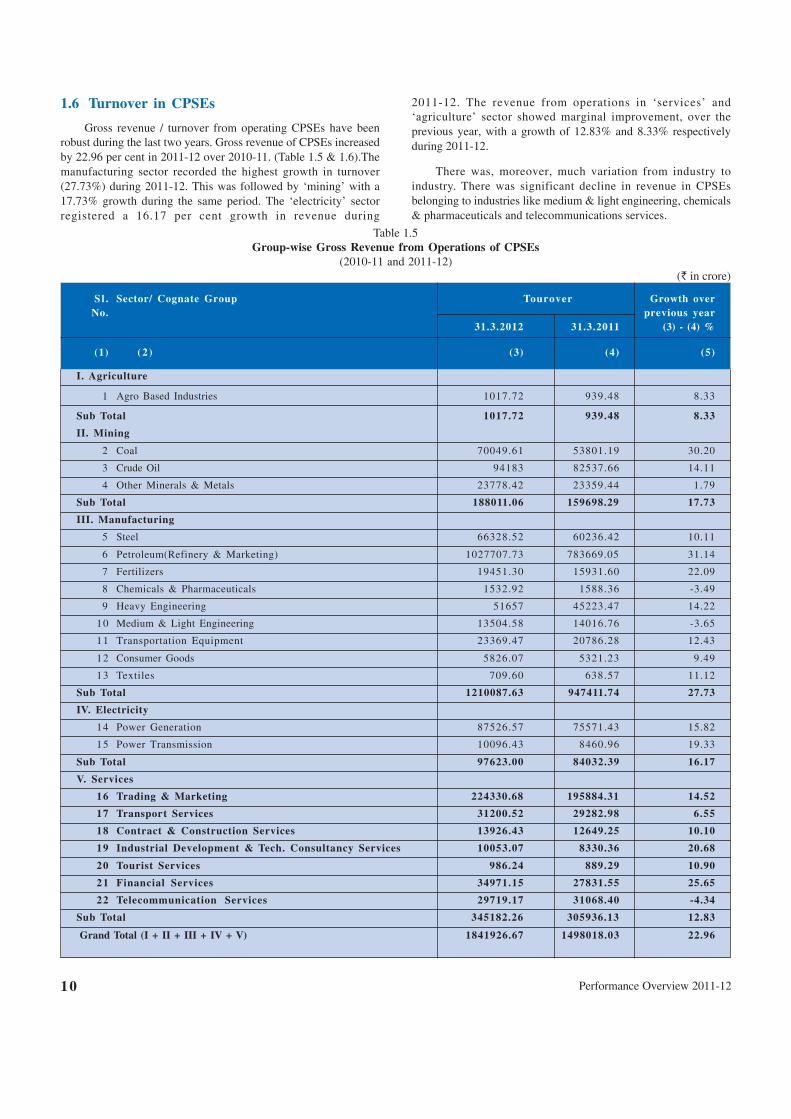
1.6 Turnover in CPSEs
Gross revenue / turnover from operating CPSEs have beenrobust during the last two years. Gross revenue of CPSEs increasedby 22.96 per cent in 2011-12 over 2010-11. (Table 1.5 & 1.6).Themanufacturing sector recorded the highest growth in turnover(27.73%) during 2011-12. This was followed by ‘mining’ with a17.73% growth during the same period. The ‘electricity’ sectorregistered a 16.17 per cent growth in revenue during
2011-12. The revenue from operations in ‘services’ and‘agriculture’ sector showed marginal improvement, over theprevious year, with a growth of 12.83% and 8.33% respectivelyduring 2011-12.
There was, moreover, much variation from industry toindustry. There was significant decline in revenue in CPSEsbelonging to industries like medium & light engineering, chemicals& pharmaceuticals and telecommunications services.
Table 1.5Group-wise Gross Revenue from Operations of CPSEs
(2010-11 and 2011-12)(` in crore)
Sl .No. Sector/ Cognate Group Investment Growth over
31.3.2012 31.3.2011 previous year(3) - (4) %
(1) (2 ) (3) (4) (5)
I. Agriculture
1 Agro Based Industries 1017.72 939.48 8.33
Sub Total 1017.72 939.48 8.33
II. Mining
2 Coal 70049.61 53801.19 30.20
3 Crude Oil 94183 82537.66 14.11
4 Other Minerals & Metals 23778.42 23359.44 1.79
Sub Total 188011.06 159698.29 17.73
III. Manufacturing
5 Steel 66328.52 60236.42 10.11
6 Petroleum(Refinery & Marketing) 1027707.73 783669.05 31.14
7 Fertilizers 19451.30 15931.60 22.09
8 Chemicals & Pharmaceuticals 1532.92 1588.36 -3.49
9 Heavy Engineering 51657 45223.47 14.22
10 Medium & Light Engineering 13504.58 14016.76 -3.65
11 Transportation Equipment 23369.47 20786.28 12.43
12 Consumer Goods 5826.07 5321.23 9.49
13 Textiles 709.60 638.57 11.12
Sub Total 1210087.63 947411.74 27.73
IV. Electricity
14 Power Generation 87526.57 75571.43 15.82
15 Power Transmission 10096.43 8460.96 19.33
Sub Total 97623.00 84032.39 16.17
V. Services
16 Trading & Marketing 224330.68 195884.31 14.52
17 Transport Services 31200.52 29282.98 6.55
18 Contract & Construction Services 13926.43 12649.25 10.10
19 Industrial Development & Tech. Consultancy Services 10053.07 8330.36 20.68
20 Tourist Services 986.24 889.29 10.90
21 Financial Services 34971.15 27831.55 25.65
22 Telecommunication Services 29719.17 31068.40 -4.34
Sub Total 345182.26 305936.13 12.83
Grand Total (I + II + III + IV + V) 1841926.67 1498018.03 22.96
S l . Sector/ Cognate Group Tourover Growth overNo. previous year
31.3.2012 31.3.2011 (3) - (4) %
(1) (2 ) (3) (4) (5)
Public Enterprises Survey 2011-2012: Vol-I 11
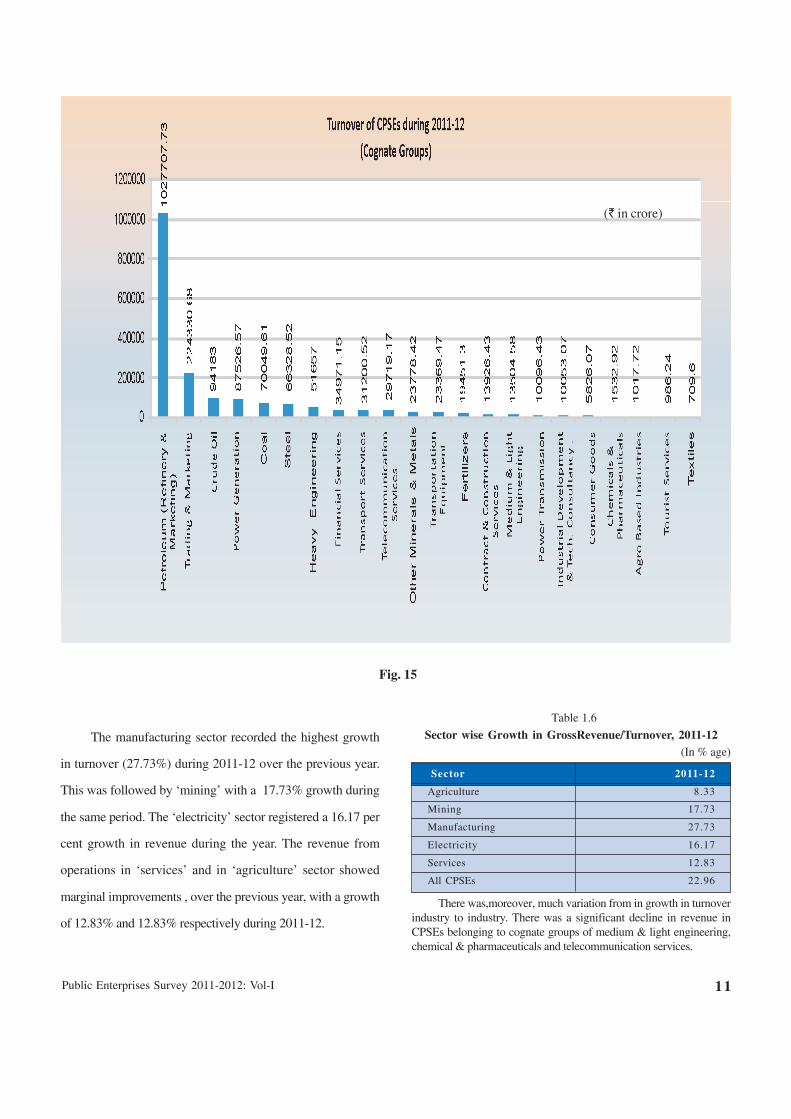
The manufacturing sector recorded the highest growth
in turnover (27.73%) during 2011-12 over the previous year.
This was followed by ‘mining’ with a 17.73% growth during
the same period. The ‘electricity’ sector registered a 16.17 per
cent growth in revenue during the year. The revenue from
operations in ‘services’ and in ‘agriculture’ sector showed
marginal improvements , over the previous year, with a growth
of 12.83% and 12.83% respectively during 2011-12.
Table 1.6
Sector wise Growth in GrossRevenue/Turnover, 2011-12 (In % age)
Sector 2011-12
Agriculture 8.33
Mining 17.73
Manufacturing 27.73
Electricity 16.17
Services 12.83
All CPSEs 22.96
There was,moreover, much variation from in growth in turnoverindustry to industry. There was a significant decline in revenue inCPSEs belonging to cognate groups of medium & light engineering,chemical & pharmaceuticals and telecommunication services.
(` in crore)
Fig. 15
Performance Overview 2011-1212
Table 1.8
Net Profit/Loss of CPSEs
(` in crore)
Sl .No. Sector/ Cognate Group Net profit/Loss Growth
31.3.2012 31.3.2011 (in %)
(1) (2 ) (3) (4) (5)
I. Agriculture
1 Agro Based Industries -0.62 40.24 -101.54
Sub Total -0.62 40.24 -101.54
II. Mining
2 Coal 22054.13 15037.09 46.66
3 Crude Oil 30353.05 23935.21 26.81
4 Other Minerals & Metals 9203.40 8622.51 6.74
Sub Total 61610.58 47594.81 29.45
III. Manufacturing
5 Steel 4364.63 5642.43 -22.64
6 Petroleum(Refinery & Marketing) 10993.60 16060.82 -31.55
7 Fertilizers -540.62 -472.38 (14.45)
8 Chemicals & Pharmaceuticals -619.45 -690.35 -10.27
9 Heavy Engineering 6899.75 7137.17 -3.33
10 Medium & Light Engineering -286.82 -432.51 -33.68
11 Transportation Equipment 3821.06 3019.66 26.54
12 Consumer Goods -934.18 -710.80 (31.43)
13 Textiles 22.50 1115.13 -97.98
Sub Total 23720.47 30669.17 -22.65IV. Electricity
14 Power Generation 17965.53 16013.67 12.18
15 Power Transmission 3274.32 2713.82 2.65
Sub Total 21239.85 18727.49 13.42
V. Services
16 Trading & Marketing Services 438.52 555.22 -21.02
17 Transport Services -6894.32 -4886.92 (41.08)
18 Contract & Construction Services 913.02 587.73 55.35
19 Industrial Development & Tech. Consultancy Services 1240.15 1073.20 15.56
20 Tourist Services 34.82 24.21 43.82
21 Financial Services 8085.83 6835.00 18.30
22 Telecommunication Services -12874.83 -9091.26 (41.61)
Sub Total -9056.81 -4902.82 -84.72
Grand Total (I + II + III + IV + V) 97513.47 92127.89 5.85
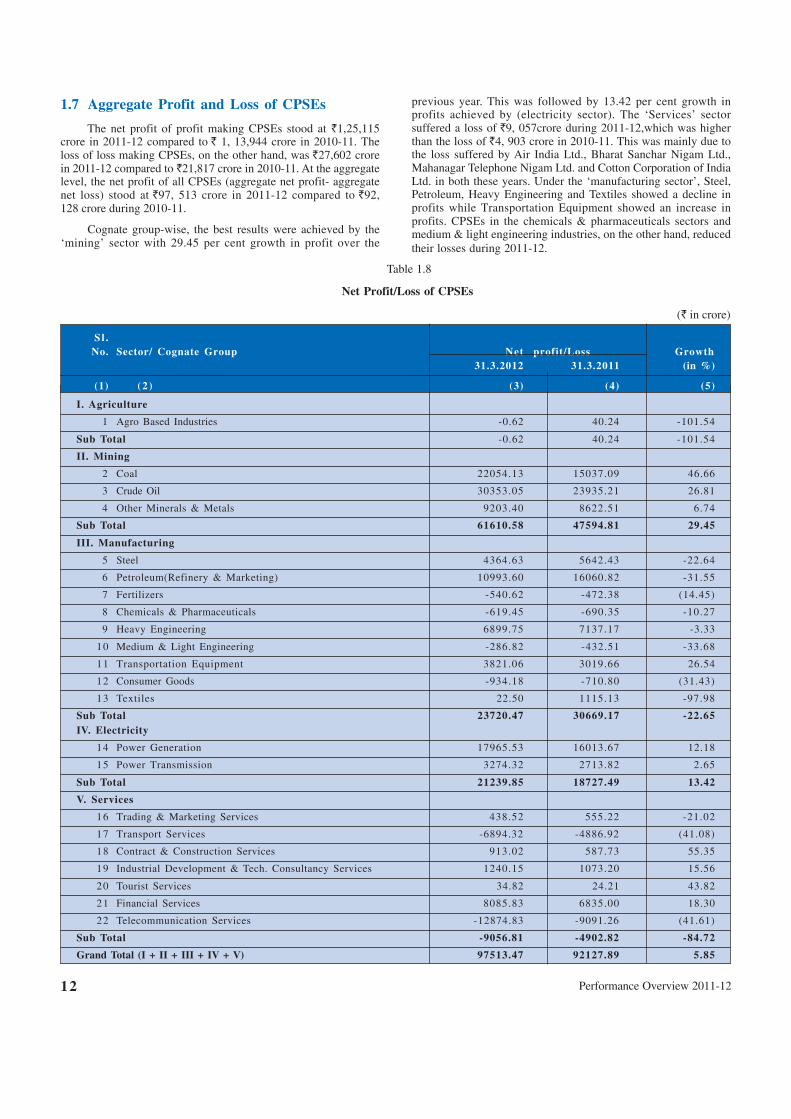
1.7 Aggregate Profit and Loss of CPSEs
The net profit of profit making CPSEs stood at `1,25,115crore in 2011-12 compared to ` 1, 13,944 crore in 2010-11. Theloss of loss making CPSEs, on the other hand, was `27,602 crorein 2011-12 compared to `21,817 crore in 2010-11. At the aggregatelevel, the net profit of all CPSEs (aggregate net profit- aggregatenet loss) stood at `97, 513 crore in 2011-12 compared to `92,128 crore during 2010-11.
Cognate group-wise, the best results were achieved by the‘mining’ sector with 29.45 per cent growth in profit over the
previous year. This was followed by 13.42 per cent growth inprofits achieved by (electricity sector). The ‘Services’ sectorsuffered a loss of `9, 057crore during 2011-12,which was higherthan the loss of `4, 903 crore in 2010-11. This was mainly due tothe loss suffered by Air India Ltd., Bharat Sanchar Nigam Ltd.,Mahanagar Telephone Nigam Ltd. and Cotton Corporation of IndiaLtd. in both these years. Under the ‘manufacturing sector’, Steel,Petroleum, Heavy Engineering and Textiles showed a decline inprofits while Transportation Equipment showed an increase inprofits. CPSEs in the chemicals & pharmaceuticals sectors andmedium & light engineering industries, on the other hand, reducedtheir losses during 2011-12.
Public Enterprises Survey 2011-2012: Vol-I 13
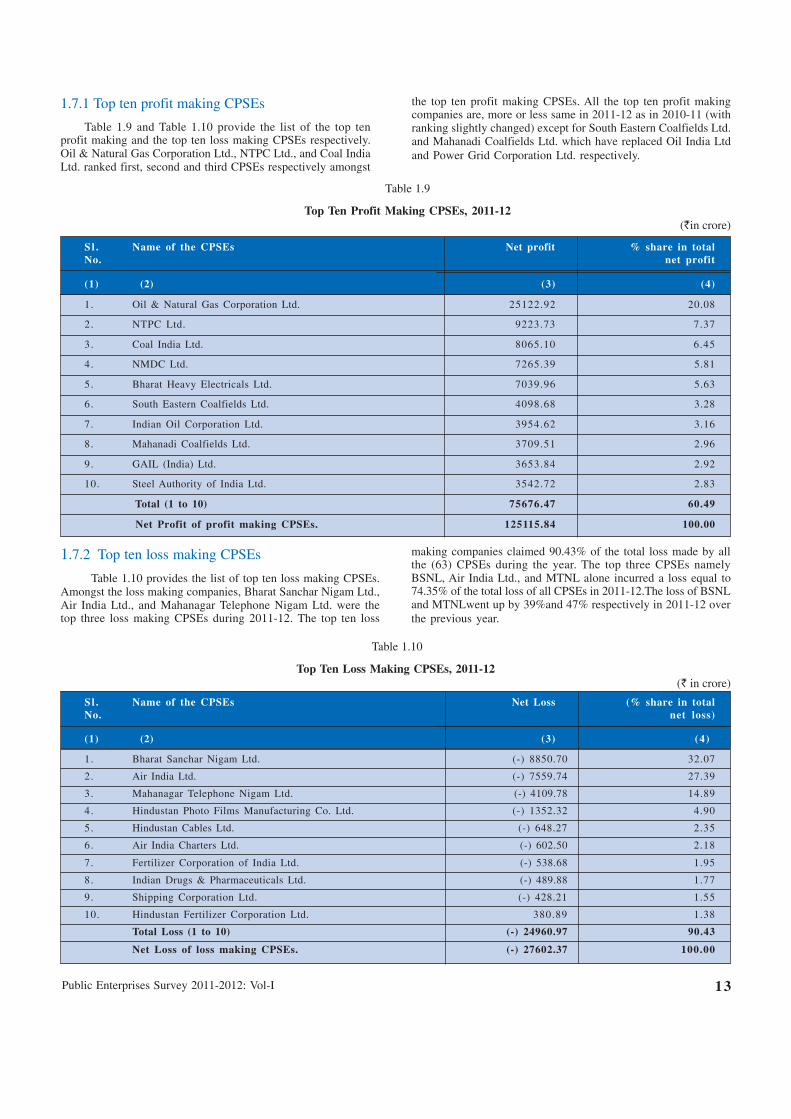
1.7.1 Top ten profit making CPSEs
Table 1.9 and Table 1.10 provide the list of the top tenprofit making and the top ten loss making CPSEs respectively.Oil & Natural Gas Corporation Ltd., NTPC Ltd., and Coal IndiaLtd. ranked first, second and third CPSEs respectively amongst
the top ten profit making CPSEs. All the top ten profit makingcompanies are, more or less same in 2011-12 as in 2010-11 (withranking slightly changed) except for South Eastern Coalfields Ltd.and Mahanadi Coalfields Ltd. which have replaced Oil India Ltdand Power Grid Corporation Ltd. respectively.
Table 1.9
Top Ten Profit Making CPSEs, 2011-12(`in crore)
Sl . Name of the CPSEs Net profit % share in totalNo. net profit
(1) (2) (3) (4)
1. Oil & Natural Gas Corporation Ltd. 25122.92 20.08
2. NTPC Ltd. 9223.73 7.37
3. Coal India Ltd. 8065.10 6.45
4. NMDC Ltd. 7265.39 5.81
5. Bharat Heavy Electricals Ltd. 7039.96 5.63
6. South Eastern Coalfields Ltd. 4098.68 3.28
7. Indian Oil Corporation Ltd. 3954.62 3.16
8. Mahanadi Coalfields Ltd. 3709.51 2.96
9. GAIL (India) Ltd. 3653.84 2.92
10. Steel Authority of India Ltd. 3542.72 2.83
Total (1 to 10) 75676.47 60.49
Net Profit of profit making CPSEs. 125115.84 100.00
1.7.2 Top ten loss making CPSEs
Table 1.10 provides the list of top ten loss making CPSEs.Amongst the loss making companies, Bharat Sanchar Nigam Ltd.,Air India Ltd., and Mahanagar Telephone Nigam Ltd. were thetop three loss making CPSEs during 2011-12. The top ten loss
making companies claimed 90.43% of the total loss made by allthe (63) CPSEs during the year. The top three CPSEs namelyBSNL, Air India Ltd., and MTNL alone incurred a loss equal to74.35% of the total loss of all CPSEs in 2011-12.The loss of BSNLand MTNLwent up by 39%and 47% respectively in 2011-12 overthe previous year.
Table 1.10
Top Ten Loss Making CPSEs, 2011-12(` in crore)
Sl . Name of the CPSEs Net Loss (% share in totalNo. net loss)
(1) (2) (3) (4)
1. Bharat Sanchar Nigam Ltd. (-) 8850.70 32.07
2. Air India Ltd. (-) 7559.74 27.39
3. Mahanagar Telephone Nigam Ltd. (-) 4109.78 14.89
4. Hindustan Photo Films Manufacturing Co. Ltd. (-) 1352.32 4.90
5. Hindustan Cables Ltd. (-) 648.27 2.35
6. Air India Charters Ltd. (-) 602.50 2.18
7. Fertilizer Corporation of India Ltd. (-) 538.68 1.95
8. Indian Drugs & Pharmaceuticals Ltd. (-) 489.88 1.77
9. Shipping Corporation Ltd. (-) 428.21 1.55
10. Hindustan Fertilizer Corporation Ltd. 380.89 1.38
Total Loss (1 to 10) (-) 24960.97 90.43
Net Loss of loss making CPSEs. (-) 27602.37 100.00
Performance Overview 2011-1214
1.8 Contribution to GDP
1.8.1 Gross Value Addition by CPSEs
The share of ‘gross value addition’ in CPSEs (net valueaddition + depreciation) as percent of Gross Domestic Product(at current market price) stood at 5.67 per cent in 2011-12 against5.44 per cent in 2010-11. If, however, the under-recoveries of oilmarketing companies (amounting to `55041crore in 2011-12 and37190 crore in 2010-11) are included, then the share of gross valueaddition of all CPSEs in GDP goes up to 6.29 per cent in 2011-12 and 6.78 per cent in 2010-11.
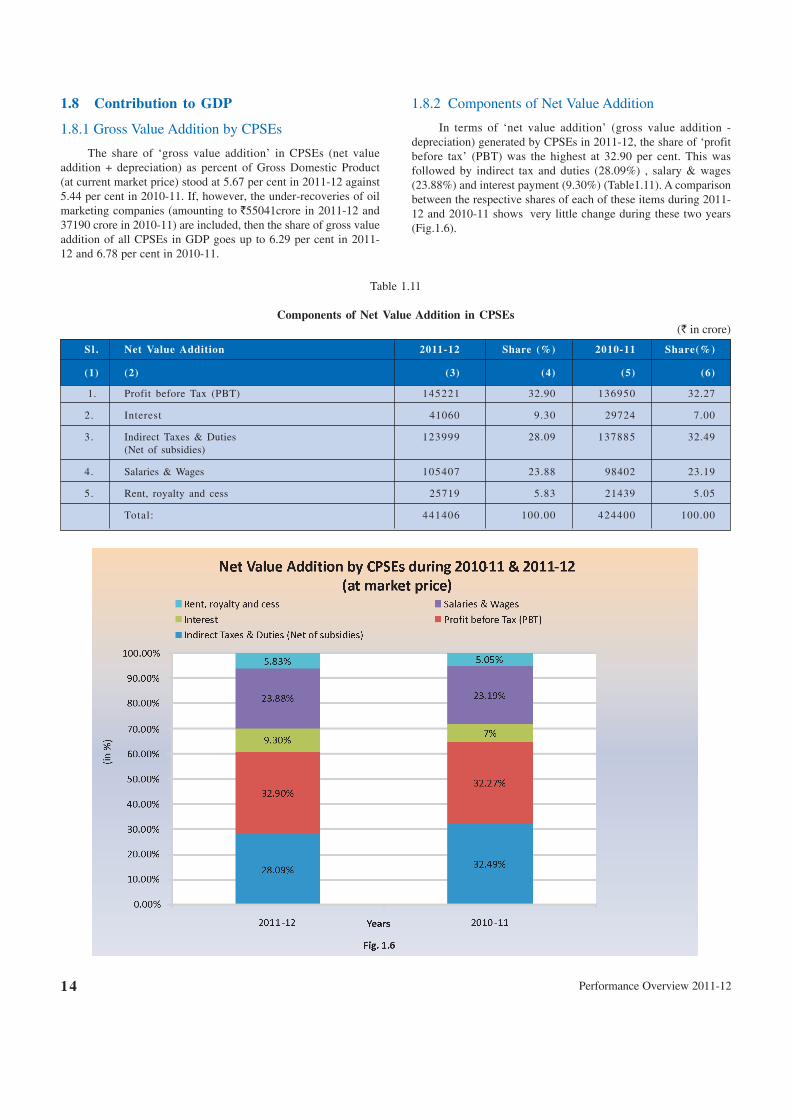
1.8.2 Components of Net Value Addition
In terms of ‘net value addition’ (gross value addition -depreciation) generated by CPSEs in 2011-12, the share of ‘profitbefore tax’ (PBT) was the highest at 32.90 per cent. This wasfollowed by indirect tax and duties (28.09%) , salary & wages(23.88%) and interest payment (9.30%) (Table1.11). A comparisonbetween the respective shares of each of these items during 2011-12 and 2010-11 shows very little change during these two years(Fig.1.6).
Table 1.11
Components of Net Value Addition in CPSEs (` in crore)
Sl . Net Value Addition 2011-12 Share (%) 2010-11 Share(%)
(1) (2) (3) (4) (5) (6)
1. Profit before Tax (PBT) 145221 32.90 136950 32.27
2. Interest 41060 9.30 29724 7.00
3. Indirect Taxes & Duties 123999 28.09 137885 32.49(Net of subsidies)
4. Salaries & Wages 105407 23.88 98402 23.19
5. Rent, royalty and cess 25719 5.83 21439 5.05
Total: 441406 100.00 424400 100.00
Public Enterprises Survey 2011-2012: Vol-I 15
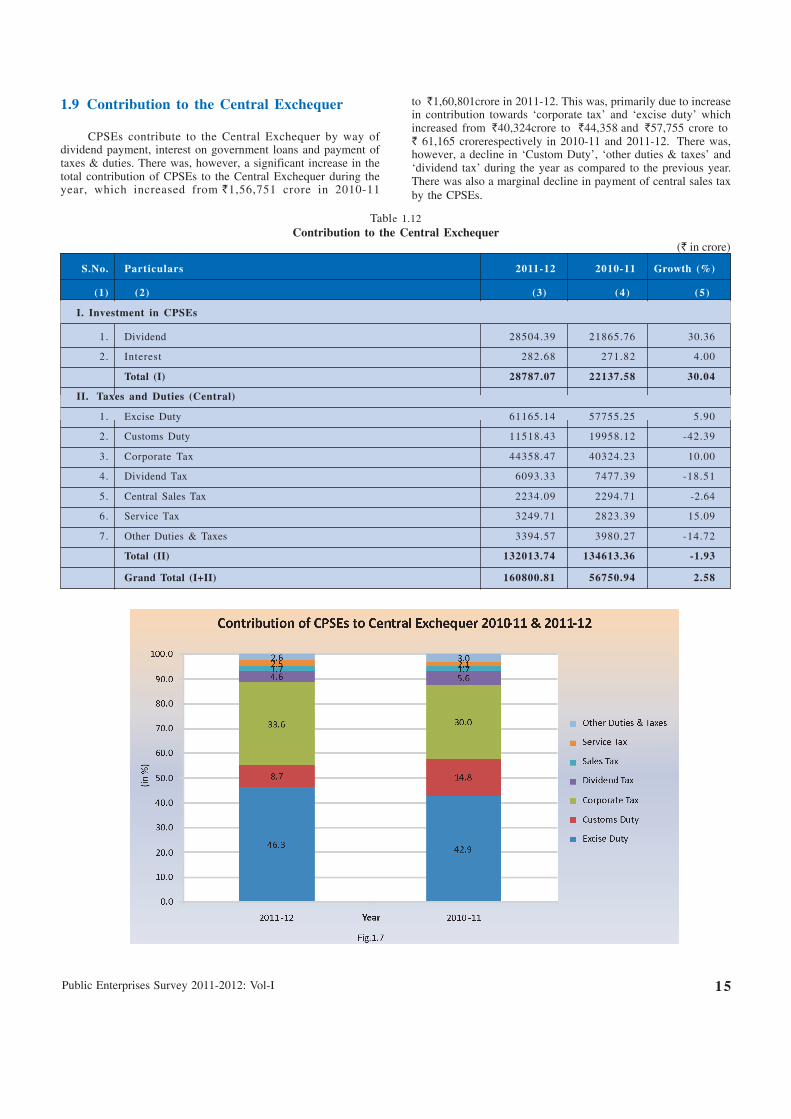
1.9 Contribution to the Central Exchequer
CPSEs contribute to the Central Exchequer by way ofdividend payment, interest on government loans and payment oftaxes & duties. There was, however, a significant increase in thetotal contribution of CPSEs to the Central Exchequer during theyear, which increased from `1,56,751 crore in 2010-11
to `1,60,801crore in 2011-12. This was, primarily due to increasein contribution towards ‘corporate tax’ and ‘excise duty’ whichincreased from `40,324crore to `44,358 and `57,755 crore to ` 61,165 crorerespectively in 2010-11 and 2011-12. There was,however, a decline in ‘Custom Duty’, ‘other duties & taxes’ and‘dividend tax’ during the year as compared to the previous year.There was also a marginal decline in payment of central sales taxby the CPSEs.
Table 1.12Contribution to the Central Exchequer
(` in crore)
S.No. Particulars 2011-12 2010-11 Growth (%)
(1) (2) (3) (4) (5)
I. Investment in CPSEs
1. Dividend 28504.39 21865.76 30.36
2. Interest 282.68 271.82 4.00
Total (I) 28787.07 22137.58 30.04
II. Taxes and Duties (Central)
1. Excise Duty 61165.14 57755.25 5.90
2. Customs Duty 11518.43 19958.12 -42.39
3. Corporate Tax 44358.47 40324.23 10.00
4. Dividend Tax 6093.33 7477.39 -18.51
5. Central Sales Tax 2234.09 2294.71 -2.64
6. Service Tax 3249.71 2823.39 15.09
7. Other Duties & Taxes 3394.57 3980.27 -14.72
Total (II) 132013.74 134613.36 -1.93
Grand Total (I+II) 160800.81 56750.94 2.58
Performance Overview 2011-1216
1.9 Government Disinvestment in CPSEs
Disinvestment of minority shares in CPSEs hasbecome an important source of raising resource for theGovernment. The policy of ‘disinvestment’ in CPSEshas evolved over the years. Disinvestment ofgovernment equity in CPSEs began in 1991-92following the Industrial Policy Statement of 1991, whichstated that the Government would divest part of itsholdings (minority share-holding) in select CPSEs.
1.9.1 Current Policy on Disinvestment
The current policy on disinvestment envisagespeople’s ownership of CPSEs while ensuring that theGovernment equity does not fall below 51% andGovernment retains management control. Keeping thisobjective in view of disinvestment policy, theGovernment has adopted the following approach todisinvestment:
(i) Already listed profitable CPSEs (not meetingmandatory shareholding of 10%) are to be madecompliant by ‘Offer for Sale’ (OFS) byGovernment or by the CPSEs through issue offresh shares or a combination of both.
(ii) Unlisted CPSEs with no accumulated losses andhaving earned net profit in three precedingconsecutive years are to be listed.
(iii) Follow-on public offers (FPO) would beconsidered in respect of profitable CPSEs having10 per cent or higher public ownership, takinginto consideration the needs for capitalinvestment of CPSE, on a case by case basisand Government could simultaneously orindependently offer a portion of its equityshareholding in conjunction.
(iv) Since each CPSE has different equity structure;financial strength; fund requirement; sector ofoperation etc., factors that do not permit a
uniform pattern of disinvestment, disinvestmentwill be considered on merits and on a case-by-case basis.
(v) CPSEs are permitted to use their surplus cashto buyback their shares; one CPSE may buy theshares of other CPSEs from the Government.
1.9.2 Disinvestment in Loss Making CPSEs
The Board for Reconstruction of Public SectorEnterprises (BRPSE) has been mandated to examineloss-making/sick CPSEs for revival/restructuring fortheir turnaround and advise the Government ondisinvestment/closure/sale in full or part, in respect ofchronically loss-making/sick CPSEs that cannot berevived. As such if efforts to revive fail and theGovernment decides for privatization, then theDepartment of Disinvestment will take up such casesfor strategic sale.
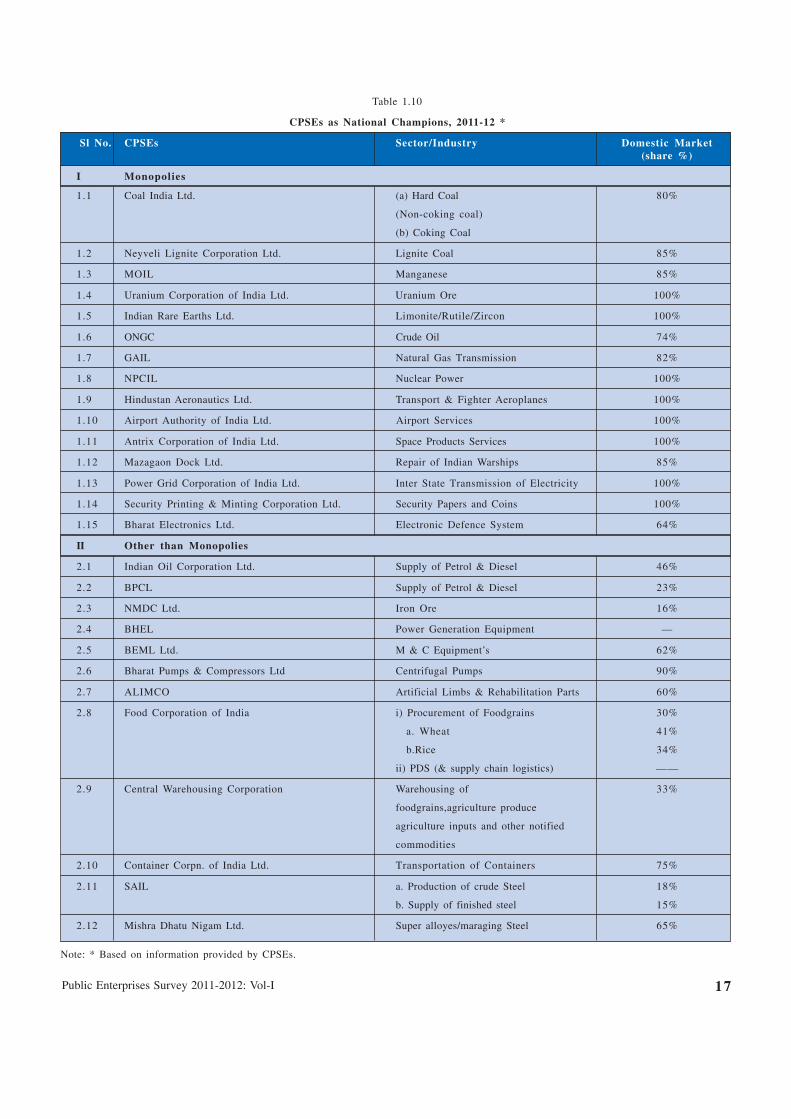
1.10 CPSEs as “National Champions”
A few countries give recognition to domesticcompanies with significant market-shares as ‘nationalchampions’. They are also accorded variousconcessions / privileges vis-à-vis interest rates etc witha view to further nurture them and develop them into‘global challenge’ and ‘global leaders’.
Based on this criterion of significant market-shares, there are a number of CPSEs who could beidentified as ‘national champions’ (Table 1.10).TheCPSEs operating in some industries/sectors aremoreover ‘monopolies’ such as nuclear powergeneration. The other industries where they have amajor share in domestic and national output (includingimports) are coal, petroleum, telecommunication, powergeneration and transmission. In comparison to 1998-99, however, the share of CPSEs in these industrieshas been significantly coming down over the years(except power generation).
Public Enterprises Survey 2011-2012: Vol-I 17
Table 1.10
CPSEs as National Champions, 2011-12 *
Sl No. CPSEs Sector/Industry Domestic Market(share %)
I Monopolies
1.1 Coal India Ltd. (a) Hard Coal 80%
(Non-coking coal)
(b) Coking Coal
1.2 Neyveli Lignite Corporation Ltd. Lignite Coal 85%
1.3 MOIL Manganese 85%
1.4 Uranium Corporation of India Ltd. Uranium Ore 100%
1.5 Indian Rare Earths Ltd. Limonite/Rutile/Zircon 100%
1.6 ONGC Crude Oil 74%
1.7 GAIL Natural Gas Transmission 82%
1.8 NPCIL Nuclear Power 100%
1.9 Hindustan Aeronautics Ltd. Transport & Fighter Aeroplanes 100%
1.10 Airport Authority of India Ltd. Airport Services 100%
1.11 Antrix Corporation of India Ltd. Space Products Services 100%
1.12 Mazagaon Dock Ltd. Repair of Indian Warships 85%
1.13 Power Grid Corporation of India Ltd. Inter State Transmission of Electricity 100%
1.14 Security Printing & Minting Corporation Ltd. Security Papers and Coins 100%
1.15 Bharat Electronics Ltd. Electronic Defence System 64%
II Other than Monopolies
2.1 Indian Oil Corporation Ltd. Supply of Petrol & Diesel 46%
2.2 BPCL Supply of Petrol & Diesel 23%
2.3 NMDC Ltd. Iron Ore 16%
2.4 BHEL Power Generation Equipment —
2.5 BEML Ltd. M & C Equipment’s 62%
2.6 Bharat Pumps & Compressors Ltd Centrifugal Pumps 90%
2.7 ALIMCO Artificial Limbs & Rehabilitation Parts 60%
2.8 Food Corporation of India i) Procurement of Foodgrains 30%
a. Wheat 41%
b.Rice 34%
ii) PDS (& supply chain logistics) ——
2.9 Central Warehousing Corporation Warehousing of 33%
foodgrains,agriculture produce
agriculture inputs and other notified
commodities
2.10 Container Corpn. of India Ltd. Transportation of Containers 75%
2.11 SAIL a. Production of crude Steel 18%
b. Supply of finished steel 15%
2.12 Mishra Dhatu Nigam Ltd. Super alloyes/maraging Steel 65%
Note: * Based on information provided by CPSEs.
Performance Overview 2011-1218
1.11 Policy for Revival of Sick PSEs
The CPSEs were brought under the purview of SickIndustrial Companies (Special Provision) Act, 1985 in1991. The condition of sick CPSEs (i.e., CPSEs whoseaccumulated losses have exceeded their net worth) has beenimproving over the years. The number of sick CPSEs, whichwas 90 in 2004-05, came down to 66 in March 2012.
The Government subsequently set up the Board forReconstruction of Public Sector Enterprises (BRPSE) inDecember, 2004 to advise the Government, inter alia, on themeasures to restructure/revive, both industrial and non-industrial CPSEs. The cases of 67 sick CPSEs have beenreferred to BRPSE up to October 2012, out of which the Boardhas made recommendations in respect of 62 cases. Furtherfive cases have been returned to the concernedadministrative Ministries/Departments for furtherexamination.
1.12 Board Structure of CPSEs
CPSEs are categorized into four Schedules namely ‘A’,‘B’, ‘C’ and ‘D’, based on various quantitative, qualitativeand other factors. The pay scales of Chief Executives andof full time Functional Directors in CPSEs are determined asper the Schedule of the concerned CPSE. Proposals fromvarious administrative Ministries/Departments for initialcategorization / up-gradation of CPSEs in appropriateschedule, personal up-gradation, creation of posts in CPSEs,etc. are considered in Department of Public Enterprises(DPE) in consultation with the Public Enterprises SelectionBoard (PESB).
1.13 Professionalization of Boards
In pursuance to the policy on public sector enterprisesbeing followed since 1991, several measures have been takenby the DPE to professionalize the Boards ofCPSEs. Theguidelines issued by the DPE in 1992 provide for inductionof outside professionals on the Boards of CPSEs as part-time non-official Directors. Furthermore, it has been decidedthat the candidates from State Level Public Enterprises(SLPEs) and the private sector will also be considered asnon-internal candidates, besides the candidates from CPSEs,for selection to the post of Functional Directors in CPSEssubject to the eligibility criteria.
1.14 Wages/ Salaries and Employees Welfare
The Department of Public Enterprises (DPE) functionsas the nodal Department in the Government of India,inter-alia, in respect of policy relating to wage settlements ofunionized employees, pay revision of non-unionizedsupervisors and the executives holding posts below theBoard level and executives at the Board level in CPSEs. The
CPSEs are largely following the Industrial DearnessAllowance (IDA) pattern scales of pay. In some cases, (onlyapprox. 4%) Central Dearness Allowance (CDA) pattern ofscales of pay is followed in the CPSEs.
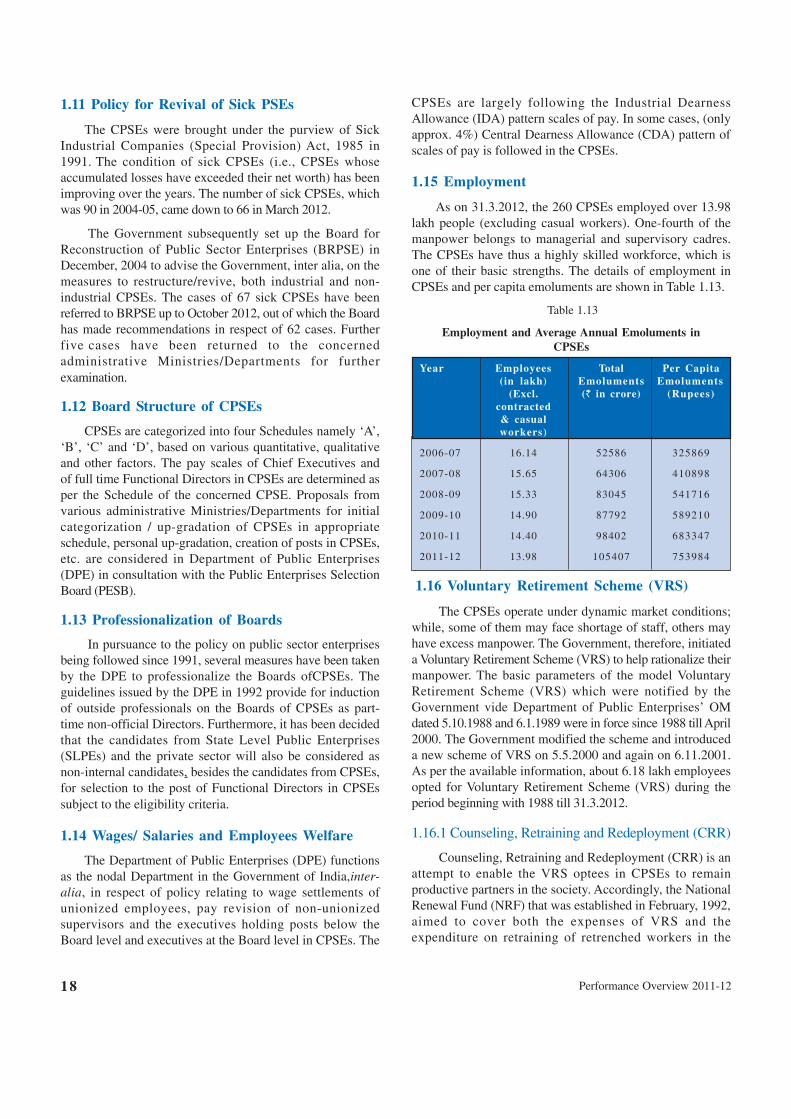
1.15 Employment
As on 31.3.2012, the 260 CPSEs employed over 13.98lakh people (excluding casual workers). One-fourth of themanpower belongs to managerial and supervisory cadres.The CPSEs have thus a highly skilled workforce, which isone of their basic strengths. The details of employment inCPSEs and per capita emoluments are shown in Table 1.13.
Table 1.13
Employment and Average Annual Emoluments inCPSEs
Year Employees Total Per Capita(in lakh) Emoluments Emoluments
(Excl. (` in crore) (Rupees)contracted& casualworkers)
2006-07 16.14 52586 325869
2007-08 15.65 64306 410898
2008-09 15.33 83045 541716
2009-10 14.90 87792 589210
2010-11 14.40 98402 683347
2011-12 13.98 105407 753984
1.16 Voluntary Retirement Scheme (VRS)
The CPSEs operate under dynamic market conditions;while, some of them may face shortage of staff, others mayhave excess manpower. The Government, therefore, initiateda Voluntary Retirement Scheme (VRS) to help rationalize theirmanpower. The basic parameters of the model VoluntaryRetirement Scheme (VRS) which were notified by theGovernment vide Department of Public Enterprises’ OMdated 5.10.1988 and 6.1.1989 were in force since 1988 till April2000. The Government modified the scheme and introduceda new scheme of VRS on 5.5.2000 and again on 6.11.2001.As per the available information, about 6.18 lakh employeesopted for Voluntary Retirement Scheme (VRS) during theperiod beginning with 1988 till 31.3.2012.
1.16.1 Counseling, Retraining and Redeployment (CRR)
Counseling, Retraining and Redeployment (CRR) is anattempt to enable the VRS optees in CPSEs to remainproductive partners in the society. Accordingly, the NationalRenewal Fund (NRF) that was established in February, 1992,aimed to cover both the expenses of VRS and theexpenditure on retraining of retrenched workers in the
Public Enterprises Survey 2011-2012: Vol-I 19
organized sector. The main elements of CRR programme areCounseling, Retraining and Redeployment. Counseling helpsthe rationalized employees to absorb the shock of leavingthe organization, to properly manage their funds includingcompensation and to motivate them to face the challengesand to re-join the productive process. Similarly, retrainingstrengthens their skill / expertise. The selected traininginstitute/nodal agencies impart need-based training of 30days/ 40 days / 60 day’s modules. The training leads toredeployment mostly through self-employment. Presently,the objective is to maximize the rate of self-employment. Thenodal Agencies, therefore, provide need based support,linkage with credit institutions and continuously follow upwith the retrained personnel. In order to evaluate theperformance of nodal agencies DPE has decided in favourof a Third Party Assessment Agency (TPAA) from 2012-13.
1.17 Memorandum of Understanding (MOU)system in CPSEs
The Memorandum of Understanding (MoU), asapplicable to public sector enterprises, is a negotiateddocument between the government and the management ofthe enterprise specifying clearly the objectives of theagreement and the obligations of both the parties. The mainpurpose of the MoU system is to manage CPSEs by resultsand objectives instead of by control and procedures. The‘management’ of the enterprise is made accountable to thegovernment through promise for performance or‘performance contract’.
Performance evaluation is done based on thecomparison between the actual achievements and the annualtargets agreed upon between the government and the CPSE.The targets constitute of both financial and non-financialparameters with different weights assigned to the differentparameters. In order to distinguish ‘excellent’ from ‘poor’,moreover, performance during the year is measured on a 5-
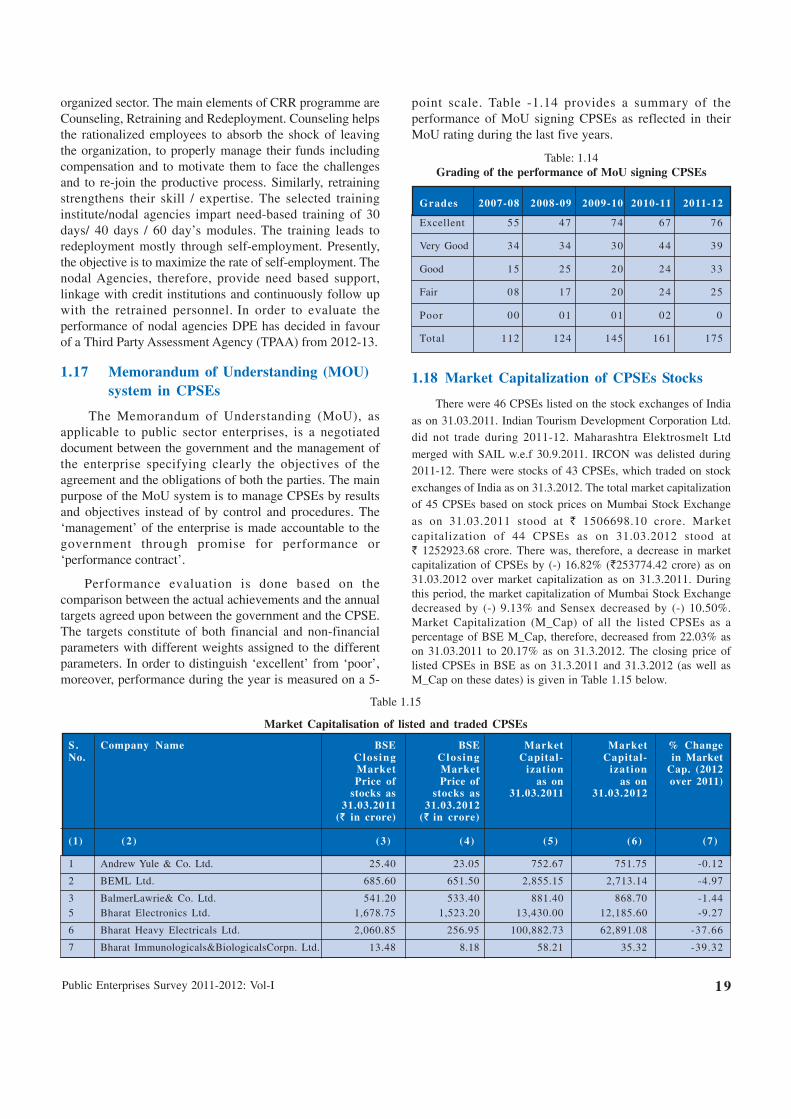
point scale. Table -1.14 provides a summary of theperformance of MoU signing CPSEs as reflected in theirMoU rating during the last five years.
Table: 1.14Grading of the performance of MoU signing CPSEs
Grades 2007-08 2008-09 2009-10 2010-11 2011-12
Excellent 55 47 74 67 76
Very Good 34 34 30 44 39
Good 15 25 20 24 33
Fair 08 17 20 24 25
Poor 00 01 01 02 0
Total 112 124 145 161 175
1.18 Market Capitalization of CPSEs Stocks
There were 46 CPSEs listed on the stock exchanges of India
as on 31.03.2011. Indian Tourism Development Corporation Ltd.did not trade during 2011-12. Maharashtra Elektrosmelt Ltd
merged with SAIL w.e.f 30.9.2011. IRCON was delisted during2011-12. There were stocks of 43 CPSEs, which traded on stock
exchanges of India as on 31.3.2012. The total market capitalizationof 45 CPSEs based on stock prices on Mumbai Stock Exchange
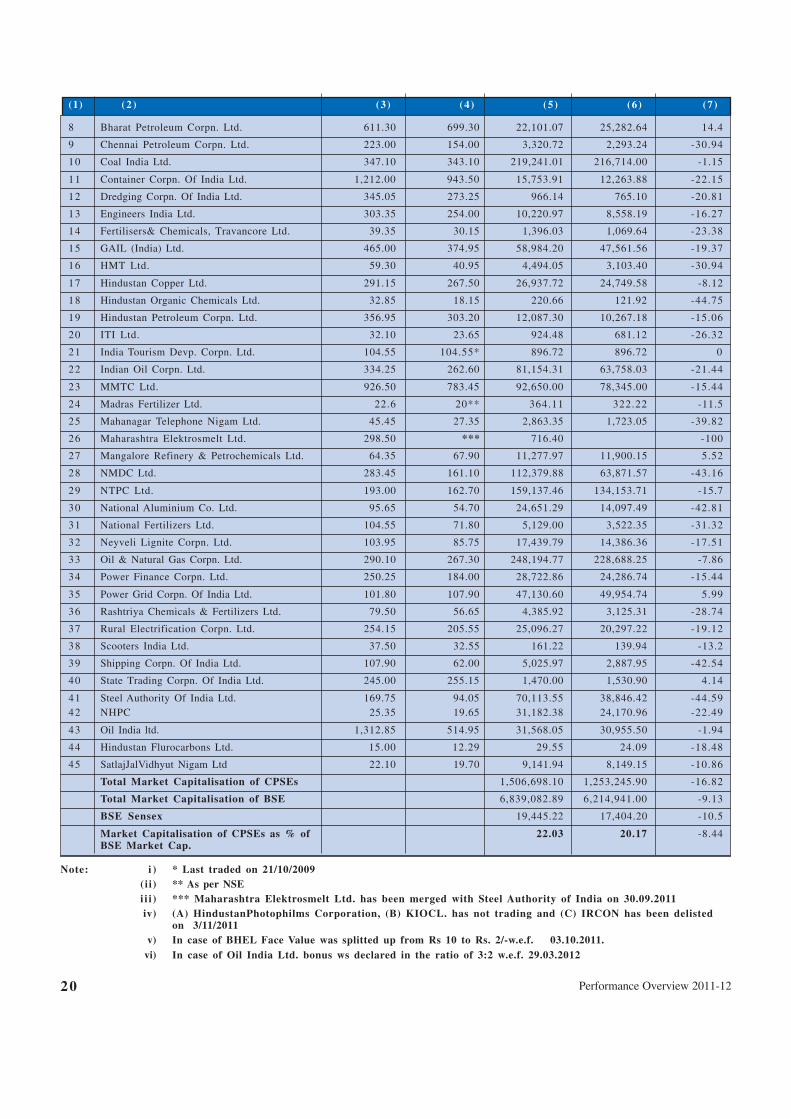
as on 31.03.2011 stood at ` 1506698.10 crore. Marketcapitalization of 44 CPSEs as on 31.03.2012 stood at` 1252923.68 crore. There was, therefore, a decrease in marketcapitalization of CPSEs by (-) 16.82% (`253774.42 crore) as on31.03.2012 over market capitalization as on 31.3.2011. Duringthis period, the market capitalization of Mumbai Stock Exchangedecreased by (-) 9.13% and Sensex decreased by (-) 10.50%.Market Capitalization (M_Cap) of all the listed CPSEs as apercentage of BSE M_Cap, therefore, decreased from 22.03% ason 31.03.2011 to 20.17% as on 31.3.2012. The closing price oflisted CPSEs in BSE as on 31.3.2011 and 31.3.2012 (as well asM_Cap on these dates) is given in Table 1.15 below.
Table 1.15
Market Capitalisation of listed and traded CPSEs
S . Company Name BSE BSE Market Market % ChangeNo. Clos ing Clos ing Capital- Capital- in Market
Market Market izat ion izat ion Cap. (2012Price of Price of as on as on over 2011)
stocks as stocks as 31.03.2011 31.03.201231.03.2011 31.03.2012
(` in crore) (` in crore)
(1) (2 ) (3) (4) (5) (6) (7)
1 Andrew Yule & Co. Ltd. 25.40 23.05 752.67 751.75 -0.12
2 BEML Ltd. 685.60 651.50 2,855.15 2,713.14 -4.97
3 BalmerLawrie& Co. Ltd. 541.20 533.40 881.40 868.70 -1.445 Bharat Electronics Ltd. 1,678.75 1,523.20 13,430.00 12,185.60 -9.27
6 Bharat Heavy Electricals Ltd. 2,060.85 256.95 100,882.73 62,891.08 -37.66
7 Bharat Immunologicals&BiologicalsCorpn. Ltd. 13.48 8.18 58.21 35.32 -39.32
Performance Overview 2011-1220
(1) (2 ) (3) (4) (5) (6) (7)
8 Bharat Petroleum Corpn. Ltd. 611.30 699.30 22,101.07 25,282.64 14.4
9 Chennai Petroleum Corpn. Ltd. 223.00 154.00 3,320.72 2,293.24 -30.94
10 Coal India Ltd. 347.10 343.10 219,241.01 216,714.00 -1.15
11 Container Corpn. Of India Ltd. 1,212.00 943.50 15,753.91 12,263.88 -22.15
12 Dredging Corpn. Of India Ltd. 345.05 273.25 966.14 765.10 -20.81
13 Engineers India Ltd. 303.35 254.00 10,220.97 8,558.19 -16.27
14 Fertilisers& Chemicals, Travancore Ltd. 39.35 30.15 1,396.03 1,069.64 -23.38
15 GAIL (India) Ltd. 465.00 374.95 58,984.20 47,561.56 -19.37
16 HMT Ltd. 59.30 40.95 4,494.05 3,103.40 -30.94
17 Hindustan Copper Ltd. 291.15 267.50 26,937.72 24,749.58 -8.12
18 Hindustan Organic Chemicals Ltd. 32.85 18.15 220.66 121.92 -44.75
19 Hindustan Petroleum Corpn. Ltd. 356.95 303.20 12,087.30 10,267.18 -15.06
20 ITI Ltd. 32.10 23.65 924.48 681.12 -26.32
21 India Tourism Devp. Corpn. Ltd. 104.55 104.55* 896.72 896.72 0
22 Indian Oil Corpn. Ltd. 334.25 262.60 81,154.31 63,758.03 -21.44
23 MMTC Ltd. 926.50 783.45 92,650.00 78,345.00 -15.44
24 Madras Fertilizer Ltd. 22.6 20** 364.11 322.22 -11.5
25 Mahanagar Telephone Nigam Ltd. 45.45 27.35 2,863.35 1,723.05 -39.82
26 Maharashtra Elektrosmelt Ltd. 298.50 *** 716.40 -100
27 Mangalore Refinery & Petrochemicals Ltd. 64.35 67.90 11,277.97 11,900.15 5.52
28 NMDC Ltd. 283.45 161.10 112,379.88 63,871.57 -43.16
29 NTPC Ltd. 193.00 162.70 159,137.46 134,153.71 -15.7
30 National Aluminium Co. Ltd. 95.65 54.70 24,651.29 14,097.49 -42.81
31 National Fertilizers Ltd. 104.55 71.80 5,129.00 3,522.35 -31.32
32 Neyveli Lignite Corpn. Ltd. 103.95 85.75 17,439.79 14,386.36 -17.51
33 Oil & Natural Gas Corpn. Ltd. 290.10 267.30 248,194.77 228,688.25 -7.86
34 Power Finance Corpn. Ltd. 250.25 184.00 28,722.86 24,286.74 -15.44
35 Power Grid Corpn. Of India Ltd. 101.80 107.90 47,130.60 49,954.74 5.99
36 Rashtriya Chemicals & Fertilizers Ltd. 79.50 56.65 4,385.92 3,125.31 -28.74
37 Rural Electrification Corpn. Ltd. 254.15 205.55 25,096.27 20,297.22 -19.12
38 Scooters India Ltd. 37.50 32.55 161.22 139.94 -13.2
39 Shipping Corpn. Of India Ltd. 107.90 62.00 5,025.97 2,887.95 -42.54
40 State Trading Corpn. Of India Ltd. 245.00 255.15 1,470.00 1,530.90 4.14
41 Steel Authority Of India Ltd. 169.75 94.05 70,113.55 38,846.42 -44.5942 NHPC 25.35 19.65 31,182.38 24,170.96 -22.49
43 Oil India ltd. 1,312.85 514.95 31,568.05 30,955.50 -1.94
44 Hindustan Flurocarbons Ltd. 15.00 12.29 29.55 24.09 -18.48
45 SatlajJalVidhyut Nigam Ltd 22.10 19.70 9,141.94 8,149.15 -10.86
Total Market Capitalisation of CPSEs 1,506,698.10 1,253,245.90 -16.82
Total Market Capitalisation of BSE 6,839,082.89 6,214,941.00 -9.13
BSE Sensex 19,445.22 17,404.20 -10.5
Market Capitalisation of CPSEs as % of 22.03 20.17 -8.44BSE Market Cap.
Note: i ) * Last traded on 21/10/2009(ii) ** As per NSEi i i ) *** Maharashtra Elektrosmelt Ltd. has been merged with Steel Authority of India on 30.09.2011iv) (A) HindustanPhotophilms Corporation, (B) KIOCL. has not trading and (C) IRCON has been delisted
on 3/11/2011 v) In case of BHEL Face Value was splitted up from Rs 10 to Rs. 2/-w.e.f. 03.10.2011.
vi) In case of Oil India Ltd. bonus ws declared in the ratio of 3:2 w.e.f. 29.03.2012
Public Enterprises Survey 2011-2012: Vol-I 21
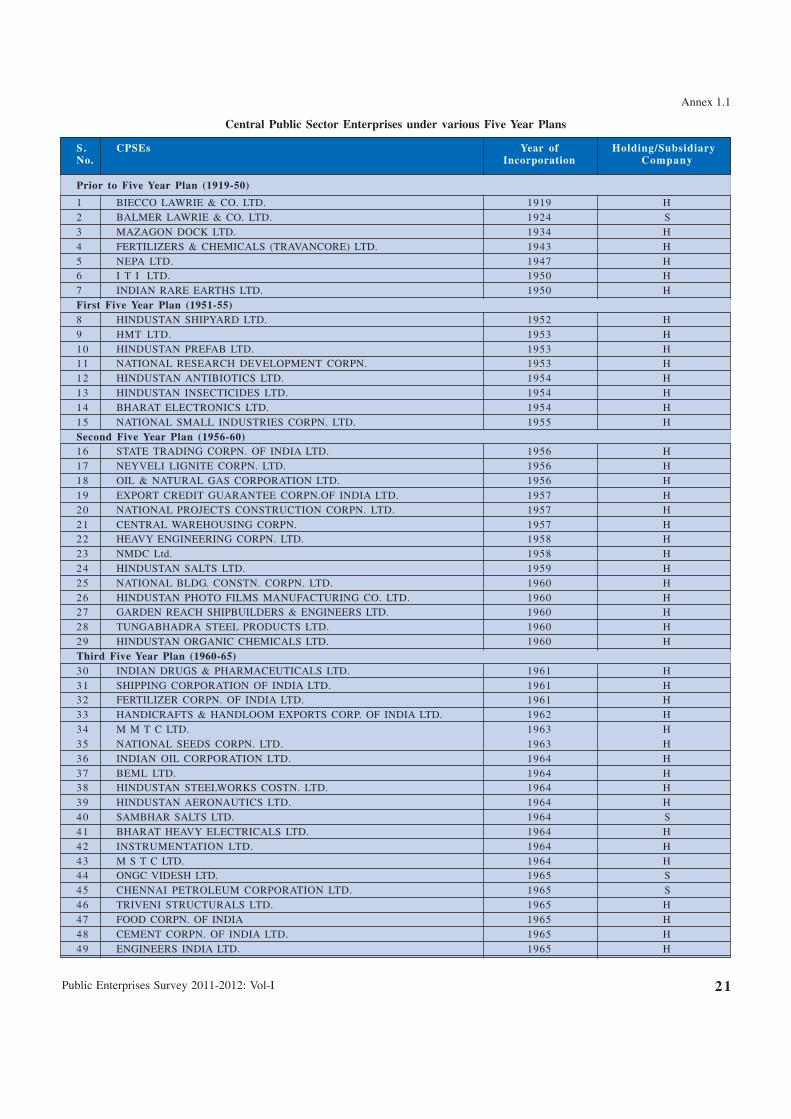
Annex 1.1
Central Public Sector Enterprises under various Five Year Plans
S . CPSEs Year of Holding/SubsidiaryNo. Incorporation Company
Prior to Five Year Plan (1919-50)
1 BIECCO LAWRIE & CO. LTD. 1919 H2 BALMER LAWRIE & CO. LTD. 1924 S3 MAZAGON DOCK LTD. 1934 H4 FERTILIZERS & CHEMICALS (TRAVANCORE) LTD. 1943 H5 NEPA LTD. 1947 H6 I T I LTD. 1950 H7 INDIAN RARE EARTHS LTD. 1950 HFirst Five Year Plan (1951-55)8 HINDUSTAN SHIPYARD LTD. 1952 H9 HMT LTD. 1953 H10 HINDUSTAN PREFAB LTD. 1953 H11 NATIONAL RESEARCH DEVELOPMENT CORPN. 1953 H12 HINDUSTAN ANTIBIOTICS LTD. 1954 H13 HINDUSTAN INSECTICIDES LTD. 1954 H14 BHARAT ELECTRONICS LTD. 1954 H15 NATIONAL SMALL INDUSTRIES CORPN. LTD. 1955 HSecond Five Year Plan (1956-60)16 STATE TRADING CORPN. OF INDIA LTD. 1956 H17 NEYVELI LIGNITE CORPN. LTD. 1956 H18 OIL & NATURAL GAS CORPORATION LTD. 1956 H19 EXPORT CREDIT GUARANTEE CORPN.OF INDIA LTD. 1957 H20 NATIONAL PROJECTS CONSTRUCTION CORPN. LTD. 1957 H21 CENTRAL WAREHOUSING CORPN. 1957 H22 HEAVY ENGINEERING CORPN. LTD. 1958 H23 NMDC Ltd. 1958 H24 HINDUSTAN SALTS LTD. 1959 H25 NATIONAL BLDG. CONSTN. CORPN. LTD. 1960 H26 HINDUSTAN PHOTO FILMS MANUFACTURING CO. LTD. 1960 H27 GARDEN REACH SHIPBUILDERS & ENGINEERS LTD. 1960 H28 TUNGABHADRA STEEL PRODUCTS LTD. 1960 H29 HINDUSTAN ORGANIC CHEMICALS LTD. 1960 HThird Five Year Plan (1960-65)30 INDIAN DRUGS & PHARMACEUTICALS LTD. 1961 H31 SHIPPING CORPORATION OF INDIA LTD. 1961 H32 FERTILIZER CORPN. OF INDIA LTD. 1961 H33 HANDICRAFTS & HANDLOOM EXPORTS CORP. OF INDIA LTD. 1962 H34 M M T C LTD. 1963 H35 NATIONAL SEEDS CORPN. LTD. 1963 H36 INDIAN OIL CORPORATION LTD. 1964 H37 BEML LTD. 1964 H38 HINDUSTAN STEELWORKS COSTN. LTD. 1964 H39 HINDUSTAN AERONAUTICS LTD. 1964 H40 SAMBHAR SALTS LTD. 1964 S41 BHARAT HEAVY ELECTRICALS LTD. 1964 H42 INSTRUMENTATION LTD. 1964 H43 M S T C LTD. 1964 H44 ONGC VIDESH LTD. 1965 S45 CHENNAI PETROLEUM CORPORATION LTD. 1965 S46 TRIVENI STRUCTURALS LTD. 1965 H47 FOOD CORPN. OF INDIA 1965 H48 CEMENT CORPN. OF INDIA LTD. 1965 H49 ENGINEERS INDIA LTD. 1965 H
Performance Overview 2011-1222
S. CPSEs Year of Holding/SubsidiaryNo. Incorporation Company
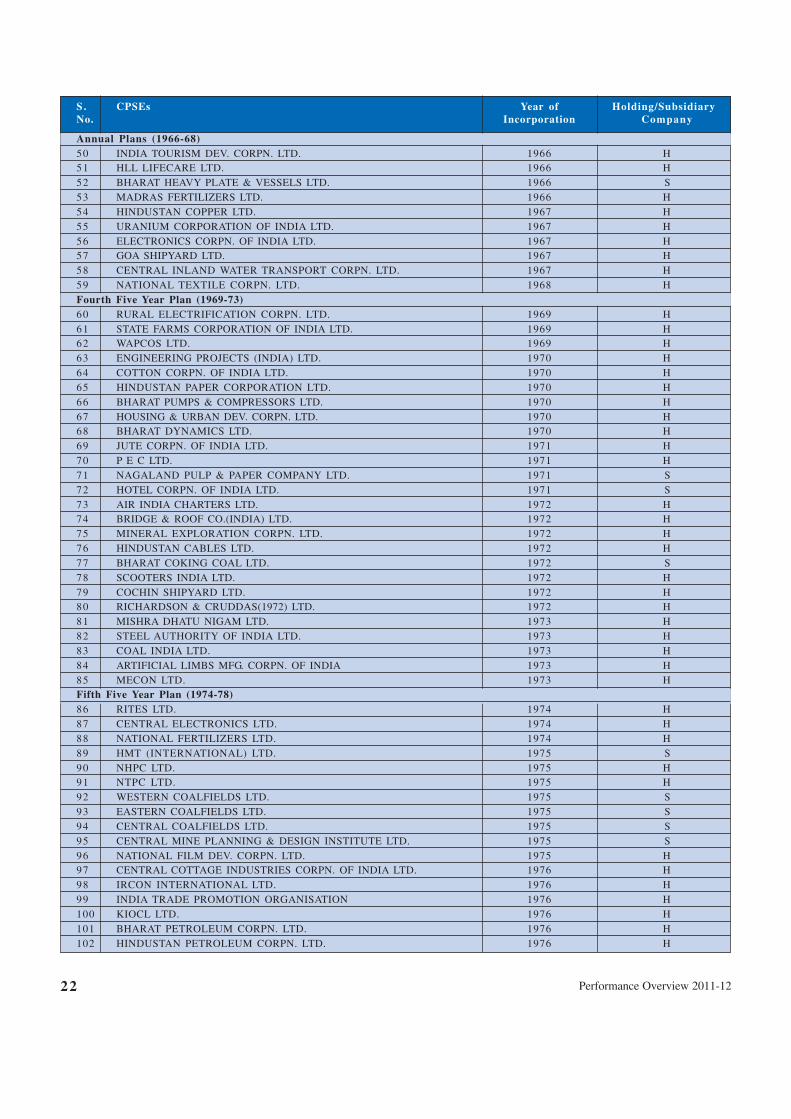
Annual Plans (1966-68)50 INDIA TOURISM DEV. CORPN. LTD. 1966 H51 HLL LIFECARE LTD. 1966 H52 BHARAT HEAVY PLATE & VESSELS LTD. 1966 S53 MADRAS FERTILIZERS LTD. 1966 H54 HINDUSTAN COPPER LTD. 1967 H55 URANIUM CORPORATION OF INDIA LTD. 1967 H56 ELECTRONICS CORPN. OF INDIA LTD. 1967 H57 GOA SHIPYARD LTD. 1967 H58 CENTRAL INLAND WATER TRANSPORT CORPN. LTD. 1967 H59 NATIONAL TEXTILE CORPN. LTD. 1968 HFourth Five Year Plan (1969-73)60 RURAL ELECTRIFICATION CORPN. LTD. 1969 H61 STATE FARMS CORPORATION OF INDIA LTD. 1969 H62 WAPCOS LTD. 1969 H63 ENGINEERING PROJECTS (INDIA) LTD. 1970 H64 COTTON CORPN. OF INDIA LTD. 1970 H65 HINDUSTAN PAPER CORPORATION LTD. 1970 H66 BHARAT PUMPS & COMPRESSORS LTD. 1970 H67 HOUSING & URBAN DEV. CORPN. LTD. 1970 H68 BHARAT DYNAMICS LTD. 1970 H69 JUTE CORPN. OF INDIA LTD. 1971 H70 P E C LTD. 1971 H71 NAGALAND PULP & PAPER COMPANY LTD. 1971 S72 HOTEL CORPN. OF INDIA LTD. 1971 S73 AIR INDIA CHARTERS LTD. 1972 H74 BRIDGE & ROOF CO.(INDIA) LTD. 1972 H75 MINERAL EXPLORATION CORPN. LTD. 1972 H76 HINDUSTAN CABLES LTD. 1972 H77 BHARAT COKING COAL LTD. 1972 S78 SCOOTERS INDIA LTD. 1972 H79 COCHIN SHIPYARD LTD. 1972 H80 RICHARDSON & CRUDDAS(1972) LTD. 1972 H81 MISHRA DHATU NIGAM LTD. 1973 H82 STEEL AUTHORITY OF INDIA LTD. 1973 H83 COAL INDIA LTD. 1973 H84 ARTIFICIAL LIMBS MFG. CORPN. OF INDIA 1973 H85 MECON LTD. 1973 HFifth Five Year Plan (1974-78)86 RITES LTD. 1974 H87 CENTRAL ELECTRONICS LTD. 1974 H88 NATIONAL FERTILIZERS LTD. 1974 H89 HMT (INTERNATIONAL) LTD. 1975 S90 NHPC LTD. 1975 H91 NTPC LTD. 1975 H92 WESTERN COALFIELDS LTD. 1975 S93 EASTERN COALFIELDS LTD. 1975 S94 CENTRAL COALFIELDS LTD. 1975 S95 CENTRAL MINE PLANNING & DESIGN INSTITUTE LTD. 1975 S96 NATIONAL FILM DEV. CORPN. LTD. 1975 H97 CENTRAL COTTAGE INDUSTRIES CORPN. OF INDIA LTD. 1976 H98 IRCON INTERNATIONAL LTD. 1976 H99 INDIA TRADE PROMOTION ORGANISATION 1976 H100 KIOCL LTD. 1976 H101 BHARAT PETROLEUM CORPN. LTD. 1976 H102 HINDUSTAN PETROLEUM CORPN. LTD. 1976 H
Public Enterprises Survey 2011-2012: Vol-I 23
S. CPSEs Year of Holding/SubsidiaryNo. Incorporation Company
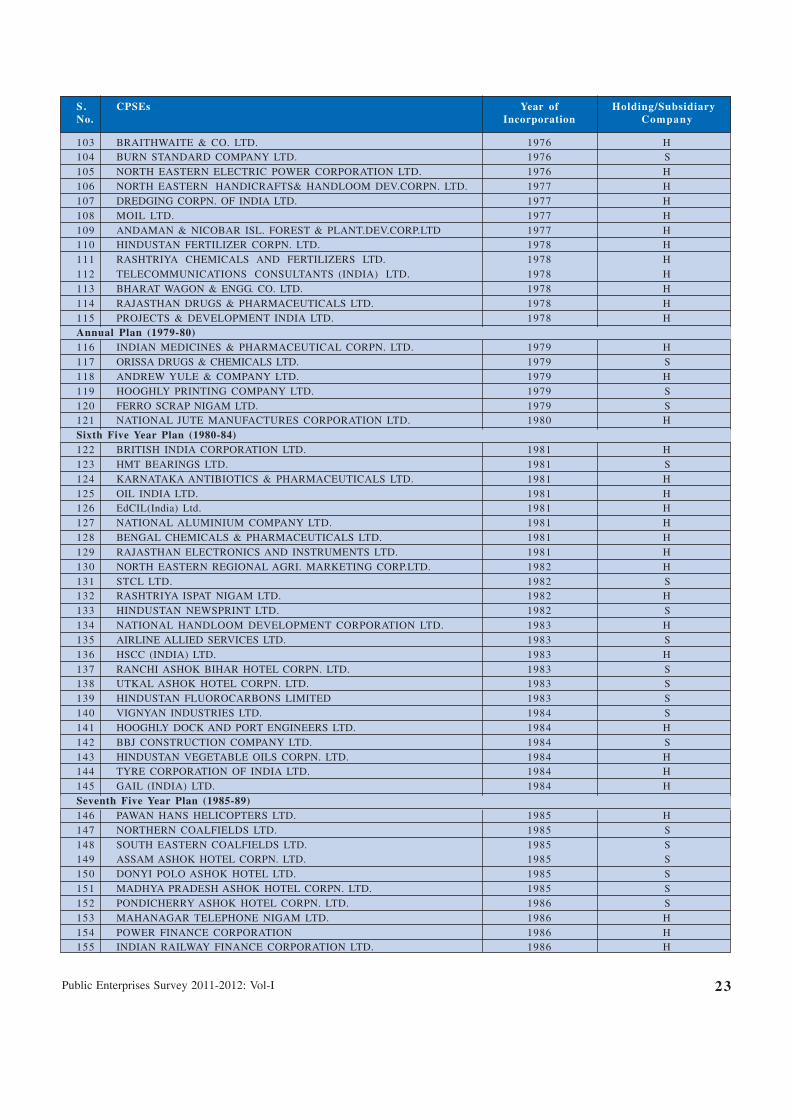
103 BRAITHWAITE & CO. LTD. 1976 H104 BURN STANDARD COMPANY LTD. 1976 S105 NORTH EASTERN ELECTRIC POWER CORPORATION LTD. 1976 H106 NORTH EASTERN HANDICRAFTS& HANDLOOM DEV.CORPN. LTD. 1977 H107 DREDGING CORPN. OF INDIA LTD. 1977 H108 MOIL LTD. 1977 H109 ANDAMAN & NICOBAR ISL. FOREST & PLANT.DEV.CORP.LTD 1977 H110 HINDUSTAN FERTILIZER CORPN. LTD. 1978 H111 RASHTRIYA CHEMICALS AND FERTILIZERS LTD. 1978 H112 TELECOMMUNICATIONS CONSULTANTS (INDIA) LTD. 1978 H113 BHARAT WAGON & ENGG. CO. LTD. 1978 H114 RAJASTHAN DRUGS & PHARMACEUTICALS LTD. 1978 H115 PROJECTS & DEVELOPMENT INDIA LTD. 1978 HAnnual Plan (1979-80)116 INDIAN MEDICINES & PHARMACEUTICAL CORPN. LTD. 1979 H117 ORISSA DRUGS & CHEMICALS LTD. 1979 S118 ANDREW YULE & COMPANY LTD. 1979 H119 HOOGHLY PRINTING COMPANY LTD. 1979 S120 FERRO SCRAP NIGAM LTD. 1979 S121 NATIONAL JUTE MANUFACTURES CORPORATION LTD. 1980 HSixth Five Year Plan (1980-84)122 BRITISH INDIA CORPORATION LTD. 1981 H123 HMT BEARINGS LTD. 1981 S124 KARNATAKA ANTIBIOTICS & PHARMACEUTICALS LTD. 1981 H125 OIL INDIA LTD. 1981 H126 EdCIL(India) Ltd. 1981 H127 NATIONAL ALUMINIUM COMPANY LTD. 1981 H128 BENGAL CHEMICALS & PHARMACEUTICALS LTD. 1981 H129 RAJASTHAN ELECTRONICS AND INSTRUMENTS LTD. 1981 H130 NORTH EASTERN REGIONAL AGRI. MARKETING CORP.LTD. 1982 H131 STCL LTD. 1982 S132 RASHTRIYA ISPAT NIGAM LTD. 1982 H133 HINDUSTAN NEWSPRINT LTD. 1982 S134 NATIONAL HANDLOOM DEVELOPMENT CORPORATION LTD. 1983 H135 AIRLINE ALLIED SERVICES LTD. 1983 S136 HSCC (INDIA) LTD. 1983 H137 RANCHI ASHOK BIHAR HOTEL CORPN. LTD. 1983 S138 UTKAL ASHOK HOTEL CORPN. LTD. 1983 S139 HINDUSTAN FLUOROCARBONS LIMITED 1983 S140 VIGNYAN INDUSTRIES LTD. 1984 S141 HOOGHLY DOCK AND PORT ENGINEERS LTD. 1984 H142 BBJ CONSTRUCTION COMPANY LTD. 1984 S143 HINDUSTAN VEGETABLE OILS CORPN. LTD. 1984 H144 TYRE CORPORATION OF INDIA LTD. 1984 H145 GAIL (INDIA) LTD. 1984 HSeventh Five Year Plan (1985-89)146 PAWAN HANS HELICOPTERS LTD. 1985 H147 NORTHERN COALFIELDS LTD. 1985 S148 SOUTH EASTERN COALFIELDS LTD. 1985 S149 ASSAM ASHOK HOTEL CORPN. LTD. 1985 S150 DONYI POLO ASHOK HOTEL LTD. 1985 S151 MADHYA PRADESH ASHOK HOTEL CORPN. LTD. 1985 S152 PONDICHERRY ASHOK HOTEL CORPN. LTD. 1986 S153 MAHANAGAR TELEPHONE NIGAM LTD. 1986 H154 POWER FINANCE CORPORATION 1986 H155 INDIAN RAILWAY FINANCE CORPORATION LTD. 1986 H
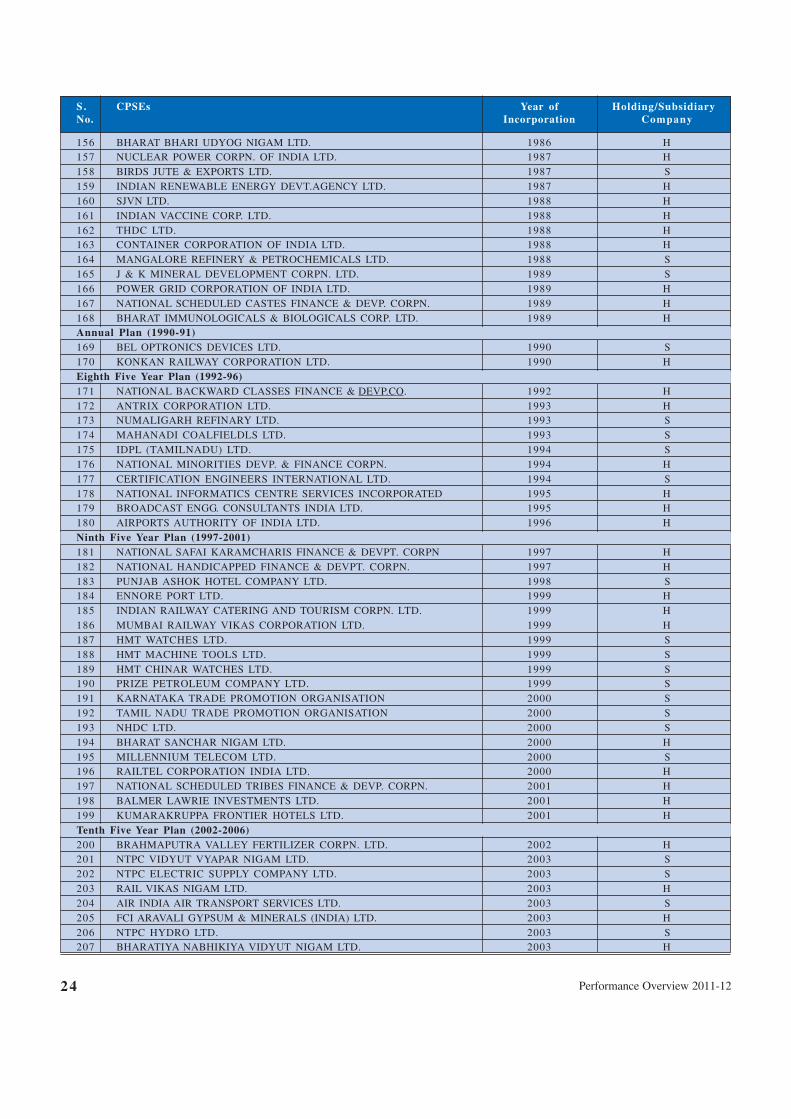
Performance Overview 2011-1224
S. CPSEs Year of Holding/SubsidiaryNo. Incorporation Company
156 BHARAT BHARI UDYOG NIGAM LTD. 1986 H157 NUCLEAR POWER CORPN. OF INDIA LTD. 1987 H158 BIRDS JUTE & EXPORTS LTD. 1987 S159 INDIAN RENEWABLE ENERGY DEVT.AGENCY LTD. 1987 H160 SJVN LTD. 1988 H161 INDIAN VACCINE CORP. LTD. 1988 H162 THDC LTD. 1988 H163 CONTAINER CORPORATION OF INDIA LTD. 1988 H164 MANGALORE REFINERY & PETROCHEMICALS LTD. 1988 S165 J & K MINERAL DEVELOPMENT CORPN. LTD. 1989 S166 POWER GRID CORPORATION OF INDIA LTD. 1989 H167 NATIONAL SCHEDULED CASTES FINANCE & DEVP. CORPN. 1989 H168 BHARAT IMMUNOLOGICALS & BIOLOGICALS CORP. LTD. 1989 HAnnual Plan (1990-91)169 BEL OPTRONICS DEVICES LTD. 1990 S170 KONKAN RAILWAY CORPORATION LTD. 1990 HEighth Five Year Plan (1992-96)171 NATIONAL BACKWARD CLASSES FINANCE & DEVP.CO. 1992 H172 ANTRIX CORPORATION LTD. 1993 H173 NUMALIGARH REFINARY LTD. 1993 S174 MAHANADI COALFIELDLS LTD. 1993 S175 IDPL (TAMILNADU) LTD. 1994 S176 NATIONAL MINORITIES DEVP. & FINANCE CORPN. 1994 H177 CERTIFICATION ENGINEERS INTERNATIONAL LTD. 1994 S178 NATIONAL INFORMATICS CENTRE SERVICES INCORPORATED 1995 H179 BROADCAST ENGG. CONSULTANTS INDIA LTD. 1995 H180 AIRPORTS AUTHORITY OF INDIA LTD. 1996 HNinth Five Year Plan (1997-2001)181 NATIONAL SAFAI KARAMCHARIS FINANCE & DEVPT. CORPN 1997 H182 NATIONAL HANDICAPPED FINANCE & DEVPT. CORPN. 1997 H183 PUNJAB ASHOK HOTEL COMPANY LTD. 1998 S184 ENNORE PORT LTD. 1999 H185 INDIAN RAILWAY CATERING AND TOURISM CORPN. LTD. 1999 H186 MUMBAI RAILWAY VIKAS CORPORATION LTD. 1999 H187 HMT WATCHES LTD. 1999 S188 HMT MACHINE TOOLS LTD. 1999 S189 HMT CHINAR WATCHES LTD. 1999 S190 PRIZE PETROLEUM COMPANY LTD. 1999 S191 KARNATAKA TRADE PROMOTION ORGANISATION 2000 S192 TAMIL NADU TRADE PROMOTION ORGANISATION 2000 S193 NHDC LTD. 2000 S194 BHARAT SANCHAR NIGAM LTD. 2000 H195 MILLENNIUM TELECOM LTD. 2000 S196 RAILTEL CORPORATION INDIA LTD. 2000 H197 NATIONAL SCHEDULED TRIBES FINANCE & DEVP. CORPN. 2001 H198 BALMER LAWRIE INVESTMENTS LTD. 2001 H199 KUMARAKRUPPA FRONTIER HOTELS LTD. 2001 HTenth Five Year Plan (2002-2006)200 BRAHMAPUTRA VALLEY FERTILIZER CORPN. LTD. 2002 H201 NTPC VIDYUT VYAPAR NIGAM LTD. 2003 S202 NTPC ELECTRIC SUPPLY COMPANY LTD. 2003 S203 RAIL VIKAS NIGAM LTD. 2003 H204 AIR INDIA AIR TRANSPORT SERVICES LTD. 2003 S205 FCI ARAVALI GYPSUM & MINERALS (INDIA) LTD. 2003 H206 NTPC HYDRO LTD. 2003 S207 BHARATIYA NABHIKIYA VIDYUT NIGAM LTD. 2003 H
Public Enterprises Survey 2011-2012: Vol-I 25
S. CPSEs Year of Holding/SubsidiaryNo. Incorporation Company
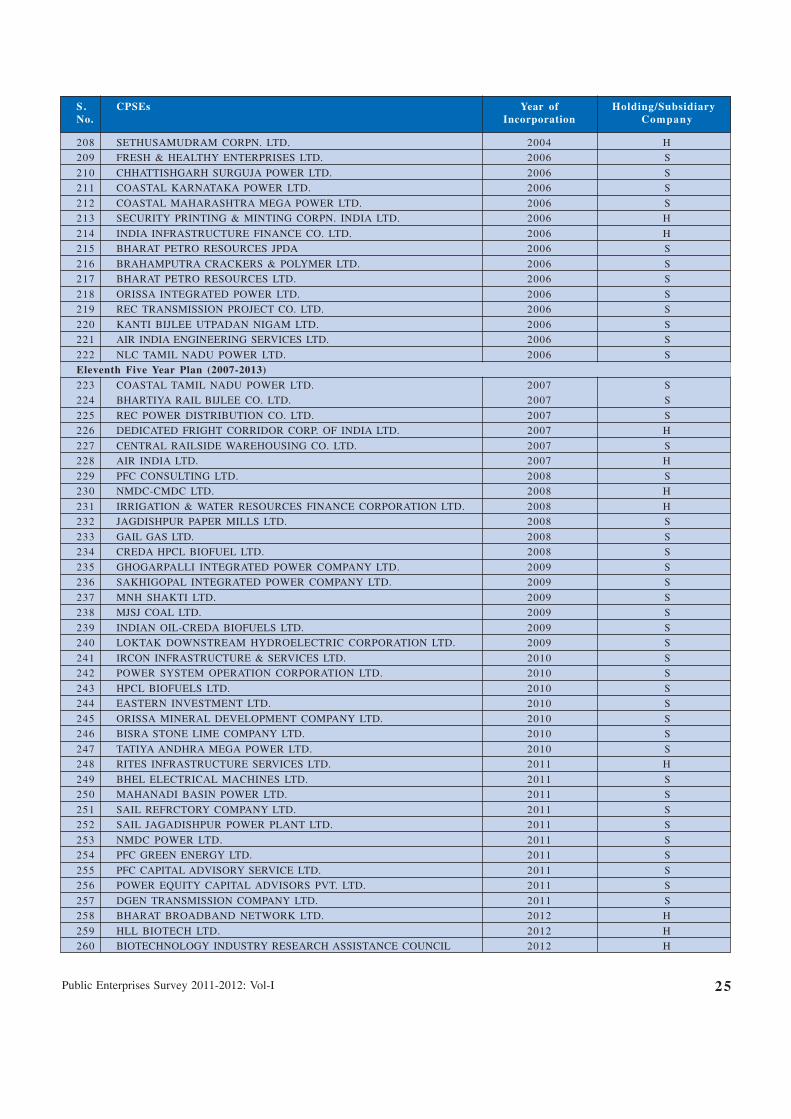
208 SETHUSAMUDRAM CORPN. LTD. 2004 H
209 FRESH & HEALTHY ENTERPRISES LTD. 2006 S
210 CHHATTISHGARH SURGUJA POWER LTD. 2006 S
211 COASTAL KARNATAKA POWER LTD. 2006 S
212 COASTAL MAHARASHTRA MEGA POWER LTD. 2006 S
213 SECURITY PRINTING & MINTING CORPN. INDIA LTD. 2006 H
214 INDIA INFRASTRUCTURE FINANCE CO. LTD. 2006 H
215 BHARAT PETRO RESOURCES JPDA 2006 S
216 BRAHAMPUTRA CRACKERS & POLYMER LTD. 2006 S
217 BHARAT PETRO RESOURCES LTD. 2006 S
218 ORISSA INTEGRATED POWER LTD. 2006 S
219 REC TRANSMISSION PROJECT CO. LTD. 2006 S
220 KANTI BIJLEE UTPADAN NIGAM LTD. 2006 S
221 AIR INDIA ENGINEERING SERVICES LTD. 2006 S
222 NLC TAMIL NADU POWER LTD. 2006 S
Eleventh Five Year Plan (2007-2013)223 COASTAL TAMIL NADU POWER LTD. 2007 S
224 BHARTIYA RAIL BIJLEE CO. LTD. 2007 S
225 REC POWER DISTRIBUTION CO. LTD. 2007 S
226 DEDICATED FRIGHT CORRIDOR CORP. OF INDIA LTD. 2007 H
227 CENTRAL RAILSIDE WAREHOUSING CO. LTD. 2007 S
228 AIR INDIA LTD. 2007 H
229 PFC CONSULTING LTD. 2008 S
230 NMDC-CMDC LTD. 2008 H
231 IRRIGATION & WATER RESOURCES FINANCE CORPORATION LTD. 2008 H
232 JAGDISHPUR PAPER MILLS LTD. 2008 S
233 GAIL GAS LTD. 2008 S
234 CREDA HPCL BIOFUEL LTD. 2008 S
235 GHOGARPALLI INTEGRATED POWER COMPANY LTD. 2009 S
236 SAKHIGOPAL INTEGRATED POWER COMPANY LTD. 2009 S
237 MNH SHAKTI LTD. 2009 S
238 MJSJ COAL LTD. 2009 S
239 INDIAN OIL-CREDA BIOFUELS LTD. 2009 S
240 LOKTAK DOWNSTREAM HYDROELECTRIC CORPORATION LTD. 2009 S
241 IRCON INFRASTRUCTURE & SERVICES LTD. 2010 S
242 POWER SYSTEM OPERATION CORPORATION LTD. 2010 S
243 HPCL BIOFUELS LTD. 2010 S
244 EASTERN INVESTMENT LTD. 2010 S
245 ORISSA MINERAL DEVELOPMENT COMPANY LTD. 2010 S
246 BISRA STONE LIME COMPANY LTD. 2010 S
247 TATIYA ANDHRA MEGA POWER LTD. 2010 S
248 RITES INFRASTRUCTURE SERVICES LTD. 2011 H
249 BHEL ELECTRICAL MACHINES LTD. 2011 S
250 MAHANADI BASIN POWER LTD. 2011 S
251 SAIL REFRCTORY COMPANY LTD. 2011 S
252 SAIL JAGADISHPUR POWER PLANT LTD. 2011 S
253 NMDC POWER LTD. 2011 S
254 PFC GREEN ENERGY LTD. 2011 S
255 PFC CAPITAL ADVISORY SERVICE LTD. 2011 S
256 POWER EQUITY CAPITAL ADVISORS PVT. LTD. 2011 S
257 DGEN TRANSMISSION COMPANY LTD. 2011 S
258 BHARAT BROADBAND NETWORK LTD. 2012 H
259 HLL BIOTECH LTD. 2012 H
260 BIOTECHNOLOGY INDUSTRY RESEARCH ASSISTANCE COUNCIL 2012 H
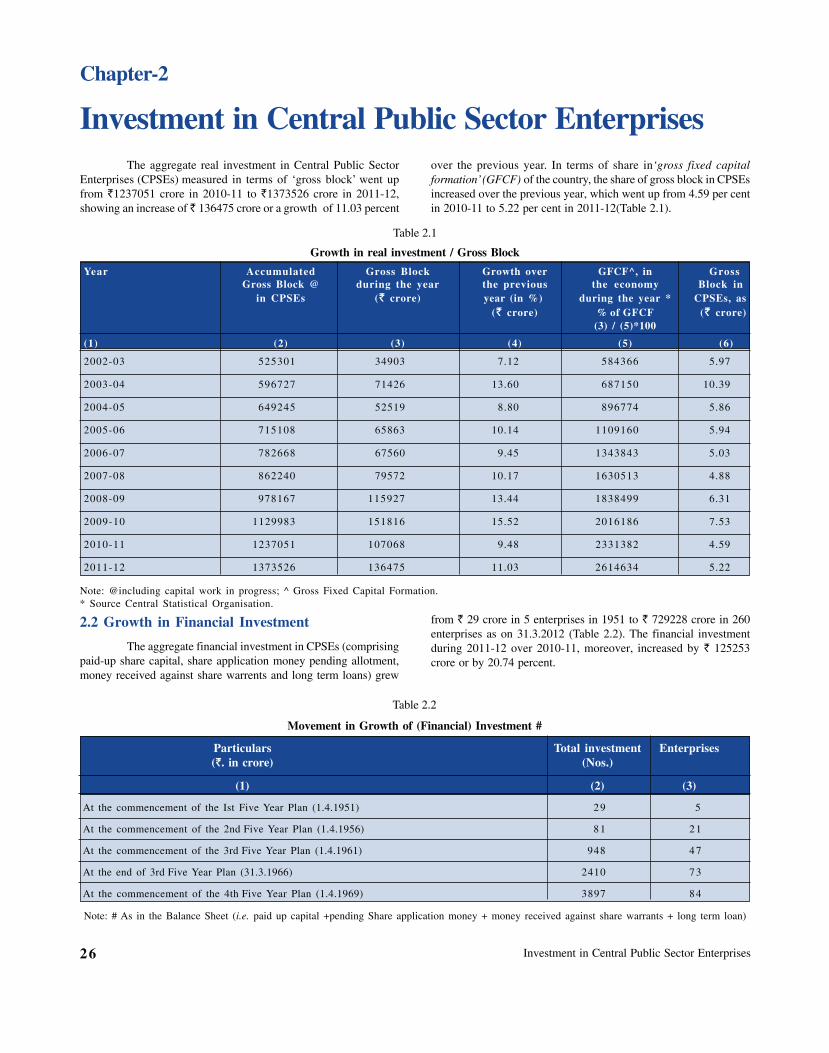
Investment in Central Public Sector Enterprises26
Investment in Central Public Sector EnterprisesThe aggregate real investment in Central Public Sector
Enterprises (CPSEs) measured in terms of ‘gross block’ went upfrom `1237051 crore in 2010-11 to `1373526 crore in 2011-12,showing an increase of ` 136475 crore or a growth of 11.03 percent
Chapter-2
over the previous year. In terms of share in‘gross fixed capitalformation’ (GFCF) of the country, the share of gross block in CPSEsincreased over the previous year, which went up from 4.59 per centin 2010-11 to 5.22 per cent in 2011-12(Table 2.1).
Table 2.1
Growth in real investment / Gross Block
Year Accumulated Gross Block Growth over GFCF^, in Gross Gross Block @ during the year the previous the economy Block in
in CPSEs (` crore) year (in %) during the year * CPSEs, as(` crore) % of GFCF (` crore)
(3) / (5)*100
(1) (2) (3) (4) (5) (6)
2002-03 525301 34903 7.12 584366 5.97
2003-04 596727 71426 13.60 687150 10.39
2004-05 649245 52519 8.80 896774 5.86
2005-06 715108 65863 10.14 1109160 5.94
2006-07 782668 67560 9.45 1343843 5.03
2007-08 862240 79572 10.17 1630513 4.88
2008-09 978167 115927 13.44 1838499 6.31
2009-10 1129983 151816 15.52 2016186 7.53
2010-11 1237051 107068 9.48 2331382 4.59
2011-12 1373526 136475 11.03 2614634 5.22
Note: @including capital work in progress; ^ Gross Fixed Capital Formation.* Source Central Statistical Organisation.
2.2 Growth in Financial Investment
The aggregate financial investment in CPSEs (comprisingpaid-up share capital, share application money pending allotment,money received against share warrents and long term loans) grew
from ` 29 crore in 5 enterprises in 1951 to ` 729228 crore in 260enterprises as on 31.3.2012 (Table 2.2). The financial investmentduring 2011-12 over 2010-11, moreover, increased by ` 125253crore or by 20.74 percent.
Table 2.2
Movement in Growth of (Financial) Investment #
Particulars Total investment Enterprises(`. in crore) (Nos.)
(1) (2) (3)
At the commencement of the Ist Five Year Plan (1.4.1951) 29 5
At the commencement of the 2nd Five Year Plan (1.4.1956) 81 21
At the commencement of the 3rd Five Year Plan (1.4.1961) 948 47
At the end of 3rd Five Year Plan (31.3.1966) 2410 73
At the commencement of the 4th Five Year Plan (1.4.1969) 3897 84
Note: # As in the Balance Sheet (i.e. paid up capital +pending Share application money + money received against share warrants + long term loan)
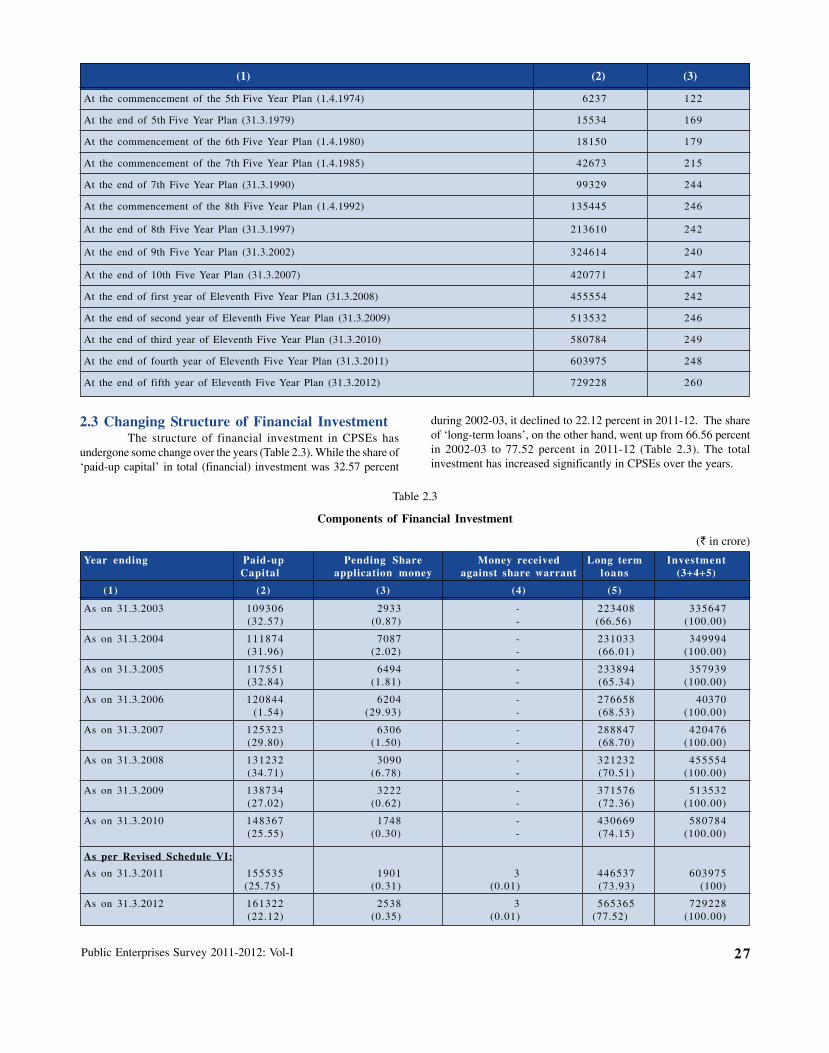
Public Enterprises Survey 2011-2012: Vol-I 27
(1) (2) (3)
At the commencement of the 5th Five Year Plan (1.4.1974) 6237 122
At the end of 5th Five Year Plan (31.3.1979) 15534 169
At the commencement of the 6th Five Year Plan (1.4.1980) 18150 179
At the commencement of the 7th Five Year Plan (1.4.1985) 42673 215
At the end of 7th Five Year Plan (31.3.1990) 99329 244
At the commencement of the 8th Five Year Plan (1.4.1992) 135445 246
At the end of 8th Five Year Plan (31.3.1997) 213610 242
At the end of 9th Five Year Plan (31.3.2002) 324614 240
At the end of 10th Five Year Plan (31.3.2007) 420771 247
At the end of first year of Eleventh Five Year Plan (31.3.2008) 455554 242
At the end of second year of Eleventh Five Year Plan (31.3.2009) 513532 246
At the end of third year of Eleventh Five Year Plan (31.3.2010) 580784 249
At the end of fourth year of Eleventh Five Year Plan (31.3.2011) 603975 248
At the end of fifth year of Eleventh Five Year Plan (31.3.2012) 729228 260
2.3 Changing Structure of Financial InvestmentThe structure of financial investment in CPSEs has
undergone some change over the years (Table 2.3). While the share of‘paid-up capital’ in total (financial) investment was 32.57 percent
during 2002-03, it declined to 22.12 percent in 2011-12. The shareof ‘long-term loans’, on the other hand, went up from 66.56 percentin 2002-03 to 77.52 percent in 2011-12 (Table 2.3). The totalinvestment has increased significantly in CPSEs over the years.
Table 2.3
Components of Financial Investment
(` in crore)
Year ending Paid-up Pending Share Money received Long term InvestmentCapital application money against share warrant loans (3+4+5)
(1) (2) (3) (4) (5)
As on 31.3.2003 109306 2933 - 223408 335647(32.57) (0.87) - (66.56) (100.00)
As on 31.3.2004 111874 7087 - 231033 349994(31.96) (2.02) - (66.01) (100.00)
As on 31.3.2005 117551 6494 - 233894 357939(32.84) (1.81) - (65.34) (100.00)
As on 31.3.2006 120844 6204 - 276658 40370(1.54) (29.93) - (68.53) (100.00)
As on 31.3.2007 125323 6306 - 288847 420476(29.80) (1.50) - (68.70) (100.00)
As on 31.3.2008 131232 3090 - 321232 455554(34.71) (6.78) - (70.51) (100.00)
As on 31.3.2009 138734 3222 - 371576 513532(27.02) (0.62) - (72.36) (100.00)
As on 31.3.2010 148367 1748 - 430669 580784(25.55) (0.30) - (74.15) (100.00)
As per Revised Schedule VI:
As on 31.3.2011 155535 1901 3 446537 603975(25.75) (0.31) (0.01) (73.93) (100)
As on 31.3.2012 161322 2538 3 565365 729228(22.12) (0.35) (0.01) (77.52) (100.00)
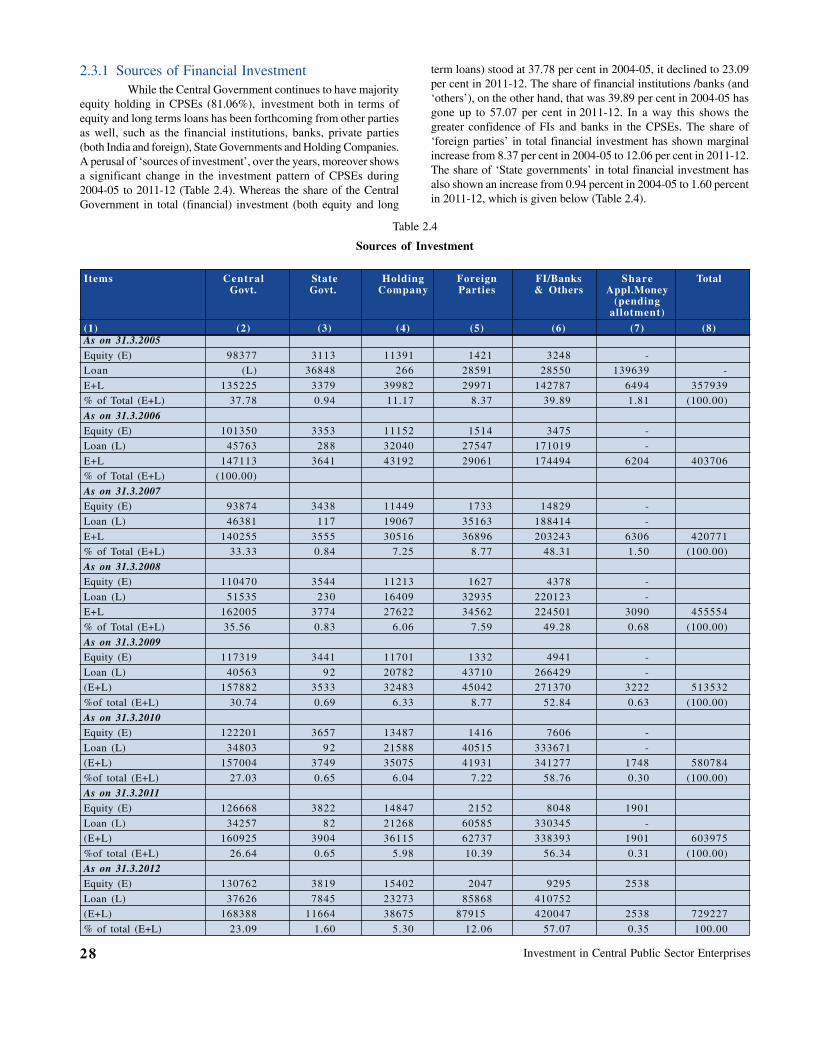
Investment in Central Public Sector Enterprises28
2.3.1 Sources of Financial InvestmentWhile the Central Government continues to have majority
equity holding in CPSEs (81.06%), investment both in terms ofequity and long terms loans has been forthcoming from other partiesas well, such as the financial institutions, banks, private parties(both India and foreign), State Governments and Holding Companies.A perusal of ‘sources of investment’, over the years, moreover showsa significant change in the investment pattern of CPSEs during2004-05 to 2011-12 (Table 2.4). Whereas the share of the CentralGovernment in total (financial) investment (both equity and long
term loans) stood at 37.78 per cent in 2004-05, it declined to 23.09per cent in 2011-12. The share of financial institutions /banks (and‘others’), on the other hand, that was 39.89 per cent in 2004-05 hasgone up to 57.07 per cent in 2011-12. In a way this shows thegreater confidence of FIs and banks in the CPSEs. The share of‘foreign parties’ in total financial investment has shown marginalincrease from 8.37 per cent in 2004-05 to 12.06 per cent in 2011-12.The share of ‘State governments’ in total financial investment hasalso shown an increase from 0.94 percent in 2004-05 to 1.60 percentin 2011-12, which is given below (Table 2.4).
Table 2.4
Sources of Investment
Items Central State Holding Foreign FI/Banks Share TotalGovt. Govt. Company Parties & Others Appl.Money
(pendingallotment)
(1) (2) (3) (4) (5) (6) (7) (8)As on 31.3.2005
Equity (E) 98377 3113 11391 1421 3248 -
Loan (L) 36848 266 28591 28550 139639 -
E+L 135225 3379 39982 29971 142787 6494 357939
% of Total (E+L) 37.78 0.94 11.17 8.37 39.89 1.81 (100.00)
As on 31.3.2006
Equity (E) 101350 3353 11152 1514 3475 -
Loan (L) 45763 288 32040 27547 171019 -
E+L 147113 3641 43192 29061 174494 6204 403706
% of Total (E+L) (100.00)
As on 31.3.2007Equity (E) 93874 3438 11449 1733 14829 -
Loan (L) 46381 117 19067 35163 188414 -
E+L 140255 3555 30516 36896 203243 6306 420771
% of Total (E+L) 33.33 0.84 7.25 8.77 48.31 1.50 (100.00)
As on 31.3.2008Equity (E) 110470 3544 11213 1627 4378 -
Loan (L) 51535 230 16409 32935 220123 -
E+L 162005 3774 27622 34562 224501 3090 455554
% of Total (E+L) 35.56 0.83 6.06 7.59 49.28 0.68 (100.00)
As on 31.3.2009Equity (E) 117319 3441 11701 1332 4941 -
Loan (L) 40563 92 20782 43710 266429 -
(E+L) 157882 3533 32483 45042 271370 3222 513532
%of total (E+L) 30.74 0.69 6.33 8.77 52.84 0.63 (100.00)
As on 31.3.2010Equity (E) 122201 3657 13487 1416 7606 -
Loan (L) 34803 92 21588 40515 333671 -
(E+L) 157004 3749 35075 41931 341277 1748 580784
%of total (E+L) 27.03 0.65 6.04 7.22 58.76 0.30 (100.00)
As on 31.3.2011
Equity (E) 126668 3822 14847 2152 8048 1901
Loan (L) 34257 82 21268 60585 330345 -
(E+L) 160925 3904 36115 62737 338393 1901 603975
%of total (E+L) 26.64 0.65 5.98 10.39 56.34 0.31 (100.00)
As on 31.3.2012
Equity (E) 130762 3819 15402 2047 9295 2538
Loan (L) 37626 7845 23273 85868 410752
(E+L) 168388 11664 38675 87915 420047 2538 729227
% of total (E+L) 23.09 1.60 5.30 12.06 57.07 0.35 100.00
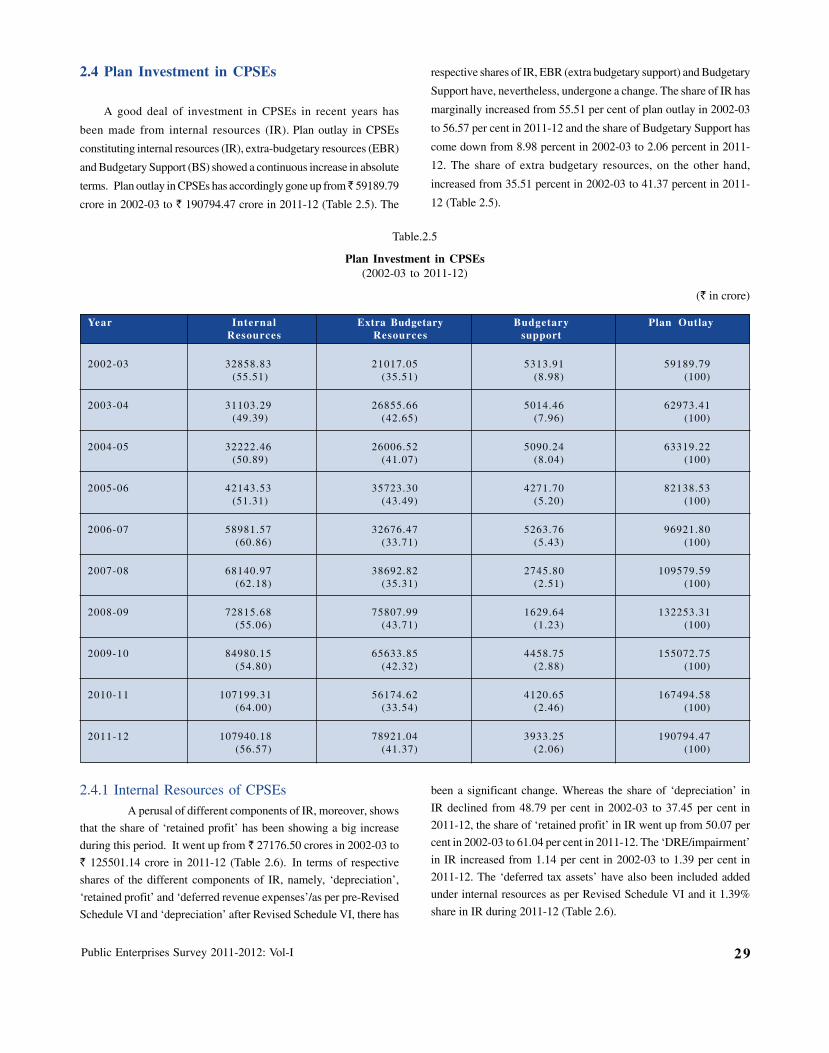
Public Enterprises Survey 2011-2012: Vol-I 29
2.4 Plan Investment in CPSEs
A good deal of investment in CPSEs in recent years has
been made from internal resources (IR). Plan outlay in CPSEs
constituting internal resources (IR), extra-budgetary resources (EBR)
and Budgetary Support (BS) showed a continuous increase in absolute
terms. Plan outlay in CPSEs has accordingly gone up from ̀ 59189.79
crore in 2002-03 to ` 190794.47 crore in 2011-12 (Table 2.5). The
respective shares of IR, EBR (extra budgetary support) and Budgetary
Support have, nevertheless, undergone a change. The share of IR has
marginally increased from 55.51 per cent of plan outlay in 2002-03
to 56.57 per cent in 2011-12 and the share of Budgetary Support has
come down from 8.98 percent in 2002-03 to 2.06 percent in 2011-
12. The share of extra budgetary resources, on the other hand,
increased from 35.51 percent in 2002-03 to 41.37 percent in 2011-
12 (Table 2.5).
Table.2.5
Plan Investment in CPSEs(2002-03 to 2011-12)
(` in crore)
Year Internal Extra Budgetary Budgetary Plan OutlayResources Resources support
2002-03 32858.83 21017.05 5313.91 59189.79(55.51) (35.51) (8.98) (100)
2003-04 31103.29 26855.66 5014.46 62973.41(49.39) (42.65) (7.96) (100)
2004-05 32222.46 26006.52 5090.24 63319.22(50.89) (41.07) (8.04) (100)
2005-06 42143.53 35723.30 4271.70 82138.53(51.31) (43.49) (5.20) (100)
2006-07 58981.57 32676.47 5263.76 96921.80(60.86) (33.71) (5.43) (100)
2007-08 68140.97 38692.82 2745.80 109579.59(62.18) (35.31) (2.51) (100)
2008-09 72815.68 75807.99 1629.64 132253.31(55.06) (43.71) (1.23) (100)
2009-10 84980.15 65633.85 4458.75 155072.75(54.80) (42.32) (2.88) (100)
2010-11 107199.31 56174.62 4120.65 167494.58(64.00) (33.54) (2.46) (100)
2011-12 107940.18 78921.04 3933.25 190794.47(56.57) (41.37) (2.06) (100)
2.4.1 Internal Resources of CPSEsA perusal of different components of IR, moreover, shows
that the share of ‘retained profit’ has been showing a big increase
during this period. It went up from ` 27176.50 crores in 2002-03 to
` 125501.14 crore in 2011-12 (Table 2.6). In terms of respective
shares of the different components of IR, namely, ‘depreciation’,
‘retained profit’ and ‘deferred revenue expenses’/as per pre-Revised
Schedule VI and ‘depreciation’ after Revised Schedule VI, there has
been a significant change. Whereas the share of ‘depreciation’ in
IR declined from 48.79 per cent in 2002-03 to 37.45 per cent in
2011-12, the share of ‘retained profit’ in IR went up from 50.07 per
cent in 2002-03 to 61.04 per cent in 2011-12. The ‘DRE/impairment’
in IR increased from 1.14 per cent in 2002-03 to 1.39 per cent in
2011-12. The ‘deferred tax assets’ have also been included added
under internal resources as per Revised Schedule VI and it 1.39%
share in IR during 2011-12 (Table 2.6).
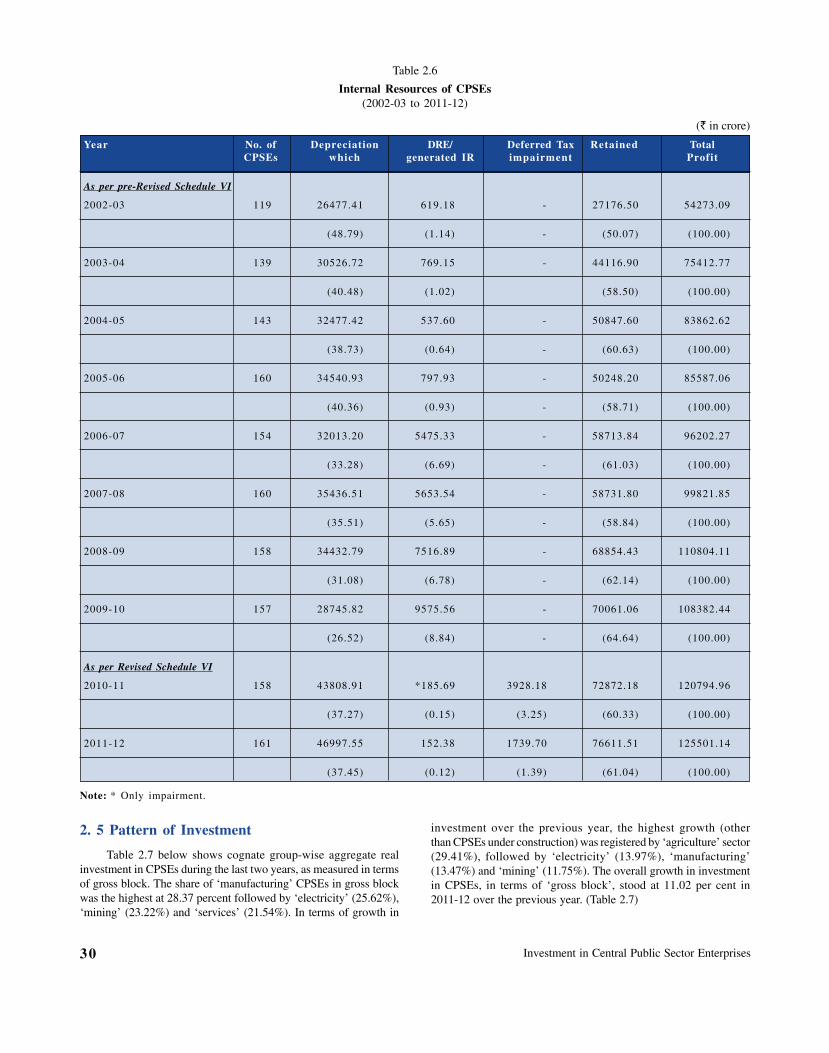
Investment in Central Public Sector Enterprises30
investment over the previous year, the highest growth (otherthan CPSEs under construction) was registered by ‘agriculture’ sector(29.41%), followed by ‘electricity’ (13.97%), ‘manufacturing’(13.47%) and ‘mining’ (11.75%). The overall growth in investmentin CPSEs, in terms of ‘gross block’, stood at 11.02 per cent in2011-12 over the previous year. (Table 2.7)
Table 2.6
Internal Resources of CPSEs(2002-03 to 2011-12)
(` in crore)
Year No. of Depreciation DRE/ Deferred Tax Retained TotalCPSEs which generated IR impairment Profit
As per pre-Revised Schedule VI
2002-03 119 26477.41 619.18 - 27176.50 54273.09
(48.79) (1.14) - (50.07) (100.00)
2003-04 139 30526.72 769.15 - 44116.90 75412.77
(40.48) (1.02) (58.50) (100.00)
2004-05 143 32477.42 537.60 - 50847.60 83862.62
(38.73) (0.64) - (60.63) (100.00)
2005-06 160 34540.93 797.93 - 50248.20 85587.06
(40.36) (0.93) - (58.71) (100.00)
2006-07 154 32013.20 5475.33 - 58713.84 96202.27
(33.28) (6.69) - (61.03) (100.00)
2007-08 160 35436.51 5653.54 - 58731.80 99821.85
(35.51) (5.65) - (58.84) (100.00)
2008-09 158 34432.79 7516.89 - 68854.43 110804.11
(31.08) (6.78) - (62.14) (100.00)
2009-10 157 28745.82 9575.56 - 70061.06 108382.44
(26.52) (8.84) - (64.64) (100.00)
As per Revised Schedule VI
2010-11 158 43808.91 *185.69 3928.18 72872.18 120794.96
(37.27) (0.15) (3.25) (60.33) (100.00)
2011-12 161 46997.55 152.38 1739.70 76611.51 125501.14
(37.45) (0.12) (1.39) (61.04) (100.00)
Note: * Only impairment.
2. 5 Pattern of Investment
Table 2.7 below shows cognate group-wise aggregate realinvestment in CPSEs during the last two years, as measured in termsof gross block. The share of ‘manufacturing’ CPSEs in gross blockwas the highest at 28.37 percent followed by ‘electricity’ (25.62%),‘mining’ (23.22%) and ‘services’ (21.54%). In terms of growth in

Public Enterprises Survey 2011-2012: Vol-I 31
1.5.1 Top Ten Enterprises in terms of Gross Block
Gross block in top ten enterprises amounted to Rs.945619crore as on 31.3.2012. This was equal to 68.85 percent of the totalgross block in all CPSEs. Oil & Natural Gas Corporation Limited,
Table 2.7
Pattern of investment in terms of Gross Block(2010-11 and 2011-12)
(` in crore)
Sl . Sector Investment in terms of Gross Growth rate over Gross block/No. Block as on the previous year as % of total
(as on 31.3.2012)31.3.2012 31.3.2011
(1) (2) (3) (4) (5) (6)
1. Agriculture 154 119 29.41 0.01
2. Mining 323098 289117 11.75 23.53
3. Manufacturing 389632 343435 13.45 28.37
4. Electricity 351939 308794 13.97 25.62
5. Services 295836 287292 2.97 21.54
6. CPSEs yet to Commence Operations 12867 7707 66.95 0.94
Total 1373526 1237051 11.02 100.00
Bharat Sanchar Nigam Ltd. and NTPC Ltd are the top three CPSEsamongst the top ten CPSEs in terms of gross block during the year2011-12 (Table 2.8). The share of these 3 CPSEs alone was 37.70%of the total gross block of all the CPSEs as on 31.3.2012.
Table 2.8
Gross Block in Top Ten Enterprises, as on 31.3.2012
(` in crore)
Sl . CPSEs Investment in terms Share in totalNo. of Gross Block* Gross Block( %)
(1) (2) (3) (4)
1. Oil & Natural Gas Corporation Ltd. 219287 23.19
2. Bharat Sanchar Nigam Ltd. 174828 18.49
3. NTPC Ltd. 123658 13.08
4. Indian Oil Corporation Ltd. 112890 11.94
5. Power Grid Corporation of India Ltd. 91571 9.68
6. Steel Authority of India Ltd. 69777 7.38
7. NHPC Ltd. 42412 4.48
8. Air India Ltd. 39044 4.13
9. Nuclear Power Corporation Ltd. 37903 4.01
10. Hindustan Petroleum Corporation Ltd. 34249 3.62
Total Top Ten (CPSEs) 945619 68.85
Total Gross Block 1373526 100.00
* Gross Block inclusive of Capital-work-in progress and intangible assets under development.
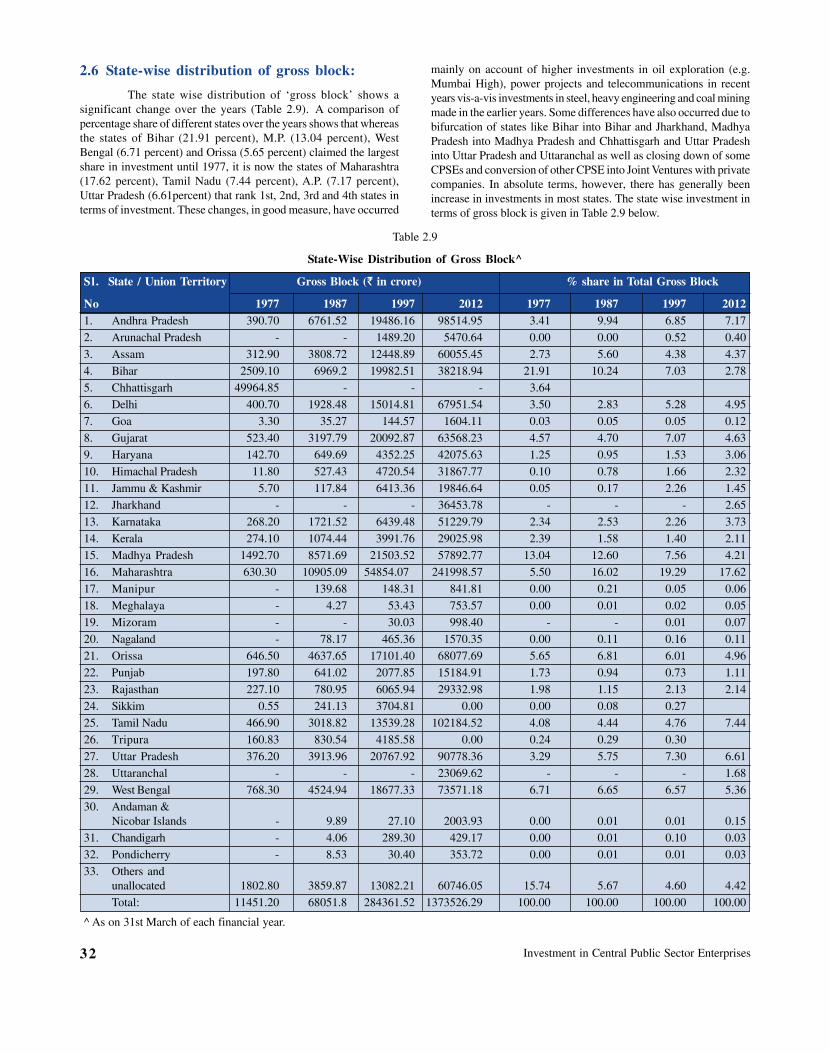
Investment in Central Public Sector Enterprises32
2.6 State-wise distribution of gross block:
The state wise distribution of ‘gross block’ shows asignificant change over the years (Table 2.9). A comparison ofpercentage share of different states over the years shows that whereasthe states of Bihar (21.91 percent), M.P. (13.04 percent), WestBengal (6.71 percent) and Orissa (5.65 percent) claimed the largestshare in investment until 1977, it is now the states of Maharashtra(17.62 percent), Tamil Nadu (7.44 percent), A.P. (7.17 percent),Uttar Pradesh (6.61percent) that rank 1st, 2nd, 3rd and 4th states interms of investment. These changes, in good measure, have occurred
mainly on account of higher investments in oil exploration (e.g.Mumbai High), power projects and telecommunications in recentyears vis-a-vis investments in steel, heavy engineering and coal miningmade in the earlier years. Some differences have also occurred due tobifurcation of states like Bihar into Bihar and Jharkhand, MadhyaPradesh into Madhya Pradesh and Chhattisgarh and Uttar Pradeshinto Uttar Pradesh and Uttaranchal as well as closing down of someCPSEs and conversion of other CPSE into Joint Ventures with privatecompanies. In absolute terms, however, there has generally beenincrease in investments in most states. The state wise investment interms of gross block is given in Table 2.9 below.
Table 2.9
State-Wise Distribution of Gross Block^
Sl. State / Union Territory Gross Block (` in crore) % share in Total Gross Block
No 1977 1987 1997 2012 1977 1987 1997 20121. Andhra Pradesh 390.70 6761.52 19486.16 98514.95 3.41 9.94 6.85 7.17
2. Arunachal Pradesh - - 1489.20 5470.64 0.00 0.00 0.52 0.40
3. Assam 312.90 3808.72 12448.89 60055.45 2.73 5.60 4.38 4.37
4. Bihar 2509.10 6969.2 19982.51 38218.94 21.91 10.24 7.03 2.78
5. Chhattisgarh 49964.85 - - - 3.64
6. Delhi 400.70 1928.48 15014.81 67951.54 3.50 2.83 5.28 4.95
7. Goa 3.30 35.27 144.57 1604.11 0.03 0.05 0.05 0.12
8. Gujarat 523.40 3197.79 20092.87 63568.23 4.57 4.70 7.07 4.63
9. Haryana 142.70 649.69 4352.25 42075.63 1.25 0.95 1.53 3.06
10. Himachal Pradesh 11.80 527.43 4720.54 31867.77 0.10 0.78 1.66 2.32
11. Jammu & Kashmir 5.70 117.84 6413.36 19846.64 0.05 0.17 2.26 1.45
12. Jharkhand - - - 36453.78 - - - 2.65
13. Karnataka 268.20 1721.52 6439.48 51229.79 2.34 2.53 2.26 3.73
14. Kerala 274.10 1074.44 3991.76 29025.98 2.39 1.58 1.40 2.11
15. Madhya Pradesh 1492.70 8571.69 21503.52 57892.77 13.04 12.60 7.56 4.21
16. Maharashtra 630.30 10905.09 54854.07 241998.57 5.50 16.02 19.29 17.62
17. Manipur - 139.68 148.31 841.81 0.00 0.21 0.05 0.06
18. Meghalaya - 4.27 53.43 753.57 0.00 0.01 0.02 0.05
19. Mizoram - - 30.03 998.40 - - 0.01 0.07
20. Nagaland - 78.17 465.36 1570.35 0.00 0.11 0.16 0.11
21. Orissa 646.50 4637.65 17101.40 68077.69 5.65 6.81 6.01 4.96
22. Punjab 197.80 641.02 2077.85 15184.91 1.73 0.94 0.73 1.11
23. Rajasthan 227.10 780.95 6065.94 29332.98 1.98 1.15 2.13 2.14
24. Sikkim 0.55 241.13 3704.81 0.00 0.00 0.08 0.27
25. Tamil Nadu 466.90 3018.82 13539.28 102184.52 4.08 4.44 4.76 7.44
26. Tripura 160.83 830.54 4185.58 0.00 0.24 0.29 0.30
27. Uttar Pradesh 376.20 3913.96 20767.92 90778.36 3.29 5.75 7.30 6.61
28. Uttaranchal - - - 23069.62 - - - 1.68
29. West Bengal 768.30 4524.94 18677.33 73571.18 6.71 6.65 6.57 5.36
30. Andaman & Nicobar Islands - 9.89 27.10 2003.93 0.00 0.01 0.01 0.15
31. Chandigarh - 4.06 289.30 429.17 0.00 0.01 0.10 0.03
32. Pondicherry - 8.53 30.40 353.72 0.00 0.01 0.01 0.03
33. Others andunallocated 1802.80 3859.87 13082.21 60746.05 15.74 5.67 4.60 4.42
Total: 11451.20 68051.8 284361.52 1373526.29 100.00 100.00 100.00 100.00
^ As on 31st March of each financial year.
Public Enterprises Survey 2011-2012: Vol-I 33
Pricing Policy in CPSEs
Chapter-3
Price is one of the most important elements of a commercialenterprise. It determines the company's profitability and isdetermined by the market share of the company and its positioningmarket strategy. Pricing strategy, in turn, involves estimation ofcost, analysis of competitor's price, determination of demand andfinally selection of the appropriate price.
In a monopoly market, a public sector enterprise can fixthe price that maximizes the mark- up as well as the gross profits.That may not happen, however, if the government intervenes tomoderate the price and reduce the mark-up in the interest ofconsumers and user industries/sectors. A good many Central PublicSector Enterprises (CPSEs) in India are charging prices belowaverage/marginal cost, and the Government has been subsidizingthese prices in the interest of consumers. CPSEs, in the (crude)oil sector, in this respect have been an important vehicle ofGovernment of India in keeping the prices low in the domesticmarket.
In general, the governments fix/administer the price of goodsand services produced by public sector enterprises based on thefollowing principles:
(a) true costs (fixed and variable cost) of goods and servicesplus a reasonable return on investment,
(b) cross-subsidization between one group and another orbetween one sector and another,
(c) differential price norm for peak and off-peak demand,below cost to stimulate demand under conditions ofexcess/unutilized capacity, lower price for givingincentive to encourage consumption(e.g. fertilizerconsumption) and higher price as disincentive todiscourage consumption (e.g. petroleum products),
(d) different prices/multi-tariffs to include discounts onpurchases of larger volumes.
Prices of goods and services produced by public sectorenterprises in India, for long, have been determined by theGovernment under the policy regime of 'controlled prices',orfollowing the Administered Price Mechanism (APM). The APM,in most cases, has been based on the cost of production (plus areasonable return on investment). The Government obtained thecost estimates either from 'the management' of the company orfrom 'an expert body'. In the case of CPSEs in the 'core sectors',the Government has relied upon the Bureau of Industrial Costsand Prices (merged in 1999 with the Tariff Commission, Ministryof Commerce and Industry) for cost estimates and the consequentrecommendations made by them on (fair) prices of goods andservices of these enterprises. Other than the Tariff Commission,there have been other agencies like the office of Chief Adviser(Cost), Department of Economic Affairs, Ministry of Finance,
the National Pharmaceutical Pricing Authority (NPPA),Department of Pharmaceuticals and the Central NegotiationCommittee, Ministry of Defence, which have been fixing the priceof select goods and services.
In the wake of post-1991 economic liberalization,furthermore, industries in the 'core sector' are no more the exclusivepreserve of the public sector. Consequently, a good many CPSEshave ceased to be monopolies and they face competition in themarket both from private players (within the country) and fromimports. APM has been gradually dismantled in these sectors, andthe CPSEs have been given the independence to fix the prices ontheir own. The Government, however, continues to be sensitiveto the needs of the poor and the impact of rise in output prices inthe core sector on the Wholesale Price Index (WPI). Any rise inprice levels of these products that is not acceptable to theGovernment is moderated through a combination of measures, suchas, lowering of customs duties, excise and sales tax, administrativecontrol on prices and grant of subsidies etc.
Since the late 1990s, moreover, the Government has cometo rely increasingly on various price regulatory commissions/authorities for regulating prices in the best interests of both theconsumers and the producers. The writ of these regulatorycommissions extends to both the public sector and the privatesector enterprises. The price regulatory commissions have beenprescribing 'the tariff ceiling', which provides scope forcompetition. Prices are reviewed, from time to time, and arerevised in the light of new technological possibilities and higher /lower input costs. The CPSEs have often played an eminent rolein giving competition to the private players, and have broughtdown prices.
3.1 Market Structures and Pricing Strategy ofCPSEs
Prices of' 'manufactured products' and 'services' are observedto be determined by firms based on the average/marginal cost ofproduction and the mark-up over and above the cost toaccommodate profits. The margin of 'mark-up', in turn, dependson the competitiveness or the degree of monopoly and theelasticity of demand and brand value in the market. Given theelasticity of demand for the product, a monopolist is able to chargea higher mark-up (10 to 40%) compared to a competitive marketscenario; the mark-up being the difference between the averagerevenue and the marginal cost per unit of output. The prices of'primary commodities' like agricultural products and minerals, onthe other hand, is determined by the market forces of demand andsupply.
Table 3.1 below provides an illustration of CPSEs operatingunder different market structures:
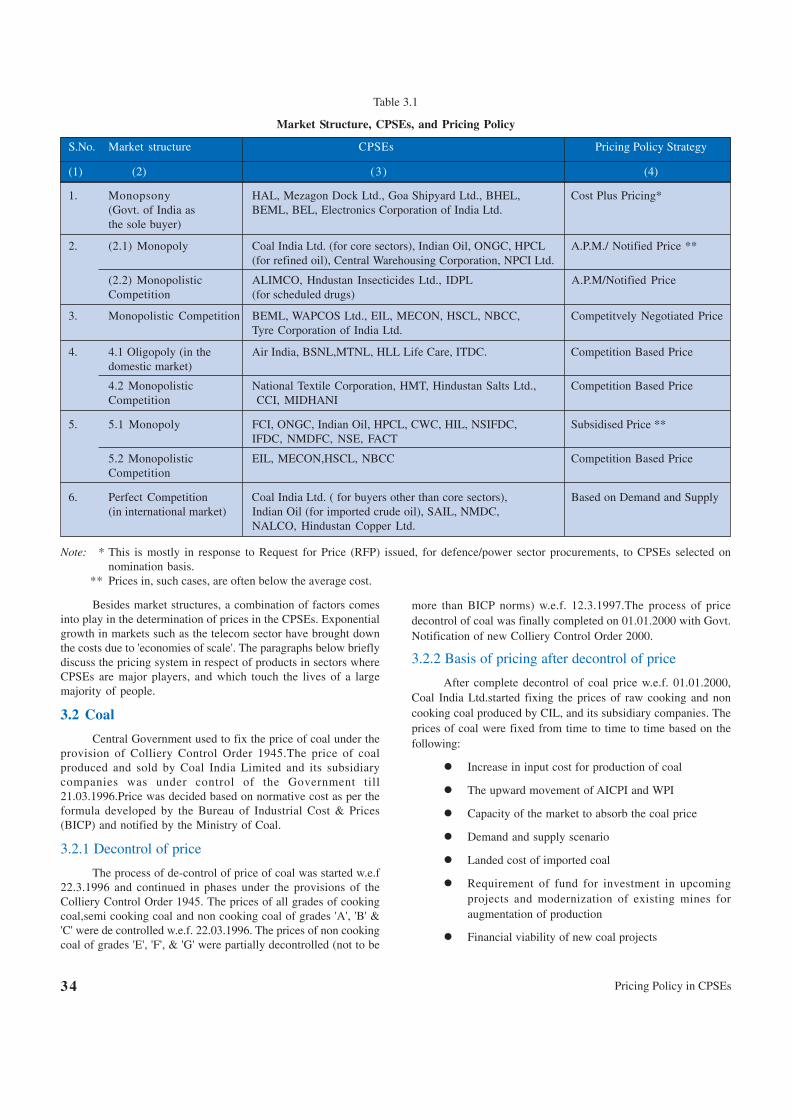
Pricing Policy in CPSEs34
Besides market structures, a combination of factors comesinto play in the determination of prices in the CPSEs. Exponentialgrowth in markets such as the telecom sector have brought downthe costs due to 'economies of scale'. The paragraphs below brieflydiscuss the pricing system in respect of products in sectors whereCPSEs are major players, and which touch the lives of a largemajority of people.
3.2 Coal
Central Government used to fix the price of coal under theprovision of Colliery Control Order 1945.The price of coalproduced and sold by Coal India Limited and its subsidiarycompanies was under control of the Government till21.03.1996.Price was decided based on normative cost as per theformula developed by the Bureau of Industrial Cost & Prices(BICP) and notified by the Ministry of Coal.
3.2.1 Decontrol of price
The process of de-control of price of coal was started w.e.f22.3.1996 and continued in phases under the provisions of theColliery Control Order 1945. The prices of all grades of cookingcoal,semi cooking coal and non cooking coal of grades 'A', 'B' &'C' were de controlled w.e.f. 22.03.1996. The prices of non cookingcoal of grades 'E', 'F', & 'G' were partially decontrolled (not to be
more than BICP norms) w.e.f. 12.3.1997.The process of pricedecontrol of coal was finally completed on 01.01.2000 with Govt.Notification of new Colliery Control Order 2000.
3.2.2 Basis of pricing after decontrol of price
After complete decontrol of coal price w.e.f. 01.01.2000,Coal India Ltd.started fixing the prices of raw cooking and noncooking coal produced by CIL, and its subsidiary companies. Theprices of coal were fixed from time to time to time based on thefollowing:
� Increase in input cost for production of coal
� The upward movement of AICPI and WPI
� Capacity of the market to absorb the coal price
� Demand and supply scenario
� Landed cost of imported coal
� Requirement of fund for investment in upcomingprojects and modernization of existing mines foraugmentation of production
� Financial viability of new coal projects
Table 3.1
Market Structure, CPSEs, and Pricing Policy
S.No. Market structure CPSEs Pricing Policy Strategy
(1) (2) (3) (4)
1. Monopsony HAL, Mezagon Dock Ltd., Goa Shipyard Ltd., BHEL, Cost Plus Pricing*(Govt. of India as BEML, BEL, Electronics Corporation of India Ltd.the sole buyer)
2. (2.1) Monopoly Coal India Ltd. (for core sectors), Indian Oil, ONGC, HPCL A.P.M./ Notified Price **(for refined oil), Central Warehousing Corporation, NPCI Ltd.
(2.2) Monopolistic ALIMCO, Hndustan Insecticides Ltd., IDPL A.P.M/Notified PriceCompetition (for scheduled drugs)
3. Monopolistic Competition BEML, WAPCOS Ltd., EIL, MECON, HSCL, NBCC, Competitvely Negotiated PriceTyre Corporation of India Ltd.
4. 4.1 Oligopoly (in the Air India, BSNL,MTNL, HLL Life Care, ITDC. Competition Based Pricedomestic market)
4.2 Monopolistic National Textile Corporation, HMT, Hindustan Salts Ltd., Competition Based PriceCompetition CCI, MIDHANI
5. 5.1 Monopoly FCI, ONGC, Indian Oil, HPCL, CWC, HIL, NSIFDC, Subsidised Price **IFDC, NMDFC, NSE, FACT
5.2 Monopolistic EIL, MECON,HSCL, NBCC Competition Based PriceCompetition
6. Perfect Competition Coal India Ltd. ( for buyers other than core sectors), Based on Demand and Supply(in international market) Indian Oil (for imported crude oil), SAIL, NMDC,
NALCO, Hindustan Copper Ltd.
Note: * This is mostly in response to Request for Price (RFP) issued, for defence/power sector procurements, to CPSEs selected onnomination basis.
** Prices in, such cases, are often below the average cost.
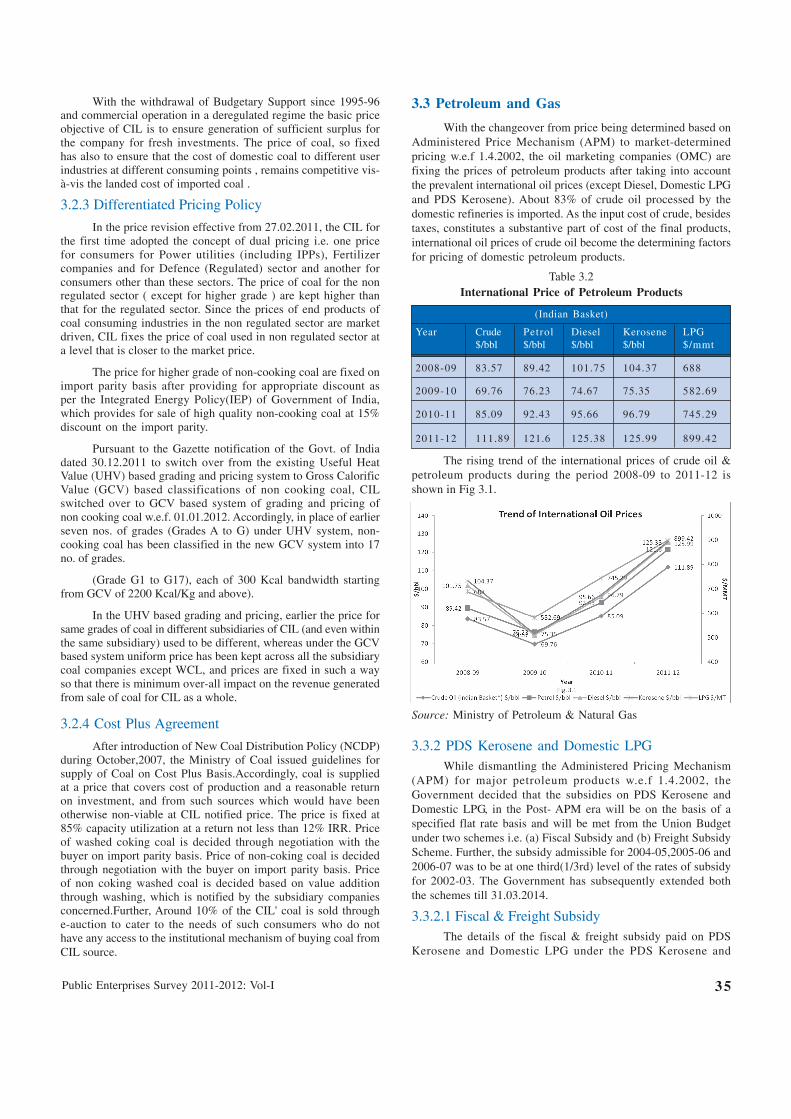
Public Enterprises Survey 2011-2012: Vol-I 35
With the withdrawal of Budgetary Support since 1995-96and commercial operation in a deregulated regime the basic priceobjective of CIL is to ensure generation of sufficient surplus forthe company for fresh investments. The price of coal, so fixedhas also to ensure that the cost of domestic coal to different userindustries at different consuming points , remains competitive vis-à-vis the landed cost of imported coal .
3.2.3 Differentiated Pricing Policy
In the price revision effective from 27.02.2011, the CIL forthe first time adopted the concept of dual pricing i.e. one pricefor consumers for Power utilities (including IPPs), Fertilizercompanies and for Defence (Regulated) sector and another forconsumers other than these sectors. The price of coal for the nonregulated sector ( except for higher grade ) are kept higher thanthat for the regulated sector. Since the prices of end products ofcoal consuming industries in the non regulated sector are marketdriven, CIL fixes the price of coal used in non regulated sector ata level that is closer to the market price.
The price for higher grade of non-cooking coal are fixed onimport parity basis after providing for appropriate discount asper the Integrated Energy Policy(IEP) of Government of India,which provides for sale of high quality non-cooking coal at 15%discount on the import parity.
Pursuant to the Gazette notification of the Govt. of Indiadated 30.12.2011 to switch over from the existing Useful HeatValue (UHV) based grading and pricing system to Gross CalorificValue (GCV) based classifications of non cooking coal, CILswitched over to GCV based system of grading and pricing ofnon cooking coal w.e.f. 01.01.2012. Accordingly, in place of earlierseven nos. of grades (Grades A to G) under UHV system, non-cooking coal has been classified in the new GCV system into 17no. of grades.
(Grade G1 to G17), each of 300 Kcal bandwidth startingfrom GCV of 2200 Kcal/Kg and above).
In the UHV based grading and pricing, earlier the price forsame grades of coal in different subsidiaries of CIL (and even withinthe same subsidiary) used to be different, whereas under the GCVbased system uniform price has been kept across all the subsidiarycoal companies except WCL, and prices are fixed in such a wayso that there is minimum over-all impact on the revenue generatedfrom sale of coal for CIL as a whole.
3.2.4 Cost Plus Agreement
After introduction of New Coal Distribution Policy (NCDP)during October,2007, the Ministry of Coal issued guidelines forsupply of Coal on Cost Plus Basis.Accordingly, coal is suppliedat a price that covers cost of production and a reasonable returnon investment, and from such sources which would have beenotherwise non-viable at CIL notified price. The price is fixed at85% capacity utilization at a return not less than 12% IRR. Priceof washed coking coal is decided through negotiation with thebuyer on import parity basis. Price of non-coking coal is decidedthrough negotiation with the buyer on import parity basis. Priceof non coking washed coal is decided based on value additionthrough washing, which is notified by the subsidiary companiesconcerned.Further, Around 10% of the CIL' coal is sold throughe-auction to cater to the needs of such consumers who do nothave any access to the institutional mechanism of buying coal fromCIL source.
3.3 Petroleum and Gas
With the changeover from price being determined based onAdministered Price Mechanism (APM) to market-determinedpricing w.e.f 1.4.2002, the oil marketing companies (OMC) arefixing the prices of petroleum products after taking into accountthe prevalent international oil prices (except Diesel, Domestic LPGand PDS Kerosene). About 83% of crude oil processed by thedomestic refineries is imported. As the input cost of crude, besidestaxes, constitutes a substantive part of cost of the final products,international oil prices of crude oil become the determining factorsfor pricing of domestic petroleum products.
Table 3.2International Price of Petroleum Products
(Indian Basket)
Year Crude Petrol Diesel Kerosene LPG$/bbl $/bbl $/bbl $/bbl $/mmt
2008-09 83.57 89.42 101.75 104.37 688
2009-10 69.76 76.23 74.67 75.35 582.69
2010-11 85.09 92.43 95.66 96.79 745.29
2011-12 111.89 121.6 125.38 125.99 899.42
The rising trend of the international prices of crude oil &petroleum products during the period 2008-09 to 2011-12 isshown in Fig 3.1.
Source: Ministry of Petroleum & Natural Gas
3.3.2 PDS Kerosene and Domestic LPGWhile dismantling the Administered Pricing Mechanism
(APM) for major petroleum products w.e.f 1.4.2002, theGovernment decided that the subsidies on PDS Kerosene andDomestic LPG, in the Post- APM era will be on the basis of aspecified flat rate basis and will be met from the Union Budgetunder two schemes i.e. (a) Fiscal Subsidy and (b) Freight SubsidyScheme. Further, the subsidy admissible for 2004-05,2005-06 and2006-07 was to be at one third(1/3rd) level of the rates of subsidyfor 2002-03. The Government has subsequently extended boththe schemes till 31.03.2014.
3.3.2.1 Fiscal & Freight SubsidyThe details of the fiscal & freight subsidy paid on PDS
Kerosene and Domestic LPG under the PDS Kerosene and
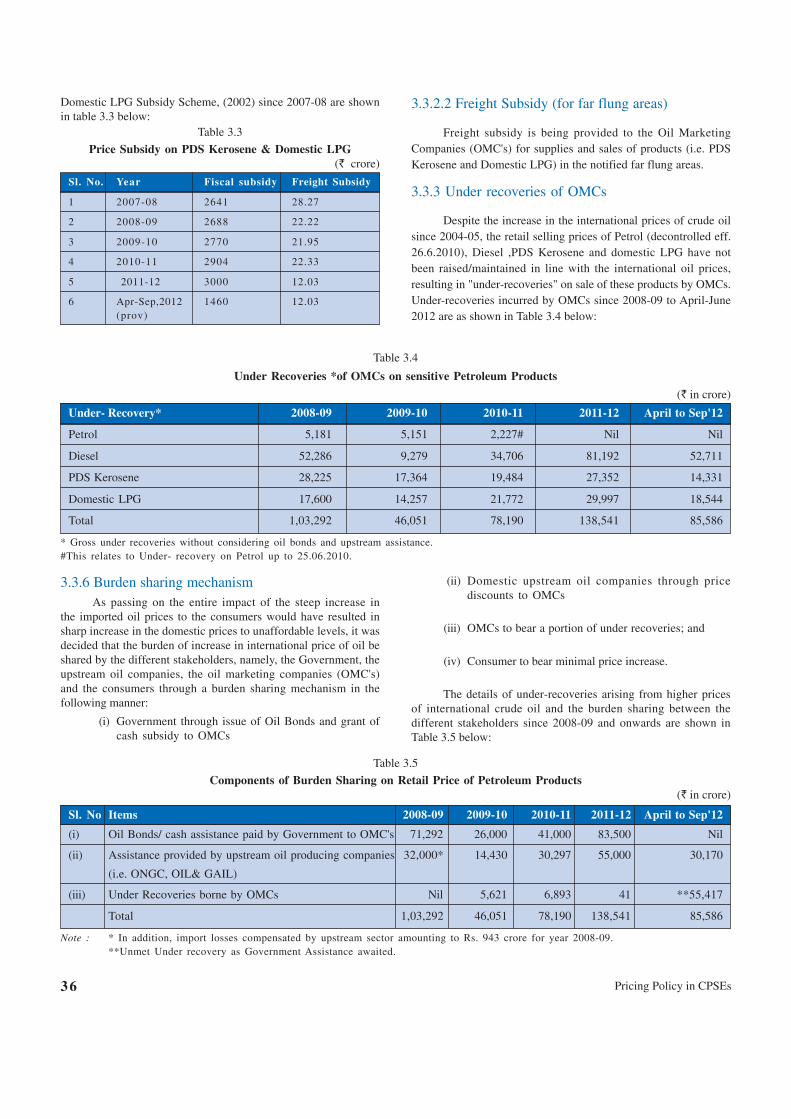
Pricing Policy in CPSEs36
3.3.2.2 Freight Subsidy (for far flung areas)
Freight subsidy is being provided to the Oil MarketingCompanies (OMC's) for supplies and sales of products (i.e. PDSKerosene and Domestic LPG) in the notified far flung areas.
3.3.3 Under recoveries of OMCs
Despite the increase in the international prices of crude oilsince 2004-05, the retail selling prices of Petrol (decontrolled eff.26.6.2010), Diesel ,PDS Kerosene and domestic LPG have notbeen raised/maintained in line with the international oil prices,resulting in "under-recoveries" on sale of these products by OMCs.Under-recoveries incurred by OMCs since 2008-09 to April-June2012 are as shown in Table 3.4 below:
3.3.6 Burden sharing mechanismAs passing on the entire impact of the steep increase in
the imported oil prices to the consumers would have resulted insharp increase in the domestic prices to unaffordable levels, it wasdecided that the burden of increase in international price of oil beshared by the different stakeholders, namely, the Government, theupstream oil companies, the oil marketing companies (OMC's)and the consumers through a burden sharing mechanism in thefollowing manner:
(i) Government through issue of Oil Bonds and grant ofcash subsidy to OMCs
(ii) Domestic upstream oil companies through pricediscounts to OMCs
(iii) OMCs to bear a portion of under recoveries; and
(iv) Consumer to bear minimal price increase.
The details of under-recoveries arising from higher pricesof international crude oil and the burden sharing between thedifferent stakeholders since 2008-09 and onwards are shown inTable 3.5 below:
Table 3.5
Components of Burden Sharing on Retail Price of Petroleum Products(` in crore)
Sl. No Items 2008-09 2009-10 2010-11 2011-12 April to Sep'12
(i) Oil Bonds/ cash assistance paid by Government to OMC's 71,292 26,000 41,000 83,500 Nil
(ii) Assistance provided by upstream oil producing companies 32,000* 14,430 30,297 55,000 30,170
(i.e. ONGC, OIL& GAIL)
(iii) Under Recoveries borne by OMCs Nil 5,621 6,893 41 **55,417
Total 1,03,292 46,051 78,190 138,541 85,586
Note : * In addition, import losses compensated by upstream sector amounting to Rs. 943 crore for year 2008-09.**Unmet Under recovery as Government Assistance awaited.
Domestic LPG Subsidy Scheme, (2002) since 2007-08 are shownin table 3.3 below:
Table 3.3
Price Subsidy on PDS Kerosene & Domestic LPG(` crore)
Sl. No. Year Fiscal subsidy Freight Subsidy
1 2007-08 2641 28.27
2 2008-09 2688 22.22
3 2009-10 2770 21.95
4 2010-11 2904 22.33
5 2011-12 3000 12.03
6 Apr-Sep,2012 1460 12.03(prov)
Table 3.4
Under Recoveries *of OMCs on sensitive Petroleum Products
(` in crore)
Under- Recovery* 2008-09 2009-10 2010-11 2011-12 April to Sep'12
Petrol 5,181 5,151 2,227# Nil Nil
Diesel 52,286 9,279 34,706 81,192 52,711
PDS Kerosene 28,225 17,364 19,484 27,352 14,331
Domestic LPG 17,600 14,257 21,772 29,997 18,544
Total 1,03,292 46,051 78,190 138,541 85,586
* Gross under recoveries without considering oil bonds and upstream assistance.#This relates to Under- recovery on Petrol up to 25.06.2010.
Public Enterprises Survey 2011-2012: Vol-I 37
3.3.7 Measures to control the impact of highinternational prices
The Government, on its part, has taken a number ofmeasures to rationalize taxes/duties on petrol and diesel to keepthe consumer prices of these sensitive (petroleum) products atreasonable limits. In view of the alarming situation arising out ofprojected massive under-recoveries of the OMCs during 2012-13on account of high international crude oil prices and the sharpdepreciation of Indian Rupee against US Dollar, the Governmenttook the following decisions in September, 2012:
(1) Increase in price of Diesel by 5 per litre excludingVAT.Out of this, 1.50 per litre is on account of increasein Excise Duty.
(2) Restrict the supply of subsidized domestic LPGcylinders to each consumer at 6 cylinders (of 14.2 kg)per annum. The number of subsidized LPG cylindersavailable to each consumer in the remaining part of thecurrent financial year to be 3 cylinders.
3.4 Electric Power
The Electricity Regulatory Commission Act was enactedin 1998 for creation of Regulatory Commissions at the Centreand in the States with the authority, inter-alia, to regulate/determine power tariffs. The Central Government accordinglycreated the Central Electricity Regulatory Commission (CERC)to regulate/ determine power tariffs of CPSEs engaged ingeneration and inter-state transmission of power. CERC alsoissues order on Availability Based Tariff (ABT) for ensuring griddiscipline.
The tariffs for the electricity supplied by CPSEs for theperiod of 2009-14 are determined by the CERC as per the CentralElectricity Regulatory Commission (Terms & Conditions ofTariff) Regulations, 2009. Regulation 14 of the Tariff Regulations2009 describes the components of the annual fixed cost of agenerating station for the purpose of determination of tariff whichare:
� Return on Equity
� Interest on loan capital
� Depreciation
� Interest on working capital
� Operation & Maintenance expenses
� Cost of Secondary Fuel (For Coal based and Lignite firedgenerating station only)
� Special allowances in lieu of R&M or separatecompensation allowances, wherever applicable.
The Important features of the Tariff Regulations, 2009having advantage for the generators or transmission licensee (overthe Tariff Regulation, 2004) are as follows:
� The base rate for allowing return on equity has been
raised from 14% to 15.5% (as this will attract moreinvestors in the power sector).
� For timely completion of projects, an additional returnon equity of 0.5 % is allowed as an incentive.
� New hydro power projects have been insulated fromhydrological risks during the first 10 years of theiroperations, giving a relaxation to design energy, if ahydro power station cannot achieve the designenergy due to reasons beyond the control of thegenerator.
� Tariff for hydro power project has been restructured toallow incentives for supply of peaking power.
� Return on equity @ 15.5% has been grossed up by theapplicable tax rate.
� As against a depreciation rate of 3.6% for the thermalpower project and 2.75% for hydro power projects, theCERC has increased the depreciation rate to 5.28% formost components of the projects.
� Capacity index based fixed charge recovery has beenreplaced by availability based fixed charge recovery.
Further, as per the Hydro Policy 2008,CPSUs/PSUs havebeen exempted from tariff based bidding and the tariff is to bedetermined on cost plus basis for the tariff period 2009-14provided the financial closure of the project is achieved by Jan,11,2011.
The dispensation available to CPSUs /PSUs regardingexemption from Tariff based Bidding need to be continued beyondJan 2011, since it is not feasible for hydel projects to predict theactual cost of the project because of geological uncertainties, costof Rehabilitation and Resettlement and other unforeseen factorsleading to time and cost overruns. The Ministry of Power, Govt.of India therefore extended the exemption from tariff based biddingup to 31.12.15 vide Notification dated 9.8.2011.
3.5 SteelThe steel industry in India was one of the first few major
sectors to be comprehensively deregulated as part of the generaleconomic reforms. The erstwhile regime of controls was whollydismantled in 1992 through the following policy changes :
(a) Price and distribution (with the exception of a fewstrategic areas) were freed,
(b) Trade barriers came down with reduction in tariff ratesand removal of physical restrictions (canalizing andlicensing) on imports and exports,
(c) Freight ceilings was replaced by freight equalization,
(d) FDI in Iron & Steel was allowed through the automaticroute,
(e) Technology imports were made easier, and
(f) Capacity controls and reservation on the BF- BOFsectors were withdrawn.
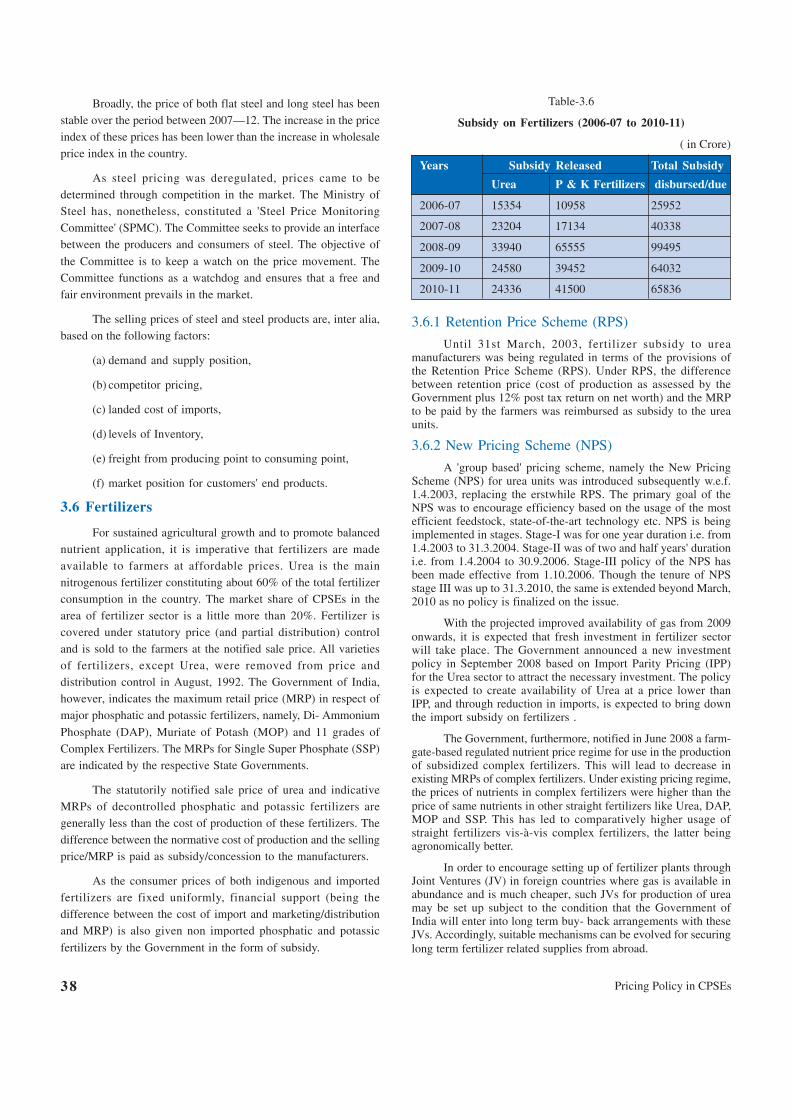
Pricing Policy in CPSEs38
Broadly, the price of both flat steel and long steel has beenstable over the period between 2007—12. The increase in the priceindex of these prices has been lower than the increase in wholesaleprice index in the country.
As steel pricing was deregulated, prices came to bedetermined through competition in the market. The Ministry ofSteel has, nonetheless, constituted a 'Steel Price MonitoringCommittee' (SPMC). The Committee seeks to provide an interfacebetween the producers and consumers of steel. The objective of
the Committee is to keep a watch on the price movement. TheCommittee functions as a watchdog and ensures that a free andfair environment prevails in the market.
The selling prices of steel and steel products are, inter alia,based on the following factors:
(a) demand and supply position,
(b) competitor pricing,
(c) landed cost of imports,
(d) levels of Inventory,
(e) freight from producing point to consuming point,
(f) market position for customers' end products.
3.6 Fertilizers
For sustained agricultural growth and to promote balancednutrient application, it is imperative that fertilizers are madeavailable to farmers at affordable prices. Urea is the mainnitrogenous fertilizer constituting about 60% of the total fertilizerconsumption in the country. The market share of CPSEs in thearea of fertilizer sector is a little more than 20%. Fertilizer iscovered under statutory price (and partial distribution) controland is sold to the farmers at the notified sale price. All varietiesof fertilizers, except Urea, were removed from price anddistribution control in August, 1992. The Government of India,however, indicates the maximum retail price (MRP) in respect ofmajor phosphatic and potassic fertilizers, namely, Di- Ammonium
Phosphate (DAP), Muriate of Potash (MOP) and 11 grades ofComplex Fertilizers. The MRPs for Single Super Phosphate (SSP)are indicated by the respective State Governments.
The statutorily notified sale price of urea and indicativeMRPs of decontrolled phosphatic and potassic fertilizers aregenerally less than the cost of production of these fertilizers. Thedifference between the normative cost of production and the sellingprice/MRP is paid as subsidy/concession to the manufacturers.
As the consumer prices of both indigenous and importedfertilizers are fixed uniformly, financial support (being thedifference between the cost of import and marketing/distributionand MRP) is also given non imported phosphatic and potassic
fertilizers by the Government in the form of subsidy.
Table-3.6
Subsidy on Fertilizers (2006-07 to 2010-11)
( in Crore)
Years Subsidy Released Total Subsidy
Urea P & K Fertilizers disbursed/due
2006-07 15354 10958 25952
2007-08 23204 17134 40338
2008-09 33940 65555 99495
2009-10 24580 39452 64032
2010-11 24336 41500 65836
3.6.1 Retention Price Scheme (RPS)
Until 31st March, 2003, fertilizer subsidy to ureamanufacturers was being regulated in terms of the provisions ofthe Retention Price Scheme (RPS). Under RPS, the differencebetween retention price (cost of production as assessed by theGovernment plus 12% post tax return on net worth) and the MRPto be paid by the farmers was reimbursed as subsidy to the ureaunits.
3.6.2 New Pricing Scheme (NPS)
A 'group based' pricing scheme, namely the New PricingScheme (NPS) for urea units was introduced subsequently w.e.f.1.4.2003, replacing the erstwhile RPS. The primary goal of theNPS was to encourage efficiency based on the usage of the mostefficient feedstock, state-of-the-art technology etc. NPS is beingimplemented in stages. Stage-I was for one year duration i.e. from1.4.2003 to 31.3.2004. Stage-II was of two and half years' durationi.e. from 1.4.2004 to 30.9.2006. Stage-III policy of the NPS hasbeen made effective from 1.10.2006. Though the tenure of NPSstage III was up to 31.3.2010, the same is extended beyond March,2010 as no policy is finalized on the issue.
With the projected improved availability of gas from 2009onwards, it is expected that fresh investment in fertilizer sectorwill take place. The Government announced a new investmentpolicy in September 2008 based on Import Parity Pricing (IPP)for the Urea sector to attract the necessary investment. The policyis expected to create availability of Urea at a price lower thanIPP, and through reduction in imports, is expected to bring downthe import subsidy on fertilizers .
The Government, furthermore, notified in June 2008 a farm-gate-based regulated nutrient price regime for use in the productionof subsidized complex fertilizers. This will lead to decrease inexisting MRPs of complex fertilizers. Under existing pricing regime,the prices of nutrients in complex fertilizers were higher than theprice of same nutrients in other straight fertilizers like Urea, DAP,MOP and SSP. This has led to comparatively higher usage ofstraight fertilizers vis-à-vis complex fertilizers, the latter beingagronomically better.
In order to encourage setting up of fertilizer plants throughJoint Ventures (JV) in foreign countries where gas is available inabundance and is much cheaper, such JVs for production of ureamay be set up subject to the condition that the Government ofIndia will enter into long term buy- back arrangements with theseJVs. Accordingly, suitable mechanisms can be evolved for securinglong term fertilizer related supplies from abroad.
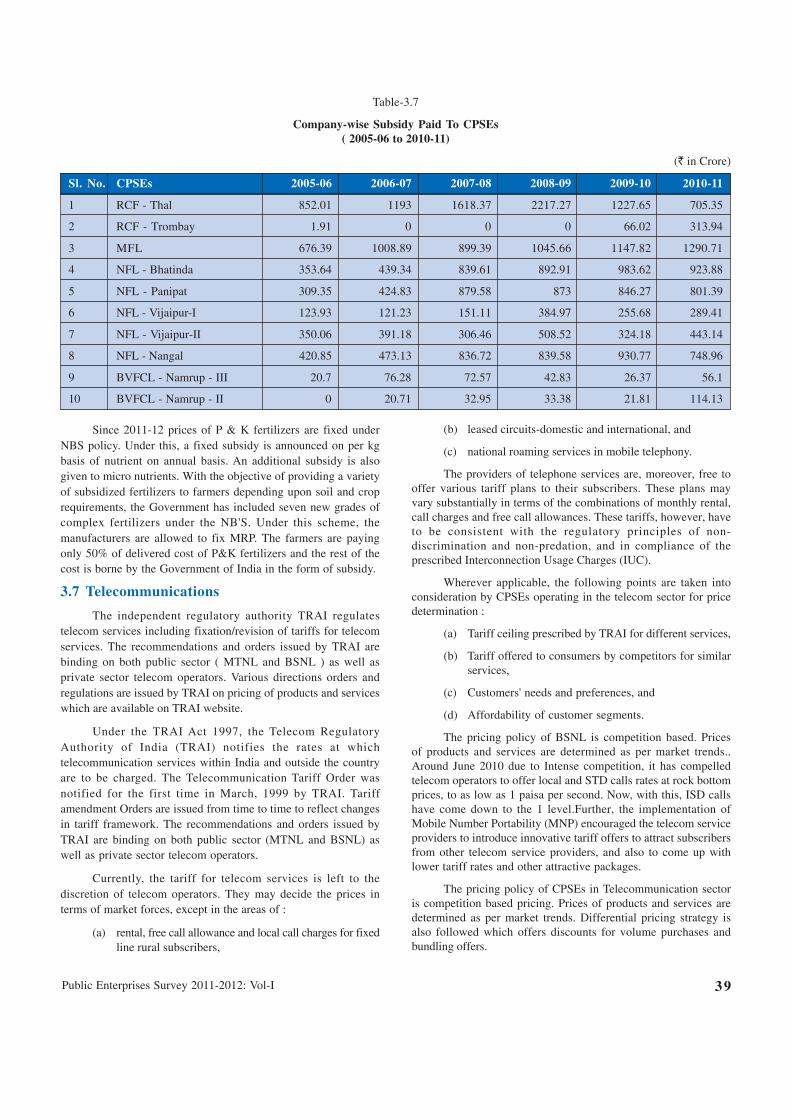
Public Enterprises Survey 2011-2012: Vol-I 39
Since 2011-12 prices of P & K fertilizers are fixed underNBS policy. Under this, a fixed subsidy is announced on per kgbasis of nutrient on annual basis. An additional subsidy is alsogiven to micro nutrients. With the objective of providing a varietyof subsidized fertilizers to farmers depending upon soil and croprequirements, the Government has included seven new grades ofcomplex fertilizers under the NB'S. Under this scheme, themanufacturers are allowed to fix MRP. The farmers are payingonly 50% of delivered cost of P&K fertilizers and the rest of thecost is borne by the Government of India in the form of subsidy.
3.7 Telecommunications
The independent regulatory authority TRAI regulatestelecom services including fixation/revision of tariffs for telecomservices. The recommendations and orders issued by TRAI arebinding on both public sector ( MTNL and BSNL ) as well asprivate sector telecom operators. Various directions orders andregulations are issued by TRAI on pricing of products and serviceswhich are available on TRAI website.
Under the TRAI Act 1997, the Telecom RegulatoryAuthority of India (TRAI) notifies the rates at whichtelecommunication services within India and outside the countryare to be charged. The Telecommunication Tariff Order wasnotified for the first time in March, 1999 by TRAI. Tariffamendment Orders are issued from time to time to reflect changesin tariff framework. The recommendations and orders issued byTRAI are binding on both public sector (MTNL and BSNL) aswell as private sector telecom operators.
Currently, the tariff for telecom services is left to thediscretion of telecom operators. They may decide the prices interms of market forces, except in the areas of :
(a) rental, free call allowance and local call charges for fixedline rural subscribers,
(b) leased circuits-domestic and international, and
(c) national roaming services in mobile telephony.
The providers of telephone services are, moreover, free tooffer various tariff plans to their subscribers. These plans mayvary substantially in terms of the combinations of monthly rental,call charges and free call allowances. These tariffs, however, haveto be consistent with the regulatory principles of non-discrimination and non-predation, and in compliance of theprescribed Interconnection Usage Charges (IUC).
Wherever applicable, the following points are taken intoconsideration by CPSEs operating in the telecom sector for pricedetermination :
(a) Tariff ceiling prescribed by TRAI for different services,
(b) Tariff offered to consumers by competitors for similarservices,
(c) Customers' needs and preferences, and
(d) Affordability of customer segments.
The pricing policy of BSNL is competition based. Pricesof products and services are determined as per market trends..Around June 2010 due to Intense competition, it has compelledtelecom operators to offer local and STD calls rates at rock bottomprices, to as low as 1 paisa per second. Now, with this, ISD callshave come down to the 1 level.Further, the implementation ofMobile Number Portability (MNP) encouraged the telecom serviceproviders to introduce innovative tariff offers to attract subscribersfrom other telecom service providers, and also to come up withlower tariff rates and other attractive packages.
The pricing policy of CPSEs in Telecommunication sectoris competition based pricing. Prices of products and services aredetermined as per market trends. Differential pricing strategy isalso followed which offers discounts for volume purchases andbundling offers.
Table-3.7
Company-wise Subsidy Paid To CPSEs( 2005-06 to 2010-11)
(` in Crore)
Sl. No. CPSEs 2005-06 2006-07 2007-08 2008-09 2009-10 2010-11
1 RCF - Thal 852.01 1193 1618.37 2217.27 1227.65 705.35
2 RCF - Trombay 1.91 0 0 0 66.02 313.94
3 MFL 676.39 1008.89 899.39 1045.66 1147.82 1290.71
4 NFL - Bhatinda 353.64 439.34 839.61 892.91 983.62 923.88
5 NFL - Panipat 309.35 424.83 879.58 873 846.27 801.39
6 NFL - Vijaipur-I 123.93 121.23 151.11 384.97 255.68 289.41
7 NFL - Vijaipur-II 350.06 391.18 306.46 508.52 324.18 443.14
8 NFL - Nangal 420.85 473.13 836.72 839.58 930.77 748.96
9 BVFCL - Namrup - III 20.7 76.28 72.57 42.83 26.37 56.1
10 BVFCL - Namrup - II 0 20.71 32.95 33.38 21.81 114.13
Pricing Policy in CPSEs40
3.8 Civil Aviation
3.8.1 Airport Services
The Airport Economic Regulatory Authority of India(AERA) has been established for regulating the various Airportand Navigational Tariff of all major airports. The Multi Year TariffProposal (MYTP) and Annual Tariff Proposal (ATP) have beensubmitted/are under submission for these airports to AERA .Forairports other than non-major airports, Ministry of Civil aviationis functioning as the Regulator and AAI is in the process ofsubmitting the proposal (s) for such airports.
3.8.2 Fares for Airflights
The air fares and tariff are deregulated.DGCA has videvarious CAR (Civil Aviation Regulation) advised the airlines onthe transparency in display of air fares & publishing of tariff(Rule135 of Aircraft Rules,1937).
The 'fares' offered by Air India are competitive and marketdriven and are based on market considerations, such as, faresoffered by competitors, seasonality, extent of competition andproduct features like frequency, timings, direct/ indirect operationsetc.
Apart from the normal sector fare, Air India offers multiplelevels of lower fares on the domestic network. The availability ofa particular fare on the sector may vary from flight to flight andsector to sector as it is dependent on the demand and supply andconsequent availability of seat in a particular fare level at the timingof booking.
Fair revision/computation is not governed by any rigidstipulation. It may not be necessary to simultaneously revise faresin all classes on a given sector nor is it necessary to revise thefares of all sectors at the same time. Dependent on the prevailingmarket conditions, there can be both upward / downwardmovement of the fare may remain unaltered on the particular sectorat the time of any fare revision.
Pawan Hans Helicopter Ltd. has adopted the following broadprinciples of price determination:
� Competition based pricing-For a majority of contractsfor helicopter services, Pawan Hans Helicopters Ltd. Hasto engage in competitive domestic and global bidding.Most business in offshore Oil and Gas E&P sector andState/Central Govt. leases are secured in such a manner.In such cases prices are driven by competitive dynamicsin order to secure long term contracts under tenderbidding.
� Cost Plus pricing-For a small proportion of works,Pawan Hans Helicopters Ltd. Based on customer requestand (or) agreement provides this kind of pricing subjectto discussion and negotiation on final prices. Suchmethod is followed for Contracts awarded onnomination basis, if any.
3.9 Pharmaceuticals
Prices of pharmaceutical products manufactured by CPSEsare fixed based on the Drugs Price Control Order (DPCO), 1995.
Pharmaceutical products have been moreover, categorized asScheduled and Non-Scheduled formulations. The Government ofIndia notified the new National Pharmaceuticals PricingPolicy(NPPP) 2012 in December 2012. There are 348 drugs inthe national List of Essential Medicines (NLEM 2011) under pricecontrol. The ceiling prices of these essential medicines under thenew method are based on market based pricing (MBP) mechanismwhich is different for calculating ceiling prices of drugs based onCost Based Pricing (CBP).
3.9.1 Prices of Scheduled PharmaceuticalProducts
The Maximum Retail Prices (MRP) of ScheduledFormulations are fixed and revised by the National PharmaceuticalPricing Authority (NPPA), the price regulatory authority ofGovernment of India.
3.9.2 Prices of Non-scheduled PharmaceuticalProducts
The prices of non-scheduled formulations are fixed by theBoard of Directors of CPSEs based on DPCO guidelines, theircost and prevailing market trend. In case of pharmaceuticals CPSEs,the pricing policy for various products are discussed in theparagraph below.
3.9.2.1 Prices of 102 products reserved under PreferentialPurchase Policy (PPP) of Government of India (GOI) for pharmaCPSEs:
3.9.2.1-A Pricing of 102 products reserved under PPPof GOI for pharma CPSEs for supply to Central Government& State Government institutions funded by GOI:
Preferential Purchase Policy for 102 drugsmanufactured by 5 CPSEs was introduced by Deptt. ofChemicals & Petrochemicals ( Deptt. of Pharmaceuticals)valid for 5 years i.e. upto 6 August, 2011. The drugs werecategorized into Scheduled & Non Scheduled drugs.
A1: For scheduled drugs discount varying upto 35%were offered on the ceiling price fixed by NPPA.
A2: For Non scheduled drugs discount varying upto35% was fixed on retail price (Notional ceiling price wasworked by NPPA for the purpose of PPP policy).
Department of pharmaceuticals has initiated stepsfor the extension of purchase preference policy w.e.f. theapproval of the competent authority.
3.9.2.1-B Price of 102 products reserved under PPPpolicy for CPSEs for supply to institutions not funded byGoI:
The benefits of reduced prices fixed under PPPpolicy as mentioned above was also extended to suchsupplies.
3.9.2.2 Prices of products other than 102 Products:
These prices for non PPP products are worked on the basisof (a) cost parameter of respective CPSEs. (b) Competitors pricingpattern. (c) Ceiling prices fixed by NPPA.
Public Enterprises Survey 2011-2012: Vol-I 41
3.9.2.2- A Price of products being sold in openmarket:
The prices for open market sale are fixed based on(a) The prevailing price of the competitor brand, (b) Costparameter of the respective CPSE. (c) Ceiling prices fixedby NPPA, (d) Guidelines given by DPCO in case of Nonscheduled drugs.
3.9.2.2-B Prices of products under JanaushadhiProgramme :
The prices of products sold by CPSEs under theJanaushadhi Programme of Department Of Pharmaceuticals,GOI are fixed by BPPI (Bureau of Pharma Public SectorCompanies of India based on (a) 50% of the average MRPof the reputed manufacturer and, (b) cost parameters ofCPSEs.
3.9.2.2-C There is no Subsidy Policy in case of supplyif drugs/medicines available to CPSEs
3.10 Agriculture Products
3.10.1 Outputs: Wheat & Paddy
The Food Corporation of India (FCI) has been interveningin the foodgrain market through price support policy for farmersand through the public distribution system for consumers. Pricesupport policy is implemented by the FCI primarily in regard towheat and paddy. The two main objectives of this marketintervention are (a) to protect the farmers from volatility in grainmarkets, and (b) to correct the trade bias against agriculture vis-à-vis other sectors of the economy.
The initial recommendation in regard to procurement priceis made by the Commission on Agricultural Costs and Prices(CACP) in the Ministry of Agriculture, Government of India.These prices are arrived at on the basis of cost of cultivationand several other specified factors rather than on demand-supplybasis.
The distribution of food grains to the vulnerable sectionsof the population by FCI is done at Central Issue Price (CIP).
Despite increase in the Minimum Support Prices for both wheatand paddy in successive years, there has been no revision of CIPof food grains (wheat and rice) for Below the Poverty Level (BPL)population, Above the Poverty Level (APL) population and forAntyodaya Anna Yojana (AAY) since July1, 2002.
3.10.2 Inputs: HYV Seeds
National Seeds Corporation Ltd. (NSC) and State FarmsCorporation of India Ltd. (SFCI) are the two CPSEs engaged inproduction of quality high- yield variety (HYV) seeds. TheGovernment has not issued any direction to these CPSEs onfixation of prices of seeds, which are generally determined bymarket forces. NSC and SFCI are engaged mainly in productionof high volume of low cost seeds of cereals and pulses and havebeen striving to make quality seeds available to Indian farmers ataffordable prices to ensure national food security.
After globalization of the Indian economy, a number ofprivate seed companies have entered Indian market. The CentralPSEs are facing stiff competition from private sector seedcompanies, especially in case of hybrid seeds. In view of the above,the Government has left it entirely to the CPSEs to fix prices oftheir products, allowing them the freedom to maintain a balancebetween social objectives and commercial viability.
Seed pricing comprise of two stages i.e. (i) seed production/procurement, (ii) seed sale. Bulk of seed production, bothfoundation and certified, is largely arranged through regularregistered contracts with seed growers. For finalizing the sale priceof hybrid/high variety seed, the main factors taken into accountare:
(a) the relevant Minimum Support Price (MSP) fixed forthe crop/season,
(b) the commercial produce price in the local mandis/market yards, especially in the ultimate end-use/seedsale areas,
(c) all the costs incurred in terms of processing, treatment,packing, labeling, tagging, sealing, transportation,storage, handling, losses in the process, publicity, salespromotion, interest burden, dealers discount, etc
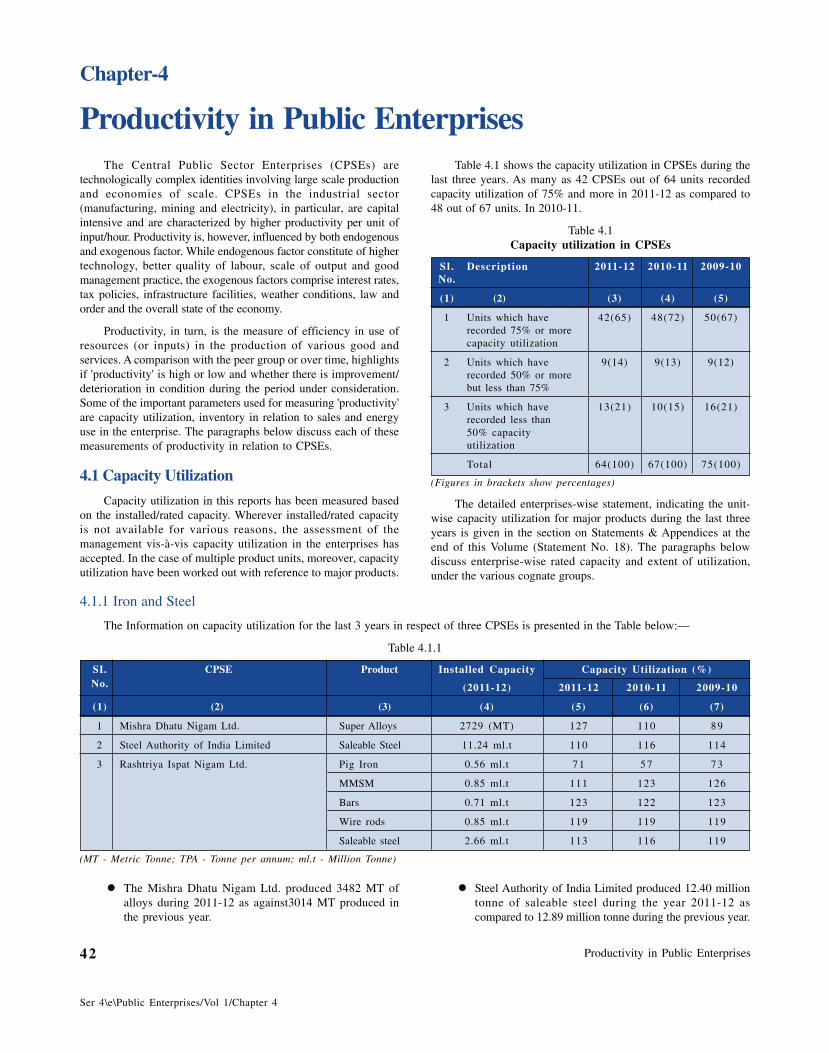
Productivity in Public Enterprises42
Ser 4\e\Public Enterprises/Vol 1/Chapter 4
Productivity in Public Enterprises
Chapter-4
The Central Public Sector Enterprises (CPSEs) aretechnologically complex identities involving large scale productionand economies of scale. CPSEs in the industrial sector(manufacturing, mining and electricity), in particular, are capitalintensive and are characterized by higher productivity per unit ofinput/hour. Productivity is, however, influenced by both endogenousand exogenous factor. While endogenous factor constitute of highertechnology, better quality of labour, scale of output and goodmanagement practice, the exogenous factors comprise interest rates,tax policies, infrastructure facilities, weather conditions, law andorder and the overall state of the economy.
Productivity, in turn, is the measure of efficiency in use ofresources (or inputs) in the production of various good andservices. A comparison with the peer group or over time, highlightsif 'productivity' is high or low and whether there is improvement/deterioration in condition during the period under consideration.Some of the important parameters used for measuring 'productivity'are capacity utilization, inventory in relation to sales and energyuse in the enterprise. The paragraphs below discuss each of thesemeasurements of productivity in relation to CPSEs.
4.1 Capacity Utilization
Capacity utilization in this reports has been measured basedon the installed/rated capacity. Wherever installed/rated capacityis not available for various reasons, the assessment of themanagement vis-à-vis capacity utilization in the enterprises hasaccepted. In the case of multiple product units, moreover, capacityutilization have been worked out with reference to major products.
Table 4.1 shows the capacity utilization in CPSEs during thelast three years. As many as 42 CPSEs out of 64 units recordedcapacity utilization of 75% and more in 2011-12 as compared to48 out of 67 units. In 2010-11.
Table 4.1Capacity utilization in CPSEs
Sl . Description 2011-12 2010-11 2009-10No.
(1) (2) (3) (4) (5)
1 Units which have 42(65) 48(72) 50(67)recorded 75% or morecapacity utilization
2 Units which have 9(14) 9(13) 9(12)recorded 50% or morebut less than 75%
3 Units which have 13(21) 10(15) 16(21)recorded less than50% capacityutilization
Total 64(100) 67(100) 75(100)
(Figures in brackets show percentages)
The detailed enterprises-wise statement, indicating the unit-wise capacity utilization for major products during the last threeyears is given in the section on Statements & Appendices at theend of this Volume (Statement No. 18). The paragraphs belowdiscuss enterprise-wise rated capacity and extent of utilization,under the various cognate groups.
4.1.1 Iron and Steel
The Information on capacity utilization for the last 3 years in respect of three CPSEs is presented in the Table below:—
Table 4.1.1
SI. CPSE Product Installed Capacity Capacity Utilization (%)No. (2011-12) 2011-12 2010-11 2009-10
(1) (2) (3) (4) (5) (6) (7)
1 Mishra Dhatu Nigam Ltd. Super Alloys 2729 (MT) 127 110 89
2 Steel Authority of India Limited Saleable Steel 11.24 ml.t 110 116 114
3 Rashtriya Ispat Nigam Ltd. Pig Iron 0.56 ml.t 71 57 73
MMSM 0.85 ml.t 111 123 126
Bars 0.71 ml.t 123 122 123
Wire rods 0.85 ml.t 119 119 119
Saleable steel 2.66 ml.t 113 116 119
(MT - Metric Tonne; TPA - Tonne per annum; ml.t - Million Tonne)
� Steel Authority of India Limited produced 12.40 milliontonne of saleable steel during the year 2011-12 ascompared to 12.89 million tonne during the previous year.
� The Mishra Dhatu Nigam Ltd. produced 3482 MT ofalloys during 2011-12 as against3014 MT produced inthe previous year.
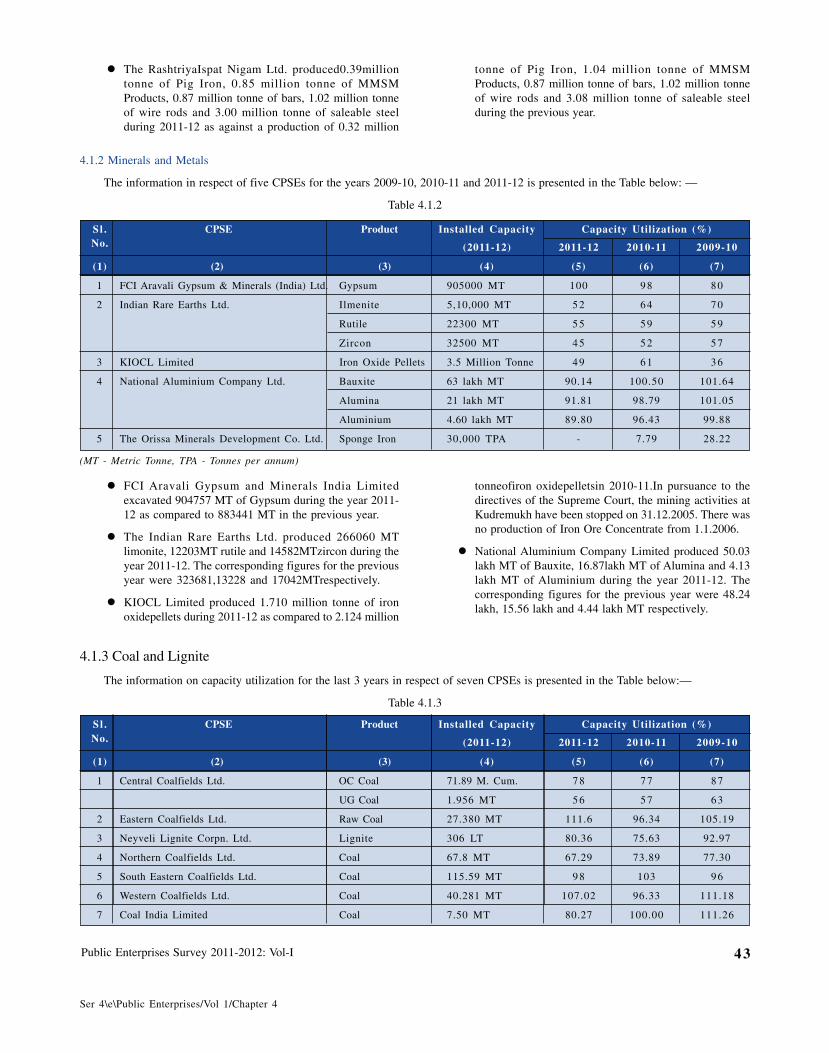
Public Enterprises Survey 2011-2012: Vol-I 43
Ser 4\e\Public Enterprises/Vol 1/Chapter 4
4.1.2 Minerals and Metals
The information in respect of five CPSEs for the years 2009-10, 2010-11 and 2011-12 is presented in the Table below: —
Table 4.1.2
Sl . CPSE Product Installed Capacity Capacity Utilization (%)No. (2011-12) 2011-12 2010-11 2009-10
(1) (2) (3) (4) (5) (6) (7)
1 FCI Aravali Gypsum & Minerals (India) Ltd. Gypsum 905000 MT 100 98 80
2 Indian Rare Earths Ltd. Ilmenite 5,10,000 MT 52 64 70
Rutile 22300 MT 55 59 59
Zircon 32500 MT 45 52 57
3 KIOCL Limited Iron Oxide Pellets 3.5 Million Tonne 49 61 36
4 National Aluminium Company Ltd. Bauxite 63 lakh MT 90.14 100.50 101.64
Alumina 21 lakh MT 91.81 98.79 101.05
Aluminium 4.60 lakh MT 89.80 96.43 99.88
5 The Orissa Minerals Development Co. Ltd. Sponge Iron 30,000 TPA - 7.79 28.22
(MT - Metric Tonne, TPA - Tonnes per annum)
tonneofiron oxidepelletsin 2010-11.In pursuance to thedirectives of the Supreme Court, the mining activities atKudremukh have been stopped on 31.12.2005. There wasno production of Iron Ore Concentrate from 1.1.2006.
� National Aluminium Company Limited produced 50.03lakh MT of Bauxite, 16.87lakh MT of Alumina and 4.13lakh MT of Aluminium during the year 2011-12. Thecorresponding figures for the previous year were 48.24lakh, 15.56 lakh and 4.44 lakh MT respectively.
� FCI Aravali Gypsum and Minerals India Limitedexcavated 904757 MT of Gypsum during the year 2011-12 as compared to 883441 MT in the previous year.
� The Indian Rare Earths Ltd. produced 266060 MTlimonite, 12203MT rutile and 14582MTzircon during theyear 2011-12. The corresponding figures for the previousyear were 323681,13228 and 17042MTrespectively.
� KIOCL Limited produced 1.710 million tonne of ironoxidepellets during 2011-12 as compared to 2.124 million
� The RashtriyaIspat Nigam Ltd. produced0.39milliontonne of Pig Iron, 0.85 million tonne of MMSMProducts, 0.87 million tonne of bars, 1.02 million tonneof wire rods and 3.00 million tonne of saleable steelduring 2011-12 as against a production of 0.32 million
tonne of Pig Iron, 1.04 million tonne of MMSMProducts, 0.87 million tonne of bars, 1.02 million tonneof wire rods and 3.08 million tonne of saleable steelduring the previous year.
4.1.3 Coal and Lignite
The information on capacity utilization for the last 3 years in respect of seven CPSEs is presented in the Table below:—
Table 4.1.3
Sl . CPSE Product Installed Capacity Capacity Utilization (%)No. (2011-12) 2011-12 2010-11 2009-10
(1) (2) (3) (4) (5) (6) (7)
1 Central Coalfields Ltd. OC Coal 71.89 M. Cum. 78 77 87
UG Coal 1.956 MT 56 57 63
2 Eastern Coalfields Ltd. Raw Coal 27.380 MT 111.6 96.34 105.19
3 Neyveli Lignite Corpn. Ltd. Lignite 306 LT 80.36 75.63 92.97
4 Northern Coalfields Ltd. Coal 67.8 MT 67.29 73.89 77.30
5 South Eastern Coalfields Ltd. Coal 115.59 MT 98 103 96
6 Western Coalfields Ltd. Coal 40.281 MT 107.02 96.33 111.18
7 Coal India Limited Coal 7.50 MT 80.27 100.00 111.26
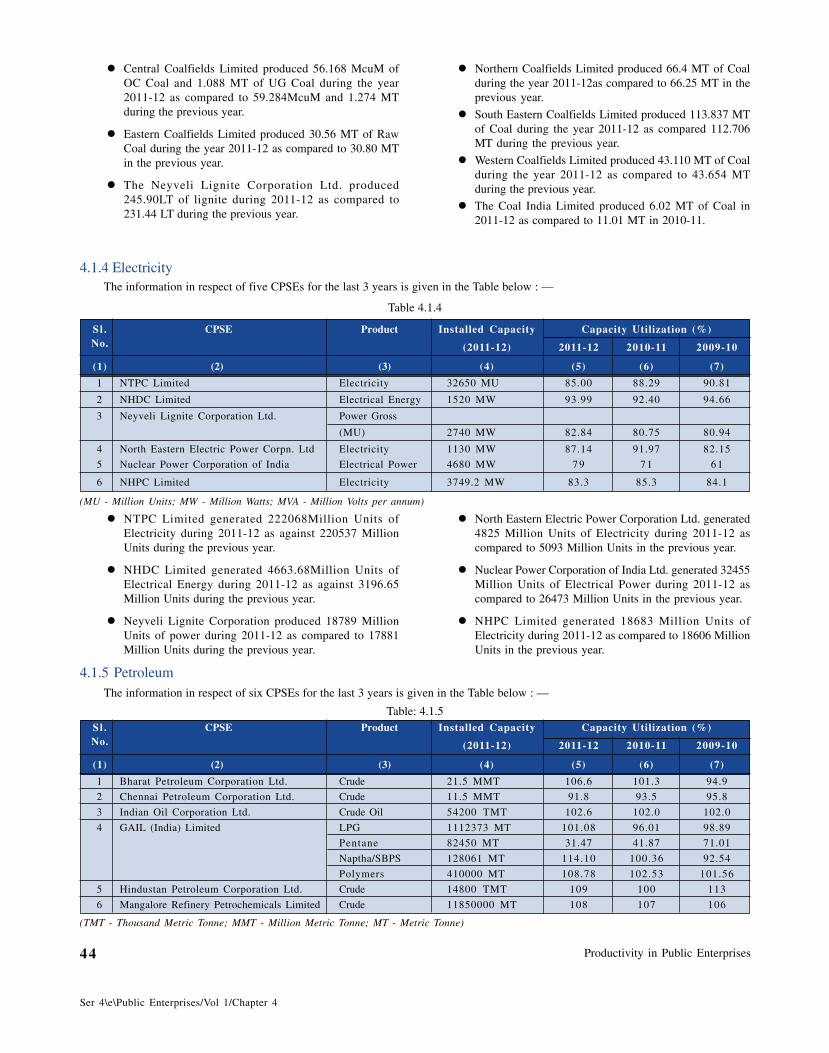
Productivity in Public Enterprises44
Ser 4\e\Public Enterprises/Vol 1/Chapter 4
4.1.4 ElectricityThe information in respect of five CPSEs for the last 3 years is given in the Table below : —
Table 4.1.4
Sl . CPSE Product Installed Capacity Capacity Utilization (%)No. (2011-12) 2011-12 2010-11 2009-10
(1) (2) (3) (4) (5) (6) (7)
1 NTPC Limited Electricity 32650 MU 85.00 88.29 90.81
2 NHDC Limited Electrical Energy 1520 MW 93.99 92.40 94.66
3 Neyveli Lignite Corporation Ltd. Power Gross
(MU) 2740 MW 82.84 80.75 80.94
4 North Eastern Electric Power Corpn. Ltd Electricity 1130 MW 87.14 91.97 82.15
5 Nuclear Power Corporation of India Electrical Power 4680 MW 79 71 61
6 NHPC Limited Electricity 3749.2 MW 83.3 85.3 84.1
(MU - Million Units; MW - Million Watts; MVA - Million Volts per annum)
� North Eastern Electric Power Corporation Ltd. generated4825 Million Units of Electricity during 2011-12 ascompared to 5093 Million Units in the previous year.
� Nuclear Power Corporation of India Ltd. generated 32455Million Units of Electrical Power during 2011-12 ascompared to 26473 Million Units in the previous year.
� NHPC Limited generated 18683 Million Units ofElectricity during 2011-12 as compared to 18606 MillionUnits in the previous year.
� NTPC Limited generated 222068Million Units ofElectricity during 2011-12 as against 220537 MillionUnits during the previous year.
� NHDC Limited generated 4663.68Million Units ofElectrical Energy during 2011-12 as against 3196.65Million Units during the previous year.
� Neyveli Lignite Corporation produced 18789 MillionUnits of power during 2011-12 as compared to 17881Million Units during the previous year.
� Northern Coalfields Limited produced 66.4 MT of Coalduring the year 2011-12as compared to 66.25 MT in theprevious year.
� South Eastern Coalfields Limited produced 113.837 MTof Coal during the year 2011-12 as compared 112.706MT during the previous year.
� Western Coalfields Limited produced 43.110 MT of Coalduring the year 2011-12 as compared to 43.654 MTduring the previous year.
� The Coal India Limited produced 6.02 MT of Coal in2011-12 as compared to 11.01 MT in 2010-11.
� Central Coalfields Limited produced 56.168 McuM ofOC Coal and 1.088 MT of UG Coal during the year2011-12 as compared to 59.284McuM and 1.274 MTduring the previous year.
� Eastern Coalfields Limited produced 30.56 MT of RawCoal during the year 2011-12 as compared to 30.80 MTin the previous year.
� The Neyveli Lignite Corporation Ltd. produced245.90LT of lignite during 2011-12 as compared to231.44 LT during the previous year.
4.1.5 PetroleumThe information in respect of six CPSEs for the last 3 years is given in the Table below : —
Table: 4.1.5Sl . CPSE Product Installed Capacity Capacity Utilization (%)No. (2011-12) 2011-12 2010-11 2009-10
(1) (2) (3) (4) (5) (6) (7)
1 Bharat Petroleum Corporation Ltd. Crude 21.5 MMT 106.6 101.3 94.9
2 Chennai Petroleum Corporation Ltd. Crude 11.5 MMT 91.8 93.5 95.8
3 Indian Oil Corporation Ltd. Crude Oil 54200 TMT 102.6 102.0 102.0
4 GAIL (India) Limited LPG 1112373 MT 101.08 96.01 98.89
Pentane 82450 MT 31.47 41.87 71.01
Naptha/SBPS 128061 MT 114.10 100.36 92.54
Polymers 410000 MT 108.78 102.53 101.56
5 Hindustan Petroleum Corporation Ltd. Crude 14800 TMT 109 100 113
6 Mangalore Refinery Petrochemicals Limited Crude 11850000 MT 108 107 106
(TMT - Thousand Metric Tonne; MMT - Million Metric Tonne; MT - Metric Tonne)
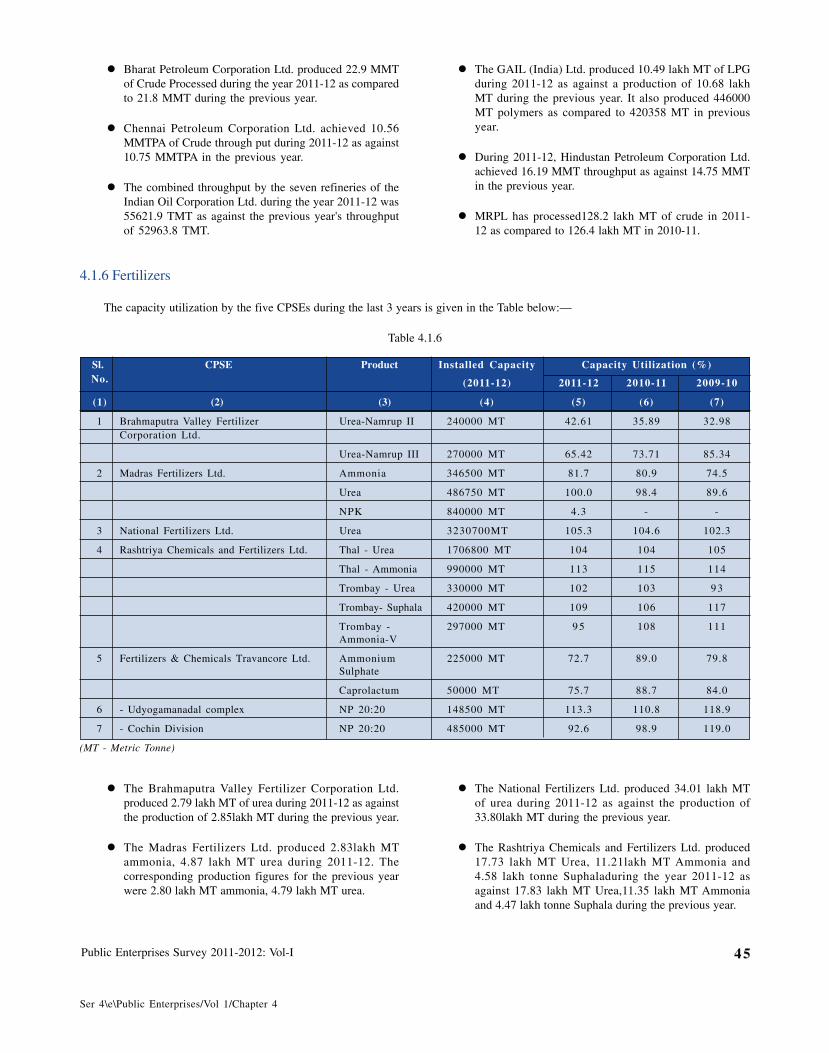
Public Enterprises Survey 2011-2012: Vol-I 45
Ser 4\e\Public Enterprises/Vol 1/Chapter 4
4.1.6 Fertilizers
The capacity utilization by the five CPSEs during the last 3 years is given in the Table below:—
Table 4.1.6
Sl. CPSE Product Installed Capacity Capacity Utilization (%)No. (2011-12) 2011-12 2010-11 2009-10
(1) (2) (3) (4) (5) (6) (7)
1 Brahmaputra Valley Fertilizer Urea-Namrup II 240000 MT 42.61 35.89 32.98Corporation Ltd.
Urea-Namrup III 270000 MT 65.42 73.71 85.34
2 Madras Fertilizers Ltd. Ammonia 346500 MT 81.7 80.9 74.5
Urea 486750 MT 100.0 98.4 89.6
NPK 840000 MT 4.3 - -
3 National Fertilizers Ltd. Urea 3230700MT 105.3 104.6 102.3
4 Rashtriya Chemicals and Fertilizers Ltd. Thal - Urea 1706800 MT 104 104 105
Thal - Ammonia 990000 MT 113 115 114
Trombay - Urea 330000 MT 102 103 93
Trombay- Suphala 420000 MT 109 106 117
Trombay - 297000 MT 95 108 111Ammonia-V
5 Fertilizers & Chemicals Travancore Ltd. Ammonium 225000 MT 72.7 89.0 79.8Sulphate
Caprolactum 50000 MT 75.7 88.7 84.0
6 - Udyogamanadal complex NP 20:20 148500 MT 113.3 110.8 118.9
7 - Cochin Division NP 20:20 485000 MT 92.6 98.9 119.0
(MT - Metric Tonne)
� The National Fertilizers Ltd. produced 34.01 lakh MTof urea during 2011-12 as against the production of33.80lakh MT during the previous year.
� The Rashtriya Chemicals and Fertilizers Ltd. produced17.73 lakh MT Urea, 11.21lakh MT Ammonia and4.58 lakh tonne Suphaladuring the year 2011-12 asagainst 17.83 lakh MT Urea,11.35 lakh MT Ammoniaand 4.47 lakh tonne Suphala during the previous year.
� The Brahmaputra Valley Fertilizer Corporation Ltd.produced 2.79 lakh MT of urea during 2011-12 as againstthe production of 2.85lakh MT during the previous year.
� The Madras Fertilizers Ltd. produced 2.83lakh MTammonia, 4.87 lakh MT urea during 2011-12. Thecorresponding production figures for the previous yearwere 2.80 lakh MT ammonia, 4.79 lakh MT urea.
� The GAIL (India) Ltd. produced 10.49 lakh MT of LPGduring 2011-12 as against a production of 10.68 lakhMT during the previous year. It also produced 446000MT polymers as compared to 420358 MT in previousyear.
� During 2011-12, Hindustan Petroleum Corporation Ltd.achieved 16.19 MMT throughput as against 14.75 MMTin the previous year.
� MRPL has processed128.2 lakh MT of crude in 2011-12 as compared to 126.4 lakh MT in 2010-11.
� Bharat Petroleum Corporation Ltd. produced 22.9 MMTof Crude Processed during the year 2011-12 as comparedto 21.8 MMT during the previous year.
� Chennai Petroleum Corporation Ltd. achieved 10.56MMTPA of Crude through put during 2011-12 as against10.75 MMTPA in the previous year.
� The combined throughput by the seven refineries of theIndian Oil Corporation Ltd. during the year 2011-12 was55621.9 TMT as against the previous year's throughputof 52963.8 TMT.
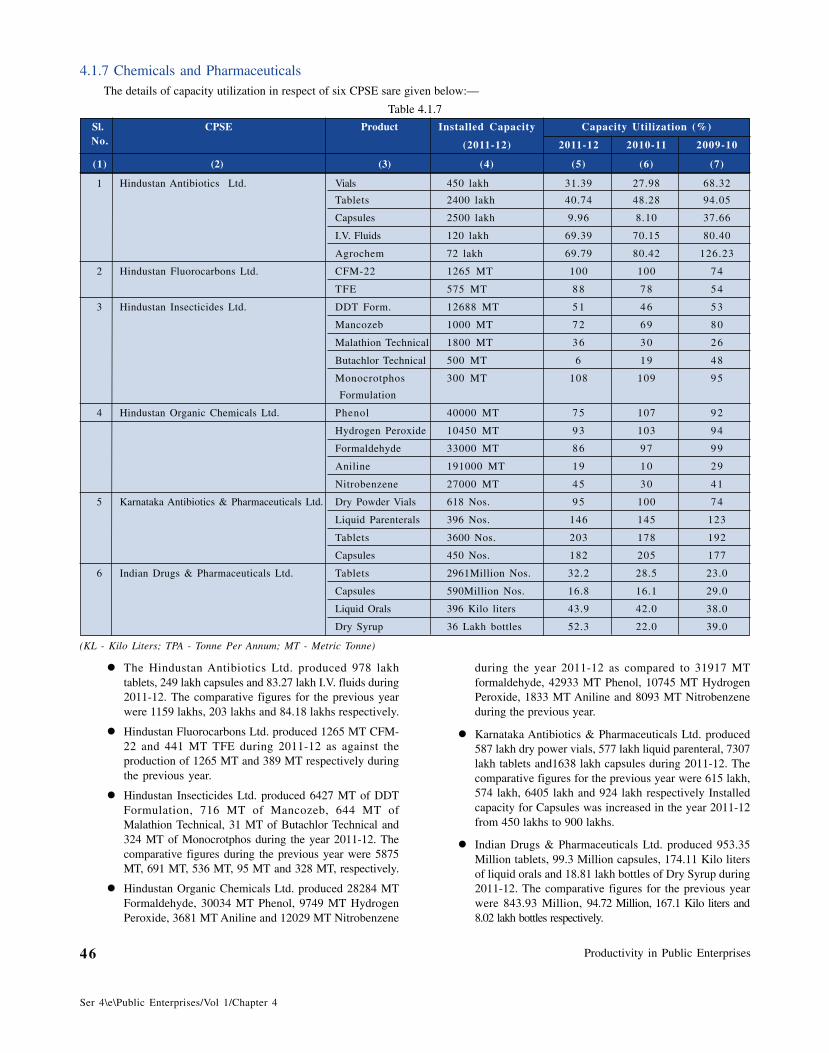
Productivity in Public Enterprises46
Ser 4\e\Public Enterprises/Vol 1/Chapter 4
4.1.7 Chemicals and PharmaceuticalsThe details of capacity utilization in respect of six CPSE sare given below:—
Table 4.1.7
Sl. CPSE Product Installed Capacity Capacity Utilization (%)No. (2011-12) 2011-12 2010-11 2009-10
(1) (2) (3) (4) (5) (6) (7)
1 Hindustan Antibiotics Ltd. Vials 450 lakh 31.39 27.98 68.32
Tablets 2400 lakh 40.74 48.28 94.05
Capsules 2500 lakh 9.96 8.10 37.66
I.V. Fluids 120 lakh 69.39 70.15 80.40
Agrochem 72 lakh 69.79 80.42 126.23
2 Hindustan Fluorocarbons Ltd. CFM-22 1265 MT 100 100 74
TFE 575 MT 88 78 54
3 Hindustan Insecticides Ltd. DDT Form. 12688 MT 51 46 53
Mancozeb 1000 MT 72 69 80
Malathion Technical 1800 MT 36 30 26
Butachlor Technical 500 MT 6 19 48
Monocrotphos 300 MT 108 109 95
Formulation
4 Hindustan Organic Chemicals Ltd. Phenol 40000 MT 75 107 92
Hydrogen Peroxide 10450 MT 93 103 94
Formaldehyde 33000 MT 86 97 99
Aniline 191000 MT 19 10 29
Nitrobenzene 27000 MT 45 30 41
5 Karnataka Antibiotics & Pharmaceuticals Ltd. Dry Powder Vials 618 Nos. 95 100 74
Liquid Parenterals 396 Nos. 146 145 123
Tablets 3600 Nos. 203 178 192
Capsules 450 Nos. 182 205 177
6 Indian Drugs & Pharmaceuticals Ltd. Tablets 2961Million Nos. 32.2 28.5 23.0
Capsules 590Million Nos. 16.8 16.1 29.0
Liquid Orals 396 Kilo liters 43.9 42.0 38.0
Dry Syrup 36 Lakh bottles 52.3 22.0 39.0
(KL - Kilo Liters; TPA - Tonne Per Annum; MT - Metric Tonne)
during the year 2011-12 as compared to 31917 MTformaldehyde, 42933 MT Phenol, 10745 MT HydrogenPeroxide, 1833 MT Aniline and 8093 MT Nitrobenzeneduring the previous year.
� Karnataka Antibiotics & Pharmaceuticals Ltd. produced587 lakh dry power vials, 577 lakh liquid parenteral, 7307lakh tablets and1638 lakh capsules during 2011-12. Thecomparative figures for the previous year were 615 lakh,574 lakh, 6405 lakh and 924 lakh respectively Installedcapacity for Capsules was increased in the year 2011-12from 450 lakhs to 900 lakhs.
� Indian Drugs & Pharmaceuticals Ltd. produced 953.35Million tablets, 99.3 Million capsules, 174.11 Kilo litersof liquid orals and 18.81 lakh bottles of Dry Syrup during2011-12. The comparative figures for the previous yearwere 843.93 Million, 94.72 Million, 167.1 Kilo liters and8.02 lakh bottles respectively.
� The Hindustan Antibiotics Ltd. produced 978 lakhtablets, 249 lakh capsules and 83.27 lakh I.V. fluids during2011-12. The comparative figures for the previous yearwere 1159 lakhs, 203 lakhs and 84.18 lakhs respectively.
� Hindustan Fluorocarbons Ltd. produced 1265 MT CFM-22 and 441 MT TFE during 2011-12 as against theproduction of 1265 MT and 389 MT respectively duringthe previous year.
� Hindustan Insecticides Ltd. produced 6427 MT of DDTFormulation, 716 MT of Mancozeb, 644 MT ofMalathion Technical, 31 MT of Butachlor Technical and324 MT of Monocrotphos during the year 2011-12. Thecomparative figures during the previous year were 5875MT, 691 MT, 536 MT, 95 MT and 328 MT, respectively.
� Hindustan Organic Chemicals Ltd. produced 28284 MTFormaldehyde, 30034 MT Phenol, 9749 MT HydrogenPeroxide, 3681 MT Aniline and 12029 MT Nitrobenzene
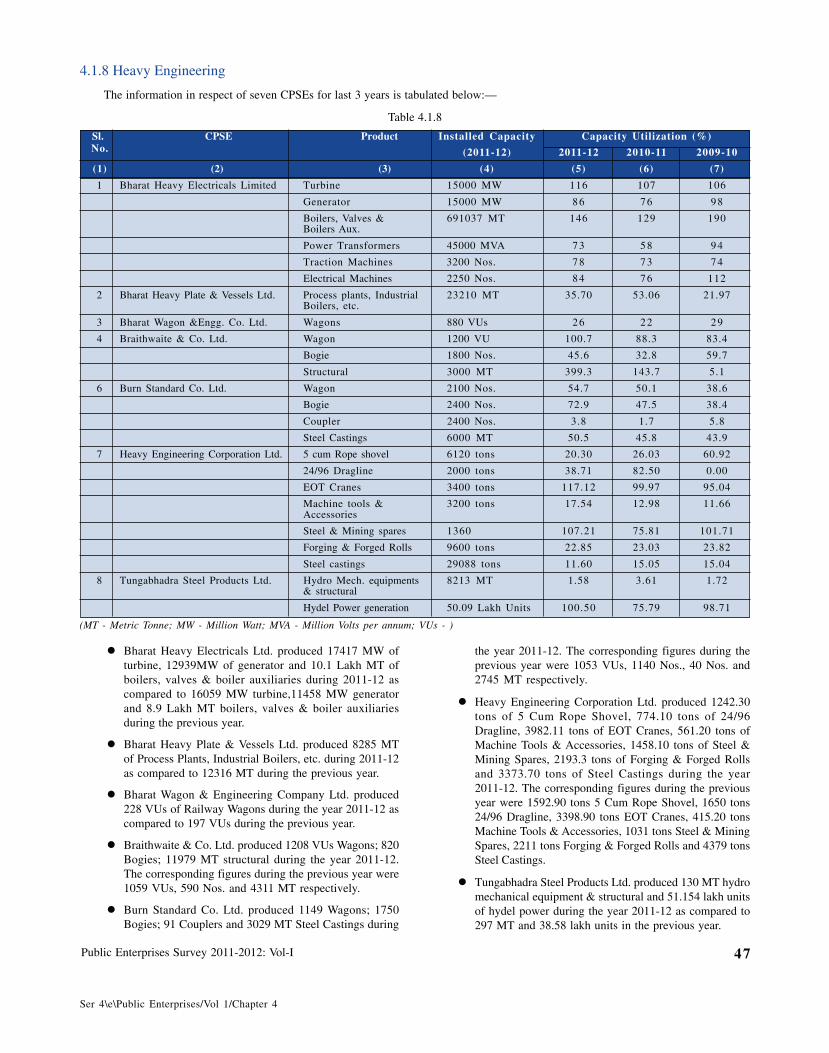
Public Enterprises Survey 2011-2012: Vol-I 47
Ser 4\e\Public Enterprises/Vol 1/Chapter 4
4.1.8 Heavy Engineering
The information in respect of seven CPSEs for last 3 years is tabulated below:—
Table 4.1.8
Sl. CPSE Product Installed Capacity Capacity Utilization (%)No. (2011-12) 2011-12 2010-11 2009-10
(1) (2) (3) (4) (5) (6) (7)
1 Bharat Heavy Electricals Limited Turbine 15000 MW 116 107 106
Generator 15000 MW 86 76 98
Boilers, Valves & 691037 MT 146 129 190Boilers Aux.
Power Transformers 45000 MVA 73 58 94
Traction Machines 3200 Nos. 78 73 74
Electrical Machines 2250 Nos. 84 76 112
2 Bharat Heavy Plate & Vessels Ltd. Process plants, Industrial 23210 MT 35.70 53.06 21.97Boilers, etc.
3 Bharat Wagon &Engg. Co. Ltd. Wagons 880 VUs 26 22 29
4 Braithwaite & Co. Ltd. Wagon 1200 VU 100.7 88.3 83.4
Bogie 1800 Nos. 45.6 32.8 59.7
Structural 3000 MT 399.3 143.7 5.1
6 Burn Standard Co. Ltd. Wagon 2100 Nos. 54.7 50.1 38.6
Bogie 2400 Nos. 72.9 47.5 38.4
Coupler 2400 Nos. 3.8 1.7 5.8
Steel Castings 6000 MT 50.5 45.8 43.9
7 Heavy Engineering Corporation Ltd. 5 cum Rope shovel 6120 tons 20.30 26.03 60.92
24/96 Dragline 2000 tons 38.71 82.50 0.00
EOT Cranes 3400 tons 117.12 99.97 95.04
Machine tools & 3200 tons 17.54 12.98 11.66Accessories
Steel & Mining spares 1360 107.21 75.81 101.71
Forging & Forged Rolls 9600 tons 22.85 23.03 23.82
Steel castings 29088 tons 11.60 15.05 15.04
8 Tungabhadra Steel Products Ltd. Hydro Mech. equipments 8213 MT 1.58 3.61 1.72& structural
Hydel Power generation 50.09 Lakh Units 100.50 75.79 98.71
(MT - Metric Tonne; MW - Million Watt; MVA - Million Volts per annum; VUs - )
the year 2011-12. The corresponding figures during theprevious year were 1053 VUs, 1140 Nos., 40 Nos. and2745 MT respectively.
� Heavy Engineering Corporation Ltd. produced 1242.30tons of 5 Cum Rope Shovel, 774.10 tons of 24/96Dragline, 3982.11 tons of EOT Cranes, 561.20 tons ofMachine Tools & Accessories, 1458.10 tons of Steel &Mining Spares, 2193.3 tons of Forging & Forged Rollsand 3373.70 tons of Steel Castings during the year2011-12. The corresponding figures during the previousyear were 1592.90 tons 5 Cum Rope Shovel, 1650 tons24/96 Dragline, 3398.90 tons EOT Cranes, 415.20 tonsMachine Tools & Accessories, 1031 tons Steel & MiningSpares, 2211 tons Forging & Forged Rolls and 4379 tonsSteel Castings.
� Tungabhadra Steel Products Ltd. produced 130 MT hydromechanical equipment & structural and 51.154 lakh unitsof hydel power during the year 2011-12 as compared to297 MT and 38.58 lakh units in the previous year.
� Bharat Heavy Electricals Ltd. produced 17417 MW ofturbine, 12939MW of generator and 10.1 Lakh MT ofboilers, valves & boiler auxiliaries during 2011-12 ascompared to 16059 MW turbine,11458 MW generatorand 8.9 Lakh MT boilers, valves & boiler auxiliariesduring the previous year.
� Bharat Heavy Plate & Vessels Ltd. produced 8285 MTof Process Plants, Industrial Boilers, etc. during 2011-12as compared to 12316 MT during the previous year.
� Bharat Wagon & Engineering Company Ltd. produced228 VUs of Railway Wagons during the year 2011-12 ascompared to 197 VUs during the previous year.
� Braithwaite & Co. Ltd. produced 1208 VUs Wagons; 820Bogies; 11979 MT structural during the year 2011-12.The corresponding figures during the previous year were1059 VUs, 590 Nos. and 4311 MT respectively.
� Burn Standard Co. Ltd. produced 1149 Wagons; 1750Bogies; 91 Couplers and 3029 MT Steel Castings during
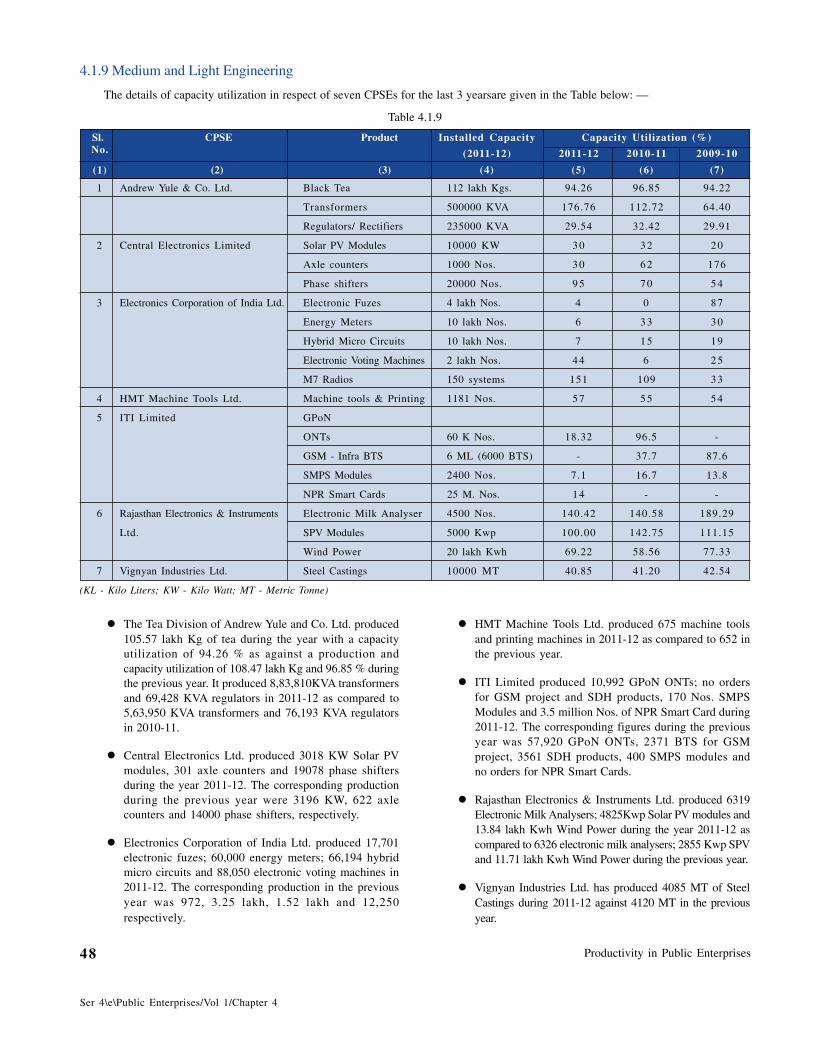
Productivity in Public Enterprises48
Ser 4\e\Public Enterprises/Vol 1/Chapter 4
4.1.9 Medium and Light Engineering
The details of capacity utilization in respect of seven CPSEs for the last 3 yearsare given in the Table below: —
Table 4.1.9
Sl. CPSE Product Installed Capacity Capacity Utilization (%)No. (2011-12) 2011-12 2010-11 2009-10
(1) (2) (3) (4) (5) (6) (7)
1 Andrew Yule & Co. Ltd. Black Tea 112 lakh Kgs. 94.26 96.85 94.22
Transformers 500000 KVA 176.76 112.72 64.40
Regulators/ Rectifiers 235000 KVA 29.54 32.42 29.91
2 Central Electronics Limited Solar PV Modules 10000 KW 30 32 20
Axle counters 1000 Nos. 30 62 176
Phase shifters 20000 Nos. 95 70 54
3 Electronics Corporation of India Ltd. Electronic Fuzes 4 lakh Nos. 4 0 87
Energy Meters 10 lakh Nos. 6 33 30
Hybrid Micro Circuits 10 lakh Nos. 7 15 19
Electronic Voting Machines 2 lakh Nos. 44 6 25
M7 Radios 150 systems 151 109 33
4 HMT Machine Tools Ltd. Machine tools & Printing 1181 Nos. 57 55 54
5 ITI Limited GPoN
ONTs 60 K Nos. 18.32 96.5 -
GSM - Infra BTS 6 ML (6000 BTS) - 37.7 87.6
SMPS Modules 2400 Nos. 7.1 16.7 13.8
NPR Smart Cards 25 M. Nos. 14 - -
6 Rajasthan Electronics & Instruments Electronic Milk Analyser 4500 Nos. 140.42 140.58 189.29
Ltd. SPV Modules 5000 Kwp 100.00 142.75 111.15
Wind Power 20 lakh Kwh 69.22 58.56 77.33
7 Vignyan Industries Ltd. Steel Castings 10000 MT 40.85 41.20 42.54
(KL - Kilo Liters; KW - Kilo Watt; MT - Metric Tonne)
� HMT Machine Tools Ltd. produced 675 machine toolsand printing machines in 2011-12 as compared to 652 inthe previous year.
� ITI Limited produced 10,992 GPoN ONTs; no ordersfor GSM project and SDH products, 170 Nos. SMPSModules and 3.5 million Nos. of NPR Smart Card during2011-12. The corresponding figures during the previousyear was 57,920 GPoN ONTs, 2371 BTS for GSMproject, 3561 SDH products, 400 SMPS modules andno orders for NPR Smart Cards.
� Rajasthan Electronics & Instruments Ltd. produced 6319Electronic Milk Analysers; 4825Kwp Solar PV modules and13.84 lakh Kwh Wind Power during the year 2011-12 ascompared to 6326 electronic milk analysers; 2855 Kwp SPVand 11.71 lakh Kwh Wind Power during the previous year.
� Vignyan Industries Ltd. has produced 4085 MT of SteelCastings during 2011-12 against 4120 MT in the previousyear.
� The Tea Division of Andrew Yule and Co. Ltd. produced105.57 lakh Kg of tea during the year with a capacityutilization of 94.26 % as against a production andcapacity utilization of 108.47 lakh Kg and 96.85 % duringthe previous year. It produced 8,83,810KVA transformersand 69,428 KVA regulators in 2011-12 as compared to5,63,950 KVA transformers and 76,193 KVA regulatorsin 2010-11.
� Central Electronics Ltd. produced 3018 KW Solar PVmodules, 301 axle counters and 19078 phase shiftersduring the year 2011-12. The corresponding productionduring the previous year were 3196 KW, 622 axlecounters and 14000 phase shifters, respectively.
� Electronics Corporation of India Ltd. produced 17,701electronic fuzes; 60,000 energy meters; 66,194 hybridmicro circuits and 88,050 electronic voting machines in2011-12. The corresponding production in the previousyear was 972, 3.25 lakh, 1.52 lakh and 12,250respectively.
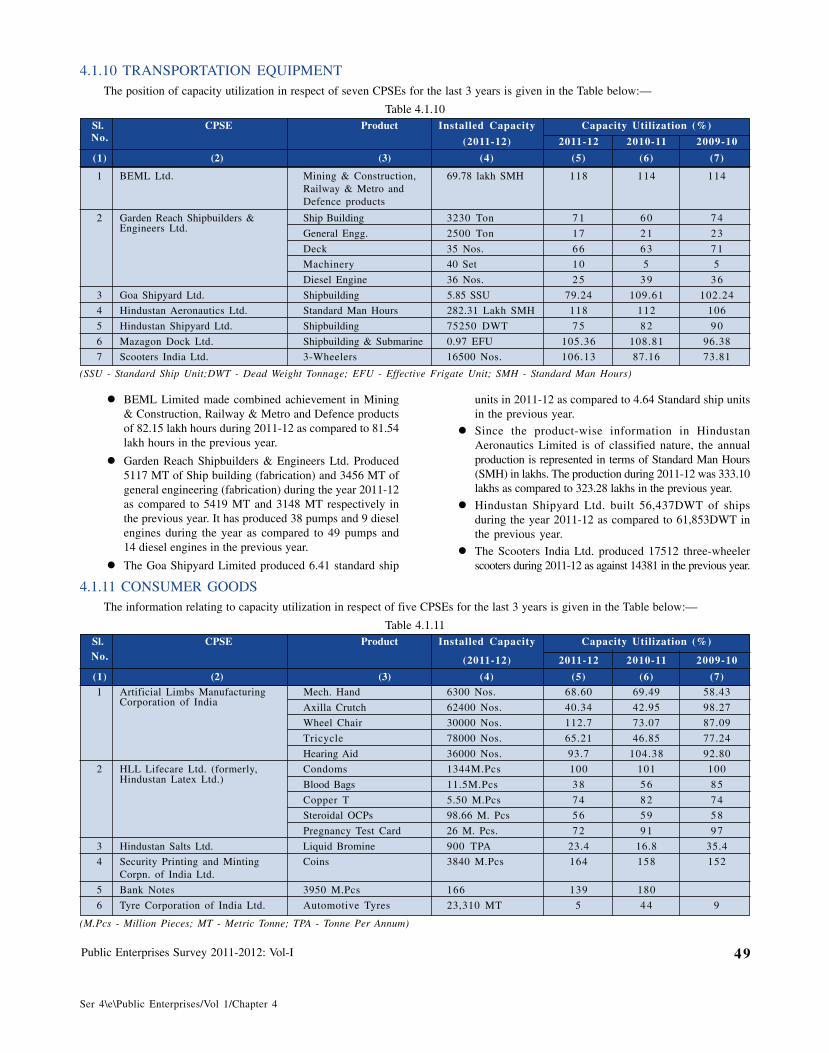
Public Enterprises Survey 2011-2012: Vol-I 49
Ser 4\e\Public Enterprises/Vol 1/Chapter 4
4.1.10 TRANSPORTATION EQUIPMENTThe position of capacity utilization in respect of seven CPSEs for the last 3 years is given in the Table below:—
Table 4.1.10 Sl. CPSE Product Installed Capacity Capacity Utilization (%)
No. (2011-12) 2011-12 2010-11 2009-10
(1) (2) (3) (4) (5) (6) (7)
1 BEML Ltd. Mining & Construction, 69.78 lakh SMH 118 114 114Railway & Metro andDefence products
2 Garden Reach Shipbuilders & Ship Building 3230 Ton 71 60 74Engineers Ltd. General Engg. 2500 Ton 17 21 23
Deck 35 Nos. 66 63 71
Machinery 40 Set 10 5 5
Diesel Engine 36 Nos. 25 39 36
3 Goa Shipyard Ltd. Shipbuilding 5.85 SSU 79.24 109.61 102.24
4 Hindustan Aeronautics Ltd. Standard Man Hours 282.31 Lakh SMH 118 112 106
5 Hindustan Shipyard Ltd. Shipbuilding 75250 DWT 75 82 90
6 Mazagon Dock Ltd. Shipbuilding & Submarine 0.97 EFU 105.36 108.81 96.38
7 Scooters India Ltd. 3-Wheelers 16500 Nos. 106.13 87.16 73.81
(SSU - Standard Ship Unit;DWT - Dead Weight Tonnage; EFU - Effective Frigate Unit; SMH - Standard Man Hours)
units in 2011-12 as compared to 4.64 Standard ship unitsin the previous year.
� Since the product-wise information in HindustanAeronautics Limited is of classified nature, the annualproduction is represented in terms of Standard Man Hours(SMH) in lakhs. The production during 2011-12 was 333.10lakhs as compared to 323.28 lakhs in the previous year.
� Hindustan Shipyard Ltd. built 56,437DWT of shipsduring the year 2011-12 as compared to 61,853DWT inthe previous year.
� The Scooters India Ltd. produced 17512 three-wheelerscooters during 2011-12 as against 14381 in the previous year.
� BEML Limited made combined achievement in Mining& Construction, Railway & Metro and Defence productsof 82.15 lakh hours during 2011-12 as compared to 81.54lakh hours in the previous year.
� Garden Reach Shipbuilders & Engineers Ltd. Produced5117 MT of Ship building (fabrication) and 3456 MT ofgeneral engineering (fabrication) during the year 2011-12as compared to 5419 MT and 3148 MT respectively inthe previous year. It has produced 38 pumps and 9 dieselengines during the year as compared to 49 pumps and14 diesel engines in the previous year.
� The Goa Shipyard Limited produced 6.41 standard ship
4.1.11 CONSUMER GOODSThe information relating to capacity utilization in respect of five CPSEs for the last 3 years is given in the Table below:—
Table 4.1.11 Sl. CPSE Product Installed Capacity Capacity Utilization (%)
No. (2011-12) 2011-12 2010-11 2009-10
(1) (2) (3) (4) (5) (6) (7)1 Artificial Limbs Manufacturing Mech. Hand 6300 Nos. 68.60 69.49 58.43
Corporation of India Axilla Crutch 62400 Nos. 40.34 42.95 98.27
Wheel Chair 30000 Nos. 112.7 73.07 87.09
Tricycle 78000 Nos. 65.21 46.85 77.24
Hearing Aid 36000 Nos. 93.7 104.38 92.80
2 HLL Lifecare Ltd. (formerly, Condoms 1344M.Pcs 100 101 100Hindustan Latex Ltd.) Blood Bags 11.5M.Pcs 38 56 85
Copper T 5.50 M.Pcs 74 82 74
Steroidal OCPs 98.66 M. Pcs 56 59 58
Pregnancy Test Card 26 M. Pcs. 72 91 97
3 Hindustan Salts Ltd. Liquid Bromine 900 TPA 23.4 16.8 35.4
4 Security Printing and Minting Coins 3840 M.Pcs 164 158 152Corpn. of India Ltd.
5 Bank Notes 3950 M.Pcs 166 139 180
6 Tyre Corporation of India Ltd. Automotive Tyres 23,310 MT 5 44 9
(M.Pcs - Million Pieces; MT - Metric Tonne; TPA - Tonne Per Annum)

Productivity in Public Enterprises50
Ser 4\e\Public Enterprises/Vol 1/Chapter 4
4.1.12 CRUDE OILInformation relating to production in respect of two CPSEs for the last 3 years is given in the Table below:—
Table 4.1.12 Sl. CPSE Product Installed Capacity Capacity Utilization (%)
No. (2011-12) 2011-12 2010-11 2009-10
(1) (2) (3) (4) (5) (6) (7)
1 Oil and Natural Gas Corporation Ltd. Crude Oil MMT 26.93 27.28 26.46
Natural Gas BCM 25.51 25.32 25.59
2 Oil India Ltd. Crude Oil MMT 3.842 3.580 4.061
Natural Gas MSCM 2472 2178 2233
LPG M T 51978 45004 44945
(MMT - Million Metric Tonne; BCM - Billion Cubic Metre; KL - Kilo Litre; MSCM - Million Standard Cubic Metre; MT - Metric Tonne)
4.2 INVENTORY MANAGEMENTMaterials management plays a significant role in improving the
operational efficiency and profitability of an enterprise. It helps inachieving higher return on investment by minimizing locked up workingcapital and also in improving the cash flow and liquidity position.Materials management, therefore, requires to be given adequateimportance in the present context where the thrust is on performanceimprovement. An attempt has been made in the paragraphs below topresent an overview of inventory position in CPSEs during the various
years, cognate group-wise and company-wise.
4.2.1 Overall AnalysisThe materials management in public enterprises has improved
over the years. The inventory level, which was 72 days cost ofproduction/turnover as on 31.3.1997 has declined to 50 days cost ofproduction/turnover as on 31.3.2012.
The overall position vis-a-vis inventory management, duringthe last 16 years, is shown in the Table 4.2.1 below:—
Table 4.2.1
Year ending Value of Inventory Cost of Production/ Level of Inventory (in No. of(` in crore) Turnover (` in crore) days Cost of Production/
Turnover)
31.3.1997 40815 206658 72
31.3.1998 41661 218940 69
31.3.1999 44404 278720 58
31.3.2000 52414 354446 54
31.3.2001 50717 425100 44
31.3.2002 52175 431362 44
31.3.2003 58282 466444 46
31.3.2004 59705 513334 42
31.3.2005 73642 626427 43
31.3.2006 90885 714841 46
31.3.2007 101527 836922 44
31.3.2008 128688 958346 49
31.3.2009 126327 1147734 40
31.3.2010 161798 1087601 54
31.3.2011 191754 1293759 54
31.3.2012 220362 1605205 50
produced 6282.40 Million pieces of Coins and 6541.41Million pieces of Bank Notes during the year 2011-12as compared to 6070.15 Million pieces of Coins and 5472Million pieces of Bank Notes during the previous year.
� Tyre Corporation of India Ltd. is doing 100% Jobbingwork. Production is based on availability of jobbing work.Production of own brand tyres discontinued from1.4.2002. Due to increase of Plant capacity by thejobbers and change in the market demand pattern forBIAS tyres, there is no outsourcing of tyres by majortyre manufacturers. Thus TCIL have no scope to increasecapacity utilization.
� Artificial Limbs Manufacturing Corporation of Indiaproduced 4322 Nos. Mechanical Hands, 25171 Nos.Axilla Crutch, 33813 Nos.Wheel Chairs, 50867nos.Tricycles and 33732 Nos. Hearing Aids in 2011-12.The corresponding figures for the previous year were4378, 26800, 21921, 36540 and 26305 respectively.
� HLL Lifecare Ltd. (formerly Hindustan Latex Ltd.)produced 1349 million pieces of condoms during the year2011-12 as compared to 1328 million pieces in theprevious year.
� Security Printing and Minting Corporation of India Ltd.
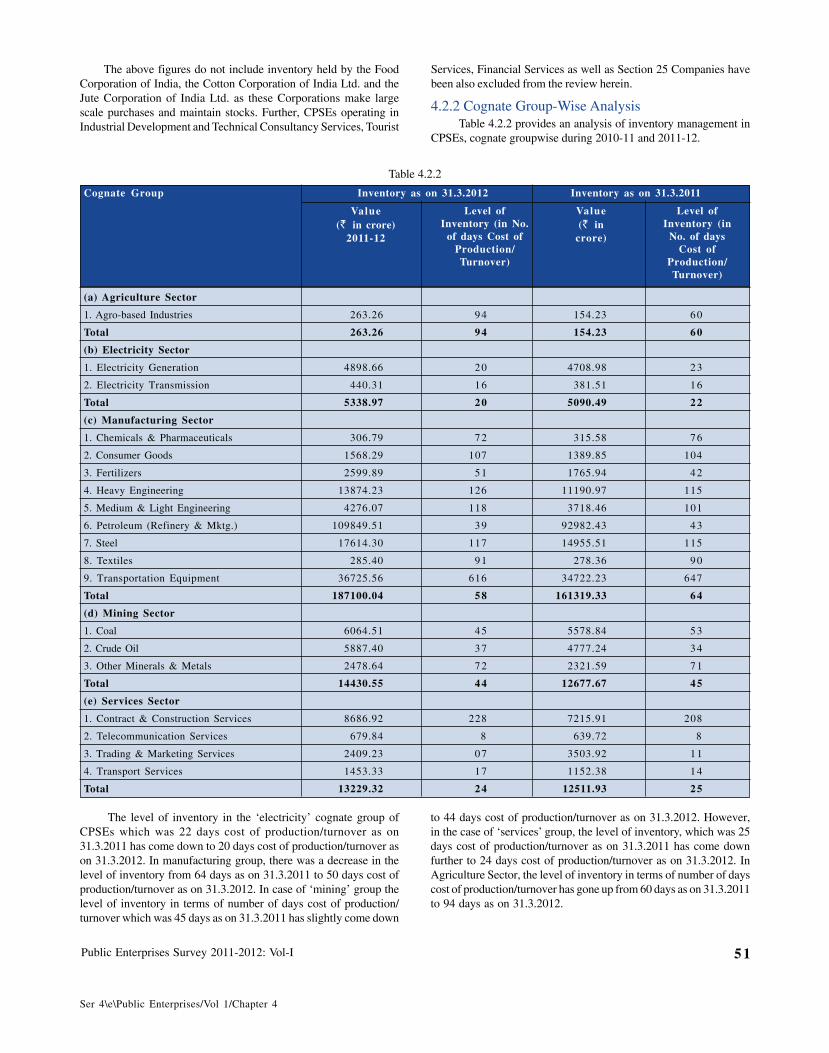
Public Enterprises Survey 2011-2012: Vol-I 51
Ser 4\e\Public Enterprises/Vol 1/Chapter 4
The above figures do not include inventory held by the FoodCorporation of India, the Cotton Corporation of India Ltd. and theJute Corporation of India Ltd. as these Corporations make largescale purchases and maintain stocks. Further, CPSEs operating inIndustrial Development and Technical Consultancy Services, Tourist
Services, Financial Services as well as Section 25 Companies havebeen also excluded from the review herein.
4.2.2 Cognate Group-Wise AnalysisTable 4.2.2 provides an analysis of inventory management in
CPSEs, cognate groupwise during 2010-11 and 2011-12.
Table 4.2.2
Cognate Group Inventory as on 31.3.2012 Inventory as on 31.3.2011
Value(` in crore)
2011-12
(a) Agriculture Sector
1. Agro-based Industries 263.26 94 154.23 60
Total 263.26 94 154.23 60
(b) Electricity Sector
1. Electricity Generation 4898.66 20 4708.98 23
2. Electricity Transmission 440.31 16 381.51 16
Total 5338.97 20 5090.49 22
(c) Manufacturing Sector
1. Chemicals & Pharmaceuticals 306.79 72 315.58 76
2. Consumer Goods 1568.29 107 1389.85 104
3. Fertilizers 2599.89 51 1765.94 42
4. Heavy Engineering 13874.23 126 11190.97 115
5. Medium & Light Engineering 4276.07 118 3718.46 101
6. Petroleum (Refinery & Mktg.) 109849.51 39 92982.43 43
7. Steel 17614.30 117 14955.51 115
8. Textiles 285.40 91 278.36 90
9. Transportation Equipment 36725.56 616 34722.23 647
Total 187100.04 58 161319.33 64
(d) Mining Sector
1. Coal 6064.51 45 5578.84 53
2. Crude Oil 5887.40 37 4777.24 34
3. Other Minerals & Metals 2478.64 72 2321.59 71
Total 14430.55 44 12677.67 45
(e) Services Sector
1. Contract & Construction Services 8686.92 228 7215.91 208
2. Telecommunication Services 679.84 8 639.72 8
3. Trading & Marketing Services 2409.23 07 3503.92 11
4. Transport Services 1453.33 17 1152.38 14
Total 13229.32 24 12511.93 25
Level ofInventory (in No.
of days Cost ofProduction/Turnover)
Value(` in
crore)
Level ofInventory (in
No. of daysCost of
Production/Turnover)
The level of inventory in the ‘electricity’ cognate group ofCPSEs which was 22 days cost of production/turnover as on31.3.2011 has come down to 20 days cost of production/turnover ason 31.3.2012. In manufacturing group, there was a decrease in thelevel of inventory from 64 days as on 31.3.2011 to 50 days cost ofproduction/turnover as on 31.3.2012. In case of ‘mining’ group thelevel of inventory in terms of number of days cost of production/turnover which was 45 days as on 31.3.2011 has slightly come down
to 44 days cost of production/turnover as on 31.3.2012. However,in the case of ‘services’ group, the level of inventory, which was 25days cost of production/turnover as on 31.3.2011 has come downfurther to 24 days cost of production/turnover as on 31.3.2012. InAgriculture Sector, the level of inventory in terms of number of dayscost of production/turnover has gone up from 60 days as on 31.3.2011to 94 days as on 31.3.2012.
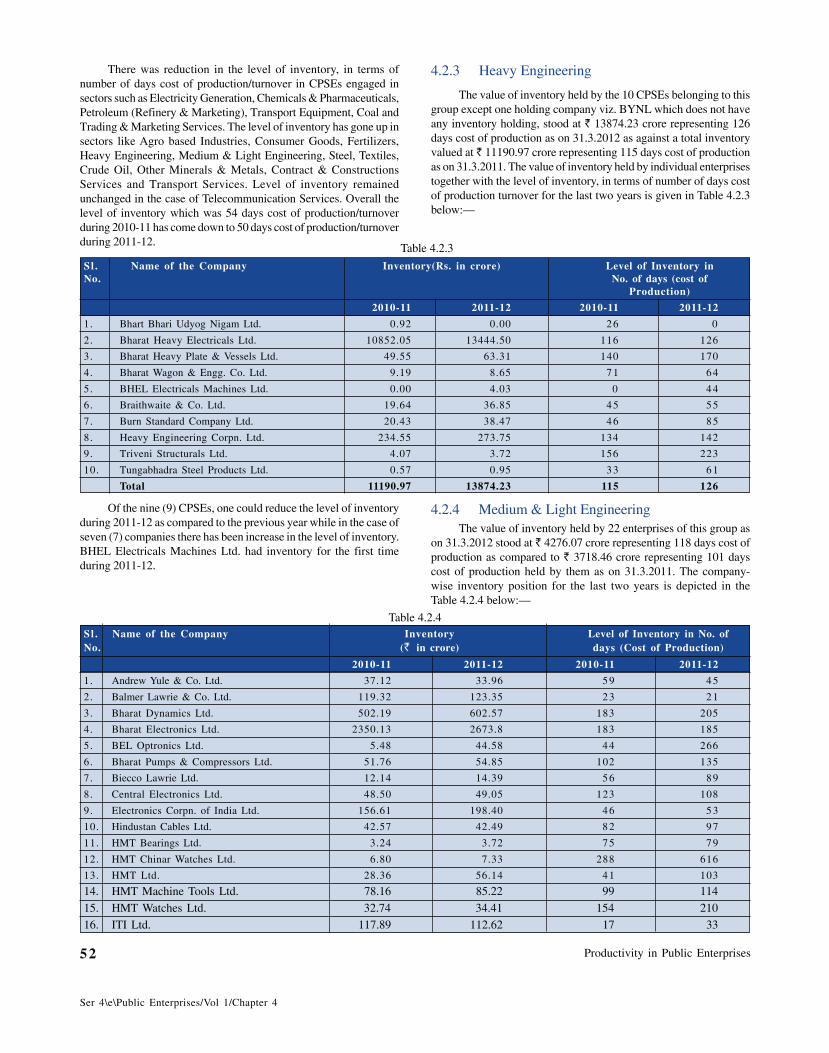
Productivity in Public Enterprises52
Ser 4\e\Public Enterprises/Vol 1/Chapter 4
There was reduction in the level of inventory, in terms ofnumber of days cost of production/turnover in CPSEs engaged insectors such as Electricity Generation, Chemicals & Pharmaceuticals,Petroleum (Refinery & Marketing), Transport Equipment, Coal andTrading & Marketing Services. The level of inventory has gone up insectors like Agro based Industries, Consumer Goods, Fertilizers,Heavy Engineering, Medium & Light Engineering, Steel, Textiles,Crude Oil, Other Minerals & Metals, Contract & ConstructionsServices and Transport Services. Level of inventory remainedunchanged in the case of Telecommunication Services. Overall thelevel of inventory which was 54 days cost of production/turnoverduring 2010-11 has come down to 50 days cost of production/turnoverduring 2011-12.
4.2.3 Heavy Engineering
The value of inventory held by the 10 CPSEs belonging to thisgroup except one holding company viz. BYNL which does not haveany inventory holding, stood at ` 13874.23 crore representing 126days cost of production as on 31.3.2012 as against a total inventoryvalued at ` 11190.97 crore representing 115 days cost of productionas on 31.3.2011. The value of inventory held by individual enterprisestogether with the level of inventory, in terms of number of days costof production turnover for the last two years is given in Table 4.2.3below:—
Of the nine (9) CPSEs, one could reduce the level of inventoryduring 2011-12 as compared to the previous year while in the case ofseven (7) companies there has been increase in the level of inventory.BHEL Electricals Machines Ltd. had inventory for the first timeduring 2011-12.
4.2.4 Medium & Light EngineeringThe value of inventory held by 22 enterprises of this group as
on 31.3.2012 stood at ` 4276.07 crore representing 118 days cost ofproduction as compared to ` 3718.46 crore representing 101 dayscost of production held by them as on 31.3.2011. The company-wise inventory position for the last two years is depicted in theTable 4.2.4 below:—
Table 4.2.4Sl . Name of the Company Inventory Level of Inventory in No. ofNo. (` in crore) days (Cost of Production)
2010-11 2011-12 2010-11 2011-12
1. Andrew Yule & Co. Ltd. 37.12 33.96 59 45
2. Balmer Lawrie & Co. Ltd. 119.32 123.35 23 21
3. Bharat Dynamics Ltd. 502.19 602.57 183 205
4. Bharat Electronics Ltd. 2350.13 2673.8 183 185
5. BEL Optronics Ltd. 5.48 44.58 44 266
6. Bharat Pumps & Compressors Ltd. 51.76 54.85 102 135
7. Biecco Lawrie Ltd. 12.14 14.39 56 89
8. Central Electronics Ltd. 48.50 49.05 123 108
9. Electronics Corpn. of India Ltd. 156.61 198.40 46 53
10. Hindustan Cables Ltd. 42.57 42.49 82 97
11. HMT Bearings Ltd. 3.24 3.72 75 79
12. HMT Chinar Watches Ltd. 6.80 7.33 288 616
13. HMT Ltd. 28.36 56.14 41 103
14. HMT Machine Tools Ltd. 78.16 85.22 99 114
15. HMT Watches Ltd. 32.74 34.41 154 210
16. ITI Ltd. 117.89 112.62 17 33
Table 4.2.3
Sl . Name of the Company Inventory(Rs. in crore) Level of Inventory inNo. No. of days (cost of
Production)
2010-11 2011-12 2010-11 2011-12
1. Bhart Bhari Udyog Nigam Ltd. 0.92 0.00 26 0
2. Bharat Heavy Electricals Ltd. 10852.05 13444.50 116 126
3. Bharat Heavy Plate & Vessels Ltd. 49.55 63.31 140 170
4. Bharat Wagon & Engg. Co. Ltd. 9.19 8.65 71 64
5. BHEL Electricals Machines Ltd. 0.00 4.03 0 44
6. Braithwaite & Co. Ltd. 19.64 36.85 45 55
7. Burn Standard Company Ltd. 20.43 38.47 46 85
8. Heavy Engineering Corpn. Ltd. 234.55 273.75 134 142
9. Triveni Structurals Ltd. 4.07 3.72 156 223
10. Tungabhadra Steel Products Ltd. 0.57 0.95 33 61
Total 11190.97 13874.23 115 126
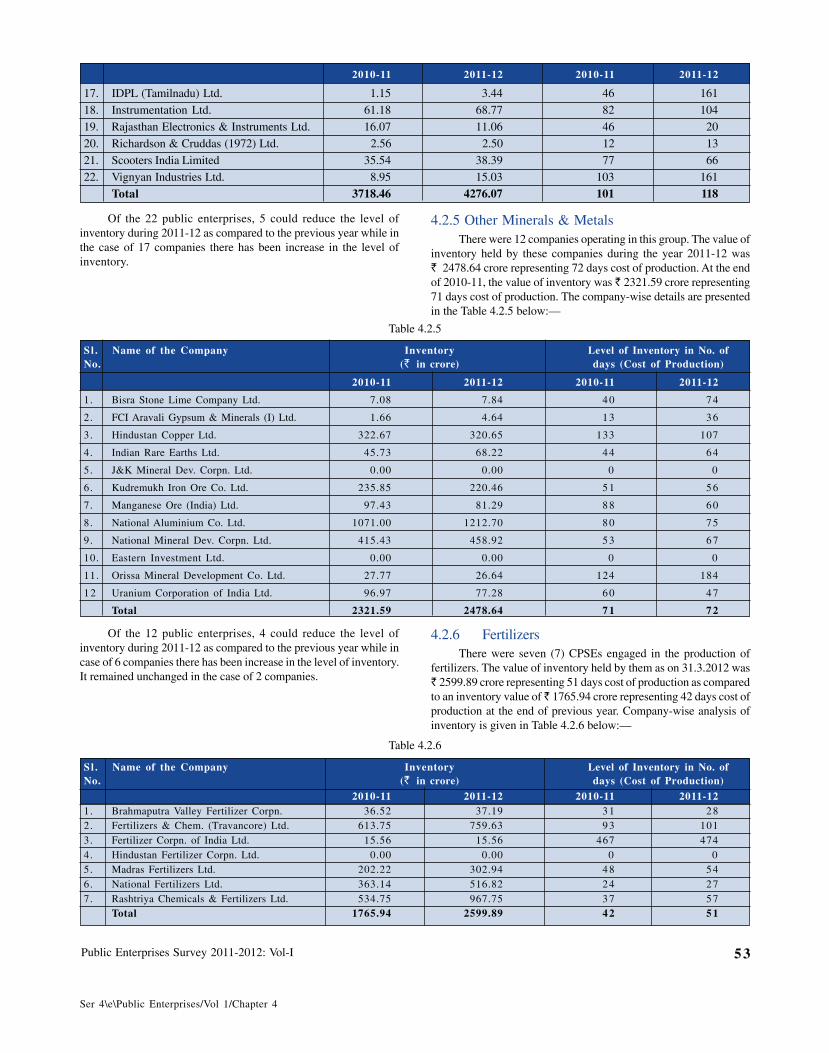
Public Enterprises Survey 2011-2012: Vol-I 53
Ser 4\e\Public Enterprises/Vol 1/Chapter 4
Of the 22 public enterprises, 5 could reduce the level ofinventory during 2011-12 as compared to the previous year while inthe case of 17 companies there has been increase in the level ofinventory.
4.2.5 Other Minerals & MetalsThere were 12 companies operating in this group. The value of
inventory held by these companies during the year 2011-12 was` 2478.64 crore representing 72 days cost of production. At the endof 2010-11, the value of inventory was ` 2321.59 crore representing71 days cost of production. The company-wise details are presentedin the Table 4.2.5 below:—
Table 4.2.5
Sl . Name of the Company Inventory Level of Inventory in No. ofNo. (` in crore) days (Cost of Production)
2010-11 2011-12 2010-11 2011-12
1. Bisra Stone Lime Company Ltd. 7.08 7.84 40 74
2. FCI Aravali Gypsum & Minerals (I) Ltd. 1.66 4.64 13 36
3. Hindustan Copper Ltd. 322.67 320.65 133 107
4. Indian Rare Earths Ltd. 45.73 68.22 44 64
5. J&K Mineral Dev. Corpn. Ltd. 0.00 0.00 0 0
6. Kudremukh Iron Ore Co. Ltd. 235.85 220.46 51 56
7. Manganese Ore (India) Ltd. 97.43 81.29 88 60
8. National Aluminium Co. Ltd. 1071.00 1212.70 80 75
9. National Mineral Dev. Corpn. Ltd. 415.43 458.92 53 67
10. Eastern Investment Ltd. 0.00 0.00 0 0
11. Orissa Mineral Development Co. Ltd. 27.77 26.64 124 184
12 Uranium Corporation of India Ltd. 96.97 77.28 60 47
Total 2321.59 2478.64 71 72
Of the 12 public enterprises, 4 could reduce the level ofinventory during 2011-12 as compared to the previous year while incase of 6 companies there has been increase in the level of inventory.It remained unchanged in the case of 2 companies.
4.2.6 FertilizersThere were seven (7) CPSEs engaged in the production of
fertilizers. The value of inventory held by them as on 31.3.2012 was` 2599.89 crore representing 51 days cost of production as comparedto an inventory value of ̀ 1765.94 crore representing 42 days cost ofproduction at the end of previous year. Company-wise analysis ofinventory is given in Table 4.2.6 below:—
17. IDPL (Tamilnadu) Ltd. 1.15 3.44 46 161
18. Instrumentation Ltd. 61.18 68.77 82 104
19. Rajasthan Electronics & Instruments Ltd. 16.07 11.06 46 20
20. Richardson & Cruddas (1972) Ltd. 2.56 2.50 12 13
21. Scooters India Limited 35.54 38.39 77 66
22. Vignyan Industries Ltd. 8.95 15.03 103 161
Total 3718.46 4276.07 101 118
Table 4.2.6
Sl . Name of the Company Inventory Level of Inventory in No. ofNo. (` in crore) days (Cost of Production)
2010-11 2011-12 2010-11 2011-121. Brahmaputra Valley Fertilizer Corpn. 36.52 37.19 31 282. Fertilizers & Chem. (Travancore) Ltd. 613.75 759.63 93 1013. Fertilizer Corpn. of India Ltd. 15.56 15.56 467 4744. Hindustan Fertilizer Corpn. Ltd. 0.00 0.00 0 05. Madras Fertilizers Ltd. 202.22 302.94 48 546. National Fertilizers Ltd. 363.14 516.82 24 277. Rashtriya Chemicals & Fertilizers Ltd. 534.75 967.75 37 57
Total 1765.94 2599.89 42 51
2010-11 2011-12 2010-11 2011-12
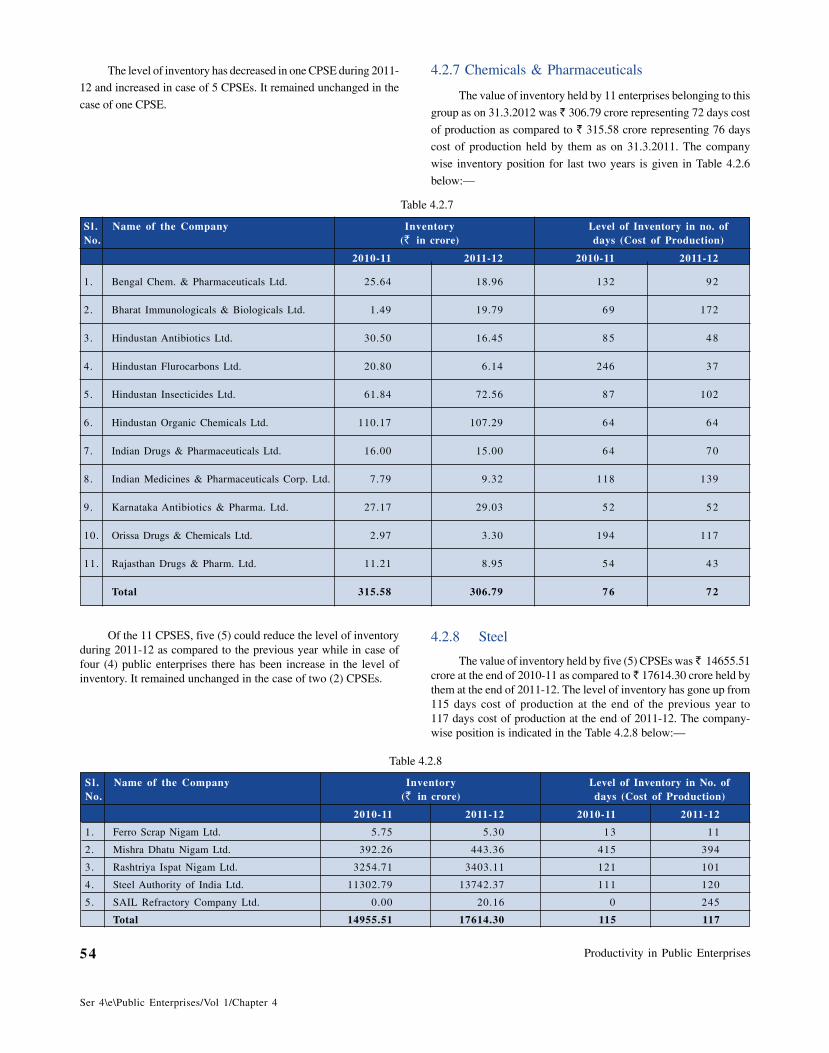
Productivity in Public Enterprises54
Ser 4\e\Public Enterprises/Vol 1/Chapter 4
The level of inventory has decreased in one CPSE during 2011-
12 and increased in case of 5 CPSEs. It remained unchanged in the
case of one CPSE.
4.2.7 Chemicals & Pharmaceuticals
The value of inventory held by 11 enterprises belonging to this
group as on 31.3.2012 was ` 306.79 crore representing 72 days cost
of production as compared to ` 315.58 crore representing 76 days
cost of production held by them as on 31.3.2011. The company
wise inventory position for last two years is given in Table 4.2.6
below:—
Table 4.2.7
Sl . Name of the Company Inventory Level of Inventory in no. ofNo. (` in crore) days (Cost of Production)
2010-11 2011-12 2010-11 2011-12
1. Bengal Chem. & Pharmaceuticals Ltd. 25.64 18.96 132 92
2. Bharat Immunologicals & Biologicals Ltd. 1.49 19.79 69 172
3. Hindustan Antibiotics Ltd. 30.50 16.45 85 48
4. Hindustan Flurocarbons Ltd. 20.80 6.14 246 37
5. Hindustan Insecticides Ltd. 61.84 72.56 87 102
6. Hindustan Organic Chemicals Ltd. 110.17 107.29 64 64
7. Indian Drugs & Pharmaceuticals Ltd. 16.00 15.00 64 70
8. Indian Medicines & Pharmaceuticals Corp. Ltd. 7.79 9.32 118 139
9. Karnataka Antibiotics & Pharma. Ltd. 27.17 29.03 52 52
10. Orissa Drugs & Chemicals Ltd. 2.97 3.30 194 117
11. Rajasthan Drugs & Pharm. Ltd. 11.21 8.95 54 43
Total 315.58 306.79 76 72
Of the 11 CPSES, five (5) could reduce the level of inventoryduring 2011-12 as compared to the previous year while in case offour (4) public enterprises there has been increase in the level ofinventory. It remained unchanged in the case of two (2) CPSEs.
4.2.8 Steel
The value of inventory held by five (5) CPSEs was ̀ 14655.51crore at the end of 2010-11 as compared to ` 17614.30 crore held bythem at the end of 2011-12. The level of inventory has gone up from115 days cost of production at the end of the previous year to117 days cost of production at the end of 2011-12. The company-wise position is indicated in the Table 4.2.8 below:—
Table 4.2.8
Sl . Name of the Company Inventory Level of Inventory in No. ofNo. (` in crore) days (Cost of Production)
2010-11 2011-12 2010-11 2011-12
1. Ferro Scrap Nigam Ltd. 5.75 5.30 13 11
2. Mishra Dhatu Nigam Ltd. 392.26 443.36 415 394
3. Rashtriya Ispat Nigam Ltd. 3254.71 3403.11 121 101
4. Steel Authority of India Ltd. 11302.79 13742.37 111 120
5. SAIL Refractory Company Ltd. 0.00 20.16 0 245
Total 14955.51 17614.30 115 117
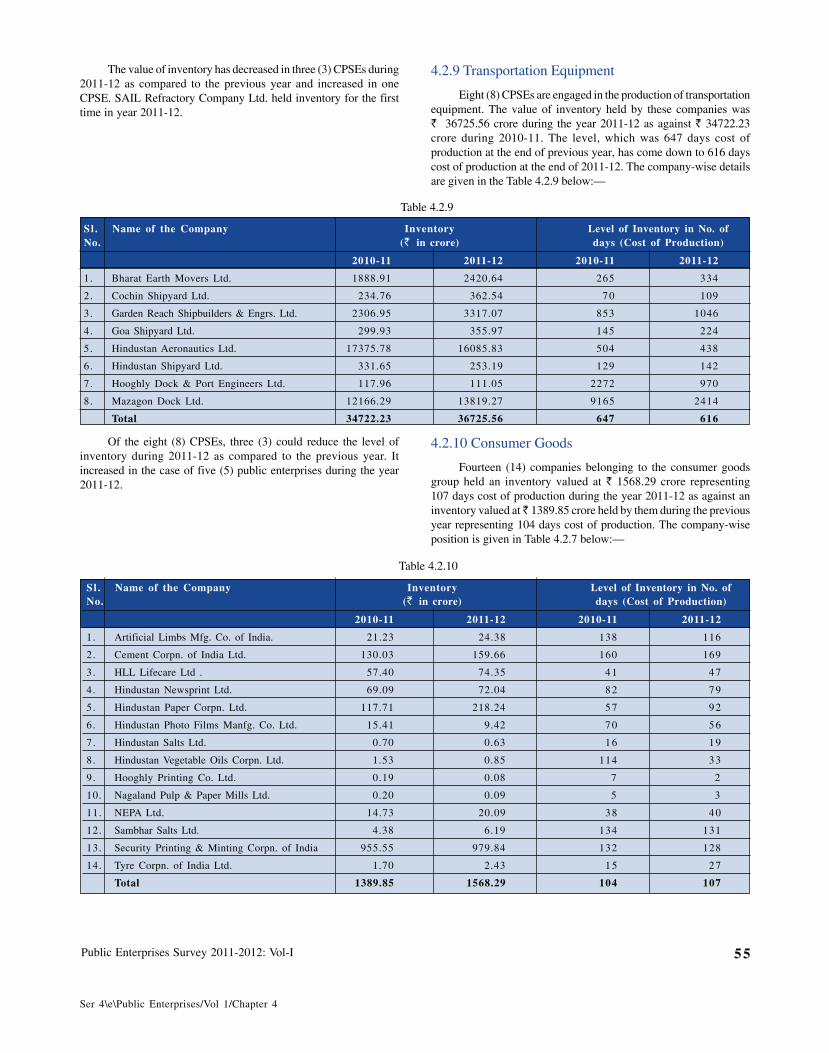
Public Enterprises Survey 2011-2012: Vol-I 55
Ser 4\e\Public Enterprises/Vol 1/Chapter 4
The value of inventory has decreased in three (3) CPSEs during2011-12 as compared to the previous year and increased in oneCPSE. SAIL Refractory Company Ltd. held inventory for the firsttime in year 2011-12.
4.2.9 Transportation Equipment
Eight (8) CPSEs are engaged in the production of transportationequipment. The value of inventory held by these companies was` 36725.56 crore during the year 2011-12 as against ` 34722.23crore during 2010-11. The level, which was 647 days cost ofproduction at the end of previous year, has come down to 616 dayscost of production at the end of 2011-12. The company-wise detailsare given in the Table 4.2.9 below:—
Table 4.2.9
Sl . Name of the Company Inventory Level of Inventory in No. ofNo. (` in crore) days (Cost of Production)
2010-11 2011-12 2010-11 2011-12
1. Bharat Earth Movers Ltd. 1888.91 2420.64 265 334
2. Cochin Shipyard Ltd. 234.76 362.54 70 109
3. Garden Reach Shipbuilders & Engrs. Ltd. 2306.95 3317.07 853 1046
4. Goa Shipyard Ltd. 299.93 355.97 145 224
5. Hindustan Aeronautics Ltd. 17375.78 16085.83 504 438
6. Hindustan Shipyard Ltd. 331.65 253.19 129 142
7. Hooghly Dock & Port Engineers Ltd. 117.96 111.05 2272 970
8. Mazagon Dock Ltd. 12166.29 13819.27 9165 2414
Total 34722.23 36725.56 647 616
Of the eight (8) CPSEs, three (3) could reduce the level ofinventory during 2011-12 as compared to the previous year. Itincreased in the case of five (5) public enterprises during the year2011-12.
4.2.10 Consumer Goods
Fourteen (14) companies belonging to the consumer goodsgroup held an inventory valued at ` 1568.29 crore representing107 days cost of production during the year 2011-12 as against aninventory valued at ̀ 1389.85 crore held by them during the previousyear representing 104 days cost of production. The company-wiseposition is given in Table 4.2.7 below:—
Table 4.2.10
Sl . Name of the Company Inventory Level of Inventory in No. ofNo. (` in crore) days (Cost of Production)
2010-11 2011-12 2010-11 2011-12
1. Artificial Limbs Mfg. Co. of India. 21.23 24.38 138 116
2. Cement Corpn. of India Ltd. 130.03 159.66 160 169
3. HLL Lifecare Ltd . 57.40 74.35 41 47
4. Hindustan Newsprint Ltd. 69.09 72.04 82 79
5. Hindustan Paper Corpn. Ltd. 117.71 218.24 57 92
6. Hindustan Photo Films Manfg. Co. Ltd. 15.41 9.42 70 56
7. Hindustan Salts Ltd. 0.70 0.63 16 19
8. Hindustan Vegetable Oils Corpn. Ltd. 1.53 0.85 114 33
9. Hooghly Printing Co. Ltd. 0.19 0.08 7 2
10. Nagaland Pulp & Paper Mills Ltd. 0.20 0.09 5 3
11. NEPA Ltd. 14.73 20.09 38 40
12. Sambhar Salts Ltd. 4.38 6.19 134 131
13. Security Printing & Minting Corpn. of India 955.55 979.84 132 128
14. Tyre Corpn. of India Ltd. 1.70 2.43 15 27
Total 1389.85 1568.29 104 107
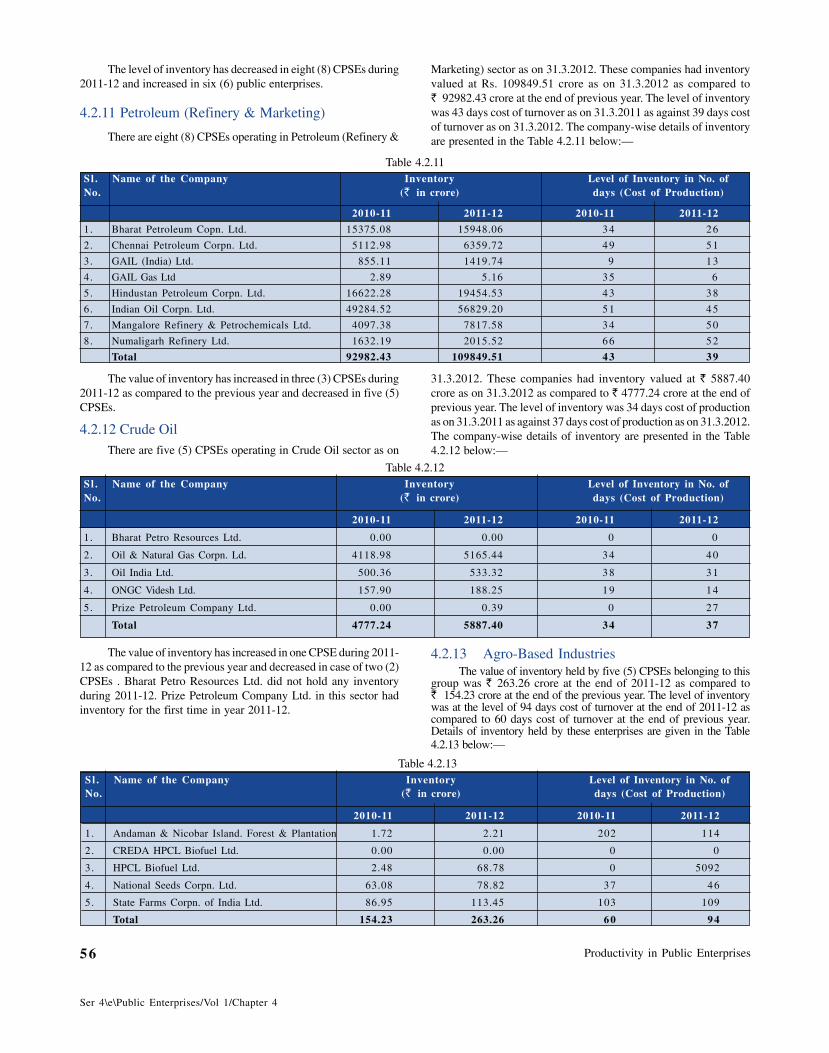
Productivity in Public Enterprises56
Ser 4\e\Public Enterprises/Vol 1/Chapter 4
The level of inventory has decreased in eight (8) CPSEs during2011-12 and increased in six (6) public enterprises.
4.2.11 Petroleum (Refinery & Marketing)
There are eight (8) CPSEs operating in Petroleum (Refinery &
Marketing) sector as on 31.3.2012. These companies had inventoryvalued at Rs. 109849.51 crore as on 31.3.2012 as compared to` 92982.43 crore at the end of previous year. The level of inventorywas 43 days cost of turnover as on 31.3.2011 as against 39 days costof turnover as on 31.3.2012. The company-wise details of inventoryare presented in the Table 4.2.11 below:—
Table 4.2.11Sl . Name of the Company Inventory Level of Inventory in No. ofNo. (` in crore) days (Cost of Production)
2010-11 2011-12 2010-11 2011-12
1. Bharat Petroleum Copn. Ltd. 15375.08 15948.06 34 26
2. Chennai Petroleum Corpn. Ltd. 5112.98 6359.72 49 51
3. GAIL (India) Ltd. 855.11 1419.74 9 13
4. GAIL Gas Ltd 2.89 5.16 35 6
5. Hindustan Petroleum Corpn. Ltd. 16622.28 19454.53 43 38
6. Indian Oil Corpn. Ltd. 49284.52 56829.20 51 45
7. Mangalore Refinery & Petrochemicals Ltd. 4097.38 7817.58 34 50
8. Numaligarh Refinery Ltd. 1632.19 2015.52 66 52
Total 92982.43 109849.51 43 39
The value of inventory has increased in three (3) CPSEs during2011-12 as compared to the previous year and decreased in five (5)CPSEs.
4.2.12 Crude OilThere are five (5) CPSEs operating in Crude Oil sector as on
31.3.2012. These companies had inventory valued at ` 5887.40crore as on 31.3.2012 as compared to ` 4777.24 crore at the end ofprevious year. The level of inventory was 34 days cost of productionas on 31.3.2011 as against 37 days cost of production as on 31.3.2012.The company-wise details of inventory are presented in the Table4.2.12 below:—
Table 4.2.12Sl . Name of the Company Inventory Level of Inventory in No. ofNo. (` in crore) days (Cost of Production)
2010-11 2011-12 2010-11 2011-12
1. Bharat Petro Resources Ltd. 0.00 0.00 0 0
2. Oil & Natural Gas Corpn. Ld. 4118.98 5165.44 34 40
3. Oil India Ltd. 500.36 533.32 38 31
4. ONGC Videsh Ltd. 157.90 188.25 19 14
5. Prize Petroleum Company Ltd. 0.00 0.39 0 27
Total 4777.24 5887.40 34 37
The value of inventory has increased in one CPSE during 2011-12 as compared to the previous year and decreased in case of two (2)CPSEs . Bharat Petro Resources Ltd. did not hold any inventoryduring 2011-12. Prize Petroleum Company Ltd. in this sector hadinventory for the first time in year 2011-12.
4.2.13 Agro-Based IndustriesThe value of inventory held by five (5) CPSEs belonging to this
group was ` 263.26 crore at the end of 2011-12 as compared to` 154.23 crore at the end of the previous year. The level of inventorywas at the level of 94 days cost of turnover at the end of 2011-12 ascompared to 60 days cost of turnover at the end of previous year.Details of inventory held by these enterprises are given in the Table4.2.13 below:—
Table 4.2.13Sl . Name of the Company Inventory Level of Inventory in No. ofNo. (` in crore) days (Cost of Production)
2010-11 2011-12 2010-11 2011-12
1. Andaman & Nicobar Island. Forest & Plantation 1.72 2.21 202 114
2. CREDA HPCL Biofuel Ltd. 0.00 0.00 0 0
3. HPCL Biofuel Ltd. 2.48 68.78 0 5092
4. National Seeds Corpn. Ltd. 63.08 78.82 37 46
5. State Farms Corpn. of India Ltd. 86.95 113.45 103 109
Total 154.23 263.26 60 94

Public Enterprises Survey 2011-2012: Vol-I 57
Ser 4\e\Public Enterprises/Vol 1/Chapter 4
Of the five (5) CPSEs under this group, one CPSE could reduce
the level of inventory during 2011-12 as compared to the previous
year and the level of inventory increased in the case of 2 public
enterprises. It remained unchanged in the case of CREDILA HPCL
Biofuel Ltd. HPCL Biofuel held inventory for the first time in year
2011-12.
4.2.14 Coal
The value of inventory held by eight (8) CPSEs belonging tothis group as on 31.3.2012 was ` 6064.51 crore as compared to` 5578.84 crore at the end of previous year. The level of inventorywas 45 days cost of production as on 31.3.2012 as compared to53 days cost of production at the end of previous year. Company-wise details are given in Table 4.2.14 below:—
Table 4.2.14
Sl . Name of the Company Inventory Level of Inventory in No. ofNo. (` in crore) days (Cost of Production)
2010-11 2011-12 2010-11 2011-12
1 Bharat Coking Coal Ltd. 1112.36 1044.41 76 55
2 Central Coalfields Ltd. 1446.99 1531.88 116 95
3 Coal India Ltd. 35.69 18.51 23 13
4 Eastern Coalfields Ltd. 568.72 622.93 34 30
5 Mahanadi Coalfields Ltd. 591.07 648.70 47 42
6 Northern Coalfields Ltd. 493.97 727.97 41 55
7 South Eastern Coalfields Ltd. 892.95 899.51 42 32
8 Western Coalfields Ltd. 437.09 570.60 30 30
Total 5578.84 6064.51 53 45
The value of inventory has decreased in six (6) CPSEs during
2011-12 as compared to the previous year and increased in the case
of one public enterprise. It remained unchanged in the case of Western
Coalfields Ltd.
4.2.15 Textiles
There are four (4) CPSEs in Textiles sector as on 31.3.2012.The value of inventory held by companies belonging to this groupwas ̀ 285.40 crore at the end of 2011-12 as compared to an inventoryof ` 278.36 crore at the end of previous year. The level of inventorywas 91 days cost of production during the year 2011-12 and 90 daysat the end of previous year. The company wise details are given inthe Table 4.2.15 below:—
Table 4.2.15
Sl . Name of the Company Inventory Level of Inventory in No. ofNo. (` in crore) days (Cost of Production)
2010-11 2011-12 2010-11 2011-12
1. Birds, Jute & Exports Ltd. 0.00 0.00 0 0
2. British India Corpn. Ltd. 7.91 7.73 76 70
3. National Jute Manufacturers Corpn. Ltd. 20.80 21.45 51 112
4. National Textile Corpn. Ltd. 249.65 256.22 96 91
Total 278.36 285.40 90 91
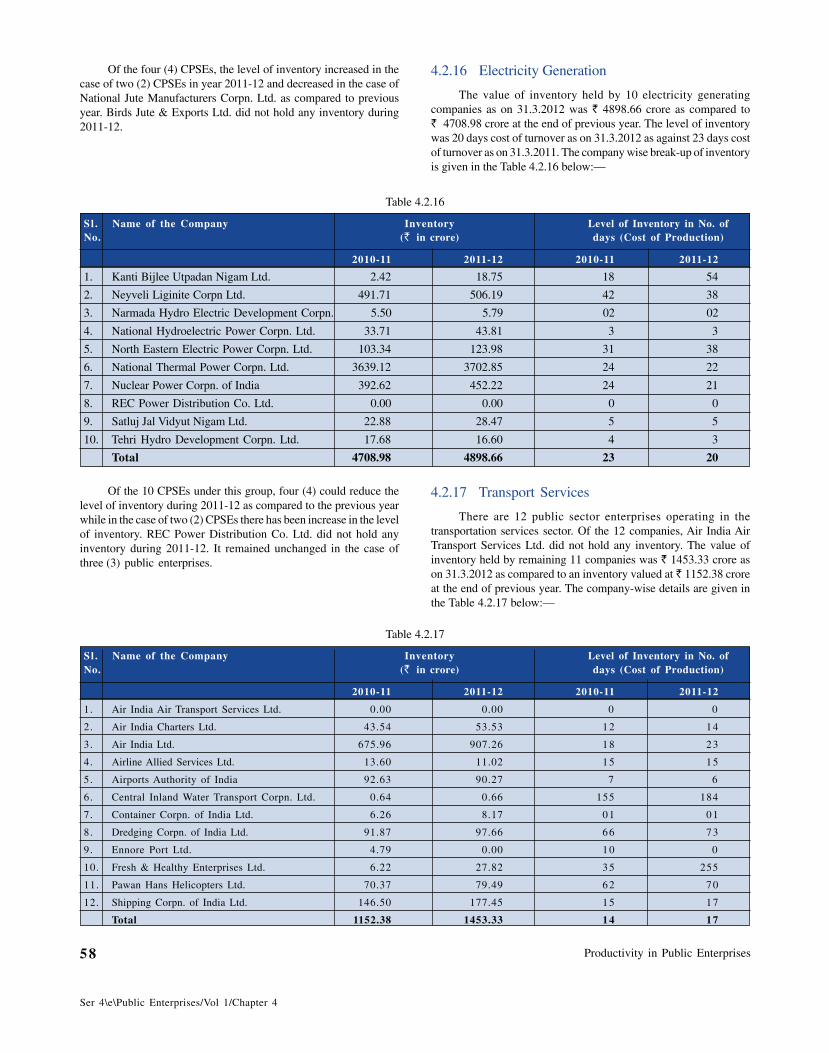
Productivity in Public Enterprises58
Ser 4\e\Public Enterprises/Vol 1/Chapter 4
Of the four (4) CPSEs, the level of inventory increased in thecase of two (2) CPSEs in year 2011-12 and decreased in the case ofNational Jute Manufacturers Corpn. Ltd. as compared to previousyear. Birds Jute & Exports Ltd. did not hold any inventory during2011-12.
4.2.16 Electricity Generation
The value of inventory held by 10 electricity generatingcompanies as on 31.3.2012 was ` 4898.66 crore as compared to` 4708.98 crore at the end of previous year. The level of inventorywas 20 days cost of turnover as on 31.3.2012 as against 23 days costof turnover as on 31.3.2011. The company wise break-up of inventoryis given in the Table 4.2.16 below:—
Table 4.2.16
Sl . Name of the Company Inventory Level of Inventory in No. ofNo. (` in crore) days (Cost of Production)
2010-11 2011-12 2010-11 2011-12
1. Kanti Bijlee Utpadan Nigam Ltd. 2.42 18.75 18 54
2. Neyveli Liginite Corpn Ltd. 491.71 506.19 42 38
3. Narmada Hydro Electric Development Corpn. 5.50 5.79 02 02
4. National Hydroelectric Power Corpn. Ltd. 33.71 43.81 3 3
5. North Eastern Electric Power Corpn. Ltd. 103.34 123.98 31 38
6. National Thermal Power Corpn. Ltd. 3639.12 3702.85 24 22
7. Nuclear Power Corpn. of India 392.62 452.22 24 21
8. REC Power Distribution Co. Ltd. 0.00 0.00 0 0
9. Satluj Jal Vidyut Nigam Ltd. 22.88 28.47 5 5
10. Tehri Hydro Development Corpn. Ltd. 17.68 16.60 4 3
Total 4708.98 4898.66 23 20
Of the 10 CPSEs under this group, four (4) could reduce thelevel of inventory during 2011-12 as compared to the previous yearwhile in the case of two (2) CPSEs there has been increase in the levelof inventory. REC Power Distribution Co. Ltd. did not hold anyinventory during 2011-12. It remained unchanged in the case ofthree (3) public enterprises.
4.2.17 Transport Services
There are 12 public sector enterprises operating in thetransportation services sector. Of the 12 companies, Air India AirTransport Services Ltd. did not hold any inventory. The value ofinventory held by remaining 11 companies was ` 1453.33 crore ason 31.3.2012 as compared to an inventory valued at ` 1152.38 croreat the end of previous year. The company-wise details are given inthe Table 4.2.17 below:—
Table 4.2.17
Sl . Name of the Company Inventory Level of Inventory in No. ofNo. (` in crore) days (Cost of Production)
2010-11 2011-12 2010-11 2011-12
1. Air India Air Transport Services Ltd. 0.00 0.00 0 0
2. Air India Charters Ltd. 43.54 53.53 12 14
3. Air India Ltd. 675.96 907.26 18 23
4. Airline Allied Services Ltd. 13.60 11.02 15 15
5. Airports Authority of India 92.63 90.27 7 6
6. Central Inland Water Transport Corpn. Ltd. 0.64 0.66 155 184
7. Container Corpn. of India Ltd. 6.26 8.17 01 01
8. Dredging Corpn. of India Ltd. 91.87 97.66 66 73
9. Ennore Port Ltd. 4.79 0.00 10 0
10. Fresh & Healthy Enterprises Ltd. 6.22 27.82 35 255
11. Pawan Hans Helicopters Ltd. 70.37 79.49 62 70
12. Shipping Corpn. of India Ltd. 146.50 177.45 15 17
Total 1152.38 1453.33 14 17
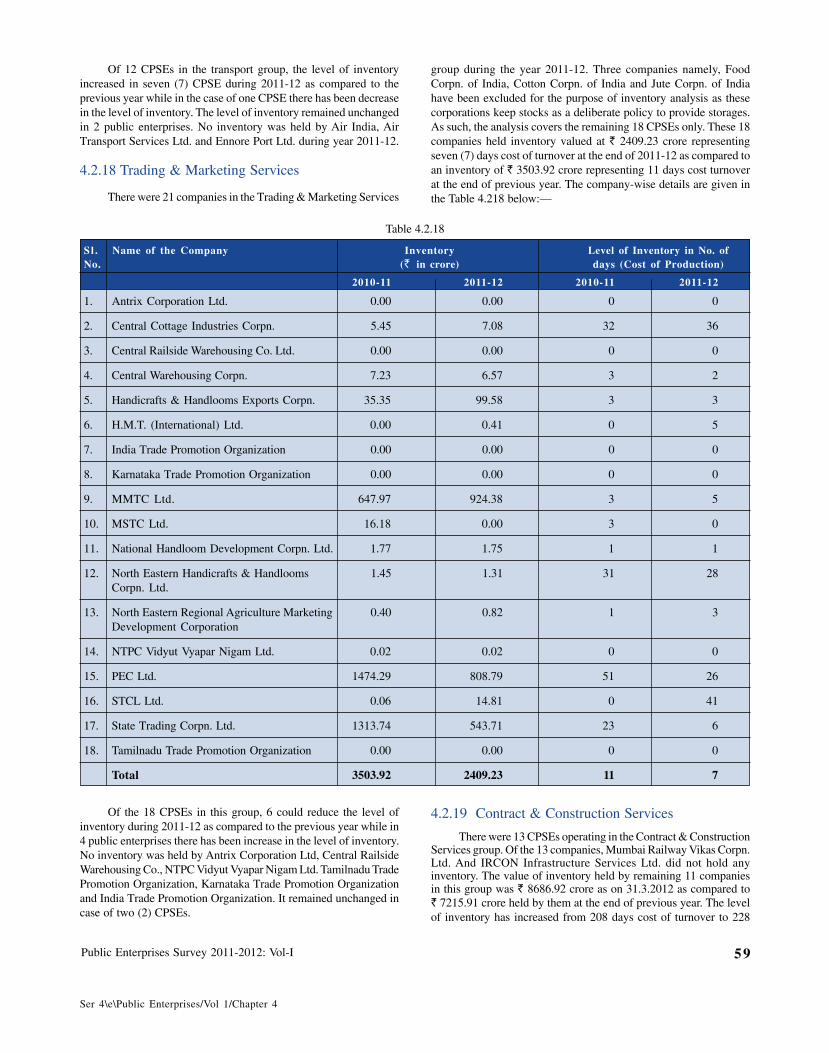
Public Enterprises Survey 2011-2012: Vol-I 59
Ser 4\e\Public Enterprises/Vol 1/Chapter 4
Of 12 CPSEs in the transport group, the level of inventoryincreased in seven (7) CPSE during 2011-12 as compared to theprevious year while in the case of one CPSE there has been decreasein the level of inventory. The level of inventory remained unchangedin 2 public enterprises. No inventory was held by Air India, AirTransport Services Ltd. and Ennore Port Ltd. during year 2011-12.
4.2.18 Trading & Marketing Services
There were 21 companies in the Trading & Marketing Services
group during the year 2011-12. Three companies namely, FoodCorpn. of India, Cotton Corpn. of India and Jute Corpn. of Indiahave been excluded for the purpose of inventory analysis as thesecorporations keep stocks as a deliberate policy to provide storages.As such, the analysis covers the remaining 18 CPSEs only. These 18companies held inventory valued at ` 2409.23 crore representingseven (7) days cost of turnover at the end of 2011-12 as compared toan inventory of ` 3503.92 crore representing 11 days cost turnoverat the end of previous year. The company-wise details are given inthe Table 4.218 below:—
Table 4.2.18
Sl . Name of the Company Inventory Level of Inventory in No. ofNo. (` in crore) days (Cost of Production)
2010-11 2011-12 2010-11 2011-12
1. Antrix Corporation Ltd. 0.00 0.00 0 0
2. Central Cottage Industries Corpn. 5.45 7.08 32 36
3. Central Railside Warehousing Co. Ltd. 0.00 0.00 0 0
4. Central Warehousing Corpn. 7.23 6.57 3 2
5. Handicrafts & Handlooms Exports Corpn. 35.35 99.58 3 3
6. H.M.T. (International) Ltd. 0.00 0.41 0 5
7. India Trade Promotion Organization 0.00 0.00 0 0
8. Karnataka Trade Promotion Organization 0.00 0.00 0 0
9. MMTC Ltd. 647.97 924.38 3 5
10. MSTC Ltd. 16.18 0.00 3 0
11. National Handloom Development Corpn. Ltd. 1.77 1.75 1 1
12. North Eastern Handicrafts & Handlooms 1.45 1.31 31 28Corpn. Ltd.
13. North Eastern Regional Agriculture Marketing 0.40 0.82 1 3Development Corporation
14. NTPC Vidyut Vyapar Nigam Ltd. 0.02 0.02 0 0
15. PEC Ltd. 1474.29 808.79 51 26
16. STCL Ltd. 0.06 14.81 0 41
17. State Trading Corpn. Ltd. 1313.74 543.71 23 6
18. Tamilnadu Trade Promotion Organization 0.00 0.00 0 0
Total 3503.92 2409.23 11 7
Of the 18 CPSEs in this group, 6 could reduce the level ofinventory during 2011-12 as compared to the previous year while in4 public enterprises there has been increase in the level of inventory.No inventory was held by Antrix Corporation Ltd, Central RailsideWarehousing Co., NTPC Vidyut Vyapar Nigam Ltd. Tamilnadu TradePromotion Organization, Karnataka Trade Promotion Organizationand India Trade Promotion Organization. It remained unchanged incase of two (2) CPSEs.
4.2.19 Contract & Construction Services
There were 13 CPSEs operating in the Contract & ConstructionServices group. Of the 13 companies, Mumbai Railway Vikas Corpn.Ltd. And IRCON Infrastructure Services Ltd. did not hold anyinventory. The value of inventory held by remaining 11 companiesin this group was ` 8686.92 crore as on 31.3.2012 as compared to` 7215.91 crore held by them at the end of previous year. The levelof inventory has increased from 208 days cost of turnover to 228
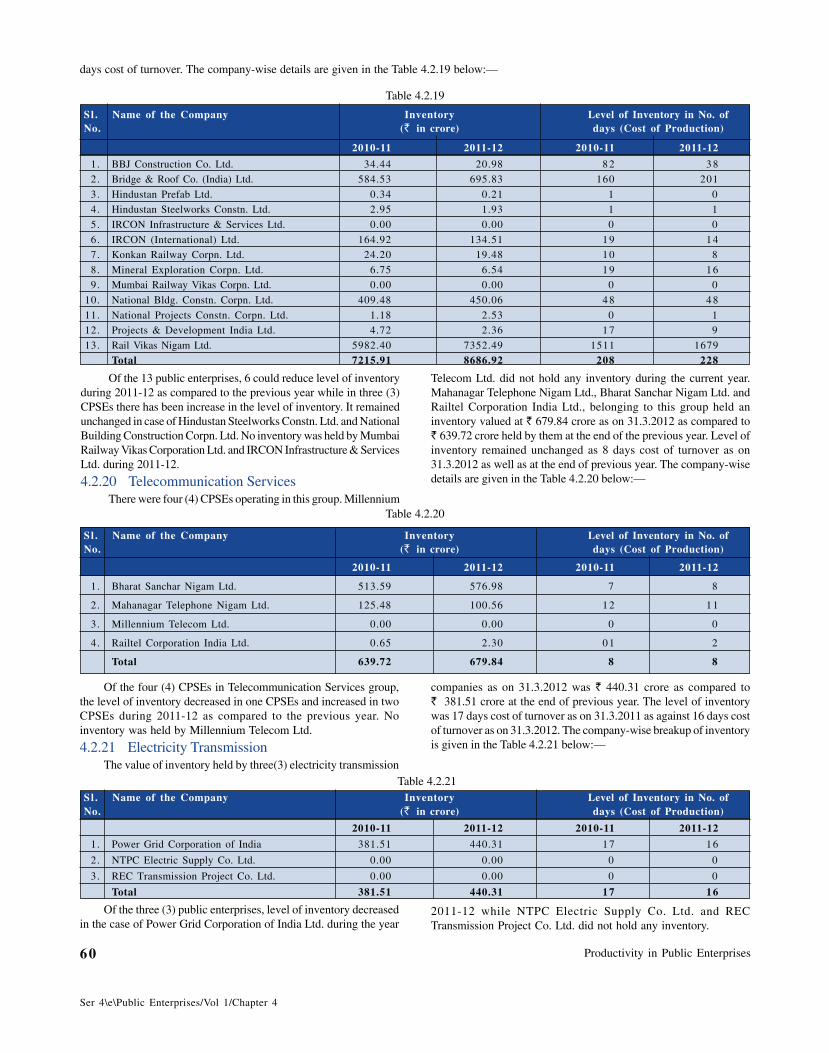
Productivity in Public Enterprises60
Ser 4\e\Public Enterprises/Vol 1/Chapter 4
days cost of turnover. The company-wise details are given in the Table 4.2.19 below:—
Of the 13 public enterprises, 6 could reduce level of inventoryduring 2011-12 as compared to the previous year while in three (3)CPSEs there has been increase in the level of inventory. It remainedunchanged in case of Hindustan Steelworks Constn. Ltd. and NationalBuilding Construction Corpn. Ltd. No inventory was held by MumbaiRailway Vikas Corporation Ltd. and IRCON Infrastructure & ServicesLtd. during 2011-12.
4.2.20 Telecommunication ServicesThere were four (4) CPSEs operating in this group. Millennium
Table 4.2.19
Sl . Name of the Company Inventory Level of Inventory in No. ofNo. (` in crore) days (Cost of Production)
2010-11 2011-12 2010-11 2011-12
1. BBJ Construction Co. Ltd. 34.44 20.98 82 38
2. Bridge & Roof Co. (India) Ltd. 584.53 695.83 160 201
3. Hindustan Prefab Ltd. 0.34 0.21 1 0
4. Hindustan Steelworks Constn. Ltd. 2.95 1.93 1 1
5. IRCON Infrastructure & Services Ltd. 0.00 0.00 0 0
6. IRCON (International) Ltd. 164.92 134.51 19 14
7. Konkan Railway Corpn. Ltd. 24.20 19.48 10 8
8. Mineral Exploration Corpn. Ltd. 6.75 6.54 19 16
9. Mumbai Railway Vikas Corpn. Ltd. 0.00 0.00 0 0
10. National Bldg. Constn. Corpn. Ltd. 409.48 450.06 48 48
11. National Projects Constn. Corpn. Ltd. 1.18 2.53 0 1
12. Projects & Development India Ltd. 4.72 2.36 17 9
13. Rail Vikas Nigam Ltd. 5982.40 7352.49 1511 1679
Total 7215.91 8686.92 208 228
Telecom Ltd. did not hold any inventory during the current year.Mahanagar Telephone Nigam Ltd., Bharat Sanchar Nigam Ltd. andRailtel Corporation India Ltd., belonging to this group held aninventory valued at ` 679.84 crore as on 31.3.2012 as compared to` 639.72 crore held by them at the end of the previous year. Level ofinventory remained unchanged as 8 days cost of turnover as on31.3.2012 as well as at the end of previous year. The company-wisedetails are given in the Table 4.2.20 below:—
Table 4.2.20
Sl . Name of the Company Inventory Level of Inventory in No. ofNo. (` in crore) days (Cost of Production)
2010-11 2011-12 2010-11 2011-12
1. Bharat Sanchar Nigam Ltd. 513.59 576.98 7 8
2. Mahanagar Telephone Nigam Ltd. 125.48 100.56 12 11
3. Millennium Telecom Ltd. 0.00 0.00 0 0
4. Railtel Corporation India Ltd. 0.65 2.30 01 2
Total 639.72 679.84 8 8
Of the four (4) CPSEs in Telecommunication Services group,the level of inventory decreased in one CPSEs and increased in twoCPSEs during 2011-12 as compared to the previous year. Noinventory was held by Millennium Telecom Ltd.
4.2.21 Electricity TransmissionThe value of inventory held by three(3) electricity transmission
companies as on 31.3.2012 was ` 440.31 crore as compared to` 381.51 crore at the end of previous year. The level of inventorywas 17 days cost of turnover as on 31.3.2011 as against 16 days costof turnover as on 31.3.2012. The company-wise breakup of inventoryis given in the Table 4.2.21 below:—
Table 4.2.21Sl . Name of the Company Inventory Level of Inventory in No. ofNo. (` in crore) days (Cost of Production)
2010-11 2011-12 2010-11 2011-12
1. Power Grid Corporation of India 381.51 440.31 17 16
2. NTPC Electric Supply Co. Ltd. 0.00 0.00 0 0
3. REC Transmission Project Co. Ltd. 0.00 0.00 0 0
Total 381.51 440.31 17 16
Of the three (3) public enterprises, level of inventory decreasedin the case of Power Grid Corporation of India Ltd. during the year
2011-12 while NTPC Electric Supply Co. Ltd. and RECTransmission Project Co. Ltd. did not hold any inventory.
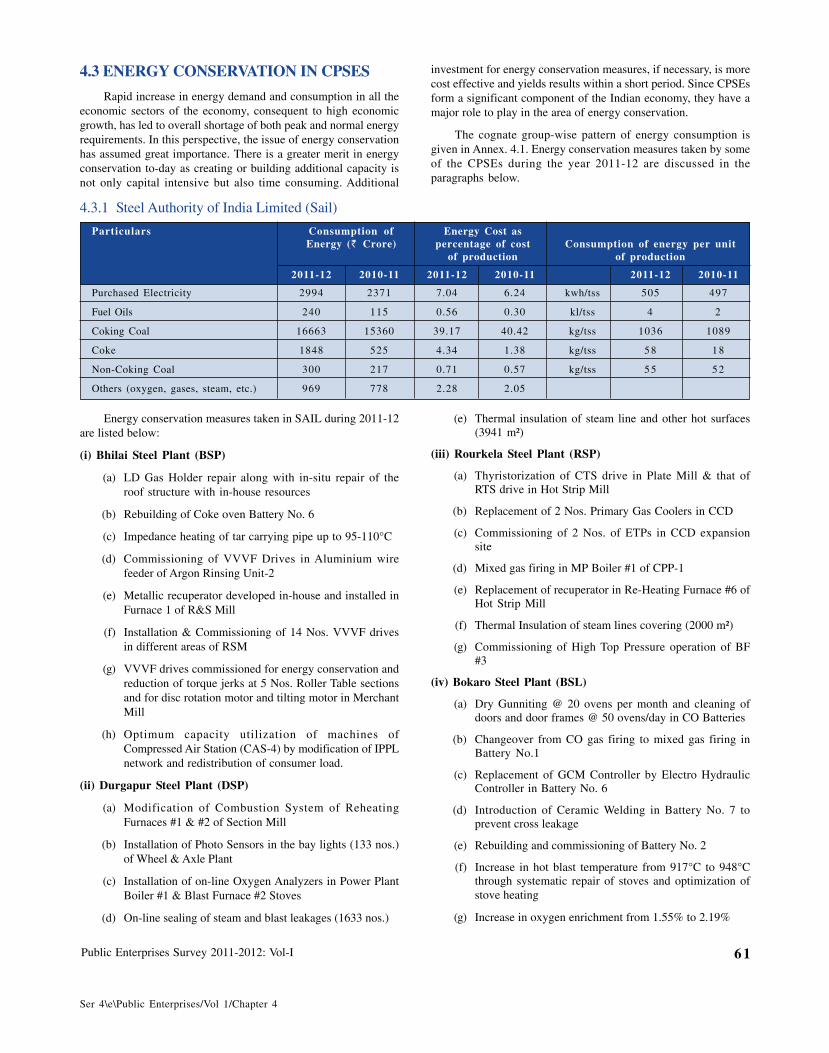
Public Enterprises Survey 2011-2012: Vol-I 61
Ser 4\e\Public Enterprises/Vol 1/Chapter 4
4.3 ENERGY CONSERVATION IN CPSES
Rapid increase in energy demand and consumption in all theeconomic sectors of the economy, consequent to high economicgrowth, has led to overall shortage of both peak and normal energyrequirements. In this perspective, the issue of energy conservationhas assumed great importance. There is a greater merit in energyconservation to-day as creating or building additional capacity isnot only capital intensive but also time consuming. Additional
investment for energy conservation measures, if necessary, is morecost effective and yields results within a short period. Since CPSEsform a significant component of the Indian economy, they have amajor role to play in the area of energy conservation.
The cognate group-wise pattern of energy consumption isgiven in Annex. 4.1. Energy conservation measures taken by someof the CPSEs during the year 2011-12 are discussed in theparagraphs below.
4.3.1 Steel Authority of India Limited (Sail)
Particulars Consumption of Energy Cost asEnergy (` Crore) percentage of cost Consumption of energy per unit
of production of production
2011-12 2010-11 2011-12 2010-11 2011-12 2010-11
Purchased Electricity 2994 2371 7.04 6.24 kwh/tss 505 497
Fuel Oils 240 115 0.56 0.30 kl/tss 4 2
Coking Coal 16663 15360 39.17 40.42 kg/tss 1036 1089
Coke 1848 525 4.34 1.38 kg/tss 58 18
Non-Coking Coal 300 217 0.71 0.57 kg/tss 55 52
Others (oxygen, gases, steam, etc.) 969 778 2.28 2.05
(e) Thermal insulation of steam line and other hot surfaces(3941 m²)
(iii) Rourkela Steel Plant (RSP)
(a) Thyristorization of CTS drive in Plate Mill & that ofRTS drive in Hot Strip Mill
(b) Replacement of 2 Nos. Primary Gas Coolers in CCD
(c) Commissioning of 2 Nos. of ETPs in CCD expansionsite
(d) Mixed gas firing in MP Boiler #1 of CPP-1
(e) Replacement of recuperator in Re-Heating Furnace #6 ofHot Strip Mill
(f) Thermal Insulation of steam lines covering (2000 m²)
(g) Commissioning of High Top Pressure operation of BF#3
(iv) Bokaro Steel Plant (BSL)
(a) Dry Gunniting @ 20 ovens per month and cleaning ofdoors and door frames @ 50 ovens/day in CO Batteries
(b) Changeover from CO gas firing to mixed gas firing inBattery No.1
(c) Replacement of GCM Controller by Electro HydraulicController in Battery No. 6
(d) Introduction of Ceramic Welding in Battery No. 7 toprevent cross leakage
(e) Rebuilding and commissioning of Battery No. 2
(f) Increase in hot blast temperature from 917°C to 948°Cthrough systematic repair of stoves and optimization ofstove heating
(g) Increase in oxygen enrichment from 1.55% to 2.19%
Energy conservation measures taken in SAIL during 2011-12are listed below:
(i) Bhilai Steel Plant (BSP)
(a) LD Gas Holder repair along with in-situ repair of theroof structure with in-house resources
(b) Rebuilding of Coke oven Battery No. 6
(c) Impedance heating of tar carrying pipe up to 95-110°C
(d) Commissioning of VVVF Drives in Aluminium wirefeeder of Argon Rinsing Unit-2
(e) Metallic recuperator developed in-house and installed inFurnace 1 of R&S Mill
(f) Installation & Commissioning of 14 Nos. VVVF drivesin different areas of RSM
(g) VVVF drives commissioned for energy conservation andreduction of torque jerks at 5 Nos. Roller Table sectionsand for disc rotation motor and tilting motor in MerchantMill
(h) Optimum capacity utilization of machines ofCompressed Air Station (CAS-4) by modification of IPPLnetwork and redistribution of consumer load.
(ii) Durgapur Steel Plant (DSP)
(a) Modification of Combustion System of ReheatingFurnaces #1 & #2 of Section Mill
(b) Installation of Photo Sensors in the bay lights (133 nos.)of Wheel & Axle Plant
(c) Installation of on-line Oxygen Analyzers in Power PlantBoiler #1 & Blast Furnace #2 Stoves
(d) On-line sealing of steam and blast leakages (1633 nos.)
Productivity in Public Enterprises62
Ser 4\e\Public Enterprises/Vol 1/Chapter 4
(h) Increase in nut coke rate from 19.9 to 24.2 kg/thm
(i) Increase in Coal Dust Injection rate from 11.5 to30.2 kg/thm
(j) Upgradation of BF No. 5 along with its stoves
(k) Capital Repair of 3 Nos. of Ceramic Recuperators atSoaking Pits
(l) Revisioning of BF Gas Valves & BF Gas Firing Systemto maximize BF gas consumption in Power Plant to 174tcm/hr from previous average of 158 tcm/hr
(m) Approx. 11km of damaged process water line changed
(n) About 3600 m² insulation of steam line replaced alongwith 22 nos. of new steam traps
(v) IISCO Steel Plant (ISP)
(a) Closure of BF #3 of capacity 1200 t/day
(b) Cold Repair of Battery No. 8
(c) Running of only one Twin Hearth Furnace
(d) Introduction of Air Blaster at Battery No.10 coal servicebunker for smooth flow of coal
(e) Introduction of PLC System in Coal Handling Plant ofBatter No.10
(f) Introduction of BF Gas Firing System in Boiler Unit -A
(g) Installation of new BF Ladle Heating System near BFarea
4.3.2 Mishra Dhatu Nigam Limited (Midhani)
MIDHANI obtained "Excellent" rating for being within the
limits of energy consumption for Electricity and LPG on account
of proactive steps taken in conserving energy.
The following measures were taken during 2011-12 for energy
conservation:
(1) The up-gradation of facilities has been completed and
modernization is still in progress and currently state-of-
the-art equipments are being used at Midhani. This
increased the capacity of production thereby reducing
cost of production & overall energy consumption.
(2) Energy conservation measures were taken to bring
improvements in specific energy consumption of
LPG. This was implemented by revamping and
calibration of furnaces, periodical maintenance of
refractory and burner blocks, prompt repairs to re-
heating furnaces and installation of flow meters, its
measurement and monitoring, use of oxygen during,reduction of heat cycle time, compact charging, useof proper scrap mix.
(3) Installation of solar hot water system of 5000 LPDcapacity at canteen.
(4) Installation of 10HP CWC pumps, in place of 135 HPpumps, for mill water requirement of HRM therebysaving power.
(5) Ceramic lining to Ludwig Furnace at Heat Treatment Shopto avoid heat losses.
(6) Provision of isolation valve on the compressed airline inMelt shop-III area. The valve is closed on holidays andSundays to avoid charging of compressed airline todownstream shops and enable operation of smaller size450 CFM Khosla make screw air compressor in place of1000 or 1200 CFM Kirloskar compressor.
4.3.3 Rashtriya Ispat Nigam Limited (Rinl)
Energy conservation measures taken during the year2011-12 include:—
(1) Reduction of coke rate from 532.7 kg/t HM 527.6 Kg/t
HM by increasing hot blast temperature and ensuringproper coking coal blend coupled with technoeconomics
(2) Reduction of BF gas bleeding from 4.1% to 3.74% bytaking up proactive measures and optimizing distribution
through Supervisory Control and Data Acquisitionsystem (SCADA)
(3) Replacement of Tubular air heater I Boiler-3 in thermalpower plant
(4) Installation of refractory less Gas Pre heather in GasExpansion Turbine of Blast Furnace 1
(5) Replacement of Air Recuperators in F/C-1& F/C-2 ofLMMM
(6) Replacement of gas recuperator at the reheating furnaceof WRM during capital repairs
(7) Reduction of Stelmor conveyor blowers by standardizedoperation for different sections of rolling
(8) Commissioned Energy Efficient Air separation plantno 4
(9) Replaced existing 211 Fluorescent Tube lights with EnergyEfficient Tube lights (T5) and Installed 329 Translucentsheet to utilize natural lighting
(10) Replaced 33 Nos. of low capacity motor and reducedRPM of fans in Air Handling Units
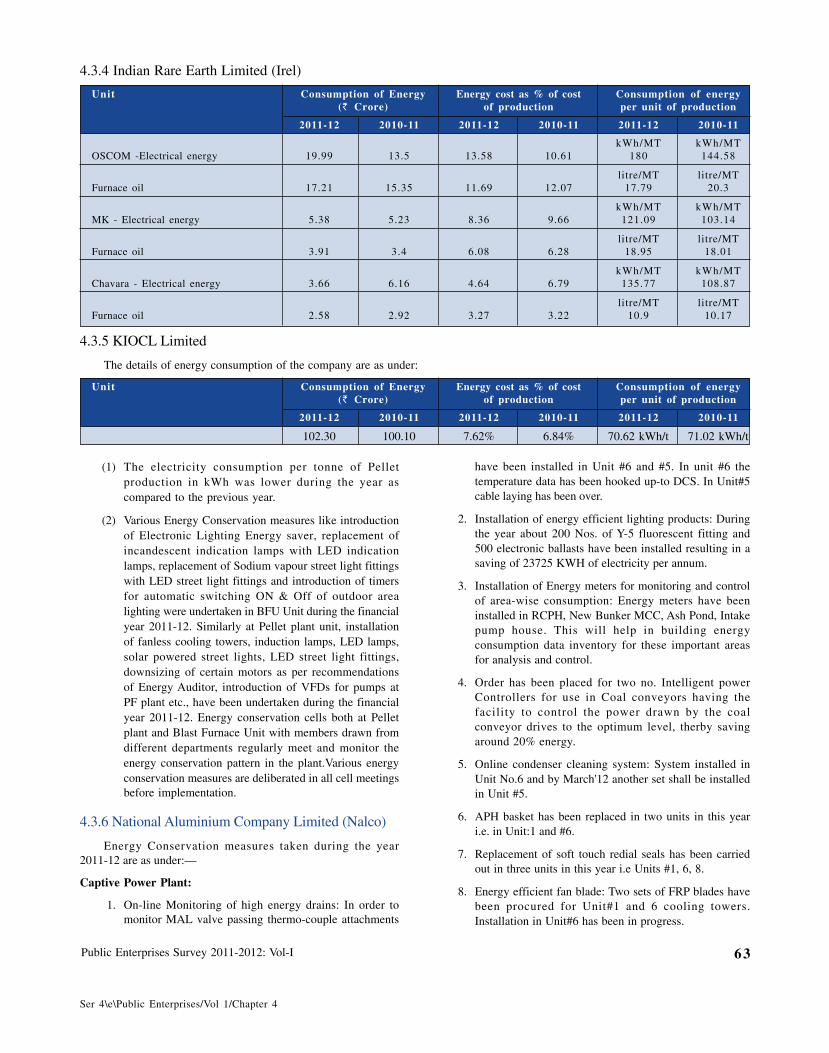
Public Enterprises Survey 2011-2012: Vol-I 63
Ser 4\e\Public Enterprises/Vol 1/Chapter 4
4.3.4 Indian Rare Earth Limited (Irel)
Unit Consumption of Energy Energy cost as % of cost Consumption of energy(` Crore) of production per unit of production
2011-12 2010-11 2011-12 2010-11 2011-12 2010-11
kWh/MT kWh/MTOSCOM -Electrical energy 19.99 13.5 13.58 10.61 180 144.58
litre/MT litre/MTFurnace oil 17.21 15.35 11.69 12.07 17.79 20.3
kWh/MT kWh/MTMK - Electrical energy 5.38 5.23 8.36 9.66 121.09 103.14
litre/MT litre/MTFurnace oil 3.91 3.4 6.08 6.28 18.95 18.01
kWh/MT kWh/MTChavara - Electrical energy 3.66 6.16 4.64 6.79 135.77 108.87
litre/MT litre/MTFurnace oil 2.58 2.92 3.27 3.22 10.9 10.17
4.3.5 KIOCL Limited
The details of energy consumption of the company are as under:
Unit Consumption of Energy Energy cost as % of cost Consumption of energy(` Crore) of production per unit of production
2011-12 2010-11 2011-12 2010-11 2011-12 2010-11
102.30 100.10 7.62% 6.84% 70.62 kWh/t 71.02 kWh/t
have been installed in Unit #6 and #5. In unit #6 thetemperature data has been hooked up-to DCS. In Unit#5cable laying has been over.
2. Installation of energy efficient lighting products: Duringthe year about 200 Nos. of Y-5 fluorescent fitting and500 electronic ballasts have been installed resulting in asaving of 23725 KWH of electricity per annum.
3. Installation of Energy meters for monitoring and controlof area-wise consumption: Energy meters have beeninstalled in RCPH, New Bunker MCC, Ash Pond, Intakepump house. This will help in building energyconsumption data inventory for these important areasfor analysis and control.
4. Order has been placed for two no. Intelligent powerControllers for use in Coal conveyors having thefacility to control the power drawn by the coalconveyor drives to the optimum level, therby savingaround 20% energy.
5. Online condenser cleaning system: System installed inUnit No.6 and by March'12 another set shall be installedin Unit #5.
6. APH basket has been replaced in two units in this yeari.e. in Unit:1 and #6.
7. Replacement of soft touch redial seals has been carriedout in three units in this year i.e Units #1, 6, 8.
8. Energy efficient fan blade: Two sets of FRP blades havebeen procured for Unit#1 and 6 cooling towers.Installation in Unit#6 has been in progress.
(1) The electricity consumption per tonne of Pelletproduction in kWh was lower during the year ascompared to the previous year.
(2) Various Energy Conservation measures like introductionof Electronic Lighting Energy saver, replacement ofincandescent indication lamps with LED indicationlamps, replacement of Sodium vapour street light fittingswith LED street light fittings and introduction of timersfor automatic switching ON & Off of outdoor arealighting were undertaken in BFU Unit during the financialyear 2011-12. Similarly at Pellet plant unit, installationof fanless cooling towers, induction lamps, LED lamps,solar powered street lights, LED street light fittings,downsizing of certain motors as per recommendationsof Energy Auditor, introduction of VFDs for pumps atPF plant etc., have been undertaken during the financialyear 2011-12. Energy conservation cells both at Pelletplant and Blast Furnace Unit with members drawn fromdifferent departments regularly meet and monitor theenergy conservation pattern in the plant.Various energyconservation measures are deliberated in all cell meetingsbefore implementation.
4.3.6 National Aluminium Company Limited (Nalco)
Energy Conservation measures taken during the year2011-12 are as under:—
Captive Power Plant:
1. On-line Monitoring of high energy drains: In order tomonitor MAL valve passing thermo-couple attachments
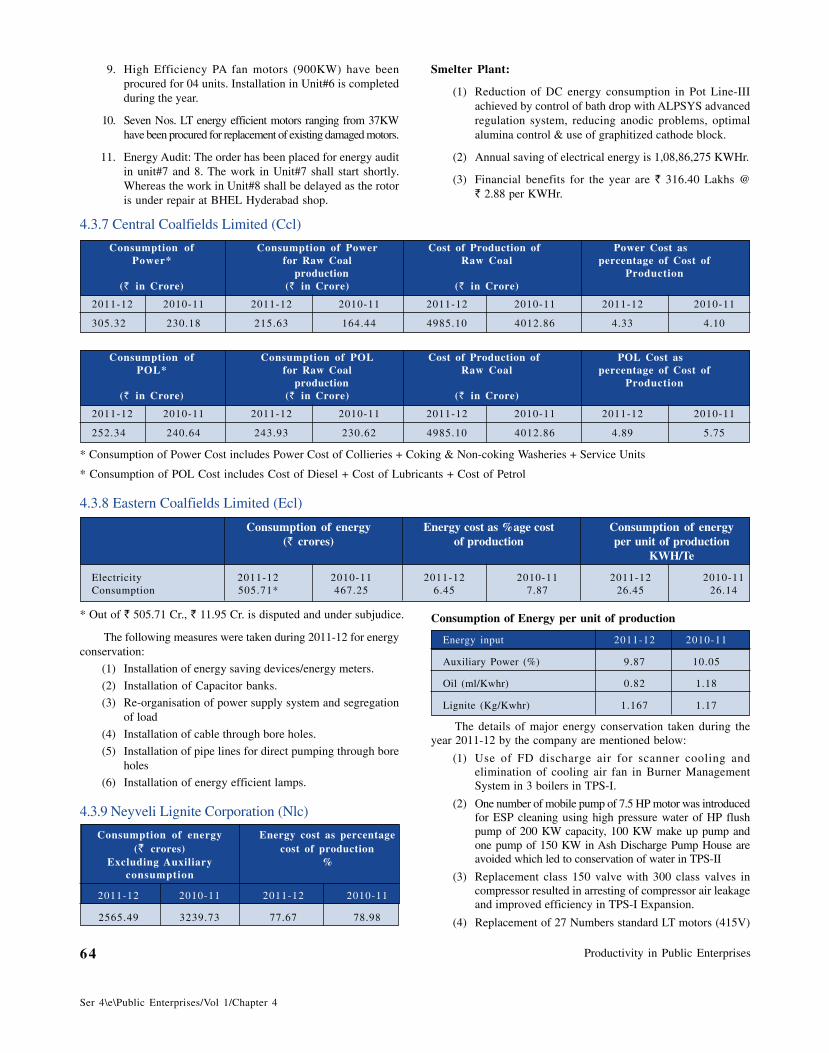
Productivity in Public Enterprises64
Ser 4\e\Public Enterprises/Vol 1/Chapter 4
9. High Efficiency PA fan motors (900KW) have beenprocured for 04 units. Installation in Unit#6 is completedduring the year.
10. Seven Nos. LT energy efficient motors ranging from 37KWhave been procured for replacement of existing damaged motors.
11. Energy Audit: The order has been placed for energy auditin unit#7 and 8. The work in Unit#7 shall start shortly.Whereas the work in Unit#8 shall be delayed as the rotoris under repair at BHEL Hyderabad shop.
Smelter Plant:
(1) Reduction of DC energy consumption in Pot Line-IIIachieved by control of bath drop with ALPSYS advancedregulation system, reducing anodic problems, optimalalumina control & use of graphitized cathode block.
(2) Annual saving of electrical energy is 1,08,86,275 KWHr.
(3) Financial benefits for the year are ` 316.40 Lakhs @` 2.88 per KWHr.
Consumption of Energy per unit of production
Energy input 2011-12 2010-11
Auxiliary Power (%) 9.87 10.05
Oil (ml/Kwhr) 0.82 1.18
Lignite (Kg/Kwhr) 1.167 1.17
The details of major energy conservation taken during theyear 2011-12 by the company are mentioned below:
(1) Use of FD discharge air for scanner cooling andelimination of cooling air fan in Burner ManagementSystem in 3 boilers in TPS-I.
(2) One number of mobile pump of 7.5 HP motor was introducedfor ESP cleaning using high pressure water of HP flushpump of 200 KW capacity, 100 KW make up pump andone pump of 150 KW in Ash Discharge Pump House areavoided which led to conservation of water in TPS-II
(3) Replacement class 150 valve with 300 class valves incompressor resulted in arresting of compressor air leakageand improved efficiency in TPS-I Expansion.
(4) Replacement of 27 Numbers standard LT motors (415V)
The following measures were taken during 2011-12 for energyconservation:
(1) Installation of energy saving devices/energy meters.
(2) Installation of Capacitor banks.
(3) Re-organisation of power supply system and segregationof load
(4) Installation of cable through bore holes.
(5) Installation of pipe lines for direct pumping through boreholes
(6) Installation of energy efficient lamps.
4.3.9 Neyveli Lignite Corporation (Nlc)
Consumption of energy Energy cost as percentage(` crores) cost of production
Excluding Auxiliary %consumption
2011-12 2010-11 2011-12 2010-11
2565.49 3239.73 77.67 78.98
4.3.7 Central Coalfields Limited (Ccl)
Consumption of Consumption of Power Cost of Production of Power Cost asPower* for Raw Coal Raw Coal percentage of Cost of
production Production(` in Crore) (` in Crore) (` in Crore)
2011-12 2010-11 2011-12 2010-11 2011-12 2010-11 2011-12 2010-11
305.32 230.18 215.63 164.44 4985.10 4012.86 4.33 4.10
Consumption of Consumption of POL Cost of Production of POL Cost asPOL* for Raw Coal Raw Coal percentage of Cost of
production Production(` in Crore) (` in Crore) (` in Crore)
2011-12 2010-11 2011-12 2010-11 2011-12 2010-11 2011-12 2010-11
252.34 240.64 243.93 230.62 4985.10 4012.86 4.89 5.75
* Consumption of Power Cost includes Power Cost of Collieries + Coking & Non-coking Washeries + Service Units
* Consumption of POL Cost includes Cost of Diesel + Cost of Lubricants + Cost of Petrol
4.3.8 Eastern Coalfields Limited (Ecl)
Consumption of energy Energy cost as %age cost Consumption of energy(` crores) of production per unit of production
KWH/Te
Electricity 2011-12 2010-11 2011-12 2010-11 2011-12 2010-11Consumption 505.71* 467.25 6.45 7.87 26.45 26.14
* Out of ` 505.71 Cr., ` 11.95 Cr. is disputed and under subjudice.
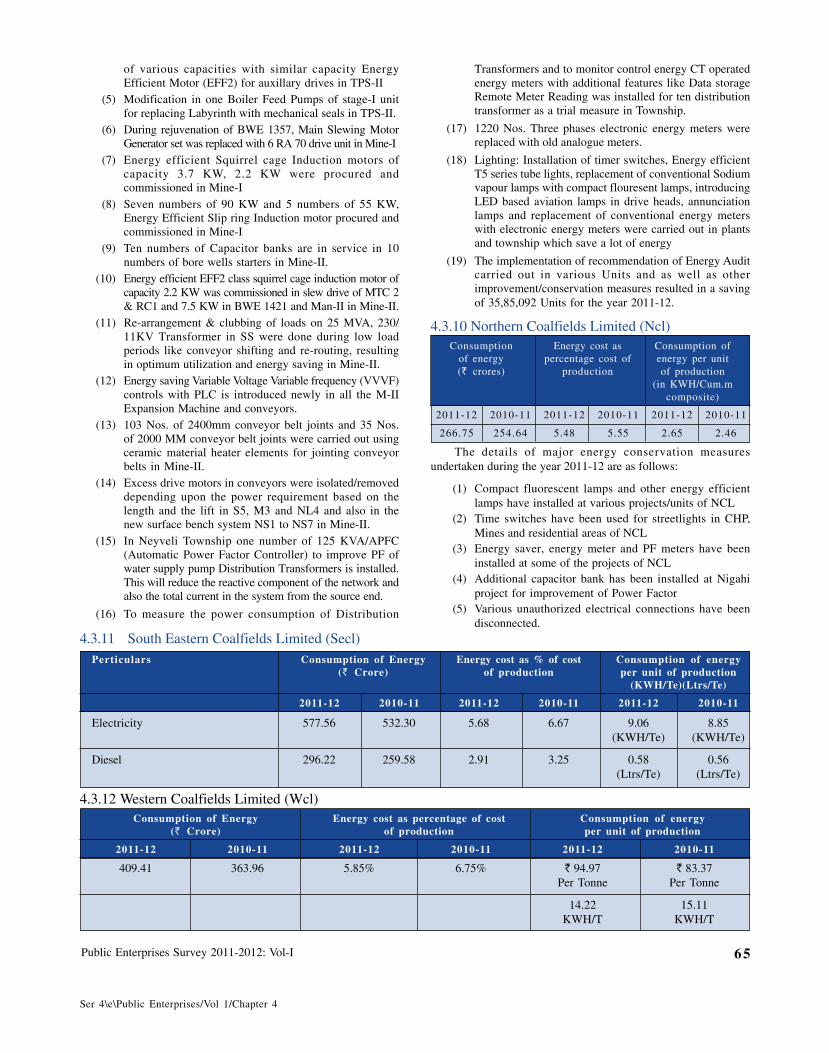
Public Enterprises Survey 2011-2012: Vol-I 65
Ser 4\e\Public Enterprises/Vol 1/Chapter 4
of various capacities with similar capacity EnergyEfficient Motor (EFF2) for auxillary drives in TPS-II
(5) Modification in one Boiler Feed Pumps of stage-I unitfor replacing Labyrinth with mechanical seals in TPS-II.
(6) During rejuvenation of BWE 1357, Main Slewing MotorGenerator set was replaced with 6 RA 70 drive unit in Mine-I
(7) Energy efficient Squirrel cage Induction motors ofcapacity 3.7 KW, 2.2 KW were procured andcommissioned in Mine-I
(8) Seven numbers of 90 KW and 5 numbers of 55 KW,Energy Efficient Slip ring Induction motor procured andcommissioned in Mine-I
(9) Ten numbers of Capacitor banks are in service in 10numbers of bore wells starters in Mine-II.
(10) Energy efficient EFF2 class squirrel cage induction motor ofcapacity 2.2 KW was commissioned in slew drive of MTC 2& RC1 and 7.5 KW in BWE 1421 and Man-II in Mine-II.
(11) Re-arrangement & clubbing of loads on 25 MVA, 230/11KV Transformer in SS were done during low loadperiods like conveyor shifting and re-routing, resultingin optimum utilization and energy saving in Mine-II.
(12) Energy saving Variable Voltage Variable frequency (VVVF)controls with PLC is introduced newly in all the M-IIExpansion Machine and conveyors.
(13) 103 Nos. of 2400mm conveyor belt joints and 35 Nos.of 2000 MM conveyor belt joints were carried out usingceramic material heater elements for jointing conveyorbelts in Mine-II.
(14) Excess drive motors in conveyors were isolated/removeddepending upon the power requirement based on thelength and the lift in S5, M3 and NL4 and also in thenew surface bench system NS1 to NS7 in Mine-II.
(15) In Neyveli Township one number of 125 KVA/APFC(Automatic Power Factor Controller) to improve PF ofwater supply pump Distribution Transformers is installed.This will reduce the reactive component of the network andalso the total current in the system from the source end.
(16) To measure the power consumption of Distribution
Transformers and to monitor control energy CT operatedenergy meters with additional features like Data storageRemote Meter Reading was installed for ten distributiontransformer as a trial measure in Township.
(17) 1220 Nos. Three phases electronic energy meters werereplaced with old analogue meters.
(18) Lighting: Installation of timer switches, Energy efficientT5 series tube lights, replacement of conventional Sodiumvapour lamps with compact flouresent lamps, introducingLED based aviation lamps in drive heads, annunciationlamps and replacement of conventional energy meterswith electronic energy meters were carried out in plantsand township which save a lot of energy
(19) The implementation of recommendation of Energy Auditcarried out in various Units and as well as otherimprovement/conservation measures resulted in a savingof 35,85,092 Units for the year 2011-12.
4.3.10 Northern Coalfields Limited (Ncl)Consumption Energy cost as Consumption of
of energy percentage cost of energy per unit(` crores) production of production
(in KWH/Cum.mcomposite)
2011-12 2010-11 2011-12 2010-11 2011-12 2010-11
266.75 254.64 5.48 5.55 2.65 2.46
The details of major energy conservation measuresundertaken during the year 2011-12 are as follows:
(1) Compact fluorescent lamps and other energy efficientlamps have installed at various projects/units of NCL
(2) Time switches have been used for streetlights in CHP,Mines and residential areas of NCL
(3) Energy saver, energy meter and PF meters have beeninstalled at some of the projects of NCL
(4) Additional capacitor bank has been installed at Nigahiproject for improvement of Power Factor
(5) Various unauthorized electrical connections have beendisconnected.
4.3.11 South Eastern Coalfields Limited (Secl)Perticulars Consumption of Energy Energy cost as % of cost Consumption of energy
(` Crore) of production per unit of production(KWH/Te)(Ltrs/Te)
2011-12 2010-11 2011-12 2010-11 2011-12 2010-11
Electricity 577.56 532.30 5.68 6.67 9.06 8.85(KWH/Te) (KWH/Te)
Diesel 296.22 259.58 2.91 3.25 0.58 0.56(Ltrs/Te) (Ltrs/Te)
4.3.12 Western Coalfields Limited (Wcl)Consumption of Energy Energy cost as percentage of cost Consumption of energy
(` Crore) of production per unit of production
2011-12 2010-11 2011-12 2010-11 2011-12 2010-11
409.41 363.96 5.85% 6.75% ` 94.97 ` 83.37Per Tonne Per Tonne
14.22 15.11KWH/T KWH/T
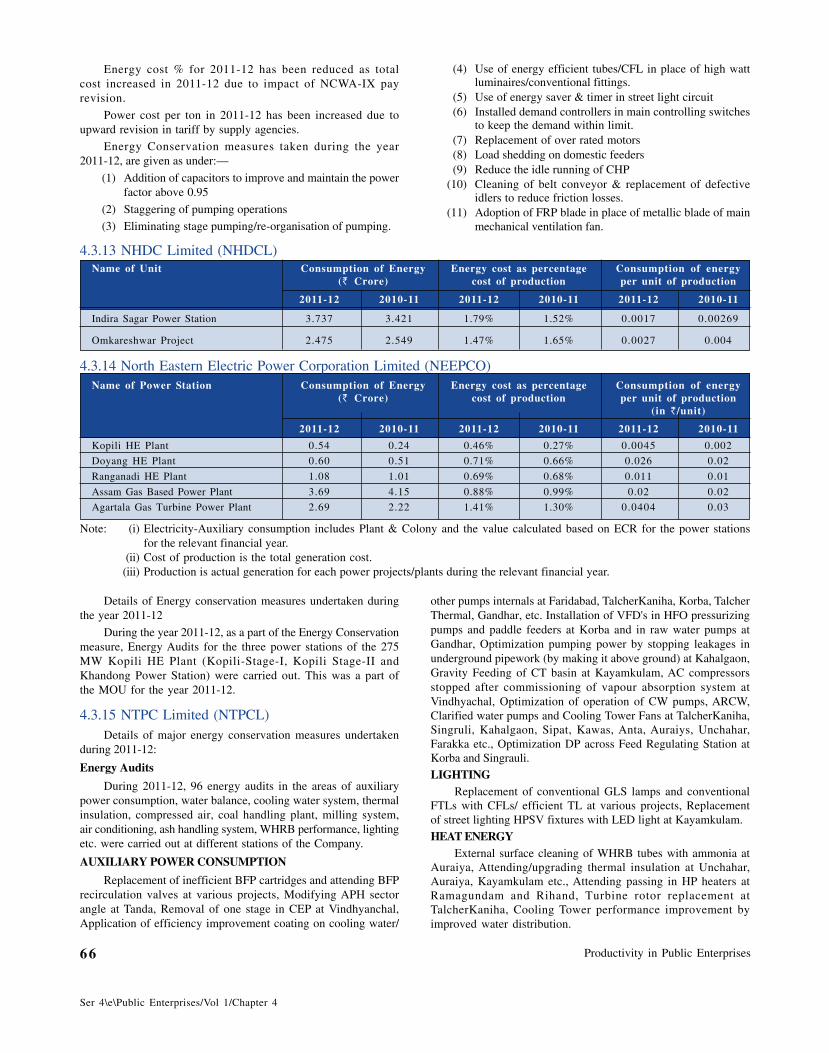
Productivity in Public Enterprises66
Ser 4\e\Public Enterprises/Vol 1/Chapter 4
Energy cost % for 2011-12 has been reduced as totalcost increased in 2011-12 due to impact of NCWA-IX payrevision.
Power cost per ton in 2011-12 has been increased due toupward revision in tariff by supply agencies.
Energy Conservation measures taken during the year2011-12, are given as under:—
(1) Addition of capacitors to improve and maintain the powerfactor above 0.95
(2) Staggering of pumping operations
(3) Eliminating stage pumping/re-organisation of pumping.
other pumps internals at Faridabad, TalcherKaniha, Korba, TalcherThermal, Gandhar, etc. Installation of VFD's in HFO pressurizingpumps and paddle feeders at Korba and in raw water pumps atGandhar, Optimization pumping power by stopping leakages inunderground pipework (by making it above ground) at Kahalgaon,Gravity Feeding of CT basin at Kayamkulam, AC compressorsstopped after commissioning of vapour absorption system atVindhyachal, Optimization of operation of CW pumps, ARCW,Clarified water pumps and Cooling Tower Fans at TalcherKaniha,Singruli, Kahalgaon, Sipat, Kawas, Anta, Auraiys, Unchahar,Farakka etc., Optimization DP across Feed Regulating Station atKorba and Singrauli.
LIGHTINGReplacement of conventional GLS lamps and conventional
FTLs with CFLs/ efficient TL at various projects, Replacementof street lighting HPSV fixtures with LED light at Kayamkulam.
HEAT ENERGYExternal surface cleaning of WHRB tubes with ammonia at
Auraiya, Attending/upgrading thermal insulation at Unchahar,Auraiya, Kayamkulam etc., Attending passing in HP heaters atRamagundam and Rihand, Turbine rotor replacement atTalcherKaniha, Cooling Tower performance improvement byimproved water distribution.
Details of Energy conservation measures undertaken duringthe year 2011-12
During the year 2011-12, as a part of the Energy Conservationmeasure, Energy Audits for the three power stations of the 275MW Kopili HE Plant (Kopili-Stage-I, Kopili Stage-II andKhandong Power Station) were carried out. This was a part ofthe MOU for the year 2011-12.
4.3.15 NTPC Limited (NTPCL)Details of major energy conservation measures undertaken
during 2011-12:
Energy Audits
During 2011-12, 96 energy audits in the areas of auxiliarypower consumption, water balance, cooling water system, thermalinsulation, compressed air, coal handling plant, milling system,air conditioning, ash handling system, WHRB performance, lightingetc. were carried out at different stations of the Company.
AUXILIARY POWER CONSUMPTION
Replacement of inefficient BFP cartridges and attending BFPrecirculation valves at various projects, Modifying APH sectorangle at Tanda, Removal of one stage in CEP at Vindhyanchal,Application of efficiency improvement coating on cooling water/
(4) Use of energy efficient tubes/CFL in place of high wattluminaires/conventional fittings.
(5) Use of energy saver & timer in street light circuit(6) Installed demand controllers in main controlling switches
to keep the demand within limit.(7) Replacement of over rated motors(8) Load shedding on domestic feeders(9) Reduce the idle running of CHP
(10) Cleaning of belt conveyor & replacement of defectiveidlers to reduce friction losses.
(11) Adoption of FRP blade in place of metallic blade of mainmechanical ventilation fan.
4.3.13 NHDC Limited (NHDCL)Name of Unit Consumption of Energy Energy cost as percentage Consumption of energy
(` Crore) cost of production per unit of production
2011-12 2010-11 2011-12 2010-11 2011-12 2010-11
Indira Sagar Power Station 3.737 3.421 1.79% 1.52% 0.0017 0.00269
Omkareshwar Project 2.475 2.549 1.47% 1.65% 0.0027 0.004
4.3.14 North Eastern Electric Power Corporation Limited (NEEPCO)Name of Power Station Consumption of Energy Energy cost as percentage Consumption of energy
(` Crore) cost of production per unit of production(in `/unit)
2011-12 2010-11 2011-12 2010-11 2011-12 2010-11
Kopili HE Plant 0.54 0.24 0.46% 0.27% 0.0045 0.002
Doyang HE Plant 0.60 0.51 0.71% 0.66% 0.026 0.02
Ranganadi HE Plant 1.08 1.01 0.69% 0.68% 0.011 0.01
Assam Gas Based Power Plant 3.69 4.15 0.88% 0.99% 0.02 0.02
Agartala Gas Turbine Power Plant 2.69 2.22 1.41% 1.30% 0.0404 0.03
Note: (i) Electricity-Auxiliary consumption includes Plant & Colony and the value calculated based on ECR for the power stationsfor the relevant financial year.
(ii) Cost of production is the total generation cost.(iii) Production is actual generation for each power projects/plants during the relevant financial year.
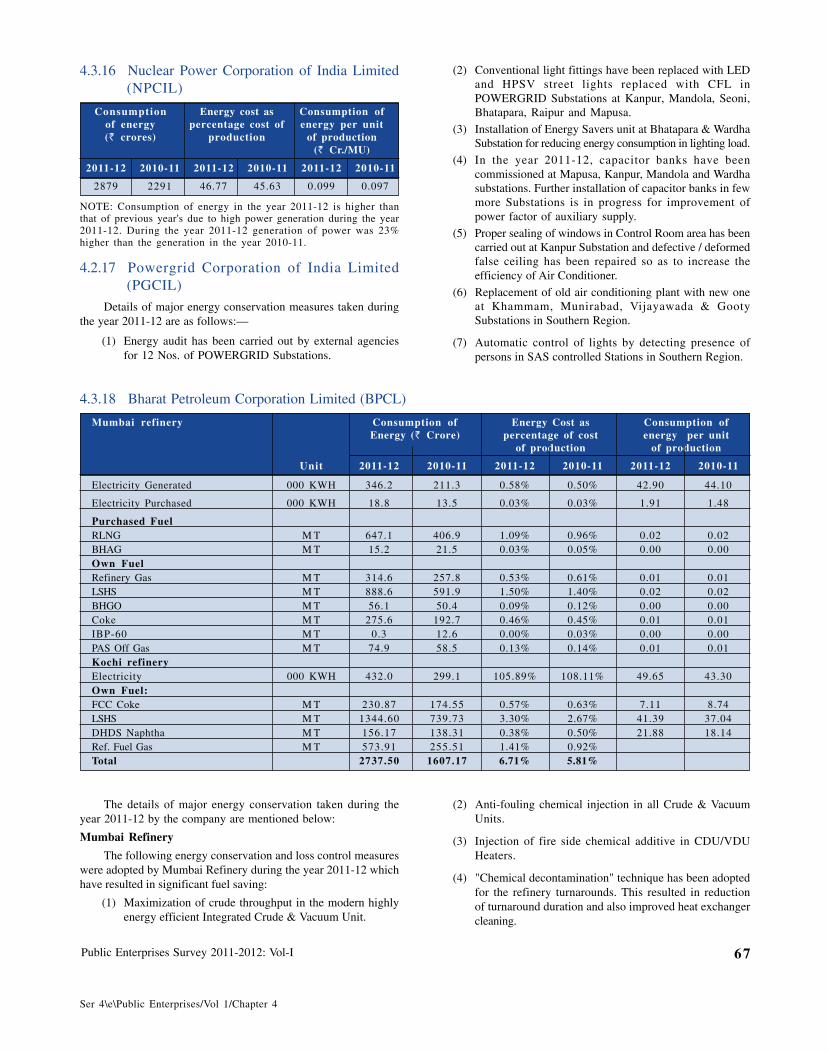
Public Enterprises Survey 2011-2012: Vol-I 67
Ser 4\e\Public Enterprises/Vol 1/Chapter 4
4.2.17 Powergrid Corporation of India Limited(PGCIL)
Details of major energy conservation measures taken duringthe year 2011-12 are as follows:—
(1) Energy audit has been carried out by external agenciesfor 12 Nos. of POWERGRID Substations.
(2) Conventional light fittings have been replaced with LEDand HPSV street lights replaced with CFL inPOWERGRID Substations at Kanpur, Mandola, Seoni,Bhatapara, Raipur and Mapusa.
(3) Installation of Energy Savers unit at Bhatapara & WardhaSubstation for reducing energy consumption in lighting load.
(4) In the year 2011-12, capacitor banks have beencommissioned at Mapusa, Kanpur, Mandola and Wardhasubstations. Further installation of capacitor banks in fewmore Substations is in progress for improvement ofpower factor of auxiliary supply.
(5) Proper sealing of windows in Control Room area has beencarried out at Kanpur Substation and defective / deformedfalse ceiling has been repaired so as to increase theefficiency of Air Conditioner.
(6) Replacement of old air conditioning plant with new oneat Khammam, Munirabad, Vijayawada & GootySubstations in Southern Region.
(7) Automatic control of lights by detecting presence ofpersons in SAS controlled Stations in Southern Region.
4.3.18 Bharat Petroleum Corporation Limited (BPCL)
Mumbai refinery Consumption of Energy Cost as Consumption ofEnergy (` Crore) percentage of cost energy per unit
of production of production
Unit 2011-12 2010-11 2011-12 2010-11 2011-12 2010-11
Electricity Generated 000 KWH 346.2 211.3 0.58% 0.50% 42.90 44.10
Electricity Purchased 000 KWH 18.8 13.5 0.03% 0.03% 1.91 1.48
Purchased FuelRLNG M T 647.1 406.9 1.09% 0.96% 0.02 0.02BHAG M T 15.2 21.5 0.03% 0.05% 0.00 0.00Own FuelRefinery Gas M T 314.6 257.8 0.53% 0.61% 0.01 0.01LSHS M T 888.6 591.9 1.50% 1.40% 0.02 0.02BHGO M T 56.1 50.4 0.09% 0.12% 0.00 0.00Coke M T 275.6 192.7 0.46% 0.45% 0.01 0.01IBP-60 M T 0.3 12.6 0.00% 0.03% 0.00 0.00PAS Off Gas M T 74.9 58.5 0.13% 0.14% 0.01 0.01Kochi refineryElectricity 000 KWH 432.0 299.1 105.89% 108.11% 49.65 43.30Own Fuel:FCC Coke M T 230.87 174.55 0.57% 0.63% 7.11 8.74LSHS M T 1344.60 739.73 3.30% 2.67% 41.39 37.04DHDS Naphtha M T 156.17 138.31 0.38% 0.50% 21.88 18.14Ref. Fuel Gas M T 573.91 255.51 1.41% 0.92%Total 2737.50 1607.17 6.71% 5.81%
(2) Anti-fouling chemical injection in all Crude & VacuumUnits.
(3) Injection of fire side chemical additive in CDU/VDUHeaters.
(4) "Chemical decontamination" technique has been adoptedfor the refinery turnarounds. This resulted in reductionof turnaround duration and also improved heat exchangercleaning.
The details of major energy conservation taken during theyear 2011-12 by the company are mentioned below:
Mumbai Refinery
The following energy conservation and loss control measureswere adopted by Mumbai Refinery during the year 2011-12 whichhave resulted in significant fuel saving:
(1) Maximization of crude throughput in the modern highlyenergy efficient Integrated Crude & Vacuum Unit.
4.3.16 Nuclear Power Corporation of India Limited(NPCIL)
Consumption Energy cost as Consumption ofof energy percentage cost of energy per unit(` crores) production of production
(` Cr./MU)
2011-12 2010-11 2011-12 2010-11 2011-12 2010-11
2879 2291 46.77 45.63 0.099 0.097
NOTE: Consumption of energy in the year 2011-12 is higher thanthat of previous year's due to high power generation during the year2011-12. During the year 2011-12 generation of power was 23%higher than the generation in the year 2010-11.
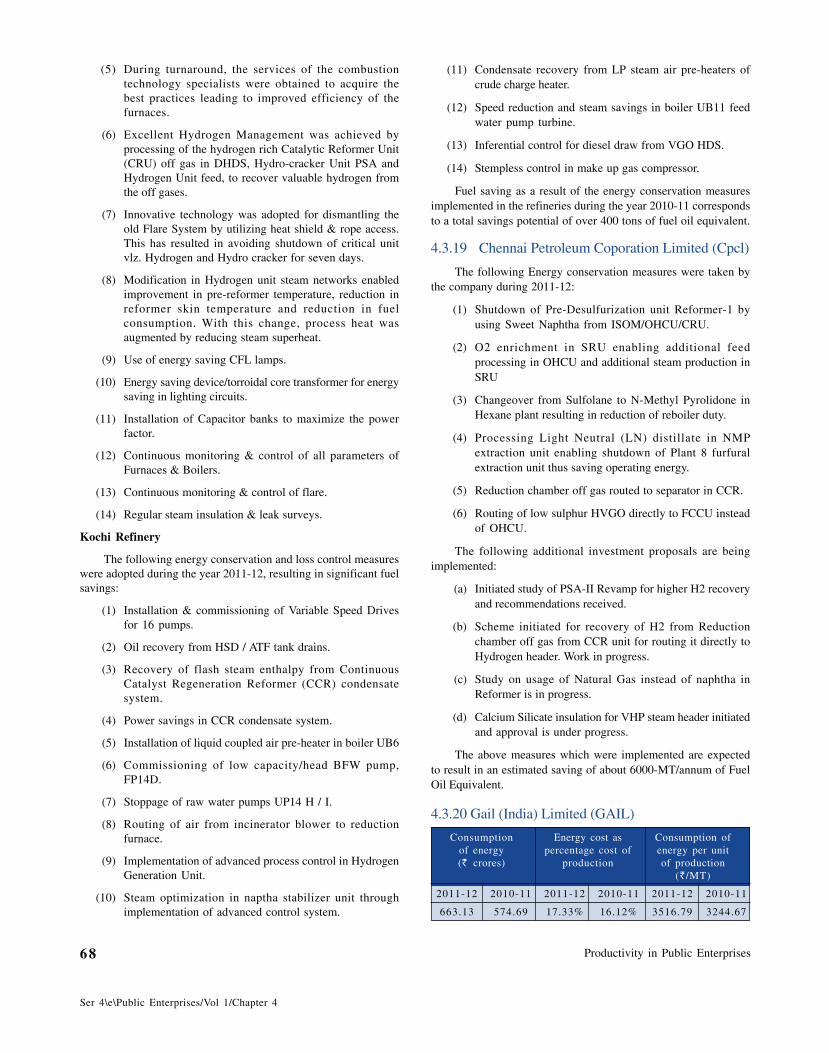
Productivity in Public Enterprises68
Ser 4\e\Public Enterprises/Vol 1/Chapter 4
(5) During turnaround, the services of the combustiontechnology specialists were obtained to acquire thebest practices leading to improved efficiency of thefurnaces.
(6) Excellent Hydrogen Management was achieved byprocessing of the hydrogen rich Catalytic Reformer Unit(CRU) off gas in DHDS, Hydro-cracker Unit PSA andHydrogen Unit feed, to recover valuable hydrogen fromthe off gases.
(7) Innovative technology was adopted for dismantling theold Flare System by utilizing heat shield & rope access.This has resulted in avoiding shutdown of critical unitvlz. Hydrogen and Hydro cracker for seven days.
(8) Modification in Hydrogen unit steam networks enabledimprovement in pre-reformer temperature, reduction inreformer skin temperature and reduction in fuelconsumption. With this change, process heat wasaugmented by reducing steam superheat.
(9) Use of energy saving CFL lamps.
(10) Energy saving device/torroidal core transformer for energysaving in lighting circuits.
(11) Installation of Capacitor banks to maximize the powerfactor.
(12) Continuous monitoring & control of all parameters ofFurnaces & Boilers.
(13) Continuous monitoring & control of flare.
(14) Regular steam insulation & leak surveys.
Kochi Refinery
The following energy conservation and loss control measureswere adopted during the year 2011-12, resulting in significant fuelsavings:
(1) Installation & commissioning of Variable Speed Drivesfor 16 pumps.
(2) Oil recovery from HSD / ATF tank drains.
(3) Recovery of flash steam enthalpy from ContinuousCatalyst Regeneration Reformer (CCR) condensatesystem.
(4) Power savings in CCR condensate system.
(5) Installation of liquid coupled air pre-heater in boiler UB6
(6) Commissioning of low capacity/head BFW pump,FP14D.
(7) Stoppage of raw water pumps UP14 H / I.
(8) Routing of air from incinerator blower to reductionfurnace.
(9) Implementation of advanced process control in HydrogenGeneration Unit.
(10) Steam optimization in naptha stabilizer unit throughimplementation of advanced control system.
(11) Condensate recovery from LP steam air pre-heaters ofcrude charge heater.
(12) Speed reduction and steam savings in boiler UB11 feedwater pump turbine.
(13) Inferential control for diesel draw from VGO HDS.
(14) Stempless control in make up gas compressor.
Fuel saving as a result of the energy conservation measuresimplemented in the refineries during the year 2010-11 correspondsto a total savings potential of over 400 tons of fuel oil equivalent.
4.3.19 Chennai Petroleum Coporation Limited (Cpcl)
The following Energy conservation measures were taken bythe company during 2011-12:
(1) Shutdown of Pre-Desulfurization unit Reformer-1 byusing Sweet Naphtha from ISOM/OHCU/CRU.
(2) O2 enrichment in SRU enabling additional feedprocessing in OHCU and additional steam production inSRU
(3) Changeover from Sulfolane to N-Methyl Pyrolidone inHexane plant resulting in reduction of reboiler duty.
(4) Processing Light Neutral (LN) distillate in NMPextraction unit enabling shutdown of Plant 8 furfuralextraction unit thus saving operating energy.
(5) Reduction chamber off gas routed to separator in CCR.
(6) Routing of low sulphur HVGO directly to FCCU insteadof OHCU.
The following additional investment proposals are beingimplemented:
(a) Initiated study of PSA-II Revamp for higher H2 recoveryand recommendations received.
(b) Scheme initiated for recovery of H2 from Reductionchamber off gas from CCR unit for routing it directly toHydrogen header. Work in progress.
(c) Study on usage of Natural Gas instead of naphtha inReformer is in progress.
(d) Calcium Silicate insulation for VHP steam header initiatedand approval is under progress.
The above measures which were implemented are expectedto result in an estimated saving of about 6000-MT/annum of FuelOil Equivalent.
4.3.20 Gail (India) Limited (GAIL)
Consumption Energy cost as Consumption ofof energy percentage cost of energy per unit(` crores) production of production
(`/MT)
2011-12 2010-11 2011-12 2010-11 2011-12 2010-11
663.13 574.69 17.33% 16.12% 3516.79 3244.67
Public Enterprises Survey 2011-2012: Vol-I 69
Ser 4\e\Public Enterprises/Vol 1/Chapter 4
The details of major energy conservation measuresundertaken during the year 2011-12 are as under:—
1. GAIL PATA
i. Replacement of Existing 50 Nos. 200W GLS lamps byenergy efficient 45W CFL:Replacement of Existing50 Nos. 200W GLS lamps by energy efficient 45W CFLdone in the plant area. This measure resulted in annualenergy saving of 33,480 KWh and monetary saving ofabout ` 1.33 lakh per annum.
ii. Installation of Energy saver in lighting Circuit: LightingCircuit of about 43.6 kw load normally connected withthe lighting transformer output 240V AC. Lighting Circuitis modified with installation of Energy saver resulted inannual saving of ` 62,208.
iii. Implementation of logic of auto stoppage of blower ofEmpty Blender-2, 3 & 4: Implementation of logic of autostoppage of blower of Empty Blenders (Nos. 2, 3 & 4)in LLDPE Plant resulted in monetary saving of about` 12.50 lakh per annum
2. GPU-Gandhar
i. Recovery of LPG vapour during statutory inspection ofLPG Mounded Bullets: Statutory internal inspection ofbullets entails evacuation of hydrocarbon and inertizationbefore taking up the inspection for safety reasons. Asper standard practice LPG liquid from the bullet is beingpumped out to the extent possible till the loading pumpsleaves the load. Remaining hydrocarbons are being flaredout. During current year at GPU Gandhar liquid hydrocarbon vapour were recovered by installing the vapourrecovery compressor till pressure reduced to ~ 1.0 to 1.5Kg/cm2g. This operation led to saving of almost 200 MTof LPG. The corresponding saving is to the extent of` 10.0 lacs in addition to reduction of 202 MT of CO2emissions.
ii. Installation of LPG Condenser Trim Cooler: Toefficiently handle the vapour load and pressure of theLPG column due to varying ambient weather conditionsespecially during the summer season, LPG trim coolercondenser has been installed at GPU Gandhar. Themodification facilitated in stoppage of all existing motordriven LPG condenser Air Cooler fans and resulting insaving of ` 13 Lakhs/year on account of electrical energysaving. Further, implementation of this project haspotential of additional recovery of ~1600 MT of LPGper annum during summer, which corresponds to around` 80 Lacs/year additional profit.
iii. Retrofitting of RG heater with PLC based BurnerManagement System: Improved burner with PLC basedBurner management system has been installed for RGheaters to replaced earlier inefficient burners with manualcontrol at GPU Gandhar with an investment of around` 89.95 Lakhs. The new PLC based Burner managementsystem result in fuel saving of around 201960000 Kcal/annum of natural gas which corresponds to saving of` 14.67 Lacs/year.
3. LPG Recovery Plant, Vaghodia
i. Retrofitting of RG heater with PLC based BurnerManagement System
GPU Vaghodia is having hot oil system for re-boiling ofLHC in the distillation columns during the fractionationprocess for the recovery of LPG. The hot oil supplied inthese reboilers is being heated in Hot Oil heater.
The hot oil heater had conventional type of gas firedheater having pilot operated four natural draft burners.The new system has changed the present furnace fromnatural draft to forced draft having proper controlsystem for maintaining air to fuel ratio thus eliminatingexcess air as well as wastage of sensible heat loss. Thus,this retrofitting in Hot Oil Heater has improved thecombustion efficiency thereby reducing the fuel gasconsumption. The estimated reduction of fuel is 30 % ofpresent level (the estimated annual saving in terms ofenergy with respect to current level is expected in orderof 6404651 KWH).
The new system is also having intelligent PLC basedsequential operation & control of heater lighting up withflame failure detection and associated safety interlocksto reduce the operating hazard.
ii. Heat Exchanger Project - Cooling of Feed Gas Supplyto GPU Vaghodia
The feed gas temperature has significant effect on therecovery of LPG as the liquification of the natural gasdecreases with increase in feed gas temperature thusaffecting LPG recovery. GPU Vaghodia does not haveany external refrigeration system for feed gas cooling.
Feed gas to GPU, Vaghodia is supplied from GREPcompressor discharge. The feed gas temperature to GPUremains very high from the design temperature of 35°Cin spite of rerouting of it through IP-2 station in orderto use natural cooling gained by the gas by travelling arelatively longer distance.
This scheme of Heat Exchanger was carried out forpressure reduction in SGPL Network as required by thecustomers as well as to cool the feed gas supply to GPUVaghodia by utilizingthe cooling of RLNG achieved inreducing the pressure from 85 kg to 45 kg. The annualenergy saved is calculated to 5602326 KWh/year.
iii. Heat Recovery Steam Generation Project
The compressor station at GAIL, Vaghodia wascommissioned in 1998 to compress about 31.8MMSCMD of natural gas through underground HVJpipeline. We are in process of setting up of a HeatRecovery Steam Generation (HRSG) Project. The HRSGboiler is an unfired, natural circulation, and HorizontalHeat Recovery Steam Generator which is installed in theexhaust of each gas turbine. The Capacity of Steamgeneration is proposed to be 60 tons/hour.
The steam shall be supplied to M/s. Apollo TyresLimited and the D. M. water required for the generation

Productivity in Public Enterprises70
Ser 4\e\Public Enterprises/Vol 1/Chapter 4
of same shall be supplied by M/s. Apollo Tyres Limited.Apart from reduction of thermal load on the environment,the Heat Recovery Steam Generation Project will alsosave an energy equivalent of 446350 Mwh annually. Itis calculated that an amount of 80589 EquivalentGHGReduction (Tonnes CO2-e.) would be done, if the sameenergy is assumed to be produced by Natural Gas forSteam Generation.
iv. Replacement of Halon 1301 with Novec 1230
The fire protection system for the LPG control roomwas replaced from Halon 1301 to Novec 1230. ThePhased out substance was having Ozone DepletingPotential and Global Warming Potential of 10 and 6900respectively. While the new substance i.e. Novec 1230is having Ozone Depleting Potential and Global WarmingPotential of 0 and <1 respectively.
4.3.21 Hindustan Petroleum Corporation Limited (HPCL)
Energy inputs Consumption of Energy Energy cost as percentage Consumption of energy(` Crore) cost of production per unit of production
(KWH/T of Crude forElectricity & Ton/TMTof Crude for others)
2011-12 2010-11 2011-12 2010-11 2011-12 2010-11
HPCL MR
Electricity 283.2 139.0 0.89 0.68 87.3 72.88
Liquid fuel 512.8 366.2 1.61 1.79 19.2 21.77
Fuel gas 914.3 583.7 2.88 2.85 39.9 40.13
Coke 239.2 82.7 0.75 0.40 9.0 4.91
HPCL VR
Electricity 458.4 313.8 1.43 1.39 61.9 54.79
Liquid fuel 1326.7 1047.2 4.14 4.65 35.5 39.94
Fuel gas 713.1 402.5 2.23 1.79 23.0 18.57
Coke 265.1 154.0 0.83 0.68 8.5 7.08
Visakh Refinery:
(1) Make up water heater was commissioned in one of theHRSGs (HRSG 6), resulting in considerable amount ofenergy saving.
(2) Antifoulant injection was carried out at SR side ofcrude/SR preheat exchangers in CDU-III, thus enablingreduced fouling of exchanger and hence resulting inenergy saving.
(3) Periodic steam leak survey and steam trap survey wascarried out for the entire Refinery by engaging externalsurveyor using ultrasonic detector and visual methods asa part of regular steam leak monitoring. Arresting of steamleaks was carried out.
(4) Operation of new boiler with higher efficiency in lieu of oldboiler, resulted in better steam to fuel ratio and fuel saving.
(5) Reduction in specific fuel consumption achieved in CPPby operation of GTGs at higher loads.
(6) Online chemical cleaning of CDU-I, CDU-II, CDU-III &DHDS furnaces was carried out, which resulted in reducedstack temperatures and increased heater efficiencies.
The details of major energy conservation taken during theyear 2011-12 by the company are mentioned below:
Mumbai Refinery:
(1) In an effort to recover hydrocarbon losses, refinery hascommissioned a flare gas recovery system at LubeRefinery, thereby reducing the overall flare losses. Thefacility was commissioned during the second quarter of2011-12.
(2) Refinery has installed Magnetic Resonators at GasTurbine Generators (GTG III & GTG V) for increasingthe combustion efficiency and reducing the carbonemissions. This has resulted in reduction of fuelconsumption by 0.8%
(3) Naphtha Splitter Unit (NSU) furnace efficiencyimprovement was carried out resulting in lower fuelconsumption. Furthermore, maximization of hot feed fromCrude Distillation Unit (CDU I/II) Naphtha stabilizer toNSU has resulted in substantial amount of energysavings.
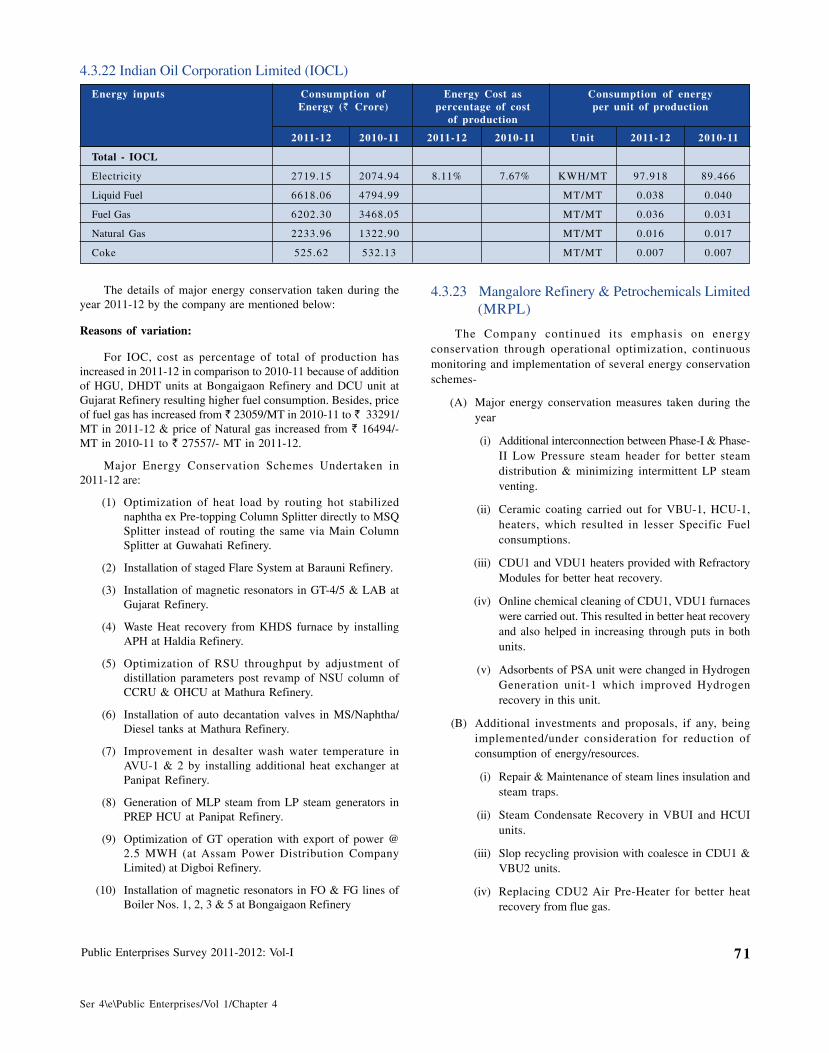
Public Enterprises Survey 2011-2012: Vol-I 71
Ser 4\e\Public Enterprises/Vol 1/Chapter 4
4.3.22 Indian Oil Corporation Limited (IOCL)
Energy inputs Consumption of Energy Cost as Consumption of energyEnergy (` Crore) percentage of cost per unit of production
of production
2011-12 2010-11 2011-12 2010-11 Unit 2011-12 2010-11
Total - IOCL
Electricity 2719.15 2074.94 8.11% 7.67% KWH/MT 97.918 89.466
Liquid Fuel 6618.06 4794.99 MT/MT 0.038 0.040
Fuel Gas 6202.30 3468.05 MT/MT 0.036 0.031
Natural Gas 2233.96 1322.90 MT/MT 0.016 0.017
Coke 525.62 532.13 MT/MT 0.007 0.007
4.3.23 Mangalore Refinery & Petrochemicals Limited(MRPL)
The Company continued its emphasis on energyconservation through operational optimization, continuousmonitoring and implementation of several energy conservationschemes-
(A) Major energy conservation measures taken during theyear
(i) Additional interconnection between Phase-I & Phase-II Low Pressure steam header for better steamdistribution & minimizing intermittent LP steamventing.
(ii) Ceramic coating carried out for VBU-1, HCU-1,heaters, which resulted in lesser Specific Fuelconsumptions.
(iii) CDU1 and VDU1 heaters provided with RefractoryModules for better heat recovery.
(iv) Online chemical cleaning of CDU1, VDU1 furnaceswere carried out. This resulted in better heat recoveryand also helped in increasing through puts in bothunits.
(v) Adsorbents of PSA unit were changed in HydrogenGeneration unit-1 which improved Hydrogenrecovery in this unit.
(B) Additional investments and proposals, if any, beingimplemented/under consideration for reduction ofconsumption of energy/resources.
(i) Repair & Maintenance of steam lines insulation andsteam traps.
(ii) Steam Condensate Recovery in VBUI and HCUIunits.
(iii) Slop recycling provision with coalesce in CDU1 &VBU2 units.
(iv) Replacing CDU2 Air Pre-Heater for better heatrecovery from flue gas.
The details of major energy conservation taken during theyear 2011-12 by the company are mentioned below:
Reasons of variation:
For IOC, cost as percentage of total of production hasincreased in 2011-12 in comparison to 2010-11 because of additionof HGU, DHDT units at Bongaigaon Refinery and DCU unit atGujarat Refinery resulting higher fuel consumption. Besides, priceof fuel gas has increased from ` 23059/MT in 2010-11 to ` 33291/MT in 2011-12 & price of Natural gas increased from ` 16494/-MT in 2010-11 to ` 27557/- MT in 2011-12.
Major Energy Conservation Schemes Undertaken in2011-12 are:
(1) Optimization of heat load by routing hot stabilizednaphtha ex Pre-topping Column Splitter directly to MSQSplitter instead of routing the same via Main ColumnSplitter at Guwahati Refinery.
(2) Installation of staged Flare System at Barauni Refinery.
(3) Installation of magnetic resonators in GT-4/5 & LAB atGujarat Refinery.
(4) Waste Heat recovery from KHDS furnace by installingAPH at Haldia Refinery.
(5) Optimization of RSU throughput by adjustment ofdistillation parameters post revamp of NSU column ofCCRU & OHCU at Mathura Refinery.
(6) Installation of auto decantation valves in MS/Naphtha/Diesel tanks at Mathura Refinery.
(7) Improvement in desalter wash water temperature inAVU-1 & 2 by installing additional heat exchanger atPanipat Refinery.
(8) Generation of MLP steam from LP steam generators inPREP HCU at Panipat Refinery.
(9) Optimization of GT operation with export of power @2.5 MWH (at Assam Power Distribution CompanyLimited) at Digboi Refinery.
(10) Installation of magnetic resonators in FO & FG lines ofBoiler Nos. 1, 2, 3 & 5 at Bongaigaon Refinery
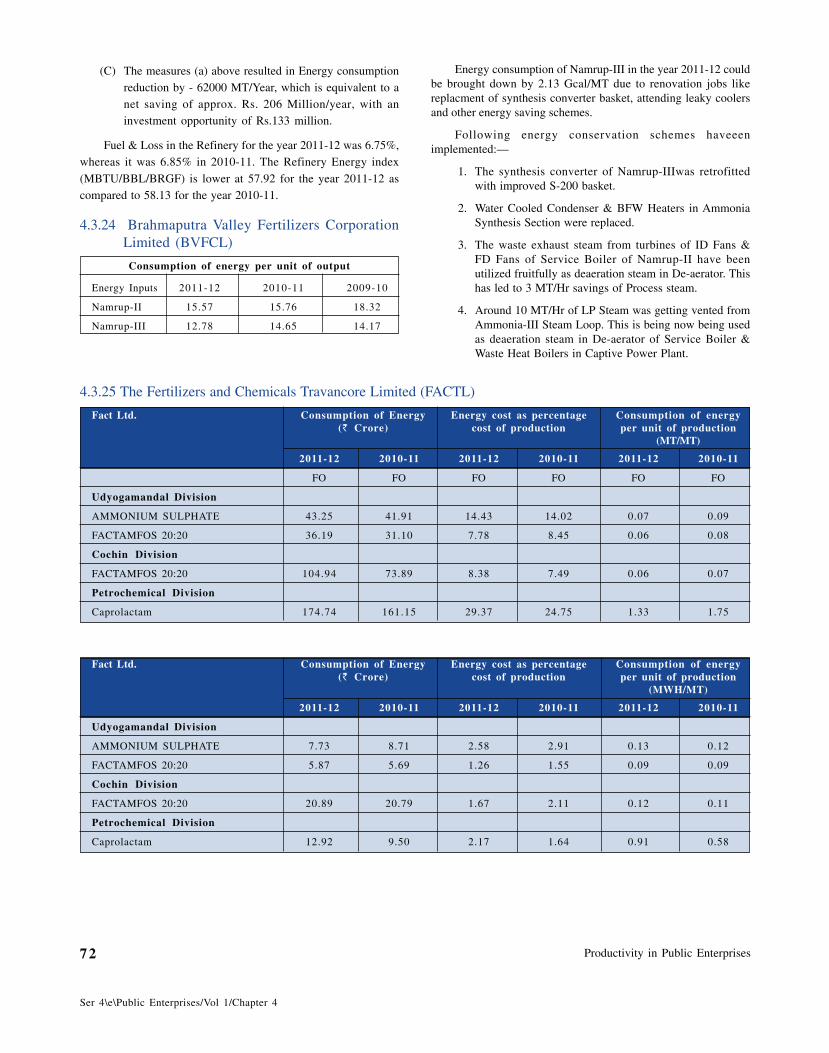
Productivity in Public Enterprises72
Ser 4\e\Public Enterprises/Vol 1/Chapter 4
(C) The measures (a) above resulted in Energy consumptionreduction by - 62000 MT/Year, which is equivalent to anet saving of approx. Rs. 206 Million/year, with aninvestment opportunity of Rs.133 million.
Fuel & Loss in the Refinery for the year 2011-12 was 6.75%,whereas it was 6.85% in 2010-11. The Refinery Energy index
(MBTU/BBL/BRGF) is lower at 57.92 for the year 2011-12 ascompared to 58.13 for the year 2010-11.
4.3.24 Brahmaputra Valley Fertilizers CorporationLimited (BVFCL)
Consumption of energy per unit of output
Energy Inputs 2011-12 2010-11 2009-10
Namrup-II 15.57 15.76 18.32
Namrup-III 12.78 14.65 14.17
Energy consumption of Namrup-III in the year 2011-12 couldbe brought down by 2.13 Gcal/MT due to renovation jobs likereplacment of synthesis converter basket, attending leaky coolersand other energy saving schemes.
Following energy conservation schemes haveeenimplemented:—
1. The synthesis converter of Namrup-IIIwas retrofittedwith improved S-200 basket.
2. Water Cooled Condenser & BFW Heaters in AmmoniaSynthesis Section were replaced.
3. The waste exhaust steam from turbines of ID Fans &FD Fans of Service Boiler of Namrup-II have beenutilized fruitfully as deaeration steam in De-aerator. Thishas led to 3 MT/Hr savings of Process steam.
4. Around 10 MT/Hr of LP Steam was getting vented fromAmmonia-III Steam Loop. This is being now being usedas deaeration steam in De-aerator of Service Boiler &Waste Heat Boilers in Captive Power Plant.
4.3.25 The Fertilizers and Chemicals Travancore Limited (FACTL)
Fact Ltd. Consumption of Energy Energy cost as percentage Consumption of energy(` Crore) cost of production per unit of production
(MT/MT)
2011-12 2010-11 2011-12 2010-11 2011-12 2010-11
FO FO FO FO FO FO
Udyogamandal Division
AMMONIUM SULPHATE 43.25 41.91 14.43 14.02 0.07 0.09
FACTAMFOS 20:20 36.19 31.10 7.78 8.45 0.06 0.08
Cochin Division
FACTAMFOS 20:20 104.94 73.89 8.38 7.49 0.06 0.07
Petrochemical Division
Caprolactam 174.74 161.15 29.37 24.75 1.33 1.75
Fact Ltd. Consumption of Energy Energy cost as percentage Consumption of energy(` Crore) cost of production per unit of production
(MWH/MT)
2011-12 2010-11 2011-12 2010-11 2011-12 2010-11
Udyogamandal Division
AMMONIUM SULPHATE 7.73 8.71 2.58 2.91 0.13 0.12
FACTAMFOS 20:20 5.87 5.69 1.26 1.55 0.09 0.09
Cochin Division
FACTAMFOS 20:20 20.89 20.79 1.67 2.11 0.12 0.11
Petrochemical Division
Caprolactam 12.92 9.50 2.17 1.64 0.91 0.58
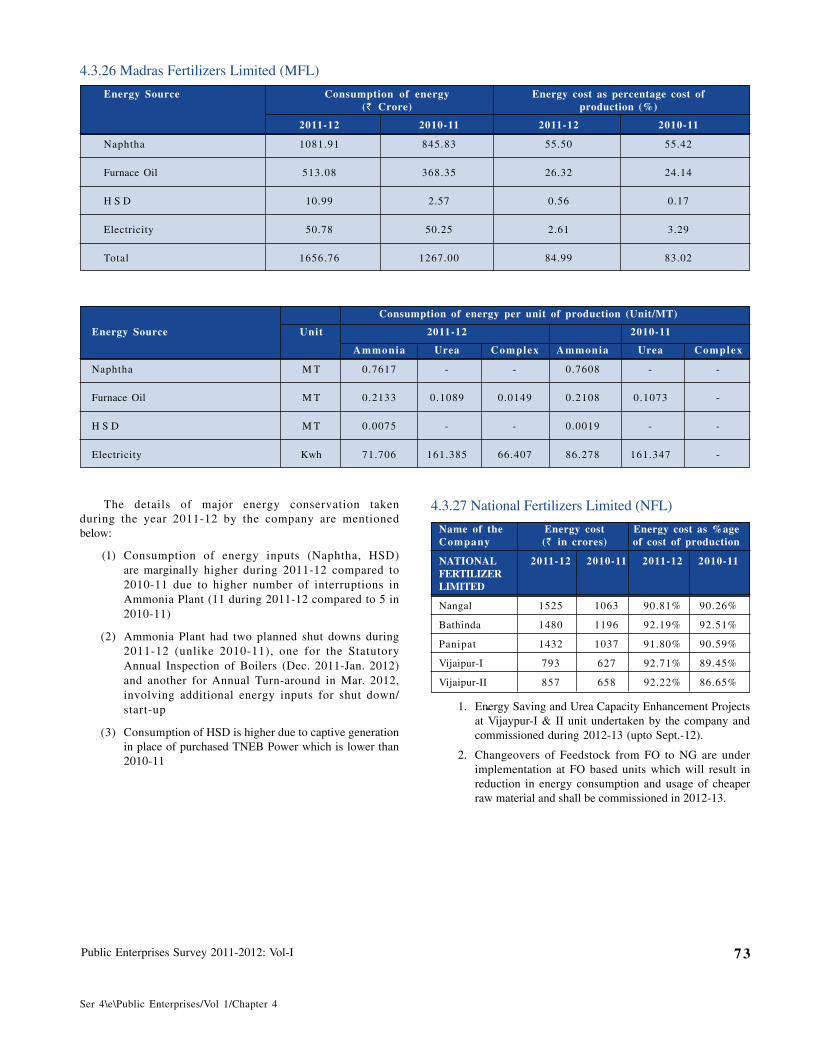
Public Enterprises Survey 2011-2012: Vol-I 73
Ser 4\e\Public Enterprises/Vol 1/Chapter 4
4.3.26 Madras Fertilizers Limited (MFL)
Energy Source Consumption of energy Energy cost as percentage cost of(` Crore) production (%)
2011-12 2010-11 2011-12 2010-11
Naphtha 1081.91 845.83 55.50 55.42
Furnace Oil 513.08 368.35 26.32 24.14
H S D 10.99 2.57 0.56 0.17
Electricity 50.78 50.25 2.61 3.29
Total 1656.76 1267.00 84.99 83.02
Consumption of energy per unit of production (Unit/MT)
Energy Source Unit 2011-12 2010-11
Ammonia Urea Complex Ammonia Urea Complex
Naphtha M T 0.7617 - - 0.7608 - -
Furnace Oil M T 0.2133 0.1089 0.0149 0.2108 0.1073 -
H S D M T 0.0075 - - 0.0019 - -
Electricity Kwh 71.706 161.385 66.407 86.278 161.347 -
4.3.27 National Fertilizers Limited (NFL)
Name of the Energy cost Energy cost as %ageCompany (` in crores) of cost of production
NATIONAL 2011-12 2010-11 2011-12 2010-11FERTILIZERLIMITED
Nangal 1525 1063 90.81% 90.26%
Bathinda 1480 1196 92.19% 92.51%
Panipat 1432 1037 91.80% 90.59%
Vijaipur-I 793 627 92.71% 89.45%
Vijaipur-II 857 658 92.22% 86.65%
1. Energy Saving and Urea Capacity Enhancement Projectsat Vijaypur-I & II unit undertaken by the company andcommissioned during 2012-13 (upto Sept.-12).
2. Changeovers of Feedstock from FO to NG are underimplementation at FO based units which will result inreduction in energy consumption and usage of cheaperraw material and shall be commissioned in 2012-13.
The details of major energy conservation takenduring the year 2011-12 by the company are mentionedbelow:
(1) Consumption of energy inputs (Naphtha, HSD)are marginally higher during 2011-12 compared to2010-11 due to higher number of interruptions inAmmonia Plant (11 during 2011-12 compared to 5 in2010-11)
(2) Ammonia Plant had two planned shut downs during2011-12 (unlike 2010-11), one for the StatutoryAnnual Inspection of Boilers (Dec. 2011-Jan. 2012)and another for Annual Turn-around in Mar. 2012,involving additional energy inputs for shut down/start-up
(3) Consumption of HSD is higher due to captive generationin place of purchased TNEB Power which is lower than2010-11
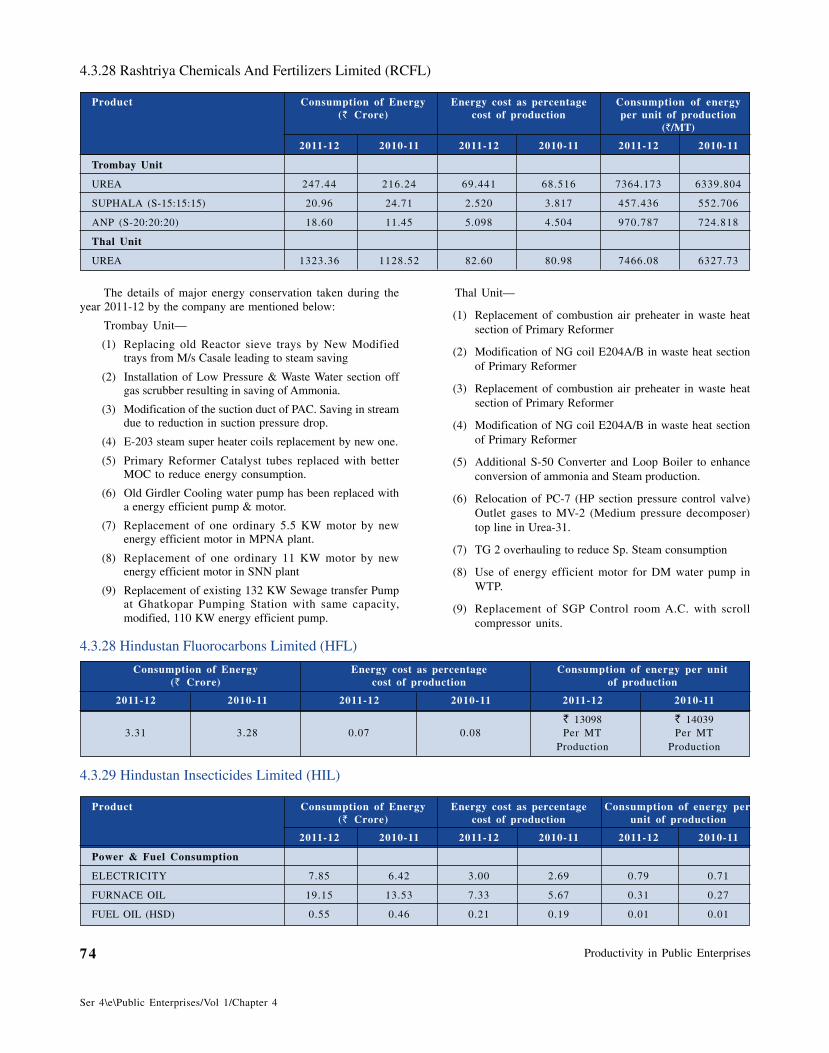
Productivity in Public Enterprises74
Ser 4\e\Public Enterprises/Vol 1/Chapter 4
4.3.28 Rashtriya Chemicals And Fertilizers Limited (RCFL)
Product Consumption of Energy Energy cost as percentage Consumption of energy(` Crore) cost of production per unit of production
(`/MT)
2011-12 2010-11 2011-12 2010-11 2011-12 2010-11
Trombay Unit
UREA 247.44 216.24 69.441 68.516 7364.173 6339.804
SUPHALA (S-15:15:15) 20.96 24.71 2.520 3.817 457.436 552.706
ANP (S-20:20:20) 18.60 11.45 5.098 4.504 970.787 724.818
Thal Unit
UREA 1323.36 1128.52 82.60 80.98 7466.08 6327.73
Thal Unit—
(1) Replacement of combustion air preheater in waste heatsection of Primary Reformer
(2) Modification of NG coil E204A/B in waste heat sectionof Primary Reformer
(3) Replacement of combustion air preheater in waste heatsection of Primary Reformer
(4) Modification of NG coil E204A/B in waste heat sectionof Primary Reformer
(5) Additional S-50 Converter and Loop Boiler to enhanceconversion of ammonia and Steam production.
(6) Relocation of PC-7 (HP section pressure control valve)Outlet gases to MV-2 (Medium pressure decomposer)top line in Urea-31.
(7) TG 2 overhauling to reduce Sp. Steam consumption
(8) Use of energy efficient motor for DM water pump inWTP.
(9) Replacement of SGP Control room A.C. with scrollcompressor units.
The details of major energy conservation taken during theyear 2011-12 by the company are mentioned below:
Trombay Unit—
(1) Replacing old Reactor sieve trays by New Modifiedtrays from M/s Casale leading to steam saving
(2) Installation of Low Pressure & Waste Water section offgas scrubber resulting in saving of Ammonia.
(3) Modification of the suction duct of PAC. Saving in streamdue to reduction in suction pressure drop.
(4) E-203 steam super heater coils replacement by new one.
(5) Primary Reformer Catalyst tubes replaced with betterMOC to reduce energy consumption.
(6) Old Girdler Cooling water pump has been replaced witha energy efficient pump & motor.
(7) Replacement of one ordinary 5.5 KW motor by newenergy efficient motor in MPNA plant.
(8) Replacement of one ordinary 11 KW motor by newenergy efficient motor in SNN plant
(9) Replacement of existing 132 KW Sewage transfer Pumpat Ghatkopar Pumping Station with same capacity,modified, 110 KW energy efficient pump.
4.3.28 Hindustan Fluorocarbons Limited (HFL)
Consumption of Energy Energy cost as percentage Consumption of energy per unit(` Crore) cost of production of production
2011-12 2010-11 2011-12 2010-11 2011-12 2010-11
` 13098 ` 140393.31 3.28 0.07 0.08 Per MT Per MT
Production Production
4.3.29 Hindustan Insecticides Limited (HIL)
Product Consumption of Energy Energy cost as percentage Consumption of energy per(` Crore) cost of production unit of production
2011-12 2010-11 2011-12 2010-11 2011-12 2010-11
Power & Fuel Consumption
ELECTRICITY 7.85 6.42 3.00 2.69 0.79 0.71
FURNACE OIL 19.15 13.53 7.33 5.67 0.31 0.27
FUEL OIL (HSD) 0.55 0.46 0.21 0.19 0.01 0.01
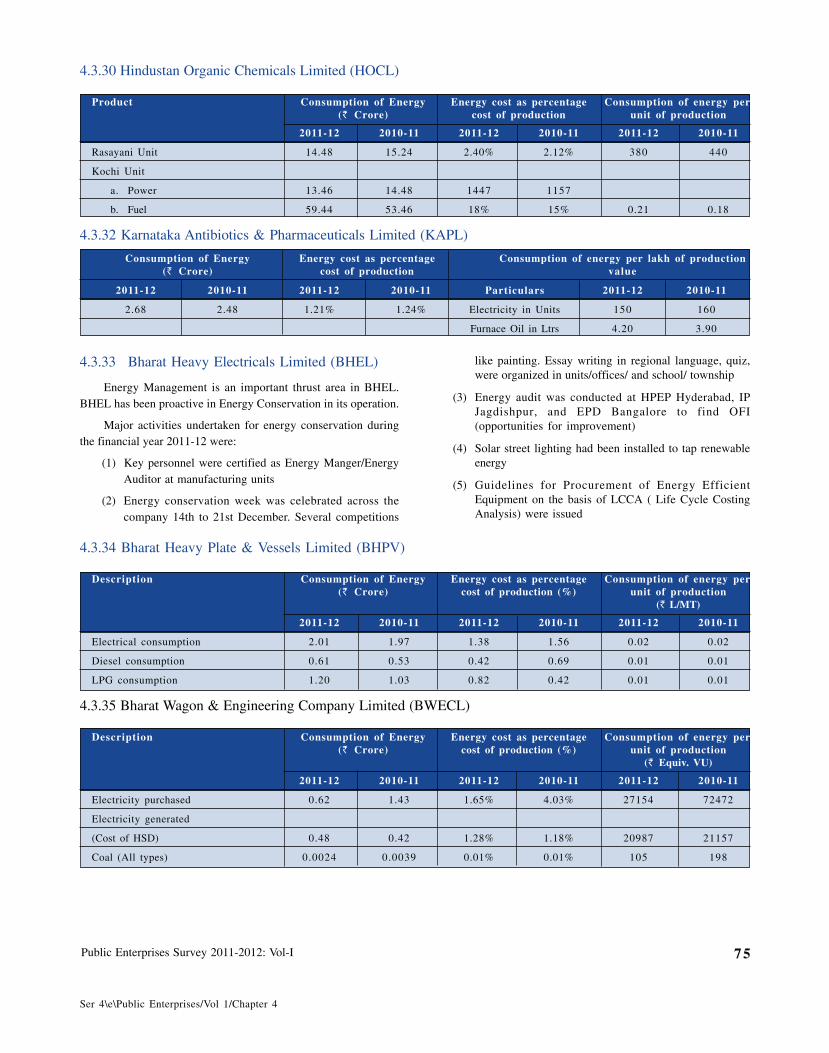
Public Enterprises Survey 2011-2012: Vol-I 75
Ser 4\e\Public Enterprises/Vol 1/Chapter 4
4.3.30 Hindustan Organic Chemicals Limited (HOCL)
Product Consumption of Energy Energy cost as percentage Consumption of energy per(` Crore) cost of production unit of production
2011-12 2010-11 2011-12 2010-11 2011-12 2010-11
Rasayani Unit 14.48 15.24 2.40% 2.12% 380 440
Kochi Unit
a. Power 13.46 14.48 1447 1157
b. Fuel 59.44 53.46 18% 15% 0.21 0.18
4.3.32 Karnataka Antibiotics & Pharmaceuticals Limited (KAPL)
Consumption of Energy Energy cost as percentage Consumption of energy per lakh of production(` Crore) cost of production value
2011-12 2010-11 2011-12 2010-11 Particulars 2011-12 2010-11
2.68 2.48 1.21% 1.24% Electricity in Units 150 160
Furnace Oil in Ltrs 4.20 3.90
like painting. Essay writing in regional language, quiz,were organized in units/offices/ and school/ township
(3) Energy audit was conducted at HPEP Hyderabad, IPJagdishpur, and EPD Bangalore to find OFI(opportunities for improvement)
(4) Solar street lighting had been installed to tap renewableenergy
(5) Guidelines for Procurement of Energy EfficientEquipment on the basis of LCCA ( Life Cycle CostingAnalysis) were issued
4.3.33 Bharat Heavy Electricals Limited (BHEL)
Energy Management is an important thrust area in BHEL.BHEL has been proactive in Energy Conservation in its operation.
Major activities undertaken for energy conservation duringthe financial year 2011-12 were:
(1) Key personnel were certified as Energy Manger/EnergyAuditor at manufacturing units
(2) Energy conservation week was celebrated across thecompany 14th to 21st December. Several competitions
4.3.34 Bharat Heavy Plate & Vessels Limited (BHPV)
Description Consumption of Energy Energy cost as percentage Consumption of energy per(` Crore) cost of production (%) unit of production
(` L/MT)
2011-12 2010-11 2011-12 2010-11 2011-12 2010-11
Electrical consumption 2.01 1.97 1.38 1.56 0.02 0.02
Diesel consumption 0.61 0.53 0.42 0.69 0.01 0.01
LPG consumption 1.20 1.03 0.82 0.42 0.01 0.01
4.3.35 Bharat Wagon & Engineering Company Limited (BWECL)
Description Consumption of Energy Energy cost as percentage Consumption of energy per(` Crore) cost of production (%) unit of production
(` Equiv. VU)
2011-12 2010-11 2011-12 2010-11 2011-12 2010-11
Electricity purchased 0.62 1.43 1.65% 4.03% 27154 72472
Electricity generated
(Cost of HSD) 0.48 0.42 1.28% 1.18% 20987 21157
Coal (All types) 0.0024 0.0039 0.01% 0.01% 105 198
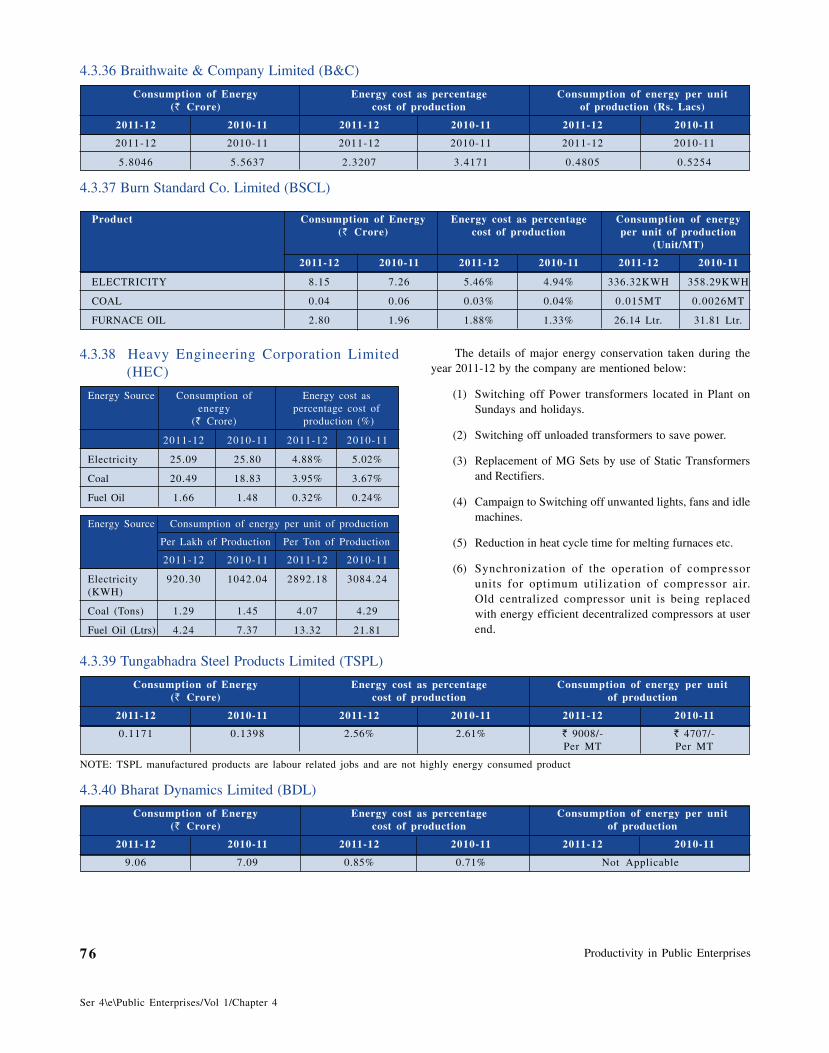
Productivity in Public Enterprises76
Ser 4\e\Public Enterprises/Vol 1/Chapter 4
4.3.36 Braithwaite & Company Limited (B&C)
Consumption of Energy Energy cost as percentage Consumption of energy per unit(` Crore) cost of production of production (Rs. Lacs)
2011-12 2010-11 2011-12 2010-11 2011-12 2010-11
2011-12 2010-11 2011-12 2010-11 2011-12 2010-11
5.8046 5.5637 2.3207 3.4171 0.4805 0.5254
4.3.37 Burn Standard Co. Limited (BSCL)
Product Consumption of Energy Energy cost as percentage Consumption of energy(` Crore) cost of production per unit of production
(Unit/MT)
2011-12 2010-11 2011-12 2010-11 2011-12 2010-11
ELECTRICITY 8.15 7.26 5.46% 4.94% 336.32KWH 358.29KWH
COAL 0.04 0.06 0.03% 0.04% 0.015MT 0.0026MT
FURNACE OIL 2.80 1.96 1.88% 1.33% 26.14 Ltr. 31.81 Ltr.
The details of major energy conservation taken during theyear 2011-12 by the company are mentioned below:
(1) Switching off Power transformers located in Plant onSundays and holidays.
(2) Switching off unloaded transformers to save power.
(3) Replacement of MG Sets by use of Static Transformersand Rectifiers.
(4) Campaign to Switching off unwanted lights, fans and idlemachines.
(5) Reduction in heat cycle time for melting furnaces etc.
(6) Synchronization of the operation of compressorunits for optimum utilization of compressor air.Old centralized compressor unit is being replacedwith energy efficient decentralized compressors at userend.
4.3.38 Heavy Engineering Corporation Limited(HEC)
Energy Source Consumption of Energy cost asenergy percentage cost of
(` Crore) production (%)
2011-12 2010-11 2011-12 2010-11
Electricity 25.09 25.80 4.88% 5.02%
Coal 20.49 18.83 3.95% 3.67%
Fuel Oil 1.66 1.48 0.32% 0.24%
Energy Source Consumption of energy per unit of production
Per Lakh of Production Per Ton of Production
2011-12 2010-11 2011-12 2010-11
Electricity 920.30 1042.04 2892.18 3084.24(KWH)
Coal (Tons) 1.29 1.45 4.07 4.29
Fuel Oil (Ltrs) 4.24 7.37 13.32 21.81
4.3.39 Tungabhadra Steel Products Limited (TSPL)
Consumption of Energy Energy cost as percentage Consumption of energy per unit(` Crore) cost of production of production
2011-12 2010-11 2011-12 2010-11 2011-12 2010-11
0.1171 0.1398 2.56% 2.61% ` 9008/- ` 4707/-Per MT Per MT
NOTE: TSPL manufactured products are labour related jobs and are not highly energy consumed product
4.3.40 Bharat Dynamics Limited (BDL)
Consumption of Energy Energy cost as percentage Consumption of energy per unit(` Crore) cost of production of production
2011-12 2010-11 2011-12 2010-11 2011-12 2010-11
9.06 7.09 0.85% 0.71% Not Applicable
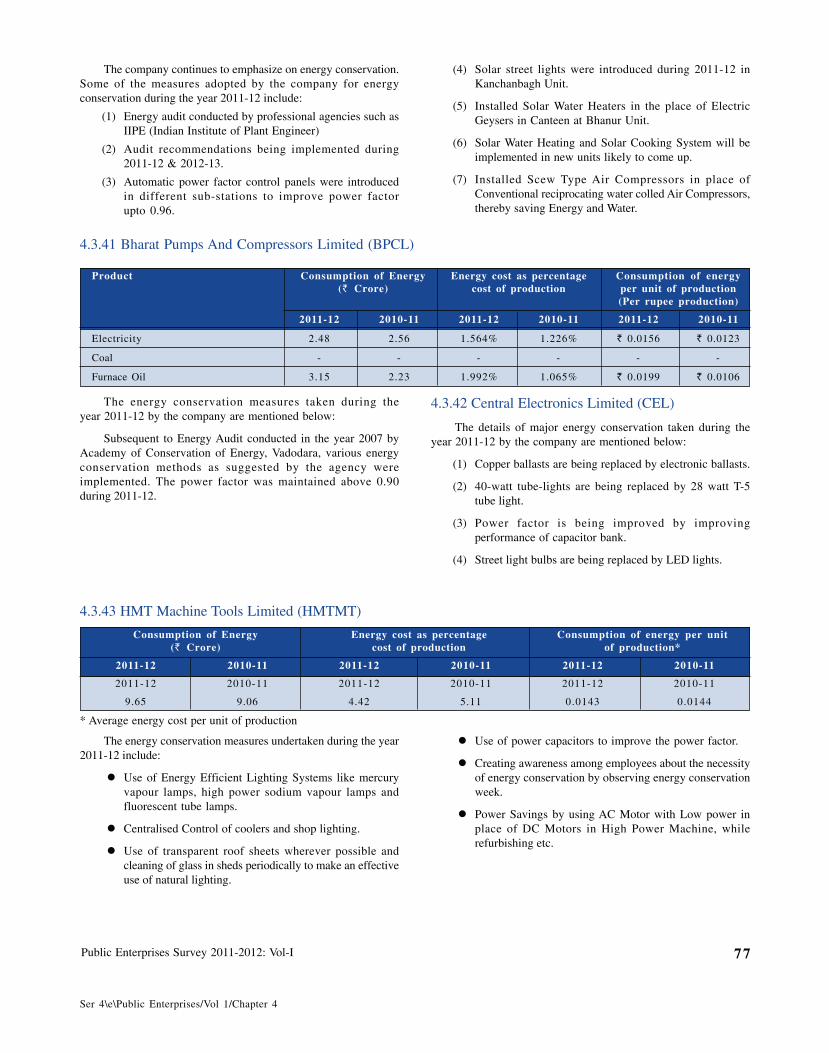
Public Enterprises Survey 2011-2012: Vol-I 77
Ser 4\e\Public Enterprises/Vol 1/Chapter 4
The company continues to emphasize on energy conservation.Some of the measures adopted by the company for energyconservation during the year 2011-12 include:
(1) Energy audit conducted by professional agencies such asIIPE (Indian Institute of Plant Engineer)
(2) Audit recommendations being implemented during2011-12 & 2012-13.
(3) Automatic power factor control panels were introducedin different sub-stations to improve power factorupto 0.96.
(4) Solar street lights were introduced during 2011-12 inKanchanbagh Unit.
(5) Installed Solar Water Heaters in the place of ElectricGeysers in Canteen at Bhanur Unit.
(6) Solar Water Heating and Solar Cooking System will beimplemented in new units likely to come up.
(7) Installed Scew Type Air Compressors in place ofConventional reciprocating water colled Air Compressors,thereby saving Energy and Water.
4.3.41 Bharat Pumps And Compressors Limited (BPCL)
Product Consumption of Energy Energy cost as percentage Consumption of energy(` Crore) cost of production per unit of production
(Per rupee production)
2011-12 2010-11 2011-12 2010-11 2011-12 2010-11
Electricity 2.48 2.56 1.564% 1.226% ` 0.0156 ` 0.0123
Coal - - - - - -
Furnace Oil 3.15 2.23 1.992% 1.065% ` 0.0199 ` 0.0106
4.3.42 Central Electronics Limited (CEL)
The details of major energy conservation taken during theyear 2011-12 by the company are mentioned below:
(1) Copper ballasts are being replaced by electronic ballasts.
(2) 40-watt tube-lights are being replaced by 28 watt T-5tube light.
(3) Power factor is being improved by improvingperformance of capacitor bank.
(4) Street light bulbs are being replaced by LED lights.
The energy conservation measures taken during theyear 2011-12 by the company are mentioned below:
Subsequent to Energy Audit conducted in the year 2007 byAcademy of Conservation of Energy, Vadodara, various energyconservation methods as suggested by the agency wereimplemented. The power factor was maintained above 0.90during 2011-12.
4.3.43 HMT Machine Tools Limited (HMTMT)
Consumption of Energy Energy cost as percentage Consumption of energy per unit(` Crore) cost of production of production*
2011-12 2010-11 2011-12 2010-11 2011-12 2010-11
2011-12 2010-11 2011-12 2010-11 2011-12 2010-11
9.65 9.06 4.42 5.11 0.0143 0.0144
* Average energy cost per unit of production
� Use of power capacitors to improve the power factor.
� Creating awareness among employees about the necessityof energy conservation by observing energy conservationweek.
� Power Savings by using AC Motor with Low power inplace of DC Motors in High Power Machine, whilerefurbishing etc.
The energy conservation measures undertaken during the year2011-12 include:
� Use of Energy Efficient Lighting Systems like mercuryvapour lamps, high power sodium vapour lamps andfluorescent tube lamps.
� Centralised Control of coolers and shop lighting.
� Use of transparent roof sheets wherever possible andcleaning of glass in sheds periodically to make an effectiveuse of natural lighting.
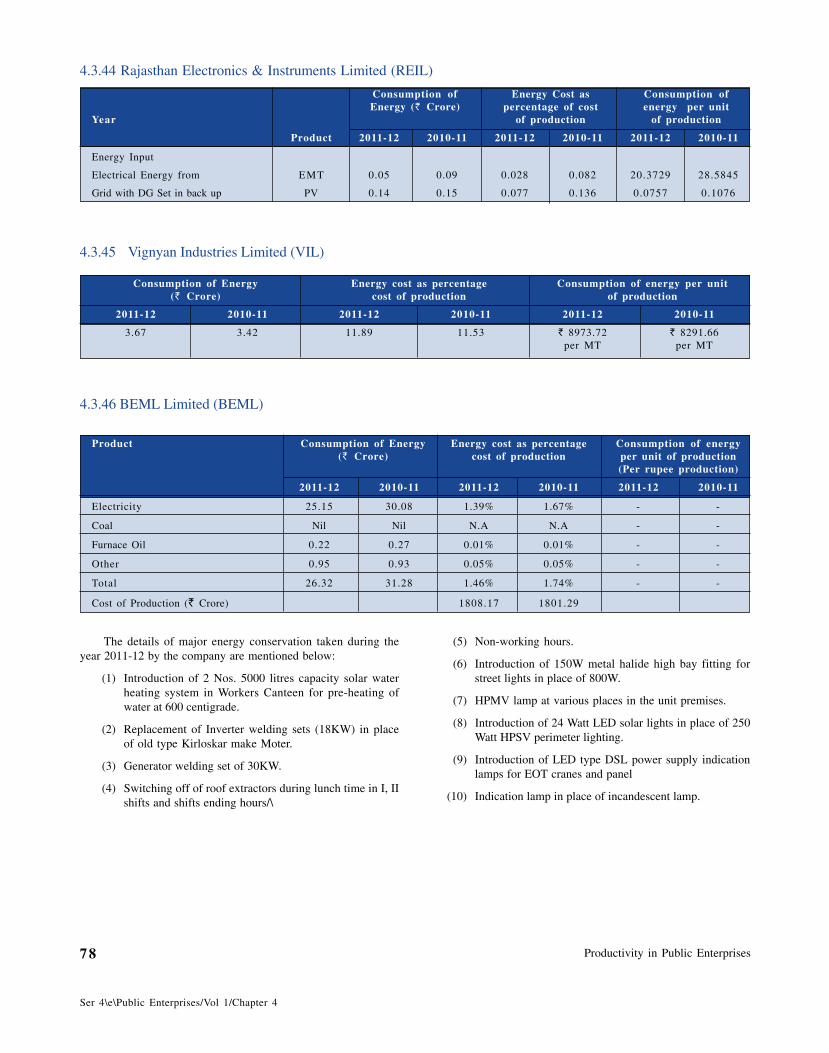
Productivity in Public Enterprises78
Ser 4\e\Public Enterprises/Vol 1/Chapter 4
4.3.44 Rajasthan Electronics & Instruments Limited (REIL)
Consumption of Energy Cost as Consumption ofEnergy (` Crore) percentage of cost energy per unit
Year of production of production
Product 2011-12 2010-11 2011-12 2010-11 2011-12 2010-11
Energy Input
Electrical Energy from EMT 0.05 0.09 0.028 0.082 20.3729 28.5845
Grid with DG Set in back up PV 0.14 0.15 0.077 0.136 0.0757 0.1076
4.3.45 Vignyan Industries Limited (VIL)
Consumption of Energy Energy cost as percentage Consumption of energy per unit(` Crore) cost of production of production
2011-12 2010-11 2011-12 2010-11 2011-12 2010-11
3.67 3.42 11.89 11.53 ` 8973.72 ` 8291.66per MT per MT
4.3.46 BEML Limited (BEML)
Product Consumption of Energy Energy cost as percentage Consumption of energy(` Crore) cost of production per unit of production
(Per rupee production)
2011-12 2010-11 2011-12 2010-11 2011-12 2010-11
Electricity 25.15 30.08 1.39% 1.67% - -
Coal Nil Nil N.A N.A - -
Furnace Oil 0.22 0.27 0.01% 0.01% - -
Other 0.95 0.93 0.05% 0.05% - -
Total 26.32 31.28 1.46% 1.74% - -
Cost of Production (` Crore) 1808.17 1801.29
(5) Non-working hours.
(6) Introduction of 150W metal halide high bay fitting forstreet lights in place of 800W.
(7) HPMV lamp at various places in the unit premises.
(8) Introduction of 24 Watt LED solar lights in place of 250Watt HPSV perimeter lighting.
(9) Introduction of LED type DSL power supply indicationlamps for EOT cranes and panel
(10) Indication lamp in place of incandescent lamp.
The details of major energy conservation taken during theyear 2011-12 by the company are mentioned below:
(1) Introduction of 2 Nos. 5000 litres capacity solar waterheating system in Workers Canteen for pre-heating ofwater at 600 centigrade.
(2) Replacement of Inverter welding sets (18KW) in placeof old type Kirloskar make Moter.
(3) Generator welding set of 30KW.
(4) Switching off of roof extractors during lunch time in I, IIshifts and shifts ending hours/\
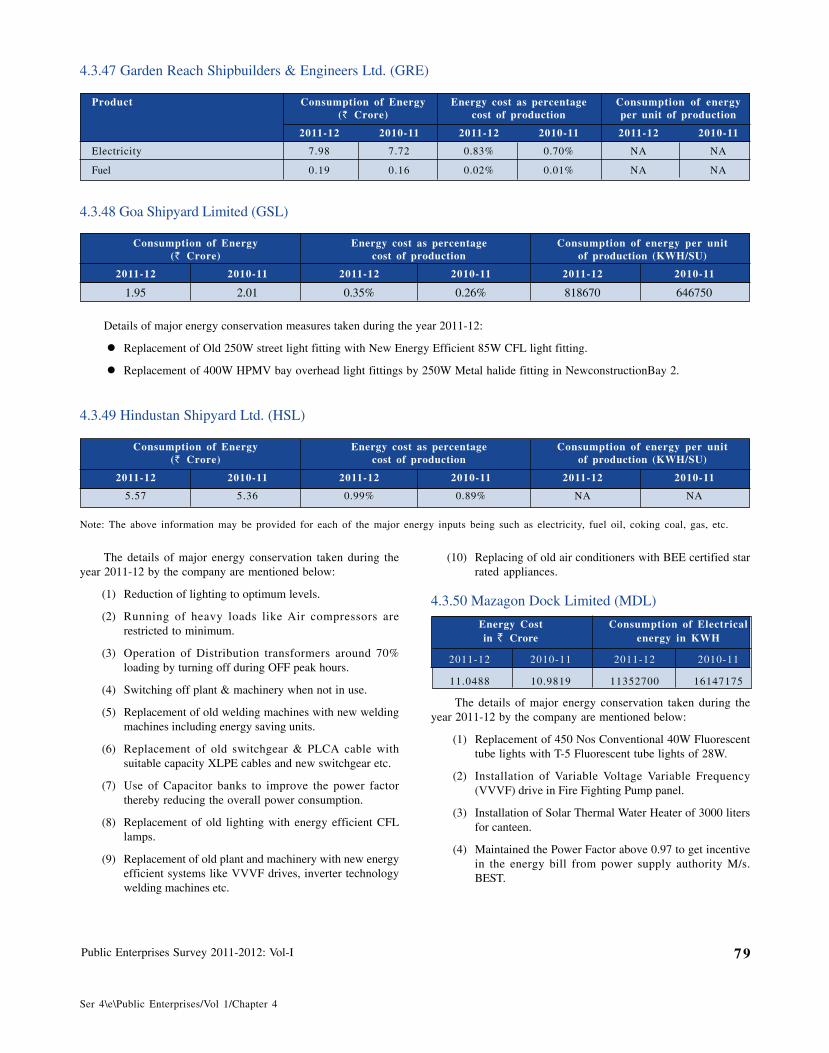
Public Enterprises Survey 2011-2012: Vol-I 79
Ser 4\e\Public Enterprises/Vol 1/Chapter 4
4.3.47 Garden Reach Shipbuilders & Engineers Ltd. (GRE)
Product Consumption of Energy Energy cost as percentage Consumption of energy(` Crore) cost of production per unit of production
2011-12 2010-11 2011-12 2010-11 2011-12 2010-11
Electricity 7.98 7.72 0.83% 0.70% NA NA
Fuel 0.19 0.16 0.02% 0.01% NA NA
4.3.48 Goa Shipyard Limited (GSL)
Consumption of Energy Energy cost as percentage Consumption of energy per unit(` Crore) cost of production of production (KWH/SU)
2011-12 2010-11 2011-12 2010-11 2011-12 2010-11
1.95 2.01 0.35% 0.26% 818670 646750
Details of major energy conservation measures taken during the year 2011-12:
� Replacement of Old 250W street light fitting with New Energy Efficient 85W CFL light fitting.
� Replacement of 400W HPMV bay overhead light fittings by 250W Metal halide fitting in NewconstructionBay 2.
4.3.49 Hindustan Shipyard Ltd. (HSL)
Consumption of Energy Energy cost as percentage Consumption of energy per unit(` Crore) cost of production of production (KWH/SU)
2011-12 2010-11 2011-12 2010-11 2011-12 2010-11
5.57 5.36 0.99% 0.89% NA NA
Note: The above information may be provided for each of the major energy inputs being such as electricity, fuel oil, coking coal, gas, etc.
(10) Replacing of old air conditioners with BEE certified starrated appliances.
4.3.50 Mazagon Dock Limited (MDL)
Energy Cost Consumption of Electricalin ` Crore energy in KWH
2011-12 2010-11 2011-12 2010-11
11.0488 10.9819 11352700 16147175
The details of major energy conservation taken during theyear 2011-12 by the company are mentioned below:
(1) Replacement of 450 Nos Conventional 40W Fluorescenttube lights with T-5 Fluorescent tube lights of 28W.
(2) Installation of Variable Voltage Variable Frequency(VVVF) drive in Fire Fighting Pump panel.
(3) Installation of Solar Thermal Water Heater of 3000 litersfor canteen.
(4) Maintained the Power Factor above 0.97 to get incentivein the energy bill from power supply authority M/s.BEST.
The details of major energy conservation taken during theyear 2011-12 by the company are mentioned below:
(1) Reduction of lighting to optimum levels.
(2) Running of heavy loads like Air compressors arerestricted to minimum.
(3) Operation of Distribution transformers around 70%loading by turning off during OFF peak hours.
(4) Switching off plant & machinery when not in use.
(5) Replacement of old welding machines with new weldingmachines including energy saving units.
(6) Replacement of old switchgear & PLCA cable withsuitable capacity XLPE cables and new switchgear etc.
(7) Use of Capacitor banks to improve the power factorthereby reducing the overall power consumption.
(8) Replacement of old lighting with energy efficient CFLlamps.
(9) Replacement of old plant and machinery with new energyefficient systems like VVVF drives, inverter technologywelding machines etc.
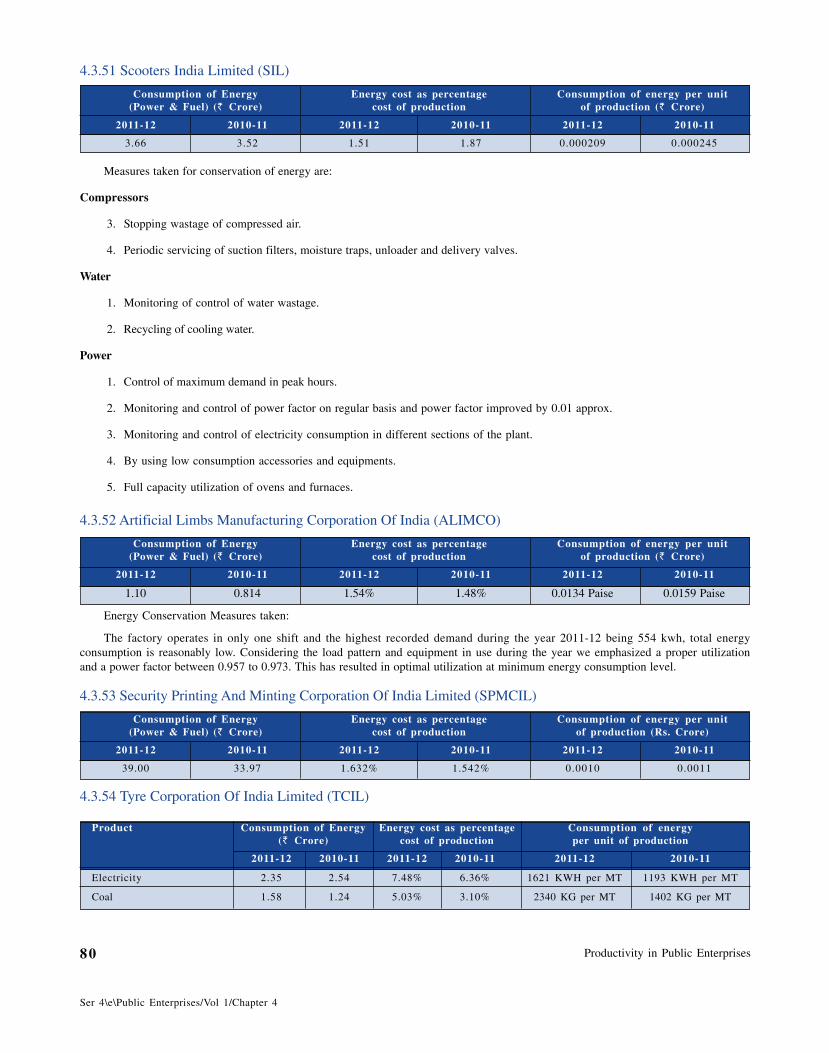
Productivity in Public Enterprises80
Ser 4\e\Public Enterprises/Vol 1/Chapter 4
4.3.51 Scooters India Limited (SIL)
Consumption of Energy Energy cost as percentage Consumption of energy per unit(Power & Fuel) (` Crore) cost of production of production (` Crore)
2011-12 2010-11 2011-12 2010-11 2011-12 2010-11
3.66 3.52 1.51 1.87 0.000209 0.000245
Measures taken for conservation of energy are:
Compressors
3. Stopping wastage of compressed air.
4. Periodic servicing of suction filters, moisture traps, unloader and delivery valves.
Water
1. Monitoring of control of water wastage.
2. Recycling of cooling water.
Power
1. Control of maximum demand in peak hours.
2. Monitoring and control of power factor on regular basis and power factor improved by 0.01 approx.
3. Monitoring and control of electricity consumption in different sections of the plant.
4. By using low consumption accessories and equipments.
5. Full capacity utilization of ovens and furnaces.
4.3.52 Artificial Limbs Manufacturing Corporation Of India (ALIMCO)
Consumption of Energy Energy cost as percentage Consumption of energy per unit(Power & Fuel) (` Crore) cost of production of production (` Crore)
2011-12 2010-11 2011-12 2010-11 2011-12 2010-11
1.10 0.814 1.54% 1.48% 0.0134 Paise 0.0159 Paise
Energy Conservation Measures taken:
The factory operates in only one shift and the highest recorded demand during the year 2011-12 being 554 kwh, total energyconsumption is reasonably low. Considering the load pattern and equipment in use during the year we emphasized a proper utilizationand a power factor between 0.957 to 0.973. This has resulted in optimal utilization at minimum energy consumption level.
4.3.53 Security Printing And Minting Corporation Of India Limited (SPMCIL)
Consumption of Energy Energy cost as percentage Consumption of energy per unit(Power & Fuel) (` Crore) cost of production of production (Rs. Crore)
2011-12 2010-11 2011-12 2010-11 2011-12 2010-11
39.00 33.97 1.632% 1.542% 0.0010 0.0011
4.3.54 Tyre Corporation Of India Limited (TCIL)
Product Consumption of Energy Energy cost as percentage Consumption of energy(` Crore) cost of production per unit of production
2011-12 2010-11 2011-12 2010-11 2011-12 2010-11
Electricity 2.35 2.54 7.48% 6.36% 1621 KWH per MT 1193 KWH per MT
Coal 1.58 1.24 5.03% 3.10% 2340 KG per MT 1402 KG per MT
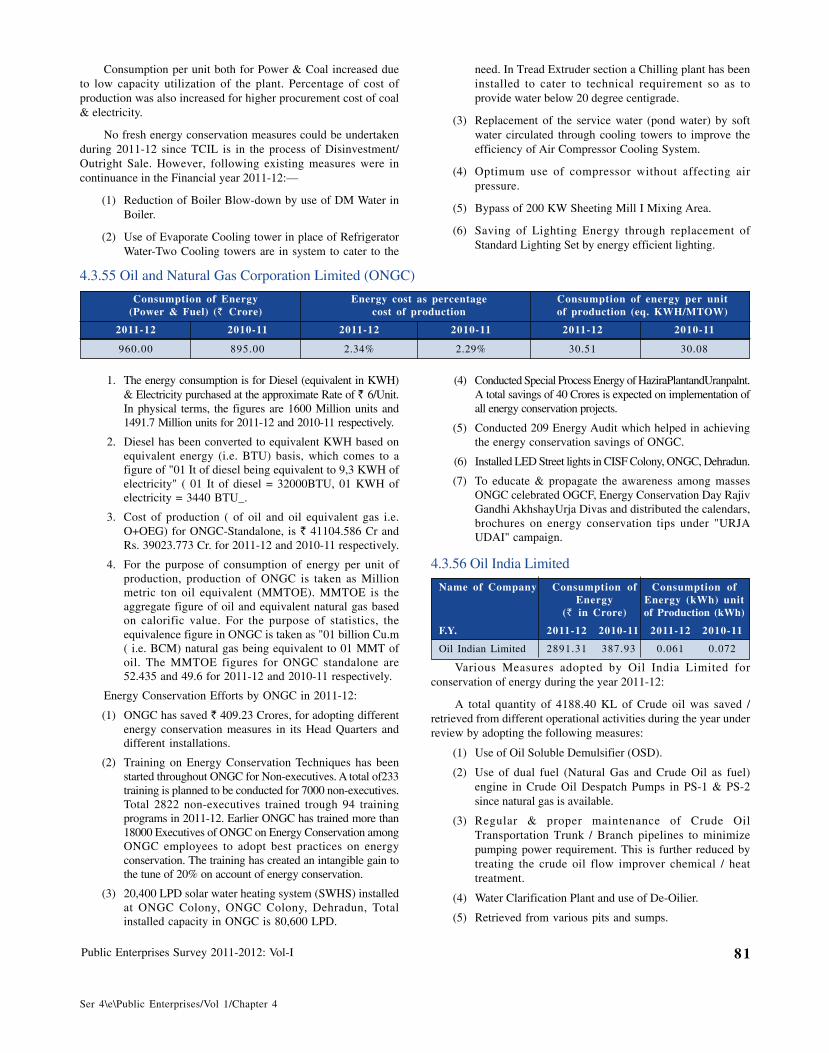
Public Enterprises Survey 2011-2012: Vol-I 81
Ser 4\e\Public Enterprises/Vol 1/Chapter 4
Consumption per unit both for Power & Coal increased dueto low capacity utilization of the plant. Percentage of cost ofproduction was also increased for higher procurement cost of coal& electricity.
No fresh energy conservation measures could be undertakenduring 2011-12 since TCIL is in the process of Disinvestment/Outright Sale. However, following existing measures were incontinuance in the Financial year 2011-12:—
(1) Reduction of Boiler Blow-down by use of DM Water inBoiler.
(2) Use of Evaporate Cooling tower in place of RefrigeratorWater-Two Cooling towers are in system to cater to the
need. In Tread Extruder section a Chilling plant has beeninstalled to cater to technical requirement so as toprovide water below 20 degree centigrade.
(3) Replacement of the service water (pond water) by softwater circulated through cooling towers to improve theefficiency of Air Compressor Cooling System.
(4) Optimum use of compressor without affecting airpressure.
(5) Bypass of 200 KW Sheeting Mill I Mixing Area.
(6) Saving of Lighting Energy through replacement ofStandard Lighting Set by energy efficient lighting.
4.3.55 Oil and Natural Gas Corporation Limited (ONGC)
Consumption of Energy Energy cost as percentage Consumption of energy per unit(Power & Fuel) (` Crore) cost of production of production (eq. KWH/MTOW)
2011-12 2010-11 2011-12 2010-11 2011-12 2010-11
960.00 895.00 2.34% 2.29% 30.51 30.08
(4) Conducted Special Process Energy of HaziraPlantandUranpalnt.A total savings of 40 Crores is expected on implementation ofall energy conservation projects.
(5) Conducted 209 Energy Audit which helped in achievingthe energy conservation savings of ONGC.
(6) Installed LED Street lights in CISF Colony, ONGC, Dehradun.
(7) To educate & propagate the awareness among massesONGC celebrated OGCF, Energy Conservation Day RajivGandhi AkhshayUrja Divas and distributed the calendars,brochures on energy conservation tips under "URJAUDAI" campaign.
4.3.56 Oil India Limited
Name of Company Consumption of Consumption ofEnergy Energy (kWh) unit
(` in Crore) of Production (kWh)
F.Y. 2011-12 2010-11 2011-12 2010-11
Oil Indian Limited 2891.31 387.93 0.061 0.072
Various Measures adopted by Oil India Limited forconservation of energy during the year 2011-12:
A total quantity of 4188.40 KL of Crude oil was saved /retrieved from different operational activities during the year underreview by adopting the following measures:
(1) Use of Oil Soluble Demulsifier (OSD).
(2) Use of dual fuel (Natural Gas and Crude Oil as fuel)engine in Crude Oil Despatch Pumps in PS-1 & PS-2since natural gas is available.
(3) Regular & proper maintenance of Crude OilTransportation Trunk / Branch pipelines to minimizepumping power requirement. This is further reduced bytreating the crude oil flow improver chemical / heattreatment.
(4) Water Clarification Plant and use of De-Oilier.
(5) Retrieved from various pits and sumps.
1. The energy consumption is for Diesel (equivalent in KWH)& Electricity purchased at the approximate Rate of ` 6/Unit.In physical terms, the figures are 1600 Million units and1491.7 Million units for 2011-12 and 2010-11 respectively.
2. Diesel has been converted to equivalent KWH based onequivalent energy (i.e. BTU) basis, which comes to afigure of "01 It of diesel being equivalent to 9,3 KWH ofelectricity" ( 01 It of diesel = 32000BTU, 01 KWH ofelectricity = 3440 BTU_.
3. Cost of production ( of oil and oil equivalent gas i.e.O+OEG) for ONGC-Standalone, is ` 41104.586 Cr andRs. 39023.773 Cr. for 2011-12 and 2010-11 respectively.
4. For the purpose of consumption of energy per unit ofproduction, production of ONGC is taken as Millionmetric ton oil equivalent (MMTOE). MMTOE is theaggregate figure of oil and equivalent natural gas basedon calorific value. For the purpose of statistics, theequivalence figure in ONGC is taken as "01 billion Cu.m( i.e. BCM) natural gas being equivalent to 01 MMT ofoil. The MMTOE figures for ONGC standalone are52.435 and 49.6 for 2011-12 and 2010-11 respectively.
Energy Conservation Efforts by ONGC in 2011-12:
(1) ONGC has saved ` 409.23 Crores, for adopting differentenergy conservation measures in its Head Quarters anddifferent installations.
(2) Training on Energy Conservation Techniques has beenstarted throughout ONGC for Non-executives. A total of233training is planned to be conducted for 7000 non-executives.Total 2822 non-executives trained trough 94 trainingprograms in 2011-12. Earlier ONGC has trained more than18000 Executives of ONGC on Energy Conservation amongONGC employees to adopt best practices on energyconservation. The training has created an intangible gain tothe tune of 20% on account of energy conservation.
(3) 20,400 LPD solar water heating system (SWHS) installedat ONGC Colony, ONGC Colony, Dehradun, Totalinstalled capacity in ONGC is 80,600 LPD.
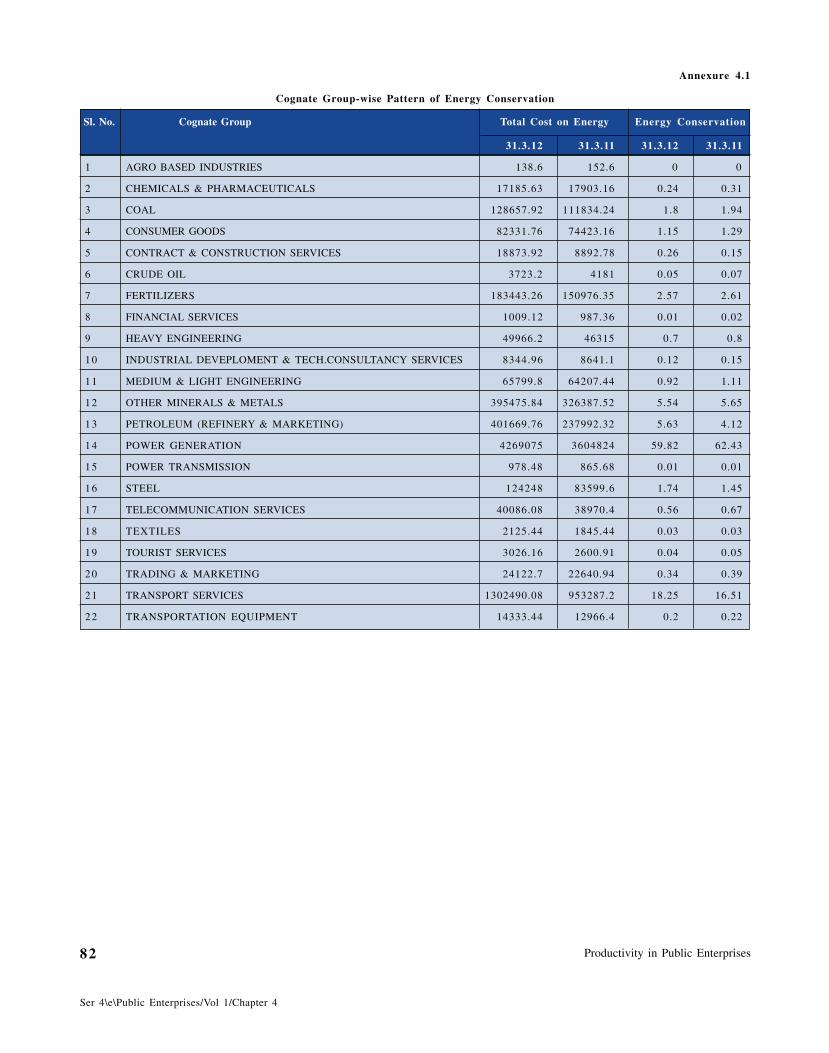
Productivity in Public Enterprises82
Ser 4\e\Public Enterprises/Vol 1/Chapter 4
Annexure 4.1
Cognate Group-wise Pattern of Energy Conservation
Sl. No. Cognate Group Total Cost on Energy Energy Conservation
31.3.12 31.3.11 31.3.12 31.3.11
1 AGRO BASED INDUSTRIES 138.6 152.6 0 0
2 CHEMICALS & PHARMACEUTICALS 17185.63 17903.16 0.24 0.31
3 COAL 128657.92 111834.24 1.8 1.94
4 CONSUMER GOODS 82331.76 74423.16 1.15 1.29
5 CONTRACT & CONSTRUCTION SERVICES 18873.92 8892.78 0.26 0.15
6 CRUDE OIL 3723.2 4181 0.05 0.07
7 FERTILIZERS 183443.26 150976.35 2.57 2.61
8 FINANCIAL SERVICES 1009.12 987.36 0.01 0.02
9 HEAVY ENGINEERING 49966.2 46315 0.7 0.8
10 INDUSTRIAL DEVEPLOMENT & TECH.CONSULTANCY SERVICES 8344.96 8641.1 0.12 0.15
11 MEDIUM & LIGHT ENGINEERING 65799.8 64207.44 0.92 1.11
12 OTHER MINERALS & METALS 395475.84 326387.52 5.54 5.65
13 PETROLEUM (REFINERY & MARKETING) 401669.76 237992.32 5.63 4.12
14 POWER GENERATION 4269075 3604824 59.82 62.43
15 POWER TRANSMISSION 978.48 865.68 0.01 0.01
16 STEEL 124248 83599.6 1.74 1.45
17 TELECOMMUNICATION SERVICES 40086.08 38970.4 0.56 0.67
18 TEXTILES 2125.44 1845.44 0.03 0.03
19 TOURIST SERVICES 3026.16 2600.91 0.04 0.05
20 TRADING & MARKETING 24122.7 22640.94 0.34 0.39
21 TRANSPORT SERVICES 1302490.08 953287.2 18.25 16.51
22 TRANSPORTATION EQUIPMENT 14333.44 12966.4 0.2 0.22
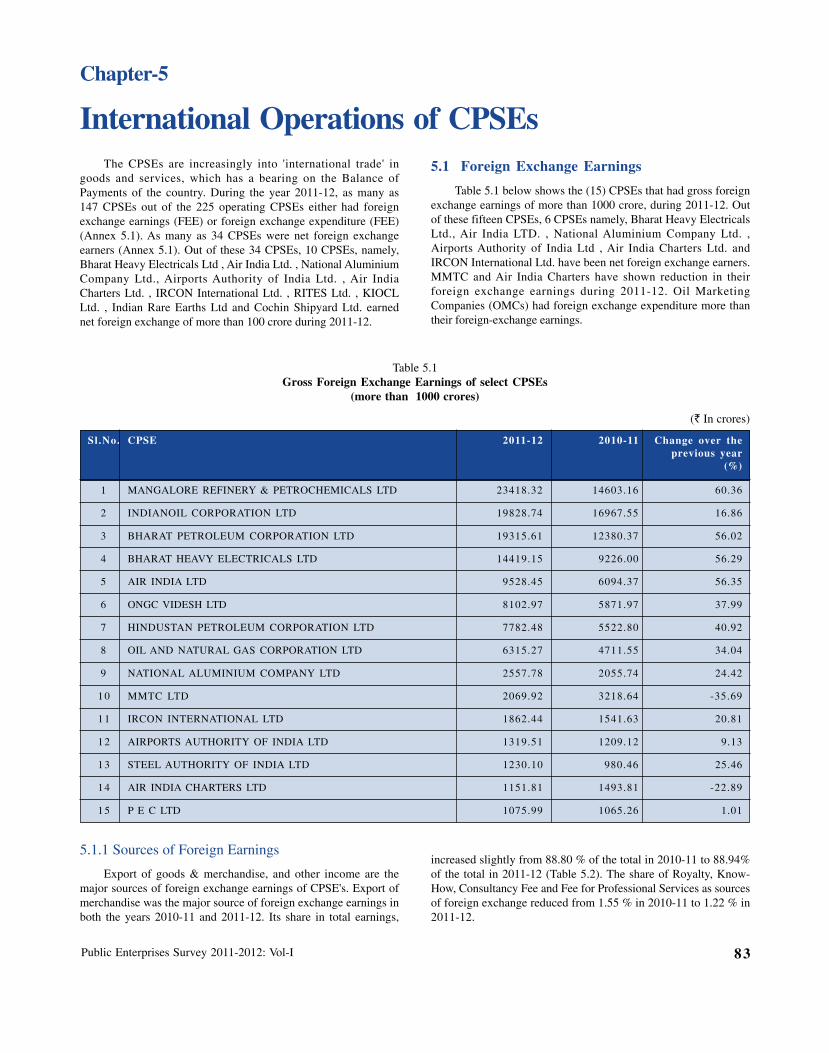
Public Enterprises Survey 2011-2012: Vol-I 83
International Operations of CPSEs
Chapter-5
The CPSEs are increasingly into 'international trade' ingoods and services, which has a bearing on the Balance ofPayments of the country. During the year 2011-12, as many as147 CPSEs out of the 225 operating CPSEs either had foreignexchange earnings (FEE) or foreign exchange expenditure (FEE)(Annex 5.1). As many as 34 CPSEs were net foreign exchangeearners (Annex 5.1). Out of these 34 CPSEs, 10 CPSEs, namely,Bharat Heavy Electricals Ltd , Air India Ltd. , National AluminiumCompany Ltd., Airports Authority of India Ltd. , Air IndiaCharters Ltd. , IRCON International Ltd. , RITES Ltd. , KIOCLLtd. , Indian Rare Earths Ltd and Cochin Shipyard Ltd. earnednet foreign exchange of more than 100 crore during 2011-12.
5.1 Foreign Exchange Earnings
Table 5.1 below shows the (15) CPSEs that had gross foreignexchange earnings of more than 1000 crore, during 2011-12. Outof these fifteen CPSEs, 6 CPSEs namely, Bharat Heavy ElectricalsLtd., Air India LTD. , National Aluminium Company Ltd. ,Airports Authority of India Ltd , Air India Charters Ltd. andIRCON International Ltd. have been net foreign exchange earners.MMTC and Air India Charters have shown reduction in theirforeign exchange earnings during 2011-12. Oil MarketingCompanies (OMCs) had foreign exchange expenditure more thantheir foreign-exchange earnings.
5.1.1 Sources of Foreign Earnings
Export of goods & merchandise, and other income are themajor sources of foreign exchange earnings of CPSE's. Export ofmerchandise was the major source of foreign exchange earnings inboth the years 2010-11 and 2011-12. Its share in total earnings,
increased slightly from 88.80 % of the total in 2010-11 to 88.94%of the total in 2011-12 (Table 5.2). The share of Royalty, Know-How, Consultancy Fee and Fee for Professional Services as sourcesof foreign exchange reduced from 1.55 % in 2010-11 to 1.22 % in2011-12.
Table 5.1Gross Foreign Exchange Earnings of select CPSEs
(more than 1000 crores)
(` In crores)
Sl.No. CPSE 2011-12 2010-11 Change over theprevious year
(%)
1 MANGALORE REFINERY & PETROCHEMICALS LTD 23418.32 14603.16 60.36
2 INDIANOIL CORPORATION LTD 19828.74 16967.55 16.86
3 BHARAT PETROLEUM CORPORATION LTD 19315.61 12380.37 56.02
4 BHARAT HEAVY ELECTRICALS LTD 14419.15 9226.00 56.29
5 AIR INDIA LTD 9528.45 6094.37 56.35
6 ONGC VIDESH LTD 8102.97 5871.97 37.99
7 HINDUSTAN PETROLEUM CORPORATION LTD 7782.48 5522.80 40.92
8 OIL AND NATURAL GAS CORPORATION LTD 6315.27 4711.55 34.04
9 NATIONAL ALUMINIUM COMPANY LTD 2557.78 2055.74 24.42
10 MMTC LTD 2069.92 3218.64 -35.69
11 IRCON INTERNATIONAL LTD 1862.44 1541.63 20.81
12 AIRPORTS AUTHORITY OF INDIA LTD 1319.51 1209.12 9.13
13 STEEL AUTHORITY OF INDIA LTD 1230.10 980.46 25.46
14 AIR INDIA CHARTERS LTD 1151.81 1493.81 -22.89
15 P E C LTD 1075.99 1065.26 1.01
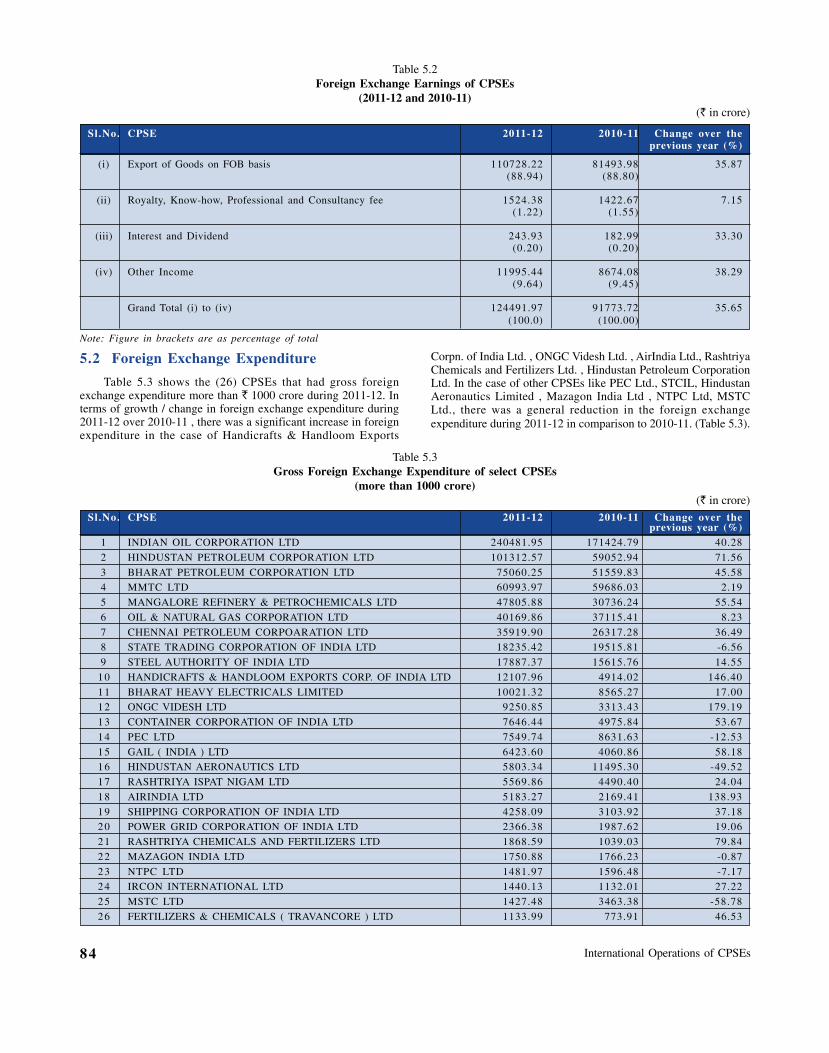
International Operations of CPSEs84
5.2 Foreign Exchange Expenditure
Table 5.3 shows the (26) CPSEs that had gross foreignexchange expenditure more than ` 1000 crore during 2011-12. Interms of growth / change in foreign exchange expenditure during2011-12 over 2010-11 , there was a significant increase in foreignexpenditure in the case of Handicrafts & Handloom Exports
Corpn. of India Ltd. , ONGC Videsh Ltd. , AirIndia Ltd., RashtriyaChemicals and Fertilizers Ltd. , Hindustan Petroleum CorporationLtd. In the case of other CPSEs like PEC Ltd., STCIL, HindustanAeronautics Limited , Mazagon India Ltd , NTPC Ltd, MSTCLtd., there was a general reduction in the foreign exchangeexpenditure during 2011-12 in comparison to 2010-11. (Table 5.3).
Table 5.2Foreign Exchange Earnings of CPSEs
(2011-12 and 2010-11)(` in crore)
Sl.No. CPSE 2011-12 2010-11 Change over theprevious year (%)
(i) Export of Goods on FOB basis 110728.22 81493.98 35.87(88.94) (88.80)
(ii) Royalty, Know-how, Professional and Consultancy fee 1524.38 1422.67 7.15(1.22) (1.55)
(iii) Interest and Dividend 243.93 182.99 33.30(0.20) (0.20)
(iv) Other Income 11995.44 8674.08 38.29(9.64) (9.45)
Grand Total (i) to (iv) 124491.97 91773.72 35.65 (100.0) (100.00)
Note: Figure in brackets are as percentage of total
Table 5.3Gross Foreign Exchange Expenditure of select CPSEs
(more than 1000 crore)(` in crore)
Sl.No. CPSE 2011-12 2010-11 Change over theprevious year (%)
1 INDIAN OIL CORPORATION LTD 240481.95 171424.79 40.28
2 HINDUSTAN PETROLEUM CORPORATION LTD 101312.57 59052.94 71.56
3 BHARAT PETROLEUM CORPORATION LTD 75060.25 51559.83 45.584 MMTC LTD 60993.97 59686.03 2.19
5 MANGALORE REFINERY & PETROCHEMICALS LTD 47805.88 30736.24 55.54
6 OIL & NATURAL GAS CORPORATION LTD 40169.86 37115.41 8.23
7 CHENNAI PETROLEUM CORPOARATION LTD 35919.90 26317.28 36.498 STATE TRADING CORPORATION OF INDIA LTD 18235.42 19515.81 -6.56
9 STEEL AUTHORITY OF INDIA LTD 17887.37 15615.76 14.55
10 HANDICRAFTS & HANDLOOM EXPORTS CORP. OF INDIA LTD 12107.96 4914.02 146.40
11 BHARAT HEAVY ELECTRICALS LIMITED 10021.32 8565.27 17.0012 ONGC VIDESH LTD 9250.85 3313.43 179.19
13 CONTAINER CORPORATION OF INDIA LTD 7646.44 4975.84 53.67
14 PEC LTD 7549.74 8631.63 -12.53
15 GAIL ( INDIA ) LTD 6423.60 4060.86 58.1816 HINDUSTAN AERONAUTICS LTD 5803.34 11495.30 -49.52
17 RASHTRIYA ISPAT NIGAM LTD 5569.86 4490.40 24.04
18 AIRINDIA LTD 5183.27 2169.41 138.93
19 SHIPPING CORPORATION OF INDIA LTD 4258.09 3103.92 37.1820 POWER GRID CORPORATION OF INDIA LTD 2366.38 1987.62 19.06
21 RASHTRIYA CHEMICALS AND FERTILIZERS LTD 1868.59 1039.03 79.84
22 MAZAGON INDIA LTD 1750.88 1766.23 -0.87
23 NTPC LTD 1481.97 1596.48 -7.1724 IRCON INTERNATIONAL LTD 1440.13 1132.01 27.22
25 MSTC LTD 1427.48 3463.38 -58.78
26 FERTILIZERS & CHEMICALS ( TRAVANCORE ) LTD 1133.99 773.91 46.53
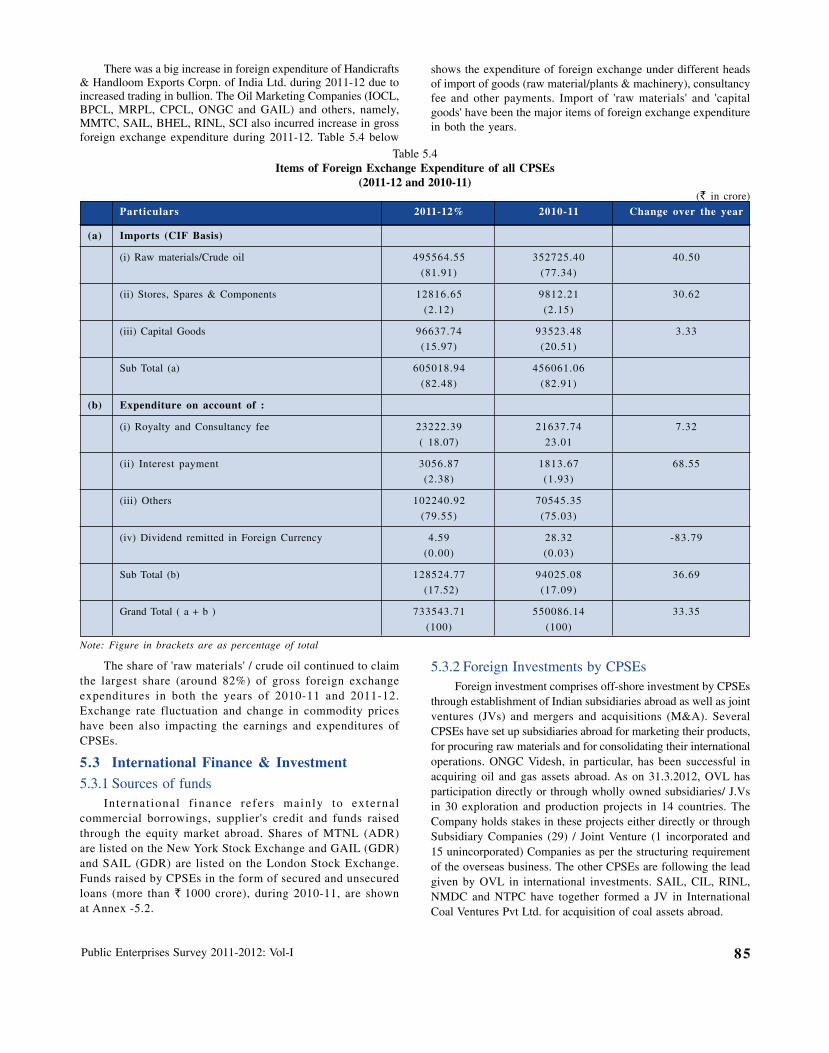
Public Enterprises Survey 2011-2012: Vol-I 85
There was a big increase in foreign expenditure of Handicrafts& Handloom Exports Corpn. of India Ltd. during 2011-12 due toincreased trading in bullion. The Oil Marketing Companies (IOCL,BPCL, MRPL, CPCL, ONGC and GAIL) and others, namely,MMTC, SAIL, BHEL, RINL, SCI also incurred increase in grossforeign exchange expenditure during 2011-12. Table 5.4 below
shows the expenditure of foreign exchange under different headsof import of goods (raw material/plants & machinery), consultancyfee and other payments. Import of 'raw materials' and 'capitalgoods' have been the major items of foreign exchange expenditurein both the years.
The share of 'raw materials' / crude oil continued to claimthe largest share (around 82%) of gross foreign exchangeexpenditures in both the years of 2010-11 and 2011-12.Exchange rate fluctuation and change in commodity priceshave been also impacting the earnings and expenditures ofCPSEs.
5.3 International Finance & Investment5.3.1 Sources of funds
Internat ional f inance refers mainly to externalcommercial borrowings, supplier's credit and funds raisedthrough the equity market abroad. Shares of MTNL (ADR)are listed on the New York Stock Exchange and GAIL (GDR)and SAIL (GDR) are listed on the London Stock Exchange.Funds raised by CPSEs in the form of secured and unsecuredloans (more than ` 1000 crore), during 2010-11, are shownat Annex -5.2.
5.3.2 Foreign Investments by CPSEsForeign investment comprises off-shore investment by CPSEs
through establishment of Indian subsidiaries abroad as well as jointventures (JVs) and mergers and acquisitions (M&A). SeveralCPSEs have set up subsidiaries abroad for marketing their products,for procuring raw materials and for consolidating their internationaloperations. ONGC Videsh, in particular, has been successful inacquiring oil and gas assets abroad. As on 31.3.2012, OVL hasparticipation directly or through wholly owned subsidiaries/ J.Vsin 30 exploration and production projects in 14 countries. TheCompany holds stakes in these projects either directly or throughSubsidiary Companies (29) / Joint Venture (1 incorporated and15 unincorporated) Companies as per the structuring requirementof the overseas business. The other CPSEs are following the leadgiven by OVL in international investments. SAIL, CIL, RINL,NMDC and NTPC have together formed a JV in InternationalCoal Ventures Pvt Ltd. for acquisition of coal assets abroad.
Table 5.4Items of Foreign Exchange Expenditure of all CPSEs
(2011-12 and 2010-11)(` in crore)
Particulars 2011-12% 2010-11 Change over the year
(a) Imports (CIF Basis)
(i) Raw materials/Crude oil 495564.55 352725.40 40.50
(81.91) (77.34)
(ii) Stores, Spares & Components 12816.65 9812.21 30.62
(2.12) (2.15)
(iii) Capital Goods 96637.74 93523.48 3.33
(15.97) (20.51)
Sub Total (a) 605018.94 456061.06
(82.48) (82.91)
(b) Expenditure on account of :
(i) Royalty and Consultancy fee 23222.39 21637.74 7.32
( 18.07) 23.01
(ii) Interest payment 3056.87 1813.67 68.55
(2.38) (1.93)
(iii) Others 102240.92 70545.35
(79.55) (75.03)
(iv) Dividend remitted in Foreign Currency 4.59 28.32 -83.79
(0.00) (0.03)
Sub Total (b) 128524.77 94025.08 36.69
(17.52) (17.09)
Grand Total ( a + b ) 733543.71 550086.14 33.35
(100) (100)
Note: Figure in brackets are as percentage of total
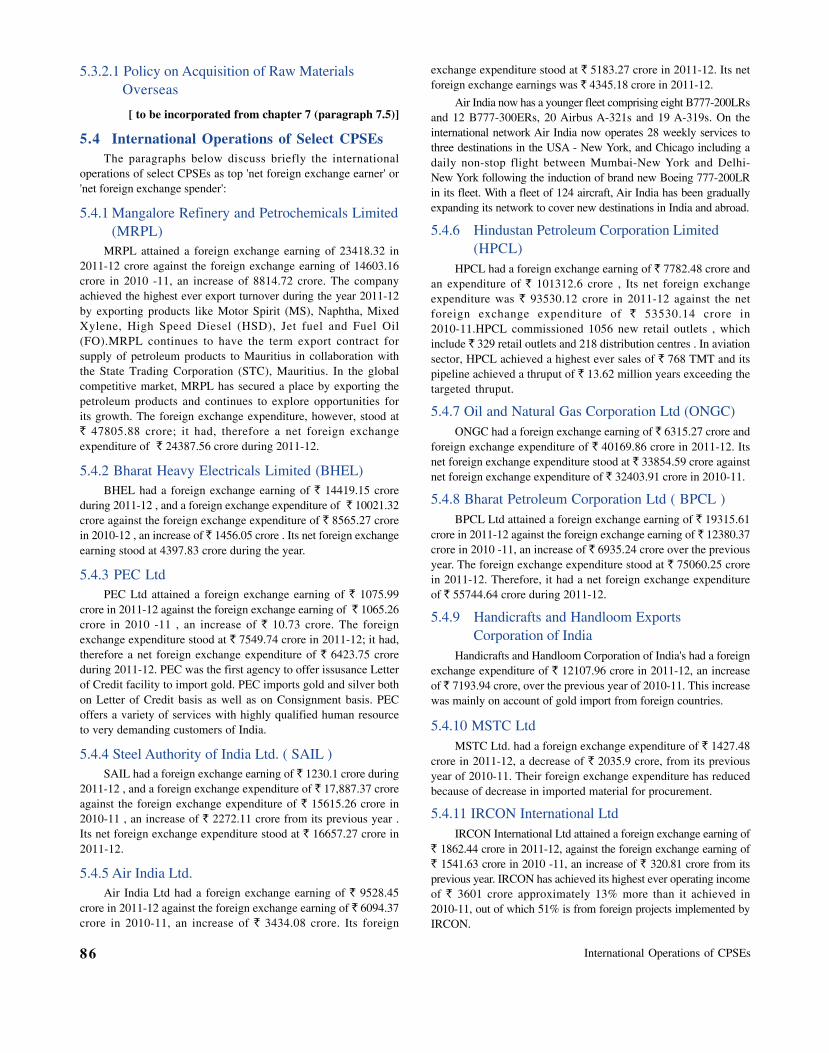
International Operations of CPSEs86
5.3.2.1 Policy on Acquisition of Raw MaterialsOverseas
[ to be incorporated from chapter 7 (paragraph 7.5)]
5.4 International Operations of Select CPSEsThe paragraphs below discuss briefly the international
operations of select CPSEs as top 'net foreign exchange earner' or'net foreign exchange spender':
5.4.1 Mangalore Refinery and Petrochemicals Limited(MRPL)
MRPL attained a foreign exchange earning of 23418.32 in2011-12 crore against the foreign exchange earning of 14603.16crore in 2010 -11, an increase of 8814.72 crore. The companyachieved the highest ever export turnover during the year 2011-12by exporting products like Motor Spirit (MS), Naphtha, MixedXylene, High Speed Diesel (HSD), Jet fuel and Fuel Oil(FO).MRPL continues to have the term export contract forsupply of petroleum products to Mauritius in collaboration withthe State Trading Corporation (STC), Mauritius. In the globalcompetitive market, MRPL has secured a place by exporting thepetroleum products and continues to explore opportunities forits growth. The foreign exchange expenditure, however, stood at` 47805.88 crore; it had, therefore a net foreign exchangeexpenditure of ` 24387.56 crore during 2011-12.
5.4.2 Bharat Heavy Electricals Limited (BHEL)BHEL had a foreign exchange earning of ` 14419.15 crore
during 2011-12 , and a foreign exchange expenditure of ` 10021.32crore against the foreign exchange expenditure of ` 8565.27 crorein 2010-12 , an increase of ` 1456.05 crore . Its net foreign exchangeearning stood at 4397.83 crore during the year.
5.4.3 PEC LtdPEC Ltd attained a foreign exchange earning of ` 1075.99
crore in 2011-12 against the foreign exchange earning of ` 1065.26crore in 2010 -11 , an increase of ` 10.73 crore. The foreignexchange expenditure stood at ` 7549.74 crore in 2011-12; it had,therefore a net foreign exchange expenditure of ` 6423.75 croreduring 2011-12. PEC was the first agency to offer issusance Letterof Credit facility to import gold. PEC imports gold and silver bothon Letter of Credit basis as well as on Consignment basis. PECoffers a variety of services with highly qualified human resourceto very demanding customers of India.
5.4.4 Steel Authority of India Ltd. ( SAIL )SAIL had a foreign exchange earning of ` 1230.1 crore during
2011-12 , and a foreign exchange expenditure of ` 17,887.37 croreagainst the foreign exchange expenditure of ` 15615.26 crore in2010-11 , an increase of ` 2272.11 crore from its previous year .Its net foreign exchange expenditure stood at ` 16657.27 crore in2011-12.
5.4.5 Air India Ltd.Air India Ltd had a foreign exchange earning of ` 9528.45
crore in 2011-12 against the foreign exchange earning of ` 6094.37crore in 2010-11, an increase of ` 3434.08 crore. Its foreign
exchange expenditure stood at ` 5183.27 crore in 2011-12. Its netforeign exchange earnings was ` 4345.18 crore in 2011-12.
Air India now has a younger fleet comprising eight B777-200LRsand 12 B777-300ERs, 20 Airbus A-321s and 19 A-319s. On theinternational network Air India now operates 28 weekly services tothree destinations in the USA - New York, and Chicago including adaily non-stop flight between Mumbai-New York and Delhi-New York following the induction of brand new Boeing 777-200LRin its fleet. With a fleet of 124 aircraft, Air India has been graduallyexpanding its network to cover new destinations in India and abroad.
5.4.6 Hindustan Petroleum Corporation Limited(HPCL)
HPCL had a foreign exchange earning of ` 7782.48 crore andan expenditure of ` 101312.6 crore , Its net foreign exchangeexpenditure was ` 93530.12 crore in 2011-12 against the netforeign exchange expenditure of ` 53530.14 crore in2010-11.HPCL commissioned 1056 new retail outlets , whichinclude ` 329 retail outlets and 218 distribution centres . In aviationsector, HPCL achieved a highest ever sales of ` 768 TMT and itspipeline achieved a thruput of ` 13.62 million years exceeding thetargeted thruput.
5.4.7 Oil and Natural Gas Corporation Ltd (ONGC)ONGC had a foreign exchange earning of ` 6315.27 crore and
foreign exchange expenditure of ` 40169.86 crore in 2011-12. Itsnet foreign exchange expenditure stood at ` 33854.59 crore againstnet foreign exchange expenditure of ` 32403.91 crore in 2010-11.
5.4.8 Bharat Petroleum Corporation Ltd ( BPCL )BPCL Ltd attained a foreign exchange earning of ` 19315.61
crore in 2011-12 against the foreign exchange earning of ` 12380.37crore in 2010 -11, an increase of ` 6935.24 crore over the previousyear. The foreign exchange expenditure stood at ` 75060.25 crorein 2011-12. Therefore, it had a net foreign exchange expenditureof ` 55744.64 crore during 2011-12.
5.4.9 Handicrafts and Handloom ExportsCorporation of India
Handicrafts and Handloom Corporation of India's had a foreignexchange expenditure of ` 12107.96 crore in 2011-12, an increaseof ` 7193.94 crore, over the previous year of 2010-11. This increasewas mainly on account of gold import from foreign countries.
5.4.10 MSTC LtdMSTC Ltd. had a foreign exchange expenditure of ` 1427.48
crore in 2011-12, a decrease of ` 2035.9 crore, from its previousyear of 2010-11. Their foreign exchange expenditure has reducedbecause of decrease in imported material for procurement.
5.4.11 IRCON International LtdIRCON International Ltd attained a foreign exchange earning of
` 1862.44 crore in 2011-12, against the foreign exchange earning of` 1541.63 crore in 2010 -11, an increase of ` 320.81 crore from itsprevious year. IRCON has achieved its highest ever operating incomeof ` 3601 crore approximately 13% more than it achieved in2010-11, out of which 51% is from foreign projects implemented byIRCON.
Public Enterprises Survey 2011-2012: Vol-I 87
5.4.12 MMTC Ltd ( MMTC )Against a foreign exchange earnings of ` 2069.92 crore
during 2011-12, the foreign exchange outgo of the Companystood at ` 60,993.97 crore. MMTC had, therefore, a net foreignexchange expenditure of ` 58924.05 crore during the year.MMTC is the India's largest International Trading Company,and also the largest exporter of mineral. It is also the leading
exporter / importer of agro commodities, the single largestimporter / supplier of metals including Gold & Silver and amajor player in the Coal and Hydrocarbons imports by thecountry. The Company commands extensive market coveragein over 65 countries in Asia, Europe, Africa, Oceania andAmerica etc. and currently holds the no. 1 rank amongst thetrading companies of India.
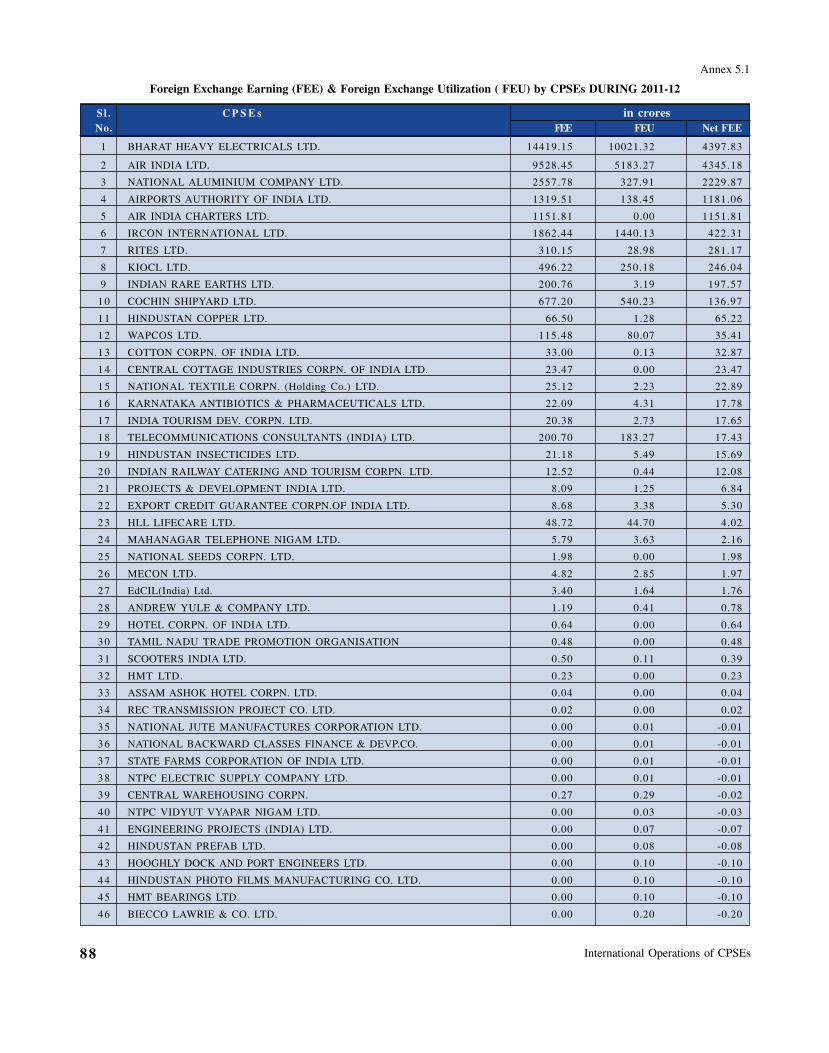
International Operations of CPSEs88
Annex 5.1
Foreign Exchange Earning (FEE) & Foreign Exchange Utilization ( FEU) by CPSEs DURING 2011-12
Sl . C P S E s in croresNo. FEE FEU Net FEE
1 BHARAT HEAVY ELECTRICALS LTD. 14419.15 10021.32 4397.83
2 AIR INDIA LTD. 9528.45 5183.27 4345.18
3 NATIONAL ALUMINIUM COMPANY LTD. 2557.78 327.91 2229.87
4 AIRPORTS AUTHORITY OF INDIA LTD. 1319.51 138.45 1181.06
5 AIR INDIA CHARTERS LTD. 1151.81 0.00 1151.81
6 IRCON INTERNATIONAL LTD. 1862.44 1440.13 422.31
7 RITES LTD. 310.15 28.98 281.17
8 KIOCL LTD. 496.22 250.18 246.04
9 INDIAN RARE EARTHS LTD. 200.76 3.19 197.57
10 COCHIN SHIPYARD LTD. 677.20 540.23 136.97
11 HINDUSTAN COPPER LTD. 66.50 1.28 65.22
12 WAPCOS LTD. 115.48 80.07 35.41
13 COTTON CORPN. OF INDIA LTD. 33.00 0.13 32.87
14 CENTRAL COTTAGE INDUSTRIES CORPN. OF INDIA LTD. 23.47 0.00 23.47
15 NATIONAL TEXTILE CORPN. (Holding Co.) LTD. 25.12 2.23 22.89
16 KARNATAKA ANTIBIOTICS & PHARMACEUTICALS LTD. 22.09 4.31 17.78
17 INDIA TOURISM DEV. CORPN. LTD. 20.38 2.73 17.65
18 TELECOMMUNICATIONS CONSULTANTS (INDIA) LTD. 200.70 183.27 17.43
19 HINDUSTAN INSECTICIDES LTD. 21.18 5.49 15.69
20 INDIAN RAILWAY CATERING AND TOURISM CORPN. LTD. 12.52 0.44 12.08
21 PROJECTS & DEVELOPMENT INDIA LTD. 8.09 1.25 6.84
22 EXPORT CREDIT GUARANTEE CORPN.OF INDIA LTD. 8.68 3.38 5.30
23 HLL LIFECARE LTD. 48.72 44.70 4.02
24 MAHANAGAR TELEPHONE NIGAM LTD. 5.79 3.63 2.16
25 NATIONAL SEEDS CORPN. LTD. 1.98 0.00 1.98
26 MECON LTD. 4.82 2.85 1.97
27 EdCIL(India) Ltd. 3.40 1.64 1.76
28 ANDREW YULE & COMPANY LTD. 1.19 0.41 0.78
29 HOTEL CORPN. OF INDIA LTD. 0.64 0.00 0.64
30 TAMIL NADU TRADE PROMOTION ORGANISATION 0.48 0.00 0.48
31 SCOOTERS INDIA LTD. 0.50 0.11 0.39
32 HMT LTD. 0.23 0.00 0.23
33 ASSAM ASHOK HOTEL CORPN. LTD. 0.04 0.00 0.04
34 REC TRANSMISSION PROJECT CO. LTD. 0.02 0.00 0.02
35 NATIONAL JUTE MANUFACTURES CORPORATION LTD. 0.00 0.01 -0.01
36 NATIONAL BACKWARD CLASSES FINANCE & DEVP.CO. 0.00 0.01 -0.01
37 STATE FARMS CORPORATION OF INDIA LTD. 0.00 0.01 -0.01
38 NTPC ELECTRIC SUPPLY COMPANY LTD. 0.00 0.01 -0.01
39 CENTRAL WAREHOUSING CORPN. 0.27 0.29 -0.02
40 NTPC VIDYUT VYAPAR NIGAM LTD. 0.00 0.03 -0.03
41 ENGINEERING PROJECTS (INDIA) LTD. 0.00 0.07 -0.07
42 HINDUSTAN PREFAB LTD. 0.00 0.08 -0.08
43 HOOGHLY DOCK AND PORT ENGINEERS LTD. 0.00 0.10 -0.10
44 HINDUSTAN PHOTO FILMS MANUFACTURING CO. LTD. 0.00 0.10 -0.10
45 HMT BEARINGS LTD. 0.00 0.10 -0.10
46 BIECCO LAWRIE & CO. LTD. 0.00 0.20 -0.20
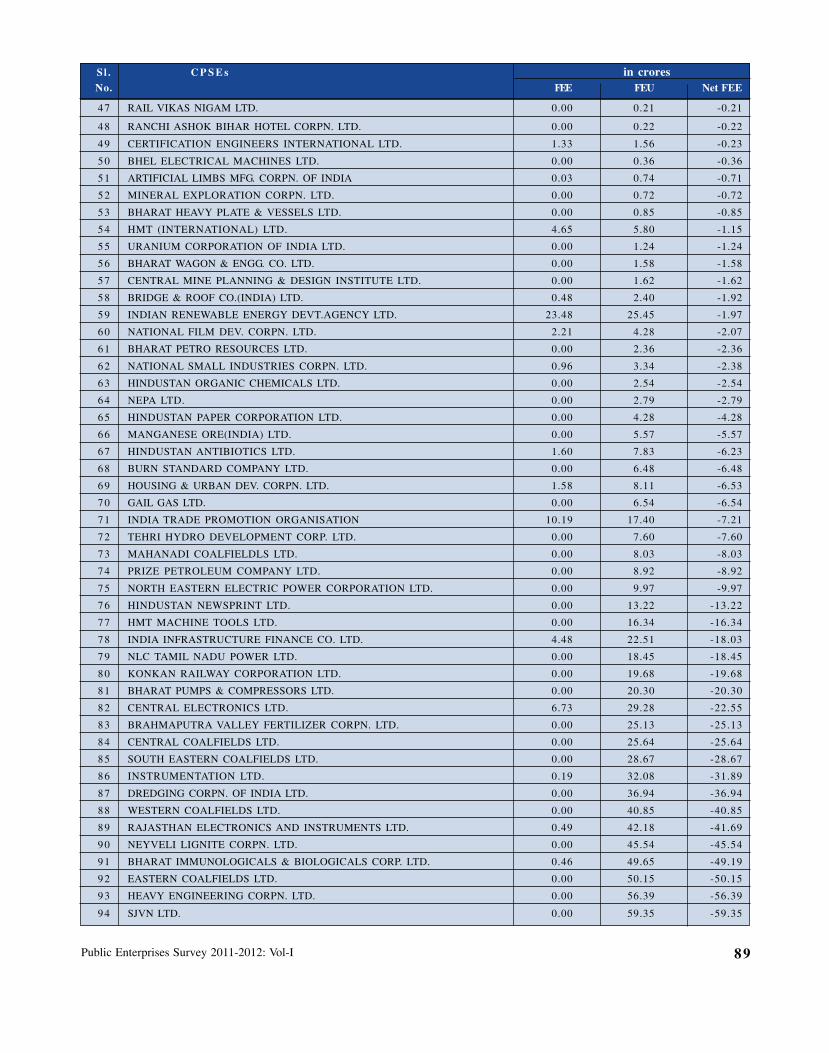
Public Enterprises Survey 2011-2012: Vol-I 89
Sl . C P S E s in croresNo. FEE FEU Net FEE
47 RAIL VIKAS NIGAM LTD. 0.00 0.21 -0.21
48 RANCHI ASHOK BIHAR HOTEL CORPN. LTD. 0.00 0.22 -0.22
49 CERTIFICATION ENGINEERS INTERNATIONAL LTD. 1.33 1.56 -0.23
50 BHEL ELECTRICAL MACHINES LTD. 0.00 0.36 -0.36
51 ARTIFICIAL LIMBS MFG. CORPN. OF INDIA 0.03 0.74 -0.71
52 MINERAL EXPLORATION CORPN. LTD. 0.00 0.72 -0.72
53 BHARAT HEAVY PLATE & VESSELS LTD. 0.00 0.85 -0.85
54 HMT (INTERNATIONAL) LTD. 4.65 5.80 -1.15
55 URANIUM CORPORATION OF INDIA LTD. 0.00 1.24 -1.24
56 BHARAT WAGON & ENGG. CO. LTD. 0.00 1.58 -1.58
57 CENTRAL MINE PLANNING & DESIGN INSTITUTE LTD. 0.00 1.62 -1.62
58 BRIDGE & ROOF CO.(INDIA) LTD. 0.48 2.40 -1.92
59 INDIAN RENEWABLE ENERGY DEVT.AGENCY LTD. 23.48 25.45 -1.97
60 NATIONAL FILM DEV. CORPN. LTD. 2.21 4.28 -2.07
61 BHARAT PETRO RESOURCES LTD. 0.00 2.36 -2.36
62 NATIONAL SMALL INDUSTRIES CORPN. LTD. 0.96 3.34 -2.38
63 HINDUSTAN ORGANIC CHEMICALS LTD. 0.00 2.54 -2.54
64 NEPA LTD. 0.00 2.79 -2.79
65 HINDUSTAN PAPER CORPORATION LTD. 0.00 4.28 -4.28
66 MANGANESE ORE(INDIA) LTD. 0.00 5.57 -5.57
67 HINDUSTAN ANTIBIOTICS LTD. 1.60 7.83 -6.23
68 BURN STANDARD COMPANY LTD. 0.00 6.48 -6.48
69 HOUSING & URBAN DEV. CORPN. LTD. 1.58 8.11 -6.53
70 GAIL GAS LTD. 0.00 6.54 -6.54
71 INDIA TRADE PROMOTION ORGANISATION 10.19 17.40 -7.21
72 TEHRI HYDRO DEVELOPMENT CORP. LTD. 0.00 7.60 -7.60
73 MAHANADI COALFIELDLS LTD. 0.00 8.03 -8.03
74 PRIZE PETROLEUM COMPANY LTD. 0.00 8.92 -8.92
75 NORTH EASTERN ELECTRIC POWER CORPORATION LTD. 0.00 9.97 -9.97
76 HINDUSTAN NEWSPRINT LTD. 0.00 13.22 -13.22
77 HMT MACHINE TOOLS LTD. 0.00 16.34 -16.34
78 INDIA INFRASTRUCTURE FINANCE CO. LTD. 4.48 22.51 -18.03
79 NLC TAMIL NADU POWER LTD. 0.00 18.45 -18.45
80 KONKAN RAILWAY CORPORATION LTD. 0.00 19.68 -19.68
81 BHARAT PUMPS & COMPRESSORS LTD. 0.00 20.30 -20.30
82 CENTRAL ELECTRONICS LTD. 6.73 29.28 -22.55
83 BRAHMAPUTRA VALLEY FERTILIZER CORPN. LTD. 0.00 25.13 -25.13
84 CENTRAL COALFIELDS LTD. 0.00 25.64 -25.64
85 SOUTH EASTERN COALFIELDS LTD. 0.00 28.67 -28.67
86 INSTRUMENTATION LTD. 0.19 32.08 -31.89
87 DREDGING CORPN. OF INDIA LTD. 0.00 36.94 -36.94
88 WESTERN COALFIELDS LTD. 0.00 40.85 -40.85
89 RAJASTHAN ELECTRONICS AND INSTRUMENTS LTD. 0.49 42.18 -41.69
90 NEYVELI LIGNITE CORPN. LTD. 0.00 45.54 -45.54
91 BHARAT IMMUNOLOGICALS & BIOLOGICALS CORP. LTD. 0.46 49.65 -49.19
92 EASTERN COALFIELDS LTD. 0.00 50.15 -50.15
93 HEAVY ENGINEERING CORPN. LTD. 0.00 56.39 -56.39
9 4 SJVN LTD. 0.00 59.35 -59.35
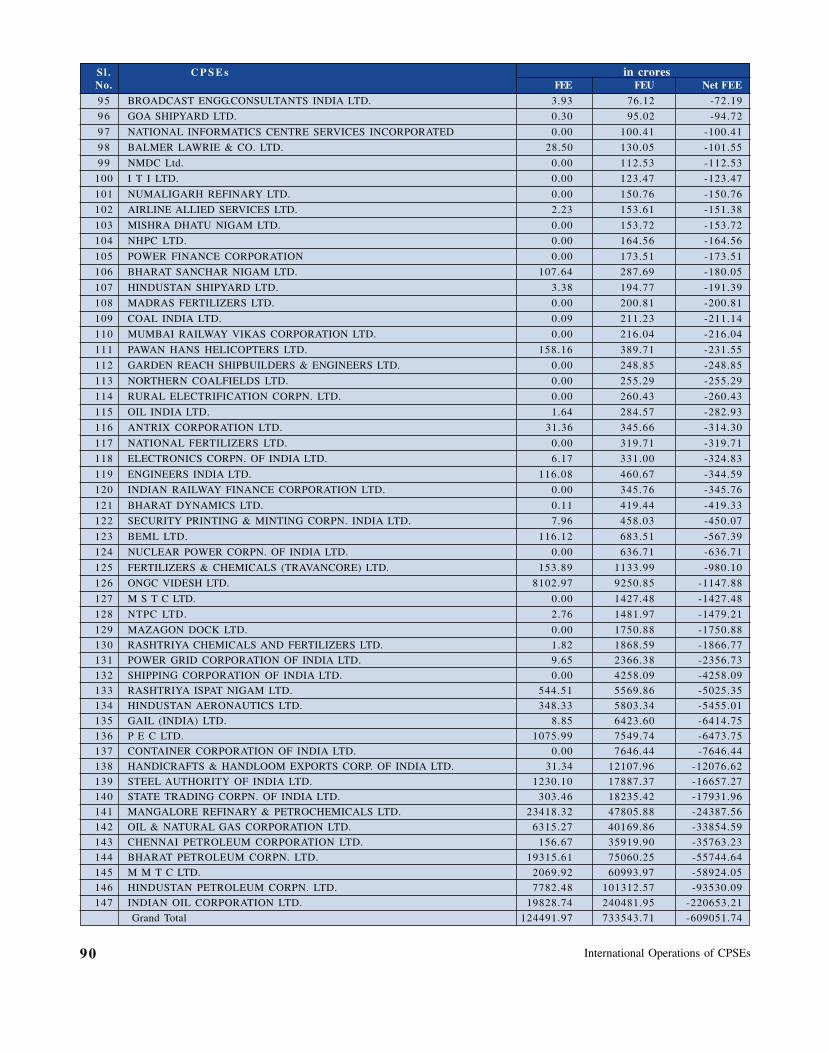
International Operations of CPSEs90
Sl . C P S E s in croresNo. FEE FEU Net FEE
95 BROADCAST ENGG.CONSULTANTS INDIA LTD. 3.93 76.12 -72.19
96 GOA SHIPYARD LTD. 0.30 95.02 -94.72
97 NATIONAL INFORMATICS CENTRE SERVICES INCORPORATED 0.00 100.41 -100.41
98 BALMER LAWRIE & CO. LTD. 28.50 130.05 -101.55
99 NMDC Ltd. 0.00 112.53 -112.53
100 I T I LTD. 0.00 123.47 -123.47
101 NUMALIGARH REFINARY LTD. 0.00 150.76 -150.76
102 AIRLINE ALLIED SERVICES LTD. 2.23 153.61 -151.38
103 MISHRA DHATU NIGAM LTD. 0.00 153.72 -153.72
104 NHPC LTD. 0.00 164.56 -164.56
105 POWER FINANCE CORPORATION 0.00 173.51 -173.51
106 BHARAT SANCHAR NIGAM LTD. 107.64 287.69 -180.05
107 HINDUSTAN SHIPYARD LTD. 3.38 194.77 -191.39
108 MADRAS FERTILIZERS LTD. 0.00 200.81 -200.81
109 COAL INDIA LTD. 0.09 211.23 -211.14
110 MUMBAI RAILWAY VIKAS CORPORATION LTD. 0.00 216.04 -216.04
111 PAWAN HANS HELICOPTERS LTD. 158.16 389.71 -231.55
112 GARDEN REACH SHIPBUILDERS & ENGINEERS LTD. 0.00 248.85 -248.85
113 NORTHERN COALFIELDS LTD. 0.00 255.29 -255.29
114 RURAL ELECTRIFICATION CORPN. LTD. 0.00 260.43 -260.43
115 OIL INDIA LTD. 1.64 284.57 -282.93
116 ANTRIX CORPORATION LTD. 31.36 345.66 -314.30
117 NATIONAL FERTILIZERS LTD. 0.00 319.71 -319.71
118 ELECTRONICS CORPN. OF INDIA LTD. 6.17 331.00 -324.83
119 ENGINEERS INDIA LTD. 116.08 460.67 -344.59
120 INDIAN RAILWAY FINANCE CORPORATION LTD. 0.00 345.76 -345.76
121 BHARAT DYNAMICS LTD. 0.11 419.44 -419.33
122 SECURITY PRINTING & MINTING CORPN. INDIA LTD. 7.96 458.03 -450.07
123 BEML LTD. 116.12 683.51 -567.39
124 NUCLEAR POWER CORPN. OF INDIA LTD. 0.00 636.71 -636.71
125 FERTILIZERS & CHEMICALS (TRAVANCORE) LTD. 153.89 1133.99 -980.10
126 ONGC VIDESH LTD. 8102.97 9250.85 -1147.88
127 M S T C LTD. 0.00 1427.48 -1427.48
128 NTPC LTD. 2.76 1481.97 -1479.21
129 MAZAGON DOCK LTD. 0.00 1750.88 -1750.88
130 RASHTRIYA CHEMICALS AND FERTILIZERS LTD. 1.82 1868.59 -1866.77
131 POWER GRID CORPORATION OF INDIA LTD. 9.65 2366.38 -2356.73
132 SHIPPING CORPORATION OF INDIA LTD. 0.00 4258.09 -4258.09
133 RASHTRIYA ISPAT NIGAM LTD. 544.51 5569.86 -5025.35
134 HINDUSTAN AERONAUTICS LTD. 348.33 5803.34 -5455.01
135 GAIL (INDIA) LTD. 8.85 6423.60 -6414.75
136 P E C LTD. 1075.99 7549.74 -6473.75
137 CONTAINER CORPORATION OF INDIA LTD. 0.00 7646.44 -7646.44
138 HANDICRAFTS & HANDLOOM EXPORTS CORP. OF INDIA LTD. 31.34 12107.96 -12076.62
139 STEEL AUTHORITY OF INDIA LTD. 1230.10 17887.37 -16657.27
140 STATE TRADING CORPN. OF INDIA LTD. 303.46 18235.42 -17931.96
141 MANGALORE REFINARY & PETROCHEMICALS LTD. 23418.32 47805.88 -24387.56
142 OIL & NATURAL GAS CORPORATION LTD. 6315.27 40169.86 -33854.59
143 CHENNAI PETROLEUM CORPORATION LTD. 156.67 35919.90 -35763.23
144 BHARAT PETROLEUM CORPN. LTD. 19315.61 75060.25 -55744.64
145 M M T C LTD. 2069.92 60993.97 -58924.05
146 HINDUSTAN PETROLEUM CORPN. LTD. 7782.48 101312.57 -93530.09
147 INDIAN OIL CORPORATION LTD. 19828.74 240481.95 -220653.21
Grand Total 124491.97 733543.71 -609051.74
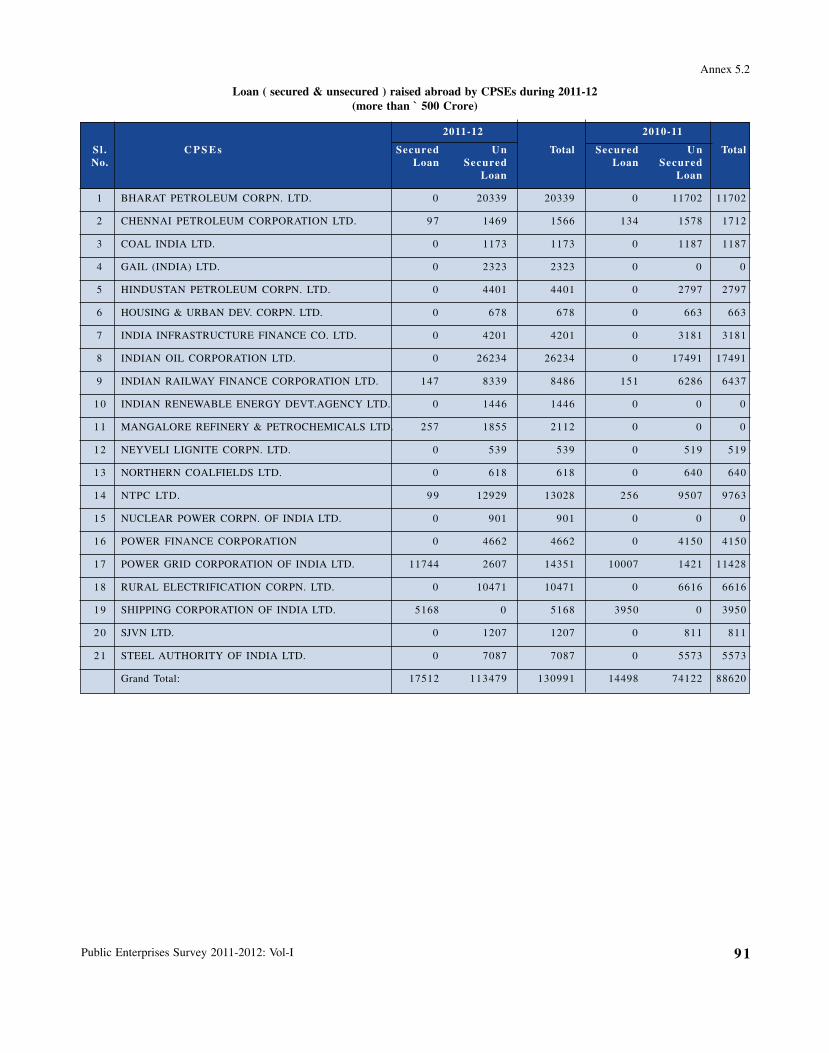
Public Enterprises Survey 2011-2012: Vol-I 91
Annex 5.2
Loan ( secured & unsecured ) raised abroad by CPSEs during 2011-12(more than ` 500 Crore)
2011-12 2010-11
Sl . C P S E s Secured U n Total Secured U n TotalNo. Loan Secured Loan Secured
Loan Loan
1 BHARAT PETROLEUM CORPN. LTD. 0 20339 20339 0 11702 11702
2 CHENNAI PETROLEUM CORPORATION LTD. 97 1469 1566 134 1578 1712
3 COAL INDIA LTD. 0 1173 1173 0 1187 1187
4 GAIL (INDIA) LTD. 0 2323 2323 0 0 0
5 HINDUSTAN PETROLEUM CORPN. LTD. 0 4401 4401 0 2797 2797
6 HOUSING & URBAN DEV. CORPN. LTD. 0 678 678 0 663 663
7 INDIA INFRASTRUCTURE FINANCE CO. LTD. 0 4201 4201 0 3181 3181
8 INDIAN OIL CORPORATION LTD. 0 26234 26234 0 17491 17491
9 INDIAN RAILWAY FINANCE CORPORATION LTD. 147 8339 8486 151 6286 6437
10 INDIAN RENEWABLE ENERGY DEVT.AGENCY LTD. 0 1446 1446 0 0 0
11 MANGALORE REFINERY & PETROCHEMICALS LTD. 257 1855 2112 0 0 0
12 NEYVELI LIGNITE CORPN. LTD. 0 539 539 0 519 519
13 NORTHERN COALFIELDS LTD. 0 618 618 0 640 640
14 NTPC LTD. 99 12929 13028 256 9507 9763
15 NUCLEAR POWER CORPN. OF INDIA LTD. 0 901 901 0 0 0
16 POWER FINANCE CORPORATION 0 4662 4662 0 4150 4150
17 POWER GRID CORPORATION OF INDIA LTD. 11744 2607 14351 10007 1421 11428
18 RURAL ELECTRIFICATION CORPN. LTD. 0 10471 10471 0 6616 6616
19 SHIPPING CORPORATION OF INDIA LTD. 5168 0 5168 3950 0 3950
2 0 SJVN LTD. 0 1207 1207 0 811 811
21 STEEL AUTHORITY OF INDIA LTD. 0 7087 7087 0 5573 5573
Grand Total: 17512 113479 130991 14498 74122 88620
Organisational Structure And Human Resource Management92
Organisational Structure and Human ResourceManagement
Chapter-6
6.1 Organisational Structure of CPSEs
The Department of Public Enterprises formulate policyguidelines on the Board structure of Public Enterprises and adviseson the shape and size of organizational structure of CPSEs. Thepublic enterprises are categorized in four Schedules namely ‘A’,‘B’, ‘C’ and ‘D’ based on various quantitative, qualitative andother factors. The quantitative factors are: investment, capitalemployed, net sales, profit before tax, number of employees andunits, capacity addition, revenue per employee, sales/capitalemployed, capacity utilization and value added per employee.Qualitative factors are: national importance, complexities ofproblems being faced by the company, level of technology,prospects for expansion and diversification of activities andcompetition from other sectors, etc. The other factors, whereveravailable, relate to Share price, MOU ratings, Maharatna/Navratna/Miniratna status and ISO certification and also the factor relatingto the critical/strategic importance of the corporation. The payscales of Chief Executives and full time Functional Directors inCPSEs are determined as per the schedule of the concernedenterprise.
Proposals received from various administrative Ministries/Departments for initial categorization /upgradation of CPSEs inappropriate schedule, personal upgradation, creation of posts inCPSEs, etc. are considered in DPE in consultation with PublicEnterprises Selection Board (PESB). During 2011-12, 1 CPSE(Hindustan Prefab Ltd.) was upgraded to higher schedule, 2 CPSEs(Orissa Minerals Development Company Ltd. and Bisra StoneLime Corporation Ltd.) were initially categorized in theappropriate schedules, one Chief Executive of a CPSE (NumaligarhRefinery Ltd.) was given higher scale of pay on personal basisand one post of Functional Director was created (Director-HumanResource & Corporate Affairs in Balmer Lawrie & Co. Ltd.).During the period from April 2012 to October 2012, one CPSE(ONGC Videsh Ltd.) was upgraded to higher schedule, 3 posts ofFunctional Directors were created (Joint Managing Director in AirIndia Ltd. and Director (Finance) & Director (Production andPlanning) in Orissa Minerals Development Company Ltd.) andone Chief Executive of a CPSE (National Film DevelopmentCorporation Ltd.) was given higher scale of pay on personal basis.
As on 31.3.2012, there were 260 CPSEs. Out of 260 thereare 61 Schedule ‘A’, 71 Schedule ‘B’, 44 Schedule ‘C’, 4 Schedule‘D’ and remaining 80 are uncategorized CPSEs. The Schedule-wiselist is at Annex-A.
6.2 Appointment of Functional Directors ofCPSEs
Functional Directors including Chief Executives of the CPSEsare appointed by the concerned Administrative Ministries/
Departments on the basis of recommendations of PublicEnterprises Selection Board (PESB). The Public enterprisesSelection Board is a high powered body constituted by theGovernment of India vide its Resolution dated 3.3.1987. The PESBhas been set up with the objective of evolving a sound managerialpolicy for the Central Public Sector Enterprises and, in particular,to advise Government on appointments to their top managementposts. As per GOI Resolution, the PESB shall consist of a part-time or full-time chairperson and three full-time Members. TheChairperson and Members are persons who have had a long anddistinguished career in management of public or privatecorporations or public in administration, and have had a provenrecord of achievements, preferably, in the field of personnel,finance, production or marketing. The Government has decidedthat candidates from State Level Public Sector Enterprises (SLPEs)and the Private sector will also be considered for selection to theport of functional directors in CPSEs as non-internal candidatesalong with the candidates of Public Sector Enterprises subject tofulfilling the eligibility criteria. The Government has furthermorestreamlined the procedure for selection and appointment ofFunctional Directors on the Boards of CPSEs. The procedure forconfirmation and extension of tenure of Board level incumbentsof CPSEs has also been simplified and streamlined by theGovernment.
6.2.1 CVC Clearance
The Government has also laid down the procedure forobtaining vigilance clearance from Central Vigilance Commission(CVC) in respect of candidates recommended by PESB for Boardlevel posts in CPSEs so as to reduce delays and it has beenprescribed that CVC will grant its clearance (or otherwise) to theconcerned Administrative Ministry/Department within 15 daysof the receipt of recommendations of PESB.
6.3 Professionalization of Board of CPSEs
Department of Public Enterprises (DPE) formulates policyguidelines on the Board structure of CPSEs. In pursuance of thepublic sector policy being followed since 1991 several measureshave been taken by the Department of Public Enterprises toprofessionalize the Boards of public enterprises. The guidelinesissued in 1992 provide that outside professionals should beinducted on the Boards of CPSEs in the form of part-time non-official Directors and that the number of such Directors shouldbe at least 1/3rd of the actual strength of the Board. In the case oflisted CPSEs headed by executive Chairman, the number of non-official Directors (Independent Directors) should be at least halfthe strength of the Board. The guidelines also provide that thenumber of Government Directors on the Boards should be notmore than one-sixth of the actual strength of the Board subject toa maximum of two. Apart from this, there should be some
Public Enterprises Survey 2011-2012: Vol-I 93
functional Directors on each Board whose number should notexceed 50% of the actual strength of the Board
6.3.1 Appointment of non official Directors. As regardsselection and appointment of non-official Directors on the Boardsof CPSE, the following eligibility criteria has been prescribed:—
6.3.1.1 Criteria of Experience
(i) Retired Government officials with a minimum of 10 yearsexperience at Joint Secretary level or above.
(ii) Persons who have retired as CMD/CEOs of CPSEs andFunctional Directors of the Schedule ‘A’ CPSEs. The ex-Chief Executives and ex-Functional Directors of theCPSEs will not be considered for appointment as non-official Director on the Board of the CPSE from whichthey retire. Serving Chief Executives/Directors of CPSEswill not be eligible to be considered for appointment asnon-official Directors on the Boards of any CPSEs.
(iii) Academicians/Directors of Institutes/Heads ofDepartment and Professors having more than 10 yearsteaching or research experience in the relevant domain e.g.management, finance, marketing, technology, humanresources, or law.
(iv) Professionals of repute having more than 15 years ofrelevant domain experience in fields relevant to thecompany’s area of operation.
(v) Former CEOs of private companies if the company is(a) listed on the Stock Exchanges or (b) unlisted butprofit making and having an annual turnover of at least` 250 crore.
(vi) Persons of eminence with proven track record fromIndustry, Business or Agriculture or Management.
(vii) Serving CEOs and Directors of private companies listedon the Stock Exchanges may also be considered forappointment as part-time non-official Directors on theBoards of CPSEs in exceptional circumstances.
6.3.1.2 Criteria of Educational Qualification
Minimum graduate degree from a recognized university.
6.3.1.3 Criteria of Age
The age band should be between 45-65 years (minimum/maximum limit)
This could, however, be relaxed for eminent professionals,for reasons to be recorded, being limited to 70 years.
The proposals for appointment of non-official Directors areinitiated by the concerned Administrative Ministries/Departments.The selection of non-official Directors in respect of all CPSEs ismade by the Search Committee which presently consists ofChairman (PESB), Secretary (DPE), Secretary of the administrativeMinistry/Department of the CPSE and 2 non-official Members.The concerned Administrative Ministry/Department appoints thenon-official Directors on the basis of recommendations of SearchCommittee after obtaining the approval of competent authority.
During the year 2011-12, the proposals for filling up 156positions of non-official Directors on the Boards of 88 CPSEswere considered and suitable recommendations were conveyed tothe concerned administrative Ministries/Departments.
6.4 Corporate Governance in Central PublicSector Enterprises (CPSEs)
Keeping in view the importance of Corporate Governanceprinciples in ensuring transparency and enhancing the trust ofstakeholders, the Government had, in 2007, approved theGuidelines on Corporate Governance for CPSEs. These guidelineswere formulated by DPE keeping in view relevant laws,instructions and procedures. These Guidelines, after approval bythe Cabinet, were released by the then Finance Minister on22nd June, 2007. The Cabinet while approving the implementationof the Guidelines for an experimental phase of one year had directedthat (i) any adjustments required in the Guidelines be made in thelight of the experiences gained with the approval of competentauthority; and (ii) mid-year progress reports be submitted by theCPSEs.
Since the issue of these Guidelines in June, 2007, the CPSEshave had the opportunity to implement them for the whole ofthe financial year 2008-09. It was felt that while the principles ofCorporate Governance apply equally to both the public and privatesector, there was a continued need to adopt and apply the goodCorporate Governance practices in respect of CPSEs wherein hugepublic funds are invested. The continued need for adoption ofgood Corporate Governance principles has been reinforced in thelight of recent events in the corporate world. Thus, it was decidedto continue the Guidelines on Corporate Governance for CPSEsand after due inter-ministerial consultations, the proposal forintroduction of Guidelines on Corporate Governance for CPSEson mandatory basis was approved by the Government in March,2010.
These Guidelines have now been made mandatory and areapplicable to all CPSEs. The Guidelines cover issues likecomposition of Board of CPSEs, Audit Committee, RemunerationCommittee, Subsidiary CPSEs, Disclosures, Code of Conduct andEthics, Risk Management and Reporting. The Guidelines havebeen modified and improved keeping in view the experience gainedduring the experimental phase of one year and include additionalprovisions relating to monitoring the compliance of Guidelines bythe CPSEs and formation of Remuneration Committee. Since, theconcept of Corporate Governance is dynamic in nature, it has alsobeen provided that suitable modifications in these Guidelines wouldbe carried out to bring them in line with prevailing laws,Regulations, Acts, etc. from time to time.
The DPE has also taken the initiative to grade CPSEs on thebasis of their compliance with Guidelines and such grading willbe used for MOU Awards. Keeping in view the importance ofCorporate Governance in State Level Public Enterprises, all Stateshave also been advised to implement these Guidelines. The salientfeatures of these guidelines are as under.
6.4.1 Composition of Board
In respect of the Board’s composition, these Guidelinesprovide that the number of functional Directors should not exceed
Organisational Structure And Human Resource Management94
50% of the actual strength of the Board; and the number ofGovernment nominee Directors shall be restricted to maximum oftwo. In case of listed CPSEs with Executive Chairman, the numberof non-official Directors shall be at least 50% of Board Members.In case of unlisted and listed CPSEs with Non-executive Chairman,at least one-third of the Board Members shall be non-officialDirectors. The Government has also laid down pre-defined criteriain terms of educational qualifications, age and experience in respectof persons to be considered for appointment as Non-officialDirectors. Relevant clauses have been incorporated in theseguidelines to ensure ‘independence’ of Non-official Directors andavoid potential conflict of interest. It has also been provided thatthe Directors nominated by any institution other than publicfinancial institution will not be treated as Non-official Directors.
It has been further mandated that the Board meetings are tobe held at least once in every 3 months and at least 4 such meetingsheld in a year and all relevant information is to be given to theBoard. Further, the Board should lay down code of conduct forall members and senior management. In this regard, a model Codehas been incorporated in the Guidelines to assist the CPSEs. TheGuidelines inter alia provide that the Board should ensureintegration and alignment of risk management system and thecompany should undertake suitable training programmes for itsnew Board members.
6.4.2 Audit Committee
The provisions relating to Audit Committee require a qualifiedand independent Audit Committee to be set up by CPSEs withminimum three Directors as members. Further, two-thirds of themembers of this Committee should be Independent Directors withan Independent Director as Chairman. The Audit Committee hasbeen given extensive powers with regard to financial matters ofcompany and is required to meet at least 4 times in a year.
6.4.3 Subsidiary Companies
With regard to subsidiary companies, it has been providedthat at least one Independent Director of holding company willbe Director on the Board of subsidiary company and the AuditCommittee of holding company will review financial statementsof subsidiary. All significant transactions and arrangements ofsubsidiary companies are required to be brought to the attentionof Board of Directors of the holding company.
6.4.4 Disclosures
The provisions regarding disclosures require all transactionsto be placed before the Audit Committee. The Guidelines mandatethat while preparing financial statements, treatment should be asper prescribed Accounting Standard and if there are any deviations,the same are to be explicitly mentioned. Further, the Board is tobe informed about risk assessment and minimization proceduresand senior Management is to make disclosures to Board relatingto all financial and commercial transactions where they havepersonal interest or may have a potential conflict.
6.4.5 Compliance
It has also been mandated in the Guidelines that AnnualReport of companies should contain a separate section on
Corporate Governance with details of compliance. The CPSEs willhave to obtain a certificate from Auditors/Company Secretaryregarding compliance with these Guidelines. Chairman’s speechin AGM will also carry a section on compliance with CorporateGovernance Guidelines and will form part of the company’s AnnualReport. The CPSEs are required to submit quarterly compliancereport to their administrative Ministries who will furnish aconsolidated Annual Report to DPE.
DPE organized an Interactive Session with CompanySecretaries of all CPSEs to discuss issues related to Complianceof Guidelines on Corporate Governance of CPSEs. Thereafter,DPE had constituted a Committee of Company Secretaries ofselect CPSEs to review the format for grading CPSEs on the basisof their compliance with Guidelines on Corporate Governance forCPSEs and on the basis of recommendations of this Committee,the format for grading the CPSEs has been revised during the yearand for the year 2011-12, the grading would be finalized on thebasis of new format and all CPSEs have been requested to furnishself-evaluation reports in the prescribed format to their concernedAdministrative Ministries/Departments on quarterly basis. Theconcerned Administrative Ministries/Departments have beenfurther requested to furnish consolidated annual score and gradingin respect of all CPSEs under their administrative control to DPE.
6.5 Wage Policy and Manpower Rationalisation
The Department of Public Enterprises (DPE) functions asnodal Department inter-alia, in respect of policy relating to wagesettlement of workmen, pay revision of non-unionized supervisorsand executives holding posts below the Board level as well as atthe Board level in CPSEs. The Department renders advice to theAdministrative Ministries/ Departments and the CPSEs in mattersrelating to the wage policy of workmen and revision in the scalesof pay of the executives. The CPSEs are largely followingIndustrial Dearness Allowance (IDA) pattern scales of pay. Insome cases Central Dearness Allowance (CDA) pattern scales ofpay is followed. DPE also issues quarterly DA orders in respectof IDA employees. The DA orders for CDA employees are issuedon six monthly periods.
6.5.1 Industrial Dearness Allowance (IDA)
Government policy relating to pay scales and pay pattern isthat all employees of the CPSEs should be on IDA pattern andrelated scales of pay. Instructions had been issued by the DPE inJuly, 1981 and July, 1984 to all the administrative Ministries/Departments that as and when a new CPSE is created orestablished, IDA pattern and related scales of pay should beadopted ab-initio. In line with DPE O.M. dated 12.06.1990, DPEvide its O.M. dated 10.08.2009 reiterated and emphasized that‘appointments’ including ‘promotion’ on or after 01.01.1989 inCDA scales of pay have to be in IDA scales of pay. There were260 CPSEs (excluding Banks, Insurance Companies and newly setup CPSEs), as on 31.03.2012 under the administrative control ofthe Central Government. They employed approximately 13.98lakh workmen, clerical staff and executives. Out of this, around75% of the workmen and executives are on IDA pattern and relatedscales of pay. The remaining employees are on CDA pay pattern,deputation etc.
Public Enterprises Survey 2011-2012: Vol-I 95
6.5.2 Second Pay Revision Committee
As the periodicity of previous pay revision was coming toan end, the Second Pay Revision Committee (2nd PRC) headedby Mr. Justice M. JagannadhaRao, retired judge of Supreme Court,for the revision of scales of pay of Board level and below Boardlevel executives including non-unionized supervisors of CPSEsfollowing Industrial Dearness Allowance (IDA) pattern scales ofpay w.e.f. 01.01.2007, was constituted vide the Government ofIndia Resolution dated 30.11.2006. The IInd PRC submitted itsreport to Government on 30.05.2008. The Government, after dueconsideration of the recommendations of the 2nd PRC issuedorders on 26.11.2008 and 09.02.2009. The salient features of theseorders are as follows:—
(i) Pay scales ranging from ? 12,600-32,500 for E-0 gradeand to ? 80,000-1,25000 for Chief Executives of schedule‘A’ CPSEs.
(ii) A uniform fitment benefit @ 30% on basic pay plus DA@ 68.8% as on 01.01.2007.
(iii) Rate of increment @ 3% of basic pay.
(iv) Perks and allowances upto the maximum of 50% of basicpay, with provision of ‘Cafeteria Approach’.
(v) PRP ranging from 40% to 200% of the basic pay.
(vi) Superannuation benefits upto 30% of basic pay.
(vii) Ceiling of gratuity in respect of executives and non-unionized supervisors raised to ? 10.00 Lakh w.e.f.01.01.2007.
(viii) Implementation of Pay Revision linked to affordabilityof the CPSE.
(ix) The CPSE concerned have to finance pay revision fromtheir own resources and no budgetary support will beprovided.
(x) An Anomalies Committee consisting of Secretaries ofDepartment of Public Enterprises, Department ofExpenditure and Department of Personnel & Trainingconstituted to look into further specific issues/ problemthat may arise in implementation of Governments orderson the recommendation of 2nd PRC.
(xi) DPE will issue necessary instructions/clarificationswhenever required in implementation of the decision onpay revision.
Subsequently, a Committee of Ministers headed by the thenHome Minister looked into the demands of the executives of Oil& Power Sector CPSEs. Based on the recommendations of theCommittee of Ministers, government issued orders on 02.04.2009to extend the following additional benefits:-
(i) Benefit of merger of DA with basic pay for the purposeof fitment raisingit from 68.8% to 78.2%.
(ii) Superannuation benefitupto 30% of basic pay + DAinstead of basic pay alone.
(iii) Limiting the expenditure on infrastructure to recurring
cost of running the facilities with a ceiling of 10% of basicpay.
(iv) Enhanced allowances could be effective from 26.11.2008,instead of from the date of issue of Presidential Directive,provided the Presidential Directive is issued within onemonth of 02.04.2009.
(v) These benefits to be extended to all CPSEs. Benefits asgiven in these O.Ms to be viewed as a total package. Nochange need be made in O.Ms dated 26.11.2008 and09.02.2009.
6.5.3 Recommendation of Anomalies Committee
In terms of the provision of Anomalies Committee under DPEO.M. dated 26.11.2008, certain issues have been considered bythe Anomalies Committee and DPE has issued orders accordingly.The issues covered are (i) Pay etc. of Government officers ondeputation to CPSEs, (ii) Self Lease, (iii) Medical Expenditure,(iv) Encashment of Leave (v) Benefit of bunching of increment,(vi)Procedure of pay fixation in some past cases of Board levelexecutives, (vii) Protection of last drawn pay in a particular caseof Board level executives (viii) NPA not to be considered as payfor the purpose of calculating other benefits (ix) no other allowanceor perks to be kept outside the 50% ceiling except the ‘4’ thathave been provided in DPE guidelines and (x) not to include ‘underrecoveries’ in PBT for the purpose of calculating PRP.
6.5.4 Wage Revision for Workmen under IDA pattern
DPE vide O.Ms dated 9.11.2006 and 01.05.2008 has issuedpolicy guidelines for the 7th Round of Wage Negotiations (whichwas on a general basis from 01.01.2007) with the unionizedworkmen of CPSEs. The guidelines are broadly similar to theearlier policy on the Sixth Round of Wage Negotiations. Theguidelines also provide that administrative Ministries/Departments may take a decision on a case by case basis for theperiodicity of wage settlement within 10 years but not less than5 years, with the approval of their Minister.
6.5.5 Pay revision of employees under CDA Patternin CPSEs
CDA pattern pay scales are applicable to some of the clericalstaff, unionized cadres and executives of the 69 CPSEs who wereon the rolls of these CPSEs as on 1.1.1986 and upto 31.12.1988and were in receipt of CDA pattern pay scales during that time.A High Power Pay Committee (HPPC) was appointed by theGovernment, in pursuance of the Supreme Court directions dated12.3.1986, which submitted its Report to the Government on24.11.1988. Its recommendations were implemented in theseCPSEs. In pursuance of the Supreme Court direction dated3.5.1990 read with the subsequent directions dated 28.8.1991, IDApattern and related scales of pay were introduced in these CPSEswith effect from 1.1.1989. Vide DPE O.M. dated 10.08.2009 itwas clarified that ‘Appointment’ includes selection, promotionand deputation. Therefore, all appointments includingappointment on promotion should be under IDA pattern of payscales as per the direction of Hon’ble Supreme Court.

Organisational Structure And Human Resource Management96
DPE vide O.Ms dated 14.10.2008 and 20.01.2009 has revisedpay scales and allowances of the employees of CPSEs followingCDA pattern w.e.f. 01.01.2006. The benefit of pay revision wasallowed to the employees of those CPSEs that are not loss makingand are in a position to absorb the expenditure on account of payrevision from their own resources without any budgetary supportfrom the Government.
6.5.6 Important policy guidelines issued during theperiod 2011-12
(i) The issue of sanction of foreign tour programme of ChiefExecutives and Functional Directors was reviewed andDPE vide O.M. dated 20.07.2011, inter alia, clarified thatstatus-quo as indicated in O.M. dated 24.08.2007 to bemaintained.
(ii) DPE vide O.M. dated 20.07.2011 allowed administrativeMinistries/Departments to create ‘Common Corpus’ forthe retired employees of CPSEs under their administrativecontrol in the light of DPE O.M. dated 08.07.2009.
(iii) DPE vide O.M. dated 30.05.2011 issued guidelines tobe followed by employees of CPSEs/Association/TradeUnions etc. while sending their representations on wage/pay related issues.
(iv) Based on the recommendations of Anomalies Committee,DPE vide O.M. dated 01.06.2011 has clarified that ‘NPA’will not to be considered as pay for the purpose ofcalculation of other benefits and no other allowance orperks will be kept outside the 50% ceiling except thefour allowances that have been provided in DPE O.M.dated 26.11.2008.
(v) DPE vide O.M. dated 20.03.2012 conveyedadministrative Ministries/Departments to issue suitableguidelines to the CPSEs under their administrative controlregarding rate for recovery of rent on lease/self-leaseaccommodation.
6.6 Voluntary Retirement Scheme(VRS)
In the present market scenario, in view of the ongoingrestructuring in industry including CPSEs, several measures forreforms and restructuring of CPSEs have been taken up by theGovernment. Right sizing of manpower in the CPSEs is one ofthe measures adopted. In this process, the Voluntary RetirementScheme, (initially announced in October, 1988 for the first time)was further liberalized and a comprehensive package was notifiedby DPE in May, 2000 in ordrer to cater to the need of the CPSEsto meet their objectives and also to protect the interest of theworkers affected due to various restructuring models.
Considering the difficulties faced by the enterprises wherethe wage revision of 1992 or 1997 (as the case may be) could notbe effective, the Voluntary Retirement Scheme was liberalized byissuance of subsequent notification of 6th November, 2001, whichinter-alia provides for 100% additional compensation for theemployees where wage revision of 1992 could not be effected andsimilarly 50% additional compensation for employees where wage
revision of 1997 could not be made effective. The ex-gratiapayment under VRS to employees following CDA pattern at 1986scales of pay has been enhanced by 50% w.e.f. 26.10.2004. Theseincreases in VRS compensation are to be computed based onexisting pay of employees.
6.6.1 VRS In Cpses that can Sustain a VRS with their Own Surplus Resources.
Enterprises, which are financially sound and can sustain VRSon their own, can frame their own schemes of VRS and make itattractive enough for employees to opt for it. They may offer ascompensation upto 60 days salary (only Basic Pay + DA) forevery completed year of service. However, such compensationwill not exceed the salary for the balance period of service left.
6.6.2 VRS in Marginally Profit or loss Making and Sick and Unviable CPSEs
Marginally profit /loss making CPSEs as well as sick andunviable units may adopt either (i) the Gujarat Model, underwhich the compensation is computed by allowing 35 days salaryfor every completed year of service and 25 days for each year ofthe balance ervice left until superannuating, subject to thecondition that the compensation shall not exceed the sum of salaryfor the balance period left for superannuation (ii) or the VRSpackage of Department of Heavy Industry (DHI model), underwhich ex-gratia payment equivalent to 45 days emoluments ( Pay+ DA) for each completed year of service or the total emolumentsfor the balance period of service, whichever is less, is applicable.The employees who have completed not less than 30 years ofservice will be eligible for a maximum of 60(sixty) months salary/wage as compensation and this will be subject to an amount notexceeding the salary/wage for the balance period of service left.
6.7 Scheme of Counselling, Retraining andRedeployment
Restructuring of enterprises is a global phenomenon,particularly in the context of liberalized economy. There has beenthrust on restructuring central public enterprises both at macro aswell as micro level. In the process, rationalization of manpowerhas also become a necessity. However, in some cases it affectsthe existing manpower due to shift in technology and changedmanpower requirements. As such, the policy of the Governmenthas been to implement reforms with a humane face and provideadequate safety net for the affected workers adversely affecteddue to right sizing.
Considering the need to have safety net, Government hadestablished the National Renewal Fund (NRF) in February, 1992broadly to cover the expenses of VRS and to provide retraining tothe workers in the organized sector. The retraining activity wasadministered by Department of Industrial Policy & Promotion.However, in February, 2000, due to various reasons NRF wasabolished in February, 2000. Since 2001-02, the Scheme forCounselling, Retraining and Redeployment (CRR) of RationalizedEmployees of CPSEs is being implemented by Department ofPublic Enterprises. CRR Scheme was modified in November, 2007
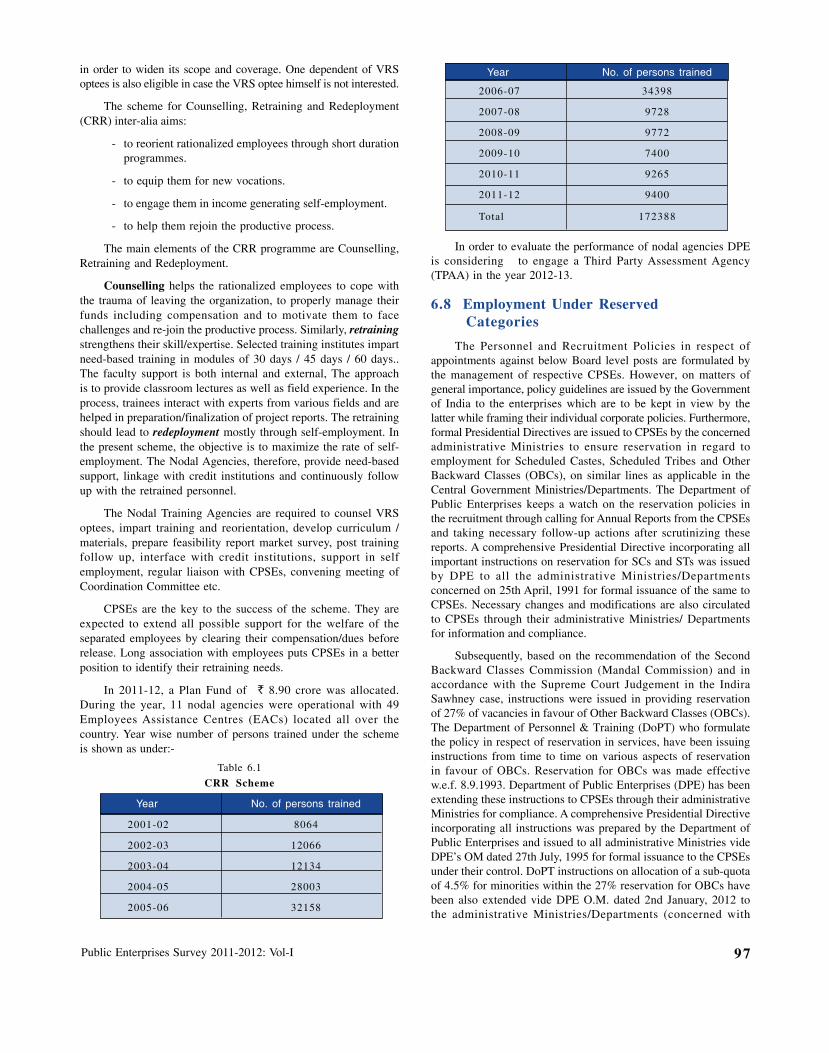
Public Enterprises Survey 2011-2012: Vol-I 97
in order to widen its scope and coverage. One dependent of VRSoptees is also eligible in case the VRS optee himself is not interested.
The scheme for Counselling, Retraining and Redeployment(CRR) inter-alia aims:
- to reorient rationalized employees through short durationprogrammes.
- to equip them for new vocations.
- to engage them in income generating self-employment.
- to help them rejoin the productive process.
The main elements of the CRR programme are Counselling,Retraining and Redeployment.
Counselling helps the rationalized employees to cope withthe trauma of leaving the organization, to properly manage theirfunds including compensation and to motivate them to facechallenges and re-join the productive process. Similarly, retrainingstrengthens their skill/expertise. Selected training institutes impartneed-based training in modules of 30 days / 45 days / 60 days..The faculty support is both internal and external, The approachis to provide classroom lectures as well as field experience. In theprocess, trainees interact with experts from various fields and arehelped in preparation/finalization of project reports. The retrainingshould lead to redeployment mostly through self-employment. Inthe present scheme, the objective is to maximize the rate of self-employment. The Nodal Agencies, therefore, provide need-basedsupport, linkage with credit institutions and continuously followup with the retrained personnel.
The Nodal Training Agencies are required to counsel VRSoptees, impart training and reorientation, develop curriculum /materials, prepare feasibility report market survey, post trainingfollow up, interface with credit institutions, support in selfemployment, regular liaison with CPSEs, convening meeting ofCoordination Committee etc.
CPSEs are the key to the success of the scheme. They areexpected to extend all possible support for the welfare of theseparated employees by clearing their compensation/dues beforerelease. Long association with employees puts CPSEs in a betterposition to identify their retraining needs.
In 2011-12, a Plan Fund of ` 8.90 crore was allocated.During the year, 11 nodal agencies were operational with 49Employees Assistance Centres (EACs) located all over thecountry. Year wise number of persons trained under the schemeis shown as under:-
Table 6.1
CRR Scheme
Year No. of persons trained
2001-02 8064
2002-03 12066
2003-04 12134
2004-05 28003
2005-06 32158
2006-07 34398
2007-08 9728
2008-09 9772
2009-10 7400
2010-11 9265
2011-12 9400
Total 172388
In order to evaluate the performance of nodal agencies DPEis considering to engage a Third Party Assessment Agency(TPAA) in the year 2012-13.
6.8 Employment Under Reserved Categories
The Personnel and Recruitment Policies in respect ofappointments against below Board level posts are formulated bythe management of respective CPSEs. However, on matters ofgeneral importance, policy guidelines are issued by the Governmentof India to the enterprises which are to be kept in view by thelatter while framing their individual corporate policies. Furthermore,formal Presidential Directives are issued to CPSEs by the concernedadministrative Ministries to ensure reservation in regard toemployment for Scheduled Castes, Scheduled Tribes and OtherBackward Classes (OBCs), on similar lines as applicable in theCentral Government Ministries/Departments. The Department ofPublic Enterprises keeps a watch on the reservation policies inthe recruitment through calling for Annual Reports from the CPSEsand taking necessary follow-up actions after scrutinizing thesereports. A comprehensive Presidential Directive incorporating allimportant instructions on reservation for SCs and STs was issuedby DPE to all the administrative Ministries/Departmentsconcerned on 25th April, 1991 for formal issuance of the same toCPSEs. Necessary changes and modifications are also circulatedto CPSEs through their administrative Ministries/ Departmentsfor information and compliance.
Subsequently, based on the recommendation of the SecondBackward Classes Commission (Mandal Commission) and inaccordance with the Supreme Court Judgement in the IndiraSawhney case, instructions were issued in providing reservationof 27% of vacancies in favour of Other Backward Classes (OBCs).The Department of Personnel & Training (DoPT) who formulatethe policy in respect of reservation in services, have been issuinginstructions from time to time on various aspects of reservationin favour of OBCs. Reservation for OBCs was made effectivew.e.f. 8.9.1993. Department of Public Enterprises (DPE) has beenextending these instructions to CPSEs through their administrativeMinistries for compliance. A comprehensive Presidential Directiveincorporating all instructions was prepared by the Department ofPublic Enterprises and issued to all administrative Ministries videDPE’s OM dated 27th July, 1995 for formal issuance to the CPSEsunder their control. DoPT instructions on allocation of a sub-quotaof 4.5% for minorities within the 27% reservation for OBCs havebeen also extended vide DPE O.M. dated 2nd January, 2012 tothe administrative Ministries/Departments (concerned with
Year No. of persons trained
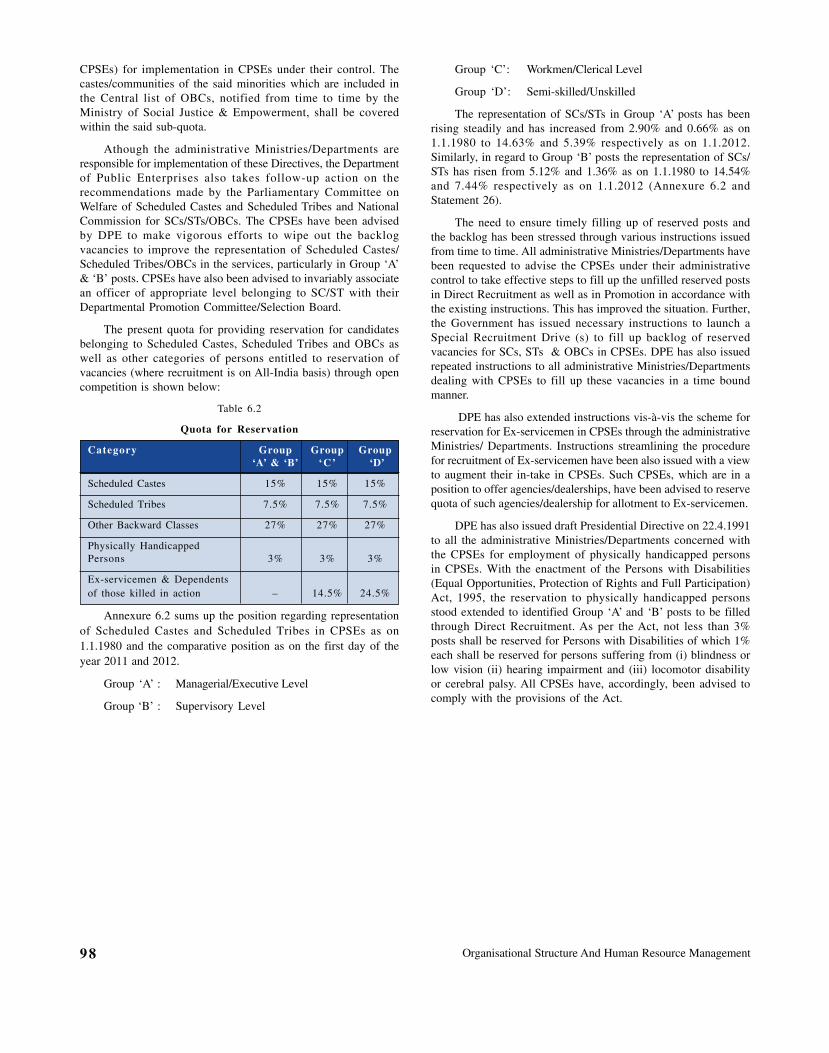
Organisational Structure And Human Resource Management98
CPSEs) for implementation in CPSEs under their control. Thecastes/communities of the said minorities which are included inthe Central list of OBCs, notified from time to time by theMinistry of Social Justice & Empowerment, shall be coveredwithin the said sub-quota.
Athough the administrative Ministries/Departments areresponsible for implementation of these Directives, the Departmentof Public Enterprises also takes follow-up action on therecommendations made by the Parliamentary Committee onWelfare of Scheduled Castes and Scheduled Tribes and NationalCommission for SCs/STs/OBCs. The CPSEs have been advisedby DPE to make vigorous efforts to wipe out the backlogvacancies to improve the representation of Scheduled Castes/Scheduled Tribes/OBCs in the services, particularly in Group ‘A’& ‘B’ posts. CPSEs have also been advised to invariably associatean officer of appropriate level belonging to SC/ST with theirDepartmental Promotion Committee/Selection Board.
The present quota for providing reservation for candidatesbelonging to Scheduled Castes, Scheduled Tribes and OBCs aswell as other categories of persons entitled to reservation ofvacancies (where recruitment is on All-India basis) through opencompetition is shown below:
Table 6.2
Quota for Reservation
Category Group Group Group‘A’ & ‘B’ ‘C’ ‘D’
Scheduled Castes 15% 15% 15%
Scheduled Tribes 7.5% 7.5% 7.5%
Other Backward Classes 27% 27% 27%
Physically HandicappedPersons 3% 3% 3%
Ex-servicemen & Dependentsof those killed in action – 14.5% 24.5%
Annexure 6.2 sums up the position regarding representationof Scheduled Castes and Scheduled Tribes in CPSEs as on1.1.1980 and the comparative position as on the first day of theyear 2011 and 2012.
Group ‘A’ : Managerial/Executive Level
Group ‘B’ : Supervisory Level
Group ‘C’: Workmen/Clerical Level
Group ‘D’: Semi-skilled/Unskilled
The representation of SCs/STs in Group ‘A’ posts has beenrising steadily and has increased from 2.90% and 0.66% as on1.1.1980 to 14.63% and 5.39% respectively as on 1.1.2012.Similarly, in regard to Group ‘B’ posts the representation of SCs/STs has risen from 5.12% and 1.36% as on 1.1.1980 to 14.54%and 7.44% respectively as on 1.1.2012 (Annexure 6.2 andStatement 26).
The need to ensure timely filling up of reserved posts andthe backlog has been stressed through various instructions issuedfrom time to time. All administrative Ministries/Departments havebeen requested to advise the CPSEs under their administrativecontrol to take effective steps to fill up the unfilled reserved postsin Direct Recruitment as well as in Promotion in accordance withthe existing instructions. This has improved the situation. Further,the Government has issued necessary instructions to launch aSpecial Recruitment Drive (s) to fill up backlog of reservedvacancies for SCs, STs & OBCs in CPSEs. DPE has also issuedrepeated instructions to all administrative Ministries/Departmentsdealing with CPSEs to fill up these vacancies in a time boundmanner.
DPE has also extended instructions vis-à-vis the scheme forreservation for Ex-servicemen in CPSEs through the administrativeMinistries/ Departments. Instructions streamlining the procedurefor recruitment of Ex-servicemen have been also issued with a viewto augment their in-take in CPSEs. Such CPSEs, which are in aposition to offer agencies/dealerships, have been advised to reservequota of such agencies/dealership for allotment to Ex-servicemen.
DPE has also issued draft Presidential Directive on 22.4.1991to all the administrative Ministries/Departments concerned withthe CPSEs for employment of physically handicapped personsin CPSEs. With the enactment of the Persons with Disabilities(Equal Opportunities, Protection of Rights and Full Participation)Act, 1995, the reservation to physically handicapped personsstood extended to identified Group ‘A’ and ‘B’ posts to be filledthrough Direct Recruitment. As per the Act, not less than 3%posts shall be reserved for Persons with Disabilities of which 1%each shall be reserved for persons suffering from (i) blindness orlow vision (ii) hearing impairment and (iii) locomotor disabilityor cerebral palsy. All CPSEs have, accordingly, been advised tocomply with the provisions of the Act.
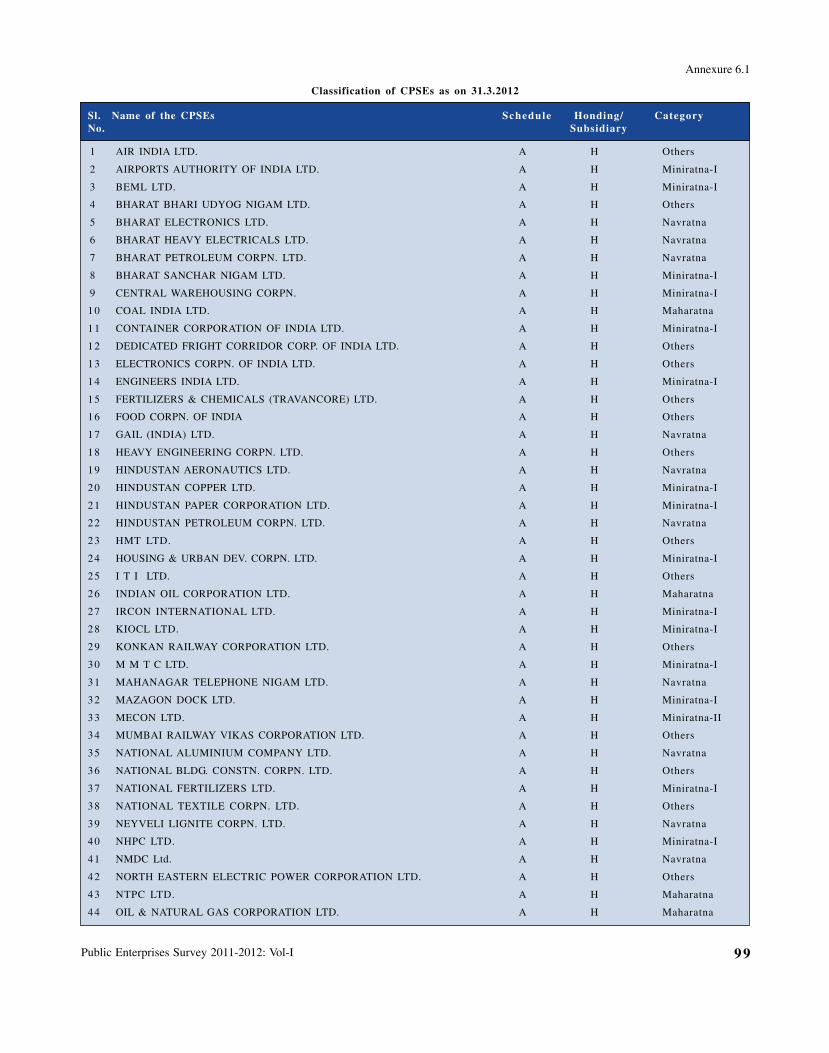
Public Enterprises Survey 2011-2012: Vol-I 99
Sl. Name of the CPSEs Schedule Honding/ CategoryNo. Subsidiary
1 AIR INDIA LTD. A H Others
2 AIRPORTS AUTHORITY OF INDIA LTD. A H Miniratna-I
3 BEML LTD. A H Miniratna-I
4 BHARAT BHARI UDYOG NIGAM LTD. A H Others
5 BHARAT ELECTRONICS LTD. A H Navratna
6 BHARAT HEAVY ELECTRICALS LTD. A H Navratna
7 BHARAT PETROLEUM CORPN. LTD. A H Navratna
8 BHARAT SANCHAR NIGAM LTD. A H Miniratna-I
9 CENTRAL WAREHOUSING CORPN. A H Miniratna-I
10 COAL INDIA LTD. A H Maharatna
11 CONTAINER CORPORATION OF INDIA LTD. A H Miniratna-I
12 DEDICATED FRIGHT CORRIDOR CORP. OF INDIA LTD. A H Others
13 ELECTRONICS CORPN. OF INDIA LTD. A H Others
14 ENGINEERS INDIA LTD. A H Miniratna-I
15 FERTILIZERS & CHEMICALS (TRAVANCORE) LTD. A H Others
16 FOOD CORPN. OF INDIA A H Others
17 GAIL (INDIA) LTD. A H Navratna
18 HEAVY ENGINEERING CORPN. LTD. A H Others
19 HINDUSTAN AERONAUTICS LTD. A H Navratna
20 HINDUSTAN COPPER LTD. A H Miniratna-I
21 HINDUSTAN PAPER CORPORATION LTD. A H Miniratna-I
22 HINDUSTAN PETROLEUM CORPN. LTD. A H Navratna
23 HMT LTD. A H Others
24 HOUSING & URBAN DEV. CORPN. LTD. A H Miniratna-I
25 I T I LTD. A H Others
26 INDIAN OIL CORPORATION LTD. A H Maharatna
27 IRCON INTERNATIONAL LTD. A H Miniratna-I
28 KIOCL LTD. A H Miniratna-I
29 KONKAN RAILWAY CORPORATION LTD. A H Others
30 M M T C LTD. A H Miniratna-I
31 MAHANAGAR TELEPHONE NIGAM LTD. A H Navratna
32 MAZAGON DOCK LTD. A H Miniratna-I
33 MECON LTD. A H Miniratna-II
34 MUMBAI RAILWAY VIKAS CORPORATION LTD. A H Others
35 NATIONAL ALUMINIUM COMPANY LTD. A H Navratna
36 NATIONAL BLDG. CONSTN. CORPN. LTD. A H Others
37 NATIONAL FERTILIZERS LTD. A H Miniratna-I
38 NATIONAL TEXTILE CORPN. LTD. A H Others
39 NEYVELI LIGNITE CORPN. LTD. A H Navratna
40 NHPC LTD. A H Miniratna-I
41 NMDC Ltd. A H Navratna
42 NORTH EASTERN ELECTRIC POWER CORPORATION LTD. A H Others
43 NTPC LTD. A H Maharatna
44 OIL & NATURAL GAS CORPORATION LTD. A H Maharatna
Annexure 6.1
Classification of CPSEs as on 31.3.2012
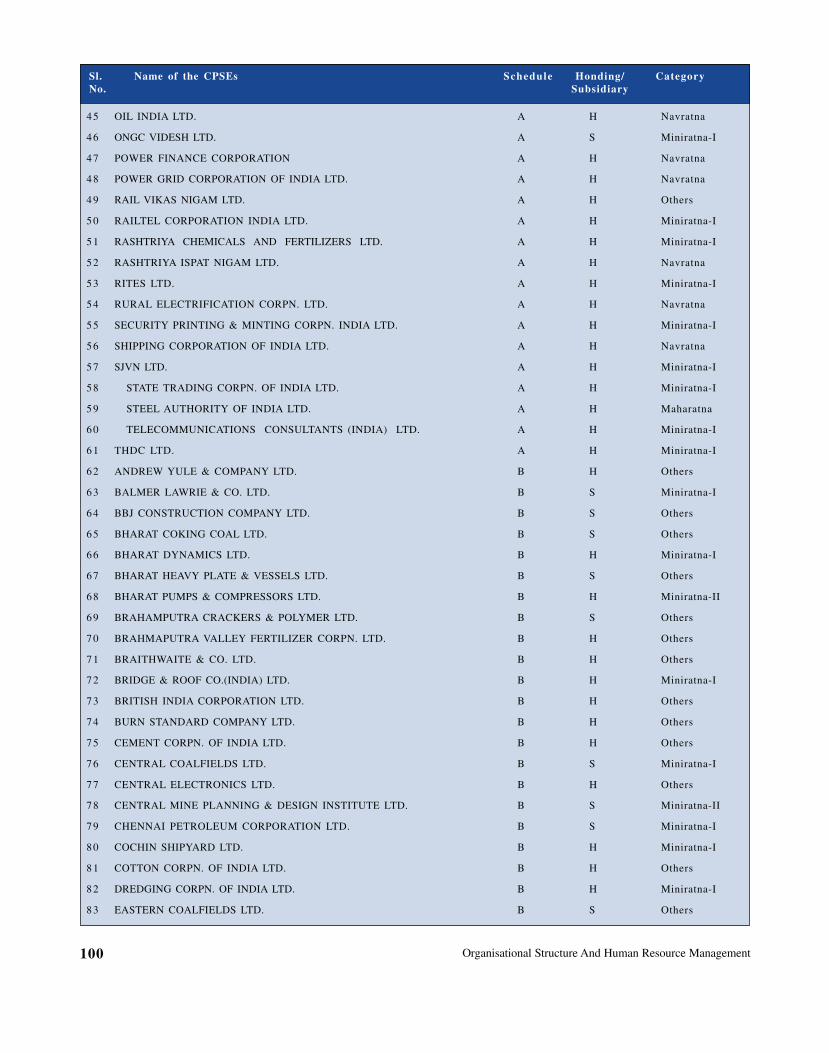
Organisational Structure And Human Resource Management100
45 OIL INDIA LTD. A H Navratna
46 ONGC VIDESH LTD. A S Miniratna-I
47 POWER FINANCE CORPORATION A H Navratna
48 POWER GRID CORPORATION OF INDIA LTD. A H Navratna
49 RAIL VIKAS NIGAM LTD. A H Others
50 RAILTEL CORPORATION INDIA LTD. A H Miniratna-I
51 RASHTRIYA CHEMICALS AND FERTILIZERS LTD. A H Miniratna-I
52 RASHTRIYA ISPAT NIGAM LTD. A H Navratna
53 RITES LTD. A H Miniratna-I
54 RURAL ELECTRIFICATION CORPN. LTD. A H Navratna
55 SECURITY PRINTING & MINTING CORPN. INDIA LTD. A H Miniratna-I
56 SHIPPING CORPORATION OF INDIA LTD. A H Navratna
5 7 SJVN LTD. A H Miniratna-I
58 STATE TRADING CORPN. OF INDIA LTD. A H Miniratna-I
59 STEEL AUTHORITY OF INDIA LTD. A H Maharatna
60 TELECOMMUNICATIONS CONSULTANTS (INDIA) LTD. A H Miniratna-I
61 THDC LTD. A H Miniratna-I
62 ANDREW YULE & COMPANY LTD. B H Others
63 BALMER LAWRIE & CO. LTD. B S Miniratna-I
64 BBJ CONSTRUCTION COMPANY LTD. B S Others
65 BHARAT COKING COAL LTD. B S Others
66 BHARAT DYNAMICS LTD. B H Miniratna-I
67 BHARAT HEAVY PLATE & VESSELS LTD. B S Others
68 BHARAT PUMPS & COMPRESSORS LTD. B H Miniratna-II
69 BRAHAMPUTRA CRACKERS & POLYMER LTD. B S Others
70 BRAHMAPUTRA VALLEY FERTILIZER CORPN. LTD. B H Others
71 BRAITHWAITE & CO. LTD. B H Others
72 BRIDGE & ROOF CO.(INDIA) LTD. B H Miniratna-I
73 BRITISH INDIA CORPORATION LTD. B H Others
74 BURN STANDARD COMPANY LTD. B H Others
75 CEMENT CORPN. OF INDIA LTD. B H Others
76 CENTRAL COALFIELDS LTD. B S Miniratna-I
77 CENTRAL ELECTRONICS LTD. B H Others
78 CENTRAL MINE PLANNING & DESIGN INSTITUTE LTD. B S Miniratna-II
79 CHENNAI PETROLEUM CORPORATION LTD. B S Miniratna-I
80 COCHIN SHIPYARD LTD. B H Miniratna-I
81 COTTON CORPN. OF INDIA LTD. B H Others
82 DREDGING CORPN. OF INDIA LTD. B H Miniratna-I
83 EASTERN COALFIELDS LTD. B S Others
Sl. Name of the CPSEs Schedule Honding/ CategoryNo. Subsidiary
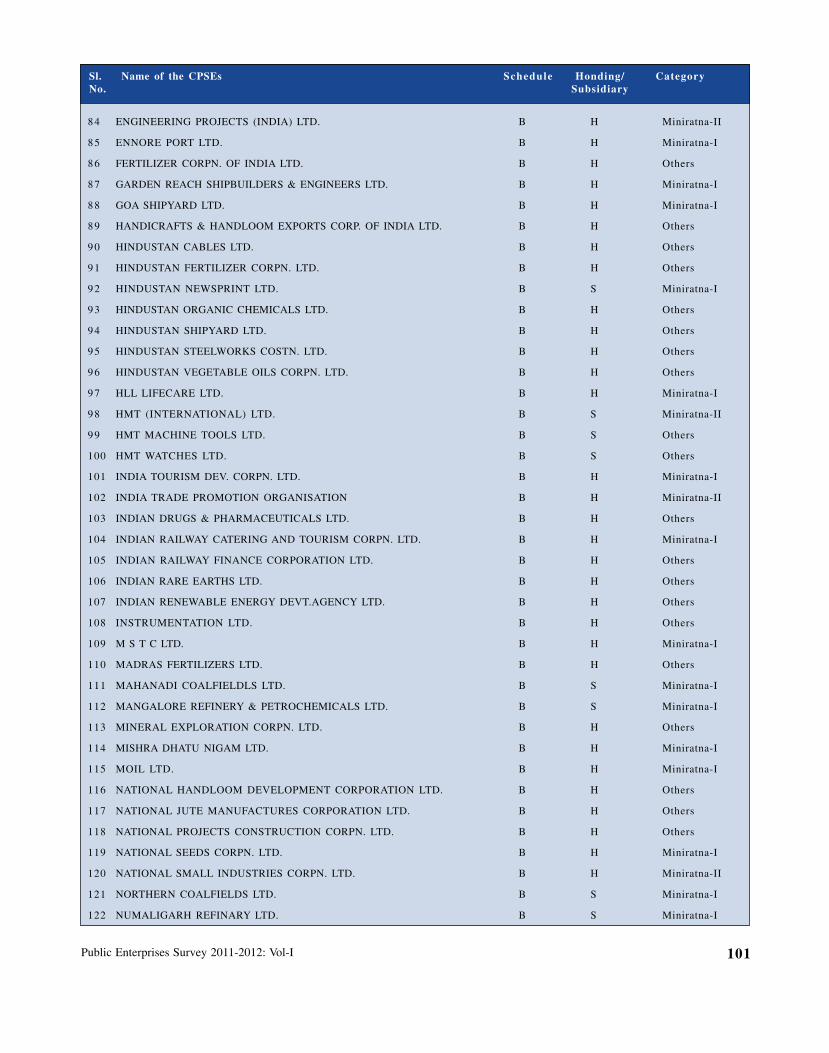
Public Enterprises Survey 2011-2012: Vol-I 101
Sl. Name of the CPSEs Schedule Honding/ CategoryNo. Subsidiary
84 ENGINEERING PROJECTS (INDIA) LTD. B H Miniratna-II
85 ENNORE PORT LTD. B H Miniratna-I
86 FERTILIZER CORPN. OF INDIA LTD. B H Others
87 GARDEN REACH SHIPBUILDERS & ENGINEERS LTD. B H Miniratna-I
88 GOA SHIPYARD LTD. B H Miniratna-I
89 HANDICRAFTS & HANDLOOM EXPORTS CORP. OF INDIA LTD. B H Others
90 HINDUSTAN CABLES LTD. B H Others
91 HINDUSTAN FERTILIZER CORPN. LTD. B H Others
92 HINDUSTAN NEWSPRINT LTD. B S Miniratna-I
93 HINDUSTAN ORGANIC CHEMICALS LTD. B H Others
94 HINDUSTAN SHIPYARD LTD. B H Others
95 HINDUSTAN STEELWORKS COSTN. LTD. B H Others
96 HINDUSTAN VEGETABLE OILS CORPN. LTD. B H Others
97 HLL LIFECARE LTD. B H Miniratna-I
98 HMT (INTERNATIONAL) LTD. B S Miniratna-II
99 HMT MACHINE TOOLS LTD. B S Others
100 HMT WATCHES LTD. B S Others
101 INDIA TOURISM DEV. CORPN. LTD. B H Miniratna-I
102 INDIA TRADE PROMOTION ORGANISATION B H Miniratna-II
103 INDIAN DRUGS & PHARMACEUTICALS LTD. B H Others
104 INDIAN RAILWAY CATERING AND TOURISM CORPN. LTD. B H Miniratna-I
105 INDIAN RAILWAY FINANCE CORPORATION LTD. B H Others
106 INDIAN RARE EARTHS LTD. B H Others
107 INDIAN RENEWABLE ENERGY DEVT.AGENCY LTD. B H Others
108 INSTRUMENTATION LTD. B H Others
109 M S T C LTD. B H Miniratna-I
110 MADRAS FERTILIZERS LTD. B H Others
111 MAHANADI COALFIELDLS LTD. B S Miniratna-I
112 MANGALORE REFINERY & PETROCHEMICALS LTD. B S Miniratna-I
113 MINERAL EXPLORATION CORPN. LTD. B H Others
114 MISHRA DHATU NIGAM LTD. B H Miniratna-I
115 MOIL LTD. B H Miniratna-I
116 NATIONAL HANDLOOM DEVELOPMENT CORPORATION LTD. B H Others
117 NATIONAL JUTE MANUFACTURES CORPORATION LTD. B H Others
118 NATIONAL PROJECTS CONSTRUCTION CORPN. LTD. B H Others
119 NATIONAL SEEDS CORPN. LTD. B H Miniratna-I
120 NATIONAL SMALL INDUSTRIES CORPN. LTD. B H Miniratna-II
121 NORTHERN COALFIELDS LTD. B S Miniratna-I
122 NUMALIGARH REFINARY LTD. B S Miniratna-I
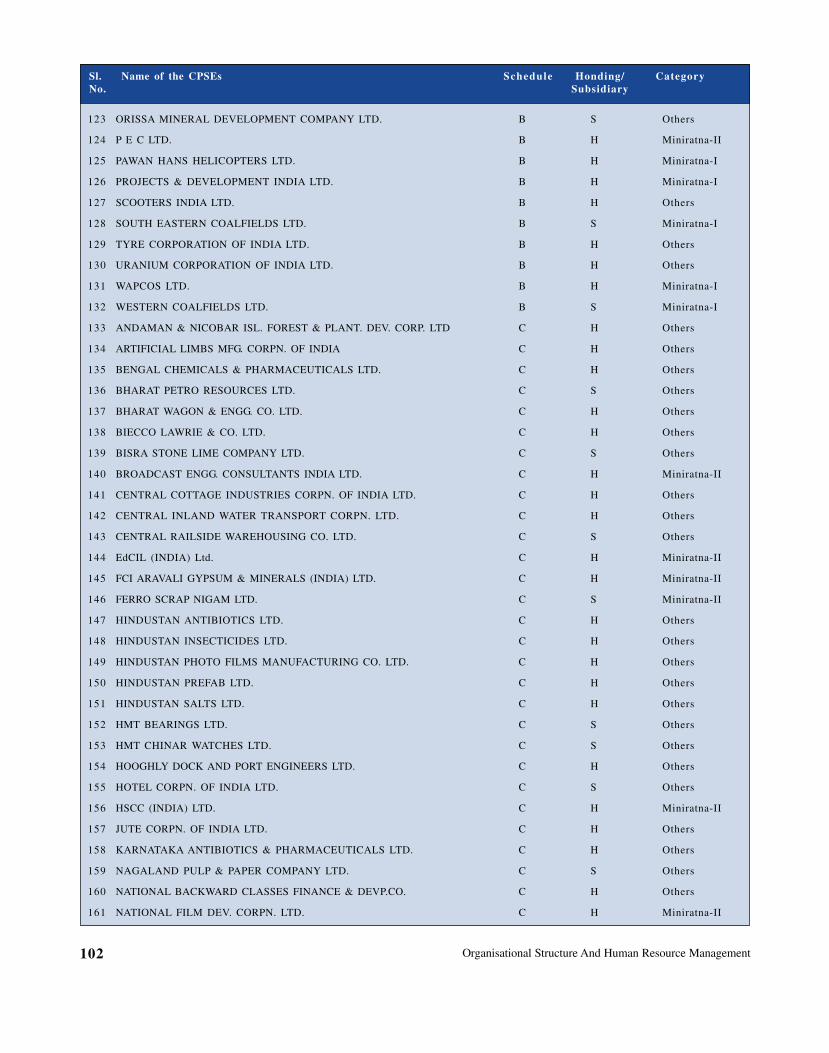
Organisational Structure And Human Resource Management102
Sl. Name of the CPSEs Schedule Honding/ CategoryNo. Subsidiary
123 ORISSA MINERAL DEVELOPMENT COMPANY LTD. B S Others
124 P E C LTD. B H Miniratna-II
125 PAWAN HANS HELICOPTERS LTD. B H Miniratna-I
126 PROJECTS & DEVELOPMENT INDIA LTD. B H Miniratna-I
127 SCOOTERS INDIA LTD. B H Others
128 SOUTH EASTERN COALFIELDS LTD. B S Miniratna-I
129 TYRE CORPORATION OF INDIA LTD. B H Others
130 URANIUM CORPORATION OF INDIA LTD. B H Others
131 WAPCOS LTD. B H Miniratna-I
132 WESTERN COALFIELDS LTD. B S Miniratna-I
133 ANDAMAN & NICOBAR ISL. FOREST & PLANT. DEV. CORP. LTD C H Others
134 ARTIFICIAL LIMBS MFG. CORPN. OF INDIA C H Others
135 BENGAL CHEMICALS & PHARMACEUTICALS LTD. C H Others
136 BHARAT PETRO RESOURCES LTD. C S Others
137 BHARAT WAGON & ENGG. CO. LTD. C H Others
138 BIECCO LAWRIE & CO. LTD. C H Others
139 BISRA STONE LIME COMPANY LTD. C S Others
140 BROADCAST ENGG. CONSULTANTS INDIA LTD. C H Miniratna-II
141 CENTRAL COTTAGE INDUSTRIES CORPN. OF INDIA LTD. C H Others
142 CENTRAL INLAND WATER TRANSPORT CORPN. LTD. C H Others
143 CENTRAL RAILSIDE WAREHOUSING CO. LTD. C S Others
144 EdCIL (INDIA) Ltd. C H Miniratna-II
145 FCI ARAVALI GYPSUM & MINERALS (INDIA) LTD. C H Miniratna-II
146 FERRO SCRAP NIGAM LTD. C S Miniratna-II
147 HINDUSTAN ANTIBIOTICS LTD. C H Others
148 HINDUSTAN INSECTICIDES LTD. C H Others
149 HINDUSTAN PHOTO FILMS MANUFACTURING CO. LTD. C H Others
150 HINDUSTAN PREFAB LTD. C H Others
151 HINDUSTAN SALTS LTD. C H Others
152 HMT BEARINGS LTD. C S Others
153 HMT CHINAR WATCHES LTD. C S Others
154 HOOGHLY DOCK AND PORT ENGINEERS LTD. C H Others
155 HOTEL CORPN. OF INDIA LTD. C S Others
156 HSCC (INDIA) LTD. C H Miniratna-II
157 JUTE CORPN. OF INDIA LTD. C H Others
158 KARNATAKA ANTIBIOTICS & PHARMACEUTICALS LTD. C H Others
159 NAGALAND PULP & PAPER COMPANY LTD. C S Others
160 NATIONAL BACKWARD CLASSES FINANCE & DEVP.CO. C H Others
161 NATIONAL FILM DEV. CORPN. LTD. C H Miniratna-II
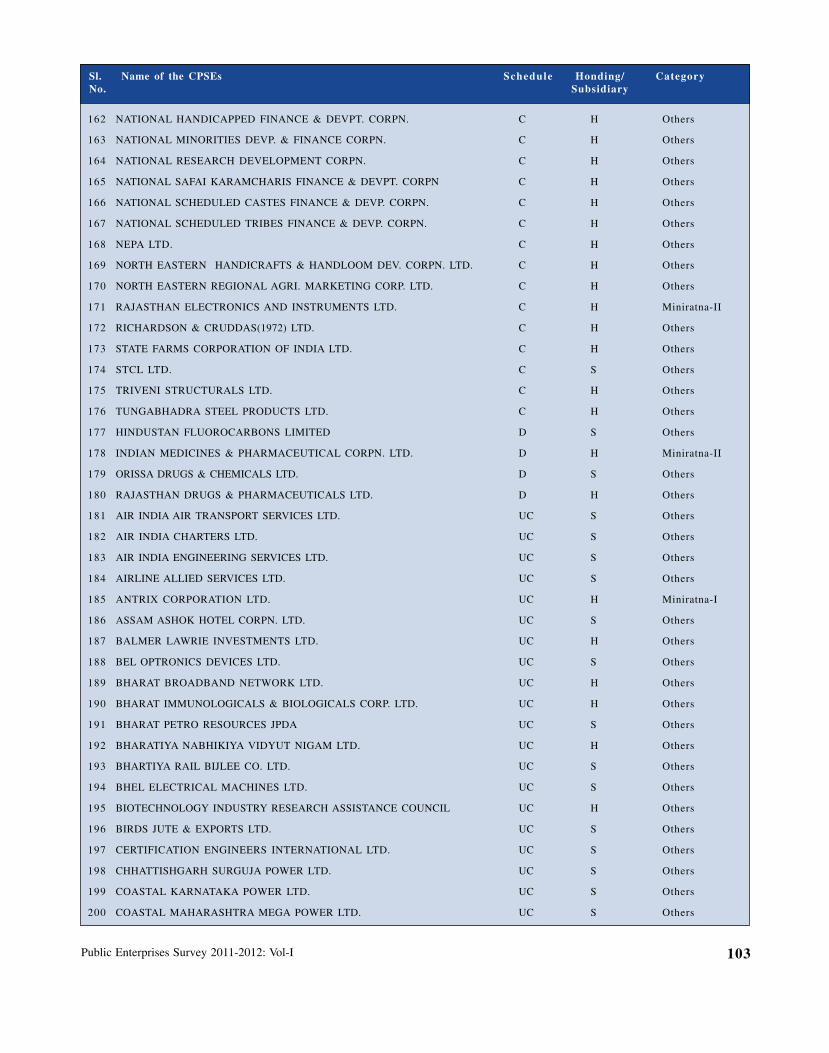
Public Enterprises Survey 2011-2012: Vol-I 103
Sl. Name of the CPSEs Schedule Honding/ CategoryNo. Subsidiary
162 NATIONAL HANDICAPPED FINANCE & DEVPT. CORPN. C H Others
163 NATIONAL MINORITIES DEVP. & FINANCE CORPN. C H Others
164 NATIONAL RESEARCH DEVELOPMENT CORPN. C H Others
165 NATIONAL SAFAI KARAMCHARIS FINANCE & DEVPT. CORPN C H Others
166 NATIONAL SCHEDULED CASTES FINANCE & DEVP. CORPN. C H Others
167 NATIONAL SCHEDULED TRIBES FINANCE & DEVP. CORPN. C H Others
168 NEPA LTD. C H Others
169 NORTH EASTERN HANDICRAFTS & HANDLOOM DEV. CORPN. LTD. C H Others
170 NORTH EASTERN REGIONAL AGRI. MARKETING CORP. LTD. C H Others
171 RAJASTHAN ELECTRONICS AND INSTRUMENTS LTD. C H Miniratna-II
172 RICHARDSON & CRUDDAS(1972) LTD. C H Others
173 STATE FARMS CORPORATION OF INDIA LTD. C H Others
174 STCL LTD. C S Others
175 TRIVENI STRUCTURALS LTD. C H Others
176 TUNGABHADRA STEEL PRODUCTS LTD. C H Others
177 HINDUSTAN FLUOROCARBONS LIMITED D S Others
178 INDIAN MEDICINES & PHARMACEUTICAL CORPN. LTD. D H Miniratna-II
179 ORISSA DRUGS & CHEMICALS LTD. D S Others
180 RAJASTHAN DRUGS & PHARMACEUTICALS LTD. D H Others
181 AIR INDIA AIR TRANSPORT SERVICES LTD. UC S Others
182 AIR INDIA CHARTERS LTD. UC S Others
183 AIR INDIA ENGINEERING SERVICES LTD. UC S Others
184 AIRLINE ALLIED SERVICES LTD. UC S Others
185 ANTRIX CORPORATION LTD. UC H Miniratna-I
186 ASSAM ASHOK HOTEL CORPN. LTD. UC S Others
187 BALMER LAWRIE INVESTMENTS LTD. UC H Others
188 BEL OPTRONICS DEVICES LTD. UC S Others
189 BHARAT BROADBAND NETWORK LTD. UC H Others
190 BHARAT IMMUNOLOGICALS & BIOLOGICALS CORP. LTD. UC H Others
191 BHARAT PETRO RESOURCES JPDA UC S Others
192 BHARATIYA NABHIKIYA VIDYUT NIGAM LTD. UC H Others
193 BHARTIYA RAIL BIJLEE CO. LTD. UC S Others
194 BHEL ELECTRICAL MACHINES LTD. UC S Others
195 BIOTECHNOLOGY INDUSTRY RESEARCH ASSISTANCE COUNCIL UC H Others
196 BIRDS JUTE & EXPORTS LTD. UC S Others
197 CERTIFICATION ENGINEERS INTERNATIONAL LTD. UC S Others
198 CHHATTISHGARH SURGUJA POWER LTD. UC S Others
199 COASTAL KARNATAKA POWER LTD. UC S Others
200 COASTAL MAHARASHTRA MEGA POWER LTD. UC S Others
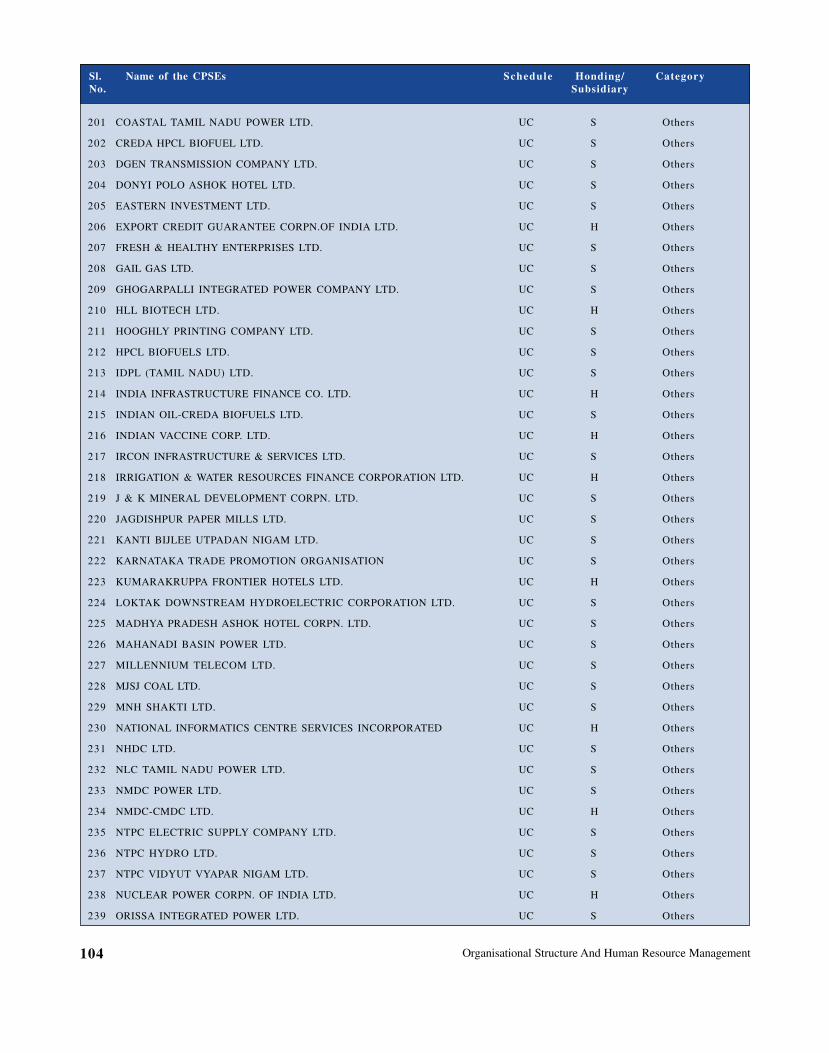
Organisational Structure And Human Resource Management104
Sl. Name of the CPSEs Schedule Honding/ CategoryNo. Subsidiary
201 COASTAL TAMIL NADU POWER LTD. UC S Others
202 CREDA HPCL BIOFUEL LTD. UC S Others
203 DGEN TRANSMISSION COMPANY LTD. UC S Others
204 DONYI POLO ASHOK HOTEL LTD. UC S Others
205 EASTERN INVESTMENT LTD. UC S Others
206 EXPORT CREDIT GUARANTEE CORPN.OF INDIA LTD. UC H Others
207 FRESH & HEALTHY ENTERPRISES LTD. UC S Others
208 GAIL GAS LTD. UC S Others
209 GHOGARPALLI INTEGRATED POWER COMPANY LTD. UC S Others
210 HLL BIOTECH LTD. UC H Others
211 HOOGHLY PRINTING COMPANY LTD. UC S Others
212 HPCL BIOFUELS LTD. UC S Others
213 IDPL (TAMIL NADU) LTD. UC S Others
214 INDIA INFRASTRUCTURE FINANCE CO. LTD. UC H Others
215 INDIAN OIL-CREDA BIOFUELS LTD. UC S Others
216 INDIAN VACCINE CORP. LTD. UC H Others
217 IRCON INFRASTRUCTURE & SERVICES LTD. UC S Others
218 IRRIGATION & WATER RESOURCES FINANCE CORPORATION LTD. UC H Others
219 J & K MINERAL DEVELOPMENT CORPN. LTD. UC S Others
220 JAGDISHPUR PAPER MILLS LTD. UC S Others
221 KANTI BIJLEE UTPADAN NIGAM LTD. UC S Others
222 KARNATAKA TRADE PROMOTION ORGANISATION UC S Others
223 KUMARAKRUPPA FRONTIER HOTELS LTD. UC H Others
224 LOKTAK DOWNSTREAM HYDROELECTRIC CORPORATION LTD. UC S Others
225 MADHYA PRADESH ASHOK HOTEL CORPN. LTD. UC S Others
226 MAHANADI BASIN POWER LTD. UC S Others
227 MILLENNIUM TELECOM LTD. UC S Others
228 MJSJ COAL LTD. UC S Others
229 MNH SHAKTI LTD. UC S Others
230 NATIONAL INFORMATICS CENTRE SERVICES INCORPORATED UC H Others
231 NHDC LTD. UC S Others
232 NLC TAMIL NADU POWER LTD. UC S Others
233 NMDC POWER LTD. UC S Others
234 NMDC-CMDC LTD. UC H Others
235 NTPC ELECTRIC SUPPLY COMPANY LTD. UC S Others
236 NTPC HYDRO LTD. UC S Others
237 NTPC VIDYUT VYAPAR NIGAM LTD. UC S Others
238 NUCLEAR POWER CORPN. OF INDIA LTD. UC H Others
239 ORISSA INTEGRATED POWER LTD. UC S Others
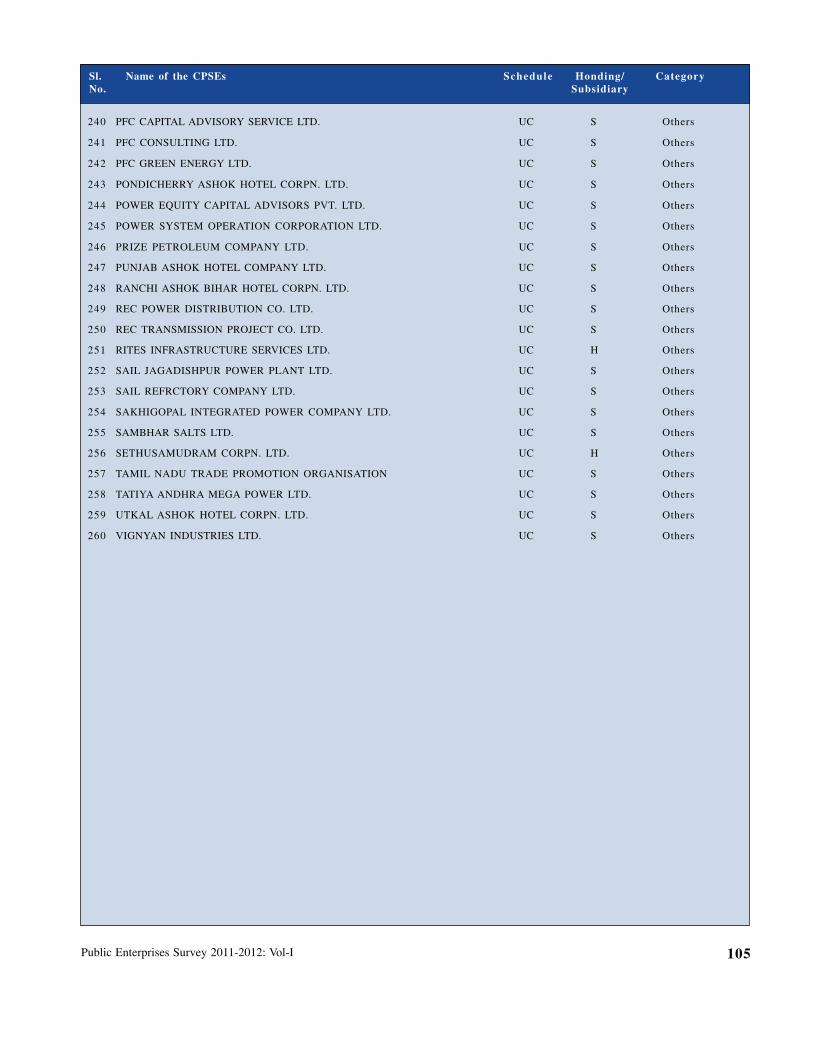
Public Enterprises Survey 2011-2012: Vol-I 105
240 PFC CAPITAL ADVISORY SERVICE LTD. UC S Others
241 PFC CONSULTING LTD. UC S Others
242 PFC GREEN ENERGY LTD. UC S Others
243 PONDICHERRY ASHOK HOTEL CORPN. LTD. UC S Others
244 POWER EQUITY CAPITAL ADVISORS PVT. LTD. UC S Others
245 POWER SYSTEM OPERATION CORPORATION LTD. UC S Others
246 PRIZE PETROLEUM COMPANY LTD. UC S Others
247 PUNJAB ASHOK HOTEL COMPANY LTD. UC S Others
248 RANCHI ASHOK BIHAR HOTEL CORPN. LTD. UC S Others
249 REC POWER DISTRIBUTION CO. LTD. UC S Others
250 REC TRANSMISSION PROJECT CO. LTD. UC S Others
251 RITES INFRASTRUCTURE SERVICES LTD. UC H Others
252 SAIL JAGADISHPUR POWER PLANT LTD. UC S Others
253 SAIL REFRCTORY COMPANY LTD. UC S Others
254 SAKHIGOPAL INTEGRATED POWER COMPANY LTD. UC S Others
255 SAMBHAR SALTS LTD. UC S Others
256 SETHUSAMUDRAM CORPN. LTD. UC H Others
257 TAMIL NADU TRADE PROMOTION ORGANISATION UC S Others
258 TATIYA ANDHRA MEGA POWER LTD. UC S Others
259 UTKAL ASHOK HOTEL CORPN. LTD. UC S Others
260 VIGNYAN INDUSTRIES LTD. UC S Others
Sl. Name of the CPSEs Schedule Honding/ CategoryNo. Subsidiary
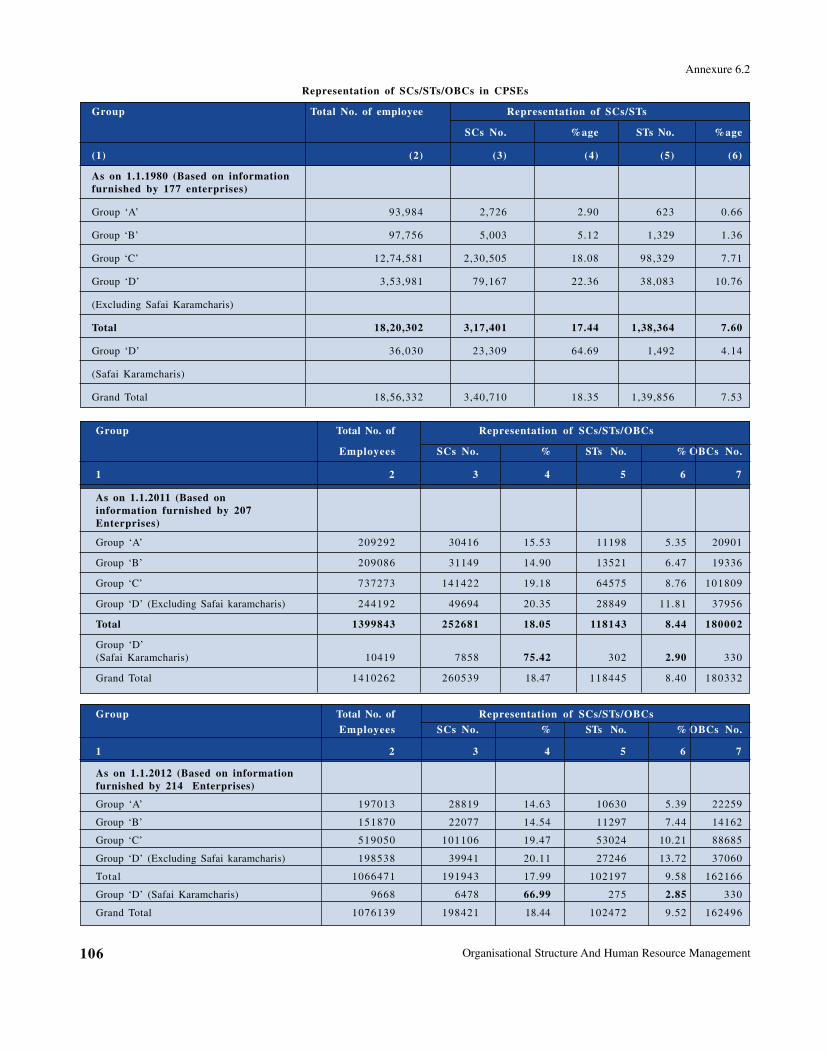
Organisational Structure And Human Resource Management106
Annexure 6.2
Representation of SCs/STs/OBCs in CPSEs
Group Total No. of employee Representation of SCs/STs
SCs No. %age STs No. %age
(1) (2) (3) (4) (5) (6)
As on 1.1.1980 (Based on informationfurnished by 177 enterprises)
Group ‘A’ 93,984 2,726 2.90 623 0.66
Group ‘B’ 97,756 5,003 5.12 1,329 1.36
Group ‘C’ 12,74,581 2,30,505 18.08 98,329 7.71
Group ‘D’ 3,53,981 79,167 22.36 38,083 10.76
(Excluding Safai Karamcharis)
Total 18,20,302 3,17,401 17.44 1,38,364 7.60
Group ‘D’ 36,030 23,309 64.69 1,492 4.14
(Safai Karamcharis)
Grand Total 18,56,332 3,40,710 18.35 1,39,856 7.53
Group Total No. of Representation of SCs/STs/OBCs
Employees SCs No. % STs No. % OBCs No.
1 2 3 4 5 6 7
As on 1.1.2011 (Based oninformation furnished by 207Enterprises)
Group ‘A’ 209292 30416 15.53 11198 5.35 20901
Group ‘B’ 209086 31149 14.90 13521 6.47 19336
Group ‘C’ 737273 141422 19.18 64575 8.76 101809
Group ‘D’ (Excluding Safai karamcharis) 244192 49694 20.35 28849 11.81 37956
Total 1399843 252681 18.05 118143 8.44 180002
Group ‘D’(Safai Karamcharis) 10419 7858 75.42 302 2.90 330
Grand Total 1410262 260539 18.47 118445 8.40 180332
Group Total No. of Representation of SCs/STs/OBCs
Employees SCs No. % STs No. % OBCs No.
1 2 3 4 5 6 7
As on 1.1.2012 (Based on informationfurnished by 214 Enterprises)
Group ‘A’ 197013 28819 14.63 10630 5.39 22259
Group ‘B’ 151870 22077 14.54 11297 7.44 14162
Group ‘C’ 519050 101106 19.47 53024 10.21 88685
Group ‘D’ (Excluding Safai karamcharis) 198538 39941 20.11 27246 13.72 37060
Total 1066471 191943 17.99 102197 9.58 162166
Group ‘D’ (Safai Karamcharis) 9668 6478 66.99 275 2.85 330
Grand Total 1076139 198421 18.44 102472 9.52 162496
Public Enterprises Survey 2011-2012: Vol-I 107
Delegation of Enhanced Financial Powers to CPSEs
Chapter-7
The Board of Directors of a CPSE exercises the delegatedpowers subject to broad policy guidelines issued by Governmentfrom time to time. The Government has granted enhanced powersto the Boards of Maharatna, Navratna, Miniratna and other profitmaking enterprises.
Keeping in view the pledge made in the then NationalCommon Minimum Programme (NCMP) that full managerial andcommercial autonomy will be devolved to successful profit makingcompanies operating in a competitive environment, theGovernment reviewed the powers delegated to the Board ofDirectors of Navratna, Miniratna and other profit making CPSEsand substantially enhanced the delegated powers in August 2005.
7.1 Maharatna Scheme
2.1.1 The Government has introduced Maharatna scheme inFebruary, 2010 with the objective to delegate enhanced powersto the Boards of identified large sized Navratna CPSEs so as tofacilitate expansion of their operations, both in domestic as wellas global markets.
7.1.1 Eligibility criteria for grant of Maharatna status
The CPSEs fulfilling the following criteria are eligible to beconsidered for grant of Maharatna status:-
(a) Having Navratna status
(b) Listed on Indian stock exchange, with minimumprescribed public shareholding under SEBI regulations
(c) An average annual turnover during the last 3 years ofmore than ` 25,000 crore
(d) An average annual net worth during the last 3 years ofmore than `15,000 crore
(e) An average annual net profit after tax during the last 3years of more than ` 5,000 crore
(f) Significant global presence or international operations.
7.1.2 Delegation of powers to Maharatna CPSEs
The Maharatna CPSEs in addition to having Navratna powershave been delegated additional powers in the area of investmentin joint ventures/subsidiaries and human resources development.The Maharatna CPSEs can invest ` 5000 crore in one project(` 1,000 crore for Navartna CPSEs) and create below Board levelposts upto E-9 level (E-6 for Navratna CPSEs).
7.1.3 Maharatna CPSEs
The Government has conferred Mahratna status to 5 CPSEsnamely, (i) Indian Oil Corporation Limited, (ii) NTPC Limited,
(iii) Oil & Natural Gas Corporation Limited and (iv) SteelAuthority of India Limited in May, 2010 and (v) Coal India Limitedin April, 2011.
7.2 Navratna scheme
7.2.1 The Government introduced the Navratna scheme inJuly, 1997 to identify and delegate enhanced powers to CPSEshaving comparative advantage and the potential to become globalplayers.
7.2.2 Eligibility Criteria for Grant of NavaratnaScheme
As per the criteria laid down by the Government, MiniratnaCategory – 1 and Schedule ‘A’ CPSEs, which have obtained‘excellent’ or ‘very good’ rating under the Memorandum ofUnderstanding system in three of the last five years, and have acomposite score of 60 or above in the six selected performanceparameters are eligible to be considered for grant of Navratnastatus.
7.2.3 Delegation of Powers to Navratna CPSEs
The powers delegated to the Boards of Navratna CPSEs areas under: -
(i) Capital Expenditure :- The Navratna CPSEs have thepowers to incur capital expenditure on purchase of newitems or for replacement, without any monetary ceiling.
(ii) Technology Joint Ventures and Strategic Alliances:-The Navratna CPSEs have the powers to enter intotechnology joint ventures or strategic alliances and obtain,by purchase or other arrangements, technology andknow-how.
(iii) Organization Restructuring:- The Navratna CPSEshave the powers to effect organizational restructuringincluding establishment of profit centers, opening ofoffices in India and abroad, creating new activity centers,etc.
(iv) Human Resources Management:- The NavratnaCPSEs have been empowered to create and wind up allposts up to E-6 level and make all appointments up tothis level. The Boards of these CPSEs have further beenempowered to effect internal transfers and re-designationof posts. The Board of Directors of Navratna CPSEs havethe power to further delegate the powers relating toHuman Resource Management (appointments, transfer,posting, etc.) of below Board level executives to sub-committees of the Board or to executives of the CPSE,as may be decided by the Board of the CPSE.
Delegation of Enhanced Financial Powers to Cpses108
(v) Resource Mobilization: - These CPSEs have beenempowered to raise debt from the domestic capitalmarkets and for borrowings from international market,subject to condition that approval of RBI/Departmentof Economic Affairs, as may be required, should beobtained through the administrative Ministry.
(vi) Joint ventures and Subsidiaries :- The NavratnaCPSEs have been delegated powers to establish financialjoint ventures and wholly owned subsidiaries in India orabroad with the stipulation that the equity investmentof the CPSE should be limited to the following: -
i. Rs. 1000 crore in any one project,
ii. 15% of the net worth of the CPSE in one project,
iii. 30% of the net worth of the CPSE in all jointventures/ subsidiaries put together.
(vii) Mergers and acquisitions:- The Navratna CPSEs havebeen delegated powers for mergers and acquisitions subjectto the conditions that (i) it should be as per the growthplan and in the core area of functioning of the CPSE, (ii)conditions/limits would be as in the case of establishingjoint ventures/subsidiaries, and (iii) the CabinetCommittee on Economic Affairs would be kept informedin case of investments abroad. Further, the powers relatingto Mergers and Acquisitions are to be exercised in such amanner that it should not lead to any change in the publicsector character of the concerned CPSEs.
(viii) Creation/Disinvestment in subsidiaries:- TheNavratna CPSEs have powers to transfer assets, floatfresh equity and divest shareholding in subsidiariessubject to the condition that the delegation will be inrespect of subsidiaries set up by the holding companyunder the powers delegated to the Navratna CPSEs andfurther to the proviso that the public sector character ofthe concerned CPSE (including subsidiary) would not bechanged without prior approval of the Government andsuch Navratna CPSEs will be required to seekGovernment approval before exiting from theirsubsidiaries.
(ix) Tours abroad of functional Directors: - The ChiefExecutive of Navratna CPSEs have been delegated powersto approve business tours abroad of functional directorsup to 5 days’ duration (other than study tours, seminars,etc.) in emergency under intimation to the Secretary ofthe administrative Ministry.
The above mentioned delegation of powers is subject to thefollowing conditions and guidelines:-
(a) The proposals must be presented to the Board ofDirectors in writing and reasonably well in advance, withan analysis of relevant factors and quantification of theanticipated results and benefits. Risk factors if any, mustbe clearly brought out.
(b) The Government Directors, the Financial Directors andthe concerned Functional Director(s) must be presentwhen major decisions are taken, especially when theypertain to investments, expenditure or organizational/capital restructuring.
(c) The decisions on such proposals should, preferably, beunanimous.
(d) In the event of any decision on important matters notbeing unanimous, a majority decision may be taken, butat least two thirds of the Directors should be present,including those mentioned in (b) above, when such adecision is taken. The objections, dissents, the reasonsfor over-ruling them and those for taking the decisionshould be recorded in writing and minuted.
(e) No financial support or contingent liability on the partof the Government should be involved.
(f) These CPSEs will establish transparent and effectivesystems of internal monitoring, including theestablishment of an Audit Committee of the Board withmembership of non-official Directors.
(g) All the proposals, where they pertain to capitalexpenditure, investment or other matters involvingsubstantial financial or managerial commitments or wherethey would have a long term impact on the structure andfunctioning of the CPSE, should be prepared by or withthe assistance of professionals and experts and shouldbe appraised, in suitable cases, by financial institutionsor reputed professional organizations with expertise inthe areas. The financial appraisal should also preferablybe backed by an involvement of the appraisinginstitutions through loans or equity participation.
(h) The exercise of authority to enter into technology jointventures and strategic alliances shall be in accordance withthe Government guidelines as may be issued from timeto time.
(i) The Boards of these CPSEs should be restructured byinducting at least four non-official Directors as the firststep before the exercise of the enhanced delegation ofauthority.
(j) These public sector enterprises shall not depend uponbudgetary support or Government guarantees. Theresources for implementing their programmes shouldcome from their internal or through other sources,including the capital markets. However, whereverGovernment guarantee is required under the standardstipulations of external donor agencies, the same may beobtained from the Ministry of Finance through theadministrative Ministry. Such Government guaranteeshall not affect the Navratna status. Further, budgetarysupport to implement Government sponsored projectsof national interest and Government sponsored Research& Development projects will not disqualify CPSEs fromretaining their Navratna status. However, for suchprojects, investment decisions will be taken by theGovernment and not by the CPSE concerned
7.2.4 Presently, there are 16 Navratna CPSEs as under:
(i) Bharat Electronics Limited
(ii) Bharat Heavy Electricals Limited
Public Enterprises Survey 2011-2012: Vol-I 109
(iii) Bharat Petroleum Corporation Limited
(iv) GAIL (India) Limited
(v) Hindustan Aeronautics Limited
(vi) Hindustan Petroleum Corporation Limited
(vii) Mahanagar Telephone Nigam Limited
(viii) National Aluminium Company Limited
(ix) Neyveli Lignite Corporation Limited
(x) NMDC Limited
(xi) Oil India Limited
(xii) Power Finance Corporation Limited
(xiii) Power Grid Corporation of India Limited
(xiv) Rashtriya Ispat Nigam Limited
(xv) Rural Electrification Corporation Limited
(xvi) Shipping Corporation of India Limited
7.3 Miniratna scheme
In October 1997, the Government, in order to make promisingprofit making CPSEs more efficient and competitive, decided to grantenhanced autonomy and delegation of financial powers subject tocertain eligibility conditions and guidelines to make them efficient andcompetitive. These companies, called Miniratnas, are in twocategories, namely, Category- I and Category-II.
7.3.1 Eligibility Criteria for Miniratna Status
The eligibility conditions and criteria are:
(i) Category-I CPSEs should have made profit in the lastthree years continuously, the pre-tax profit should havebeen ` 30 crores or more in at least one of the three yearsand should have a positive net worth.
(ii) Category-II CPSEs should have made profit for the lastthree years continuously and should have a positive networth.
(iii) These CPSEs shall be eligible for enhanced delegatedpowers provided they have not defaulted in the repaymentof loans/interest on any loans due to the Government.
(iv) These public sector enterprises shall not depend uponbudgetary support or Government guarantees.
(v) The Boards of these CPSEs should be restructured byinducting at least three non-official Directors as the firststep before the exercise of enhanced delegation of authority.
(vi) The administrative Ministry concerned shall decidewhether a Public Sector Enterprise fulfilled therequirements of a Category-I/Category-II company beforethe exercise of enhanced powers.
7.3.2 Delegation of Powers to Miniratna CPSEs:
The delegation of decision-making authority available atpresent to the Boards of these Miniratna CPSEs is as follows:
(i) Capital Expenditure
(a) For CPSEs in category I: The power to incur capitalexpenditure on new projects, modernization, purchase of
equipment, etc., without Government approval upto` 500 crore or equal to net worth, whichever is less.
(b) For CPSEs in category II: The power to incur capitalexpenditure on new projects, modernization, purchase ofequipment, etc., without Government approval upto` 250 crore or equal to 50% of the Net worth, whicheveris less.
(ii) Joint ventures and subsidiaries:
(a) Category I CPSEs: To establish joint ventures andsubsidiaries in India with the stipulation that the equityinvestment of the CPSE in any one project should belimited to 15% of the networth of the CPSE or ` 500crore, whichever is less. The overall ceiling on suchinvestment in all projects put together is 30% of thenetworth of the CPSE.
(b) Category II CPSEs: To establish joint ventures andsubsidiaries in India with the stipulation that the equityinvestment of the CPSE in any one project should be 15%of the networth of the CPSE or ` 250 crore, whichever isless. The overall ceiling on such investment in all projectsput together is 30% of the networth of the CPSE.
(iii) Mergers and acquisitions :- The Board of Directors ofthese CPSEs have the powers for mergers andacquisitions, subject to the conditions that (a) it shouldbe as per the growth plan and in the core area offunctioning of the CPSE, (b) conditions/limits would beas in the case of establishing joint ventures/subsidiaries,and (c) the Cabinet Committee on Economic Affairswould be kept informed in case of investments abroad.Further, the powers relating to Mergers and Acquisitionsare to be exercised in such a manner that it should notlead to any change in the public sector character of theconcerned CPSEs.
(iv) Scheme for HRD :- To structure and implement schemesrelating to personnel and human resource management,training, voluntary or compulsory retirement schemes,etc. The Board of Directors of these CPSEs have thepower to further delegate the powers relating to HumanResource Management (appointments, transfer, posting,etc.) of below Board level executives to sub-committeesof the Board or to executives of the CPSE, as may bedecided by the Board of the CPSE.
(v) Tour abroad of functional Directors: - The ChiefExecutive of these CPSEs have the power to approvebusiness tours abroad of functional directors up to 5 days’duration (other than study tours, seminars, etc.) inemergency, under intimation to the Secretary of theadministrative Ministry.
(vi) Technology Joint Ventures and Strategic Alliances:-To enter into technology joint ventures, strategic alliancesand to obtain technology and know-how by purchase orother arrangements, subject to Government guidelines asmay be issued from time to time.
(vii) Creation/Disinvestment in subsidiaries :- To transferassets, float fresh equity and divest shareholding insubsidiaries subject to the condition that the delegation willbe in respect of subsidiaries set up by the holding company
Delegation of Enhanced Financial Powers to Cpses110
under the powers delegated to the Miniratna CPSEs andfurther to the proviso that the public sector character ofthe concerned CPSE (including subsidiary) would not bechanged without prior approval of the Government, andsuch Miniratna CPSEs will be required to seek Governmentapproval before exiting from their subsidiaries.
The above delegation of powers is subject to similarconditions as are applicable to Navratna CPSEs
Presently (as on 15.11.2012), there are 68 Miniratna CPSEs(51 Category-I and 16 Category-II). The list of these 68 MiniratnaCPSEs is enclosed at Annex 1.
7.4 Other profit making CPSEs
Those CPSEs which have shown a profit in each of the 3preceding accounting years and have a positive net worth arecategorized as ‘other profit making CPSEs’.
7.4.1 Delegation of Powers
These CPSEs have been delegated enhanced powers as under:-
(i) Capital Expenditure:- These CPSEs have the power toincur capital expenditure up to ` 150 crore or equal to50% of the Net worth, whichever is less. The abovedelegation is subject to the following conditions:
(a) inclusion of the project in the approved Five Year andAnnual Plans and outlays provided for;
(b) the required funds can be found from the internal resourcesof the company and extra budgetary resources (EIBR) andthe expenditure is incurred on schemes included in thecapital budget approved by the Government.
(ii) Tours abroad of functional Directors :- The ChiefExecutive of these CPSEs have the power to approvebusiness tours abroad of functional directors up to 5 days’duration (other than study tours, seminars, etc.) inemergency, under intimation to the Secretary of theadministrative Ministry. In all other cases including thoseof Chief Executive, tours abroad would continue to requirethe prior approval of the Minister of the AdministrativeMinistry/ Department.
7.5 Policy on Acquisition of Raw MaterialOverseas by CPSEs
The availability of adequate quantities of raw materials is a pre-requisite for growth. There is also a strategic perspective as somecountries have already taken the lead in acquiring sources of rawmaterial assets globally. Overseas investments are currently undertakenby CPSEs either under powers delegated to their Boards or with theapproval of CCEA through the mechanism of Empowered Committeeof Secretaries (ECS). Shortcomings in the present system includedelays in decision making, lack of coordinated & inter-sectoralapproach and absence of government funding.
On the basis of recommendations of National ManufacturingCompetitiveness Council (NMCC), inter-ministerial consultationsand approval of the Cabinet, DPE has notified the Policy foracquisition of Raw Material assets abroad by CPSEs in October, 2011.
The broad features of this Policy are as following.
� Policy applicable to CPSEs in Agriculture, Mining,Manufacturing and Electricity sectors having a three yearrecord of making net profits.
� CPSEs to examine proposals, undertake due diligence andobtain approval of Board of Directors in a transparentmanner.
� Powers delegated to the Boards of Maharatna andNavratna enhanced and enhanced powers available onlyfor acquisition of raw material assets abroad.
� Coordinating Committee of Secretaries (CCoS) headed bythe Cabinet Secretary to be constituted. Proposals (i)where the administrative Ministry/CPSE requests for acoordinated view and (ii) involve Government funds tobe put up before the CCoS.
� CCoS to facilitate quick and coordinated decision making,coordinate grant of concessional credit to foreignenterprise/Government, recommend Government fundingand decide about the nature of the Government fundingon case to case basis.
� The CCoS to be serviced by the DPE and separate cellto be created in DPE. DPE authorized to hire additionalpersonnel, accommodation and procure equipmentsnecessary for making this cell operational. Additionalannual budgetary outlay of ` 1.5 crore per annum to beprovided to DPE.
� CPSE/Ministry to submit proposal to the DPE whichwill convene a meeting of the CCoS. CPSE/Ministry tonominate a nodal officer.
� Recommendations of CCoS to be placed before CCEAby the DPE.
� Existing Empowered Committee of Secretaries (ECS)mechanisms shall continue to function. Ministriespresently not having ECS proposed to be authorized tohave appropriate ECS mechanism.
� The Ministry of External Affairs and its Missions abroadto be associated right from the beginning of the process.
� The Government to, in due course, consider constitutinga dedicated, Sovereign Wealth Fund.
The following actions have been taken by DPE in thisregard.
(i) Circulation of the approved policy to all stakeholders.
(ii) Issuance of guidelines prescribed by Ministry of ExternalAffairs (MEA) and its advisory to its Missions abroadafter consultations with MEA.
(iii) Constitution of Coordinating Committee of Secretariesafter approval of Cabinet Secretariat.
(iv) Allocation of financial resources for running the separateCell.
(v) Initiating the process of recruitment of manpower forseparate cell and release of advertisement in newspapersinviting applications and holding of selection interviews.
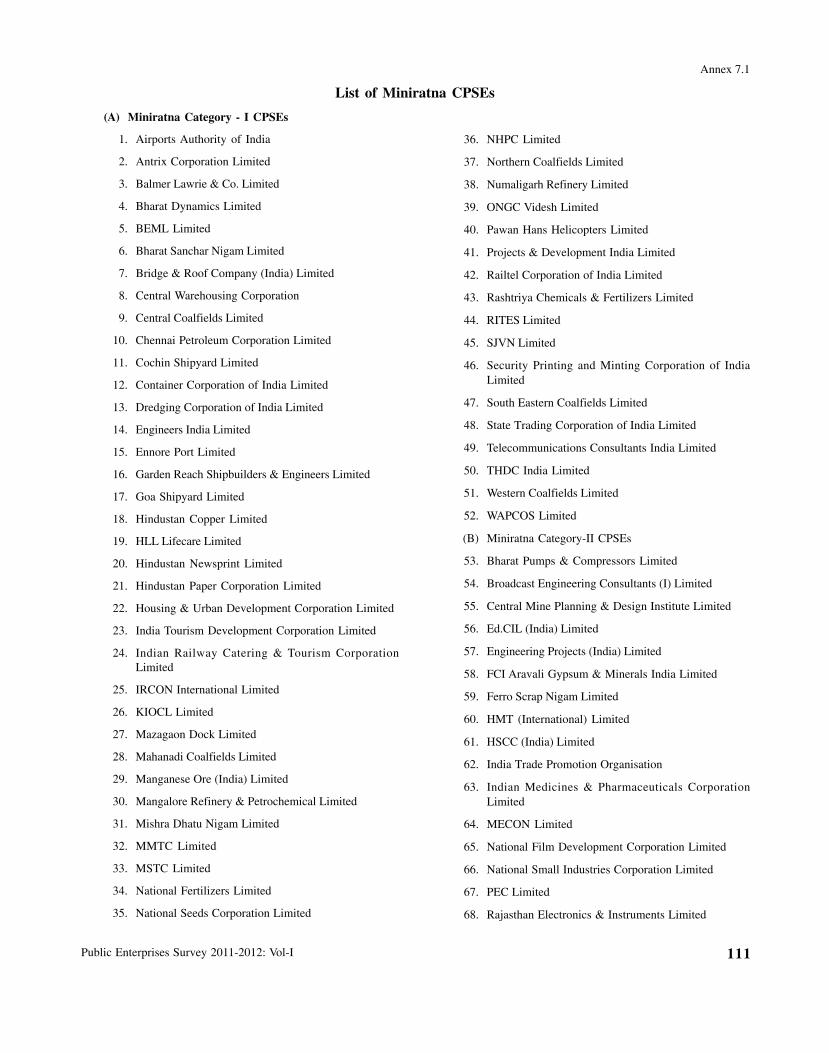
Public Enterprises Survey 2011-2012: Vol-I 111
Annex 7.1
List of Miniratna CPSEs
(A) Miniratna Category - I CPSEs
36. NHPC Limited
37. Northern Coalfields Limited
38. Numaligarh Refinery Limited
39. ONGC Videsh Limited
40. Pawan Hans Helicopters Limited
41. Projects & Development India Limited
42. Railtel Corporation of India Limited
43. Rashtriya Chemicals & Fertilizers Limited
44. RITES Limited
45. SJVN Limited
46. Security Printing and Minting Corporation of IndiaLimited
47. South Eastern Coalfields Limited
48. State Trading Corporation of India Limited
49. Telecommunications Consultants India Limited
50. THDC India Limited
51. Western Coalfields Limited
52. WAPCOS Limited
(B) Miniratna Category-II CPSEs
53. Bharat Pumps & Compressors Limited
54. Broadcast Engineering Consultants (I) Limited
55. Central Mine Planning & Design Institute Limited
56. Ed.CIL (India) Limited
57. Engineering Projects (India) Limited
58. FCI Aravali Gypsum & Minerals India Limited
59. Ferro Scrap Nigam Limited
60. HMT (International) Limited
61. HSCC (India) Limited
62. India Trade Promotion Organisation
63. Indian Medicines & Pharmaceuticals CorporationLimited
64. MECON Limited
65. National Film Development Corporation Limited
66. National Small Industries Corporation Limited
67. PEC Limited
68. Rajasthan Electronics & Instruments Limited
1. Airports Authority of India
2. Antrix Corporation Limited
3. Balmer Lawrie & Co. Limited
4. Bharat Dynamics Limited
5. BEML Limited
6. Bharat Sanchar Nigam Limited
7. Bridge & Roof Company (India) Limited
8. Central Warehousing Corporation
9. Central Coalfields Limited
10. Chennai Petroleum Corporation Limited
11. Cochin Shipyard Limited
12. Container Corporation of India Limited
13. Dredging Corporation of India Limited
14. Engineers India Limited
15. Ennore Port Limited
16. Garden Reach Shipbuilders & Engineers Limited
17. Goa Shipyard Limited
18. Hindustan Copper Limited
19. HLL Lifecare Limited
20. Hindustan Newsprint Limited
21. Hindustan Paper Corporation Limited
22. Housing & Urban Development Corporation Limited
23. India Tourism Development Corporation Limited
24. Indian Railway Catering & Tourism CorporationLimited
25. IRCON International Limited
26. KIOCL Limited
27. Mazagaon Dock Limited
28. Mahanadi Coalfields Limited
29. Manganese Ore (India) Limited
30. Mangalore Refinery & Petrochemical Limited
31. Mishra Dhatu Nigam Limited
32. MMTC Limited
33. MSTC Limited
34. National Fertilizers Limited
35. National Seeds Corporation Limited
MoU System in CPSEs112
MoU System in CPSEsThe Memorandum of Understanding (MoU) as applicable
to public sector enterprises is a negotiated agreement betweenthe government and the management of the enterprise specifyingclearly the objectives of the agreement and the obligations of boththe parties. It was first introduced in France in two phases, thatis, as ‘contracts de programme’ in 1970 and as ‘contractsenterprise’ in 1979 consequent to the recommendations of theSimon Nora Committee Report (1967). The MoU system isintended to ensure a level playing field to the public sectorenterprises vis-à-vis the private (corporate) sector.
MoU system in India was first introduced in 1986 on thebasis of the recommendations of the Arjun Sengupta CommitteeReport (1984). The Committee laid emphasis on medium termcontract between the Government and the Central Public SectorEnterprises (CPSEs) and recommended a five-year agreement thatmay be reviewed annually. Moreover, since the CPSEs have beenset up as part of the national/central plan, the Committee favouredMoUs especially in respect of CPSEs in the core sectors of steel,coal, power, petroleum, fertilizer and petro-chemicals.
8.1 Autonomy and Accountability
The ‘management’ of the enterprise is made accountable tothe government through promise for performance or ‘performancecontract’. The government however continues to have control overthese enterprises, through ‘a priori supervision’ by ‘setting targets’in the beginning of the year and through a posteriori ‘performanceevaluation’ at the end of the year. In order to grant autonomy topublic sector enterprises vis-à-vis control of the government, theArjun Sengupta Committee identified three areas of Government-PSE interaction, namely (a) price fixation, (b) investment planningand (c) financial management. In regard to price fixation theCommittee observed that price control/ administered price/retention price may be retained only in areas where the nature ofproduct so justifies. While fixing prices for products of CPSEsoperating under monopoly conditions, the Committeerecommended that these should be benchmarked with internationalprices. It further stated that wherever CPSEs are operating undercompetitive market conditions, the CPSEs should be left on theirown to fix the price of their output. The gradual dismantling ofAdministered Price Mechanism (APM) since 1991 has helpedthese enterprises to fix the output prices on market principles. Inregard to autonomy for investment planning, greater powers weresubsequently delegated to the Board of Directors as recommendedby the Committee. The Board of Directors of MoU signing CPSEscan therefore sanction capital expenditure without the priorapproval of the government, especially so if the required fundscould be found from the internal resources of the enterprise. Inregard to financial management especially with reference to‘auditing’, the Arjun Sengupta Committee was of the view thatsubsequent to evolving of appropriate accounting standards bythe Comptroller and Auditor General of India (CAG),supplementary audit by CAG for the non-core sector should be
Chapter-8
given up. In the case of the enterprises in the core sector, however,the Committee recommended that company audit by the CAGmay continue.
The Committee further observed that ministries should notinterfere in areas of decision making which are within the delegatedpowers of CPSEs. Accordingly numerous ‘administrative controls’emanating from different ‘government circulars’ issued over theyears and pertaining to public sector enterprises were dispensedconsequent to the review exercises undertaken in the Departmentof Public Enterprises in 1996 and in 2000.
8.2 MoU System: Process and Principles’
The process of finalizing the MoUs starts with the issue ofdetailed Guidelines by the Department of Public Enterprises (DPE)on the basis of which the CPSEs submit their draft MoUs afterapproval by the respective Boards and the AdministrativeMinistries. The draft MoUs indicate various performance targetson a five point scale for the ensuing financial year. These draftMoUs are then discussed, improved and finalized during the MoUnegotiation meetings. The Task Force on MoU set up by DPEprovides the oversight during the MoU negotiations. The MoUnegotiations meetings are attended by the Chief Executives of theCPSEs, Senior Officers from the administrative Ministries and therepresentatives of the nodal Government agencies such as PlanningCommission and Ministry of Statistics & ProgrammeImplementation.
8.2.1 Task Force and Syndicates
The MoU Task Force comprises former Civil Servants, ex-CMDs of the Public Enterprises, finance professionals, domainexperts and academics. They are selected by DPE. Currently, thereare 68 Task Force (TF) members who are divided into sector-wise Syndicate Groups. Each Syndicate consists of 6 membersnormally. One of the members of the Syndicate acts as theConvener. The rich experience and knowledge of the TF membersin different fields provides the necessary technical input andenables the Syndicate in fixing realistic targets. The DPE issuesthe Minutes of MoU negotiation meetings to the CPSEs (and theMinistry/Department concerned) for finalizing the MoUs whichare authenticated in the DPE to ensure that those are in accordancewith the decisions on targets as agreed upon during the meetings.Subsequently, all MoUs have to be signed before 31st March forimplementation during the succeeding financial year.
8.2.2 High Power Committee on MoU
The High Power Committee (HPC) on MoU is a Committeeof Secretaries (COS) set up by the Government as the ApexCommittee to assess the performance of MoU signing CPSEs withreference to the commitments made by them in the MoU and also
Public Enterprises Survey 2011-2012: Vol-I 113
to assess how far the Administrative Ministries/Departments havebeen able to give the necessary support as committed by them inthe MoU. HPC is headed by the Cabinet Secretary. Secretary,Department of Public Enterprises is the Member-Secretary of thisCommittee. The other members comprise of Finance Secretary,Secretary (Expenditure),Secretary (Planning Commission),Secretary(Statistics & Programme Implementation). ChairmanPublic Enterprises Selection Board, Chief Economic Advisor,Department of Economic Affairs, Chairman Tariff Commission andSecretary (Performance Management). The HPC on MoU hasbeen, from time to time, giving directions in regard to thedetermination of the principles and parameters for evaluating theperformance of CPSEs.
8.3 Aims and Objectives of MoU system in CPSEs
The aims and objectives of the MoU system are broadly thefollowings :
(a) To improve the performance of public sector enterprisesby increasing autonomy of the management of theCompany.
(b) To remove the fuzziness in goals and objectives of publicsector enterprises.
(c) To evaluate the performance of management throughobjective criteria
(d) To provide incentive for better performance in future.
The incentives under the present system take two forms,namely ‘monetary’ and ‘non-monetary’ incentives. As per theSecond Pay Revision Committee recommendations (for theexecutives of CPSEs) vide DPE OM No. 2(70)/08-DPE (WC)-GL-XV/08 dtd. 26.11.2008, the variable Performance Related Pay(PRP) would be payable in the case of profit making CPSEs at100 % eligibility levels if the CPSE achieves the MoU rating as“Excellent”. If the CPSE’s MoU is rated as “Very Good”, theeligibility of PRP would be 80% of the basic pay. In respect of“Good” and “Fair” ratings, the eligibility levels would be 60%and 40% of basic pay respectively. However, there will be noPRP irrespective of the profitability of CPSE, in case it is ratedas “Poor”. The non-monetary incentives comprise the MoUAwards. These awards are also an expression of commitment ofthe policy makers to the MoU system. While excellent performingCPSEs are awarded with the MoU Excellence Awards, theremaining excellent performing CPSEs are recognized withExcellence Merit Certificates.
8.4 MoU Targets and Performance Evaluation
Performance evaluation at the end of the year indicates theextent to which the mutually agreed Targets agreed upon at thebeginning of the year were achieved by the enterprise.
8.4.1 Setting of MoU Targets
The exercise of fixing MoU targets involves the followingsteps:
(i) Preparation of MoU Guidelines, which are issued by DPEin the month of October/ November.
(ii) Submission of draft MoU by CPSEs directly andsubsequently through administrative Ministry on thebasis of the MoU guidelines.
(iii) Examination of draft MoUs by the MoU Division andpreparation of critiques to be circulated to the Task ForceMembers.
(iv) Fixing of dates and venue for MoU negotiation meetingsthat starts from January/February.
(v) Holding the MoU negotiation meetings to finalize theMoUs in the presence of the Task Force (January –March ) each year.
(vi) Preparation and circulation of the Minutes.
(vii) Submission of the draft MoU by the CPSE on the basisof Minutes.
(viii) Evaluation of MoU by the Task Force Members assubmitted by CPSE and vetted by DPE.
(ix) All MoUs have to be signed before 31st March of everyyear.
8.4.2 MoU Methodology and Evaluation
The MoU system was revamped in 1989 and was modeledon ‘the signaling system’ using the five-point scale ofperformance measurement, that is, ‘excellent’, ‘very good’,‘good’, ‘average’ and ‘poor’. This was further refined in2004-05 utilising ‘the balance score card’ methodology. Underthe current MoU Guidelines, equal weights (50% + 50% ) areassigned to ‘financial’ and ‘non-financial’ parameters 0% financialand 60% non-financial for section 25 CPSEs and sick & Lossmaking CPSEs as targets to be achieved at the end of year. The‘financial’ parameters are both in the form of absolute values,such as gross margins (profits) and turnover as well as in termsof ratios. The ‘non-financial’ parameters (also called dynamicparameters) are of three kinds, namely, dynamic parameters,sector specific mandatory parameters and enterprise specificparameters. ‘Non-financial parameters’ (also called dynamicparameters) include project implementation quality of productsand services, customer satisfaction, extent of globalization etc.Similarly, while the ‘sector-specific’ parameters refer tomacroeconomic factors like change in demand and supply, pricefluctuations, variation in interest rates etc, (that are, factorsbeyond the control of the management), the ‘enterprise-specific’parameters relate to issues such as safety and pollution etc. Eachof these performance targets for MoUs are framed on the fivepoint scale. Corporate Social Responsibility,(5%weightage),R&D (5% weightage) Sustainable Development(5%weightage), HRM (5% weightage), are mandatory MoUParameters.
Comprehensive Guidelines with Templates for objectiveevaluation has been issued for these elements of MoU. It isstipulated that non financial parameters should be consistent withthe proposed Annual Plan/Annual Budget and Corporate Plan ofthe CPSE. Major ongoing projects being monitored by the
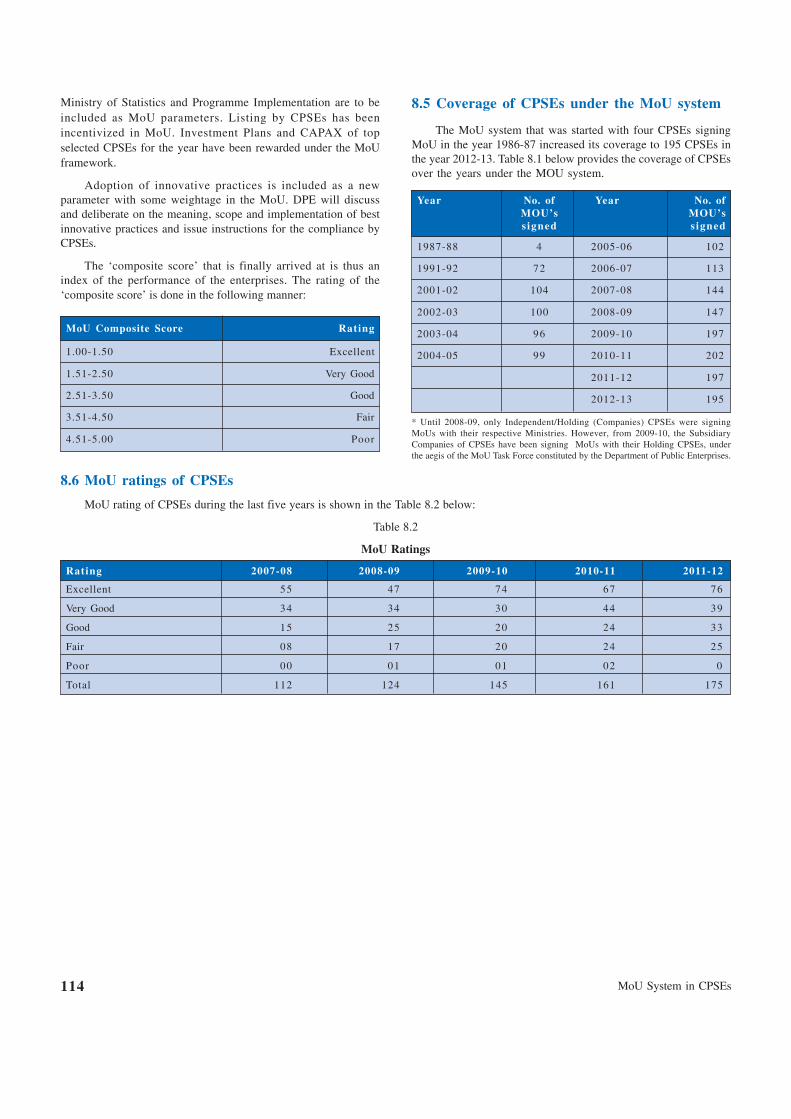
MoU System in CPSEs114
Ministry of Statistics and Programme Implementation are to beincluded as MoU parameters. Listing by CPSEs has beenincentivized in MoU. Investment Plans and CAPAX of topselected CPSEs for the year have been rewarded under the MoUframework.
Adoption of innovative practices is included as a newparameter with some weightage in the MoU. DPE will discussand deliberate on the meaning, scope and implementation of bestinnovative practices and issue instructions for the compliance byCPSEs.
The ‘composite score’ that is finally arrived at is thus anindex of the performance of the enterprises. The rating of the‘composite score’ is done in the following manner:
MoU Composite Score Rating
1.00-1.50 Excellent
1.51-2.50 Very Good
2.51-3.50 Good
3.51-4.50 Fair
4.51-5.00 Poor
8.5 Coverage of CPSEs under the MoU system
The MoU system that was started with four CPSEs signingMoU in the year 1986-87 increased its coverage to 195 CPSEs inthe year 2012-13. Table 8.1 below provides the coverage of CPSEsover the years under the MOU system.
Year No. of Year No. ofMOU’s MOU’ss igned s igned
1987-88 4 2005-06 102
1991-92 72 2006-07 113
2001-02 104 2007-08 144
2002-03 100 2008-09 147
2003-04 96 2009-10 197
2004-05 99 2010-11 202
2011-12 197
2012-13 195
* Until 2008-09, only Independent/Holding (Companies) CPSEs were signingMoUs with their respective Ministries. However, from 2009-10, the SubsidiaryCompanies of CPSEs have been signing MoUs with their Holding CPSEs, underthe aegis of the MoU Task Force constituted by the Department of Public Enterprises.
8.6 MoU ratings of CPSEs
MoU rating of CPSEs during the last five years is shown in the Table 8.2 below:
Table 8.2
MoU Ratings
Rating 2007-08 2008-09 2009-10 2010-11 2011-12
Excellent 55 47 74 67 76
Very Good 34 34 30 44 39
Good 15 25 20 24 33
Fair 08 17 20 24 25
Poor 00 01 01 02 0
Total 112 124 145 161 175
Public Enterprises Survey 2011-2012: Vol-I 115
Research & DevelopmentThe competitive and challenging business environment
demands continuous up-gradation and development of products,processes and services for sustained growth. Research andDevelopment (R&D) contribute substantially towards achievingthese goals. In the face of rapid technological advancements,various products and services have a very short product life cycle.R&D, in this respect, helps phase out products (& services)through introduction of new designs and technologies andimprovement in quality.
While a number of CPSEs have in-house R&D facilities,the others have gone for sponsored research through collaborationwith Universities and reputed R&D institutions. Sponsoredresearch is cost effective and is suited to CPSEs who cannot affordto incur expenditure on in-house research. There is also a greaterawareness of Intellectual Property Rights (IPR) and ‘patenting’of new knowledge gained and discoveries made in the process ofR&D.
The National Research Development Corporation (NRDC),a CPSE, is actively engaged in promoting, developing andcommercializing technologies, knowhow, patent and processesgenerated through national R&D institutions, thus helpingindividual enterprises and institutions acquire IPR/ Patents forcommercial use.
Technological collaboration with leading companies of theworld has been another approach adopted by CPSEs for upgradingtheir technological know-how.
R&D activities in CPSEs
The following paragraphs explain briefly the various R&Dactivities being undertaken by the different CPSEs in the differentcognate groups of manufacturing and services sectors.
9.1 Coal
9.1.1 Central Mine Planning & Design Institute Ltd.(CMPDI)
A total of twelve projects of R&D and S&T projects werecompleted by CMPDI, Ranchi during 2011-12. These projectsare related to Coal Bed Methane, Coal Mine Methane ,GroundPenetrating Radar (for detection of old unapproachable waterlogged working) , high resolution seismic monitoring (for earlydetection of slope failure) and development and use of fly ashbased pesticides.
9.1.2 Neyveli Lignite Corporation Ltd.(NLC)
A Research study was conducted in collaboration with CentralElectro Chemical Research Institute (CECRI), Karaikudi and theresult was found successful. Based on that a project proposal wassubmitted on “Development of customized Organic Coatings for
Chapter-9
corrosion protection of special mining equipments at NeyveliLignite Mines”, which was approved by the Ministry of Coal.
A bench scale production facility was erected at CARD toestablish the production of zeolite from fly ash based on the studyconducted in association with IIT Kharagpur. Since the Zeolite isin the powder form, a new project has been initiated to pelletizethe powder form of Zeolite to overcome some difficulties in watertreatment.
A collaborative project with VIT/Vellore is in progress toutilize the Bottom ash from thermal plants as partial replacementof sand in construction activities. Unburnt Carbon is separatedfrom bottom ash using ‘Air density separator’. It is observed thatthe mixture with bottom ash gives good strength and the resultsare encouraging.
A joint R&D project was taken up with National Instituteof Technology/Tiruchirapalli to study preventive measures forerosion-corrosion problems in Storm Water Control pumps.Suitable coatings to withstand corrosion were identified by labtests and three pumps were coated and the performance wasevaluated. In phase-II of the study, three more pumps werecoated. Some coated areas were removed due to local cavitationsand the problem was further studied by NIT/Tiruchirapalli indetail.
An air dispersion model has been developed by VIT/Vellore,which is able to predict the patterns of distribution of airpollutants in and around Neyveli.
9.2 Electricity
9.2.1 NHPC Ltd.
Specific areas in which R&D was carried out during the yearinclude:
Techniques to stop seepage in reservoirs/structures.
Development of a hard coating facility for which the DPRwas prepared.
Computational fluid dynamics analysis of fluid flowingthrough the surge and pressure shafts of the Teesta-V Power Stationand Dam-Spillway of Subansiri H.E. Project was accompalished.
A National Perspective Plan (NPP), namely,‘Developmentof Silt erosion resistant material for turbine of hydrogenerators’was prepared.
R&D in ‘Tunneling in water charged zones under highhydrostatic pressure’ was undertaken, sponsored by CPRI.
Research & Development116
9.2.2 NTPC Ltd.
NTPC Energy Technology Research Alliance (NETRA), aresearch and development wing of the Company, focuses on areasof efficiency improvement ,cost reduction, renewable andalternative energy, climate change and scientific support to utilities.In order to provide support to the power stations, projects likeArtificial Intelligence based plant performance advisory system,real–time advisory system, development and trails of roboticinspection devices at stations, development of PDC-RDM basedexpert system (analyzer) for online monitoring and advisorysystem for transformer conditioning , maintaining boiler waterchemistry , monitoring CO
2 utilisation through mineralization of
fly ash etc. have been successfully completed and deployed/testedat stations.
Research Advisory Council (RAC) comprising eminentscientists and experts from India and abroad is also in place in theCompany to steer high-end research. Scientific Advisory Council(SAC) with Regional Executive Directors and Station Heads asits members, provides directions for improving plant performanceand reducing the cost of generation. Meetings of both the AdvisoryCouncils were held during the year where members deliberated onvarious project activities and gave guidelines for implementationof suggestions.
Further 116 patents applications filed are in advance stageof processing. NETRA provides scientific support to all NTPCstations as well as other Utilities to improve their performance.NETRA has entered into MoU with National MetallurgicalLaboratory, Jamshedpur for collaborative research in the area ofMetallurgy. NTPC is fully aligned to the needs of adaptingemerging technologies and upgrading the technologies throughR&D.
9.3 Crude Oil
9.3.1 Oil and Natural Gas Corporation Ltd. (ONGC)
Specific areas in which R&D was carried out are:
Feasibility study of using composite material for fencing ofoil and gas wells, pipelines for handling highly corrosive oil andoil field effluents and tanks for oil storage .
Studies on the structural characterisation of gas hydrates usingRaman Spectroscopy.
Studies on the thermodynamics and kinetics of methanehydrate formation and diccociation under varying subsurfaceconditions.
Soil classification and evaluation of soil design parametersusing PCPT data with emphasis on application in Indian waters.
A total of 120 R&D projects were completed by IOGPT inthe areas of well completion , Artificial lift system, sand control,water shut off, stimulation, process facilities design &optimisation,Deep water production and subsea technology.
Under the Science &Technology International partnershipagreement between the goverments of India & Canada, CarbonManagement & Sustainability Group has undertaken an R&D
project on solar thermal application towards low carbon initiativetitled “Substitution of natural gas by solar thermal energy”. Thisfirst of its own kind project, aims at replacing natural gas basedheating of crude by a combination of solar and natural gas basedheating combination, saving effectively thereby a part of naturalgas.
ONGC along with TERI has been also carrying out R&D inthe field of Microbial Enhanced Oil Recovery, Paraffin DegradingBacteria and Flow Assurance for the last 4-5 years.
9.3.2 Oil India Ltd.(OIL)
Specific areas in which R&D activities have been carried outinclude:
Surface geochemical exploration using adsorbed soil gasmethod.
A collaborative project has been taken up with TERI todevelop a bacterial strain and nutrient suitable for paraffin controland MEOR jobs for our fields from in-situ sources. For isolationof the bacterial strain, samples from different reservoirs have beencollected & isolation work has been successfully carried out.
In order to explore the possibility of exploiting any ShaleGas and Tight Gas deposits, a strategic project has beenundertaken with the objective of establishing the resource potentialin operational areas in Assam-Arakan and Rajasthan basins byengaging an external consultant
9.4 Petroleum
9.4.1 Bharat Petroleum Corporation Limited (BPCL)
R&D programmes during the year continued to provide acompetitive advantage to the business operations throughdevelopment and commercialization of cost effective andcompetitive products and processes such as :
Hydrogen management for distillate production.
Fuel additive for high octane MS.
Corrosion inhibitor additive for gasoline-ethanol blends.
Bharat Metal Cutting Gas additive.
Fuel oil blending schemes at Refineries.
Process simulation models for optimization.
9.4.2 Chennai Petroleum Corpn. Ltd.(CPCL)
CPCL’s R&D is aimed at increasing the efficiency andreliability of the refinery processes and continues to extendsupport to various Refinery units like FCC, Hydrocracker, DHDSand Lube units with process and feed optimization studies.
CPCL’s R&D center has carried out extensive isomerisationpilot plant studies to successfully develop a model for supportingthe commercial ISOM unit. Studies were initiated on Bio fuelsalso by conducting several high-pressure pilot plant trials onthermo chemical conversion of Algae. CPCL’s R&D centre alsoentered into research cooperation with Indian Institute of
Public Enterprises Survey 2011-2012: Vol-I 117
Petroleum (IIP), Dehradun for the development of process forlow sulfur fuel oil through Extraction route as an alternate to hydrotreating which is expensive and complex.
9.4.3 Hindustan Petroleum Corporation Limited(HPCL)
R&D in the Company provides support to the Refineriesand Marketing divisions for operational improvement, absorptionof new technologies, developing innovative & path breakingtechnologies and license technologies. HPCL has taken the initiativefor setting up its world class Green R&D Centre at Bangalorewith a total cost of ` 550 crores. The project is being executed ina phased manner with a Phase-1 capital investment of ` 312 crores.Nine research labs which include Crude Evaluation & FuelsResearch , Hydro- processing ,FCC/RFCC, Catalysis, Bio-processes,Process Modelling and Simulation, Standard Testing,Analytical labs and Centre for Excellence in Nano Technology arebeing established under Phase-1. HPCL has also undertakencollaborative R&D projects with premier research institutes suchas IIT, Kanpur, IIT, Madras, IISC, Bangalore. IIT, Delhi. TERI,NewDelhi, NIT, Calicut, CIMFR, Dhanbad, GITAM University,Vishakhapatnam , Korea Institute for Energy Research-Korea inthe areas of process intensification, Nano catalyst ,CO2 captureand utilization , Hydrogen production and storage, improvedLubricant and adsorptive separations.
9.4.4 Indian Oil Corporation (IOC)
Two units based on the technologies developed by IOC R&DCentre were successfully commissioned in Bongaigaon Refineryin 2011-12, one being the DHDT for production of diesel andthe other being Isomerisationonit for production of MS. 15 patentswere filed; six patents were granted, which includes two Indian,One U.K.,One U.S.A,One Chinese and One Singapore Patent. Inthe lubricant technology development area, the R&D Centredeveloped 154 product formulations during the year and obtained63 approvals from original Equipment Manufacturers (OEMs)/customers. Pipeline research group were successfully employedto develop IPIG and CPIG Technologies to inspect pipelines.During the year impetus was given to research work in the areasof Bio-fuels and Bio-energy with the execution of a Memorandumof Agreement with the Department of Bio-technology,Govt. ofIndia for setting up an advanced Bio-energy Research Centre. Insolar thermal area, tri-partite MOC has been signed with IIT-Rajasthan and BHEL
9.5 Other Minerals & Metals
9.5.1 Manganese Ore (India) Ltd.
Specific areas in which R&D activities have been carried outare:
Inception of Load Haul & Dump machine (LHD) tyre inunderground mines for development & stopping operations.
Optimization of stope designs for safety & productivityimprovement.
Hydro-geological studies for underground mining operationsat Kandri Mine.
Increase level of interval (from exiting 30 Meters to 45Meters) for rapid mining operations; Independent high speed shaftsinking operation for underground mining for 650 mtr at BalaghatMine, (hydrological studies & stress monitoring is going on at thesite for safety of the project).
Commissioning of PLC driven compressors in Kandri, Ukwa& Gumgaon Mine for energy saving and studies of reclamation ofwaste dumps and investigations for other environmental protectionmeasures.
Collaborative research studies for use of overburden materialfor consolidated hydraulic stowing operation for the undergroundmining operation with Visvesvaraya National Institute Technology,Nagpur.
Development of alternative mining methods and supportsystems for underground mines; installation additionalindigenously developed IMB plant of 100000 TPA capacity forsecondary recovery of manganese ore from the rejects of integratedmanganese beneficiation plant and dumps at Balaghat Mine and astudy for beneficiation of low grade ore/ fines is in progress.
9.5.2 National Aluminum Co. Ltd. (NALCO)
NALCO’s In-house R&D units located at its Refinery & SmelterComplexes have been recognized by DSIR. Further, NALCO is settingup of its world class Research & Technology Centre at Bhubaneswarwith an investment of Rs. 88 crore with Technical Consultancy fromAluminpro, Canada and EPCM Consultancy from DCPL, Kolkata.Implementation of various activities of NRTC (Nalco Research &Development Centre) is in progress.
Alumina Plant
Studies to establish the effect of fine seed addition ongranulometry and to develop it as a tool to control granulometry.
Studies to establish Solubility of CaO from different sourcesof Lime.
Studies related to use of CAIS as filter aid.
Studies to establish impact of over flocculation in settlerOverflow.
Commercialization of high temperature resin developed in-house.
Impurity Identification and salt removal studies starting withV2O5.
Installation of heating bundles in pre desilication tank.
Preparation of Low Alpha Special alumina for ceramic Use.
Study on impact of surface mined Bauxite on process.
Laboratory scale studies were carried out along with thesuppliers of various flocculants for use in High Rate thickenersand Deep cone washers of New stream.
Smelter Plant
Development of chequered sheet as a new variety of rolledproduct.

Research & Development118
Development of a process for production of High puritymetal (HP-2 grade) first time in two pots of Potline-IV.
Bench scale studies on Impact of butt quantity & quality onanode quality .
Six sigma projects on Reduction of iron in anode completedsuccessfully.
Characterization of baked anodes for process monitoring.
Metallographic studies of cast products & tibor rods,inclusion analysis of molten aluminium metal are being carried outregularly for product quality improvement.
Fuel oil saving by use of magnetic resonators in cast housefurnace
Pots started with alternate supply of cathode blocks,reprocessed rejected paste & indigenously developed rammingpaste are being monitored for their performances.
Slot cutting machine for anodes commissioned in carbon plant.Slotted anodes are being used in pot line-I & II.
Bench scale studies carried out on impact of spent pot liningcarbon on anode quality.
Bench scale studies continuing on Effect of high softeningpoint pitch on anode quality.
Trials continuing with nonwetting castable in tapping ladles.
Melt loss is being monitored in cast house furnaces.
The Company has entered into collaboration withJNARDDC, Nagpur for the development of high speed extrusionalloys, development of glaze tiles and foam based light weightedaggregates from red mudand . It has also entered into collaborationwith IIT, Kharagpur for the process of manufacturing ceramic tilesfrom Fly ash.
9.6 Steel
9.6.1 Mishra Dhatu Nigam Limited (MIDHANI)
Midhani Research and Development (R&D) is centeredaround development of new alloys like 11-10-T PH, Superni 740,304 HCu Titanium STA Rings, Superni 708 etc. for strategicsectors. Product development such as Ti castings, investment castproducts, near net shape, close die forging etc. resulted in thedevelopment of precision Ti-castings and titanium filters for theNavy and complex thin walled castings for aerospace applications.Midhani is devoting its core competence for manufacturing ofalloys tailor-made to suit the specific stringent requirements ofcustomers for their critical applications.
9.6.2 Steel Authority of India Ltd.(SAIL)
The Research and Development Centre for Iron & Steel(RDCIS) at Ranchi pursued altogether 107 R&D projects in2011-12, out of which 69 projects were planned for completion.Achieving a target compliance of 104%, RDCIS completed72 projects during the year. The Centre also filed 34 patents and34 copyrights in 2011-12. As many as 85 technical papers
(34 international) were published and 161 papers (95 international)were presented during the year. In addition, RDCIS undertookcontract research work and provided significant consultancyservices and know-how to organizations outside SAIL, yieldingan external earning of 280.27 lakhs
9.7 Fertilizer
9.7.1 Rashtriya Chemicals and Fertilizers Ltd.(RCF)
RCF took up the following major R&D projects during the year:
Development of MICROLA & liquid bio fertilizers fornitrogen fixation in soil for Bihar state as per guidelines of stateAgricultural department.
MOU with Institute of Chemical Technology (ICT),Matungato carry out collaborative research for improvement in commonareas of operations.
Development of process for production of zindacted urea andboronated has been taken up by the company & is expected to becompleted by December, 2012.
9.8 Heavy Engineering
9.8.1 Bharat Heavy Engineering Limited (BHEL)
BHEL’s products and systems are technology intensive andthe Company emphasizes on R&D/technology development in itsendeavor to realize its strategic aspiration of becoming engineeringconglomerate. Accordingly BHEL pursued the strategy of in-houseproduct development by encouraging innovation in line with the“Decade of Innovations (2010-2020)” declared by Govt. of India.As a major step towards this, the company updated its R&Dpolicy. During 2011-12, BHEL invested Rs 1,198 crore on R&Defforts – 22% higher than the previous year. BHEL’s efforts forencouraging innovation have resulted in raising BHEL’s IPR capitaltally to 1786 with highest ever IPRs (351 no.) filed during2011-12. A growth of 15% has been recorded in turnover of` 9,832 crore from in-house developed products and services.
In order to facilitate advanced R&D activities in focused areaswith state-of-the-art facilities and specialized manpower, BHELhas established 13 Centers of Excellence which include eightCentres of Excellence at Corporate R&D Hyderabad. In additionto the existing centres of Excellence for Simulators, ComputationalFluid Dynamics, Permanent Magnet Machines and Robotics andMachine Dynamics, BHEL has established four new Centres ofExcellence during the year in the areas of Advance FabricationTechnology, Coal Research Centre, Nano Technology applicationand UHV lab for GIS development.
An MoU has been signed with Indian Institute of Science(IISc), Bangalore, covering a broad area of joint researchopportunities to facilitate BHEL to engage in collaborativeresearch. This aims at accelerating the pace of development anddemonstration of new products, systems and concepts. ‘R&DAdvisory Council’ has been formed with eminent scientists anddignitaries from Govt. of India to advise BHEL on R&D strategiesfor growth and to enable it face the new challenges in the market.
Public Enterprises Survey 2011-2012: Vol-I 119
In addition to Corporate R&D Division, BHEL has fourspecialized Institutes, viz., Welding Research Institute at Trichy,Ceramic Technological Institute at Bangalore, Hydro Lab at Bhopaland Pollution Control Research Institute at Haridwar
9.9 Medium & Light Engineering
9.9.1 Bharat Electronics Ltd.(BEL)
Focused attention was given during the year for planning andreviewing of development of technology modules and products.New projects initiated during 2011-12 include development ofSoftware Defined Radio (SDR) for Navy/Air Force, Solid StateCoastal and Surface Surveillance radars, Point to Multi-pointRadio, Uncooled Thermal weapon Sight, Tablet PC, integrated anti-submarine Warfare Complex,Torpedo Defence System, UpgradedIndegenous Forward Observer Simulator,Remotely OperatedVehicle and Thermal Imaging Camera for Flycatcher Radar.
9.9.2 Electronics Corporation of India Ltd.
Specific areas in which R&D was carried out during the yearare:
Airborne Satcom Terminals and Large Earth Station Antennae
IGBT based High Voltage DC Power Supplies
RF Seekers
C4I and Checkout systems for Missile Programs
Weather Radars
Electronic Voting Machines
Solid State Video Recorder
Electrical Sub-Station Automation systems
De-duplication technologies and crypto analysis
Enterprise wide Access Control System Software
Migration of software to Linux platform
9.9.3 Central Electronics Ltd. (CEL)
CEL has established the manufacturing facilities to produceCZT Substrates & produced and delivered 300 Substrate to SSPLin 3 yers as schedule, upgraded the process to improvespecifications in collaboration with SSPL. In order to encounterthe terrorism against public property and human life, a projectwas conceptualized and has been successfully competed.Basedon this project,CEL has participated in various tenders of IndianRailways,MHA,MOD,BSF,CIF,CRPF,PoliceDepatments ofStates & other Govt. establishments.
9.10 Transportation Equipment
9.10.1 Cochin Shipyard Ltd.(CSL)
R&D activities of CSL were mainly focused on developmentof suitable welding procedures for Marine grade Aluminumfabrication. Concerted efforts were put in place for thedevelopment of weld procedures with double pulsing power
sources which helped in producing defect free and excellent weldjoints in Marine grade Aluminum. These efforts in R&D are drivenby need to find solutions for the fabrication of aluminumsuperstructure. Some of the R&D projects identified for takingup in the near future include automation of pipe fabrication bythe adoption of Orbital Welding, introduction of virtual realityweld simulators for welder training and study on distortion controlin Aluminum welded panels.
9.10.2 BEML
The R&D Unit of BEML has designed and developed anumber of high technology products and aggregates forConstruction & Mining, Rail & Metro and Defence sectors as percustomer requirements. BEML has launched the followingproducts / projects during the year:
Mining &Construction :
(a) BE450LC - 45 ton class – Hydraulic Excavator
(b) BE220R - 22 ton class - Rail – Road Hydraulic Excavator
(c) BL9H - Back Hoe Loader with BS-III compliant engine &improved aesthetics
(d) BL200-1 - Wheel Loader with BS-III compliant engine &improved aesthetics
(e) BD355-1 - Dozer with BS-III compliant Electronic Engine &Transmission
(f) BD155 - Dozers with BEML Electronic Engine
(g) BG605A - Articulated version of BG605 Motor Grader·
(h) BH100 - Dump truck with MTU Engine & AllisonTransmission.
Metro &Rail :
(a) 8-Wheeler Overhead Equipment Inspection Car for IndianRailways.
(b) Stainless Steel ACEMU for Indian Railways.
9.11 Consumer Goods
9.11.1 HLL Lifecare Limited
The company's corporate R &D centre is implementing R&Dprojects, both in-house and in collaboration with different nationalinstitutions namely, IIT Kanpur, IIT Mumbai, SreeChitra ThirunalI Institute for Medical Science &Technology Thiruvananthapuram, Regional Cancer Centre,Thiruvananthapuram.
The Company’s R&D Centre received funding assistance of` 19.75 lakh from Department of Science and Technology (DST)during the year for the project ‘Bioprospecting forantimycrobacterial natural products inder the Fast Track Scheme’.The new state-of -the art R&D infrastructure is in the final stagesof completion. The centre will have three verticals of operationsnamely Pharma, Medical devices and Diagnostics divisions.
Research & Development120
9.11.2 Security Printing and Minting Corporation ofIndia Ltd.(SPMCIL)
The Company undertook R&D activities during the year atBNP, Dewas, CNP, Nashik, ISP, Nashik, SPM, Hoshangabad,IGM, Kolkata, IGM, Mumbai in the areas of manufacturingprocess improvement and information technology. The Companyhas furthermore, initiated efforts for adoption of newer technologyof manufacturing of banknote paper by setting-up a JV companyin the name of Bank Note Paper Mill India Pvt. Ltd.
MoU system in CPSEs and R&D
R&D has been included as a compulsory element under the“non-financial parameters” under the MoU system in CPSEs witha 5% weightage attached to it. In order to remove ambiguity andbring uniformity of approach, guidelines have been issuedspecifying scope of activities under R&D. The guidelines are acharter on activities, projects, expenditure, documentation andmonitoring of initiatives by CPSEs. The salient features of theGuidelines on Research & Development for CPSEs are as under:
(i) ‘Research’ is original and planned investigationundertaken with the prospect of gaining new scientificor technical knowledge and understanding.‘Development’ is the application of research findings orother knowledge to a plan or design for the productionof new or substantially improved materials, devices,products, processes, systems or services prior to thecommencement of commercial production or use.
(ii) ‘Scientific Research and Development’ shall meansystematic investigation and search in the field oftechnology natural or applied science (includingagriculture).
(iii) R&D policy of the CPSE should align with its Visionand Mission and based on this policy the CPSE mustdevelop R&D Manual and R&D Plan.
(iv) R&D plans should contain details about implementationas well as procedures and methodologies for monitoringresults and modalities of concurrent and final evaluation.
(v) The expenditure on R&D as a percentage of PAT willhave 50% weight in total marks of 5. The prescribedminimum amount for expenditure under R&D will be0.5 per cent of PAT of the previous year for Miniratnaand other CPSEs and minimum 1 per cent of PAT forNavratna/ Maharatna CPSEs.
(vi) CPSE should create a mechanism/process for planning/monitoring at Apex level to decide on R&D activitieson long term/short term basis. The Sub-committee ofthe Board (on R&D) will be responsible for periodicmonitoring and review of R&D activities
(vii) R&D projects have to be based on stable and permanentmechanism for implementation; baseline organizationalsurvey (before and after the project); projectidentification in line with business needs and coreactivities; specification of outcomes extracted from theproject; setting timeline and mileposts; collaborationand synergizing with Universities/institutions/Researchlaboratories; outsourcing and scheme for incentives andrewards.
(viii) Evaluation of the performance of the R&D project willhave to be based on its objectives, scope, deliverablesand benefits (techno-commercial). The list of R&Dprojects/ activities with target values/performanceindicators will be submitted by the CPSE to Task Forceeach year. The Task Force will approve 3-5 projects oradd any other R&D projects with performanceindicators. The evaluation/rating of the selected projectsdone by Research Advisory Committee of the CPSE orany independent expert will be considered by the TaskForce for awarding MoU score against R&D projects.
(ix) The Department of Public Enterprises will create aNational R&D Hub which will act as a Think Tank andundertake/facilitate nation-wide compilation,documentation and creation of database; advocacy;research; training, publication, promotional activities ,etc.
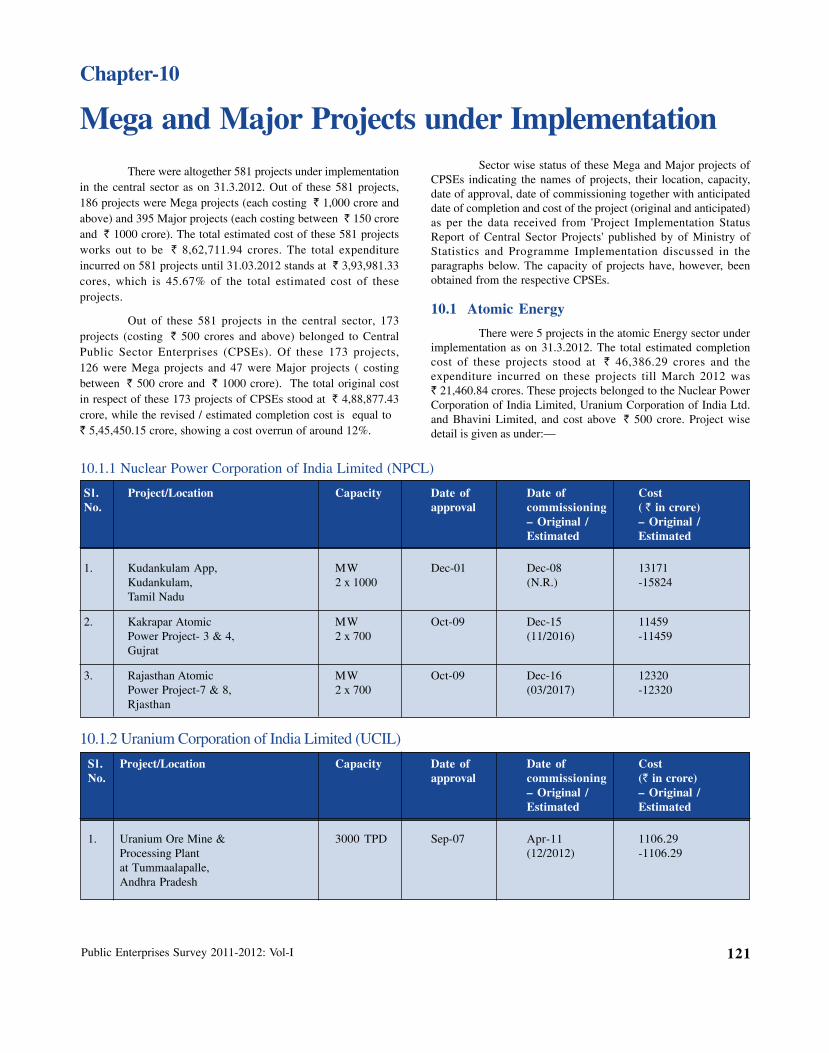
Public Enterprises Survey 2011-2012: Vol-I 121
Mega and Major Projects under Implementation
Chapter-10
10.1.1 Nuclear Power Corporation of India Limited (NPCL)
Sl. Project/Location Capacity Date of Date of CostNo. approval commissioning ( ` in crore)
– Original / – Original /Estimated Estimated
1. Kudankulam App, MW Dec-01 Dec-08 13171Kudankulam, 2 x 1000 (N.R.) -15824Tamil Nadu
2. Kakrapar Atomic MW Oct-09 Dec-15 11459Power Project- 3 & 4, 2 x 700 (11/2016) -11459Gujrat
3. Rajasthan Atomic MW Oct-09 Dec-16 12320Power Project-7 & 8, 2 x 700 (03/2017) -12320Rjasthan
10.1.2 Uranium Corporation of India Limited (UCIL)
Sl. Project/Location Capacity Date of Date of CostNo. approval commissioning (` in crore)
– Original / – Original /Estimated Estimated
1. Uranium Ore Mine & 3000 TPD Sep-07 Apr-11 1106.29Processing Plant (12/2012) -1106.29at Tummaalapalle,Andhra Pradesh
There were altogether 581 projects under implementationin the central sector as on 31.3.2012. Out of these 581 projects,186 projects were Mega projects (each costing ` 1,000 crore andabove) and 395 Major projects (each costing between ` 150 croreand ` 1000 crore). The total estimated cost of these 581 projectsworks out to be ` 8,62,711.94 crores. The total expenditureincurred on 581 projects until 31.03.2012 stands at ` 3,93,981.33cores, which is 45.67% of the total estimated cost of theseprojects.
Out of these 581 projects in the central sector, 173projects (costing ` 500 crores and above) belonged to CentralPublic Sector Enterprises (CPSEs). Of these 173 projects,126 were Mega projects and 47 were Major projects ( costingbetween ` 500 crore and ` 1000 crore). The total original costin respect of these 173 projects of CPSEs stood at ` 4,88,877.43crore, while the revised / estimated completion cost is equal to ` 5,45,450.15 crore, showing a cost overrun of around 12%.
Sector wise status of these Mega and Major projects ofCPSEs indicating the names of projects, their location, capacity,date of approval, date of commissioning together with anticipateddate of completion and cost of the project (original and anticipated)as per the data received from 'Project Implementation StatusReport of Central Sector Projects' published by of Ministry ofStatistics and Programme Implementation discussed in theparagraphs below. The capacity of projects have, however, beenobtained from the respective CPSEs.
10.1 Atomic Energy
There were 5 projects in the atomic Energy sector underimplementation as on 31.3.2012. The total estimated completioncost of these projects stood at ` 46,386.29 crores and theexpenditure incurred on these projects till March 2012 was` 21,460.84 crores. These projects belonged to the Nuclear PowerCorporation of India Limited, Uranium Corporation of India Ltd.and Bhavini Limited, and cost above ` 500 crore. Project wisedetail is given as under:—
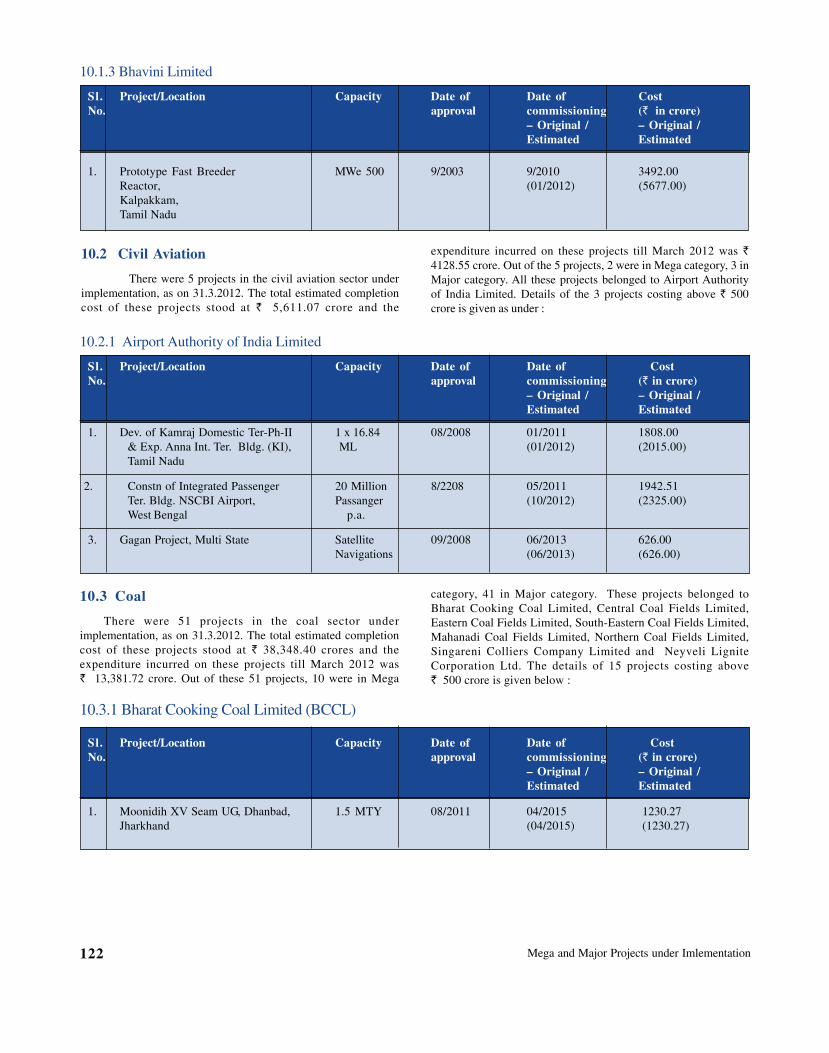
Mega and Major Projects under Imlementation122
10.1.3 Bhavini Limited
Sl. Project/Location Capacity Date of Date of CostNo. approval commissioning (` in crore)
– Original / – Original /Estimated Estimated
1. Prototype Fast Breeder MWe 500 9/2003 9/2010 3492.00Reactor, (01/2012) (5677.00)Kalpakkam,Tamil Nadu
10.2 Civil Aviation
There were 5 projects in the civil aviation sector underimplementation, as on 31.3.2012. The total estimated completioncost of these projects stood at ` 5,611.07 crore and the
expenditure incurred on these projects till March 2012 was `
4128.55 crore. Out of the 5 projects, 2 were in Mega category, 3 inMajor category. All these projects belonged to Airport Authorityof India Limited. Details of the 3 projects costing above ` 500crore is given as under :
10.2.1 Airport Authority of India Limited
Sl. Project/Location Capacity Date of Date of CostNo. approval commissioning (` in crore)
– Original / – Original /Estimated Estimated
1. Dev. of Kamraj Domestic Ter-Ph-II 1 x 16.84 08/2008 01/2011 1808.00& Exp. Anna Int. Ter. Bldg. (KI), ML (01/2012) (2015.00)Tamil Nadu
2. Constn of Integrated Passenger 20 Million 8/2208 05/2011 1942.51Ter. Bldg. NSCBI Airport, Passanger (10/2012) (2325.00)West Bengal p.a.
3. Gagan Project, Multi State Satellite 09/2008 06/2013 626.00Navigations (06/2013) (626.00)
10.3 Coal
There were 51 projects in the coal sector underimplementation, as on 31.3.2012. The total estimated completioncost of these projects stood at ` 38,348.40 crores and theexpenditure incurred on these projects till March 2012 was` 13,381.72 crore. Out of these 51 projects, 10 were in Mega
category, 41 in Major category. These projects belonged toBharat Cooking Coal Limited, Central Coal Fields Limited,Eastern Coal Fields Limited, South-Eastern Coal Fields Limited,Mahanadi Coal Fields Limited, Northern Coal Fields Limited,Singareni Colliers Company Limited and Neyveli LigniteCorporation Ltd. The details of 15 projects costing above` 500 crore is given below :
10.3.1 Bharat Cooking Coal Limited (BCCL)
Sl. Project/Location Capacity Date of Date of CostNo. approval commissioning (` in crore)
– Original / – Original /Estimated Estimated
1. Moonidih XV Seam UG, Dhanbad, 1.5 MTY 08/2011 04/2015 1230.27Jharkhand (04/2015) (1230.27)
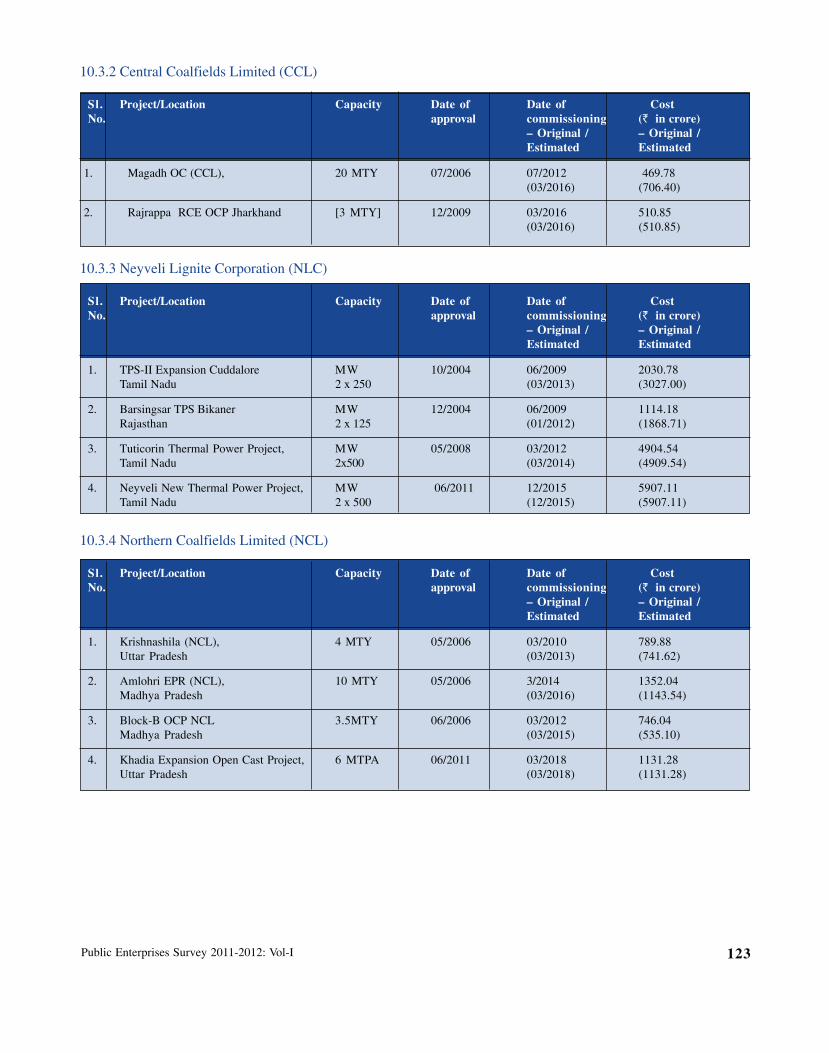
Public Enterprises Survey 2011-2012: Vol-I 123
10.3.2 Central Coalfields Limited (CCL)
Sl. Project/Location Capacity Date of Date of CostNo. approval commissioning (` in crore)
– Original / – Original /Estimated Estimated
1. Magadh OC (CCL), 20 MTY 07/2006 07/2012 469.78(03/2016) (706.40)
2. Rajrappa RCE OCP Jharkhand [3 MTY] 12/2009 03/2016 510.85(03/2016) (510.85)
10.3.3 Neyveli Lignite Corporation (NLC)
Sl. Project/Location Capacity Date of Date of CostNo. approval commissioning (` in crore)
– Original / – Original /Estimated Estimated
1. TPS-II Expansion Cuddalore MW 10/2004 06/2009 2030.78Tamil Nadu 2 x 250 (03/2013) (3027.00)
2. Barsingsar TPS Bikaner MW 12/2004 06/2009 1114.18Rajasthan 2 x 125 (01/2012) (1868.71)
3. Tuticorin Thermal Power Project, MW 05/2008 03/2012 4904.54Tamil Nadu 2x500 (03/2014) (4909.54)
4. Neyveli New Thermal Power Project, MW 06/2011 12/2015 5907.11Tamil Nadu 2 x 500 (12/2015) (5907.11)
10.3.4 Northern Coalfields Limited (NCL)
Sl. Project/Location Capacity Date of Date of CostNo. approval commissioning (` in crore)
– Original / – Original /Estimated Estimated
1. Krishnashila (NCL), 4 MTY 05/2006 03/2010 789.88Uttar Pradesh (03/2013) (741.62)
2. Amlohri EPR (NCL), 10 MTY 05/2006 3/2014 1352.04Madhya Pradesh (03/2016) (1143.54)
3. Block-B OCP NCL 3.5MTY 06/2006 03/2012 746.04Madhya Pradesh (03/2015) (535.10)
4. Khadia Expansion Open Cast Project, 6 MTPA 06/2011 03/2018 1131.28Uttar Pradesh (03/2018) (1131.28)
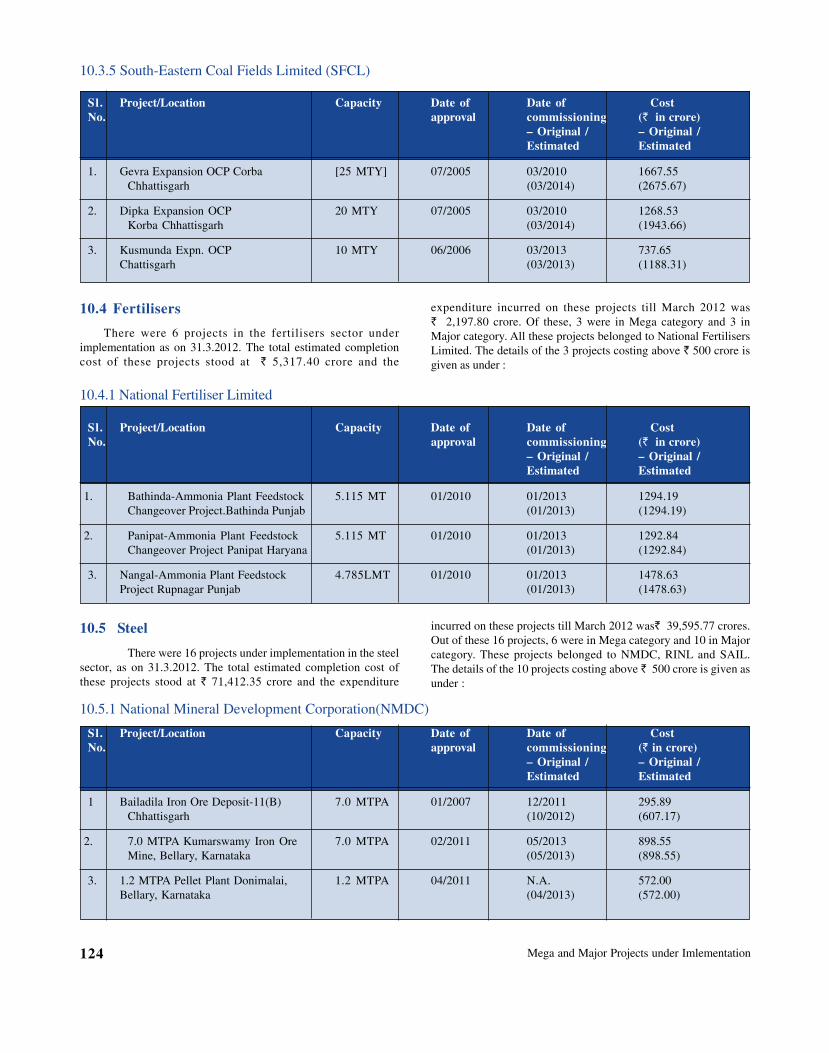
Mega and Major Projects under Imlementation124
10.3.5 South-Eastern Coal Fields Limited (SFCL)
Sl. Project/Location Capacity Date of Date of CostNo. approval commissioning (` in crore)
– Original / – Original /Estimated Estimated
1. Gevra Expansion OCP Corba [25 MTY] 07/2005 03/2010 1667.55Chhattisgarh (03/2014) (2675.67)
2. Dipka Expansion OCP 20 MTY 07/2005 03/2010 1268.53Korba Chhattisgarh (03/2014) (1943.66)
3. Kusmunda Expn. OCP 10 MTY 06/2006 03/2013 737.65Chattisgarh (03/2013) (1188.31)
10.4 Fertilisers
There were 6 projects in the fertilisers sector underimplementation as on 31.3.2012. The total estimated completioncost of these projects stood at ` 5,317.40 crore and the
expenditure incurred on these projects till March 2012 was` 2,197.80 crore. Of these, 3 were in Mega category and 3 inMajor category. All these projects belonged to National FertilisersLimited. The details of the 3 projects costing above ` 500 crore isgiven as under :
10.4.1 National Fertiliser Limited
Sl. Project/Location Capacity Date of Date of CostNo. approval commissioning (` in crore)
– Original / – Original /Estimated Estimated
1. Bathinda-Ammonia Plant Feedstock 5.115 MT 01/2010 01/2013 1294.19Changeover Project.Bathinda Punjab (01/2013) (1294.19)
2. Panipat-Ammonia Plant Feedstock 5.115 MT 01/2010 01/2013 1292.84Changeover Project Panipat Haryana (01/2013) (1292.84)
3. Nangal-Ammonia Plant Feedstock 4.785LMT 01/2010 01/2013 1478.63Project Rupnagar Punjab (01/2013) (1478.63)
10.5 Steel
There were 16 projects under implementation in the steelsector, as on 31.3.2012. The total estimated completion cost ofthese projects stood at ` 71,412.35 crore and the expenditure
incurred on these projects till March 2012 was` 39,595.77 crores.Out of these 16 projects, 6 were in Mega category and 10 in Majorcategory. These projects belonged to NMDC, RINL and SAIL.The details of the 10 projects costing above ` 500 crore is given asunder :
10.5.1 National Mineral Development Corporation(NMDC)
Sl. Project/Location Capacity Date of Date of CostNo. approval commissioning (` in crore)
– Original / – Original /Estimated Estimated
1 Bailadila Iron Ore Deposit-11(B) 7.0 MTPA 01/2007 12/2011 295.89Chhattisgarh (10/2012) (607.17)
2. 7.0 MTPA Kumarswamy Iron Ore 7.0 MTPA 02/2011 05/2013 898.55Mine, Bellary, Karnataka (05/2013) (898.55)
3. 1.2 MTPA Pellet Plant Donimalai, 1.2 MTPA 04/2011 N.A. 572.00Bellary, Karnataka (04/2013) (572.00)
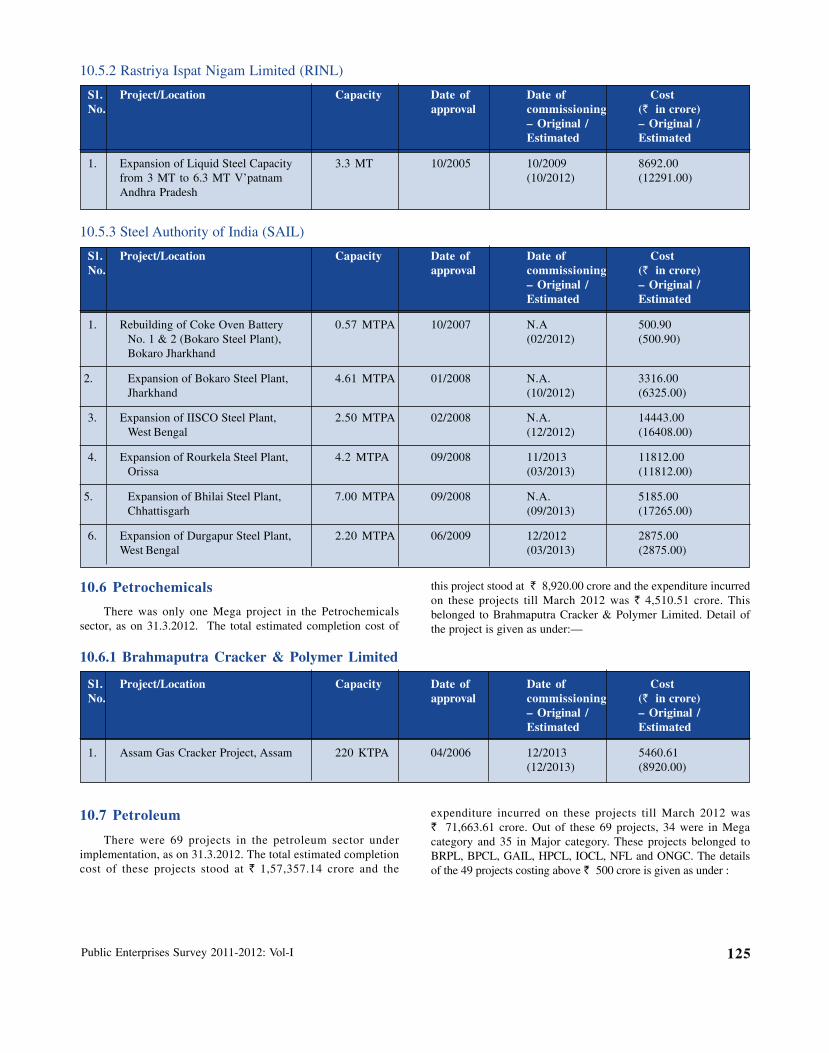
Public Enterprises Survey 2011-2012: Vol-I 125
10.5.2 Rastriya Ispat Nigam Limited (RINL)
Sl. Project/Location Capacity Date of Date of CostNo. approval commissioning (` in crore)
– Original / – Original /Estimated Estimated
1. Expansion of Liquid Steel Capacity 3.3 MT 10/2005 10/2009 8692.00from 3 MT to 6.3 MT V’patnam (10/2012) (12291.00)Andhra Pradesh
10.5.3 Steel Authority of India (SAIL)
Sl. Project/Location Capacity Date of Date of CostNo. approval commissioning (` in crore)
– Original / – Original /Estimated Estimated
1. Rebuilding of Coke Oven Battery 0.57 MTPA 10/2007 N.A 500.90No. 1 & 2 (Bokaro Steel Plant), (02/2012) (500.90)Bokaro Jharkhand
2. Expansion of Bokaro Steel Plant, 4.61 MTPA 01/2008 N.A. 3316.00Jharkhand (10/2012) (6325.00)
3. Expansion of IISCO Steel Plant, 2.50 MTPA 02/2008 N.A. 14443.00West Bengal (12/2012) (16408.00)
4. Expansion of Rourkela Steel Plant, 4.2 MTPA 09/2008 11/2013 11812.00Orissa (03/2013) (11812.00)
5. Expansion of Bhilai Steel Plant, 7.00 MTPA 09/2008 N.A. 5185.00Chhattisgarh (09/2013) (17265.00)
6. Expansion of Durgapur Steel Plant, 2.20 MTPA 06/2009 12/2012 2875.00West Bengal (03/2013) (2875.00)
10.6 Petrochemicals
There was only one Mega project in the Petrochemicalssector, as on 31.3.2012. The total estimated completion cost of
this project stood at ` 8,920.00 crore and the expenditure incurredon these projects till March 2012 was ` 4,510.51 crore. Thisbelonged to Brahmaputra Cracker & Polymer Limited. Detail ofthe project is given as under:—
10.6.1 Brahmaputra Cracker & Polymer Limited
Sl. Project/Location Capacity Date of Date of CostNo. approval commissioning (` in crore)
– Original / – Original /Estimated Estimated
1. Assam Gas Cracker Project, Assam 220 KTPA 04/2006 12/2013 5460.61(12/2013) (8920.00)
10.7 Petroleum
There were 69 projects in the petroleum sector underimplementation, as on 31.3.2012. The total estimated completioncost of these projects stood at ` 1,57,357.14 crore and the
expenditure incurred on these projects till March 2012 was` 71,663.61 crore. Out of these 69 projects, 34 were in Megacategory and 35 in Major category. These projects belonged toBRPL, BPCL, GAIL, HPCL, IOCL, NFL and ONGC. The detailsof the 49 projects costing above ` 500 crore is given as under :
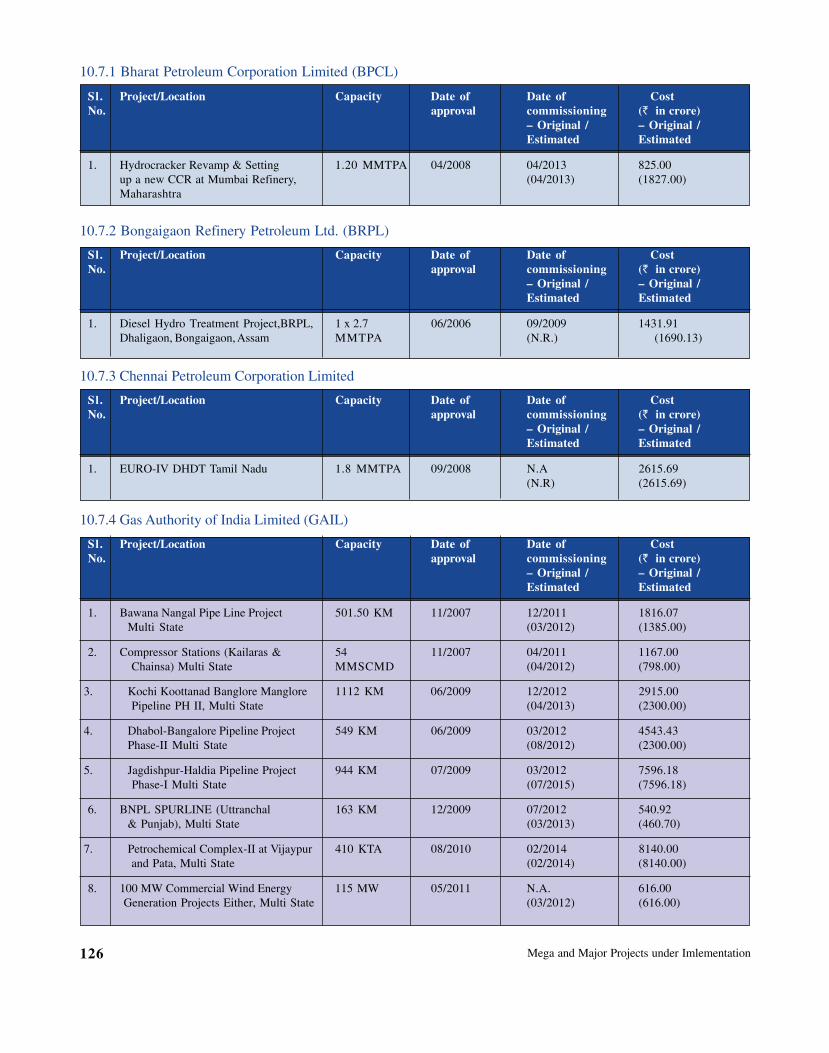
Mega and Major Projects under Imlementation126
10.7.1 Bharat Petroleum Corporation Limited (BPCL)
Sl. Project/Location Capacity Date of Date of CostNo. approval commissioning (` in crore)
– Original / – Original /Estimated Estimated
1. Hydrocracker Revamp & Setting 1.20 MMTPA 04/2008 04/2013 825.00up a new CCR at Mumbai Refinery, (04/2013) (1827.00)Maharashtra
10.7.2 Bongaigaon Refinery Petroleum Ltd. (BRPL)
Sl. Project/Location Capacity Date of Date of CostNo. approval commissioning (` in crore)
– Original / – Original /Estimated Estimated
1. Diesel Hydro Treatment Project,BRPL, 1 x 2.7 06/2006 09/2009 1431.91Dhaligaon, Bongaigaon, Assam MMTPA (N.R.) (1690.13)
10.7.3 Chennai Petroleum Corporation Limited
Sl. Project/Location Capacity Date of Date of CostNo. approval commissioning (` in crore)
– Original / – Original /Estimated Estimated
1. EURO-IV DHDT Tamil Nadu 1.8 MMTPA 09/2008 N.A 2615.69(N.R) (2615.69)
10.7.4 Gas Authority of India Limited (GAIL)
Sl. Project/Location Capacity Date of Date of CostNo. approval commissioning (` in crore)
– Original / – Original /Estimated Estimated
1. Bawana Nangal Pipe Line Project 501.50 KM 11/2007 12/2011 1816.07Multi State (03/2012) (1385.00)
2. Compressor Stations (Kailaras & 54 11/2007 04/2011 1167.00 Chainsa) Multi State MMSCMD (04/2012) (798.00)
3. Kochi Koottanad Banglore Manglore 1112 KM 06/2009 12/2012 2915.00 Pipeline PH II, Multi State (04/2013) (2300.00)
4. Dhabol-Bangalore Pipeline Project 549 KM 06/2009 03/2012 4543.43Phase-II Multi State (08/2012) (2300.00)
5. Jagdishpur-Haldia Pipeline Project 944 KM 07/2009 03/2012 7596.18 Phase-I Multi State (07/2015) (7596.18)
6. BNPL SPURLINE (Uttranchal 163 KM 12/2009 07/2012 540.92& Punjab), Multi State (03/2013) (460.70)
7. Petrochemical Complex-II at Vijaypur 410 KTA 08/2010 02/2014 8140.00 and Pata, Multi State (02/2014) (8140.00)
8. 100 MW Commercial Wind Energy 115 MW 05/2011 N.A. 616.00 Generation Projects Either, Multi State (03/2012) (616.00)
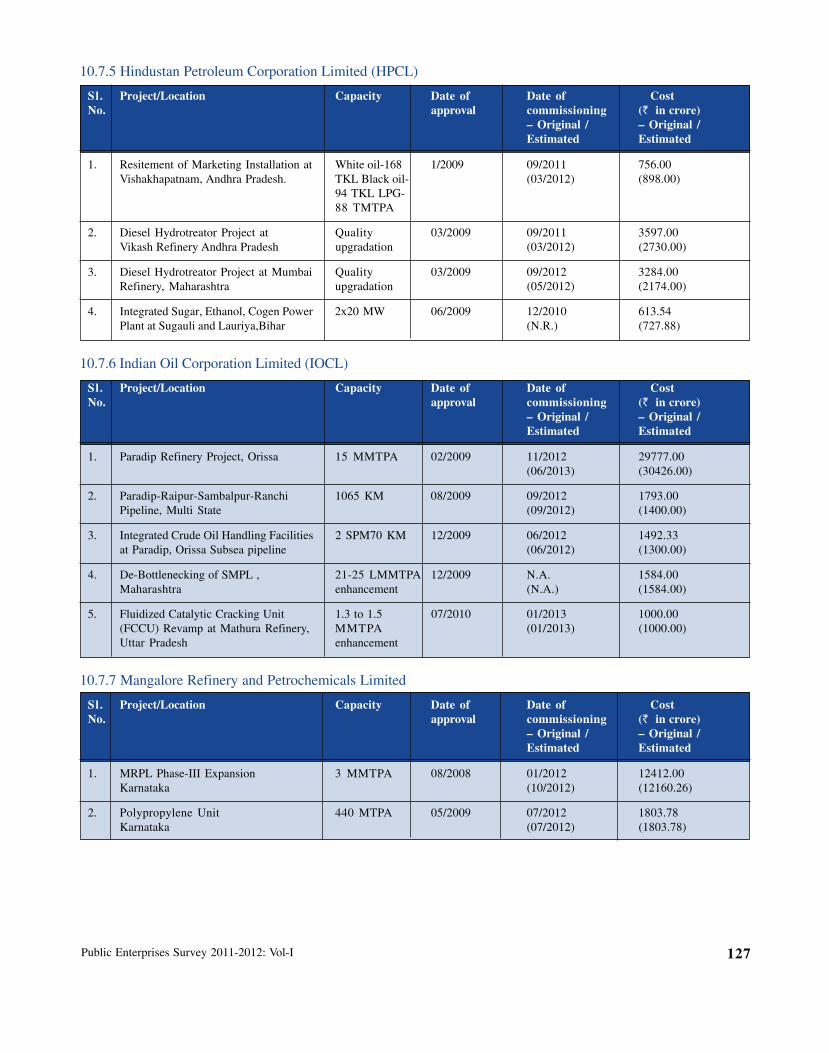
Public Enterprises Survey 2011-2012: Vol-I 127
10.7.5 Hindustan Petroleum Corporation Limited (HPCL)
Sl. Project/Location Capacity Date of Date of CostNo. approval commissioning (` in crore)
– Original / – Original /Estimated Estimated
1. Resitement of Marketing Installation at White oil-168 1/2009 09/2011 756.00Vishakhapatnam, Andhra Pradesh. TKL Black oil- (03/2012) (898.00)
94 TKL LPG-88 TMTPA
2. Diesel Hydrotreator Project at Quality 03/2009 09/2011 3597.00Vikash Refinery Andhra Pradesh upgradation (03/2012) (2730.00)
3. Diesel Hydrotreator Project at Mumbai Quality 03/2009 09/2012 3284.00Refinery, Maharashtra upgradation (05/2012) (2174.00)
4. Integrated Sugar, Ethanol, Cogen Power 2x20 MW 06/2009 12/2010 613.54Plant at Sugauli and Lauriya,Bihar (N.R.) (727.88)
10.7.6 Indian Oil Corporation Limited (IOCL)
Sl. Project/Location Capacity Date of Date of CostNo. approval commissioning (` in crore)
– Original / – Original /Estimated Estimated
1. Paradip Refinery Project, Orissa 15 MMTPA 02/2009 11/2012 29777.00(06/2013) (30426.00)
2. Paradip-Raipur-Sambalpur-Ranchi 1065 KM 08/2009 09/2012 1793.00Pipeline, Multi State (09/2012) (1400.00)
3. Integrated Crude Oil Handling Facilities 2 SPM70 KM 12/2009 06/2012 1492.33at Paradip, Orissa Subsea pipeline (06/2012) (1300.00)
4. De-Bottlenecking of SMPL , 21-25 LMMTPA 12/2009 N.A. 1584.00Maharashtra enhancement (N.A.) (1584.00)
5. Fluidized Catalytic Cracking Unit 1.3 to 1.5 07/2010 01/2013 1000.00(FCCU) Revamp at Mathura Refinery, MMTPA (01/2013) (1000.00)Uttar Pradesh enhancement
10.7.7 Mangalore Refinery and Petrochemicals Limited
Sl. Project/Location Capacity Date of Date of CostNo. approval commissioning (` in crore)
– Original / – Original /Estimated Estimated
1. MRPL Phase-III Expansion 3 MMTPA 08/2008 01/2012 12412.00Karnataka (10/2012) (12160.26)
2. Polypropylene Unit 440 MTPA 05/2009 07/2012 1803.78Karnataka (07/2012) (1803.78)
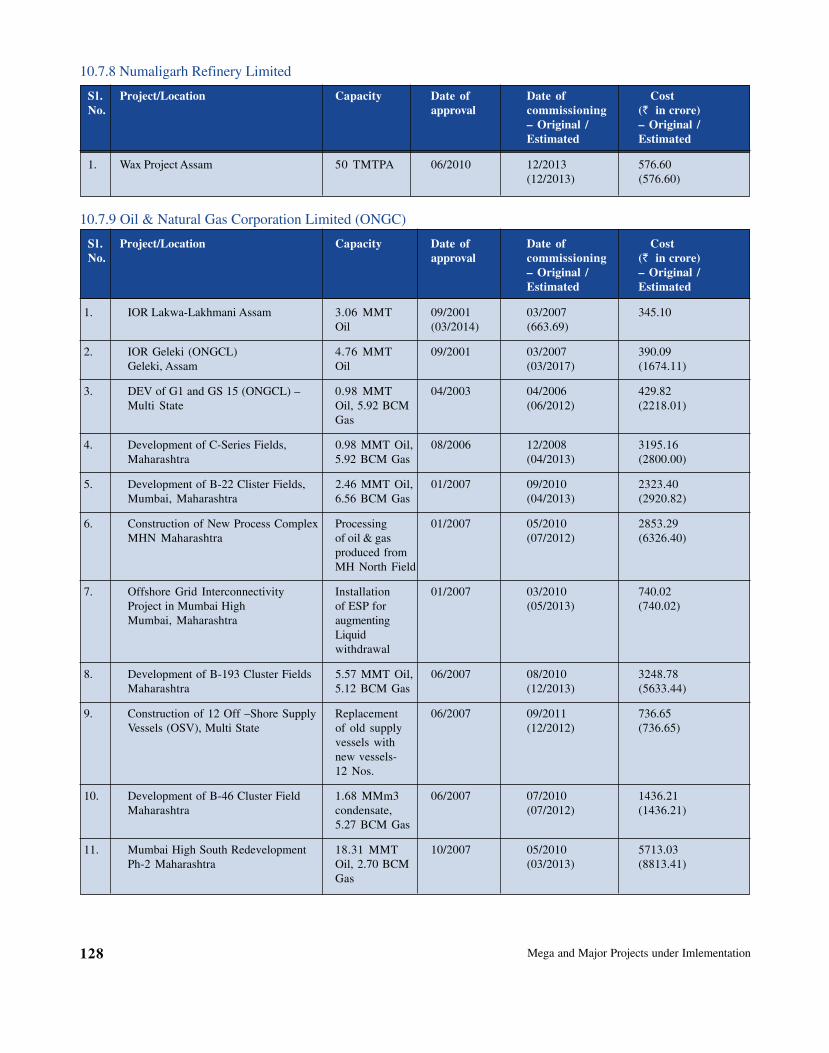
Mega and Major Projects under Imlementation128
10.7.8 Numaligarh Refinery Limited
Sl. Project/Location Capacity Date of Date of CostNo. approval commissioning (` in crore)
– Original / – Original /Estimated Estimated
1. Wax Project Assam 50 TMTPA 06/2010 12/2013 576.60(12/2013) (576.60)
10.7.9 Oil & Natural Gas Corporation Limited (ONGC)
Sl. Project/Location Capacity Date of Date of CostNo. approval commissioning (` in crore)
– Original / – Original /Estimated Estimated
1. IOR Lakwa-Lakhmani Assam 3.06 MMT 09/2001 03/2007 345.10Oil (03/2014) (663.69)
2. IOR Geleki (ONGCL) 4.76 MMT 09/2001 03/2007 390.09Geleki, Assam Oil (03/2017) (1674.11)
3. DEV of G1 and GS 15 (ONGCL) – 0.98 MMT 04/2003 04/2006 429.82Multi State Oil, 5.92 BCM (06/2012) (2218.01)
Gas
4. Development of C-Series Fields, 0.98 MMT Oil, 08/2006 12/2008 3195.16Maharashtra 5.92 BCM Gas (04/2013) (2800.00)
5. Development of B-22 Clister Fields, 2.46 MMT Oil, 01/2007 09/2010 2323.40Mumbai, Maharashtra 6.56 BCM Gas (04/2013) (2920.82)
6. Construction of New Process Complex Processing 01/2007 05/2010 2853.29MHN Maharashtra of oil & gas (07/2012) (6326.40)
produced fromMH North Field
7. Offshore Grid Interconnectivity Installation 01/2007 03/2010 740.02Project in Mumbai High of ESP for (05/2013) (740.02)Mumbai, Maharashtra augmenting
Liquidwithdrawal
8. Development of B-193 Cluster Fields 5.57 MMT Oil, 06/2007 08/2010 3248.78Maharashtra 5.12 BCM Gas (12/2013) (5633.44)
9. Construction of 12 Off –Shore Supply Replacement 06/2007 09/2011 736.65Vessels (OSV), Multi State of old supply (12/2012) (736.65)
vessels withnew vessels-12 Nos.
10. Development of B-46 Cluster Field 1.68 MMm3 06/2007 07/2010 1436.21Maharashtra condensate, (07/2012) (1436.21)
5.27 BCM Gas
11. Mumbai High South Redevelopment 18.31 MMT 10/2007 05/2010 5713.03Ph-2 Maharashtra Oil, 2.70 BCM (03/2013) (8813.41)
Gas
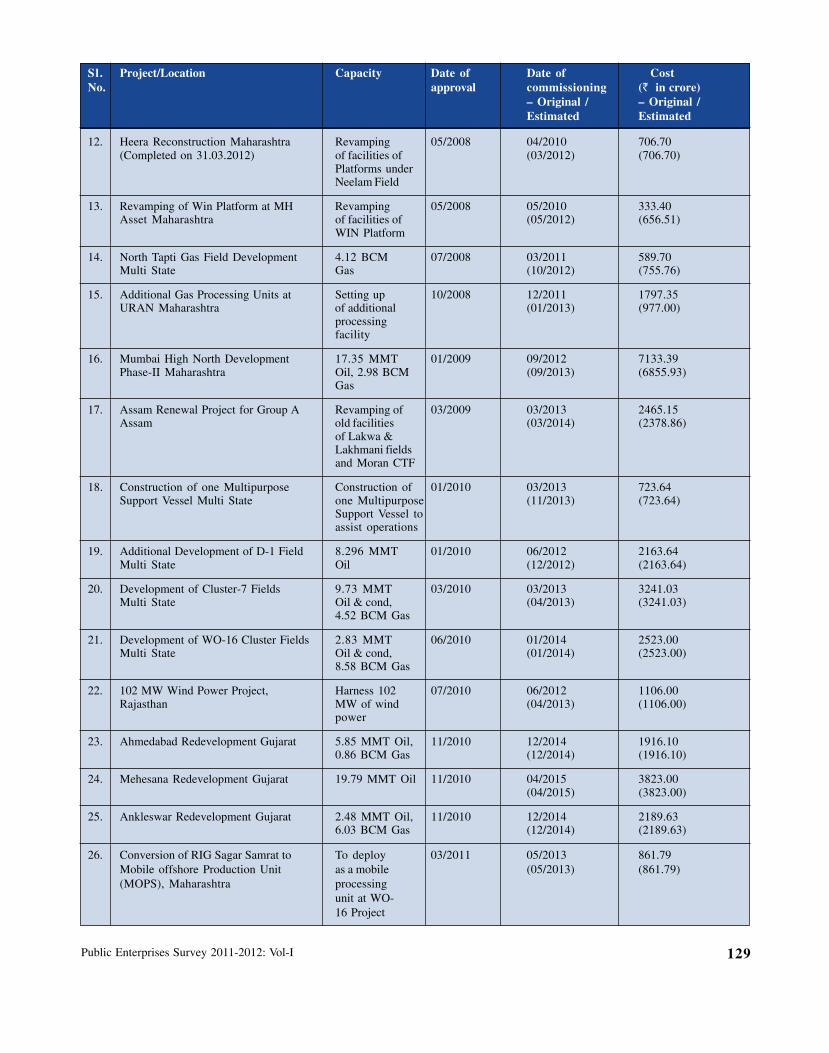
Public Enterprises Survey 2011-2012: Vol-I 129
Sl. Project/Location Capacity Date of Date of CostNo. approval commissioning (` in crore)
– Original / – Original /Estimated Estimated
12. Heera Reconstruction Maharashtra Revamping 05/2008 04/2010 706.70(Completed on 31.03.2012) of facilities of (03/2012) (706.70)
Platforms underNeelam Field
13. Revamping of Win Platform at MH Revamping 05/2008 05/2010 333.40Asset Maharashtra of facilities of (05/2012) (656.51)
WIN Platform
14. North Tapti Gas Field Development 4.12 BCM 07/2008 03/2011 589.70Multi State Gas (10/2012) (755.76)
15. Additional Gas Processing Units at Setting up 10/2008 12/2011 1797.35URAN Maharashtra of additional (01/2013) (977.00)
processingfacility
16. Mumbai High North Development 17.35 MMT 01/2009 09/2012 7133.39Phase-II Maharashtra Oil, 2.98 BCM (09/2013) (6855.93)
Gas
17. Assam Renewal Project for Group A Revamping of 03/2009 03/2013 2465.15Assam old facilities (03/2014) (2378.86)
of Lakwa &Lakhmani fieldsand Moran CTF
18. Construction of one Multipurpose Construction of 01/2010 03/2013 723.64Support Vessel Multi State one Multipurpose (11/2013) (723.64)
Support Vessel toassist operations
19. Additional Development of D-1 Field 8.296 MMT 01/2010 06/2012 2163.64Multi State Oil (12/2012) (2163.64)
20. Development of Cluster-7 Fields 9.73 MMT 03/2010 03/2013 3241.03Multi State Oil & cond, (04/2013) (3241.03)
4.52 BCM Gas
21. Development of WO-16 Cluster Fields 2.83 MMT 06/2010 01/2014 2523.00Multi State Oil & cond, (01/2014) (2523.00)
8.58 BCM Gas
22. 102 MW Wind Power Project, Harness 102 07/2010 06/2012 1106.00Rajasthan MW of wind (04/2013) (1106.00)
power
23. Ahmedabad Redevelopment Gujarat 5.85 MMT Oil, 11/2010 12/2014 1916.100.86 BCM Gas (12/2014) (1916.10)
24. Mehesana Redevelopment Gujarat 19.79 MMT Oil 11/2010 04/2015 3823.00(04/2015) (3823.00)
25. Ankleswar Redevelopment Gujarat 2.48 MMT Oil, 11/2010 12/2014 2189.636.03 BCM Gas (12/2014) (2189.63)
26. Conversion of RIG Sagar Samrat to To deploy 03/2011 05/2013 861.79Mobile offshore Production Unit as a mobile (05/2013) (861.79)(MOPS), Maharashtra processing
unit at WO-16 Project
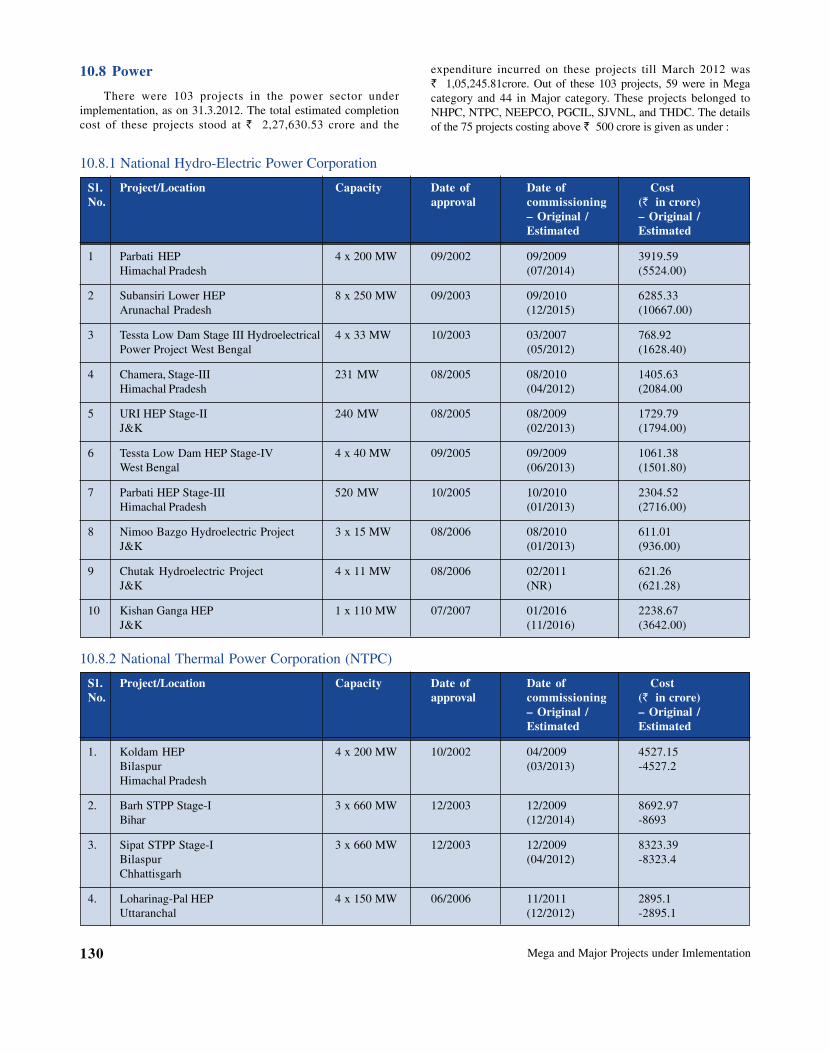
Mega and Major Projects under Imlementation130
10.8 Power
There were 103 projects in the power sector underimplementation, as on 31.3.2012. The total estimated completioncost of these projects stood at ` 2,27,630.53 crore and the
expenditure incurred on these projects till March 2012 was` 1,05,245.81crore. Out of these 103 projects, 59 were in Megacategory and 44 in Major category. These projects belonged toNHPC, NTPC, NEEPCO, PGCIL, SJVNL, and THDC. The detailsof the 75 projects costing above ` 500 crore is given as under :
10.8.1 National Hydro-Electric Power Corporation
Sl. Project/Location Capacity Date of Date of CostNo. approval commissioning (` in crore)
– Original / – Original /Estimated Estimated
1 Parbati HEP 4 x 200 MW 09/2002 09/2009 3919.59Himachal Pradesh (07/2014) (5524.00)
2 Subansiri Lower HEP 8 x 250 MW 09/2003 09/2010 6285.33Arunachal Pradesh (12/2015) (10667.00)
3 Tessta Low Dam Stage III Hydroelectrical 4 x 33 MW 10/2003 03/2007 768.92Power Project West Bengal (05/2012) (1628.40)
4 Chamera, Stage-III 231 MW 08/2005 08/2010 1405.63Himachal Pradesh (04/2012) (2084.00
5 URI HEP Stage-II 240 MW 08/2005 08/2009 1729.79J&K (02/2013) (1794.00)
6 Tessta Low Dam HEP Stage-IV 4 x 40 MW 09/2005 09/2009 1061.38West Bengal (06/2013) (1501.80)
7 Parbati HEP Stage-III 520 MW 10/2005 10/2010 2304.52Himachal Pradesh (01/2013) (2716.00)
8 Nimoo Bazgo Hydroelectric Project 3 x 15 MW 08/2006 08/2010 611.01J&K (01/2013) (936.00)
9 Chutak Hydroelectric Project 4 x 11 MW 08/2006 02/2011 621.26J&K (NR) (621.28)
10 Kishan Ganga HEP 1 x 110 MW 07/2007 01/2016 2238.67J&K (11/2016) (3642.00)
10.8.2 National Thermal Power Corporation (NTPC)
Sl. Project/Location Capacity Date of Date of CostNo. approval commissioning (` in crore)
– Original / – Original /Estimated Estimated
1. Koldam HEP 4 x 200 MW 10/2002 04/2009 4527.15Bilaspur (03/2013) -4527.2Himachal Pradesh
2. Barh STPP Stage-I 3 x 660 MW 12/2003 12/2009 8692.97Bihar (12/2014) -8693
3. Sipat STPP Stage-I 3 x 660 MW 12/2003 12/2009 8323.39Bilaspur (04/2012) -8323.4Chhattisgarh
4. Loharinag-Pal HEP 4 x 150 MW 06/2006 11/2011 2895.1Uttaranchal (12/2012) -2895.1

Public Enterprises Survey 2011-2012: Vol-I 131
Sl. Project/Location Capacity Date of Date of CostNo. approval commissioning (` in crore)
– Original / – Original /Estimated Estimated
5. Tapovan-Vishnugad HEP 4 x 130 MW 11/2006 03/2013 2978.48Uttaranchal (06/2014) -2978.5
6. Simhadri STPP Stage-II 2x500 MW 08/2007 NA 5103.39Andhra Pradesh (03/2012) -5038.8
7. Bongaigaon Thermal Power Project 3x250 MW 01/2008 NA 4375.35Assam (11/2014) -4375.4
8. Barh STPP Stage-II 2x660 MW 02/2008 NA 7341.04Bihar (01/2014) -7341
9. Mouda STPP, 2 x 500 MW 11/2008 08/2012 5459.28Maharashtra (03/2013) -6010.9
10. Vindhyachal STTP Stage-IV 2 x 500 MW 01/2009 10/2012 5915Madhya Pradesh (03/2013) -5915
11. Rihand STTP Stage-III 5 x 500 MW 01/2009 10/2012 6230.81Uttar Pradesh (03/2013) -6230.8
10.8.3 North East Electric Power Corporation
Sl. Project/Location Capacity Date of Date of CostNo. approval commissioning (` in crore)
– Original / – Original /Estimated Estimated
1. Tuirial HE Project 2 X 30 MW 07/1998 07/2006 368.72Aizwal (01/2014) -913.63Mizoram
2. Kameng Hydroelectric Project 4 x 150 MW 12/2004 05/2013 2496.9West Kameng (06/2016) -2496.Arunachal Pradesh
3. Pare Hydro Electric Project 2 x 55 MW 12/2008 08/2012 573.99Papum Pare (08/2013) -573.99Arunachal Pradesh
4. Tripura Gas Based Power Project 100 MW 07/2009 NA 421.01Tripura (07/2013) -623.44
5. Tuirial Hydro Electric Project, 60 MW 01/2011 Jan-14 913.Mizoram (01/2014) -913.63
10.8.4 Power Grid Corporation of India Limited
Sl. Project/Location Capacity Date of Date of CostNo. approval commissioning (` in crore)
– Original / – Original /Estimated Estimated
1. Kaiga 3 and 4 Transmission system 759 CKM 03/2005 12/2007 596.45Karnataka (Uncertain) (1007.16)
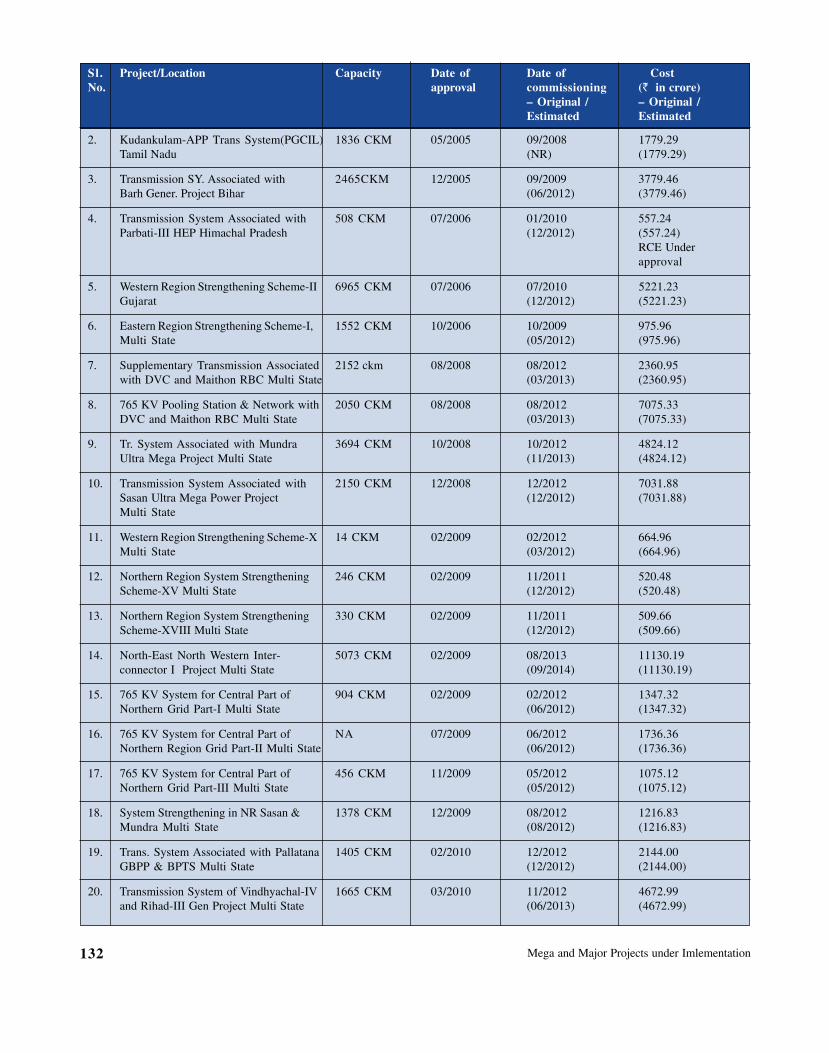
Mega and Major Projects under Imlementation132
2. Kudankulam-APP Trans System(PGCIL) 1836 CKM 05/2005 09/2008 1779.29Tamil Nadu (NR) (1779.29)
3. Transmission SY. Associated with 2465CKM 12/2005 09/2009 3779.46Barh Gener. Project Bihar (06/2012) (3779.46)
4. Transmission System Associated with 508 CKM 07/2006 01/2010 557.24Parbati-III HEP Himachal Pradesh (12/2012) (557.24)
RCE Underapproval
5. Western Region Strengthening Scheme-II 6965 CKM 07/2006 07/2010 5221.23Gujarat (12/2012) (5221.23)
6. Eastern Region Strengthening Scheme-I, 1552 CKM 10/2006 10/2009 975.96Multi State (05/2012) (975.96)
7. Supplementary Transmission Associated 2152 ckm 08/2008 08/2012 2360.95with DVC and Maithon RBC Multi State (03/2013) (2360.95)
8. 765 KV Pooling Station & Network with 2050 CKM 08/2008 08/2012 7075.33DVC and Maithon RBC Multi State (03/2013) (7075.33)
9. Tr. System Associated with Mundra 3694 CKM 10/2008 10/2012 4824.12Ultra Mega Project Multi State (11/2013) (4824.12)
10. Transmission System Associated with 2150 CKM 12/2008 12/2012 7031.88Sasan Ultra Mega Power Project (12/2012) (7031.88)Multi State
11. Western Region Strengthening Scheme-X 14 CKM 02/2009 02/2012 664.96Multi State (03/2012) (664.96)
12. Northern Region System Strengthening 246 CKM 02/2009 11/2011 520.48Scheme-XV Multi State (12/2012) (520.48)
13. Northern Region System Strengthening 330 CKM 02/2009 11/2011 509.66Scheme-XVIII Multi State (12/2012) (509.66)
14. North-East North Western Inter- 5073 CKM 02/2009 08/2013 11130.19connector I Project Multi State (09/2014) (11130.19)
15. 765 KV System for Central Part of 904 CKM 02/2009 02/2012 1347.32Northern Grid Part-I Multi State (06/2012) (1347.32)
16. 765 KV System for Central Part of NA 07/2009 06/2012 1736.36Northern Region Grid Part-II Multi State (06/2012) (1736.36)
17. 765 KV System for Central Part of 456 CKM 11/2009 05/2012 1075.12Northern Grid Part-III Multi State (05/2012) (1075.12)
18. System Strengthening in NR Sasan & 1378 CKM 12/2009 08/2012 1216.83Mundra Multi State (08/2012) (1216.83)
19. Trans. System Associated with Pallatana 1405 CKM 02/2010 12/2012 2144.00GBPP & BPTS Multi State (12/2012) (2144.00)
20. Transmission System of Vindhyachal-IV 1665 CKM 03/2010 11/2012 4672.99and Rihad-III Gen Project Multi State (06/2013) (4672.99)
Sl. Project/Location Capacity Date of Date of CostNo. approval commissioning (` in crore)
– Original / – Original /Estimated Estimated
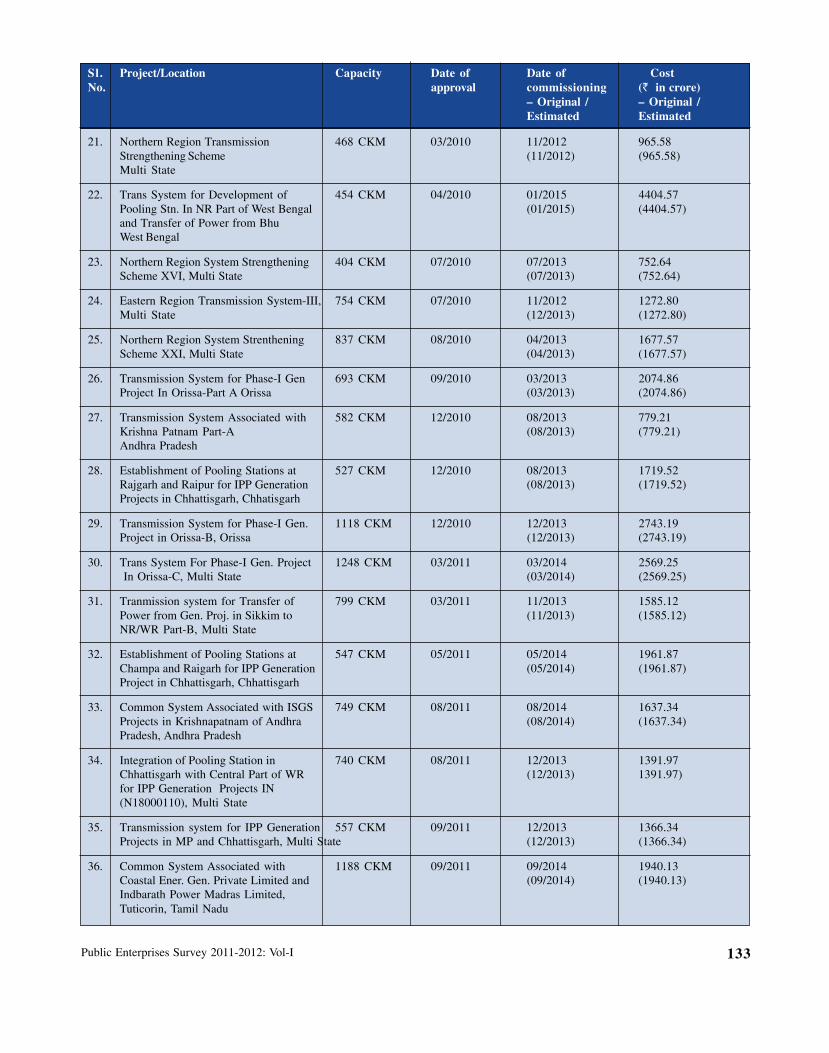
Public Enterprises Survey 2011-2012: Vol-I 133
21. Northern Region Transmission 468 CKM 03/2010 11/2012 965.58Strengthening Scheme (11/2012) (965.58)Multi State
22. Trans System for Development of 454 CKM 04/2010 01/2015 4404.57Pooling Stn. In NR Part of West Bengal (01/2015) (4404.57)and Transfer of Power from BhuWest Bengal
23. Northern Region System Strengthening 404 CKM 07/2010 07/2013 752.64Scheme XVI, Multi State (07/2013) (752.64)
24. Eastern Region Transmission System-III, 754 CKM 07/2010 11/2012 1272.80Multi State (12/2013) (1272.80)
25. Northern Region System Strenthening 837 CKM 08/2010 04/2013 1677.57Scheme XXI, Multi State (04/2013) (1677.57)
26. Transmission System for Phase-I Gen 693 CKM 09/2010 03/2013 2074.86Project In Orissa-Part A Orissa (03/2013) (2074.86)
27. Transmission System Associated with 582 CKM 12/2010 08/2013 779.21Krishna Patnam Part-A (08/2013) (779.21)Andhra Pradesh
28. Establishment of Pooling Stations at 527 CKM 12/2010 08/2013 1719.52Rajgarh and Raipur for IPP Generation (08/2013) (1719.52)Projects in Chhattisgarh, Chhatisgarh
29. Transmission System for Phase-I Gen. 1118 CKM 12/2010 12/2013 2743.19Project in Orissa-B, Orissa (12/2013) (2743.19)
30. Trans System For Phase-I Gen. Project 1248 CKM 03/2011 03/2014 2569.25 In Orissa-C, Multi State (03/2014) (2569.25)
31. Tranmission system for Transfer of 799 CKM 03/2011 11/2013 1585.12Power from Gen. Proj. in Sikkim to (11/2013) (1585.12)NR/WR Part-B, Multi State
32. Establishment of Pooling Stations at 547 CKM 05/2011 05/2014 1961.87Champa and Raigarh for IPP Generation (05/2014) (1961.87)Project in Chhattisgarh, Chhattisgarh
33. Common System Associated with ISGS 749 CKM 08/2011 08/2014 1637.34Projects in Krishnapatnam of Andhra (08/2014) (1637.34)Pradesh, Andhra Pradesh
34. Integration of Pooling Station in 740 CKM 08/2011 12/2013 1391.97Chhattisgarh with Central Part of WR (12/2013) 1391.97)for IPP Generation Projects IN(N18000110), Multi State
35. Transmission system for IPP Generation 557 CKM 09/2011 12/2013 1366.34Projects in MP and Chhattisgarh, Multi State (12/2013) (1366.34)
36. Common System Associated with 1188 CKM 09/2011 09/2014 1940.13Coastal Ener. Gen. Private Limited and (09/2014) (1940.13)Indbarath Power Madras Limited,Tuticorin, Tamil Nadu
Sl. Project/Location Capacity Date of Date of CostNo. approval commissioning (` in crore)
– Original / – Original /Estimated Estimated
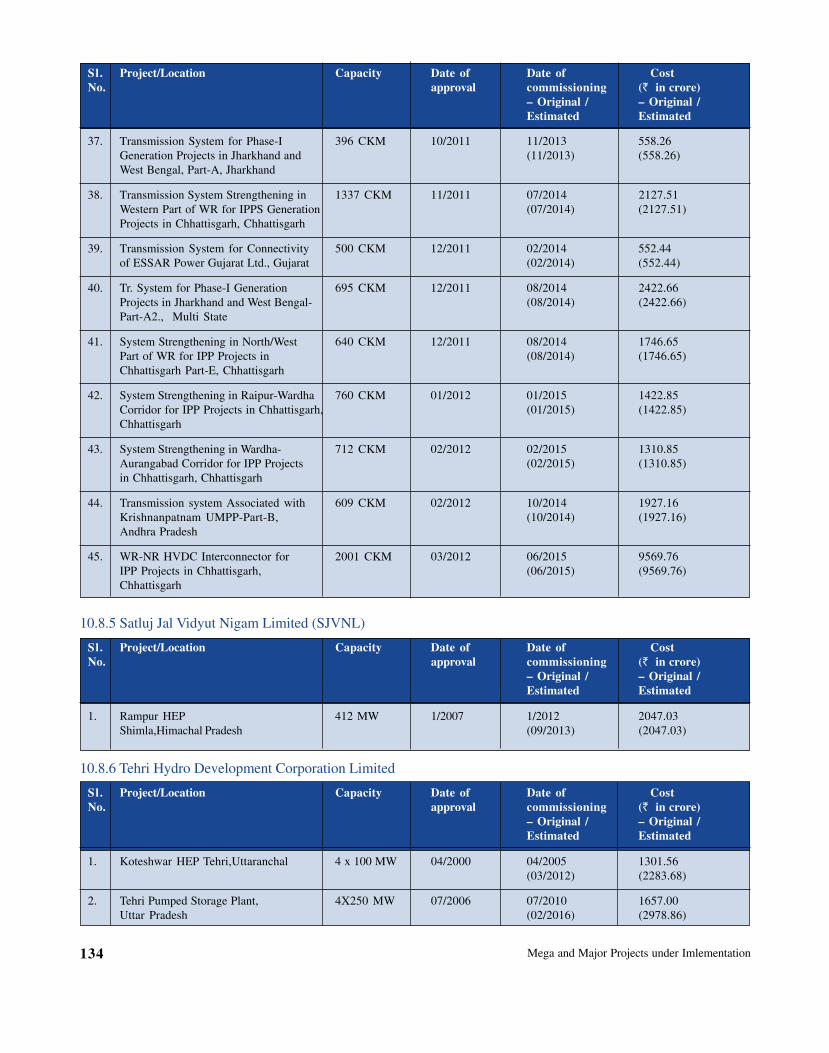
Mega and Major Projects under Imlementation134
37. Transmission System for Phase-I 396 CKM 10/2011 11/2013 558.26Generation Projects in Jharkhand and (11/2013) (558.26)West Bengal, Part-A, Jharkhand
38. Transmission System Strengthening in 1337 CKM 11/2011 07/2014 2127.51Western Part of WR for IPPS Generation (07/2014) (2127.51)Projects in Chhattisgarh, Chhattisgarh
39. Transmission System for Connectivity 500 CKM 12/2011 02/2014 552.44of ESSAR Power Gujarat Ltd., Gujarat (02/2014) (552.44)
40. Tr. System for Phase-I Generation 695 CKM 12/2011 08/2014 2422.66Projects in Jharkhand and West Bengal- (08/2014) (2422.66)Part-A2., Multi State
41. System Strengthening in North/West 640 CKM 12/2011 08/2014 1746.65Part of WR for IPP Projects in (08/2014) (1746.65)Chhattisgarh Part-E, Chhattisgarh
42. System Strengthening in Raipur-Wardha 760 CKM 01/2012 01/2015 1422.85Corridor for IPP Projects in Chhattisgarh, (01/2015) (1422.85)Chhattisgarh
43. System Strengthening in Wardha- 712 CKM 02/2012 02/2015 1310.85Aurangabad Corridor for IPP Projects (02/2015) (1310.85)in Chhattisgarh, Chhattisgarh
44. Transmission system Associated with 609 CKM 02/2012 10/2014 1927.16Krishnanpatnam UMPP-Part-B, (10/2014) (1927.16)Andhra Pradesh
45. WR-NR HVDC Interconnector for 2001 CKM 03/2012 06/2015 9569.76IPP Projects in Chhattisgarh, (06/2015) (9569.76)Chhattisgarh
10.8.5 Satluj Jal Vidyut Nigam Limited (SJVNL)
Sl. Project/Location Capacity Date of Date of CostNo. approval commissioning (` in crore)
– Original / – Original /Estimated Estimated
1. Rampur HEP 412 MW 1/2007 1/2012 2047.03Shimla,Himachal Pradesh (09/2013) (2047.03)
10.8.6 Tehri Hydro Development Corporation Limited
Sl. Project/Location Capacity Date of Date of CostNo. approval commissioning (` in crore)
– Original / – Original /Estimated Estimated
1. Koteshwar HEP Tehri,Uttaranchal 4 x 100 MW 04/2000 04/2005 1301.56(03/2012) (2283.68)
2. Tehri Pumped Storage Plant, 4X250 MW 07/2006 07/2010 1657.00Uttar Pradesh (02/2016) (2978.86)
Sl. Project/Location Capacity Date of Date of CostNo. approval commissioning (` in crore)
– Original / – Original /Estimated Estimated

Public Enterprises Survey 2011-2012: Vol-I 135
3. Vishnugad Pipalkoti Hydroelectric 4X111 MW 08/2008 07/2014 2491.58Project Uttaranchal (05/2016) (3422.44)
Sl. Project/Location Capacity Date of Date of CostNo. approval commissioning (` in crore)
– Original / – Original /Estimated Estimated
10.9 Shipping & Ports
There were 26 projects in the Shipping & Ports sectorunder implementation, as on 31.3.2012. The total estimatedcompletion cost of these projects stood at ` 19858.90 croreand the expenditure incurred on these projects till March 2012
was ` 5264.48 crore. Out of these 26 projects, 6 were inMega category and 20 in Major category. These projectsbelonged to Ennore Port Ltd., RVNL and SCI. The details ofthe 5 projects of Shipping Corporation of India whose costingabove ` 500 crore is given as under :
10.9.1 Shipping Corporation of India (SCI)
Sl. Project/Location Capacity Date of Date of CostNo. approval commissioning (` in crore)
– Original / – Original /Estimated Estimated
1. Acquisition of 6 Nos. of 57000 DWT 6 x 57000 DWT 11/2007 03/2012 1061.96Handymax Bulk Carriers Mumbai (04/2012) (1082.06)Maharashtra
2. Acquisition of 4 Nos. of 80655 DWT 4 x 80665 DWT 08/2008 09/2012 1066.91Panamax Bulk Carriers Mumbai (09/2012) (968.35)Maharashtra
3. Acquisition of 4 Nos. of 82000 DWT 4X82000 DWT 08/2010 12/2012 612.72Kamsavmax Bulk Carriers from (12/2012) (627.64)M/s Jiangsu Eastern Heavy IndustriesMaharashtra
4. Acquisition of Two(2) Nos. of 317000 2X317000 DWT 10/2010 02/2014 966.46DWT Very Large Crude Carriers from (02/2014) (994.82)M/s. Jiangsu Rongsheng HeavyMaharashtra
5. Acquisition of Three (3) Nos. of 6500 3X6500 TEU 10/2010 12/2013 1028.10TEU Cellular Container Vessels from (12/2013) (1028.10)M/s. STX Ship Building Co. Ltd.Maharashtra
10.10 Telecommunication
There were 22 projects in the Shipping & Ports sector underimplementation, as on 31.3.2012. The total estimated completioncost of these projects stood at ` 11910.44 crore and the
expenditure incurred on these projects till March 2012 was` 3901.72 crore. Out of these 22 projects, 2 were in Mega categoryand 20 in Major category. These projects belonged to BSNL,MTNL. The details of the 7 projects costing above ` 500 croreare given as under:
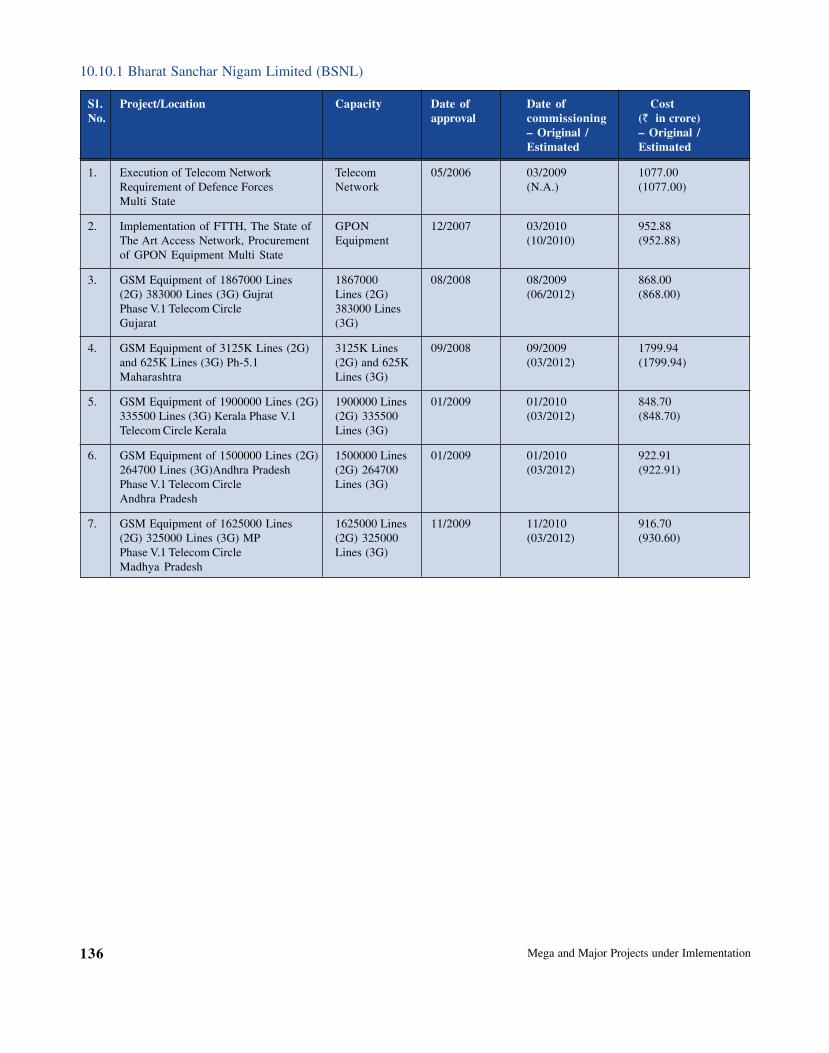
Mega and Major Projects under Imlementation136
10.10.1 Bharat Sanchar Nigam Limited (BSNL)
Sl. Project/Location Capacity Date of Date of CostNo. approval commissioning (` in crore)
– Original / – Original /Estimated Estimated
1. Execution of Telecom Network Telecom 05/2006 03/2009 1077.00Requirement of Defence Forces Network (N.A.) (1077.00)Multi State
2. Implementation of FTTH, The State of GPON 12/2007 03/2010 952.88The Art Access Network, Procurement Equipment (10/2010) (952.88)of GPON Equipment Multi State
3. GSM Equipment of 1867000 Lines 1867000 08/2008 08/2009 868.00(2G) 383000 Lines (3G) Gujrat Lines (2G) (06/2012) (868.00)Phase V.1 Telecom Circle 383000 LinesGujarat (3G)
4. GSM Equipment of 3125K Lines (2G) 3125K Lines 09/2008 09/2009 1799.94and 625K Lines (3G) Ph-5.1 (2G) and 625K (03/2012) (1799.94)Maharashtra Lines (3G)
5. GSM Equipment of 1900000 Lines (2G) 1900000 Lines 01/2009 01/2010 848.70335500 Lines (3G) Kerala Phase V.1 (2G) 335500 (03/2012) (848.70)Telecom Circle Kerala Lines (3G)
6. GSM Equipment of 1500000 Lines (2G) 1500000 Lines 01/2009 01/2010 922.91264700 Lines (3G)Andhra Pradesh (2G) 264700 (03/2012) (922.91)Phase V.1 Telecom Circle Lines (3G)Andhra Pradesh
7. GSM Equipment of 1625000 Lines 1625000 Lines 11/2009 11/2010 916.70(2G) 325000 Lines (3G) MP (2G) 325000 (03/2012) (930.60)Phase V.1 Telecom Circle Lines (3G)Madhya Pradesh
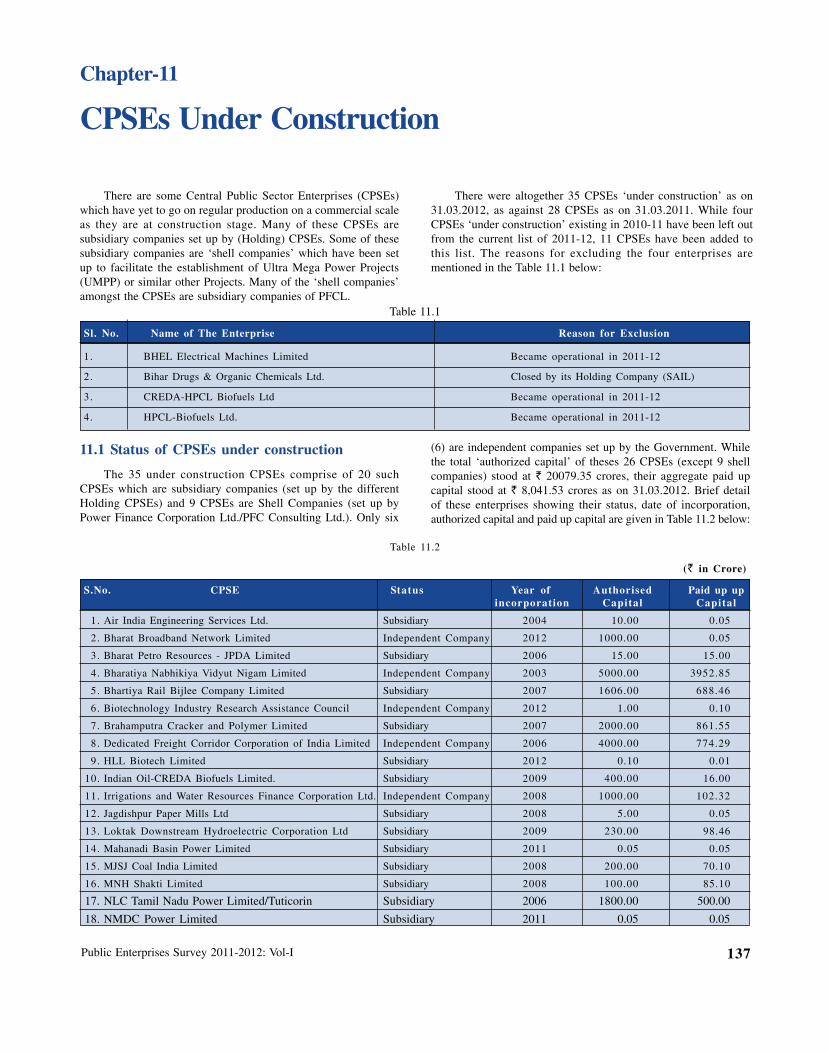
Public Enterprises Survey 2011-2012: Vol-I 137
CPSEs Under Construction
Chapter-11
There are some Central Public Sector Enterprises (CPSEs)which have yet to go on regular production on a commercial scaleas they are at construction stage. Many of these CPSEs aresubsidiary companies set up by (Holding) CPSEs. Some of thesesubsidiary companies are ‘shell companies’ which have been setup to facilitate the establishment of Ultra Mega Power Projects(UMPP) or similar other Projects. Many of the ‘shell companies’amongst the CPSEs are subsidiary companies of PFCL.
11.1 Status of CPSEs under construction
The 35 under construction CPSEs comprise of 20 suchCPSEs which are subsidiary companies (set up by the differentHolding CPSEs) and 9 CPSEs are Shell Companies (set up byPower Finance Corporation Ltd./PFC Consulting Ltd.). Only six
Table 11.1
Sl. No. Name of The Enterprise Reason for Exclusion
1. BHEL Electrical Machines Limited Became operational in 2011-12
2. Bihar Drugs & Organic Chemicals Ltd. Closed by its Holding Company (SAIL)
3. CREDA-HPCL Biofuels Ltd Became operational in 2011-12
4. HPCL-Biofuels Ltd. Became operational in 2011-12
Table 11.2
(` in Crore)
S.No. CPSE Status Year of Authorised Paid up upincorporation Capital Capital
1. Air India Engineering Services Ltd. Subsidiary 2004 10.00 0.05
2. Bharat Broadband Network Limited Independent Company 2012 1000.00 0.05
3. Bharat Petro Resources - JPDA Limited Subsidiary 2006 15.00 15.00
4. Bharatiya Nabhikiya Vidyut Nigam Limited Independent Company 2003 5000.00 3952.85
5. Bhartiya Rail Bijlee Company Limited Subsidiary 2007 1606.00 688.46
6. Biotechnology Industry Research Assistance Council Independent Company 2012 1.00 0.10
7. Brahamputra Cracker and Polymer Limited Subsidiary 2007 2000.00 861.55
8. Dedicated Freight Corridor Corporation of India Limited Independent Company 2006 4000.00 774.29
9. HLL Biotech Limited Subsidiary 2012 0.10 0.01
10. Indian Oil-CREDA Biofuels Limited. Subsidiary 2009 400.00 16.00
11. Irrigations and Water Resources Finance Corporation Ltd. Independent Company 2008 1000.00 102.32
12. Jagdishpur Paper Mills Ltd Subsidiary 2008 5.00 0.05
13. Loktak Downstream Hydroelectric Corporation Ltd Subsidiary 2009 230.00 98.46
14. Mahanadi Basin Power Limited Subsidiary 2011 0.05 0.05
15. MJSJ Coal India Limited Subsidiary 2008 200.00 70.10
16. MNH Shakti Limited Subsidiary 2008 100.00 85.10
17. NLC Tamil Nadu Power Limited/Tuticorin Subsidiary 2006 1800.00 500.00
18. NMDC Power Limited Subsidiary 2011 0.05 0.05
There were altogether 35 CPSEs ‘under construction’ as on31.03.2012, as against 28 CPSEs as on 31.03.2011. While fourCPSEs ‘under construction’ existing in 2010-11 have been left outfrom the current list of 2011-12, 11 CPSEs have been added tothis list. The reasons for excluding the four enterprises arementioned in the Table 11.1 below:
(6) are independent companies set up by the Government. Whilethe total ‘authorized capital’ of theses 26 CPSEs (except 9 shellcompanies) stood at ` 20079.35 crores, their aggregate paid upcapital stood at ` 8,041.53 crores as on 31.03.2012. Brief detailof these enterprises showing their status, date of incorporation,authorized capital and paid up capital are given in Table 11.2 below:
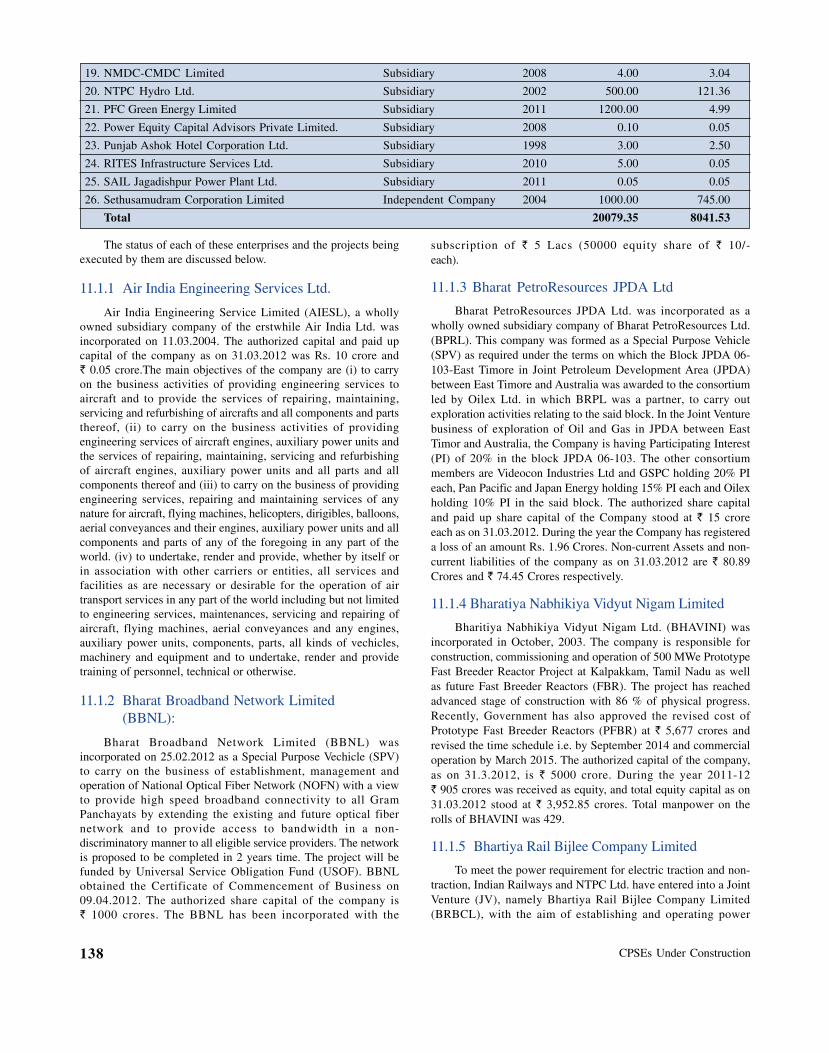
CPSEs Under Construction138
19. NMDC-CMDC Limited Subsidiary 2008 4.00 3.04
20. NTPC Hydro Ltd. Subsidiary 2002 500.00 121.36
21. PFC Green Energy Limited Subsidiary 2011 1200.00 4.99
22. Power Equity Capital Advisors Private Limited. Subsidiary 2008 0.10 0.05
23. Punjab Ashok Hotel Corporation Ltd. Subsidiary 1998 3.00 2.50
24. RITES Infrastructure Services Ltd. Subsidiary 2010 5.00 0.05
25. SAIL Jagadishpur Power Plant Ltd. Subsidiary 2011 0.05 0.05
26. Sethusamudram Corporation Limited Independent Company 2004 1000.00 745.00
Total 20079.35 8041.53
The status of each of these enterprises and the projects beingexecuted by them are discussed below.
11.1.1 Air India Engineering Services Ltd.
Air India Engineering Service Limited (AIESL), a whollyowned subsidiary company of the erstwhile Air India Ltd. wasincorporated on 11.03.2004. The authorized capital and paid upcapital of the company as on 31.03.2012 was Rs. 10 crore and` 0.05 crore.The main objectives of the company are (i) to carryon the business activities of providing engineering services toaircraft and to provide the services of repairing, maintaining,servicing and refurbishing of aircrafts and all components and partsthereof, (ii) to carry on the business activities of providingengineering services of aircraft engines, auxiliary power units andthe services of repairing, maintaining, servicing and refurbishingof aircraft engines, auxiliary power units and all parts and allcomponents thereof and (iii) to carry on the business of providingengineering services, repairing and maintaining services of anynature for aircraft, flying machines, helicopters, dirigibles, balloons,aerial conveyances and their engines, auxiliary power units and allcomponents and parts of any of the foregoing in any part of theworld. (iv) to undertake, render and provide, whether by itself orin association with other carriers or entities, all services andfacilities as are necessary or desirable for the operation of airtransport services in any part of the world including but not limitedto engineering services, maintenances, servicing and repairing ofaircraft, flying machines, aerial conveyances and any engines,auxiliary power units, components, parts, all kinds of vechicles,machinery and equipment and to undertake, render and providetraining of personnel, technical or otherwise.
11.1.2 Bharat Broadband Network Limited(BBNL):
Bharat Broadband Network Limited (BBNL) wasincorporated on 25.02.2012 as a Special Purpose Vechicle (SPV)to carry on the business of establishment, management andoperation of National Optical Fiber Network (NOFN) with a viewto provide high speed broadband connectivity to all GramPanchayats by extending the existing and future optical fibernetwork and to provide access to bandwidth in a non-discriminatory manner to all eligible service providers. The networkis proposed to be completed in 2 years time. The project will befunded by Universal Service Obligation Fund (USOF). BBNLobtained the Certificate of Commencement of Business on09.04.2012. The authorized share capital of the company is` 1000 crores. The BBNL has been incorporated with the
subscription of ` 5 Lacs (50000 equity share of ` 10/-each).
11.1.3 Bharat PetroResources JPDA Ltd
Bharat PetroResources JPDA Ltd. was incorporated as awholly owned subsidiary company of Bharat PetroResources Ltd.(BPRL). This company was formed as a Special Purpose Vehicle(SPV) as required under the terms on which the Block JPDA 06-103-East Timore in Joint Petroleum Development Area (JPDA)between East Timore and Australia was awarded to the consortiumled by Oilex Ltd. in which BRPL was a partner, to carry outexploration activities relating to the said block. In the Joint Venturebusiness of exploration of Oil and Gas in JPDA between EastTimor and Australia, the Company is having Participating Interest(PI) of 20% in the block JPDA 06-103. The other consortiummembers are Videocon Industries Ltd and GSPC holding 20% PIeach, Pan Pacific and Japan Energy holding 15% PI each and Oilexholding 10% PI in the said block. The authorized share capitaland paid up share capital of the Company stood at ` 15 croreeach as on 31.03.2012. During the year the Company has registereda loss of an amount Rs. 1.96 Crores. Non-current Assets and non-current liabilities of the company as on 31.03.2012 are ` 80.89Crores and ` 74.45 Crores respectively.
11.1.4 Bharatiya Nabhikiya Vidyut Nigam Limited
Bharitiya Nabhikiya Vidyut Nigam Ltd. (BHAVINI) wasincorporated in October, 2003. The company is responsible forconstruction, commissioning and operation of 500 MWe PrototypeFast Breeder Reactor Project at Kalpakkam, Tamil Nadu as wellas future Fast Breeder Reactors (FBR). The project has reachedadvanced stage of construction with 86 % of physical progress.Recently, Government has also approved the revised cost ofPrototype Fast Breeder Reactors (PFBR) at ` 5,677 crores andrevised the time schedule i.e. by September 2014 and commercialoperation by March 2015. The authorized capital of the company,as on 31.3.2012, is ` 5000 crore. During the year 2011-12` 905 crores was received as equity, and total equity capital as on31.03.2012 stood at ` 3,952.85 crores. Total manpower on therolls of BHAVINI was 429.
11.1.5 Bhartiya Rail Bijlee Company Limited
To meet the power requirement for electric traction and non-traction, Indian Railways and NTPC Ltd. have entered into a JointVenture (JV), namely Bhartiya Rail Bijlee Company Limited(BRBCL), with the aim of establishing and operating power
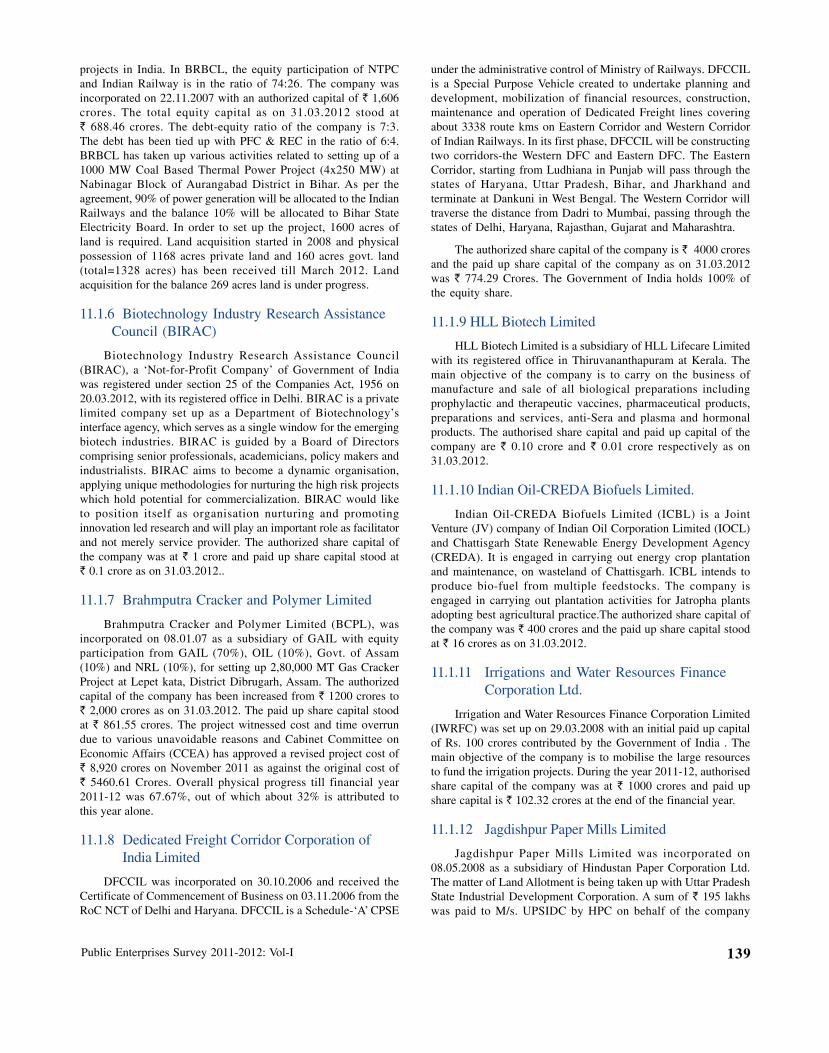
Public Enterprises Survey 2011-2012: Vol-I 139
projects in India. In BRBCL, the equity participation of NTPCand Indian Railway is in the ratio of 74:26. The company wasincorporated on 22.11.2007 with an authorized capital of ` 1,606crores. The total equity capital as on 31.03.2012 stood at` 688.46 crores. The debt-equity ratio of the company is 7:3.The debt has been tied up with PFC & REC in the ratio of 6:4.BRBCL has taken up various activities related to setting up of a1000 MW Coal Based Thermal Power Project (4x250 MW) atNabinagar Block of Aurangabad District in Bihar. As per theagreement, 90% of power generation will be allocated to the IndianRailways and the balance 10% will be allocated to Bihar StateElectricity Board. In order to set up the project, 1600 acres ofland is required. Land acquisition started in 2008 and physicalpossession of 1168 acres private land and 160 acres govt. land(total=1328 acres) has been received till March 2012. Landacquisition for the balance 269 acres land is under progress.
11.1.6 Biotechnology Industry Research AssistanceCouncil (BIRAC)
Biotechnology Industry Research Assistance Council(BIRAC), a ‘Not-for-Profit Company’ of Government of Indiawas registered under section 25 of the Companies Act, 1956 on20.03.2012, with its registered office in Delhi. BIRAC is a privatelimited company set up as a Department of Biotechnology’sinterface agency, which serves as a single window for the emergingbiotech industries. BIRAC is guided by a Board of Directorscomprising senior professionals, academicians, policy makers andindustrialists. BIRAC aims to become a dynamic organisation,applying unique methodologies for nurturing the high risk projectswhich hold potential for commercialization. BIRAC would liketo position itself as organisation nurturing and promotinginnovation led research and will play an important role as facilitatorand not merely service provider. The authorized share capital ofthe company was at ` 1 crore and paid up share capital stood at` 0.1 crore as on 31.03.2012..
11.1.7 Brahmputra Cracker and Polymer Limited
Brahmputra Cracker and Polymer Limited (BCPL), wasincorporated on 08.01.07 as a subsidiary of GAIL with equityparticipation from GAIL (70%), OIL (10%), Govt. of Assam(10%) and NRL (10%), for setting up 2,80,000 MT Gas CrackerProject at Lepet kata, District Dibrugarh, Assam. The authorizedcapital of the company has been increased from ` 1200 crores to` 2,000 crores as on 31.03.2012. The paid up share capital stoodat ` 861.55 crores. The project witnessed cost and time overrundue to various unavoidable reasons and Cabinet Committee onEconomic Affairs (CCEA) has approved a revised project cost of` 8,920 crores on November 2011 as against the original cost of` 5460.61 Crores. Overall physical progress till financial year2011-12 was 67.67%, out of which about 32% is attributed tothis year alone.
11.1.8 Dedicated Freight Corridor Corporation ofIndia Limited
DFCCIL was incorporated on 30.10.2006 and received theCertificate of Commencement of Business on 03.11.2006 from theRoC NCT of Delhi and Haryana. DFCCIL is a Schedule-‘A’ CPSE
under the administrative control of Ministry of Railways. DFCCILis a Special Purpose Vehicle created to undertake planning anddevelopment, mobilization of financial resources, construction,maintenance and operation of Dedicated Freight lines coveringabout 3338 route kms on Eastern Corridor and Western Corridorof Indian Railways. In its first phase, DFCCIL will be constructingtwo corridors-the Western DFC and Eastern DFC. The EasternCorridor, starting from Ludhiana in Punjab will pass through thestates of Haryana, Uttar Pradesh, Bihar, and Jharkhand andterminate at Dankuni in West Bengal. The Western Corridor willtraverse the distance from Dadri to Mumbai, passing through thestates of Delhi, Haryana, Rajasthan, Gujarat and Maharashtra.
The authorized share capital of the company is ` 4000 croresand the paid up share capital of the company as on 31.03.2012was ` 774.29 Crores. The Government of India holds 100% ofthe equity share.
11.1.9 HLL Biotech Limited
HLL Biotech Limited is a subsidiary of HLL Lifecare Limitedwith its registered office in Thiruvananthapuram at Kerala. Themain objective of the company is to carry on the business ofmanufacture and sale of all biological preparations includingprophylactic and therapeutic vaccines, pharmaceutical products,preparations and services, anti-Sera and plasma and hormonalproducts. The authorised share capital and paid up capital of thecompany are ` 0.10 crore and ` 0.01 crore respectively as on31.03.2012.
11.1.10 Indian Oil-CREDA Biofuels Limited.
Indian Oil-CREDA Biofuels Limited (ICBL) is a JointVenture (JV) company of Indian Oil Corporation Limited (IOCL)and Chattisgarh State Renewable Energy Development Agency(CREDA). It is engaged in carrying out energy crop plantationand maintenance, on wasteland of Chattisgarh. ICBL intends toproduce bio-fuel from multiple feedstocks. The company isengaged in carrying out plantation activities for Jatropha plantsadopting best agricultural practice.The authorized share capital ofthe company was ` 400 crores and the paid up share capital stoodat ` 16 crores as on 31.03.2012.
11.1.11 Irrigations and Water Resources FinanceCorporation Ltd.
Irrigation and Water Resources Finance Corporation Limited(IWRFC) was set up on 29.03.2008 with an initial paid up capitalof Rs. 100 crores contributed by the Government of India . Themain objective of the company is to mobilise the large resourcesto fund the irrigation projects. During the year 2011-12, authorisedshare capital of the company was at ` 1000 crores and paid upshare capital is ` 102.32 crores at the end of the financial year.
11.1.12 Jagdishpur Paper Mills Limited
Jagdishpur Paper Mills Limited was incorporated on08.05.2008 as a subsidiary of Hindustan Paper Corporation Ltd.The matter of Land Allotment is being taken up with Uttar PradeshState Industrial Development Corporation. A sum of ` 195 lakhswas paid to M/s. UPSIDC by HPC on behalf of the company
CPSEs Under Construction140
towards EMD for allotment of 62.59 acres of land for the projectduring the year. The authorized capital and paid up capital of thecompany are ` 5 crore and ` 0.05 crore respectively, as on31.3.2012.
11.1.13 Loktak Downstream HydroelectricCorporation Limited
Loktak Downstream Hydroelectric Corporation Ltd.(LDHCL) was incorporated as a Joint Venture (JVC) companyof NHPC Ltd. (74% shareholding) and Government of Manipur(26% shareholding) on 23.10.2009, with an authorized share capitalof 230 crores.The paid up share capital of the company stood at` 98.46 crores as on 31.03.2012. Its registered office is at LoktakPower Station, Komkeirap, Manipur. The objective of thecompany is to plan, promote and develop hydroelectric powergeneration in Manipur.
11.1.14 Mahanadi Basin Power Limited
Mahanadi Basin Power Limited (MBPL) is a wholly ownedsubsidiary of Mahanadi Coalfields Limited (MCL). MBPL wasincorporated in 02.12.2011. The Commencement of BusinessCertificate was issued by RoC on 06.02.2012. The authorizedcapital and paid up capital of the company are ` 0.05 crore each,as on 31.3.2012. The company would be inviting proposal todevelop, operate and maintain the proposed power project of2x800 MW capacities Super Critical Thermal Power Plant atSundargarh District in Orissa.
11.1.15 MJSJ Coal Limited
MJSJ Coal Ltd. was incorporated on 13.08.2012 as a JointVenture (JV) company between Mahanadi Coalfields Ltd. (60%share), JSW Steel Ltd. (11% share), JSW Energy Ltd. (11% share),Shyam Metallics & Energy Ltd. (9%share) and Jindal StainlessLtd. (9% share). The company has been formed in respect ofGopalprasad OCP (Western part of Gopalprasad) and Utkal-Aof Talcher Coalfield. The normative capacity of the project is 15.00MTY and peak capacity is 20.00 MTY. The project is located atsouth central part of Talcher Coalfield. The authorised share capitalstood at ` 200 crores whereas it’s paid up share capital stood at` 70.10 Crores as on 31.03.2012.
11.1.16 MNH Shakti Limited
MNH Shakti Limited is a subsidiary company of MahanadiCoalfields Limited, which was incorporated on 16.07.2008. It is aJV with 70% stake of Mahanadi Coalfields Limited (MCL), 15%stake of Neyveli Lignite Corporation Limited (NLC) and 15 %stake of Hindalco Limited (HIL). The total area of land acquiredfor this project is 1914.063 hectres (excluding land required forResettlement site and Residential colony) and involves villages ofRampur, Malda and Patrapalli in Jharsuguda district (in WestBengal) and villages of Talabira and Khinda in Sambalpur District(in Orissa). The project comprises of 994.5 Ha of coal bearingarea, out of which mineable coal reserve is 553.98 M.Te. (in Ibseam and Rampur seam). Most of the coal is of F&G grade, whichis suitable for Thermal Power Plants. With ultimate capacity of20 MTY, the mine will have a life of 34 years while the authorizedshare capital of the company was ` 100 crores, the paid up
share capital of the company stood at ` 85.10 crores as on31.03.2012.
11.1.17 NLC Tamil Nadu Power Limited
NLC Tamil Nadu Power Limited (NTPL) was set up in theyear 2006. It is a JV company of NLC Ltd. and TNEB forestablishing a 2 x 500 MW power plant at Tuticorin, Tamil Naduat an estimated cost of ` 4909.54 crores. The land for the project(and colony) measuring 127.465 hectres has been allotted by VOChidambaranar Port Trust (VOCPT) and long term LeaseAgreement for 30 years has been entered into between theCompany and VOCPT, The contract for the main plant packageof Steam Generator, Turbo Generator and ElectrostaticPrecipitator, has been awarded to BHEL. Civil construction,structural fabrication and mechanical erection works are inprogress. Drum lifting for both the units were completed inSeptember 2011. The Ministry of Coal has given coal linkage tothis project from Mahanadi Coalfields Limited (MCL) and MCLhas issued Letter of Assurance to supply 3 million ton of “F”grade coal per annum for this project. While the authorized capitalwas ` 1,800 crores and the paid up capital stood at ` 500 croresas on 31.03.2012.
11.1.18 NMDC Power Limited
NMDC Power Limited was incorporated as a Special PurposeVehicle (SPV) on 12.12. 2011 as a wholly owned subsidiarycompany of NMDC Ltd. The company was set up for thepurpose for captive power supply to the 3-MTPA integrated steelplant being constructed at Nagamar at Chattisgarh. Both theauthorized share capital and the paid up capital stood at ` 0.05crore each as on 31.03.2012.
11.1.19 NMDC-CMDC Limited
NMDC-CMDC Limited was incorporated on 19.06.2008. Itis a subsidiary company of NMDC Limited and a Joint Venture(JV) Company of NMDC and Chattisgarh Mineral DevelopmentCorporation Limited (CMDC) with equity participation in theratio of 51:49. While the authorized capital of the company is` 4 crores, the paid capital of the company stood at ` 3.04 croresas on 31.03.12. Its registered office is at Raipur, Chattisgarh. Sinceno mining operation has yet started, there is no commercialactivity going on. After obtaining various Statutory Clearances suchas Environment Clearances, Forest Clearance from IBM/DGMS/SPCB etc. the development of mine will take place.
The company has entered into an agreement with ChattisgarhState Housing Board and has made a payment of ` 154.69 lacstowards its first installment.
11.1.20 NTPC Hydro Limited
NTPC Hydro Limited was incorporated on in 2002, forhydroelectric power generation. It is a wholly owned subsidiaryof National Thermal power Corporation Ltd. (NTPC) with itscorporate offices at New Delhi. The authorised and paid up sharecapital stood at ` 500 crores and ` 121.36 crores respectively ason 31.03.2012. The company is presently executing two projects,namely, Lata Tapovan Hydro Electric Project (171 MW)
Public Enterprises Survey 2011-2012: Vol-I 141
located in Chamoli District of Uttarakhand and Ramman HydroElectric Project, Stage-III (120 MW) located in Darjelling Districtof West Bengal and West Sikkim district of Sikkim. The projectsundertaken by the company are in construction stage.
11.1.21 PFC Green Energy Limited
The company was incorporated on 30.03.2011, as a whollyowned subsidiary of Power Finance Corporation Limited toprovide finance and financial support to the renewable energysector like solar, wind, small hydro, bio mass etc. The Certificateof Commencement of Business was obtained by the company on30.07.2011. The company has applied to RBI for registration asa Non-Banking Finance Company (NBFC). The authorized capitaland paid up capital of the company stood at ` 1200 crores and` 4.99 crores respectively as on 31.03.2012.
11.1.22 Power Equity Capital Advisors Private Limited
Power Equity Capital Advisors Private Limited (PECAP) hasbeen set up as a company under the Companies Act, 1956 on25.03.2008. As an advisory PECAP was incorporated to provideadvisory services related to equity investments in Indian powersector, where PFC holds 30% of the total issued and paid upequity share capital. Consequent upon transfer of 70% stake inPECAP to PFC, PECAP has become wholly owned subsidiaryof PFC on 11.10.2011.
While the authorized share capital of the company was at` 0.10 crore, the paid up share capital stood at ` 0.05 crore as on31.03.2012.
11.1.23 Punjab Ashok Hotel Co. Ltd.
Punjab Ashok Hotel Co. Ltd. is a Joint Venture (JV) betweenIndia Tourism Development Corporation Limited and PunjabTourism Development Corporation Ltd. It was incorporated on11.11.1998. The authorized and paid up capital were ` 3.00 croreand ` 2.50 crore respectively as on 31.3.2012. The equitycontribution is in proportion of 51:49 between Indian TourismDevelopment Corporation and Punjab Tourism DevelopmentCorporation Limited respectively. While the registered office is inChandigarh, the corporate office is located at Anandpur Sahib inPunjab. The main objectives of the company are to own, manage,construct-purchase and operate hotels, restaurants, motels as wellas to establish, manage transport units for tourism in Punjab.
11.1.24 RITES Infrastructure Services Limited
RITES Infrastructure Services Limited (RISL) wasincorporated on 27.4.2010 as a wholly owned subsidiary of RITESLtd. The main objectives of the company are development ofinfrastructure projects, operation & maintenance of Multi-Functional Complexes (MFCs) at/in the vicinity of identified orprescribed premises of Railway Stations and on sites assigned bythe Ministry of Railways. The paid up share capital of companyis ` 0.05 crores against the authorised capital of ` 5 crores. Thecompany is executing the work of development, operation andmaintenance of Multi-functional complexes at 20 railway stationswhich have been identified by the Ministry of Railways (MOR).The Holding Company (RITES Ltd.) has been into constructingMulti-Functional Complexes (MFCs), on behalf of the RISL.
During the year under review physical works of construction andservices connections at three stations have been completed andeleven other stations are in advanced stages.
11.1.25 SAIL Jagadishpur Power Plant Limited
SAIL Jagadishpur Power Plant Limited (SJPPL) is whollyowned subsidiary of Steel Authority of India Limited (SAIL). Thecompany has been created as a Special Purpose Vehicle (SPV) forinstallation of about 1050 MW capacity gas based combined cyclepower plant at Jagdishpur in Distt Sultanpur. The main objectivesof the company are to install, operate and maintain Power Plantat Jagdishpur in the State of Uttar Pradesh for supplying powerto various units of SAIL and its associated units/facilities. Theauthorized capital and paid up capital of the company, were` 0.05 crore each as on 31.3.2012.
The authorized capital and paid up capital of the company,as on 31.3.2012, are ` 0.05 crore each.
11.1.26 Sethusamudram Corporation Limited
Sethusamudram Corporation Limited (SCL) was incorporatedin the year 2004 to develop and operate a navigation channel alongthe territorial waters of India for connecting Gulf of Mannar withPalk Bay, named as Sethusamudaram Channel to enable bettermovement of various shipping within the territorial waters of India.The prestigious Sethusamudram Ship Channel project wassanctioned by Government of India on 01.06.2005. Dredging isthe major component of the project accounting for about two thirdof the project cost. The total length of the channel is 167 kms.Dredging is required for a length of 89 Km in two stretches, viz.Adam’s Bridge area and Palk Bay/Palk Strait area. The designeddepth of the channel is 12 m below chart datum. The company isin construction stage in implementing the Sethusamudram Shipchannel project. The total cost of the project sanctioned byGovernment of India is ` 2,427.40 crores. Out of this sanctionedamount, the company has incurred capital cost of ` 829.01 croresas on 31.03.2012. The company has an authorized capital of` 1,000 crores while ` 745 crores has been subscribed by thevarious stakeholders. Government of India has contributed ` 495crores towards equity capital, V.O. Chidambaranar Port Trust andShipping Corporation of India have contributed Rs. 50 crores each.The remaining ` 150 crores has been contributed by DredgingCorporation of India, Chennai Port Trust, Ennore Port Limited,Visakhapatnam Port Trust and Paradip Port Trust has contributed` 30 crores each.
11.2 Shell Companies
The objective of ‘shell companies’ are to undertakepreliminary studies and to facilitate tie-ups of inputs, linkagesand clearances for the projects such as water, land and environmentclearance; Appointment of Bid Process Management Consultantfor preparation and evaluation of documents (RFQ/RFP) forselection of developer through International Competitive Bidding(ICB) etc.
The Power Finance Corporation Limited (PFCL) was selectedas the Nodal Agency for the development of such mega powerprojects by the Central Electricity Authority (CEA). There arenine (9) Shell companies set up by Power Finance Corporation
CPSEs Under Construction142
Ltd./ PFC Consulting Ltd. While the total ‘authorized capital’ andpaid up capital of theses nine CPSEs stood at ` 0.45 crore eachrespectively as on 31.03.2012. Brief detail of these enterprises
incorporated in March, 2006 under the Companies Act, 1956 as awholly owned subsidiary (and a shell company) of Power FinanceCorporation Ltd. to facilitate the development of Ultra MegaPower Project at Sindhudurg Distric in Maharashtra. Theauthorized capital and paid up capital of the company as on31.3.2012 are ` 0.05 crore each. On behalf of the proposed UltraMega Power Project (UMPP), CMMPL has been established toundertake preliminary studies and to facilitate tie-ups of inputs,linkages and clearances for the projects such as water, land andenvironment clearance as well as appointment of ‘bid process’Management Consultant for preparation and evaluation ofdocuments (RFQ/RFP) for selection of developer throughInternational Competitive Bidding (ICB).
11.2.4 Coastal Tamil Nadu Power Limited
Coastal Tamil Nadu Power Limited (CTNPL) wasincorporated in January, 2007 under the Companies Act, 1956 asa wholly owned subsidiary (and a shell company) of PowerFinance Corporation Limited for the development of CheyyurUltra Mega Power Project (UMPP) in state of Tamilnadu. Theauthorized capital and paid up capital of the company as on31.3.2012 are ` 0.05 crore each. On behalf of the proposed UltraMega Power Project at Cheyyur, CTNPL is to undertakepreliminary studies and to obtain necessary clearances and tie upinputs including water, land and power selling arrangements etc.,for proposed power project prior to award of the project to thesuccessful bidder.
11.2.5 DGEN Transmission Co. Ltd.
DGEN Transmission Company Limited (formerly known asDGEN and Uttrakhand Transmission Company Limited) wasincorporated on 15.11.2011, as a wholly owned subsidiary of PFCConsulting Limited for the development of the Transmissioncapacity in India and to bring potential investors through tariff
Table 11.3
(` in Crore)
S.No. CPSE Status Year of Authorised Paid upincorporation Capital up Capital
1. Chattisgarh Sarguja Power Limited Subsidiary 2006 0.05 0.05
2. Coastal Karnataka Power Limited Subsidiary 2006 0.05 0.05
3. Coastal Maharashtra Mega Power Limted Subsidiary 2006 0.05 0.05
4. Coastal Tamil Nadu Power Limited Subsidiary 2007 0.05 0.05
5. DGEN Transmission Co. Ltd. Subsidiary 2011 0.05 0.05
6. Ghogharpalli Integrated Power Company Limited Subsidiary 2008 0.05 0.05
7. Orissa Integrated Power Limited Subsidiary 2006 0.05 0.05
8. Sakhigopal Integrated Power Company Limited Subsidiary 2008 0.05 0.05
9. Tatiya Andhra Mega Power Limited Subsidiary 2009 0.05 0.05
Total 0.45 0.45
A brief description of these shell companies is given below.
11.2.1 Chhattisgarh Surguja Power Limited
Chhattisgarh Surguja Power Ltd. (CSPL) was established inFebruary 2006 as a wholly owned subsidiary (and a shellcompany) of Power Finance Corporation Ltd. for the developmentof Ultra Mega Power Project (UMPP) in Chhattisgarh. Bothauthorized capital and paid up capital of the company are Rs.0.05 crore each as on 31.3.2012. On behalf of the proposed UMPP,CSPL has been established to undertake preliminary studies andto facilitate tie-ups of inputs, linkages and clearances for theprojects such as water, land and environment clearance;Appointment of Bid process Management Consultant forpreparation and evaluation of documents (RFQ/RFP) for selectionof developer through International Competitive Bidding (ICB).
11.2.2 Coastal Karnataka Power Limited
Coastal Karnataka Power Limited (CKPL) was incorporatedin February, 2006 under the Companies Act, 1956 as a whollyowned subsidiary (and a shell company) of Power FinanceCorporation Limited for the development of Tadri Ultra MegaPower Project (UMPP) in Karnataka. The authorized capital andpaid up capital of the company, as on 31.3.2012, are ` 0.05 croreeach. On behalf of the proposed Ultra Mega Power Project atTadri, CKPL has been established to undertake preliminary studiesand to facilitate tie-ups of inputs, linkages and clearances for theprojects such as water, land and environment clearance as well asappointment of ‘bid process’ Management Consultant forpreparation and evaluation of documents (RFQ/RFP) for selectionof developer through International Competitive Bidding (ICB).
11.2.3 Coastal Maharashtra Mega Power Limited
Coastal Maharashtra Mega Power Ltd. (CMMPL), was
showing their status, date of incorporation, authorized capital andpaid up capital are given in Table 11.3 below:
Public Enterprises Survey 2011-2012: Vol-I 143
based competitive bidding process. Presently, company isassociated with DGEN TPS (1200MW) of Torrent Power Ltd.The authorized capital and paid up capital of the company were` 0.05 crore each as on 31.3.2012.
11.2.6 Ghogarpalli Integrated Power CompanyLimited
Ghogarpalli Integrated Power Company Limited (GIPCL)was incorporated on 22.05.2008, as a wholly owned subsidiaryof Power Finance Corporation Ltd. to facilitate the developmentof Ultra Mega Power Project (UMPP) at Ghogarpalli in Orissa.The authorized capital and paid up capital of the company are` 0.05 crore each, as on 31.3.2012. GIPCL has been establishedto undertake preliminary studies and to facilitate tie-ups of inputs,linkages and clearances for the projects such as water, land andenvironment clearance as well as appointment of Bid processManagement Consultant for preparation and evaluation ofdocuments (RFQ/RFP) for selection of developer throughInternational Competitive Bidding (ICB) for the UMPP.
11.2.7 Orissa Integrated Power Limited
Orissa Integrated Power Limited (OIPL) is a wholly ownedsubsidiary of Power Finance Corporation Limited for thedevelopment of Sundergarh Ultra Mega Power Project (UMPP)in Orissa. OIPL has been established to undertake preliminarystudies and to facilitate tie-ups of inputs, linkages and clearancesfor the projects such as water, land and environment clearance,appointment of bid process Management Consultant forpreparation and evaluation of documents (RFQ/RFP) for selectionof developer through International Competitive Bidding (ICB) forthe UMPP.It was incorporated on 24.08.2006. The authorized
capital and paid up capital of the company stood at ` 0.05 croreeach as on 31.03.2012.
11.2.8 Sakhigopal Integrated Power Company Limited
Sakhigopal Integrated Power Company Limited (SIPCL) is aSPVs and a wholly owned subsidiary of Power FinanceCorporation Limited. It was incorporated on 21.5.2008 under theCompanies Act, 1956 for the development of Ultra Mega PowerProject (UMPP) in Orissa. The authorized capital and paid upcapital of the company were ` 0.05 crore each as on 31.3.2012.SIPCL has been established to undertake preliminary studies andto facilitate tie-ups of inputs, linkages and clearances for theprojects such as water, land and environment clearance as well asappointment of bid process Management Consultant forpreparation and evaluation of documents (RFQ/RFP) for selectionof developer through International Competitive Bidding (ICB) forthe UMPP.
11.2.9 Tatiya Andhra Mega Power Limited
Tatya Andhra Mega Power Limited (TAMPL) is one of theSPVs and a wholly owned subsidiary of Power FinanceCorporation Limited. It was incorporated on 17.4.2009 for thedevelopment of Ultra Mega Power Project (UMPP) in AndhraPradesh. The authorized capital and paid up capital of thecompany were ` 0.05 crore each as on 31.3.2012. TAMPL hasbeen established to undertake preliminary studies and to facilitatetie-ups of inputs, linkages and clearances for the projects such aswater, land and environment clearance as well as appointment ofbid process Management Consultant for preparation andevaluation of documents (RFQ/RFP) for selection of developerthrough International Competitive Bidding (ICB) for thedevelopment of UMPP.
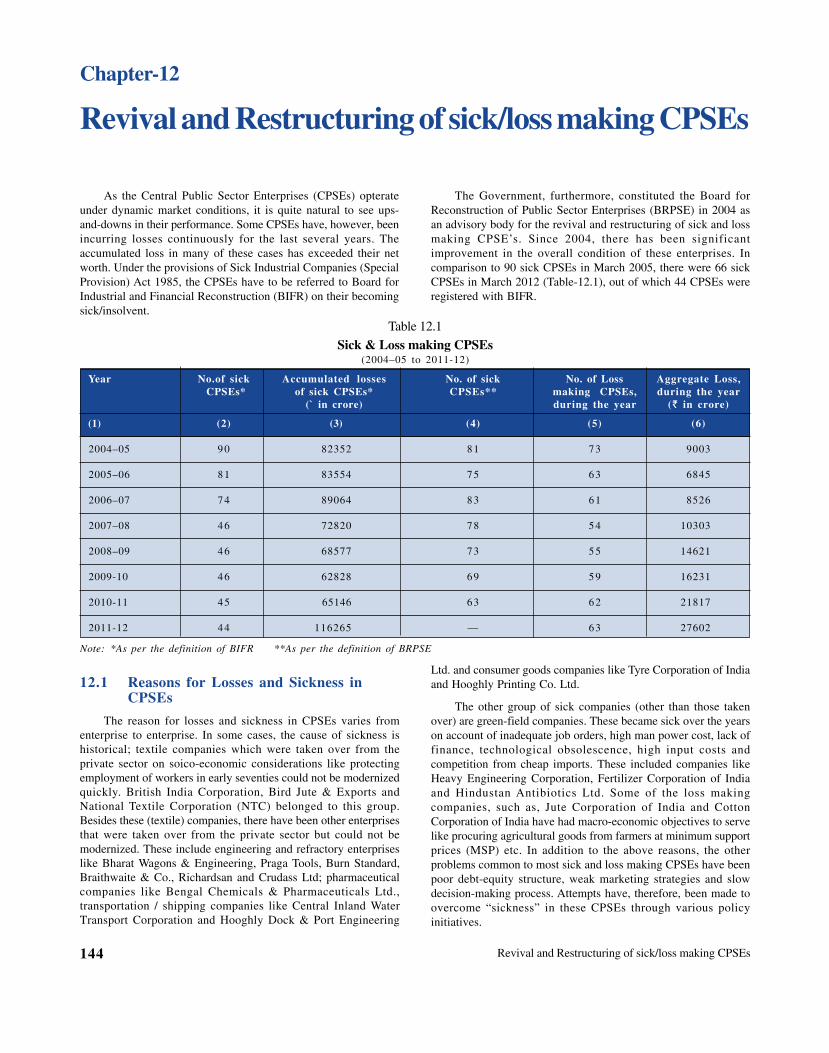
Revival and Restructuring of sick/loss making CPSEs144
Revival and Restructuring of sick/loss making CPSEs
Chapter-12
As the Central Public Sector Enterprises (CPSEs) opterateunder dynamic market conditions, it is quite natural to see ups-and-downs in their performance. Some CPSEs have, however, beenincurring losses continuously for the last several years. Theaccumulated loss in many of these cases has exceeded their networth. Under the provisions of Sick Industrial Companies (SpecialProvision) Act 1985, the CPSEs have to be referred to Board forIndustrial and Financial Reconstruction (BIFR) on their becomingsick/insolvent.
The Government, furthermore, constituted the Board forReconstruction of Public Sector Enterprises (BRPSE) in 2004 asan advisory body for the revival and restructuring of sick and lossmaking CPSE’s. Since 2004, there has been significantimprovement in the overall condition of these enterprises. Incomparison to 90 sick CPSEs in March 2005, there were 66 sickCPSEs in March 2012 (Table-12.1), out of which 44 CPSEs wereregistered with BIFR.
Table 12.1
Sick & Loss making CPSEs(2004–05 to 2011-12)
Year No.of sick Accumulated losses No. of sick No. of Loss Aggregate Loss, CPSEs* of sick CPSEs* CPSEs** making CPSEs, during the year
(` in crore) during the year (` in crore)
(1) (2) (3) (4) (5) (6)
2004–05 90 82352 81 73 9003
2005–06 81 83554 75 63 6845
2006–07 74 89064 83 61 8526
2007–08 46 72820 78 54 10303
2008–09 46 68577 73 55 14621
2009-10 46 62828 69 59 16231
2010-11 45 65146 63 62 21817
2011-12 44 116265 — 63 27602
Note: *As per the definition of BIFR **As per the definition of BRPSE
Ltd. and consumer goods companies like Tyre Corporation of Indiaand Hooghly Printing Co. Ltd.
The other group of sick companies (other than those takenover) are green-field companies. These became sick over the yearson account of inadequate job orders, high man power cost, lack offinance, technological obsolescence, high input costs andcompetition from cheap imports. These included companies likeHeavy Engineering Corporation, Fertilizer Corporation of Indiaand Hindustan Antibiotics Ltd. Some of the loss makingcompanies, such as, Jute Corporation of India and CottonCorporation of India have had macro-economic objectives to servelike procuring agricultural goods from farmers at minimum supportprices (MSP) etc. In addition to the above reasons, the otherproblems common to most sick and loss making CPSEs have beenpoor debt-equity structure, weak marketing strategies and slowdecision-making process. Attempts have, therefore, been made toovercome “sickness” in these CPSEs through various policyinitiatives.
12.1 Reasons for Losses and Sickness inCPSEs
The reason for losses and sickness in CPSEs varies fromenterprise to enterprise. In some cases, the cause of sickness ishistorical; textile companies which were taken over from theprivate sector on soico-economic considerations like protectingemployment of workers in early seventies could not be modernizedquickly. British India Corporation, Bird Jute & Exports andNational Textile Corporation (NTC) belonged to this group.Besides these (textile) companies, there have been other enterprisesthat were taken over from the private sector but could not bemodernized. These include engineering and refractory enterpriseslike Bharat Wagons & Engineering, Praga Tools, Burn Standard,Braithwaite & Co., Richardsan and Crudass Ltd; pharmaceuticalcompanies like Bengal Chemicals & Pharmaceuticals Ltd.,transportation / shipping companies like Central Inland WaterTransport Corporation and Hooghly Dock & Port Engineering

Public Enterprises Survey 2011-2012: Vol-I 145
12.2 Sick Industrial Companies (SpecialProvisions) Act, 1985 (SICA)
The Sick Industrial Companies (Special Provision) Act, 1985(SICA) brought the CPSEs under its purview in 1991 (madeeffective from 1992). Under the provisions of SICA, the CPSEs(with at least five years of registration) whose accumulated lossesare equal to or have exceeded their net worth may be referred tothe BIFR. Reference to BIFR grants immunity from legal sanctionsto the company arising from proceedings from execution of decreeagainst property, suit for recovery of money and suit forenforcement of guarantor in respect of loans etc. The BIFR, onexamination, may either sanction suitable revival/ rehabilitationschemes (in case of enterprises which are viable) or recommendclosure (in respect of enterprises considered unviable). During theperiod of the last twenty years, that is, between 1992 to 2011,63 CPSEs have been referred to BIFR (Table12.2). There were noreferences made to BIFR between 2008 to 2012. Year-wiseregistration of CPSEs with BIFR is given below:
Hindustan Insecticides Limited and Hindustan Organic ChemicalsLimited have been dropped by the Board from the list of ‘sickindustrial CPSEs’ on their net worth becoming positive. Cases offour CPSEs have been declared as ‘non-maintainable’ by the Board,as either the matter had become time barred for reference to theBoard or on account of the net worth of the CPSE becomingpositive or the CPSE was found not fulfilling the conditions ofbeing industrial company as defined under SICA or on some othergrounds. Moreover, one of these companies, namely, ManipurState Drugs and Pharmaceuticals Limited has been closed. Table12.3 below shows the status of the 63 sick industrial CPSEs,registered with BIFR, as on 31.3.2012.
Table 12.2
Registration of CPSEs with BIFR
Year No. of CPSEs Year No. of CPSEs
1992 30* 2003 2
1993 2* 2004 4*
1994 4* 2005 2
1995 1 2006 1
1996 2 2007 1
1997 3 2008 0
1998 3 2009 0
1999 3 2010 0
2000 3 2011 0
2001 2 2012 0
2002 3 Total 63 #
Note: *This includes the subsidiaries of NTC, which have been mergedinto one company and registered again in 2008 after merger.
# Since Mandya National Paper Mills Limited has been woundup, Jessop & Co. Ltd. has been privatized, U.P. Drugs andPharmaceuticals Limited has been transferred to the U.P.Government, all the nine subsidiaries of NTC (Holding) Ltd. mergedwith NTC (Holding), Indian Iron and Steel Co. Limited, BharatRefractories Limited (BRL) and Maharashtra Elektrosmelt Limitedhave merged with SAIL, and Praga Tools Ltd. merged with HMTLtd, these CPSEs have not been included in the list of BIFR referredCPSEs.
Although a total number of 63 CPSEs have been referred toBIFR (uptil 2007), there are only 44 CPSEs that are in operation.Out of the remaining 19 CPSEs, 18 CPSEs are closed and one hasceased to be a CPSE. (Their cases however, continue to be listedin BIFR). Two CPSEs namely Vignyan Industries Limited andNorth Eastern Regional Agricultural Marketing CorporationLimited have since been declared ‘No Longer Sick’. In addition,Bharat Immunologicals and Biologicals Corporation Limited,Hindustan Salts Limited, Projects and Development India Ltd.,
Table 12.3
Status of CPSEs registered with BIFR(as on 31.03.2011)
Sl. No. Particulars Number
1. Revival Scheme sanctioned by BIFR 14
2. Revival Scheme sanctioned by AAIFR 1
3. Declared no longer sick 2
4. Dropped on net worth becoming positive 5
5. Dismissed as non-maintainable 4
6. Deregistered with BIFR / Others 2
7. Winding up recommended and closed 14
8. Winding up recommended 5
9. Winding up notice issued 1
10. Failed and re-opened 1
11. Draft Rehabilitation Scheme (DRS) awaited 13
12. Remanded by AAIFR 1
Total 63
BIFR has already disposed of 48 cases of CPSEs eitherthrough sanctioning revival schemes (15 cases) or declaring ‘nolonger sick’ (2 cases) or dropping due to net worth becomingpositive (5 cases) or dismissing the cases as non-maintainable (4cases) or deregistered with BIFR / Others (2 cases) orrecommending winding up (19 cases) or winding up notice issued(one case) (Annex-12.1). BIFR is yet to take a view in regard to15 cases of CPSEs. The process of sanctioning of revival /rehabilitation schemes as well as the process of appointment ofOfficial Liquidator (OL) for winding up of CPSEs by BIFR have,however, been slow on account of involvement of multipleagencies.
12.3 Strategies for revival / restructuring ofsick CPSEs
Some of the strategies adopted for restructuring / revival ofsick CPSEs are mentioned below:
(i) Financial restructuring: Financial restructuringinvolves investment in CPSEs by the Government in theform of equity participation, providing loan (plan/non-plan)/grants and/or write-off of past losses as well as
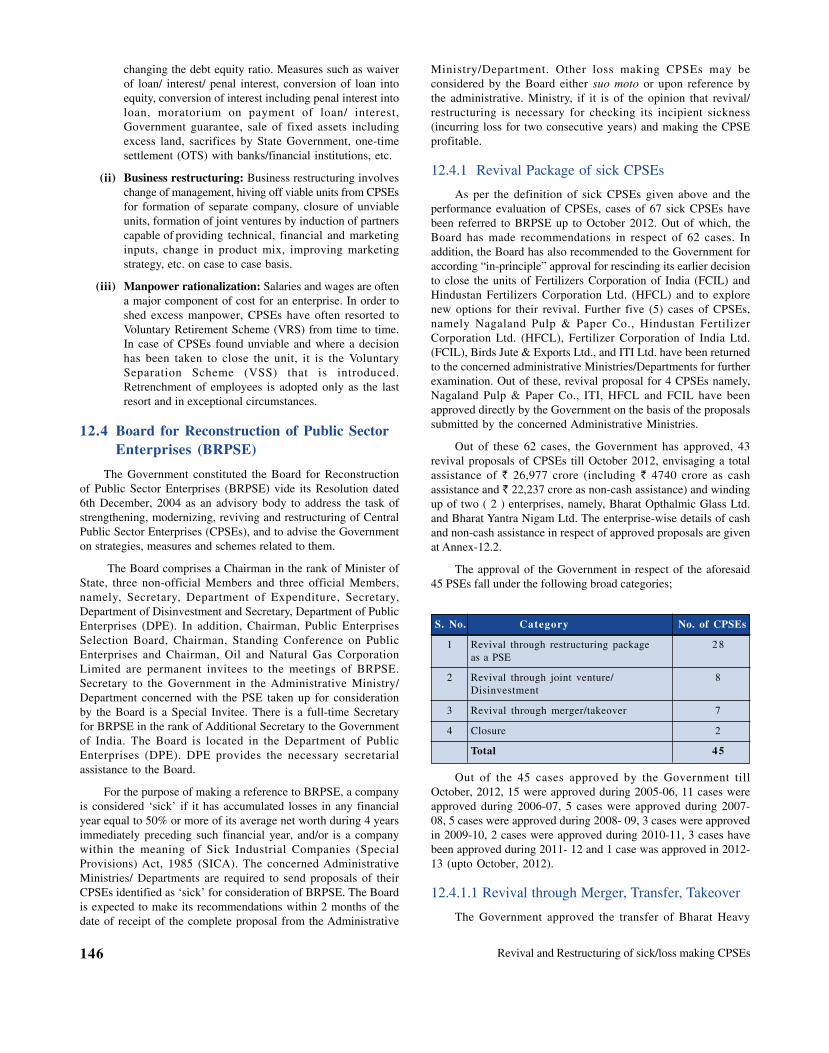
Revival and Restructuring of sick/loss making CPSEs146
changing the debt equity ratio. Measures such as waiverof loan/ interest/ penal interest, conversion of loan intoequity, conversion of interest including penal interest intoloan, moratorium on payment of loan/ interest,Government guarantee, sale of fixed assets includingexcess land, sacrifices by State Government, one-timesettlement (OTS) with banks/financial institutions, etc.
(ii) Business restructuring: Business restructuring involveschange of management, hiving off viable units from CPSEsfor formation of separate company, closure of unviableunits, formation of joint ventures by induction of partnerscapable of providing technical, financial and marketinginputs, change in product mix, improving marketingstrategy, etc. on case to case basis.
(iii) Manpower rationalization: Salaries and wages are oftena major component of cost for an enterprise. In order toshed excess manpower, CPSEs have often resorted toVoluntary Retirement Scheme (VRS) from time to time.In case of CPSEs found unviable and where a decisionhas been taken to close the unit, it is the VoluntarySeparation Scheme (VSS) that is introduced.Retrenchment of employees is adopted only as the lastresort and in exceptional circumstances.
12.4 Board for Reconstruction of Public SectorEnterprises (BRPSE)
The Government constituted the Board for Reconstructionof Public Sector Enterprises (BRPSE) vide its Resolution dated6th December, 2004 as an advisory body to address the task ofstrengthening, modernizing, reviving and restructuring of CentralPublic Sector Enterprises (CPSEs), and to advise the Governmenton strategies, measures and schemes related to them.
The Board comprises a Chairman in the rank of Minister ofState, three non-official Members and three official Members,namely, Secretary, Department of Expenditure, Secretary,Department of Disinvestment and Secretary, Department of PublicEnterprises (DPE). In addition, Chairman, Public EnterprisesSelection Board, Chairman, Standing Conference on PublicEnterprises and Chairman, Oil and Natural Gas CorporationLimited are permanent invitees to the meetings of BRPSE.Secretary to the Government in the Administrative Ministry/Department concerned with the PSE taken up for considerationby the Board is a Special Invitee. There is a full-time Secretaryfor BRPSE in the rank of Additional Secretary to the Governmentof India. The Board is located in the Department of PublicEnterprises (DPE). DPE provides the necessary secretarialassistance to the Board.
For the purpose of making a reference to BRPSE, a companyis considered ‘sick’ if it has accumulated losses in any financialyear equal to 50% or more of its average net worth during 4 yearsimmediately preceding such financial year, and/or is a companywithin the meaning of Sick Industrial Companies (SpecialProvisions) Act, 1985 (SICA). The concerned AdministrativeMinistries/ Departments are required to send proposals of theirCPSEs identified as ‘sick’ for consideration of BRPSE. The Boardis expected to make its recommendations within 2 months of thedate of receipt of the complete proposal from the Administrative
Ministry/Department. Other loss making CPSEs may beconsidered by the Board either suo moto or upon reference bythe administrative. Ministry, if it is of the opinion that revival/restructuring is necessary for checking its incipient sickness(incurring loss for two consecutive years) and making the CPSEprofitable.
12.4.1 Revival Package of sick CPSEs
As per the definition of sick CPSEs given above and theperformance evaluation of CPSEs, cases of 67 sick CPSEs havebeen referred to BRPSE up to October 2012. Out of which, theBoard has made recommendations in respect of 62 cases. Inaddition, the Board has also recommended to the Government foraccording “in-principle” approval for rescinding its earlier decisionto close the units of Fertilizers Corporation of India (FCIL) andHindustan Fertilizers Corporation Ltd. (HFCL) and to explorenew options for their revival. Further five (5) cases of CPSEs,namely Nagaland Pulp & Paper Co., Hindustan FertilizerCorporation Ltd. (HFCL), Fertilizer Corporation of India Ltd.(FCIL), Birds Jute & Exports Ltd., and ITI Ltd. have been returnedto the concerned administrative Ministries/Departments for furtherexamination. Out of these, revival proposal for 4 CPSEs namely,Nagaland Pulp & Paper Co., ITI, HFCL and FCIL have beenapproved directly by the Government on the basis of the proposalssubmitted by the concerned Administrative Ministries.
Out of these 62 cases, the Government has approved, 43revival proposals of CPSEs till October 2012, envisaging a totalassistance of ` 26,977 crore (including ` 4740 crore as cashassistance and ` 22,237 crore as non-cash assistance) and windingup of two ( 2 ) enterprises, namely, Bharat Opthalmic Glass Ltd.and Bharat Yantra Nigam Ltd. The enterprise-wise details of cashand non-cash assistance in respect of approved proposals are givenat Annex-12.2.
The approval of the Government in respect of the aforesaid45 PSEs fall under the following broad categories;
S. No. Category No. of CPSEs
1 Revival through restructuring package 28as a PSE
2 Revival through joint venture/ 8Disinvestment
3 Revival through merger/takeover 7
4 Closure 2
Total 45
Out of the 45 cases approved by the Government tillOctober, 2012, 15 were approved during 2005-06, 11 cases wereapproved during 2006-07, 5 cases were approved during 2007-08, 5 cases were approved during 2008- 09, 3 cases were approvedin 2009-10, 2 cases were approved during 2010-11, 3 cases havebeen approved during 2011- 12 and 1 case was approved in 2012-13 (upto October, 2012).
12.4.1.1 Revival through Merger, Transfer, Takeover
The Government approved the transfer of Bharat Heavy
Public Enterprises Survey 2011-2012: Vol-I 147
Plates and Vessels Ltd. to BHEL on 26.11.2007 and merger ofBharat Refractories Ltd. with SAIL on 24.4.2008. The Governmentapproved on 20.10.2005 merger of Praga Tools Ltd. with HMTMachine Tools Ltd. The Government also approved on 7.2.2008transfer of Bharat Wagon & Engineering Co. Ltd. (BWEL) fromD/o Heavy Industries to M/o Railways. The Government alsoapproved on 24.12.2009 the transfer of administrative control ofHindustan Shipyard Ltd. from M/o Shipping to M/o Defence. TheGovernment further approved on 10.6.2010 the transfer ofRefractory Unit (at Salem) of Burn Standard CompanyLtd.(BSCL) to SAIL under M/o Steel and the transfer ofadministrative control of BSCL(excluding Refractory unit at Salem)and Braithwaite and Company Ltd. from D/o Heavy Industry toM/o Railways.
12.4.1.2 Revival/restructuring during 2011-12
During the period between November 2011 to October 2012,the Board recommended revival of HMT Ltd. and North EasternHandicrafts & Handlooms Development Corporation Ltd.
The Board also reviewed, during this period, the status ofimplementation of revival package sanctioned by the Governmentin case of 15 CPSEs as mentioned below:
1. Hindustan Shipyard Ltd.
2. National Textile Corporation Ltd.
3. Heavy Engineering Corporation Ltd
4. Bharat Wagon & Engineers Ltd.
5. Central Electronics Ltd.
6. Fertilizers & Chemicals Travancore Ltd.
7. Hindustan Copper Ltd.
8. Konkan Railway Corporation Ltd.
9. Scooters India Ltd.
10. Instrumentation Ltd.
11. HMT Machine Tools Ltd.
12. Hindustan Organic Chemicals Ltd.
13. Eastern Coalfields Ltd.
14. Tungabhadra Steel Products Ltd.
15. National Jute Manufactures Corporation Ltd.
The Board also reviewed the progress vis-à-vis itsrecommendations in respect of 6 CPSEs as mentioned below:
1. Indian Drugs & Pharmaceuticals Ltd.
2. IDPL (Tamil Nadu) Ltd.
3. Bihar Drugs & Organic Chemicals Ltd.
4. Madras Fertilizers Ltd.
5. Brahmaputra Valley Fertilizers Corporation Ltd.
6. Bharat Coking Coal Ltd.
In addition, the Board also reviewed, suo moto, theperformance of Hindustan Paper Corporation Ltd. and CentralCottage Industries Corporation of India Ltd., which have beenincurring losses continously in the previous two years.
12.4.2 Attracting talent to sick/loss making CPSEs
Based on the recommendations of BRPSE, furthermore, theGovernment has issued guidelines for retaining/attractingManagerial Talent in sick and loss making CPSEs for which revivalplan has been appropved. Accordingly, if any incumbent Boardlevel executive contributes exceedingly well in the turn around ofthe company, his tenure maybe extended to 65 years of age and alump-sum incentive may be given up to maximum of Rs. 10 lakhout of the profits of the CPSE besides usual pay, allowances andperks attached to the post.
12.5 Revival of Fertilizer PSUs
In addition, the Government had also given ‘in principle’approval to explore the possibility of revival of HindustanFertilizer Corporation Ltd. and Fertilizer Corporation of India Ltd.subject to the confirmed availability of gas. The Government hadestablished an Empowered Committee of Secretaries (ECoS) withthe mandate to evaluate all options of revival of closed units ofFCIL and HFCL, and make suitable recommendations forconsideration of the Government. The Government finallyapproved the Draft Rehabilitation Scheme (DRS) on 4.8.2011 forrevival of HFCL and FCIL envisaging a non-cash assistance of` 16731.55 crores and waiver of tax implication in this regard.cash infusion for revival will be made by public sector and privatesector companies.
12.6 Performance of sick CPSEs
The performance of 43 sick CPSEs approved for revival bythe Government, during the five-year period from 2006-07 to2010-11 is given in Annex-12.3. Out of the 43 CPSEs, 24 CPSEshave posted profit in 2010-11.
12.6.1 Turnaround Sick CPSEs
The Government issued guidelines for declaring a sick CPSEas “turnaround CPSE” in January 2011. These guidelines, interalia, define a turnaround CPSE as one which was in the list ofsick CPSEs of BRPSE and which has shown profit in each of thethree preceding accounting years and has a positive net worth afterimplementation of the revival package. Accordingly, 15 such CPSEshave been declared “turnaround CPSEs” as shown at Annex-12.4
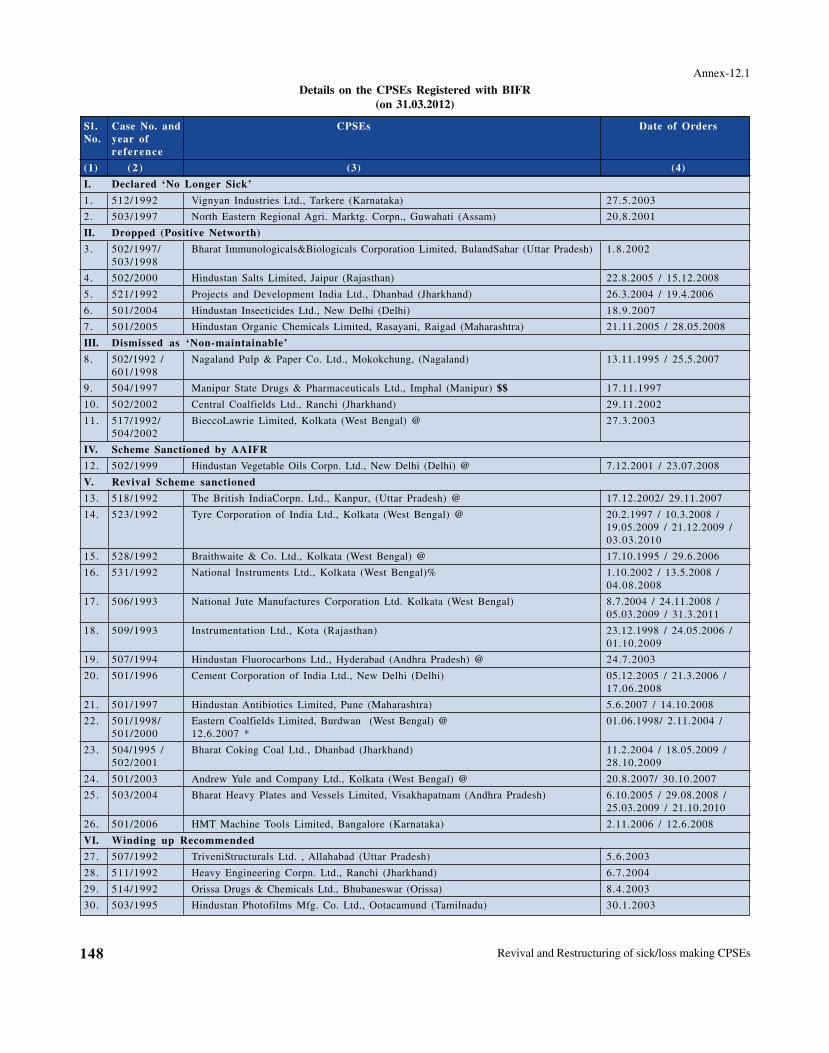
Revival and Restructuring of sick/loss making CPSEs148
Annex-12.1
Details on the CPSEs Registered with BIFR(on 31.03.2012)
Sl . Case No. and CPSEs Date of OrdersNo. year of
reference
(1) ( 2 ) (3) (4)
I. Declared ‘No Longer Sick’
1. 512/1992 Vignyan Industries Ltd., Tarkere (Karnataka) 27.5.2003
2. 503/1997 North Eastern Regional Agri. Marktg. Corpn., Guwahati (Assam) 20.8.2001
II. Dropped (Positive Networth)
3. 502/1997/ Bharat Immunologicals&Biologicals Corporation Limited, BulandSahar (Uttar Pradesh) 1.8.2002503/1998
4. 502/2000 Hindustan Salts Limited, Jaipur (Rajasthan) 22.8.2005 / 15.12.2008
5. 521/1992 Projects and Development India Ltd., Dhanbad (Jharkhand) 26.3.2004 / 19.4.2006
6. 501/2004 Hindustan Insecticides Ltd., New Delhi (Delhi) 18.9.2007
7. 501/2005 Hindustan Organic Chemicals Limited, Rasayani, Raigad (Maharashtra) 21.11.2005 / 28.05.2008
III. Dismissed as ‘Non-maintainable’
8. 502/1992 / Nagaland Pulp & Paper Co. Ltd., Mokokchung, (Nagaland) 13.11.1995 / 25.5.2007601/1998
9. 504/1997 Manipur State Drugs & Pharmaceuticals Ltd., Imphal (Manipur) $$ 17.11.1997
10. 502/2002 Central Coalfields Ltd., Ranchi (Jharkhand) 29.11.2002
11. 517/1992/ BieccoLawrie Limited, Kolkata (West Bengal) @ 27.3.2003504/2002
IV. Scheme Sanctioned by AAIFR
12. 502/1999 Hindustan Vegetable Oils Corpn. Ltd., New Delhi (Delhi) @ 7.12.2001 / 23.07.2008
V. Revival Scheme sanctioned
13. 518/1992 The British IndiaCorpn. Ltd., Kanpur, (Uttar Pradesh) @ 17.12.2002/ 29.11.2007
14. 523/1992 Tyre Corporation of India Ltd., Kolkata (West Bengal) @ 20.2.1997 / 10.3.2008 /19.05.2009 / 21.12.2009 /03.03.2010
15. 528/1992 Braithwaite & Co. Ltd., Kolkata (West Bengal) @ 17.10.1995 / 29.6.2006
16. 531/1992 National Instruments Ltd., Kolkata (West Bengal)% 1.10.2002 / 13.5.2008 /04.08.2008
17. 506/1993 National Jute Manufactures Corporation Ltd. Kolkata (West Bengal) 8.7.2004 / 24.11.2008 /05.03.2009 / 31.3.2011
18. 509/1993 Instrumentation Ltd., Kota (Rajasthan) 23.12.1998 / 24.05.2006 /01.10.2009
19. 507/1994 Hindustan Fluorocarbons Ltd., Hyderabad (Andhra Pradesh) @ 24.7.2003
20. 501/1996 Cement Corporation of India Ltd., New Delhi (Delhi) 05.12.2005 / 21.3.2006 /17.06.2008
21. 501/1997 Hindustan Antibiotics Limited, Pune (Maharashtra) 5.6.2007 / 14.10.2008
22. 501/1998/ Eastern Coalfields Limited, Burdwan (West Bengal) @ 01.06.1998/ 2.11.2004 /501/2000 12.6.2007 *
23. 504/1995 / Bharat Coking Coal Ltd., Dhanbad (Jharkhand) 11.2.2004 / 18.05.2009 /502/2001 28.10.2009
24. 501/2003 Andrew Yule and Company Ltd., Kolkata (West Bengal) @ 20.8.2007/ 30.10.2007
25. 503/2004 Bharat Heavy Plates and Vessels Limited, Visakhapatnam (Andhra Pradesh) 6.10.2005 / 29.08.2008 /25.03.2009 / 21.10.2010
26. 501/2006 HMT Machine Tools Limited, Bangalore (Karnataka) 2.11.2006 / 12.6.2008
VI. Winding up Recommended
27. 507/1992 TriveniStructurals Ltd. , Allahabad (Uttar Pradesh) 5.6.2003
28. 511/1992 Heavy Engineering Corpn. Ltd., Ranchi (Jharkhand) 6.7.2004
29. 514/1992 Orissa Drugs & Chemicals Ltd., Bhubaneswar (Orissa) 8.4.2003
30. 503/1995 Hindustan Photofilms Mfg. Co. Ltd., Ootacamund (Tamilnadu) 30.1.2003
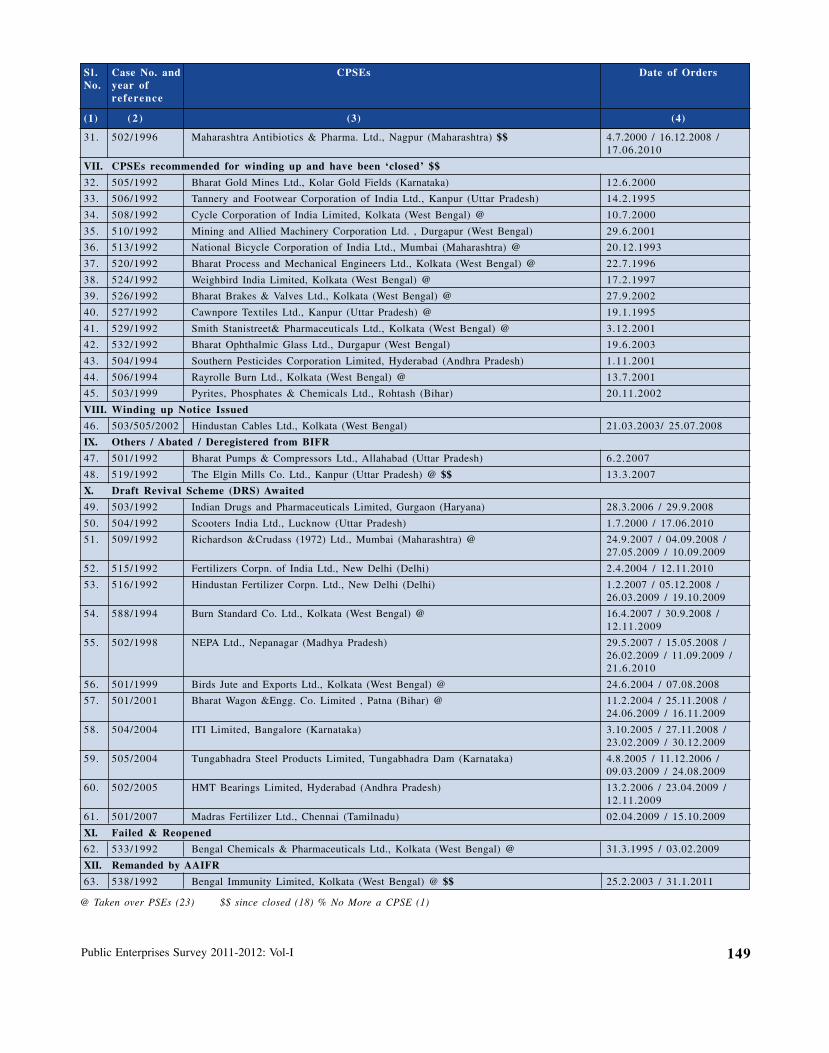
Public Enterprises Survey 2011-2012: Vol-I 149
31. 502/1996 Maharashtra Antibiotics & Pharma. Ltd., Nagpur (Maharashtra) $$ 4.7.2000 / 16.12.2008 /17.06.2010
VII. CPSEs recommended for winding up and have been ‘closed’ $$
32. 505/1992 Bharat Gold Mines Ltd., Kolar Gold Fields (Karnataka) 12.6.2000
33. 506/1992 Tannery and Footwear Corporation of India Ltd., Kanpur (Uttar Pradesh) 14.2.1995
34. 508/1992 Cycle Corporation of India Limited, Kolkata (West Bengal) @ 10.7.2000
35. 510/1992 Mining and Allied Machinery Corporation Ltd. , Durgapur (West Bengal) 29.6.2001
36. 513/1992 National Bicycle Corporation of India Ltd., Mumbai (Maharashtra) @ 20.12.1993
37. 520/1992 Bharat Process and Mechanical Engineers Ltd., Kolkata (West Bengal) @ 22.7.1996
38. 524/1992 Weighbird India Limited, Kolkata (West Bengal) @ 17.2.1997
39. 526/1992 Bharat Brakes & Valves Ltd., Kolkata (West Bengal) @ 27.9.2002
40. 527/1992 Cawnpore Textiles Ltd., Kanpur (Uttar Pradesh) @ 19.1.1995
41. 529/1992 Smith Stanistreet& Pharmaceuticals Ltd., Kolkata (West Bengal) @ 3.12.2001
42. 532/1992 Bharat Ophthalmic Glass Ltd., Durgapur (West Bengal) 19.6.2003
43. 504/1994 Southern Pesticides Corporation Limited, Hyderabad (Andhra Pradesh) 1.11.2001
44. 506/1994 Rayrolle Burn Ltd., Kolkata (West Bengal) @ 13.7.2001
45. 503/1999 Pyrites, Phosphates & Chemicals Ltd., Rohtash (Bihar) 20.11.2002
VIII. Winding up Notice Issued
46. 503/505/2002 Hindustan Cables Ltd., Kolkata (West Bengal) 21.03.2003/ 25.07.2008
IX. Others / Abated / Deregistered from BIFR
47. 501/1992 Bharat Pumps & Compressors Ltd., Allahabad (Uttar Pradesh) 6.2.2007
48. 519/1992 The Elgin Mills Co. Ltd., Kanpur (Uttar Pradesh) @ $$ 13.3.2007
X. Draft Revival Scheme (DRS) Awaited
49. 503/1992 Indian Drugs and Pharmaceuticals Limited, Gurgaon (Haryana) 28.3.2006 / 29.9.2008
50. 504/1992 Scooters India Ltd., Lucknow (Uttar Pradesh) 1.7.2000 / 17.06.2010
51. 509/1992 Richardson &Crudass (1972) Ltd., Mumbai (Maharashtra) @ 24.9.2007 / 04.09.2008 /27.05.2009 / 10.09.2009
52. 515/1992 Fertilizers Corpn. of India Ltd., New Delhi (Delhi) 2.4.2004 / 12.11.2010
53. 516/1992 Hindustan Fertilizer Corpn. Ltd., New Delhi (Delhi) 1.2.2007 / 05.12.2008 /26.03.2009 / 19.10.2009
54. 588/1994 Burn Standard Co. Ltd., Kolkata (West Bengal) @ 16.4.2007 / 30.9.2008 /12.11.2009
55. 502/1998 NEPA Ltd., Nepanagar (Madhya Pradesh) 29.5.2007 / 15.05.2008 /26.02.2009 / 11.09.2009 /21.6.2010
56. 501/1999 Birds Jute and Exports Ltd., Kolkata (West Bengal) @ 24.6.2004 / 07.08.2008
57. 501/2001 Bharat Wagon &Engg. Co. Limited , Patna (Bihar) @ 11.2.2004 / 25.11.2008 /24.06.2009 / 16.11.2009
58. 504/2004 ITI Limited, Bangalore (Karnataka) 3.10.2005 / 27.11.2008 /23.02.2009 / 30.12.2009
59. 505/2004 Tungabhadra Steel Products Limited, Tungabhadra Dam (Karnataka) 4.8.2005 / 11.12.2006 /09.03.2009 / 24.08.2009
60. 502/2005 HMT Bearings Limited, Hyderabad (Andhra Pradesh) 13.2.2006 / 23.04.2009 /12.11.2009
61. 501/2007 Madras Fertilizer Ltd., Chennai (Tamilnadu) 02.04.2009 / 15.10.2009
XI. Failed & Reopened
62. 533/1992 Bengal Chemicals & Pharmaceuticals Ltd., Kolkata (West Bengal) @ 31.3.1995 / 03.02.2009
XII. Remanded by AAIFR
63. 538/1992 Bengal Immunity Limited, Kolkata (West Bengal) @ $$ 25.2.2003 / 31.1.2011
@ Taken over PSEs (23) $$ since closed (18) % No More a CPSE (1)
Sl . Case No. and CPSEs Date of OrdersNo. year of
reference
(1) ( 2 ) (3) (4)
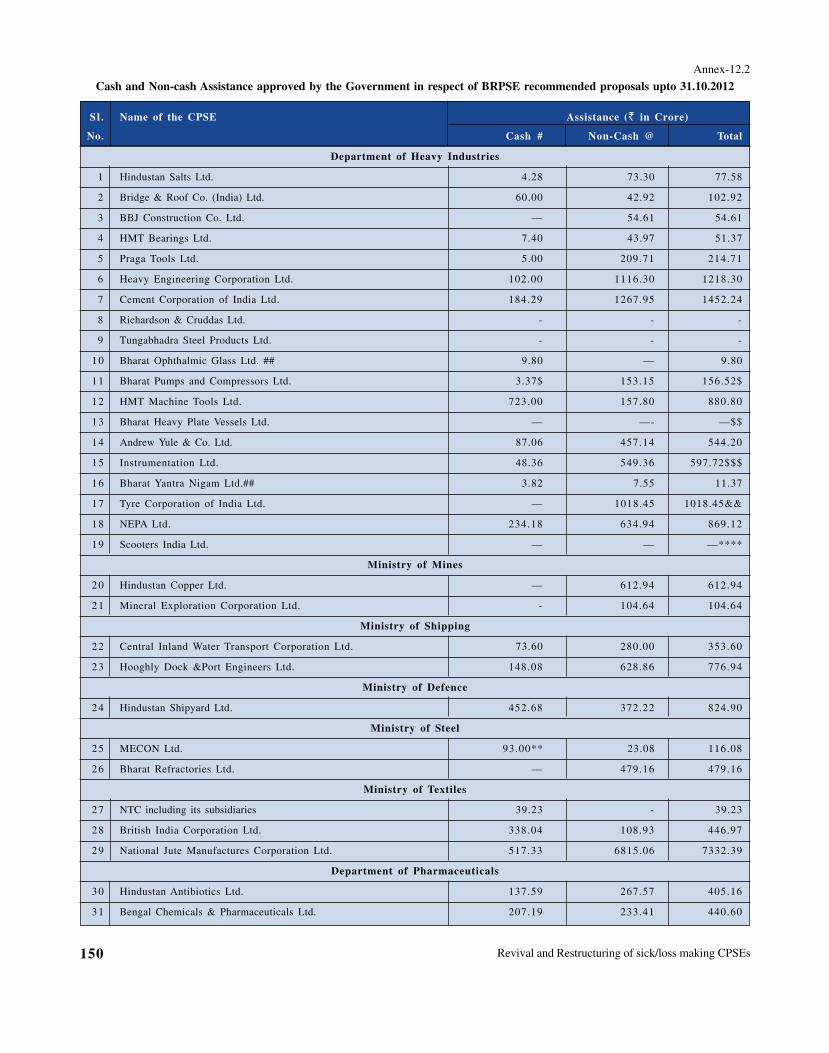
Revival and Restructuring of sick/loss making CPSEs150
Annex-12.2
Cash and Non-cash Assistance approved by the Government in respect of BRPSE recommended proposals upto 31.10.2012
Sl . Name of the CPSE Assistance (` in Crore)
No. Cash # Non-Cash @ Total
Department of Heavy Industries
1 Hindustan Salts Ltd. 4.28 73.30 77.58
2 Bridge & Roof Co. (India) Ltd. 60.00 42.92 102.92
3 BBJ Construction Co. Ltd. — 54.61 54.61
4 HMT Bearings Ltd. 7.40 43.97 51.37
5 Praga Tools Ltd. 5.00 209.71 214.71
6 Heavy Engineering Corporation Ltd. 102.00 1116.30 1218.30
7 Cement Corporation of India Ltd. 184.29 1267.95 1452.24
8 Richardson & Cruddas Ltd. - - -
9 Tungabhadra Steel Products Ltd. - - -
10 Bharat Ophthalmic Glass Ltd. ## 9.80 — 9.80
11 Bharat Pumps and Compressors Ltd. 3.37$ 153.15 156.52$
12 HMT Machine Tools Ltd. 723.00 157.80 880.80
13 Bharat Heavy Plate Vessels Ltd. — —- —$$
14 Andrew Yule & Co. Ltd. 87.06 457.14 544.20
15 Instrumentation Ltd. 48.36 549.36 597.72$$$
16 Bharat Yantra Nigam Ltd.## 3.82 7.55 11.37
17 Tyre Corporation of India Ltd. — 1018.45 1018.45&&
18 NEPA Ltd. 234.18 634.94 869.12
19 Scooters India Ltd. — — —****
Ministry of Mines
20 Hindustan Copper Ltd. — 612.94 612.94
21 Mineral Exploration Corporation Ltd. - 104.64 104.64
Ministry of Shipping
22 Central Inland Water Transport Corporation Ltd. 73.60 280.00 353.60
23 Hooghly Dock &Port Engineers Ltd. 148.08 628.86 776.94
Ministry of Defence
24 Hindustan Shipyard Ltd. 452.68 372.22 824.90
Ministry of Steel
25 MECON Ltd. 93.00** 23.08 116.08
26 Bharat Refractories Ltd. — 479.16 479.16
Ministry of Textiles
27 NTC including its subsidiaries 39.23 - 39.23
28 British India Corporation Ltd. 338.04 108.93 446.97
29 National Jute Manufactures Corporation Ltd. 517.33 6815.06 7332.39
Department of Pharmaceuticals
30 Hindustan Antibiotics Ltd. 137.59 267.57 405.16
31 Bengal Chemicals & Pharmaceuticals Ltd. 207.19 233.41 440.60

Public Enterprises Survey 2011-2012: Vol-I 151
Department of Chemicals & Petrochemicals
32 Hindustan Organic Chemicals Ltd. 250.00 110.46 360.46
33 Hindustan Insecticides Ltd. - 267.29 267.29
Department of Fertilizers
34 Fertilizers & Chemicals (Travancore) Ltd. - 670.37 670.37
Department of Scientific & Industrial Research
35 Central Electronics Ltd. - 16.28 16.28
Department of Coal
36 Eastern Coal Fields Ltd. —* —* —*
Department of Agriculture & Co-operation
37 State Forms Corporation of India Ltd. 21.21 124.42 145.63
Ministry of Railways
38 Konkan Railway Corporation Ltd. 857.05 3222.46 4079.51
39 Bharat Wagon &Engineering Company Ltd. 49.45 258.73 308.18
40 Braithwaite & Company Ltd. 4.00 280.21 284.21
41 Burn Standard Company Ltd.@@@ 75.43 1139.16 1214.59
Ministry of Water Resources
42 National Projects Construction Corporation Ltd. — 219.43*** 219.43***
Ministry of Housing & urban Poverty Alleviation
43 Hindustan Prefab Ltd. — 128.00 128.00
Ministry of Information & Broadcasting
44 National Film Development Corporation Ltd. 3.00 28.40 31.40
Ministry of Petroleum & Natural Gas
45 Biecco Lawrie Ltd. — 59.60 59.60
Total 4739.44 22237.83 26977.27
# Cash Assistance may involve budgetary support through equity/loan/grants.
@ Non-cash Assistance may involve waiver of interest, penal interest, GOI loan, Guarantee fee, conversion of loan into equity/debentures etc.
## Government have approved closure/winding up of these CPSEs.
* The revival plan approved by the Government inter alia envisaged non-cash assistance of Rs. 2470.77crore and waiver ofservice charges of ` 14 crore per annum from 2004-05 from Coal India Ltd.
$ In addition ONGC and BHEL would extend cash support to the extent of ` 150 crore and ` 20 crore respectively.
** Excludes continuation of 50% interest subsidy not exceeding ` 6.50 crore per annum on VRS loans.
$$ Cabinet approved “in principle” the takeover of BHPV by BHEL with the direction that the valuation of BHPV be carried outprudently on the basis of established principles and if the takeover is not found feasible, the matter be brought back before theCabinet.
&& Parliament had approved the Tyre Corporation of India Ltd. (Disinvestment of Ownership) Bill 2007 for changing the publicsector Enterprises Character of the company. Disinvestment after cleaning the balance sheet.
*** In addition Govt. had also approved the conversion of cumulative interest due & accrued on GOI loan as on the date of conversioninto equity capital and further written down to 10% of value.
$$$ Interest free mobilization advance of Rs.30 crore from BHEL for technological up-gradation and diversification which would berepaid through supplies to be made to BHEL against their orders. Interest free advance of ` 25 crore from BHEL to ILK at thebeginning of each year for the next three years from 2008-09 which will be adjusted against supplies to BHEL in the same year.
@@@ Transferred from D/o Heavy Industry. Refractory Unit of Burn Standard Co. Ltd. was transferred to SAIL under Ministry of Steel.
**** Transfer of entire Govt. equity to suitable identified strategic partner, continue extension of salary support and in principleapproval of cleaning the balance sheet at the time of seeking final approval for induction of strategic partner.
Sl . Name of the CPSE Assistance (` in Crore)
No. Cash # Non-Cash @ Total
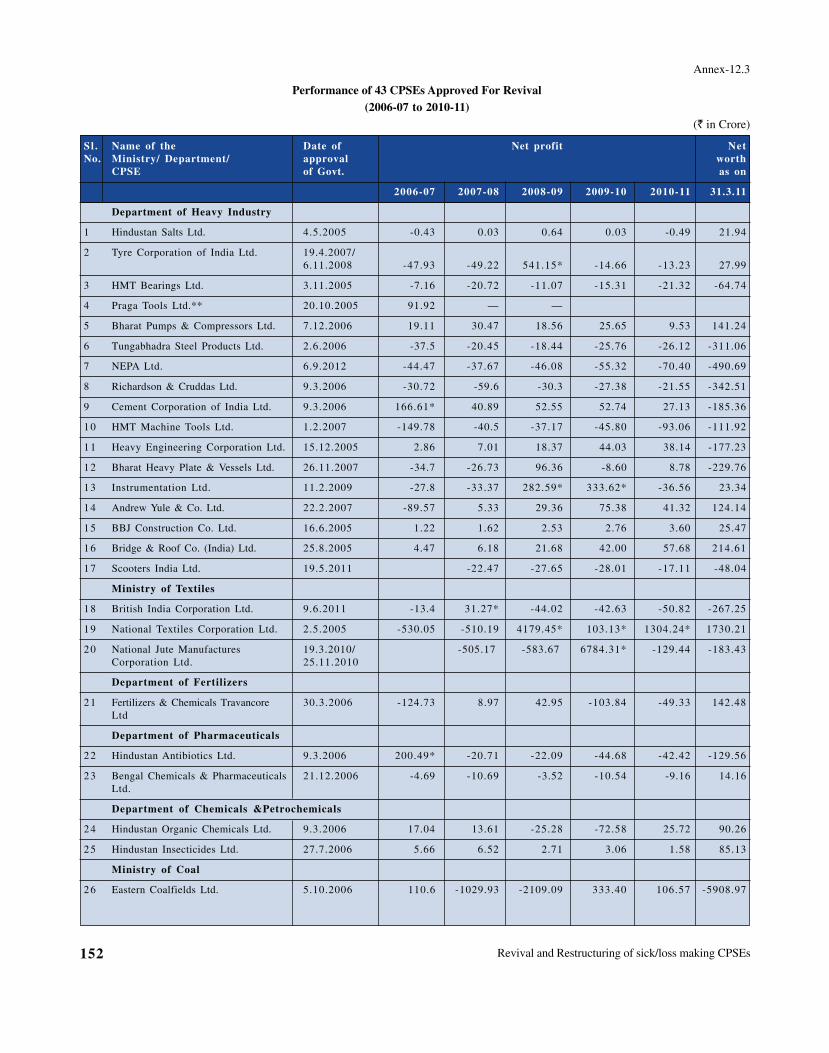
Revival and Restructuring of sick/loss making CPSEs152
Annex-12.3
Performance of 43 CPSEs Approved For Revival(2006-07 to 2010-11)
(` in Crore)
Sl . Name of the Date of Net profit NetNo. Ministry/ Department/ approval worth
CPSE of Govt. as on
2006-07 2007-08 2008-09 2009-10 2010-11 31.3.11
Department of Heavy Industry
1 Hindustan Salts Ltd. 4.5.2005 -0.43 0.03 0.64 0.03 -0.49 21.94
2 Tyre Corporation of India Ltd. 19.4.2007/6.11.2008 -47.93 -49.22 541.15* -14.66 -13.23 27.99
3 HMT Bearings Ltd. 3.11.2005 -7.16 -20.72 -11.07 -15.31 -21.32 -64.74
4 Praga Tools Ltd.** 20.10.2005 91.92 — —
5 Bharat Pumps & Compressors Ltd. 7.12.2006 19.11 30.47 18.56 25.65 9.53 141.24
6 Tungabhadra Steel Products Ltd. 2.6.2006 -37.5 -20.45 -18.44 -25.76 -26.12 -311.06
7 NEPA Ltd. 6.9.2012 -44.47 -37.67 -46.08 -55.32 -70.40 -490.69
8 Richardson & Cruddas Ltd. 9.3.2006 -30.72 -59.6 -30.3 -27.38 -21.55 -342.51
9 Cement Corporation of India Ltd. 9.3.2006 166.61* 40.89 52.55 52.74 27.13 -185.36
10 HMT Machine Tools Ltd. 1.2.2007 -149.78 -40.5 -37.17 -45.80 -93.06 -111.92
11 Heavy Engineering Corporation Ltd. 15.12.2005 2.86 7.01 18.37 44.03 38.14 -177.23
12 Bharat Heavy Plate & Vessels Ltd. 26.11.2007 -34.7 -26.73 96.36 -8.60 8.78 -229.76
13 Instrumentation Ltd. 11.2.2009 -27.8 -33.37 282.59* 333.62* -36.56 23.34
14 Andrew Yule & Co. Ltd. 22.2.2007 -89.57 5.33 29.36 75.38 41.32 124.14
15 BBJ Construction Co. Ltd. 16.6.2005 1.22 1.62 2.53 2.76 3.60 25.47
1 6 Bridge & Roof Co. (India) Ltd. 25.8.2005 4.47 6.18 21.68 42.00 57.68 214.61
17 Scooters India Ltd. 19.5.2011 -22.47 -27.65 -28.01 -17.11 -48.04
Ministry of Textiles
18 British India Corporation Ltd. 9.6.2011 -13.4 31.27* -44.02 -42.63 -50.82 -267.25
19 National Textiles Corporation Ltd. 2.5.2005 -530.05 -510.19 4179.45* 103.13* 1304.24* 1730.21
20 National Jute Manufactures 19.3.2010/ -505.17 -583.67 6784.31* -129.44 -183.43Corporation Ltd. 25.11.2010
Department of Fertilizers
21 Fertilizers & Chemicals Travancore 30.3.2006 -124.73 8.97 42.95 -103.84 -49.33 142.48Ltd
Department of Pharmaceuticals
22 Hindustan Antibiotics Ltd. 9.3.2006 200.49* -20.71 -22.09 -44.68 -42.42 -129.56
23 Bengal Chemicals & Pharmaceuticals 21.12.2006 -4.69 -10.69 -3.52 -10.54 -9.16 14.16Ltd.
Department of Chemicals &Petrochemicals
24 Hindustan Organic Chemicals Ltd. 9.3.2006 17.04 13.61 -25.28 -72.58 25.72 90.26
25 Hindustan Insecticides Ltd. 27.7.2006 5.66 6.52 2.71 3.06 1.58 85.13
Ministry of Coal
26 Eastern Coalfields Ltd. 5.10.2006 110.6 -1029.93 -2109.09 333.40 106.57 -5908.97
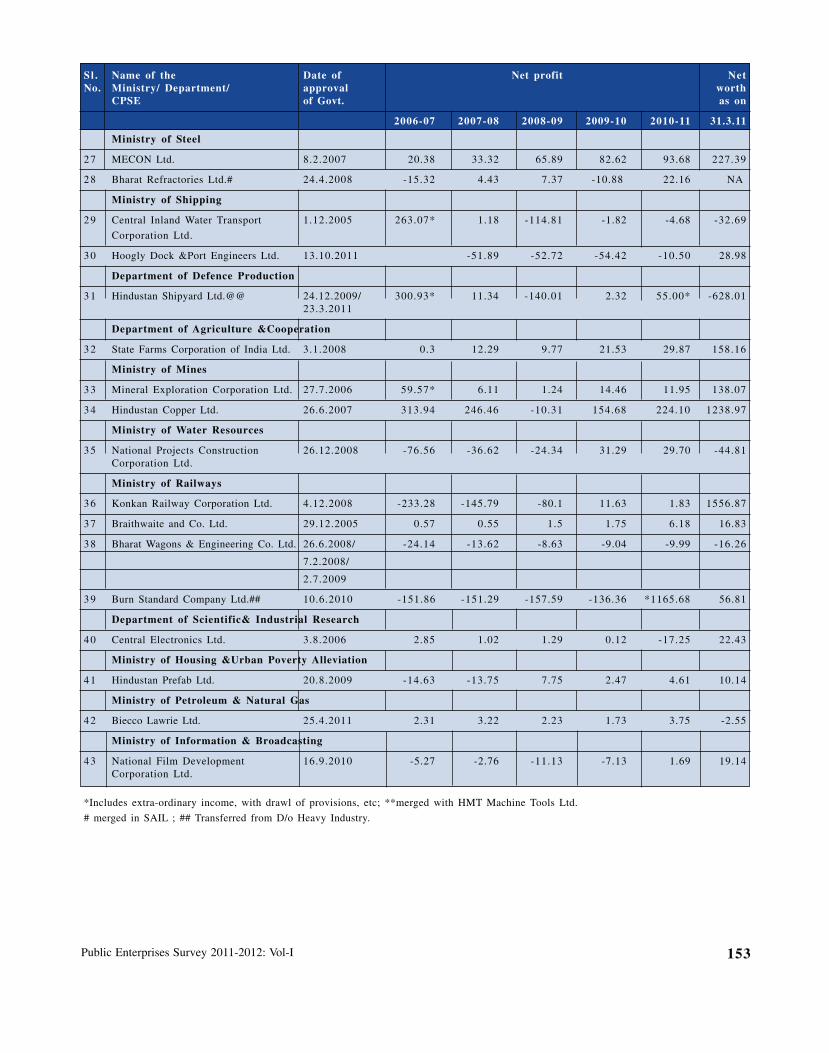
Public Enterprises Survey 2011-2012: Vol-I 153
Ministry of Steel
27 MECON Ltd. 8.2.2007 20.38 33.32 65.89 82.62 93.68 227.39
28 Bharat Refractories Ltd.# 24.4.2008 -15.32 4.43 7.37 -10.88 22.16 NA
Ministry of Shipping
29 Central Inland Water Transport 1.12.2005 263.07* 1.18 -114.81 -1.82 -4.68 -32.69
Corporation Ltd.
30 Hoogly Dock &Port Engineers Ltd. 13.10.2011 -51.89 -52.72 -54.42 -10.50 28.98
Department of Defence Production
31 Hindustan Shipyard Ltd.@@ 24.12.2009/ 300.93* 11.34 -140.01 2.32 55.00* -628.0123.3.2011
Department of Agriculture &Cooperation
32 State Farms Corporation of India Ltd. 3.1.2008 0.3 12.29 9.77 21.53 29.87 158.16
Ministry of Mines
33 Mineral Exploration Corporation Ltd. 27.7.2006 59.57* 6.11 1.24 14.46 11.95 138.07
34 Hindustan Copper Ltd. 26.6.2007 313.94 246.46 -10.31 154.68 224.10 1238.97
Ministry of Water Resources
35 National Projects Construction 26.12.2008 -76.56 -36.62 -24.34 31.29 29.70 -44.81Corporation Ltd.
Ministry of Railways
36 Konkan Railway Corporation Ltd. 4.12.2008 -233.28 -145.79 -80.1 11.63 1.83 1556.87
37 Braithwaite and Co. Ltd. 29.12.2005 0.57 0.55 1.5 1.75 6.18 16.83
38 Bharat Wagons & Engineering Co. Ltd. 26.6.2008/ -24.14 -13.62 -8.63 -9.04 -9.99 -16.26
7.2.2008/
2.7.2009
39 Burn Standard Company Ltd.## 10.6.2010 -151.86 -151.29 -157.59 -136.36 *1165.68 56.81
Department of Scientific& Industrial Research
40 Central Electronics Ltd. 3.8.2006 2.85 1.02 1.29 0.12 -17.25 22.43
Ministry of Housing &Urban Poverty Alleviation
41 Hindustan Prefab Ltd. 20.8.2009 -14.63 -13.75 7.75 2.47 4.61 10.14
Ministry of Petroleum & Natural Gas
42 Biecco Lawrie Ltd. 25.4.2011 2.31 3.22 2.23 1.73 3.75 -2.55
Ministry of Information & Broadcasting
43 National Film Development 16.9.2010 -5.27 -2.76 -11.13 -7.13 1.69 19.14Corporation Ltd.
*Includes extra-ordinary income, with drawl of provisions, etc; **merged with HMT Machine Tools Ltd.
# merged in SAIL ; ## Transferred from D/o Heavy Industry.
Sl . Name of the Date of Net profit NetNo. Ministry/ Department/ approval worth
CPSE of Govt. as on
2006-07 2007-08 2008-09 2009-10 2010-11 31.3.11
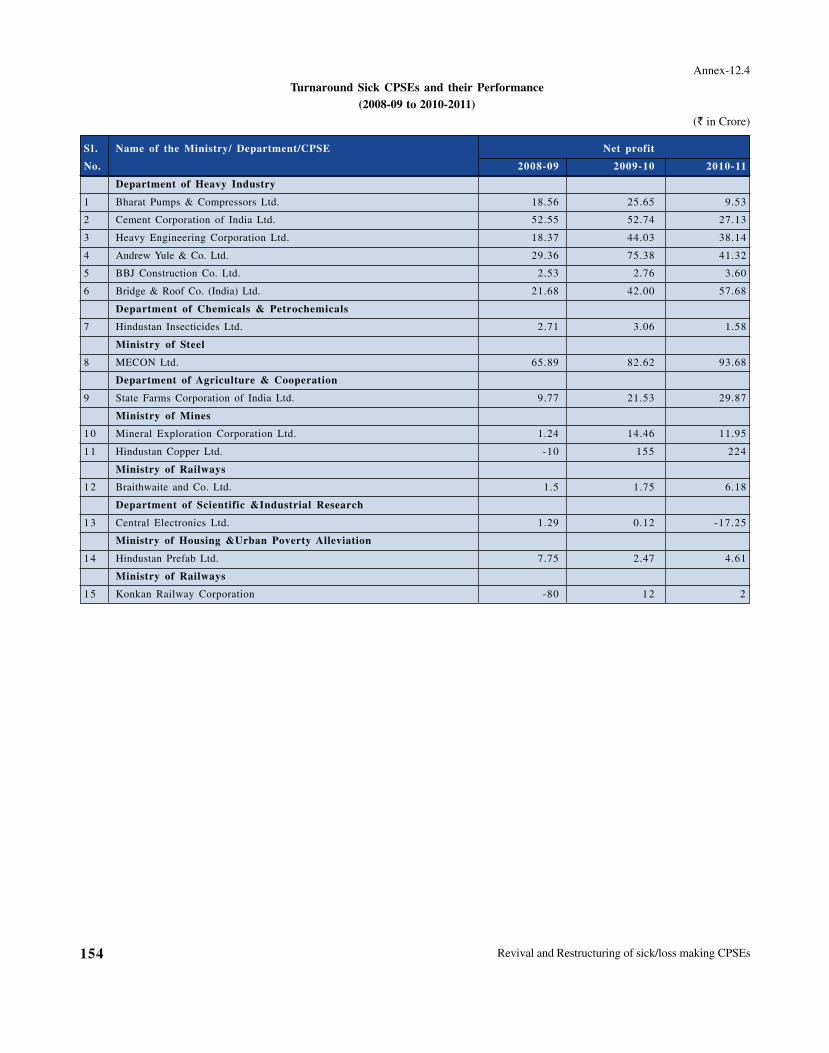
Revival and Restructuring of sick/loss making CPSEs154
Annex-12.4
Turnaround Sick CPSEs and their Performance(2008-09 to 2010-2011)
(` in Crore)
Sl . Name of the Ministry/ Department/CPSE Net profit
No. 2008-09 2009-10 2010-11
Department of Heavy Industry
1 Bharat Pumps & Compressors Ltd. 18.56 25.65 9.53
2 Cement Corporation of India Ltd. 52.55 52.74 27.13
3 Heavy Engineering Corporation Ltd. 18.37 44.03 38.14
4 Andrew Yule & Co. Ltd. 29.36 75.38 41.32
5 BBJ Construction Co. Ltd. 2.53 2.76 3.60
6 Bridge & Roof Co. (India) Ltd. 21.68 42.00 57.68
Department of Chemicals & Petrochemicals
7 Hindustan Insecticides Ltd. 2.71 3.06 1.58
Ministry of Steel
8 MECON Ltd. 65.89 82.62 93.68
Department of Agriculture & Cooperation
9 State Farms Corporation of India Ltd. 9.77 21.53 29.87
Ministry of Mines
10 Mineral Exploration Corporation Ltd. 1.24 14.46 11.95
11 Hindustan Copper Ltd. -10 155 224
Ministry of Railways
12 Braithwaite and Co. Ltd. 1.5 1.75 6.18
Department of Scientific &Industrial Research
13 Central Electronics Ltd. 1.29 0.12 -17.25
Ministry of Housing &Urban Poverty Alleviation
14 Hindustan Prefab Ltd. 7.75 2.47 4.61
Ministry of Railways
15 Konkan Railway Corporation -80 12 2
Public Enterprises Survey 2011-2012: Vol-I 155
Disinvestment and Listing on Stock Exchanges
Chapter-13
The policy of 'disinvestment' in Central Public SectorEnterprises (CPSEs) has evolved over the years. Disinvestmentof government equity in CPSEs began in 1991-92. The IndustrialPolicy Statement of 1991 stated that the Government would divestpart of its holdings in select CPSEs. Broadly, the objectives ofdivestment have been to raise resources, encourage wider publicparticipation and bring in greater market accountability. Thechronology of evolution of the policy on disinvestment since1991-92, with their distinct features is shown at Annex-13.1.
13.1 Disinvestment Commission
From 1991-92 to 1996-97, disinvestment in CPSEs washandled by the Department of Public Enterprises (DPE). DPEvide its resolution dated 23.8.1996, constituted a Public SectorDisinvestment Commission for a period of three years with Mr.G.V. Ramakrishna as its full time Chairman. The term of theCommission was further extended till 30.11.1999. TheCommission submitted its report on 58 CPSEs.
The Commission was reconstituted in July, 2001 for a periodof two years with Dr. R.M. Patil as its (part time) Chairman.The term of this Commission was subsequently extended tillOctober, 2004. The reconstituted Commission submitted itsreports on 41 CPSEs, including review cases of earlierCommission's recommendations on 4 CPSEs. The term of thecommission expired on 31.10. 2004 and the Commission waswound up.
13.2 Department of Disinvestment
During1997-98, the subject matter of 'disinvestment inCPSEs' was brought under Department of Economic Affairs(Ministry of Finance). Subsequently, the Department ofDisinvestment was constituted in the Ministry of Finance inDecember, 1999 with the following functions assigned to it:
(i) All matters relating to disinvestment of CentralGovernment equity from Central Public SectorUndertakings.
(ii) All matters relating to sale of Central Government equitythrough offer for sale or private placement in theerstwhile Central Public Sector Undertakings.*
(iii) Matters relating to decisions on the recommendations ofthe Disinvestment Commission on the modalities ofdisinvestment, including restructuring.
(iv) Matters relating to implementation of disinvestmentdecisions, including appointment of advisers, pricing ofshares, and other terms and conditions of disinvestment.
(v) Disinvestment Commission.
(vi) Central Public Sector Undertakings for purposes ofdisinvestment of Government equity only.
(vii) Financial Policy in regard to the utilization of theproceeds of disinvestment channelized into the NationalInvestment Fund.
*Note: All other post disinvestment matters, including thoserelating to and arising out of the exercise of Call option by theStrategic partner in the erstwhile Central Public SectorUndertakings, shall continue to be handled by the administrativeMinistry or Department concerned, where necessary, inconsultation with the Department of Disinvestment.
13.3 Evolution of Disinvestment Policy
The policy of disinvestment has largely evolved through thepolicy statements of Finance Ministers in their Budget Speeches.It may be construed to be an integral part of the reforms triggeredpost-1990's economic crisis. In brief the policy on disinvestmentcan be divided into three phases, viz.,
(i) 1991 to 1999: When the focus was on disinvestment ofminority shareholding in favour of financial institutions.
(ii) 1999-2000 to 2003-04: In the period the focus was ondisinvestment through strategic sale.
(iii) Since 2004-05: The focus is on disinvestment of minoritystakes in the domestic market to the general public inconjunction with issue of fresh equity by the company.
13.4 Current Policy on Disinvestment
The current policy on disinvestment envisages to developpeople's ownership of Central Public Sector Enterprises to sharein their wealth and prosperity while ensuring that the Governmentequity does not fall below 51% and Government retainsmanagement control:-
Keeping in view the objective of disinvestment policy, thefollowing approach to disinvestment has been adopted:
(i) Already listed profitable CPSEs (not meeting mandatoryshareholding of 10%) are to be made compliant by 'Offerfor Sale' by Government or by the CPSEs through issueof fresh shares or a combination of both.
(ii) Unlisted CPSEs with no accumulated losses and havingearned net profit in three preceding consecutive years areto be listed.
(iii) Follow-on public offers would be considered in respectof profitable CPSEs having 10 per cent or higher publicownership, taking into consideration the needs for capitalinvestment of CPSE, on a case by case basis andGovernment could simultaneously or independently offera portion of its equity shareholding in conjunction.
Disinvestment and Listing on Stock Exchanges156
(iv) Each CPSE has different equity structure; financialstrength; fund requirement; sector of operation etc.,factors that do not permit a uniform pattern ofdisinvestment. Therefore, disinvestment is considered onmerits and on a case-by-case basis.
(v) CPSEs have been permitted to use their surplus cash tobuyback their shares as well as one CPSE may buy theshares of other CPSEs from the Government.
13.5 Current Policy on Loss Making CPSEs
The Board for Reconstruction of Public Sector Enterprises(BRPSE) has been mandated to examine loss-making/sick CPSEsfor revival/restructuring for their turnaround and advise theGovernment on disinvestment/closure/sale in full or part, in respectof chronically loss-making/sick CPSEs that cannot be revived. Assuch if efforts to revive fail and the Government decides forprivatization, then the Department of Disinvestment will take upsuch cases for strategic sale.
13.6 Advantages of Listing
There are inherent advantages in the listing of shares ofprofitable CPSEs on the stock exchanges as it triggers multilayeredoversight mechanism to enhance corporate governance as well asprovides for level playing field to CPSEs vis-á-vis privatecompanies in regard to accessing the resources through the capitalmarket. The process enhances shareholder value in the listedCPSEs in the following ways:-
(a) The listed companies are mandated by Company Law/SEBI/ Stock Exchanges to comply with higher level ofdisclosures. This will bring greater transparency andcredibility;
(b) With the induction of independent directors, managementaccountability, competencies and performance areenhanced.
(c) Investor centric research provides on a regular basis athird party professional assessment of risks as well asfuture prospects to management to help it benchmarkits business model with the industry.
(d) Daily trading volume and prices work as a barometer forthe management and operate as a concurrent source offeedback with regard to the impact of managerial decisionsas well as shop floor developments. The higher levelsof public scrutiny promotes ethical conduct of businessand improves corporate culture; and
(e) Expectations of investors (shareholders) will bringproductive pressure upon the management to motivateit to perform efficiently to unlock the true value of theenterprise and also to strive to stand tall amongst thesector.
Listing of profitable CPSEs on the stock exchanges with amandatory public ownership of at least 10% shareholding has beenobserved to increase significantly the value of the Enterprise andGovernment's residual shareholding as well as that held by thepublic post-listing. Listing provides development of people-
ownership of CPSEs, thus encourage participation and sharingthe prosperity of CPSEs.
13.7 Disinvestment From 2004-05 Till January2012
Chronology of the evolution of the policy on disinvestmentsince 1991-92 is given at Annex.13.1. A brief review ofdisinvestment in various CPSEs since 2004-05 is given below:
National Thermal Power Corporation Limited (NTPC):NTPC Limited had proposed an Initial Public Offering (IPO)through issue of fresh equity of 5.25% of the fully diluted postissue equity of the company. Government on 12th July, 2004approved disinvestment of 5.25% equity of NTPC out ofGovernment's shareholding in conjunction with the IPO by thecompany. The IPO was completed in October 2004. An amountof ` 2684.07 crore was realized by the Government.
Maruti Udyog Limited (MUL) (Not a CPSU): Governmenton 2nd September, 2005 approved the proposal for disinvestmentof 8% equity in Maruti Udyog Limited. In January 2006Government sold 8% equity of the company out of its residualshareholding of 18.28% to public sector institutions and publicsector banks; through a differential pricing method. Governmentrealized `1567.60 crore from this sale. In March 2006 0.01%equity of the company was sold to the employees of the companyand the Government realized an amount of ` 2.08 crore.Government on 21st December 2006 decided that the Governmentmay disinvest its entire residual shareholding of 10.27% in MarutiUdyog Limited. The shareholding of 10.27% was disinvested inMay 2007 though the differential pricing method to Indian PublicSector Financial Institutions, Public Sector Banks and IndianMutual Funds. The Government realized ` 2277.62 crore fromthis disinvestment.
Power Grid Corporation of India Limited (PGCIL):Government on 8th February, 2007 approved disinvestment of5% equity of the company out of Government's shareholding alongwith the fresh issue of equity of 10% of the pre-issue paid-upcapital of PGCIL. The IPO was completed in October 2007 andGovernment realized an amount of ` 994.82 crore.
Rural Electrification Corporation Limited (REC):Government on 8th February, 2007 approved disinvestment of10% equity of the company out of Government's shareholdingalong with the fresh issue of equity of 10% of the pre-issue paid-up capital of REC. The IPO was completed in March 2008 andthe Government realized an amount of ` 819.63 crore.
NHPC Limited: Government on 8th February, 2007 approveddisinvestment of 5% equity of the company out of Government'sshareholding along with the fresh issue of equity of 10% of thepre-issue paid-up capital of NHPC Ltd. The IPO was completedin August 2009 and Government realized an amount of` 2012.85 crore.
Oil India Limited: Government on 30th August, 2007approved disinvestment of 10% equity of the company out ofGovernment's shareholding along with the fresh issue of equityof 11% of the post-issue paid-up capital of Oil India Limitedand Government to simultaneously disinvest 10% equity in favour
Public Enterprises Survey 2011-2012: Vol-I 157
of IOC, HPCL and BPCL in the ratio of 2:1:1, at the marketdiscovered price. The IPO was completed in September 2009 andGovernment realized an amount of Rs 2247.046 crore.
National Thermal Power Corporation Limited (NTPC):Government offered 5% pre Issue paid-up capital of NTPCLimited out of Government's shareholding through follow-onpublic offering in February 2010 and realized an amount of` 8480.10 crore.
Rural Electrification Corporation Limited (REC): Governmentoffered 5% pre Issue paid-up capital of REC Limited out ofGovernment's shareholding in conjunction with issue of freshequity of 15% by the Company through a follow-on publicoffering in March 2010 and Government realized an amount of` 882.52 crore.
NMDC Limited (NMDC): Government offered 8.38% preIssue paid-up capital of NMDC Limited out of Government'sshareholding through follow-on public offering in March 2010 andrealized an amount of Rs 9930.42 crores.
SJVN Limited (SJVNL): Government offered 10.03% preIssue paid-up capital of SJVN Limited out of Government'sshareholding through an Initial Public Offering in May 2010 andrealized an amount of ` 1062.74 crore.
Engineers India Limited (EIL): Government offered 10% preIssue paid-up capital of Engineers India Limited out ofGovernment's shareholding through a follow-on public offering inJuly 2010 and realized an amount of Rs 960 crore.
Coal India Ltd. (CIL): Government offered 10% pre Issuepaid-up equity capital of Coal India Ltd. out of Government'sshareholding though an initial public offering in October 2010 andrealized and amount of ` 15,199 crore.
Power Grid Corporation of India Ltd. (PGCIL): Governmentoffered 10% pre Issue paid-up capital of Power Grid Corporationof India Limited out of Government's shareholding in conjunctionwith issue of fresh equity of 10% by the Company through afollow-on public offering in November 2010 and realized anamount of ` 3,721.17 crore.
MOIL Limited (MOIL): Government offered 10% pre Issuepaid-up equity capital of MOIL Ltd. out of Government'sshareholding in conjunction with 5% each by Government ofMaharashtra and Government of Madhya Pradesh and realizedan amount of ` 618.74 crore.
Shipping Corporation of India Limited (SCIL): Governmentoffered 10% pre Issue paid-up capital of Shipping Corporationof India Limited out of Government's shareholding in conjunctionwith issue of fresh equity of 10% by the Company through afollow-on public offering and realized an amount of` 582.45 crore.
Power Finance Corporation (PFC): Government offered 5%pre-issue paid-up capital of Power Finance Corporation Ltd. outof Government's shareholding in conjunction with issue of freshequity of 15% by the Company through a follow-on publicoffering and realized an amount of ` 1144.55 crore.
Oil & Natural Gas Corporation of India Limited (ONGC):In March 2012 Government disinvested 4.91% paid-up equity
capital of the Company by way of Offer for Sale of Shares byPromoters through Stock Exchange Mechanism and realized anamount of ` 12,749.50 crore.
National Building Construction Corporation Limited (NBCC):In March/April 2012 Government disinvested 10% paid-up equitycapital of the Company out of Government's shareholding throughinitial public offering and realized an amount of ` 124.97 crore.
The disinvestment target for the year has been indicated as` 30,000 crore in the Budget 2012-13.
The summary of disinvestment receipts since 1991-92 tilldate is at Annex-13.2.
13.8 National Investment Funds
In January 2005, the Government decided to constitute a"National Investment Fund" (NIF) into which the realisation fromsale of minority shareholding of the Government in profitableCPSEs would be channelised. The Fund was to be maintainedoutside the Consolidated Fund of India. The income from the Fundis to be used for the following broad investment objectives: -
(a) Investment in social sector projects which promoteeducation, health care and employment;
(b) Capital investment in selected profitable and revivablePublic Sector Enterprises that yield adequate returns inorder to enlarge their capital base to finance expansion/diversification.
Corpus of NIF: The corpus of the Fund has remained at` 1814.45 crore being the proceeds from the disinvestment inPower Grid Corporation and Rural Electrification Corporation.The income generated on the same during 2009-10 was ` 110.57crores and during 20101-11 was ` 128.95 crores.
Use of Disinvestment Proceeds: In view of the difficulteconomic situation caused by the global slowdown of 2008-09and a severe drought that was likely to adversely affect the 11thPlan growth performance, Government in November 2009 decidedto give one time exemption for utilization of proceeds fromdisinvestment of CPSEs for a period of three years - from April2009 to March 2012. This has been extended to April 2013. Itwas decided that disinvestment proceeds during this period wouldbe available in full for investment in specific social sector schemesdecided by Planning Commission/Department of Expenditure. Thestatus quo ante would be restored from April 2013. However,the existing corpus of the NIF should continue to be managed bythe Fund Managers. Accordingly till march 2013 thedisinvestment proceeds are being used for funding the capitalexpenditure under the social sector schemes of the Government,namely:-
(i) Mahatma Gandhi National Rural Employment GuaranteeScheme
(ii) Indira Awas Yojana
(iii) Rajiv Gandhi Gramin Vidyutikaran Yojana
(iv) Jawaharlal Nehru National Urban Renewal Mission
(v) Accelerated Irrigation Benefits Programme
(vi) Accelerated Power Development Reform Programme
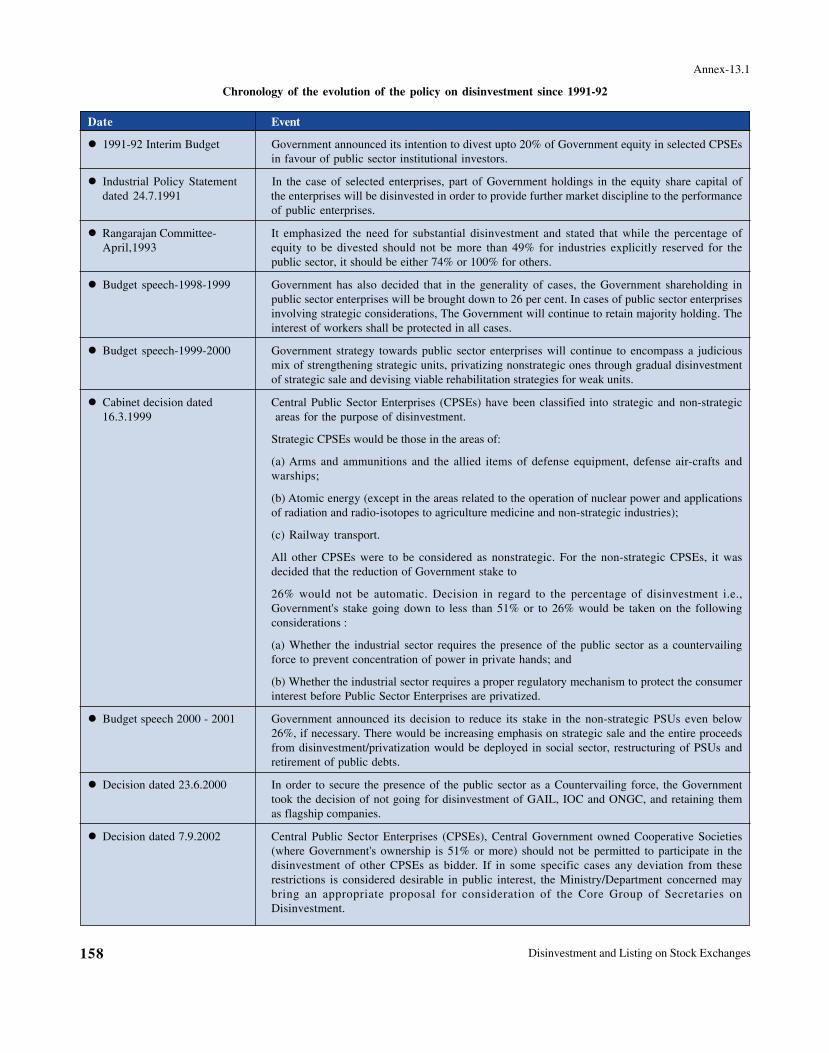
Disinvestment and Listing on Stock Exchanges158
Annex-13.1
Chronology of the evolution of the policy on disinvestment since 1991-92
Date Event
� 1991-92 Interim Budget Government announced its intention to divest upto 20% of Government equity in selected CPSEsin favour of public sector institutional investors.
� Industrial Policy Statement In the case of selected enterprises, part of Government holdings in the equity share capital ofdated 24.7.1991 the enterprises will be disinvested in order to provide further market discipline to the performance
of public enterprises.
� Rangarajan Committee- It emphasized the need for substantial disinvestment and stated that while the percentage ofApril,1993 equity to be divested should not be more than 49% for industries explicitly reserved for the
public sector, it should be either 74% or 100% for others.
� Budget speech-1998-1999 Government has also decided that in the generality of cases, the Government shareholding inpublic sector enterprises will be brought down to 26 per cent. In cases of public sector enterprisesinvolving strategic considerations, The Government will continue to retain majority holding. Theinterest of workers shall be protected in all cases.
� Budget speech-1999-2000 Government strategy towards public sector enterprises will continue to encompass a judiciousmix of strengthening strategic units, privatizing nonstrategic ones through gradual disinvestmentof strategic sale and devising viable rehabilitation strategies for weak units.
� Cabinet decision dated Central Public Sector Enterprises (CPSEs) have been classified into strategic and non-strategic16.3.1999 areas for the purpose of disinvestment.
Strategic CPSEs would be those in the areas of:
(a) Arms and ammunitions and the allied items of defense equipment, defense air-crafts andwarships;
(b) Atomic energy (except in the areas related to the operation of nuclear power and applicationsof radiation and radio-isotopes to agriculture medicine and non-strategic industries);
(c) Railway transport.
All other CPSEs were to be considered as nonstrategic. For the non-strategic CPSEs, it wasdecided that the reduction of Government stake to
26% would not be automatic. Decision in regard to the percentage of disinvestment i.e.,Government's stake going down to less than 51% or to 26% would be taken on the followingconsiderations :
(a) Whether the industrial sector requires the presence of the public sector as a countervailingforce to prevent concentration of power in private hands; and
(b) Whether the industrial sector requires a proper regulatory mechanism to protect the consumerinterest before Public Sector Enterprises are privatized.
� Budget speech 2000 - 2001 Government announced its decision to reduce its stake in the non-strategic PSUs even below26%, if necessary. There would be increasing emphasis on strategic sale and the entire proceedsfrom disinvestment/privatization would be deployed in social sector, restructuring of PSUs andretirement of public debts.
� Decision dated 23.6.2000 In order to secure the presence of the public sector as a Countervailing force, the Governmenttook the decision of not going for disinvestment of GAIL, IOC and ONGC, and retaining themas flagship companies.
� Decision dated 7.9.2002 Central Public Sector Enterprises (CPSEs), Central Government owned Cooperative Societies(where Government's ownership is 51% or more) should not be permitted to participate in thedisinvestment of other CPSEs as bidder. If in some specific cases any deviation from theserestrictions is considered desirable in public interest, the Ministry/Department concerned maybring an appropriate proposal for consideration of the Core Group of Secretaries onDisinvestment.
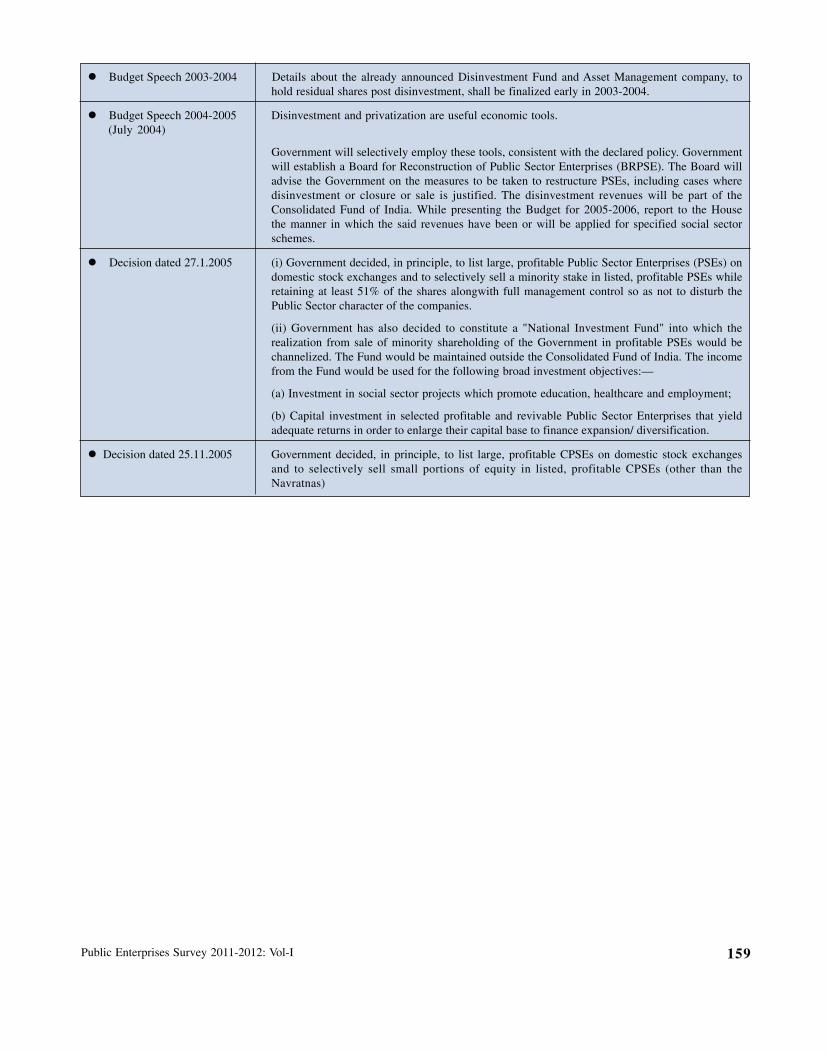
Public Enterprises Survey 2011-2012: Vol-I 159
� Budget Speech 2003-2004 Details about the already announced Disinvestment Fund and Asset Management company, tohold residual shares post disinvestment, shall be finalized early in 2003-2004.
� Budget Speech 2004-2005 Disinvestment and privatization are useful economic tools.(July 2004)
Government will selectively employ these tools, consistent with the declared policy. Governmentwill establish a Board for Reconstruction of Public Sector Enterprises (BRPSE). The Board willadvise the Government on the measures to be taken to restructure PSEs, including cases wheredisinvestment or closure or sale is justified. The disinvestment revenues will be part of theConsolidated Fund of India. While presenting the Budget for 2005-2006, report to the Housethe manner in which the said revenues have been or will be applied for specified social sectorschemes.
� Decision dated 27.1.2005 (i) Government decided, in principle, to list large, profitable Public Sector Enterprises (PSEs) ondomestic stock exchanges and to selectively sell a minority stake in listed, profitable PSEs whileretaining at least 51% of the shares alongwith full management control so as not to disturb thePublic Sector character of the companies.
(ii) Government has also decided to constitute a "National Investment Fund" into which therealization from sale of minority shareholding of the Government in profitable PSEs would bechannelized. The Fund would be maintained outside the Consolidated Fund of India. The incomefrom the Fund would be used for the following broad investment objectives:—
(a) Investment in social sector projects which promote education, healthcare and employment;
(b) Capital investment in selected profitable and revivable Public Sector Enterprises that yieldadequate returns in order to enlarge their capital base to finance expansion/ diversification.
� Decision dated 25.11.2005 Government decided, in principle, to list large, profitable CPSEs on domestic stock exchangesand to selectively sell small portions of equity in listed, profitable CPSEs (other than theNavratnas)
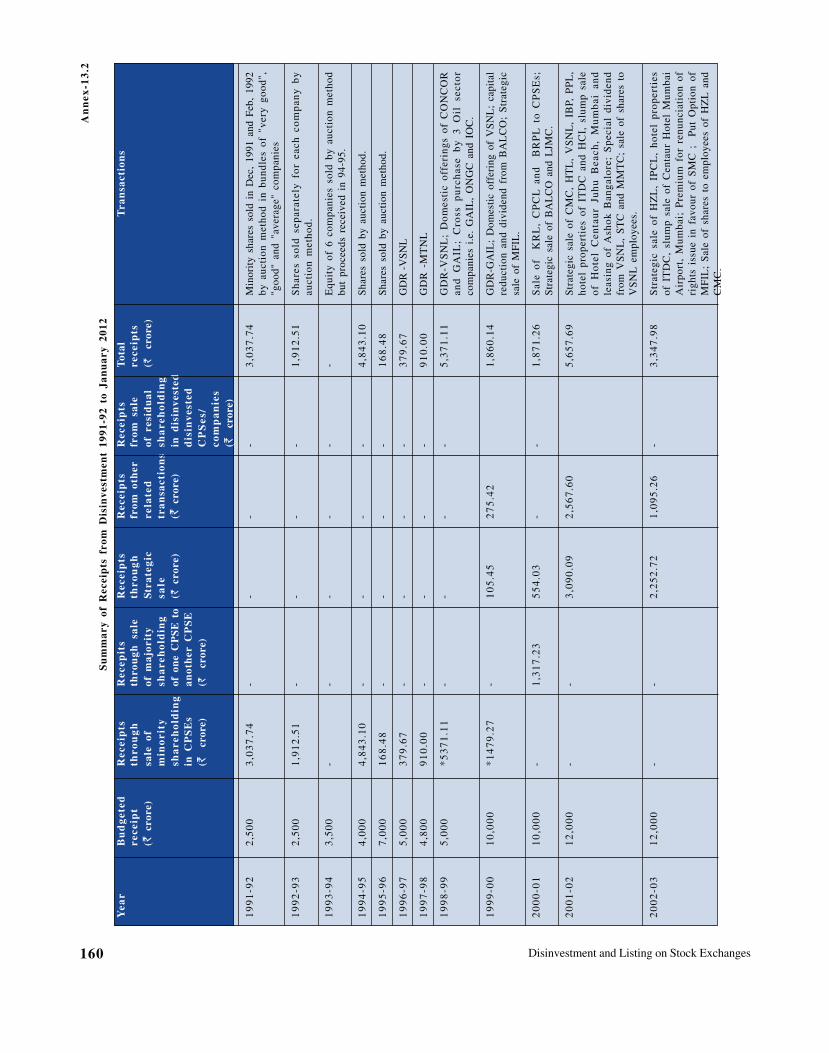
Disinvestment and Listing on Stock Exchanges160
An
nex
-13
.2
Su
mm
ary
of R
ecei
pts
fro
m D
isin
vest
men
t 19
91-9
2 to
Jan
uar
y 20
12
Yea
rB
ud
get
edR
ecei
pts
Rec
epit
sR
ecei
pts
Rec
eip
tsR
ecei
pts
Tot
alT
ran
sact
ion
sre
ceip
tth
rou
gh
thro
ugh
sal
eth
rou
gh
from
oth
erfr
om s
ale
rece
ipts
(` c
rore
)sa
le o
fof
maj
orit
ySt
rate
gic
rela
ted
of r
esid
ual
(`
cror
e)m
ino
rity
sha
reh
old
ing
sale
tra
nsa
ctio
ns
sha
reh
old
ing
sha
reh
old
ing
of o
ne
CP
SE
to
(` c
rore
)(`
cro
re)
in d
isin
vest
edin
CP
SE
san
oth
er C
PS
Ed
isin
ves
ted
(`
cror
e)(`
cr
ore)
CP
Ses
/co
mp
an
ies
(`
cror
e)
19
91
-92
2,5
00
3,0
37
.74
--
--
3,0
37
.74
Min
orit
y sh
ares
sol
d in
Dec
, 19
91 a
nd F
eb,
1992
by a
ucti
on m
etho
d in
bun
dles
of
"ver
y go
od",
"goo
d" a
nd "
aver
age"
com
pani
es
19
92
-93
2,5
00
1,9
12
.51
--
--
1,9
12
.51
Sh
ares
so
ld s
epar
atel
y f
or
each
co
mp
any
by
auct
ion
met
hod.
19
93
-94
3,5
00
--
--
--
Equ
ity
of 6
com
pani
es s
old
by a
ucti
on m
etho
dbu
t pr
ocee
ds r
ecei
ved
in 9
4-95
.
19
94
-95
4,0
00
4,8
43
.10
--
--
4,8
43
.10
Sha
res
sold
by
auct
ion
met
hod.
19
95
-96
7,0
00
16
8.4
8-
--
-1
68
.48
Sha
res
sold
by
auct
ion
met
hod.
19
96
-97
5,0
00
37
9.6
7-
--
-3
79
.67
GD
R -
VS
NL
19
97
-98
4,8
00
91
0.0
0-
--
-9
10
.00
GD
R -
MT
NL
19
98
-99
5,0
00
*5
37
1.1
1-
--
-5
,37
1.1
1G
DR
-VS
NL
; D
omes
tic
offe
ring
s of
CO
NC
OR
and
GA
IL;
Cro
ss p
urc
has
e b
y 3
Oil
sec
tor
com
pani
es i
.e.
GA
IL,
ON
GC
and
IO
C.
19
99
-00
10
,00
0*
14
79
.27
-1
05
.45
27
5.4
21
,86
0.1
4G
DR
-GA
IL;
Dom
esti
c of
feri
ng o
f V
SN
L;
capi
tal
redu
ctio
n an
d di
vide
nd f
rom
BA
LC
O;
Str
ateg
icsa
le o
f M
FIL
.
20
00
-01
10
,00
0-
1,3
17
.23
55
4.0
3-
-1
,87
1.2
6S
ale
of
KR
L,
CP
CL
an
d
BR
PL
to
CP
SE
s;S
trat
egic
sal
e of
BA
LC
O a
nd L
JMC
.
20
01
-02
12
,00
0-
-3
,09
0.0
92
,56
7.6
05
,65
7.6
9S
trat
egic
sal
e of
CM
C,
HT
L,
VS
NL
, IB
P, P
PL
,ho
tel
prop
erti
es o
f IT
DC
and
HC
I, s
lum
p sa
leo
f H
ote
l C
enta
ur
Juh
u B
each
, M
um
bai
an
dle
asin
g of
Ash
ok B
anga
lore
; S
peci
al d
ivid
end
from
VS
NL
, S
TC
and
MM
TC
; sa
le o
f sh
ares
to
VS
NL
em
ploy
ees.
20
02
-03
12
,00
0-
-2
,25
2.7
21
,09
5.2
6-
3,3
47
.98
Str
ateg
ic s
ale
of H
ZL
, IP
CL
, ho
tel
prop
erti
esof
IT
DC
, sl
ump
sale
of
Cen
taur
Hot
el M
umba
iA
irpo
rt,
Mum
bai;
Pre
miu
m f
or r
enun
ciat
ion
ofri
ghts
iss
ue i
n fa
vour
of
SM
C ;
P
ut O
ptio
n of
MF
IL;
Sal
e of
sha
res
to e
mpl
oyee
s of
HZ
L a
ndC
MC
.
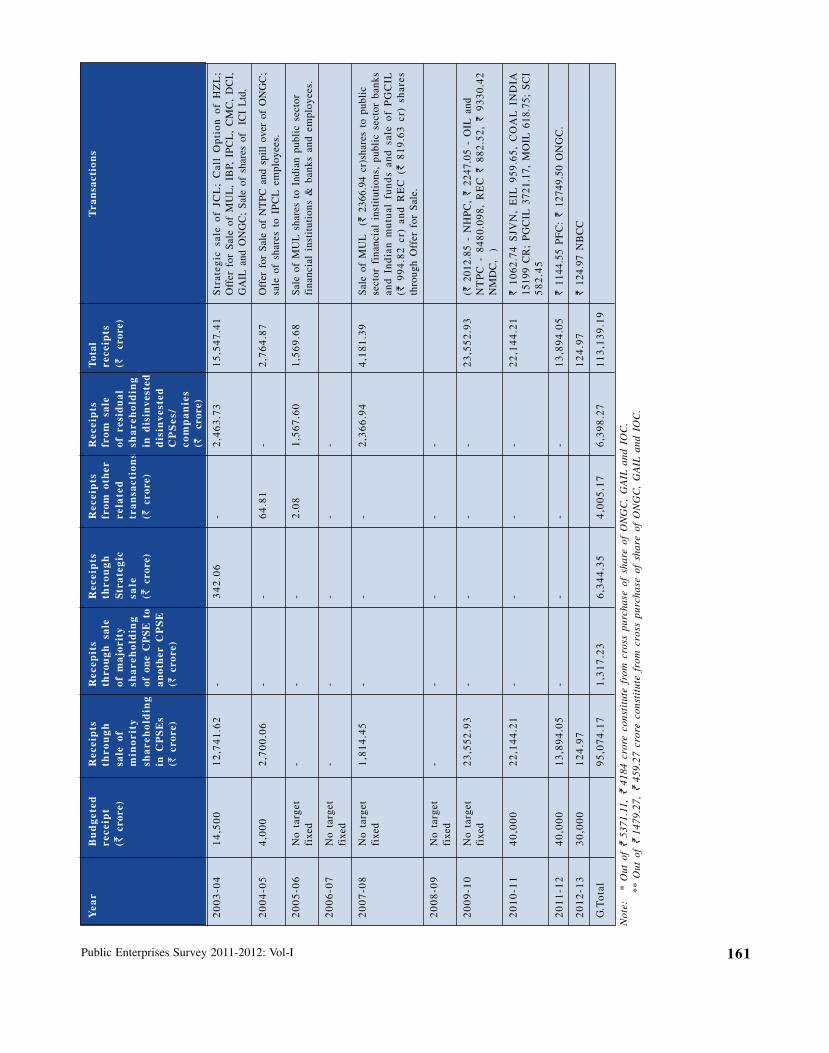
Public Enterprises Survey 2011-2012: Vol-I 161
Yea
rB
ud
get
edR
ecei
pts
Rec
epit
sR
ecei
pts
Rec
eip
tsR
ecei
pts
Tot
alT
ran
sact
ion
sre
ceip
tth
rou
gh
thro
ugh
sal
eth
rou
gh
from
oth
erfr
om s
ale
rece
ipts
(` c
rore
)sa
le o
fof
maj
orit
ySt
rate
gic
rela
ted
of r
esid
ual
(`
cror
e)m
ino
rity
sha
reh
old
ing
sale
tra
nsa
ctio
ns
sha
reh
old
ing
sha
reh
old
ing
of o
ne
CP
SE
to
(` c
rore
)(`
cro
re)
in d
isin
vest
edin
CP
SE
san
oth
er C
PS
Ed
isin
ves
ted
(` c
rore
)(`
cro
re)
CP
Ses
/co
mp
an
ies
(`
cror
e)
20
03
-04
14
,50
01
2,7
41
.62
-3
42
.06
-2
,46
3.7
31
5,5
47
.41
Str
ateg
ic s
ale
of
JCL
; C
all
Op
tio
n o
f H
ZL
;O
ffer
for
Sal
e of
MU
L,
IBP,
IP
CL
, C
MC
, D
CI,
GA
IL a
nd O
NG
C;
Sal
e of
sha
res
of
ICI
Ltd
.
20
04
-05
4,0
00
2,7
00
.06
--
64
.81
-2
,76
4.8
7O
ffer
for
Sal
e of
NT
PC
and
spi
ll o
ver
of O
NG
C;
sale
of
shar
es t
o IP
CL
em
ploy
ees.
20
05
-06
No
targ
et-
--
2.0
81
,56
7.6
01
,56
9.6
8S
ale
of M
UL
sha
res
to I
ndia
n pu
blic
sec
tor
fixe
dfi
nanc
ial
inst
itut
ions
& b
anks
and
em
ploy
ees.
20
06
-07
No
targ
et-
--
--
fixe
d
20
07
-08
No
targ
et1
,81
4.4
5-
--
2,3
66
.94
4,1
81
.39
Sal
e of
MU
L
(` 23
66.9
4 cr
)sha
res
to p
ubli
cfi
xed
sect
or f
inan
cial
ins
titu
tion
s, p
ubli
c se
ctor
ban
ksan
d I
nd
ian
mu
tual
fu
nd
s an
d s
ale
of
PG
CIL
(` 9
94
.82
cr)
an
d R
EC
(`
8
19
.63
cr)
sh
ares
thro
ugh
Off
er f
or S
ale.
20
08
-09
No
targ
et-
--
--
fixe
d
20
09
-10
No
targ
et2
3,5
52
.93
--
--
23
,55
2.9
3(`
20
12.8
5 -
NH
PC
, `
22
47.0
5 -
OIL
and
fixe
dN
TP
C -
848
0.09
8, R
EC
` 88
2.52
, `
93
30.4
2N
MD
C,
)
20
10
-11
40
,00
02
2,1
44
.21
--
--
22
,14
4.2
1`
1
06
2.7
4 S
JVN
, E
IL 9
59
.65
, C
OA
L I
ND
IA15
199
CR
; P
GC
IL 3
721.
17,
MO
IL 6
18.7
5; S
CI
58
2.4
5
20
11
-12
40
,00
01
3,8
94
.05
--
--
13
,89
4.0
5`
11
44.5
5 P
FC
: `
12
749.
50 O
NG
C.
20
12
-13
30
,00
01
24
.97
12
4.9
7`
12
4.97
NB
CC
G.T
ota
l9
5,0
74
.17
1,3
17
.23
6,3
44
.35
4,0
05
.17
6,3
98
.27
11
3,1
39
.19
Not
e:*
Out
of
` 53
71.1
1, `
41
84 c
rore
con
stit
ute
from
cro
ss p
urch
ase
of s
hare
of
ON
GC
, G
AIL
and
IO
C.
** O
ut o
f `
14
79.2
7, `
45
9.27
cro
re c
onst
itut
e fr
om c
ross
pur
chas
e of
sha
re o
f O
NG
C,
GA
IL a
nd I
OC
.
Disinvestment and Listing on Stock Exchanges162
Listing means admission of securities to dealings on arecognized stock exchange. The securities may be of any publiclimited company, Central or State Government, quasi governmentaland other financial institutions/corporations, municipalities, etc.
The objectives of listing are mainly to :
� provide liquidity to securities;
� mobilize savings for economic development;
� protect interest of investors by ensuring full disclosures.
The Bombay Stock Exchange (BSE) has a dedicated ListingDepartment to grant approval for listing of securities of companiesin accordance with the provisions of the Securities Contracts(Regulation) Act, 1956, Securities Contracts (Regulation) Rules,1957, Companies Act, 1956, Guidelines issued by SEBI and Rules,Bye-laws and Regulations of BSE.
BSE has set various guidelines and forms that need to beadhered to and submitted by the companies. These guidelines willhelp companies to expedite the fulfillment of the various formalitiesand disclosure requirements that are required at various stages of
� Initial Public Offering;
� Further Public Offering;
� Preferential Issues;
� Indian Depository Receipts;
� Amalgamation;
� Qualified Institutions Placements.
A company intending to have its securities listed on BSE hasto comply with the listing requirements prescribed by it. Some ofthe requirements are as under :
I Minimum Listing Requirements for New Companies;
II Minimum Listing Requirements for Companies alreadyListed on other Stock Exchanges;
III Minimum Requirements for Companies Delisted by BSEseeking relisting on BSE;
IV Permission to Use the Name of BSE in an Issuer Company'sProspectus;
V Submission of Letter of Application;
VI Allotment of Securities;
VII Trading Permission;
VIII Requirement of 1% Security;
IX Payment of Listing Fees;
X Compliance with the Listing Agreement; and
XI Cash Management Services (CMS) - Collection of ListingFees.
[I] Minimum Listing Requirements for NewCompanies
The following eligibility criteria have been prescribed effectiveAugust 1, 2006 for listing of companies on BSE, through InitialPublic Offerings (IPOs) & Follow-on Public Offerings (FPOs):
1. Companies have been classified as large cap companiesand small cap companies. A large cap company is acompany with a minimum issue size of Rs. 10 crore andmarket capitalization of not less than Rs. 25 crore. A smallcap company is a company other than a large capcompany.
a. In respect of Large Cap Companies
i. The minimum post-issue paid-up capital of theapplicant company (hereinafter referred to as "theCompany") shall be Rs. 3 crore;
ii. The minimum issue size shall be Rs. 10 crore; and
iii. The minimum market capitalization of theCompany shall be Rs. 25 crore (marketcapitalization shall be calculated by multiplying thepost-issue paid-up number of equity shares withthe issue price).
b. In respect of Small Cap Companies
i. The minimum post-issue paid-up capital of theCompany shall be Rs. 3 crore;
ii. The minimum issue size shall be Rs. 3 crore;
iii. The minimum market capitalization of theCompany shall be Rs. 5 crore (marketcapitalization shall be calculated by multiplyingthe post-issue paid-up number of equity shareswith the issue price);
iv. The minimum income/turnover of the Companyshall be Rs. 3 crore in each of the preceding three12-months period;
v. The minimum number of public shareholders afterthe issue shall be 1000; and
vi. A due diligence study may be conducted by anindependent team of Chartered Accountants orMerchant Bankers appointed by BSE, the costof which will be borne by the company. Therequirement of a due diligence study may bewaived if a financial institution or a scheduledcommercial bank has appraised the project in thepreceding 12 months.
Guidelines for Listing on BSE
Annex-13.3
Public Issues :
Public Enterprises Survey 2011-2012: Vol-I 163
2. For all companies :
a. In respect of the requirement of paid-up capital andmarket capitalization, the issuers shall be requiredto include in the disclaimer clause forming a part ofthe offer document that in the event of the marketcapitalization (product of issue price and the postissue number of shares) requirement of BSE not beingmet, the securities of the issuer would not be listedon BSE.
b. The applicant, promoters and/or group companies,shall not be in default in compliance of the listingagreement.
c. The above eligibility criteria would be in addition tothe conditions prescribed under SEBI (Disclosure andInvestor Protection) Guidelines, 2000.
[II] Minimum Listing Requirements for Companiesalready Listed on Other Stock Exchanges
The listing norms for companies already listed on other stockexchanges and seeking listing at BSE, made effective fromAugust 6, 2002, are as under:
1. The company shall have a minimum issued and paid upequity capital of ` 3 crore.
2. The company shall have a profit making track recordfor the preceding last three years. The revenues/profitsarising out of extra ordinary items or income from anysource of non-recurring nature shall be excluded whilecalculating the profit making track record.
3. Minimum net worth shall be ` 20 crore (net worthincludes equity capital and free reserves excludingrevaluation reserves).
4. Minimum market capitalisation of the listed capital shallbe at least two times of the paid up capital.
5. The company shall have a dividend paying track recordfor at least the last 3 consecutive years and the dividendshould be at least 10% in each year.
6. Minimum 25% of the company's issued capital shall bewith Non-Promoter shareholders as per Clause 35 ofthe Listing Agreement. Out of above Non-Promoterholding, no single shareholder shall hold more than 0.5%of the paid-up capital of the company individually orjointly with others except in case of Banks/FinancialInstitutions/Foreign Institutional Investors/OverseasCorporate Bodies and Non-Resident Indians.
7. The company shall have at least two years listing recordwith any of the Regional Stock Exchanges.
8. The company shall sign an agreement with CDSL andNSDL for demat trading.
[III] Minimum Requirements for CompaniesDelisted by BSE seeking Relisting on BSE
Companies delisted by BSE and seeking relisting at BSE arerequired to make a fresh public offer and comply with the extantguidelines of SEBI and BSE regarding initial public offerings.
[IV] Permission to Use the Name of BSE in an IssuerCompany's Prospectus
Companies desiring to list their securities offered through apublic issue are required to obtain prior permission of BSE to usethe name of BSE in their prospectus or offer for sale documentsbefore filing the same with the concerned office of the Registrarof Companies.
BSE has a Listing Committee , comprising of market experts,which decides upon the matter of granting permission tocompanies to use the name of BSE in their prospectus/offerdocuments. This Committee evaluates the promoters, company,project , financials, risk factors and several other aspects beforetaking a decision in this regard.
Decision with regard to some types/sizes of companies hasbeen delegated to the Internal Committee of BSE.
[V] Submission of Letter of Application
As per Section 73 of the Companies Act, 1956, a companyseeking listing of its securities on BSE is required to submit aLetter of Application to all the stock exchanges where it proposesto have its securities listed before filing the prospectus with theRegistrar of Companies.
[VI] Allotment of Securities
As per the Listing Agreement, a company is required tocomplete the allotment of securities offered to the public within30 days of the date of closure of the subscription list and approachthe Designated Stock Exchange for approval of the basis ofallotment.
In case of Book Building issues, allotment shall be made notlater than 15 days from the closure of the issue, failing whichinterest at the rate of 15% shall be paid to the investors.
[VII] Trading Permission
As per SEBI Guidelines, an issuer company should completethe formalities for trading at all the stock exchanges where thesecurities are to be listed within 7 working days of finalization ofthe basis of allotment.
A company should scrupulously adhere to the time limitspecified in SEBI (Disclosure and Investor Protection) Guidelines2000 for allotment of all securities and dispatch of allotmentletters/share certificates/credit in depository accounts and refundorders and for obtaining the listing permissions of all the exchangeswhose names are stated in its prospectus or offer document. Inthe event of listing permission to a company being denied by anystock exchange where it had applied for listing of its securities,the company cannot proceed with the allotment of shares.However, the company may file an appeal before SEBI underSection 22 of the Securities Contracts (Regulation) Act, 1956.
Disinvestment and Listing on Stock Exchanges164
[VIII] Requirement of 1% Security
Companies making public/rights issues are required to deposit1% of the issue amount with the Designated Stock Exchange beforethe issue opens. This amount is liable to be forfeited in the eventof the company not resolving the complaints of investors regardingdelay in sending refund orders/share certificates, non-payment ofcommission to underwriters, brokers, etc.
[IX] Payment of Listing Fees
All companies listed on BSE are required to pay to BSE theAnnual Listing Fees by 30th April of every financial year as perthe Schedule of Listing Fees prescribed from time to time.
[X] Compliance with the Listing Agreement
Companies desirous of getting their securities listed at BSEare required to enter into an agreement with BSE called the ListingAgreement, under which they are required to make certaindisclosures and perform certain acts, failing which the companymay face some disciplinary action, including suspension/delistingof securities. As such, the Listing Agreement is of great importanceand is executed under the common seal of a company. Under the
Listing Agreement, a company undertakes, amongst other things,to provide facilities for prompt transfer, registration, sub-divisionand consolidation of securities; to give proper notice of closure oftransfer books and record dates, to forward 6 copies of unabridgedAnnual Reports, Balance Sheets and Profit and Loss Accounts toBSE, to file shareholding patterns and financial results on aquarterly basis; to intimate promptly to the Exchange thehappenings which are likely to materially affect the financialperformance of the Company and its stock prices, to comply withthe conditions of Corporate Governance, etc.
The Listing Department of BSE monitors the compliance bythe companies with the provisions of the Listing Agreement,especially with regard to timely payment of annual listing fees,submission of results, shareholding patterns and corporategovernance reports on a quarterly basis . Penal action is takenagainst the defaulting companies.
[XI] Cash Management Services (CMS)-Collection ofListing Fees
In order to simplify the system of payment of listing fees,BSE has entered into an arrangement with HDFC Bank forcollection of listing fees from 141 locations all over the country.
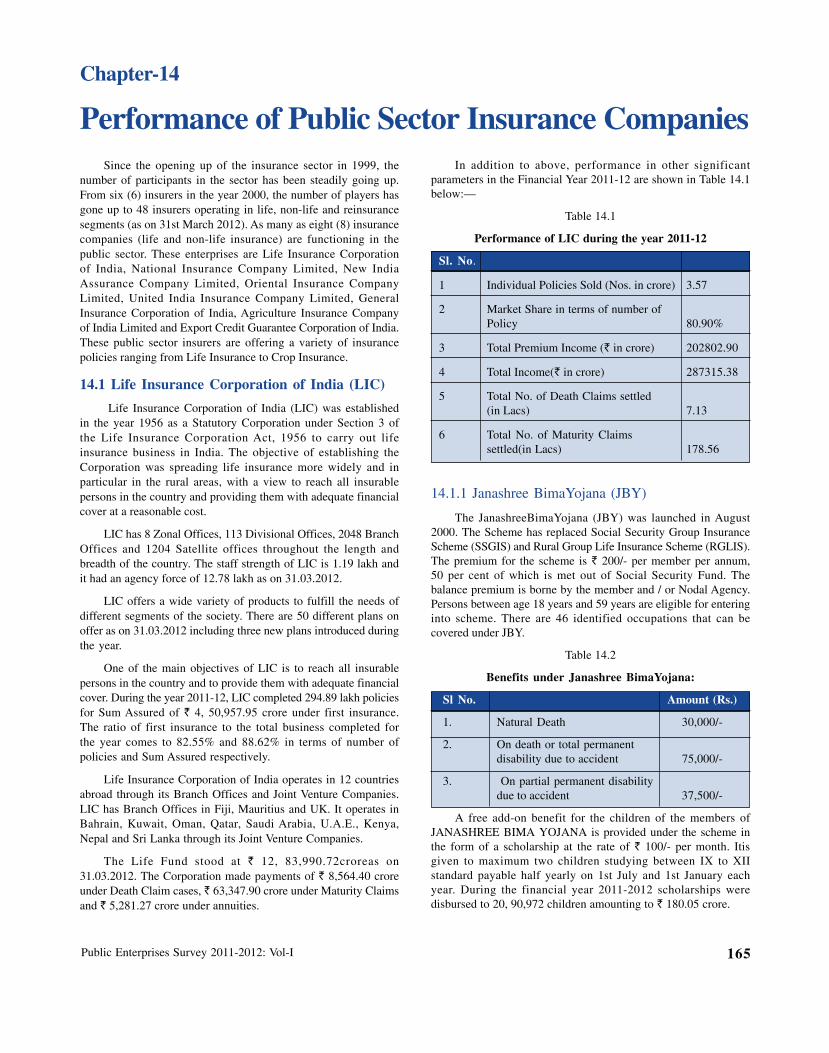
Public Enterprises Survey 2011-2012: Vol-I 165
Performance of Public Sector Insurance Companies
Chapter-14
Since the opening up of the insurance sector in 1999, thenumber of participants in the sector has been steadily going up.From six (6) insurers in the year 2000, the number of players hasgone up to 48 insurers operating in life, non-life and reinsurancesegments (as on 31st March 2012). As many as eight (8) insurancecompanies (life and non-life insurance) are functioning in thepublic sector. These enterprises are Life Insurance Corporationof India, National Insurance Company Limited, New IndiaAssurance Company Limited, Oriental Insurance CompanyLimited, United India Insurance Company Limited, GeneralInsurance Corporation of India, Agriculture Insurance Companyof India Limited and Export Credit Guarantee Corporation of India.These public sector insurers are offering a variety of insurancepolicies ranging from Life Insurance to Crop Insurance.
14.1 Life Insurance Corporation of India (LIC)
Life Insurance Corporation of India (LIC) was establishedin the year 1956 as a Statutory Corporation under Section 3 ofthe Life Insurance Corporation Act, 1956 to carry out lifeinsurance business in India. The objective of establishing theCorporation was spreading life insurance more widely and inparticular in the rural areas, with a view to reach all insurablepersons in the country and providing them with adequate financialcover at a reasonable cost.
LIC has 8 Zonal Offices, 113 Divisional Offices, 2048 BranchOffices and 1204 Satellite offices throughout the length andbreadth of the country. The staff strength of LIC is 1.19 lakh andit had an agency force of 12.78 lakh as on 31.03.2012.
LIC offers a wide variety of products to fulfill the needs ofdifferent segments of the society. There are 50 different plans onoffer as on 31.03.2012 including three new plans introduced duringthe year.
One of the main objectives of LIC is to reach all insurablepersons in the country and to provide them with adequate financialcover. During the year 2011-12, LIC completed 294.89 lakh policiesfor Sum Assured of ` 4, 50,957.95 crore under first insurance.The ratio of first insurance to the total business completed forthe year comes to 82.55% and 88.62% in terms of number ofpolicies and Sum Assured respectively.
Life Insurance Corporation of India operates in 12 countriesabroad through its Branch Offices and Joint Venture Companies.LIC has Branch Offices in Fiji, Mauritius and UK. It operates inBahrain, Kuwait, Oman, Qatar, Saudi Arabia, U.A.E., Kenya,Nepal and Sri Lanka through its Joint Venture Companies.
The Life Fund stood at ` 12, 83,990.72croreas on31.03.2012. The Corporation made payments of ` 8,564.40 croreunder Death Claim cases, ` 63,347.90 crore under Maturity Claimsand ` 5,281.27 crore under annuities.
In addition to above, performance in other significantparameters in the Financial Year 2011-12 are shown in Table 14.1below:—
Table 14.1
Performance of LIC during the year 2011-12
Sl. No.
1 Individual Policies Sold (Nos. in crore) 3.57
2 Market Share in terms of number ofPolicy 80.90%
3 Total Premium Income (` in crore) 202802.90
4 Total Income(` in crore) 287315.38
5 Total No. of Death Claims settled(in Lacs) 7.13
6 Total No. of Maturity Claimssettled(in Lacs) 178.56
14.1.1 Janashree BimaYojana (JBY)
The JanashreeBimaYojana (JBY) was launched in August2000. The Scheme has replaced Social Security Group InsuranceScheme (SSGIS) and Rural Group Life Insurance Scheme (RGLIS).The premium for the scheme is ` 200/- per member per annum,50 per cent of which is met out of Social Security Fund. Thebalance premium is borne by the member and / or Nodal Agency.Persons between age 18 years and 59 years are eligible for enteringinto scheme. There are 46 identified occupations that can becovered under JBY.
Table 14.2
Benefits under Janashree BimaYojana:
Sl No. Amount (Rs.)
1. Natural Death 30,000/-
2. On death or total permanentdisability due to accident 75,000/-
3. On partial permanent disabilitydue to accident 37,500/-
A free add-on benefit for the children of the members ofJANASHREE BIMA YOJANA is provided under the scheme inthe form of a scholarship at the rate of ` 100/- per month. Itisgiven to maximum two children studying between IX to XIIstandard payable half yearly on 1st July and 1st January eachyear. During the financial year 2011-2012 scholarships weredisbursed to 20, 90,972 children amounting to ` 180.05 crore.
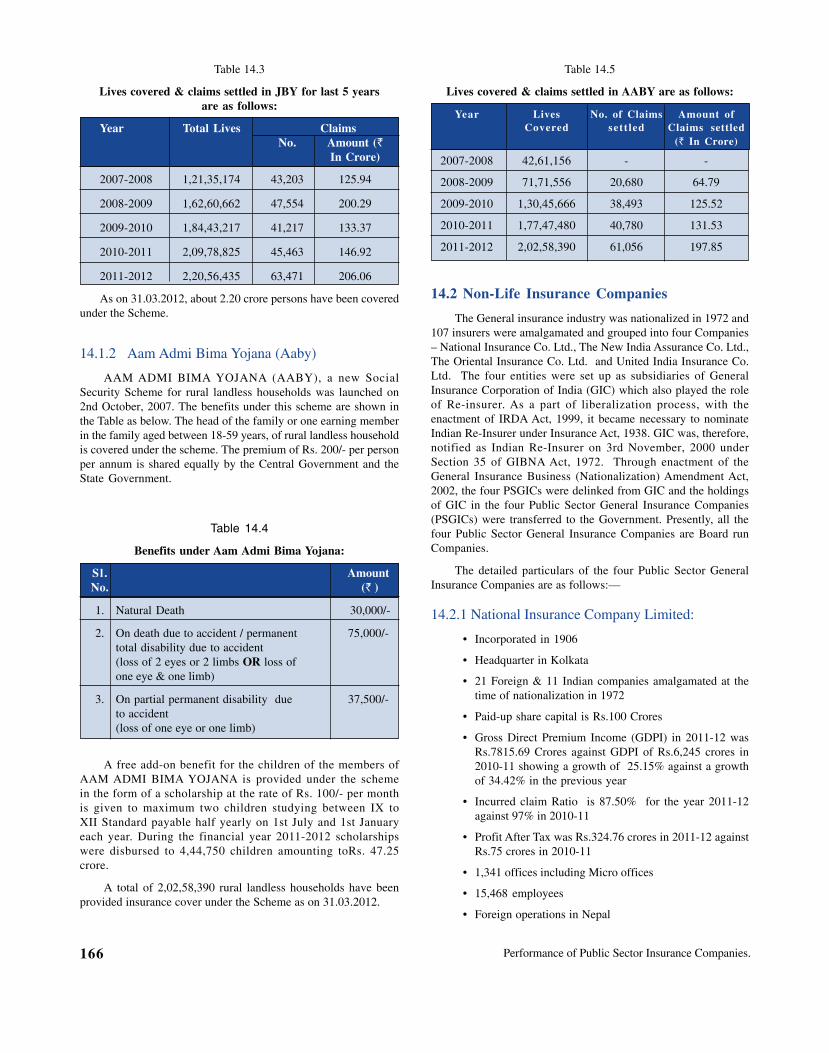
Performance of Public Sector Insurance Companies.166
Table 14.3
Lives covered & claims settled in JBY for last 5 yearsare as follows:
Year Total Lives ClaimsNo. Amount (`
In Crore)
2007-2008 1,21,35,174 43,203 125.94
2008-2009 1,62,60,662 47,554 200.29
2009-2010 1,84,43,217 41,217 133.37
2010-2011 2,09,78,825 45,463 146.92
2011-2012 2,20,56,435 63,471 206.06
As on 31.03.2012, about 2.20 crore persons have been coveredunder the Scheme.
14.1.2 Aam Admi Bima Yojana (Aaby)
AAM ADMI BIMA YOJANA (AABY), a new SocialSecurity Scheme for rural landless households was launched on2nd October, 2007. The benefits under this scheme are shown inthe Table as below. The head of the family or one earning memberin the family aged between 18-59 years, of rural landless householdis covered under the scheme. The premium of Rs. 200/- per personper annum is shared equally by the Central Government and theState Government.
Table 14.4
Benefits under Aam Admi Bima Yojana:
Sl. AmountNo. (` )
1. Natural Death 30,000/-
2. On death due to accident / permanent 75,000/-total disability due to accident(loss of 2 eyes or 2 limbs OR loss ofone eye & one limb)
3. On partial permanent disability due 37,500/-to accident(loss of one eye or one limb)
A free add-on benefit for the children of the members ofAAM ADMI BIMA YOJANA is provided under the schemein the form of a scholarship at the rate of Rs. 100/- per monthis given to maximum two children studying between IX toXII Standard payable half yearly on 1st July and 1st Januaryeach year. During the financial year 2011-2012 scholarshipswere disbursed to 4,44,750 children amounting toRs. 47.25crore.
A total of 2,02,58,390 rural landless households have beenprovided insurance cover under the Scheme as on 31.03.2012.
Table 14.5
Lives covered & claims settled in AABY are as follows:
Year Lives No. of Claims Amount ofCovered sett led Claims settled
(` In Crore)
2007-2008 42,61,156 - -
2008-2009 71,71,556 20,680 64.79
2009-2010 1,30,45,666 38,493 125.52
2010-2011 1,77,47,480 40,780 131.53
2011-2012 2,02,58,390 61,056 197.85
14.2 Non-Life Insurance Companies
The General insurance industry was nationalized in 1972 and107 insurers were amalgamated and grouped into four Companies– National Insurance Co. Ltd., The New India Assurance Co. Ltd.,The Oriental Insurance Co. Ltd. and United India Insurance Co.Ltd. The four entities were set up as subsidiaries of GeneralInsurance Corporation of India (GIC) which also played the roleof Re-insurer. As a part of liberalization process, with theenactment of IRDA Act, 1999, it became necessary to nominateIndian Re-Insurer under Insurance Act, 1938. GIC was, therefore,notified as Indian Re-Insurer on 3rd November, 2000 underSection 35 of GIBNA Act, 1972. Through enactment of theGeneral Insurance Business (Nationalization) Amendment Act,2002, the four PSGICs were delinked from GIC and the holdingsof GIC in the four Public Sector General Insurance Companies(PSGICs) were transferred to the Government. Presently, all thefour Public Sector General Insurance Companies are Board runCompanies.
The detailed particulars of the four Public Sector GeneralInsurance Companies are as follows:—
14.2.1 National Insurance Company Limited:
• Incorporated in 1906
• Headquarter in Kolkata
• 21 Foreign & 11 Indian companies amalgamated at thetime of nationalization in 1972
• Paid-up share capital is Rs.100 Crores
• Gross Direct Premium Income (GDPI) in 2011-12 wasRs.7815.69 Crores against GDPI of Rs.6,245 crores in2010-11 showing a growth of 25.15% against a growthof 34.42% in the previous year
• Incurred claim Ratio is 87.50% for the year 2011-12against 97% in 2010-11
• Profit After Tax was Rs.324.76 crores in 2011-12 againstRs.75 crores in 2010-11
• 1,341 offices including Micro offices
• 15,468 employees
• Foreign operations in Nepal
Public Enterprises Survey 2011-2012: Vol-I 167
• “AAA/STABLE” rating by CRISIL
14.2.2 The New India Assurance Company Limited:
• Incorporated in 1919
• Headquarter at Mumbai
• 32 Foreign & Indian companies amalgamated at the timeof nationalization in 1972
• Paid-up share capital is Rs.200 crores
• Gross Direct Premium Income (GDPI) in 2011-12 isRs.10,074crores against GDPI of Rs. 8,226 Crores in2010-11 showing a growth of 22.47% against a growthof 15.87% in the previous year.
• Incurred claim Ratio is 90% for the year 2011-12 against101% in 2010-11.
• Profit After Tax is Rs. 179.31crores in 2011-12 againstRs. (-)422 crores in 2010-11
• 1,207offices
• 19,328 employees
• The Company operates through a network of 19Branches, 7 Agencies, 3 Subsidiary Companies and 4Associate Companies in 20 countries
• “A-”(excellent) rating from AM Best & Co.(Europe)
14.2.3 The Oriental Insurance Company Limited:
· Incorporated in 1947
· Headquarter at New Delhi
· 10 Indian & 12 Foreign companies merged at the time ofnationalization in 1972
· Paid-up share capital is Rs.100 Crores
· Gross Direct Premium Income (GDPI) in 2011-12 wasRs.6,195 crores against GDPI of Rs.5,570 Crores in2010-11 showing a growth of 11.22% against a growthof 14.73% in the previous year
· Incurred claim Ratio is 85% for the year 2011-12 against88% in 2010-11
· Profit After Tax was Rs.253 crores in 2011-12 againstRs.55 crores in 2010-11
· 1,193 offices
· 15,043 employees
· Foreign operations in Nepal, Dubai & Kuwait
· ‘B++”(very good) rating from AM Best & Co.(Europe)
14.2.4 United India Insurance Company Limited:
• Incorporated in 1938
• Headquarter at Chennai
• 12 Indian companies, 4 cooperative societies & Indianoperations of 5 foreign companies merged at the time ofnationalization in 1972
• Paid-up share capital is Rs.150 crores
• Gross Direct Premium Income (GDPI) in 2011-12 wasRs.8,179.29 crores against GDPI of Rs.6376.66 Croresin 2010-11 showing a growth of 28.27% against a growthof 21.71% in the previous year
• Incurred claim Ratio is 79.46% for the year 2011-12against 86% in 2010-11
• Profit After Tax was Rs.386.79crores in 2011-12 against131 crores in 2010-11
• Dividend for the year 2011-12 is Rs.78 crores
• 1,476 offices
• 16,927 employees
• Rated iAAA by ICRA
The above Public Sector General Insurance Companiesprovide coverage for insurance other than Life such as, Fire,Marine (Cargo & Hull), Motor, Workmen’s Compensation,Personal Accident, Aviation, Engineering, Liability, Health, etc.
The Public Sector General Insurance Companies witnessed agrowth rate of 22.13% during 2011-12 collecting a total premiumof Rs.32,264 crores against Rs.26,418 Crores during 2010-11. Themarket share of the Public Sector General Insurance Companiesstood approximately at 58% in 2011-12. Motor and HealthInsurance have been the major drivers of growth.
Strategic alliances spearhead the retail focus of the companiesthrough tie-up arrangements with automobile manufacturers, banksand other entities with large distribution network.
Besides providing cover through traditional policies, thePSGICs are continually evolving themselves to provide tailor madepolicies to suit the changing / emerging needs of the customers.Some of the covers specially designed for the benefit of rural andsocial sector are:—
· Insurance of fishermen
· Plantation Insurance
· Calf rearing Insurance Scheme
· Insurance of Drip Irrigation – Multi periled lift InsurancePolicy
· Emu bird Insurance
· Elephant Insurance
· Farmers Package Insurance
· Ganna Kamgar BimaYojana
· Gopal Raksha Scheme
The Public Sector General Insurance Companies (PSGICs)have various policies to provide insurance cover to the poor forreconstruction of their houses in case of natural calamities likefire, flood, cyclone, earthquake etc.
Policies like GraminSuraksha Micro Policy, Farmers PackagePolicy, Hut Insurance Policy, Tribal Package Policy, Uni-MicroPolicy. Long Term House Policy to cover houses constructedunder Weaker Section Housing Scheme for a period of 10 years isalso available.
Performance of Public Sector Insurance Companies.168
14.3 General Insurance Corporation of India(GIC)
The General Insurance Corporation of India (GIC) was setup as a Government company under the General InsuranceBusiness (Nationalisation) Act, 1972 for the purpose ofsuperintending, controlling and carrying on the business of‘General Insurance’. The GIC was authorized to carry out thegeneral insurance business through its four subsidiaries viz.National Insurance Company Ltd., New India AssuranceCompany Ltd., Oriental Insurance Company Ltd. and UnitedIndia Insurance Company Ltd. With the notification of theGeneral Insurance Business (Nationalisation) Amendment Act,2002, the GIC was designated as the ‘Indian Reinsurer’ on 3rdNovember, 2000 and its supervisory role over its subsidiariesended. The ownership of these subsidiaries companies now restswith the Government of India.
General Insurance Corporation of India (GIC Re) is a leadingglobal reinsurance and risk solution provider with its RegisteredOffice of the Corporation in Mumbai and liaison offices in NewDelhi, Kolkata and Chennai to cater to the needs of clients in thesemetro cities. As the ‘Indian Reinsurer with a global footprint’,GIC Re provides reinsurance support for all the general insurancecompanies (non-life) in India. Internationally, GIC Re leads thereinsurance programmers of insurance companies in SAARCregion, African countries and in the Middle East. Apart fromreinsurance business, GIC Re continues to participate in the sharecapital of Kenindia Assurance Company Ltd. (Kenya), IndiaInternational Insurance Pte Ltd., Singapore, East Africa Re andAsian Reinsurance Corporation, Bangkok. It also holds 35% sharein Agriculture Insurance Company of India Ltd.
GIC Re is expanding its global presence. During 2011-12,international business contributed to 44% to its revenue. GIC Rehas 4 overseas offices with branch Offices in London, Dubai andMalaysia and a Representative Office in Moscow. GIC Re has an‘Eventual Reinsurer’ status in Brazil. It is also reinsuring lifeinsurance risks in India and Takaful (Shariah-compliant insurance).GIC Re also manages Marine Hull Pool, Indian Terrorism InsurancePool and India Motor Third Party Insurance Pool for Commercialvehicles on behalf of Indian Insurance industry. The Motor ThirdParty Insurance Pool for Commercial vehicles was dismantled on31st March 2012 and w.e.f 1.4.2012, GIC Re is the administratorof the new Indian Motor Third Party Declined Risk InsurancePool.GIC Re has been selected as the Manager for Nat Cat Poolpromoted by the Federation of Afro-Asian Insurers &Reinsurers(FAIR)
GIC Re is financially strong as reflected by its high graderatings from credit rating agencies. It is rated A- (Excellent) by AM Best & AAA (In) by CARE. GIC Re is also the 5th largestaviation reinsurer globally. During the year 2011-12, the netpremium of the GIC Re was ` 12558.24 crores as against` 10512.57 crorein the previous year. The net incurred claimswere at ` 13986.41 crores i.e.,123.6 % as against ` 8625.87 croresin the previous year i.e., 90.4%. Catastrophic losses in Thailand,Japan, New Zealand, Australia; loss provisioning on the dismantlingof the Motor Pool and the Regulator IRDA instructing to settleliabilities of the Motor Pool on Ultimate Liability, resulted in GICRe incurring loss after tax amounting to ` 2468.75 crores as on
31st March 2012 compared to Profit after tax of ` 1033.41 croresas on 31st March 2011. The total assets and networth as on31st March 2012 was ` 53730.92 crores and ` 7690.51 crores,respectively.The present paid up capital of the Corporation is` 430.00 crores.
14.4 Agriculture Insurance Company of IndiaLimited (AICIL)
The Agriculture Insurance Company of India Limited (AICIL)was registered under the Companies Act 1956, with equityparticipation from General Insurance Corporation of India (35%),NABARD (30%), and four Public Sector General InsuranceCompanies (i.e., National, New India, Oriental & United Indiacombined 30% @8.75% each). The paid up share capital of thecompany is Rs. 200 crore against an authorized share capital of` 1500 crore. It has been set up with the objective to implementvarious Crop Insurance Schemes of Government of India likelyto be introduced from time to time and other insurance productsrelating to agriculture. The company has commenced its businesswith effect from 1.4.2003 with transfer of Crop Insurance Businessfrom General Insurance Corporation of India.
The primary product i.e. “National Agricultural InsuranceScheme” (NAIS) introduced by Ministry of Agriculture is beingimplemented from Rabi 1999-2000 season which replaced theformer product i.e., Comprehensive Crop Insurance Scheme(CCIS) and is presently available in 24 States and 2 UnionTerritories. AICIL is the sole implementing agency for NAIS. Allcategories of farmers i.e., both, loanee and non loanee, sharecroppers, tenant farmers irrespective of the size of their holdingcan participate in the Scheme. The main objective of the schemeis to protect the farmers against the losses suffered due to cropfailure on account of natural calamities, such as drought, flood,hailstorm, cyclone, fire, pest/ diseases, etc., so as to indemnifythe losses and restore the credit worthiness of the loanee farmersfor the ensuing season.
The Scheme envisages coverage of all crops including cereals,millets, pulses, oilseeds and annual commercial and horticulturecrops in respect of which past yield data is available. At present70 different Food and Oilseed crops are covered during Kharifand Rabi seasons. Among the annual commercial/ horticulturalcrops, cotton, sugarcane, potato, chilly, ginger, turmeric, onion,garlic, jute, tapioca, banana, pineapple, brinjal, coriander, cumin,fennel, French bean, isabgul, fenugreek and tomato have beenbrought under insurance coverage. Flat premium rates of 3.5% ofsum insured for bajra and oilseeds, 2.5% for other crops duringKharif seasons and 1.5% for wheat and 2% for other crops duringRabi seasons are charged. In case the actuarial rates are less thanprescribed flat premium rates mentioned above, the lower rate isapplicable for food crops and oilseeds. In case of annual commercialand horticulture crops only actuarial rates are charged and witheffect from Kharif 2011 season, AICIL is responsible for all theclaims under such crops. At present, 10% subsidy in premium isallowed for small and marginal farmers, shared equally by centraland state government. The Scheme operates on the basis of ‘AreaApproach’ for widespread calamities.
Claims are automatically calculated based on shortfall in thecurrent season yield obtained from crop cutting experimentsconducted by State Governments under General Crops Estimation
Public Enterprises Survey 2011-2012: Vol-I 169
Survey (GCES) as compared to threshold yield. All the claims aresettled through the banking network. The Company is makingefforts to bring the remaining States/ UTs into the fold of NAIS.
During Kharif 2011 & Rabi 2011-12, 1.56 crore farmerswere insured covering 2.17 crore hectare cropped area for suminsured of Rs. 31,588 crore against premium of Rs. 960 crore.Claims amounting to Rs. 373.32 crore out of the reported claimsof Rs. 1300.20 crore has so far been settled benefitting 15.16 lacfarmers. Since the inception of the scheme and until Rabi 2011-12, about 1,919 lakh farmers have been insured, covering an areaof 290 million hectares for a sum insured value of Rs. 2,53,222crore, against a premium of Rs. 7,564 crore. Claims to the tuneof about Rs. 24,192 crore have been reported benefiting nearly503 lakh farmers
The unit of insurance may be Gram Panchyat, Mandal, Hobli,Circle, Phirka, Block, and Taluka etc., to be decided by therespective State / UT Government. As envisaged in scheme, asmany as 14 States /UTs have already lowered down the size ofunit areas to Village / Gram Panchayat or equivalent level in orderto make the scheme more efficacious and reflective of crop losses.
The government announced a pilot on an improved versionof NAIS, namely Modified NAIS w.e.f. Rabi 2010-11 seasons forexperimentation in 50 districts. The modified version has manyimprovements viz. Insurance Unit for major crops are villagepanchayat or other equivalent unit; in case of prevented / failedsowing claims upto 25 percent of the sum insured is payable,post-harvest losses caused by cyclonic rains are assessed at farmlevel for the crop harvested and left in ‘cut & spread’ conditionupto a period of 2 weeks; individual farm level assessment oflosses in case of localized calamities, like hailstorm and landslide;on-account payment up to 25% of likely claim as advance, forproviding immediate relief to farmers in case of severe calamities;threshold yield based on average yield of past seven years,excluding upto two years of declared natural calamities; minimumindemnity level of 70 percent is available (instead of 60 percentin NAIS); and premium rates are actuarial supported by up-frontsubsidy in premium, which ranges from 25 percent to 75 percent,equally shared by Centre and States. Insurer is responsible forthe claims liabilities.
AICIL implemented MNAIS during Rabi 2010-11 in 32Districts across 12 States. During Kharif 2011, the pilot wasimplemented by AIC in 31 districts across 13 States and duringRabi 2011-12 in 37 districts across 16 States. The pilot is beingcontinued during Kharif 2012 season. The coverage so far underMNAIS is as under:—
Table 14.6
Coverage under Modified NAIS
(` in 00,000)
Sl . Particulars Rabi Kharif RabiNo. 2010-11 2011 2011-12
1 Farmers covered 336724 417831 597177
2 Sum Insured 66679 102748 15119
3 Farmers’ premium 2271 4424 5664
4 Claims 1596 7528 Yet to bereported
Apart from the above two yield guarantee insurance products,the Government of India has introduced another Pilot namely, PilotWeather Based Crop Insurance Scheme (WBCIS) with effect fromKharif 2007. The Scheme operates on an actuarial basis withpremium subsidy contribution from Union and StateGovernments. AICIL has since implemented the scheme in variousStates during all previous Kharif and Rabi seasons starting Kharif2007. WBCIS is a parametric insurance product designed toprovide insurance protection to the cultivator against adverseweather incidence during the cultivation period, such as deficit &excess rainfall, frost, heat (temperature), relative humidity, windspeed etc., which are deemed to adversely impact the crop yield.Crops and ‘Reference Unit Areas (RUA)’ are notified before thecommencement of the season by the State Govt. Each RUA islinked to a Reference Weather Station (RWS), on the basis of whichpayout/ claims are processed. The payouts are made on the basisof adverse variations in the current season’s weather parametersas measured at Reference Weather Station (RWS). Claim underWBCIS is area based and automatic.
During the year 2011-12, the Scheme was implemented in14 States namely Andhra Pradesh, Bihar, Chhattisgarh, Gujarat,Haryana, Himachal Pradesh, Jharkhand, Karnataka, Kerala, Orissa,Madhya Pradesh, Maharashtra, Rajasthan, Tamil Nadu,Uttrakhand, Uttar Pradesh and West Bengal spread over 1425Tehsils / blocks of 109 districts for the major crops during Kharifand 1842 Tehsils / Blocks of 137 districts during Rabi crop seasonand covered more than 83 lakh farmers on a cropped covering114 lakh hectares for a sum insured of Rs. 15026 crore. AIC isimplementing WBCIS for more than 30 different crops, includingperennial horticultural crops like Apple, Mango, Grapes, CashewNut, Pepper, Pomegranate, Orange, Sweet orange, and Banana etc.
The coverage so far under WBCIS is as under:—
Table 14.7
Coverage under Weather Based CIS
(` in 00,000)
Sl. Particulars Kharif Rabi Kharif Rabi Kharif Rabi
No. 2009 09-10 2010 2010-11 2011 11-12
2009-10 2010-11 2011-12
1 Farmers 1134219 873352 3915052 2822499 5263734 3110499
2 Sum 198931 197636 443943 524668 834181 668418
Insured
3 Farmers’ 5641 3998 13067 11452 27181 14617
premium
4 Claims 15315 13790 15008 28869 38870 50302*
Besides the above, AICIL has designed various other cropinsurance products to cater to the diverse needs of farmingcommunity. These are Coconut Palm Insurance Scheme (CPIS) incollaboration with Coconut Board and implementing StateGovernments, Rainfall Insurance Scheme-Coffee (RISC) incollaboration with Coffee Board, Rubber Plantation Insurance, Bio-Fuel Plants Insurance, Grapes Insurance, Mango Weather Insurance,Potato Contract Farming Insurance, Pulpwood Tree Insurance, RabiWeather Insurance, and VarshaBima/ Rainfall Insurance.
During the financial year 2011-12, the Company has recordeda gross premium of Rs.2577 crore and net premium of Rs.1357crore, as against net claims incurred of Rs.1026 crore.
Performance of Public Sector Insurance Companies.170
BLANK PAGEBEFORE STATEMENT & APPENDIX
Public Enterprises Survey 2011-2012: Vol-I 171
Statementsand Appendices
Performance of Public Sector Insurance Companies.172
Statements and AppendicesSl. No. Page No.
Statements S-1 to S-155
1. Aggregate Balance Sheet of CPSEs .............................................................................................................................. S -1
2. Aggregate Profit and Loss (-) Account of CPSEs ....................................................................................................... S - 2
3. Net Profit/Loss (-) in CPSEs under different Ministries/ Departments ................................................................... S - 3 to S - 9
4. Dividend declared by CPSEs (Cognate Group Wise) ................................................................................................. S - 10 to S - 12
5. Net Profit to Profit Making CPSEs (Cognate Group Wise) ...................................................................................... S - 13 to S - 19
6. Net Loss (-)of Loss Making CPSEs (Cognate Group Wise) ..................................................................................... S - 20 to S - 22
7. Cash Loss (-) of CPSEs during 2011-12 ..................................................................................................................... S - 23 to S - 24
8. CPSE Wise Net Profit/Loss (-) of ‘Taken Over ‘ Sick CPSEs .................................................................................. S - 25
9. Investment (Financial) in Central Government Enterprises under different Ministries/Departments as
on 31.03.2012 ............................................................................................................................................................... S - 26 to S - 34
10. Details of participation in equity of Public Sector Enterprises by different parties as on 31.03.2012 ................. S - 35 to S - 44
11. Details of short term loans of CPSEs as on 31.03.2012 ............................................................................................ S - 45 to S - 49
12. Details of long term Borrowings (Secured + Unsecured) of CPSEs as on 31.03.2012 ............................................ S - 50 to S - 55
13. State-Wise CPSEs with Gross Block & Employment during the last two years ..................................................... S - 56 to S - 100
14. Ranking of CPSEs in terms of Profit/Loss before Exceptional, Extra Orientation & Tax in 2011-12 ..................... S - 101 to S - 106
15. Ranking of CPSEs in terms of Net Turnover/Revenue in 2011-12 ........................................................................... S - 107 to S - 112
16. Ranking of CPSEs in terms of employment in 2011-12 ............................................................................................ S - 113 to S - 119
17. Ranking of CPSEs in terms of Gross Block in 2011-12 ............................................................................................ S - 120 to S - 125
18. Capacity utilisation in Manufacturing CPSEs ............................................................................................................ S - 126 to S - 131
19. Expenditure on Research and Development in CPSEs .............................................................................................. S - 132 to S - 133
20. Component of Internal Resources of CPSEs Generated During 2011-12 ................................................................ S - 134 to S - 139
21. Internal Resources Utilized as % of Fixed Assets as on 31.03.2012 ........................................................................ S - 140 to S - 143
22. Foreign Exchange Earnings of CPSEs in 2011-12 ....................................................................................................... S - 144 to S - 151
23. Number of Employees and Houses Constructed in CPSEs ....................................................................................... S - 152 to S - 159
24. Township Maintenance Expenditure in CPSEs (Cognate Group) ............................................................................ S - 160
25. Break-up of total employees as on 31.03.2012 .......................................................................................................... S - 161 to S - 169
26. Representation of SC/ST and OBC in CPSEs as on 31.03.2012 ............................................................................... S - 170 to S - 181
27. Equity Participation by Under Construction CPSES as on 31.3.2012 ..................................................................... S - 182 to S - 183
Appendices
I Central Public Sector Enterprises under different Ministries/Departments as on 31.03.2012 ............................... S - 184 to S - 191
II Central Public Sector Enterprises under different Sectors and Cognate Groups as on 31.03.2012 ........................ S - 192 to S - 199
III Central Public Sector Enterprises under different States /Union Territories as on 31.03.2012 .............................. S - 200 to S - 208
IV Central Public Sector Enterprises (Holding company and their subsidiaries) .......................................................... S - 209 to S - 215
V Central Public Sector Enterprises whose data has been treated as provisional in 2011-12 ..................................... S - 216
VI Glossary of certain terms used in the Survey ............................................................................................................. S - 217
Related Documents