Hydraulic Model Summary Report – West Brook 1 Fluvial Hydraulic Modelling Report 1. Basic Model Information Model Name: West Brook Primary Watercourses / Water Bodies West Brook Designation Main river Model ID The following table presents information regarding the Existing and Scheme Model Scenario ID Model Scenario ID Scenario Return Period Baseline _fenstanton_Hilton( last updated_designrun)_25.sim11 Existing Model 1 in 25 years (4% AEP) Baseline _fenstanton_Hilton( last updated_designrun)_100.sim11 1 in 100 years (1% AEP) Baseline _fenstanton_Hilton( last updated_designrun)_100CC.sim11 1 in 100 years + 20% (1%+CC AEP) Proposed _fenstanton_Hilton( last updated_designrun)_25.sim11 Scheme Model 1 in 25 years (4% AEP) Proposed _fenstanton_Hilton( last updated_designrun)_100.sim11 1 in 100 years (1% AEP) Proposed _fenstanton_Hilton( last updated_designrun)_100CC.sim11 1 in 100 years + 20% (1%+CC AEP) 2. Survey Data and Base Mapping 2.1 Base Mapping: 1 to 10,000 Scale Raster Reference: TL3060 2.2 DTM for 2D Model domain: N/A 1D Model 2.3 River channel/Structures survey All cross section data from the original model has been retained as in existing model. Number of cross-sections included in this model: 93

Welcome message from author
This document is posted to help you gain knowledge. Please leave a comment to let me know what you think about it! Share it to your friends and learn new things together.
Transcript
Hydraulic Model Summary Report – West Brook 1
Fluvial Hydraulic Modelling Report
1. Basic Model Information
Model Name: West Brook
Primary Watercourses / Water Bodies West Brook
Designation Main river
Model ID The following table presents information regarding the Existing and Scheme Model Scenario ID
Model Scenario ID Scenario Return Period
Baseline _fenstanton_Hilton( last updated_designrun)_25.sim11
Existing Model 1 in 25 years (4% AEP)
Baseline _fenstanton_Hilton( last updated_designrun)_100.sim11
1 in 100 years (1% AEP)
Baseline _fenstanton_Hilton( last updated_designrun)_100CC.sim11
1 in 100 years + 20% (1%+CC AEP)
Proposed _fenstanton_Hilton( last updated_designrun)_25.sim11
Scheme Model 1 in 25 years (4% AEP)
Proposed _fenstanton_Hilton( last updated_designrun)_100.sim11
1 in 100 years (1% AEP)
Proposed _fenstanton_Hilton( last updated_designrun)_100CC.sim11
1 in 100 years + 20% (1%+CC AEP)
2. Survey Data and Base Mapping
2.1 Base Mapping: 1 to 10,000 Scale Raster
Reference:
TL3060
2.2 DTM for 2D Model domain:
N/A 1D Model
2.3 River channel/Structures survey
All cross section data from the original model has been retained as in existing model.
Number of cross-sections included in this model: 93
Hydraulic Model Summary Report – West Brook 2
3. Baseline Hydraulic Model Schematisation
3.1 Software: 1D domain: MIKE11 2011
2D domain(s): N/A
3.2 Baseline model: Atkins 2009 MIKE11 1D Model
3.3 Baseline Model Reference
Atkins (2009) Ellington to Fen Ditton Phase 1a: A14 Hydraulic Modelling Report
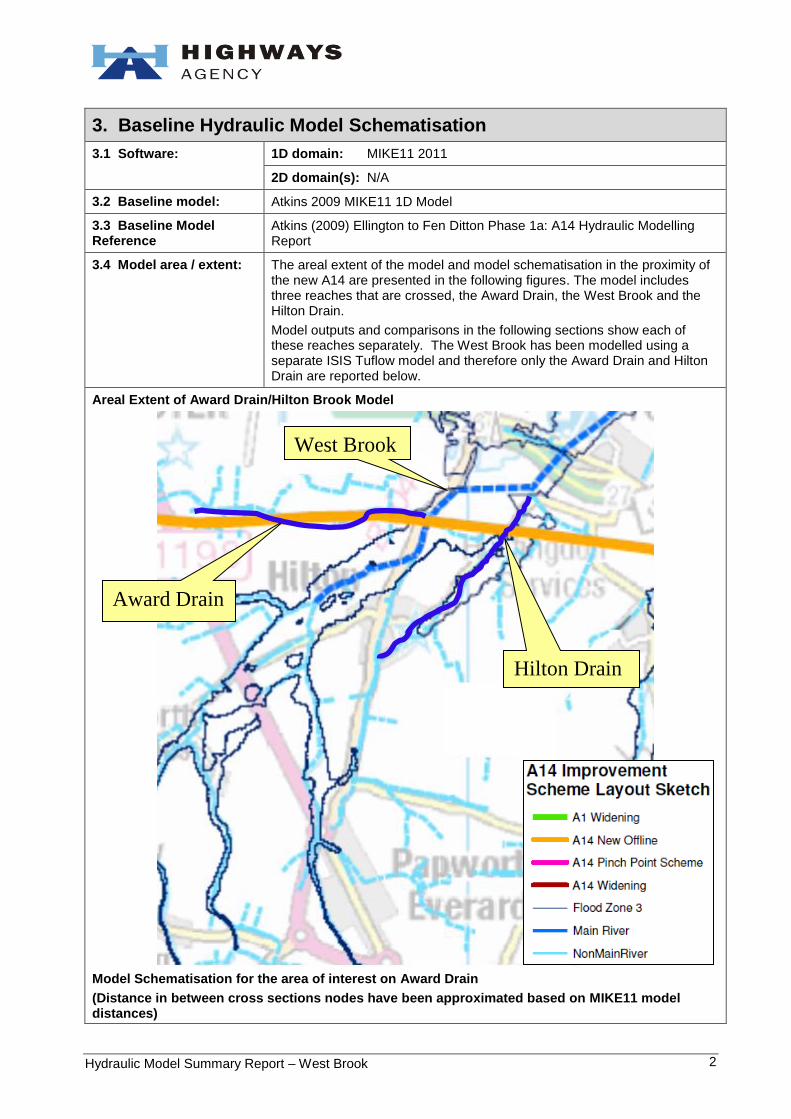
3.4 Model area / extent: The areal extent of the model and model schematisation in the proximity of the new A14 are presented in the following figures. The model includes three reaches that are crossed, the Award Drain, the West Brook and the Hilton Drain.
Model outputs and comparisons in the following sections show each of these reaches separately. The West Brook has been modelled using a separate ISIS Tuflow model and therefore only the Award Drain and Hilton Drain are reported below.
Areal Extent of Award Drain/Hilton Brook Model
Model Schematisation for the area of interest on Award Drain
(Distance in between cross sections nodes have been approximated based on MIKE11 model distances)
West Brook
Award Drain
Hilton Drain
Hydraulic Model Summary Report – West Brook 3
4. Award Drain Existing Model
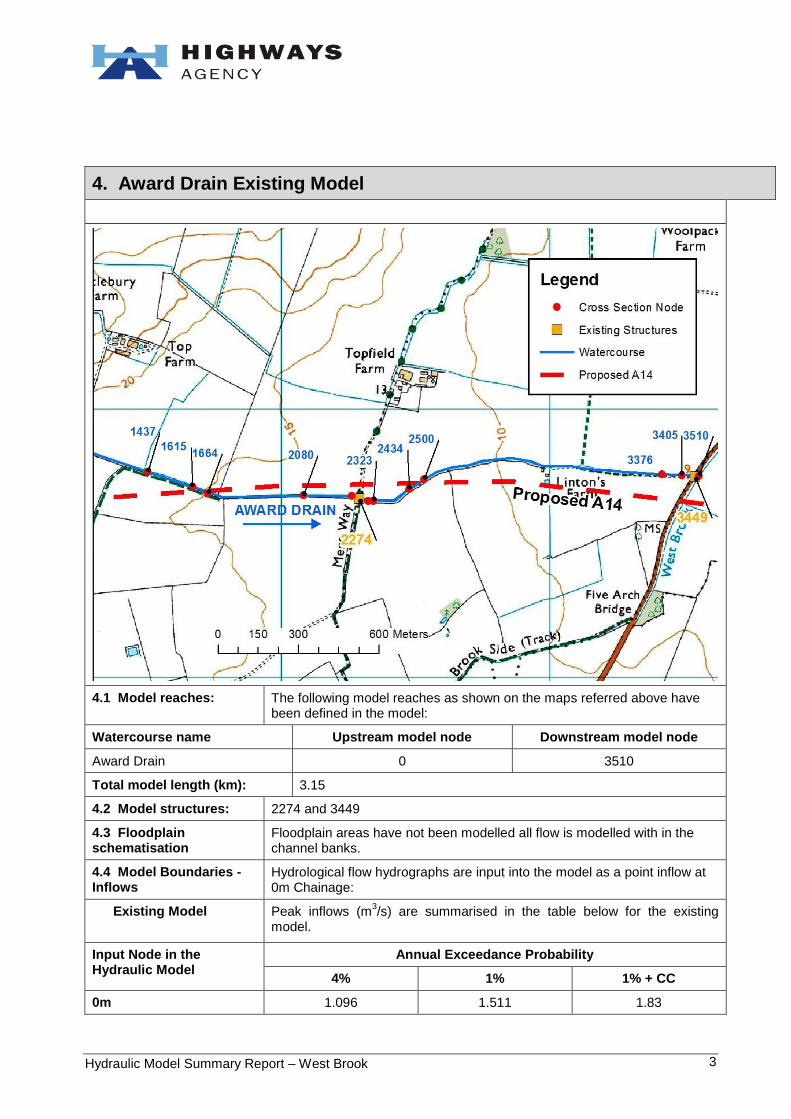
4.1 Model reaches: The following model reaches as shown on the maps referred above have been defined in the model:
Watercourse name Upstream model node Downstream model node
Award Drain 0 3510
Total model length (km): 3.15
4.2 Model structures: 2274 and 3449
4.3 Floodplain schematisation
Floodplain areas have not been modelled all flow is modelled with in the channel banks.
4.4 Model Boundaries - Inflows
Hydrological flow hydrographs are input into the model as a point inflow at 0m Chainage:
Existing Model
Peak inflows (m3/s) are summarised in the table below for the existing
model.
Input Node in the Hydraulic Model
Annual Exceedance Probability
4% 1% 1% + CC
0m 1.096 1.511 1.83
Hydraulic Model Summary Report – West Brook 4
4.5 Model Boundaries – Downstream Conditions
The downstream boundary of the Award Drain are water levels in the West Brook.
5. Award Drain Scheme Model Build
5.1 Scenario Definition
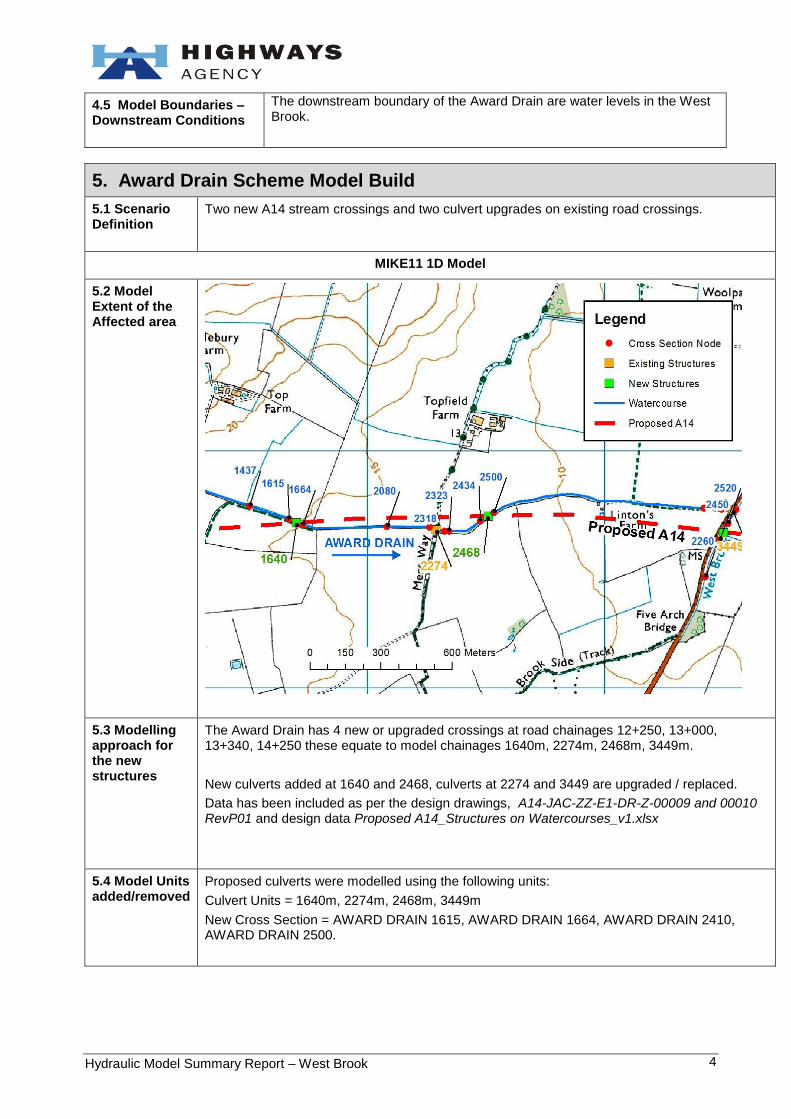
Two new A14 stream crossings and two culvert upgrades on existing road crossings.
MIKE11 1D Model
5.2 Model Extent of the Affected area
5.3 Modelling approach for the new structures
The Award Drain has 4 new or upgraded crossings at road chainages 12+250, 13+000, 13+340, 14+250 these equate to model chainages 1640m, 2274m, 2468m, 3449m.
New culverts added at 1640 and 2468, culverts at 2274 and 3449 are upgraded / replaced.
Data has been included as per the design drawings, A14-JAC-ZZ-E1-DR-Z-00009 and 00010 RevP01 and design data Proposed A14_Structures on Watercourses_v1.xlsx
5.4 Model Units added/removed
Proposed culverts were modelled using the following units:
Culvert Units = 1640m, 2274m, 2468m, 3449m
New Cross Section = AWARD DRAIN 1615, AWARD DRAIN 1664, AWARD DRAIN 2410, AWARD DRAIN 2500.
Hydraulic Model Summary Report – West Brook 5
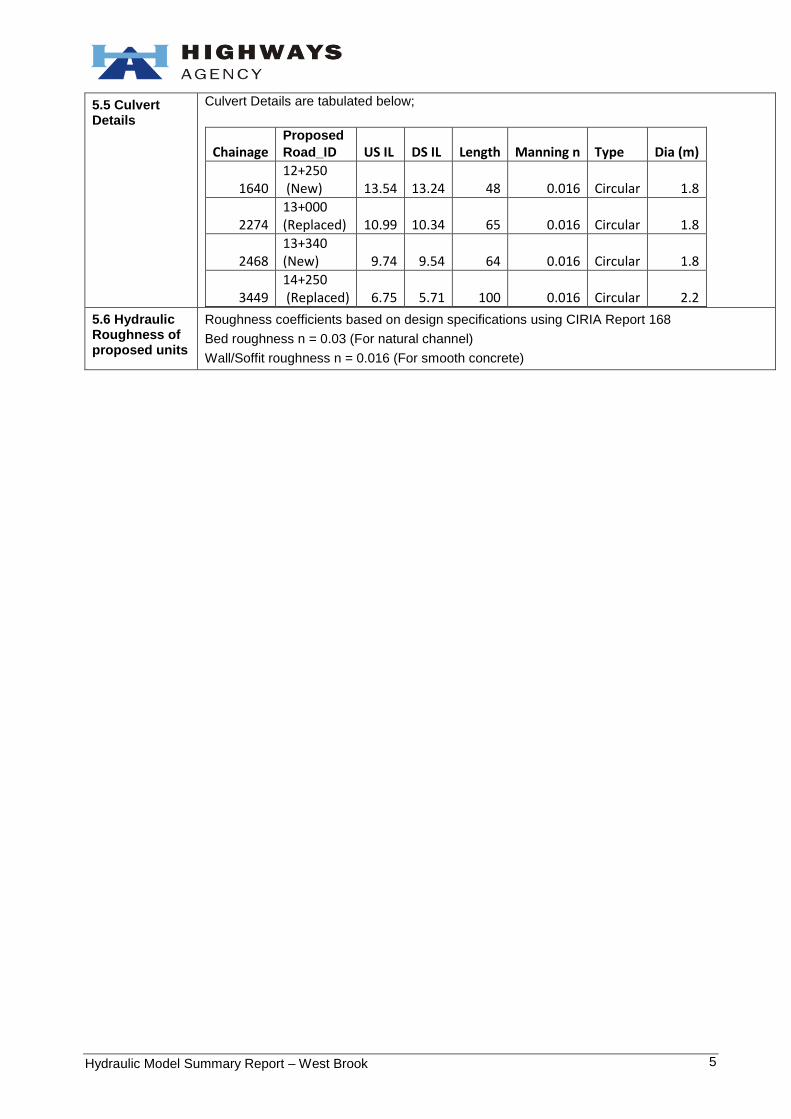
5.5 Culvert Details
Culvert Details are tabulated below;
Chainage Proposed
Road_ID US IL DS IL Length Manning n Type Dia (m)
1640 12+250 (New) 13.54 13.24 48 0.016 Circular 1.8
2274 13+000 (Replaced) 10.99 10.34 65 0.016 Circular 1.8
2468 13+340 (New) 9.74 9.54 64 0.016 Circular 1.8
3449 14+250 (Replaced) 6.75 5.71 100 0.016 Circular 2.2
5.6 Hydraulic Roughness of proposed units
Roughness coefficients based on design specifications using CIRIA Report 168
Bed roughness n = 0.03 (For natural channel)
Wall/Soffit roughness n = 0.016 (For smooth concrete)
Hydraulic Model Summary Report – West Brook 6
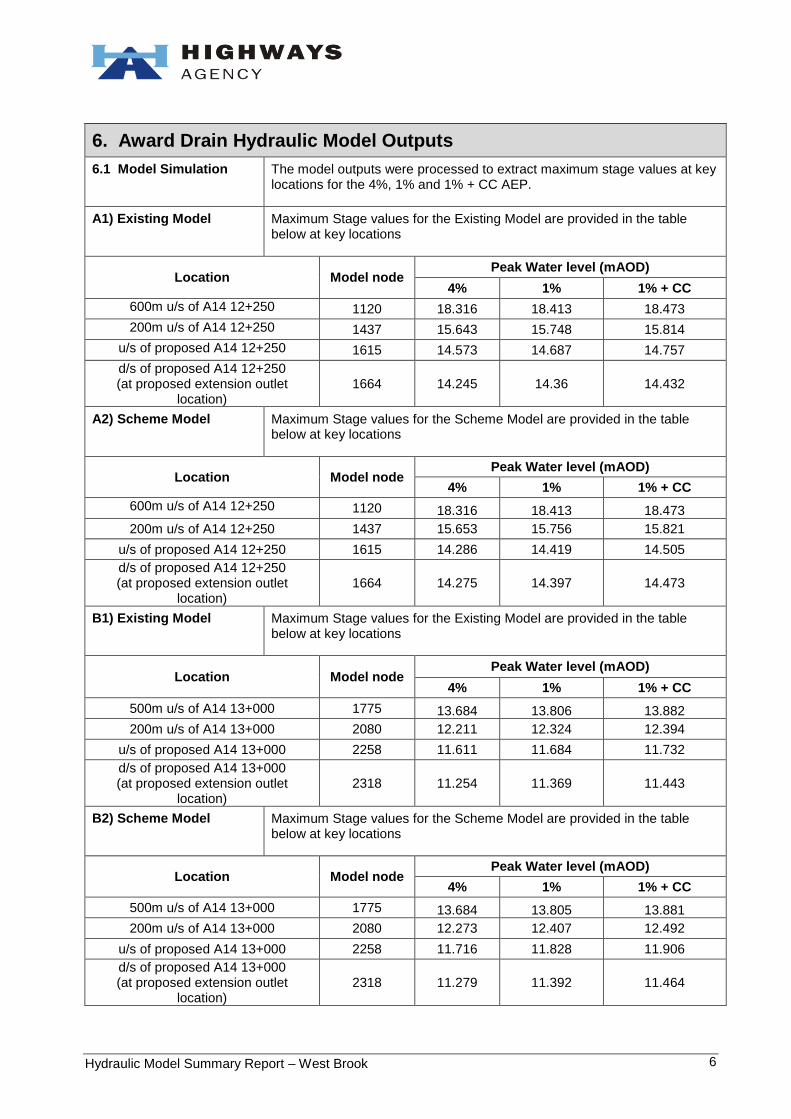
6. Award Drain Hydraulic Model Outputs
6.1 Model Simulation The model outputs were processed to extract maximum stage values at key locations for the 4%, 1% and 1% + CC AEP.
A1) Existing Model Maximum Stage values for the Existing Model are provided in the table below at key locations
Location Model node Peak Water level (mAOD)
4% 1% 1% + CC
600m u/s of A14 12+250 1120 18.316 18.413 18.473
200m u/s of A14 12+250 1437 15.643 15.748 15.814
u/s of proposed A14 12+250 1615 14.573 14.687 14.757
d/s of proposed A14 12+250 (at proposed extension outlet
location) 1664 14.245 14.36 14.432
A2) Scheme Model Maximum Stage values for the Scheme Model are provided in the table below at key locations
Location Model node Peak Water level (mAOD)
4% 1% 1% + CC
600m u/s of A14 12+250 1120 18.316 18.413 18.473
200m u/s of A14 12+250 1437 15.653 15.756 15.821
u/s of proposed A14 12+250 1615 14.286 14.419 14.505
d/s of proposed A14 12+250 (at proposed extension outlet
location) 1664 14.275 14.397 14.473
B1) Existing Model Maximum Stage values for the Existing Model are provided in the table below at key locations
Location Model node Peak Water level (mAOD)
4% 1% 1% + CC
500m u/s of A14 13+000 1775 13.684 13.806 13.882
200m u/s of A14 13+000 2080 12.211 12.324 12.394
u/s of proposed A14 13+000 2258 11.611 11.684 11.732
d/s of proposed A14 13+000 (at proposed extension outlet
location) 2318 11.254 11.369 11.443
B2) Scheme Model Maximum Stage values for the Scheme Model are provided in the table below at key locations
Location Model node Peak Water level (mAOD)
4% 1% 1% + CC
500m u/s of A14 13+000 1775 13.684 13.805 13.881
200m u/s of A14 13+000 2080 12.273 12.407 12.492
u/s of proposed A14 13+000 2258 11.716 11.828 11.906
d/s of proposed A14 13+000 (at proposed extension outlet
location) 2318 11.279 11.392 11.464
Hydraulic Model Summary Report – West Brook 7
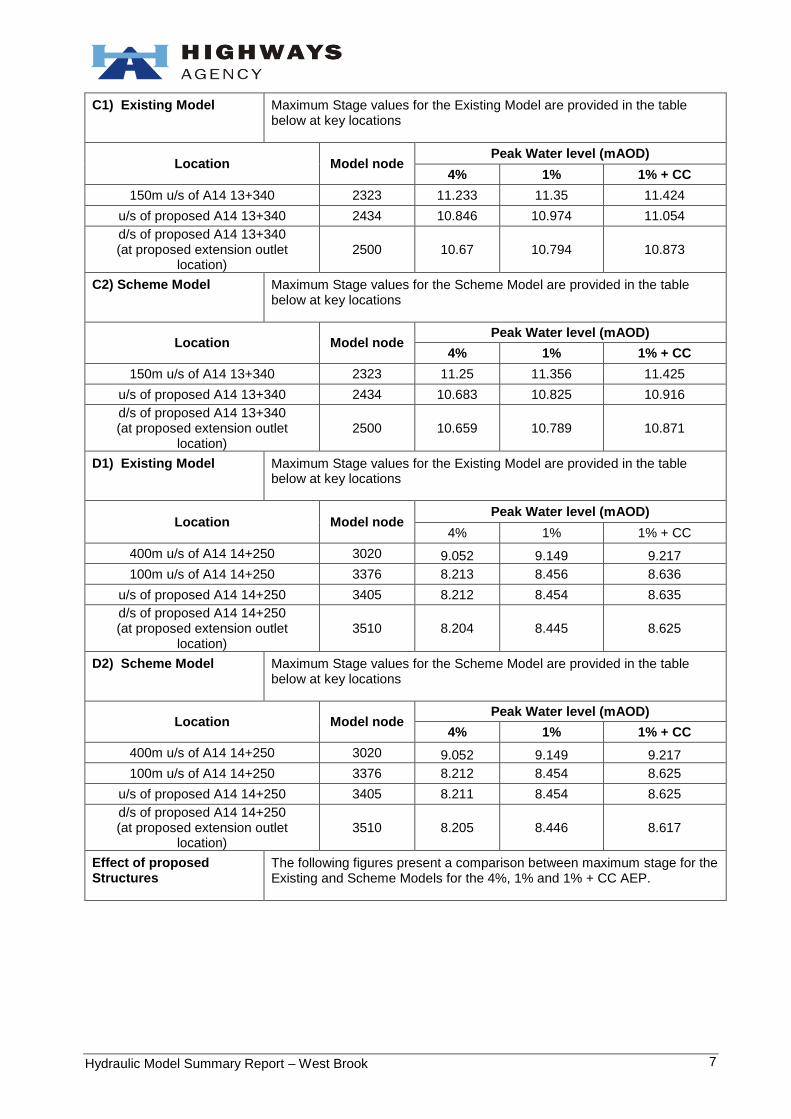
C1) Existing Model Maximum Stage values for the Existing Model are provided in the table below at key locations
Location Model node Peak Water level (mAOD)
4% 1% 1% + CC
150m u/s of A14 13+340 2323 11.233 11.35 11.424
u/s of proposed A14 13+340 2434 10.846 10.974 11.054
d/s of proposed A14 13+340 (at proposed extension outlet
location) 2500 10.67 10.794 10.873
C2) Scheme Model Maximum Stage values for the Scheme Model are provided in the table below at key locations
Location Model node Peak Water level (mAOD)
4% 1% 1% + CC
150m u/s of A14 13+340 2323 11.25 11.356 11.425
u/s of proposed A14 13+340 2434 10.683 10.825 10.916
d/s of proposed A14 13+340 (at proposed extension outlet
location) 2500 10.659 10.789 10.871
D1) Existing Model Maximum Stage values for the Existing Model are provided in the table below at key locations
Location Model node Peak Water level (mAOD)
4% 1% 1% + CC
400m u/s of A14 14+250 3020 9.052 9.149 9.217
100m u/s of A14 14+250 3376 8.213 8.456 8.636
u/s of proposed A14 14+250 3405 8.212 8.454 8.635
d/s of proposed A14 14+250 (at proposed extension outlet
location) 3510 8.204 8.445 8.625
D2) Scheme Model Maximum Stage values for the Scheme Model are provided in the table below at key locations
Location Model node Peak Water level (mAOD)
4% 1% 1% + CC
400m u/s of A14 14+250 3020 9.052 9.149 9.217
100m u/s of A14 14+250 3376 8.212 8.454 8.625
u/s of proposed A14 14+250 3405 8.211 8.454 8.625
d/s of proposed A14 14+250 (at proposed extension outlet
location) 3510 8.205 8.446 8.617
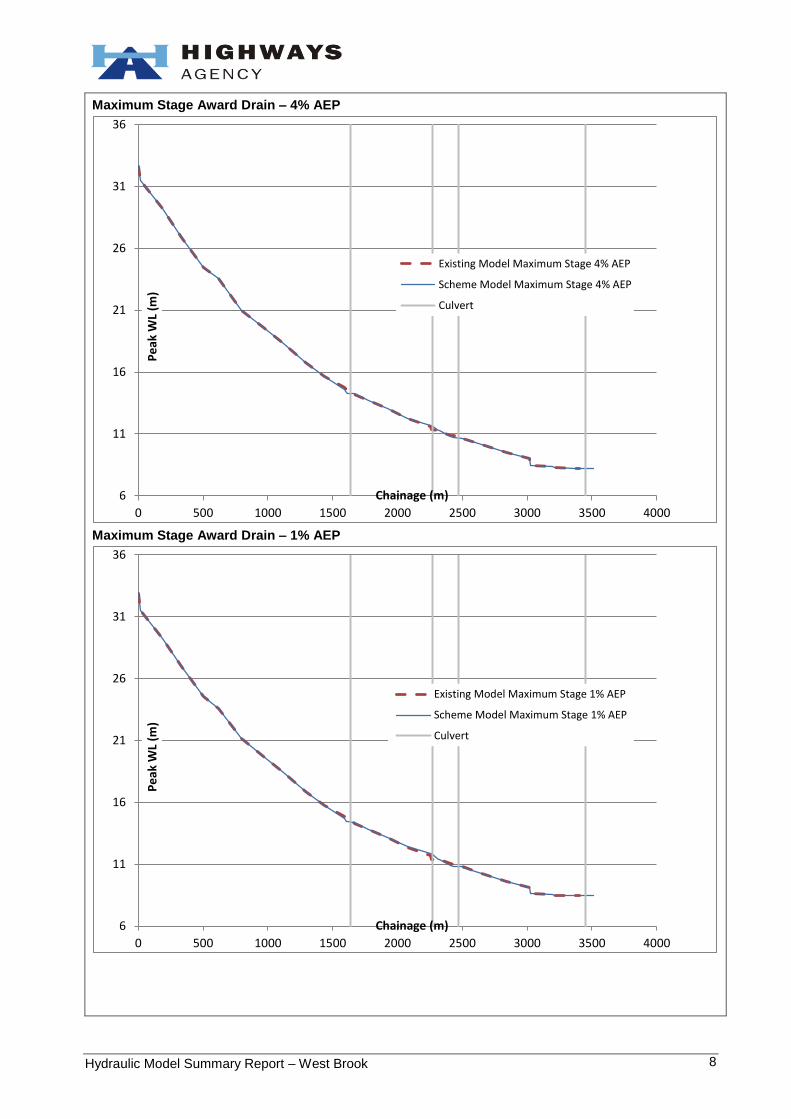
Effect of proposed Structures
The following figures present a comparison between maximum stage for the Existing and Scheme Models for the 4%, 1% and 1% + CC AEP.
Hydraulic Model Summary Report – West Brook 8
Maximum Stage Award Drain – 4% AEP
Maximum Stage Award Drain – 1% AEP
6
11
16
21
26
31
36
0 500 1000 1500 2000 2500 3000 3500 4000
Pe
ak W
L (m
)
Chainage (m)
Existing Model Maximum Stage 4% AEP
Scheme Model Maximum Stage 4% AEP
Culvert
6
11
16
21
26
31
36
0 500 1000 1500 2000 2500 3000 3500 4000
Pe
ak W
L (m
)
Chainage (m)
Existing Model Maximum Stage 1% AEP
Scheme Model Maximum Stage 1% AEP
Culvert
Hydraulic Model Summary Report – West Brook 9
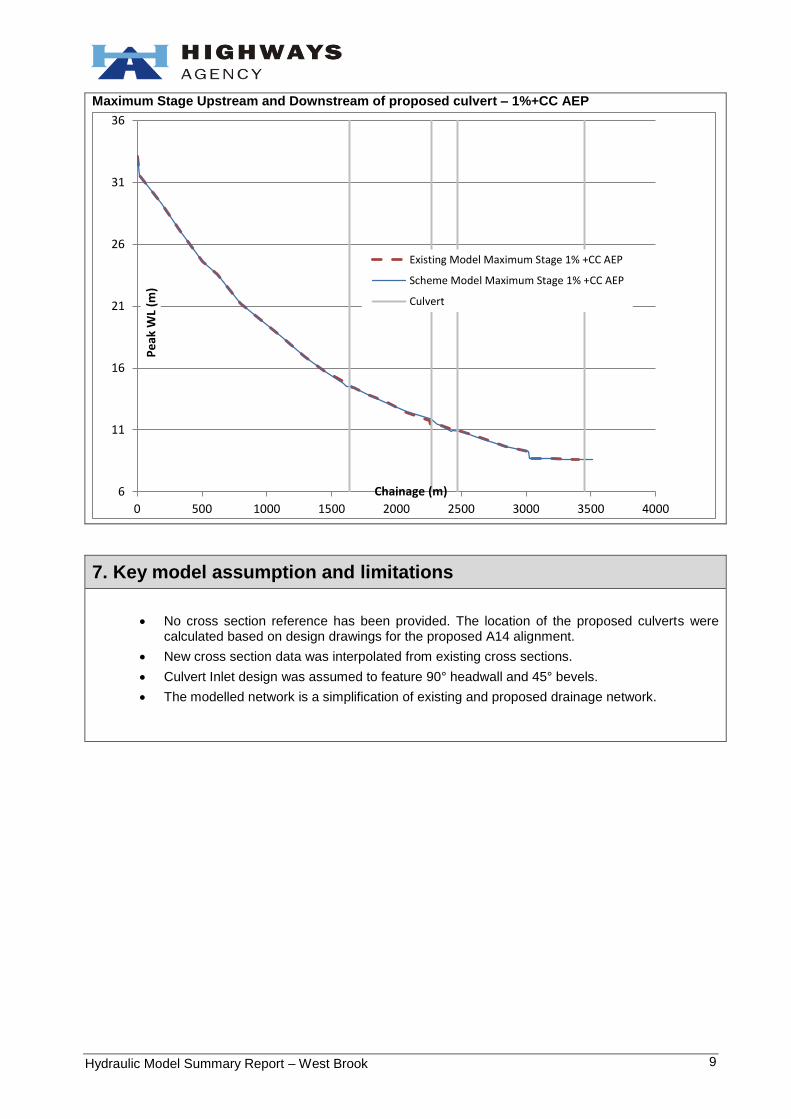
Maximum Stage Upstream and Downstream of proposed culvert – 1%+CC AEP
7. Key model assumption and limitations
No cross section reference has been provided. The location of the proposed culverts were calculated based on design drawings for the proposed A14 alignment.
New cross section data was interpolated from existing cross sections.
Culvert Inlet design was assumed to feature 90° headwall and 45° bevels.
The modelled network is a simplification of existing and proposed drainage network.
6
11
16
21
26
31
36
0 500 1000 1500 2000 2500 3000 3500 4000
Pe
ak W
L (m
)
Chainage (m)
Existing Model Maximum Stage 1% +CC AEP
Scheme Model Maximum Stage 1% +CC AEP
Culvert
Hydraulic Model Summary Report – West Brook 10
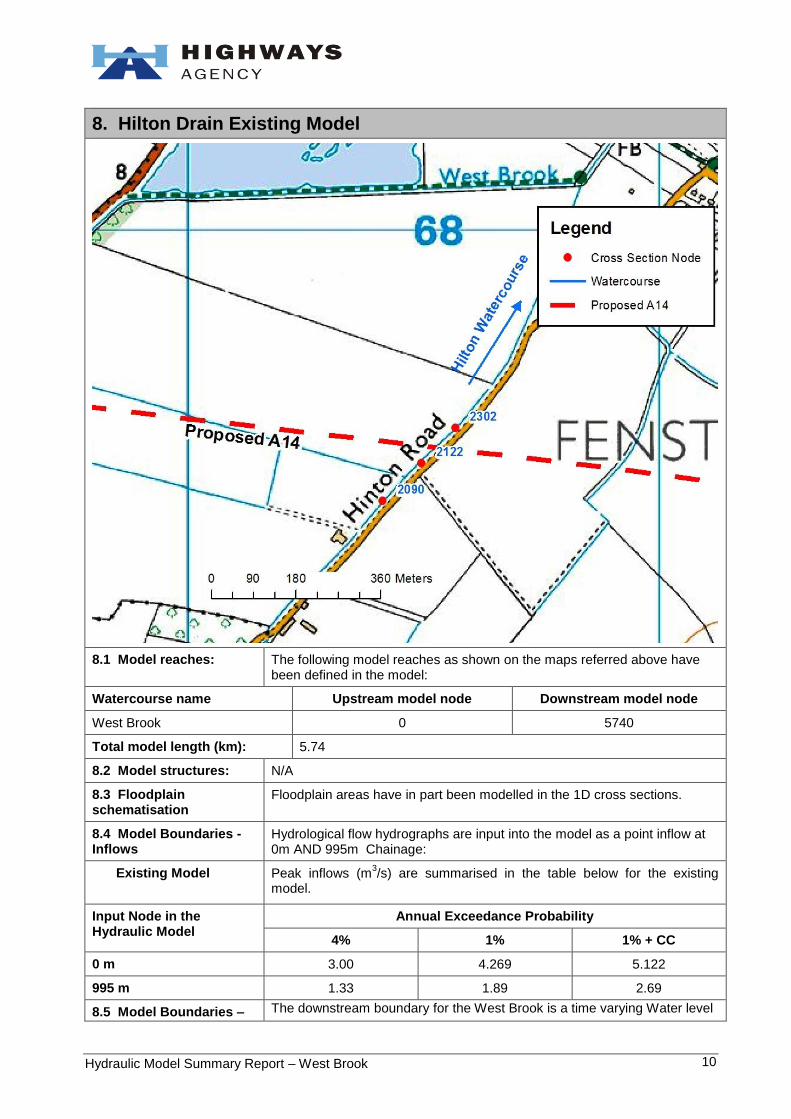
8. Hilton Drain Existing Model
8.1 Model reaches: The following model reaches as shown on the maps referred above have been defined in the model:
Watercourse name Upstream model node Downstream model node
West Brook 0 5740
Total model length (km): 5.74
8.2 Model structures: N/A
8.3 Floodplain schematisation
Floodplain areas have in part been modelled in the 1D cross sections.
8.4 Model Boundaries - Inflows
Hydrological flow hydrographs are input into the model as a point inflow at 0m AND 995m Chainage:
Existing Model
Peak inflows (m3/s) are summarised in the table below for the existing
model.
Input Node in the Hydraulic Model
Annual Exceedance Probability
4% 1% 1% + CC
0 m 3.00 4.269 5.122
995 m 1.33 1.89 2.69
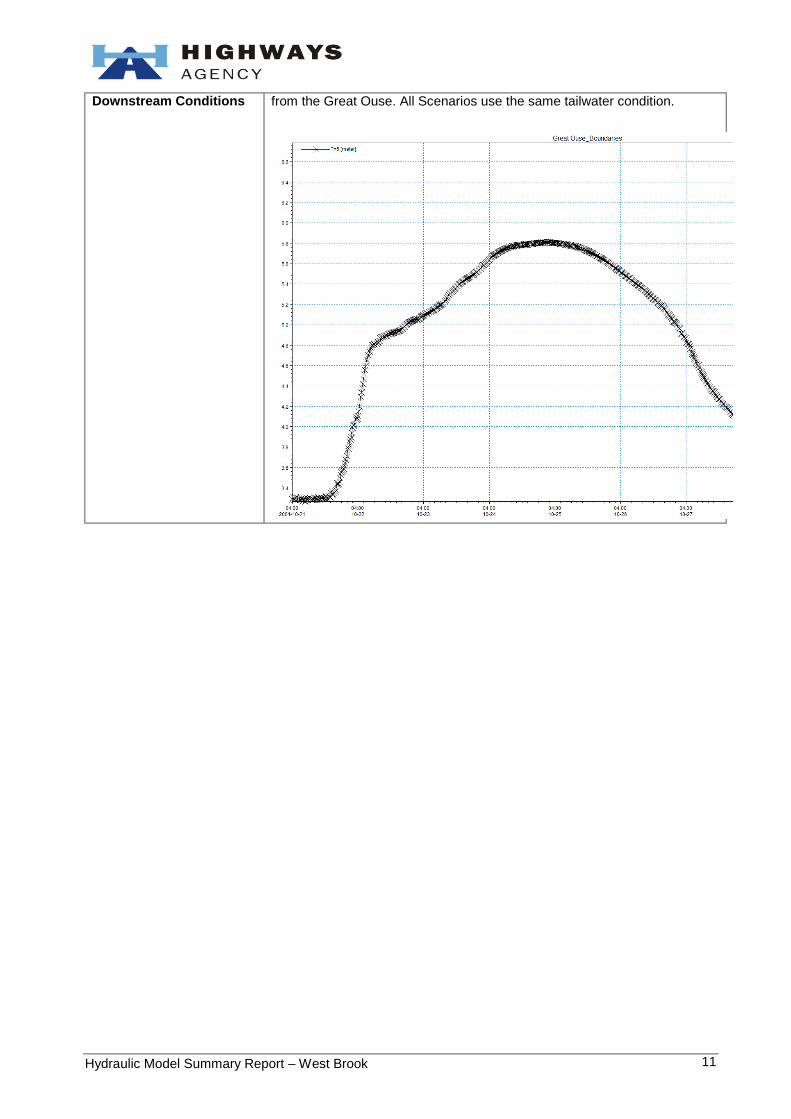
8.5 Model Boundaries – The downstream boundary for the West Brook is a time varying Water level
Hydraulic Model Summary Report – West Brook 11
Downstream Conditions from the Great Ouse. All Scenarios use the same tailwater condition.
Hydraulic Model Summary Report – West Brook 12
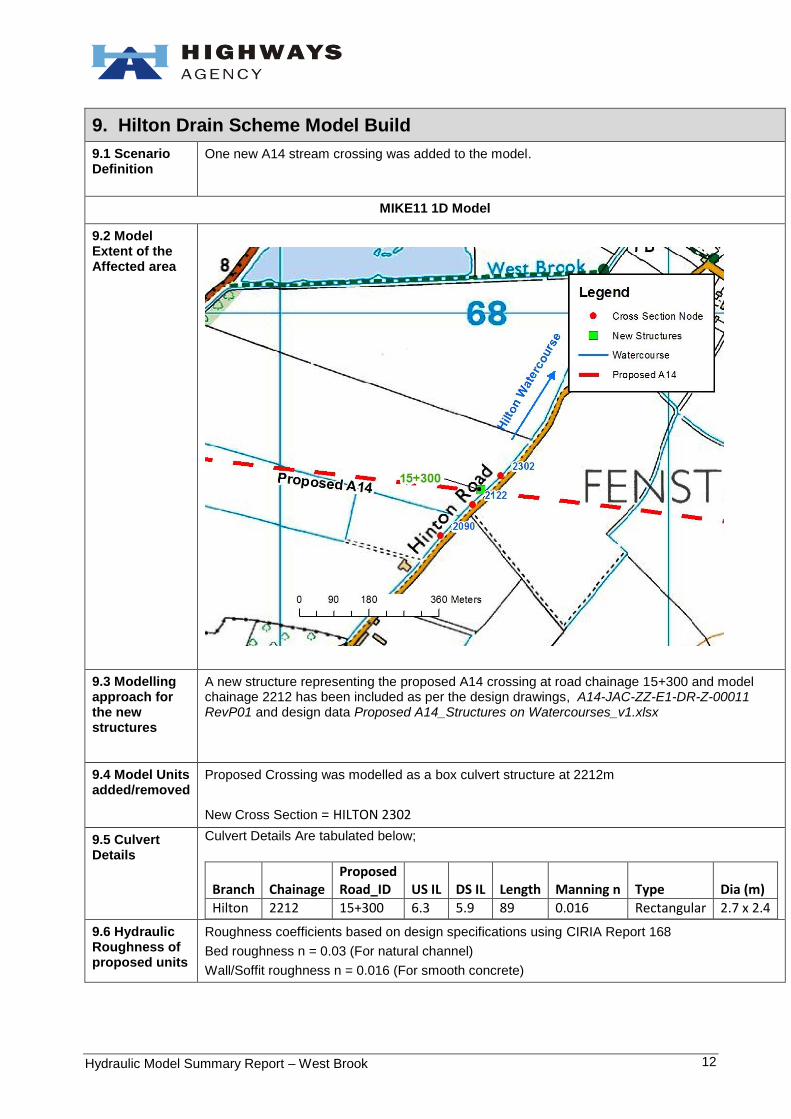
9. Hilton Drain Scheme Model Build
9.1 Scenario Definition
One new A14 stream crossing was added to the model.
MIKE11 1D Model
9.2 Model Extent of the Affected area
9.3 Modelling approach for the new structures
A new structure representing the proposed A14 crossing at road chainage 15+300 and model chainage 2212 has been included as per the design drawings, A14-JAC-ZZ-E1-DR-Z-00011 RevP01 and design data Proposed A14_Structures on Watercourses_v1.xlsx
9.4 Model Units added/removed
Proposed Crossing was modelled as a box culvert structure at 2212m
New Cross Section = HILTON 2302
9.5 Culvert Details
Culvert Details Are tabulated below;
Branch Chainage Proposed Road_ID US IL DS IL Length Manning n Type Dia (m)
Hilton 2212 15+300 6.3 5.9 89 0.016 Rectangular 2.7 x 2.4
9.6 Hydraulic Roughness of proposed units
Roughness coefficients based on design specifications using CIRIA Report 168
Bed roughness n = 0.03 (For natural channel)
Wall/Soffit roughness n = 0.016 (For smooth concrete)
Hydraulic Model Summary Report – West Brook 13
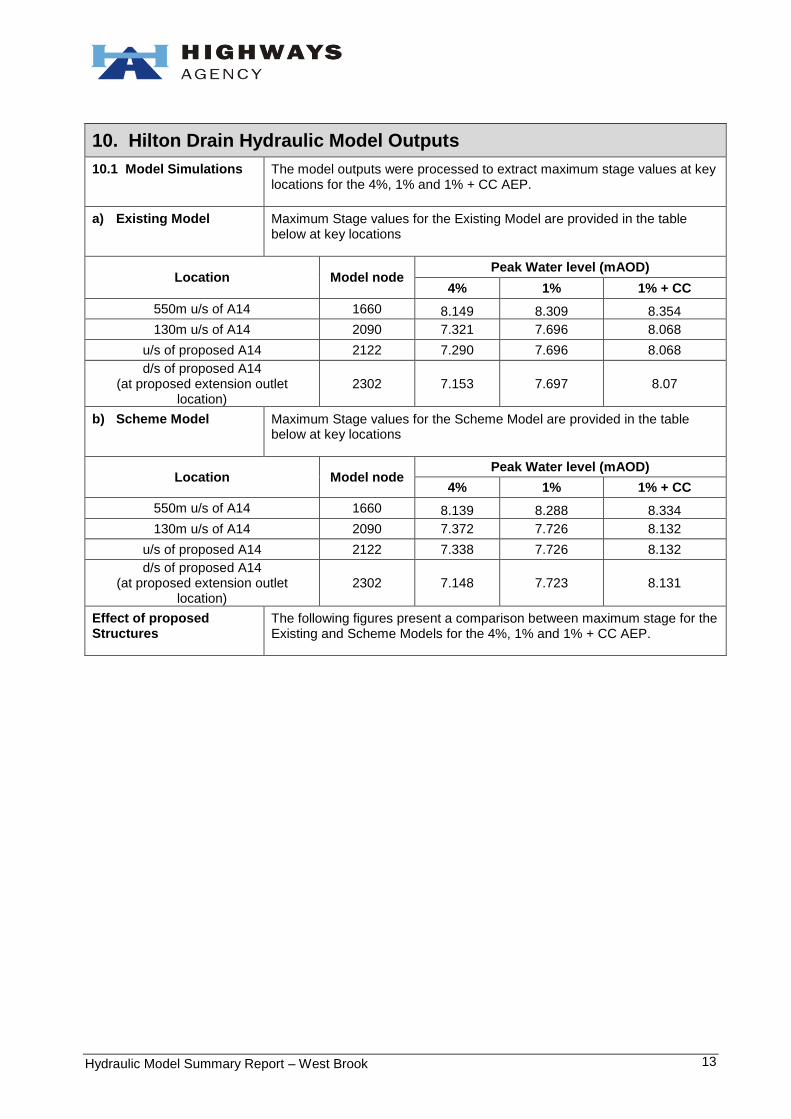
10. Hilton Drain Hydraulic Model Outputs
10.1 Model Simulations The model outputs were processed to extract maximum stage values at key locations for the 4%, 1% and 1% + CC AEP.
a) Existing Model Maximum Stage values for the Existing Model are provided in the table below at key locations
Location Model node Peak Water level (mAOD)
4% 1% 1% + CC
550m u/s of A14 1660 8.149 8.309 8.354
130m u/s of A14 2090 7.321 7.696 8.068
u/s of proposed A14 2122 7.290 7.696 8.068
d/s of proposed A14 (at proposed extension outlet
location) 2302 7.153 7.697 8.07
b) Scheme Model Maximum Stage values for the Scheme Model are provided in the table below at key locations
Location Model node Peak Water level (mAOD)
4% 1% 1% + CC
550m u/s of A14 1660 8.139 8.288 8.334
130m u/s of A14 2090 7.372 7.726 8.132
u/s of proposed A14 2122 7.338 7.726 8.132
d/s of proposed A14 (at proposed extension outlet
location) 2302 7.148 7.723 8.131
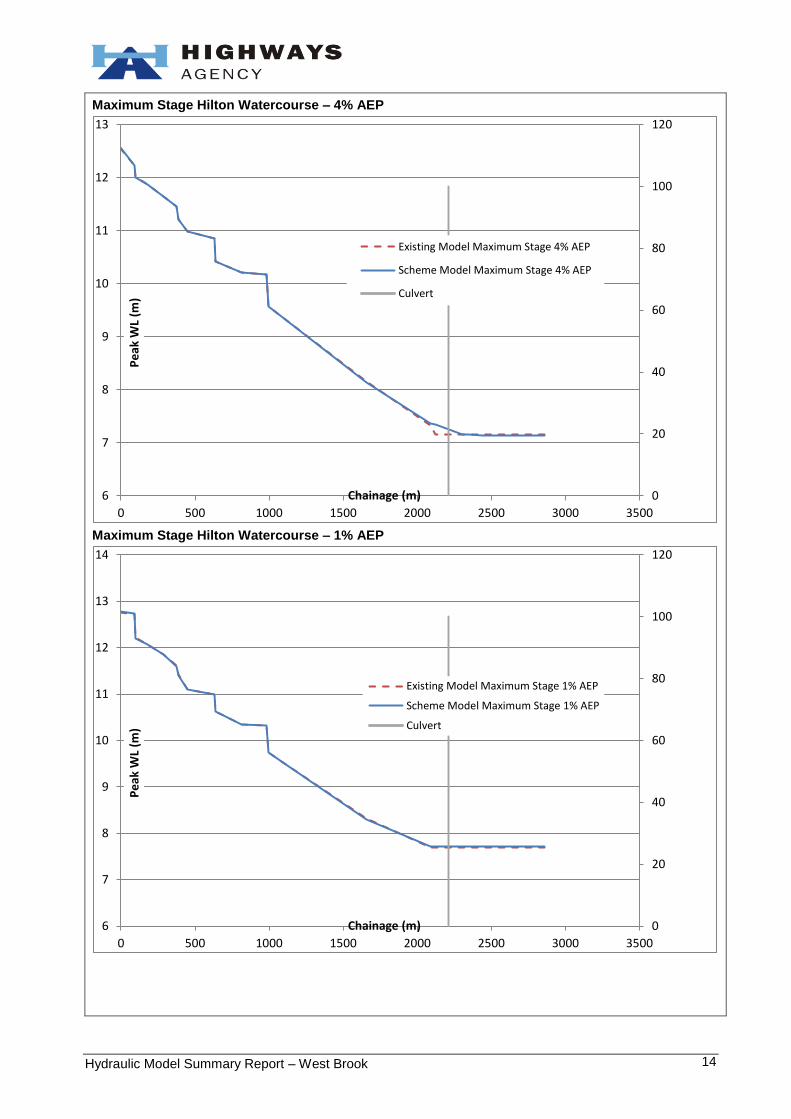
Effect of proposed Structures
The following figures present a comparison between maximum stage for the Existing and Scheme Models for the 4%, 1% and 1% + CC AEP.
Hydraulic Model Summary Report – West Brook 14
Maximum Stage Hilton Watercourse – 4% AEP
Maximum Stage Hilton Watercourse – 1% AEP
0
20
40
60
80
100
120
6
7
8
9
10
11
12
13
0 500 1000 1500 2000 2500 3000 3500
Pe
ak W
L (m
)
Chainage (m)
Existing Model Maximum Stage 4% AEP
Scheme Model Maximum Stage 4% AEP
Culvert
0
20
40
60
80
100
120
6
7
8
9
10
11
12
13
14
0 500 1000 1500 2000 2500 3000 3500
Pe
ak W
L (m
)
Chainage (m)
Existing Model Maximum Stage 1% AEP
Scheme Model Maximum Stage 1% AEP
Culvert
Hydraulic Model Summary Report – West Brook 15
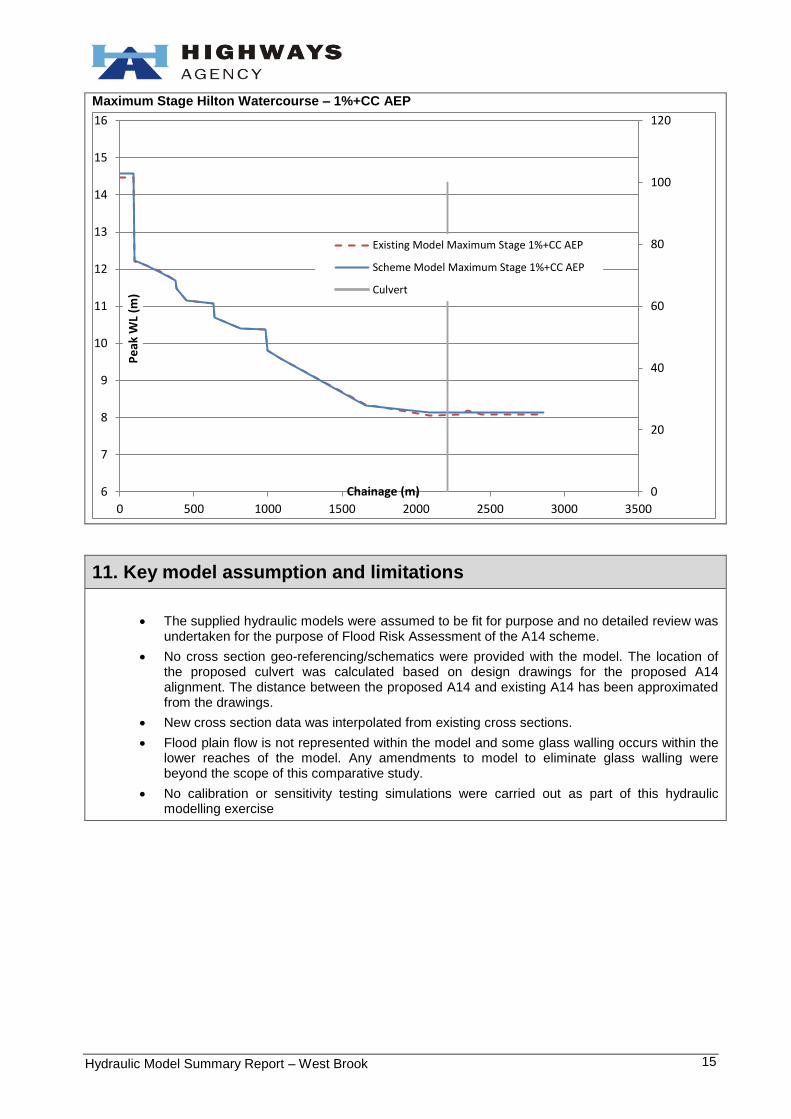
Maximum Stage Hilton Watercourse – 1%+CC AEP
11. Key model assumption and limitations
The supplied hydraulic models were assumed to be fit for purpose and no detailed review was undertaken for the purpose of Flood Risk Assessment of the A14 scheme.
No cross section geo-referencing/schematics were provided with the model. The location of the proposed culvert was calculated based on design drawings for the proposed A14 alignment. The distance between the proposed A14 and existing A14 has been approximated from the drawings.
New cross section data was interpolated from existing cross sections.
Flood plain flow is not represented within the model and some glass walling occurs within the lower reaches of the model. Any amendments to model to eliminate glass walling were beyond the scope of this comparative study.
No calibration or sensitivity testing simulations were carried out as part of this hydraulic modelling exercise
0
20
40
60
80
100
120
6
7
8
9
10
11
12
13
14
15
16
0 500 1000 1500 2000 2500 3000 3500
Pe
ak W
L (m
)
Chainage (m)
Existing Model Maximum Stage 1%+CC AEP
Scheme Model Maximum Stage 1%+CC AEP
Culvert
Related Documents