NASA Technical Memorandum 86028 NASA -TM -86028 19f1£J0091L/S Flight Test Experience With Pilot- Induced-Oscillation Suppression Filters ' Mary F. Shafer, Rogers E. Smith, James F. Stewart, and Randall E. Bailey January 1984 NI\S/\ National Aeronautics and Space Administration

Welcome message from author
This document is posted to help you gain knowledge. Please leave a comment to let me know what you think about it! Share it to your friends and learn new things together.
Transcript
NASA Technical Memorandum 86028 NASA -TM -86028
19f1£J0091L/S
Flight Test Experience With PilotInduced-Oscillation Suppression Filters '
Mary F. Shafer, Rogers E. Smith, James F. Stewart, and Randall E. Bailey
January 1984
NI\S/\ National Aeronautics and Space Administration
NASA Technical Memorandum 86028
F'light Test Experience With Pilot· Induced·Oscillation Supp'ression Flilters Mary F. Shafer, Rogers E. Smith, James F. Stewart NASA Ames Research Center, Dryden Flight Research Facility, Edwards, California 93523
Randall E. Bailey Grumman Aerospace Corporation, Bethpage, New York 11714
1984
National Aeronautics and Space Administration Ames Research Center Dryden Flight Research Facility Edwards, California 93523
/
FLIGHT TEST EXPERIENCE WITH PILOT-INDUCED-OSCILLATION SUPPRESSION FILTERS
Mary F. Shafer,. Rogers E. Smith,** and James F. Stewartt NASA Ames Research Center
Dryden Flight Research Facility Edwards, California
and
Randall E. Bailey* Grumman Aerospace Corporation
Bethpage, New York
Abstract
Digi tal flight control systems are popular for their flexibility, reliability, and power; however, their use sometimes results in deficient handling qualities, including pilot-induced oscillation (PIO), which can require extensive redesign of the control system. When redesign is not immediately possible, 'temporary solutions, such as the PIO suppression (PIOS) filter developed for the space shuttle, have been proposed. To determine the effectiveness of such PIOS filters on more conventional, hiqh-performance aircraft, three experiments were performed using the NASA F-8 digital fly-by-wire and USAF/Calspan NT-33 variablestability aircraft. Two types of PIOS filters were evaluated, using high-gain, precision tasks (close formation, probe-and-drogue refllellng, and precision tOllch--and-go landing) with a time delay or a first-order lag added to make the aircraft prone to PIO. Various configurations of the PIOS filter Were evaluated in the flight programs, and most of the PIOS filter configurations reduced the occurrence of PIOs and improved the handling qualities of the PIC-'prone aircraft. These experiments also confirmed the influence of high-gain tasks and excessive control system time delay in evoking pi lot-induced osci llations.
Nomenclature
CTF close-trail formation
I)FBW digital fly-by-wire
Max maximum attenuation
PDR probe-and-drogue refueling
Pro pilot-induced oscillation
PIOS pilot-induced oscillation suppressor
PTG precision touch-and-go
SAS stability augmentation system
Introduction
The use of digital flight control systems has become common in recent years because they are
*Aerospace Engineer. Member AIAA. **Research Test Pilot (formerLy of Calspan Advanced
Technology Center, Buffalo, New York). Member AIM.
tX-29 Project Engineer. *Aerospace Engineer (formerly of Calspan Advanced
Technology Center, Buffalo, New York).
reliable, maintainable, flexible, and make the implementation of complex control laws possible. There have been, however, a number of problems
associated with digital flight control systems.',2 Typically, the effects of the more-complex control laws have not been well understood. Even when conventional control laws are implemented, unacceptable flying qualities may result from other system deficiencies. For example, design and cost constraints may produce inadequate control authority or surface rate limiting. There are also certain constraints intrinsic to digital flight control systems, such as time delays associated with digital computation and the finite sample rates of control states.
The major problems associated with digital flight control systems have been related to the equivalent time delays introduced because of the complex, higher-order natllre of the dynamic system the pilot must fly. Excessively large time delays
have been implicated3,4 as a cause of pilot-induced oscillations (PIO). When deficient flying qualities arise because of problems like these, the ideal solution is to redesign the control system, correcting these deficiencies. However, it is not always possible to do so in a timely manner, in part because of the extensive validation and verification process required for these control systems. Thus the question arises, Are there temporary solutions that will enable the aircraft to keep flying while a permanent solution is implemented?
One such solution is the pilot-inducedoscillation suppression filter (PIOS filter) that was developed for the space shuttle. During the approach and landing tests, the space shuttle demonstrated a propensity for PIO in a preciSion landing. This proneness to PIO has been attributed to a number of factors,S the most important being excesslve control system time delay. Because of time constraints and the complexity of the control system, it was not considered acceptable to redesign the control system before continuing the program. Instead, a PIOS filter was designed for
the space shuttle. 5,6 These filters are adaptive, nonlinear fllters that reduce the pilot's control authority when conditions signaling an incipient PIO are evident. During testing with ground-based and airborne simulators, the filter reduced the incidence of PIO and reduced the severity of the PIOs that did occur.
The success with the PIOS filter for the space shuttle made it likely that such techniques could be applied to other classes of aircraft, such as high-performance fighters. Among the aircraft
identified 1,2 as having flying qualities deficien-
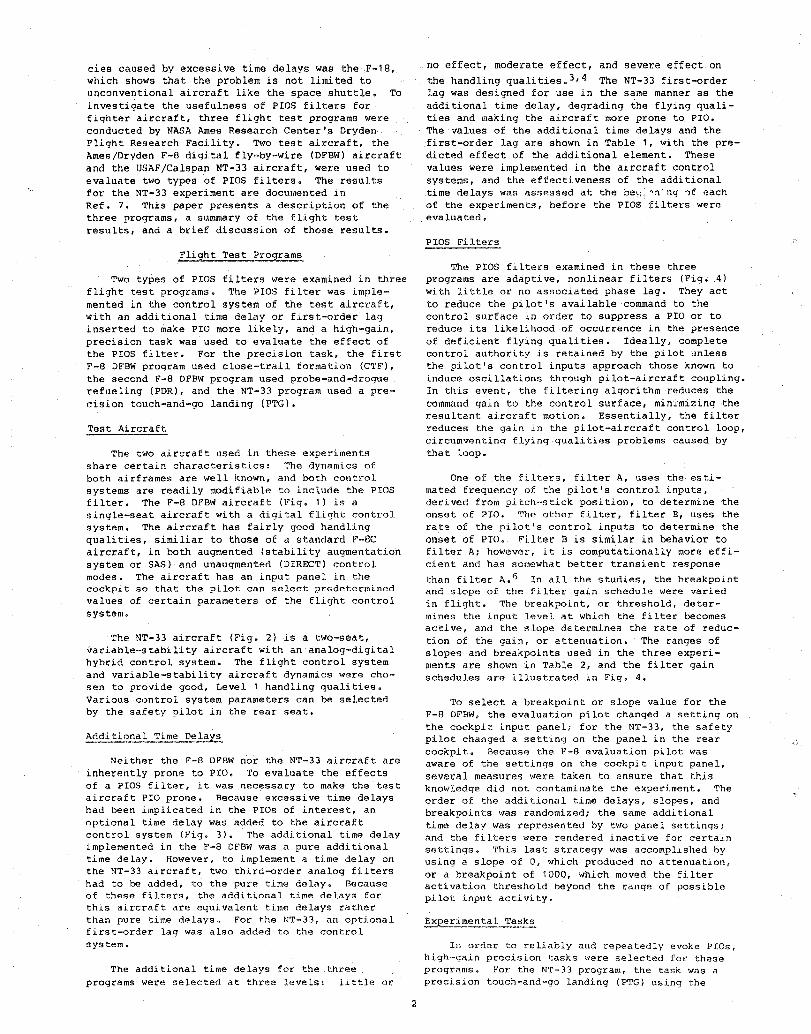
cies caused by excessive time delays was the F-18, which shows that the problem is not limited to unconventional aircraft like the space shuttle. To investigate the usefulness of PIOS filters for fighter aircraft, three flight test programs were conducted by NASA Ames Research Center's Dryden Flight Research Facility. Two test aircraft, the Ames/Dryden F-8 digital fly-by-wire (DFBW) aircraft and the USAF/Calspan NT-33 aircraft, were used to evaluate two types of PIOS filters. The results for the NT-33 experiment are documented in Ref. 7. This paper presents a description of the three programs, a summary of the flight test results, and a brief discussion of those results.
Flight Test Programs
Two types of PIOS filters were examined in three flight test programs. The PIOS filter was implemented in the control system of the test aircraft, with an additional time delay or first-order lag inserted to make PIO more likely, and a high-gain, precision task was used to evaluate the effect of the PIOS filter. For the precision task, the first F-8 DFBW program used close-trail formation (CTF), the second F-8 DFBW program used probe-and-drogue refueling (PDR), and the NT-33 program used a precision touch-and-go landing (PTG).
Test Aircraft
The two aircraft used in these experiments share certain characteristics: The dynamics of both airframes are well known, and bot.h control systems are readily modifiable to include the PIOS filter. The F-8 DFBW aircraft (Fig. 1) is a single-seat aircraft with a digital flight control system. The aircraft has fairly good handling qualities, similiar to those of a standard F-8C aircraft, in both augmented (stability augmentation system or SAS) and unaugmented (DIRECT) control modes. The aircraft has an input panel in the cockpit so that the pilot can select predetermined values of certain parameters of the flight control system.
The NT-33 aircraft (Fig. 2) is a two-seat, variable-stability aircraft with an analog-digital hybrid control system. The flight control system and variable-stability aircraft dynamics were chosen to provide good, Levell handling qualities. Various control system parameters can be selected by the safety pilot in the rear seat.
Additional Time Delays
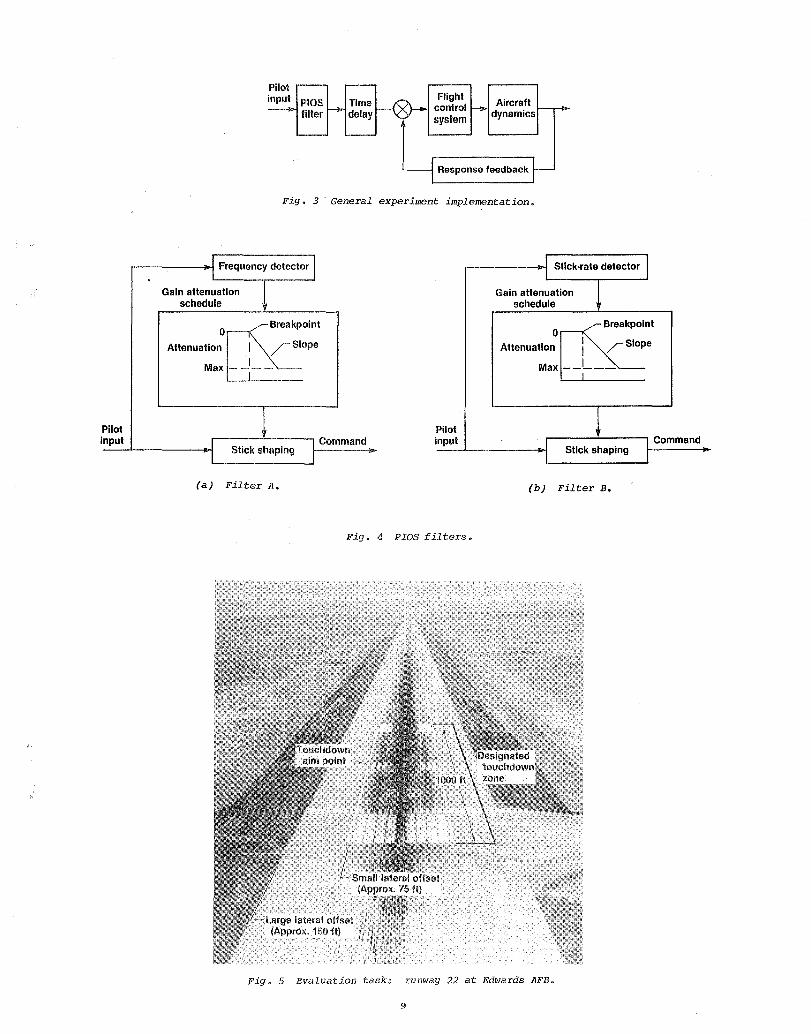
Neither the F-8 DFBW no·r the NT-33 aircraft are inherently prone to PIO. To evaluate the effects of a PIOS filter, it was necessary to make the test aircraft PIO prone. Because excessive time delays had been implicated in the PIOs of interest, an optional time delay was added to the aircraft control system (Fig. 3). The additional time delay implemented in the F-8 DFBW was a pure additional time delay. However, to implement a time delay on the NT-33 aircraft, two third-order analog filters had to be added, to the pure time delay. Because of these filters, the additional time delays for this aircraft are equivalent time delays rather than pure time delays. For the NT-33, an optional flrst-order lag was also added to the control system.
The additional time delays for the three programs were selected at three levels: little or
2
no effect, moderate effect, and severe effect on
the handling qualities. 3,4 The NT-33 first-order lag was designed for use in the same manner as the additional time delay, degrading the flying qualities and making the aircraft more prone to PIO. The values of the additional time delays and the first-order lag are shown in Table 1, with the predicted effect of the additional element. These values were implemented in the aircraft control systems, and the effectiveness of the additional time delays was as'lp.ssed at the beS 'n'ng ..,f "ach of the experiments, before the PIOS filters were evaluated.
PIOS Filters
The PIOS filters examined in these three programs are adaptive, nonlinear filters (Fig. 4) with little or no associated phase lag. They act to reduce the pilot's available command to the control surface in order to suppress a PIO or to reduce its likelihood of occurrence in the presence of deficient flying qualities. Ideally, complete control authority is retained by the pilot unless the pilot's control inputs approach those known to induce oscillations through pilot-aircraft coupling. In this event, the filtering algorithm reduces the command gain to the control surface, minimizing the resultant aircraft motion. Essentially, the filter reduces the gain in the pilot-aircraft control loop, circumventing flying qualities problems caused by that loop.
One of the filters, filter A, uses the estimated frequency of the pilot's control inputs, derived from pitch-stick position, to determine the onset of PIO. The other filter, filter B, uses the rate of the pilot's control in.puts to determine the onset of PIO. Filter B is similar in behavior to filter A; hO~/ever, it is computationally more efficient and has somewhat better transient response
than filter A. 6 In all the studies, the breakpoint and slope of the filter gain schedule were varied in flight. 'rhe breakpoint, or threshold, determines the input level at which the filter becomes active, and the slope determines the rate of reduction of the galn, or attenuation. The ranges of slopes and breakpoints used in the three experiments are shown in Table 2, and the filter gain schedules are illustrated 1n Fig. 4.
To select a breakpoint or slope value for the F-8 DFBW, the evaluation pilot changed a setting on the cockpit input panel; for the NT-33, the safety pilot changed a setting on the panel in the rear cockpit. Because the F-8 evaluation pilot was aware of the settings on the cockpit input panel, several measures were taken to ensure that this kn.owledge did not contaminate the experiment. The order of the additional time delays, slopes, and breakpoints was randomized; the same additional time delay was represented by two panel settings; and the filters were rendered inactive for certain settings. This last strategy was accompl~shed by using a slope of 0, which produced no attenuation, or a breakpoint of 1000, which moved the filter activation threshold beyond the range of possible pi lot input acti vi ty.
Experimental Tasks
In order to reliably and repeatedly evoke pros, high-gain precision tasks were selected for these programs. For the NT-33 program, the task was a precision touch-and-go landing (PTG) using the
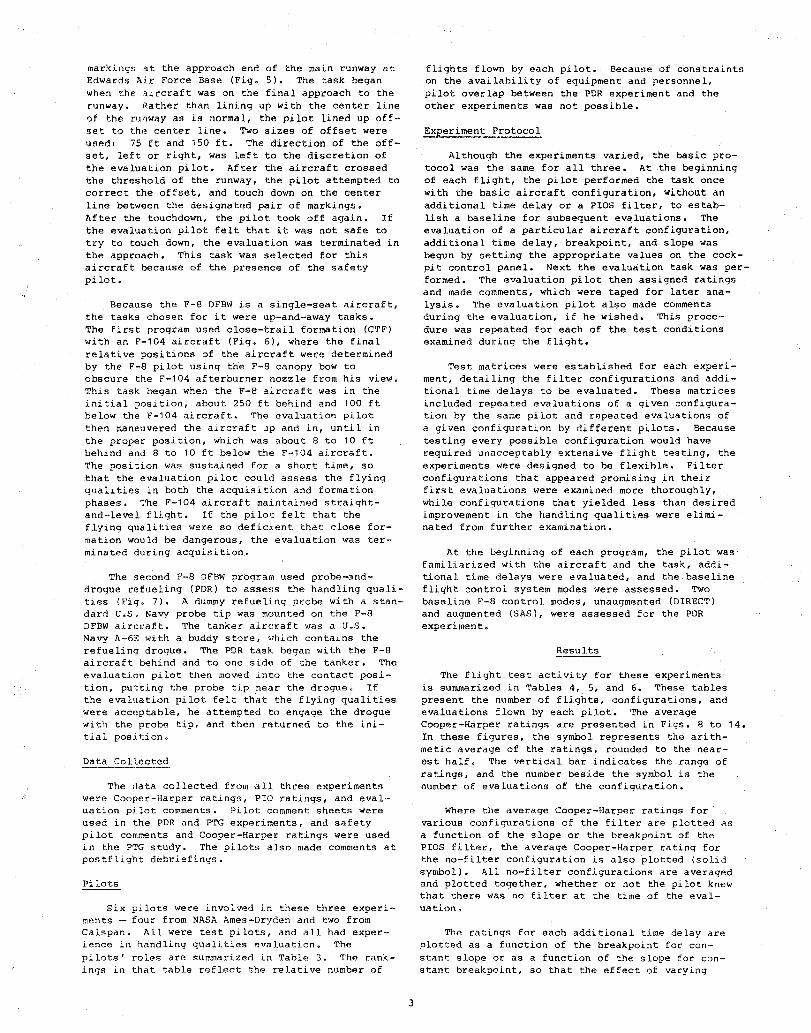
markings at the approach end of the main runway at Edwards Air Force Base (Fig. 5). The task began when the aircraft was on the final approach to the runway. Rather than lining up with the center line 0f the runway as is normal, the pilot lined up offset to the center line. Two sizes of offset were used: 75 ft and 150 ft. The direction of the offset, left or right, was left to the discretion of the evaluation pilot. After the aircraft crossed the threshold of the runway, the pilot attempted to correct the offset, and touch down on the center line betwElen the designated pair of markings. After the touchdown, the pilot took off again. If the evaluation pilot felt that it was not safe to try to touch down, the evaluation was terminated in the approach. This task was selected for this aircraft because of the presence of the safety pilot.
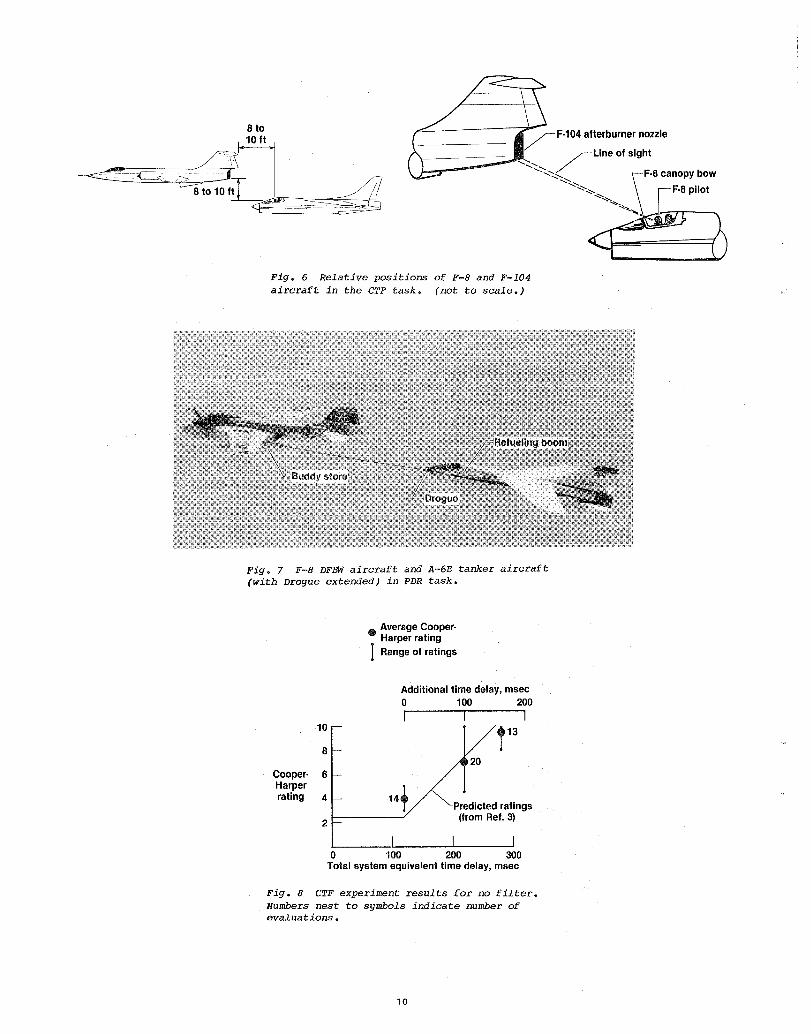
Because the F-8 DFBW is a single-seat aircraft, the tasks chosen for it were up-and··away tasks. The first program used close-trail formation (CTF) with an F··l04 aircraft (Fig. 6), where the final relative positions of the aircraft were determined by the F-H pilot using the F-8 canopy bow to obscure the F-l04 afterburner nozzle from his view. This task began when the F-8 aircraft was in the initial position, about 250 ft behind and 100 ft below the F-104 aircraft. The evaluation pilot then maneuvered the aircraft up and in, until Ln the proper position, which was about 8 to 10 ft behind and 8 to 10 ft below the F-104 aircraft. The position was sustained for a short time, so that the evaillation pilot could assess the flying qualities in both the acquisition and formation phases. 'l'he F-l04 aircraft maintained straightand-level flight. If the pilot felt that the flying qua.lities were so deficient that close formation wou.ld be dangerous, the evaluation was terminated during acquisition.
The second F··8 DFBW program used probe-.'l.nddrogue refueling (PDR) to assess the handling qualities (Fig. 7). A dummy refueling probe with a standard V.S. Navy probe tip was mounted on the F-8 DFBW aircraft. The tanker aircraft was a V.S. Navy A-6E with a buddy store, .,hich contains the refueling drogue. The PDR task began with the F-H aircraft behind and to one side of the tanker. The evaluation pilot then moved into the contact position, putting the probe tip near the drogue. If the evaluation pilot felt that the flying qualities were acceptable, he attempted to engage the drogue with the probe tip, and then returned to the initial position.
Data Collected
The data collected from all three experiments were Cooper-Harper ratings, PIO ratings, and evaluation pilot comments. Pilot comment sheets ... ere used in the PDR and PTG experiments, and safety pilot comments and Coope~-Harper ratings were used in the P1~G study. The pilots also made comments at postflight debriefings.
Pilots
Six pilots were involved in these three experiments - four from NASA Ames-Dryden and two from Calspan. All were test pilots, and all had experience in handling qualities evaluation. The pilots' roles are summarized in Table 3. The rankings in that table reflect the relative number of
3
flights flown by each pilot. Because of constraints on the availability of equipment and personnel, pilot overlap between the PDR experiment and the other experiments was not possible.
Experiment Protocol
Although the experiments varied, the basic protocol was the same for all three. At the beginning of each flight, the pilot performed the task once with the basic aircraft configuration, without an additional time delay or a PIOS filter, to establish a baseline for subsequent evaluations. The evaluation of a particular aircraft configuration, additional time delay, breakpoint, and slope was begun by setting the appropriate values on the cockpit control panel. Next the evaluation task was performed. The evaluation pilot then assigned ratings and made comments, which were taped for later analysis. The evaluation pilot also made comments during the evaluation, if he wished. This procedure was repeated for each of the test conditions examined during the flight.
Test matrices were established for each experiment, detailing the filter configurations and additional time delays to be evaluated. These matrices included repeated evaluations of a given configuration by the same pilot and repeated evaluations of a given configuration by different pilots. Because testing every possible configuration would have required unacceptably extensive flight testing, the experiments were designed to be flexihle. Filter configurations that appeared promising in their first evaluations were examined more thoroughly, while configurations that yielded less than desired improvement in the handling qualities were eliminated from further examination.
At the beginning of each program, the pilot was familiarized with the aircraft and the task, additional time delays were evaluated, and the. baseline flight control system modes were assessed. Two baseline F-8 control modes, unaugmented (DIRECT) and augmented (SAS), were assessed for the PDR experiment.
Results
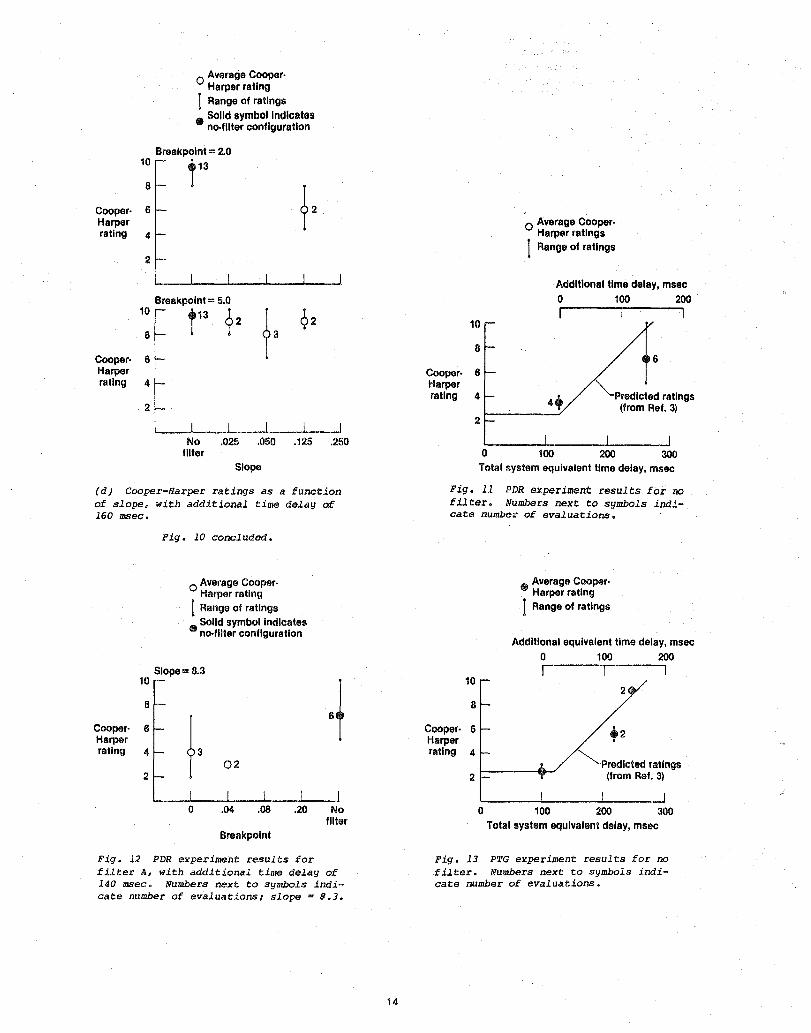
The flight test activity for these experiments is summarized in Tables 4, 5, and 6. These tables present the number of flights, configurations, and evaluations flown by each pilot. The average Cooper-Harper ratings a~e presented in Figs. 8 to 14. In these figures, the symbol represents the arithmetic average of the ratings, rounded to the nearest half. The vertical bar indicates the range of ratings, and the number beside the symbol is the number of evaluations of the configuration.
Where the average Cooper-Harper ratings for various configurations of the filter are plotted as a function of the slope or the breakpoint of the PIOS filter, the average Cooper-Harper rating for the no-filte~ configuration is also plotted (solid symbol). All no-filter configurations are averaged and plotted together, whether or not the pilot knew that there was no filter at the time of the evaluation.
The ratings for each additional time delay are plotted as a function of the breakpoint for constant slope or as a function of the slope for constant breakpoint, so that the effect of varying
slope or breakpoint can be assessed. For the CTF and PDR experiments, the value of the slope for no filter is 0, and the value of the breakpoint for no f i 1 ter is 1000; .therefore, these values were used in plotting the ratings of the no-filter configura-· tions. For consistency, the no-filter configurations of the PTG experiment are plotted in the same way. The ratings shown were selected from the complete set of data by two criteria: consistency with the pilot comments, and the presence of multiple evaluations of the configuration.
Even with the additional time delay and highgain task, PIOs were not encountered consistently. The concept of PIO as a "cliff" in the handling qualities implies that the handling qualities are good until they suddenly become bad as the pilot "falls over the cliff." The range of Cooper-Harper ratings obtained in these experiments tends to confirm this characterization, with ratings ranging from 4 to 10 for the same configuration. Because of this variation in the ratings, it was felt that a single evaluation provided insufficient information with which to assess the handling quali ties of the configuration. Therefore, ratings were plotted only when a filter configuration had been evaluated more than once.
The CTF experiment
The CTF experiment consisted of 16 flights with 197 evaluations of 48 configurations. The flight test activity for this experiment is summarized in Table 4. Because the DIRECT mode with no time delay produced acceptable performance, all subsequent evaluations used DIRECT. Initially, additional time delays of 100 and 160 msec were evaluated. Because the pilots reported that 100 msec yielded poor, PIO-prone handling qualities, this value was used for most of the evaluations. However, as the pilots gained more experience in flying with this additional delay they reported that the aircraft was no longer sufficiently prone to PIO. In an attempt to overcome this learning effect, additional delays of 160 and 200 msec were evaluated and an additional delay of 160 msec was determined to produce the required degree of proneness to PIO.
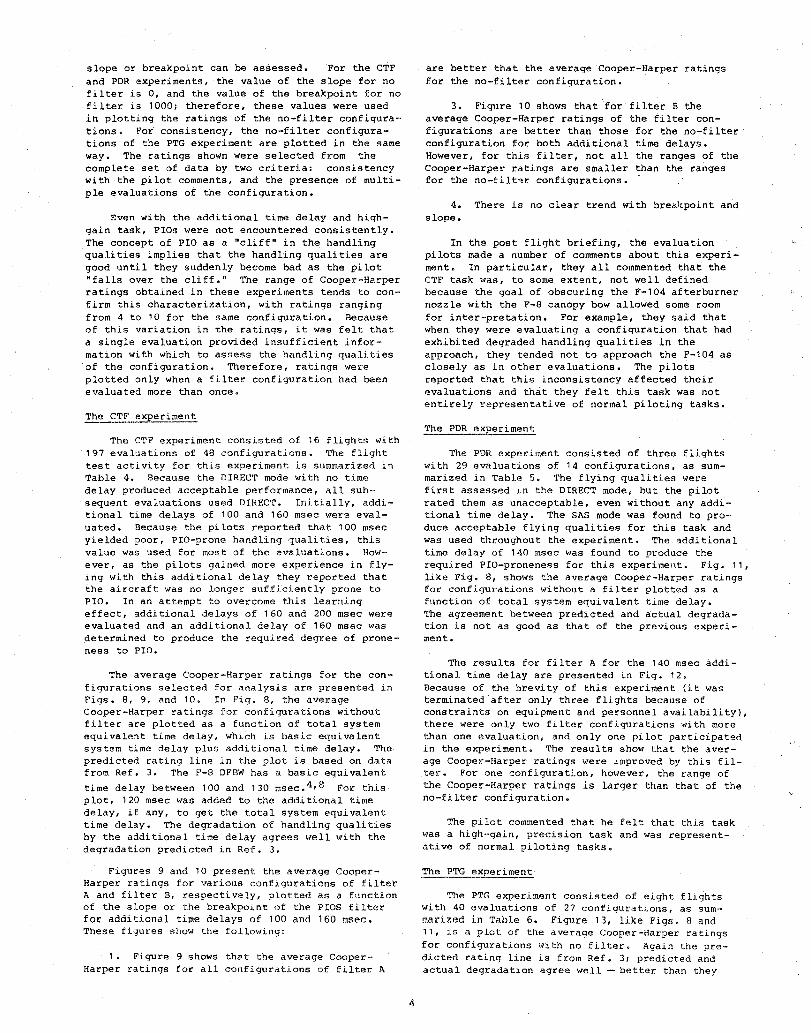
The average Cooper-Harper ratings for the configurations selected for analysis are presented in Figs. 8, 9, and 10. In Fig. 8, the average Cooper-Harper ratings for configurations without filter are plotted as a function of total system equivalent time delay, which is basic equivalent system time delay plus additional time delay. The predicted rating line in the plot is based on data from Ref. 3. The F-8 DFBW has a basic equivalent
time delay between 100 and 130 msec. 4 ,8 For this plot, 120 msec was added to the additional time delay, if any, to get the total system equivalent time delay. The degradation of handling qualities by the additional time delay agrees well with the degradation predicted in Ref. 3.
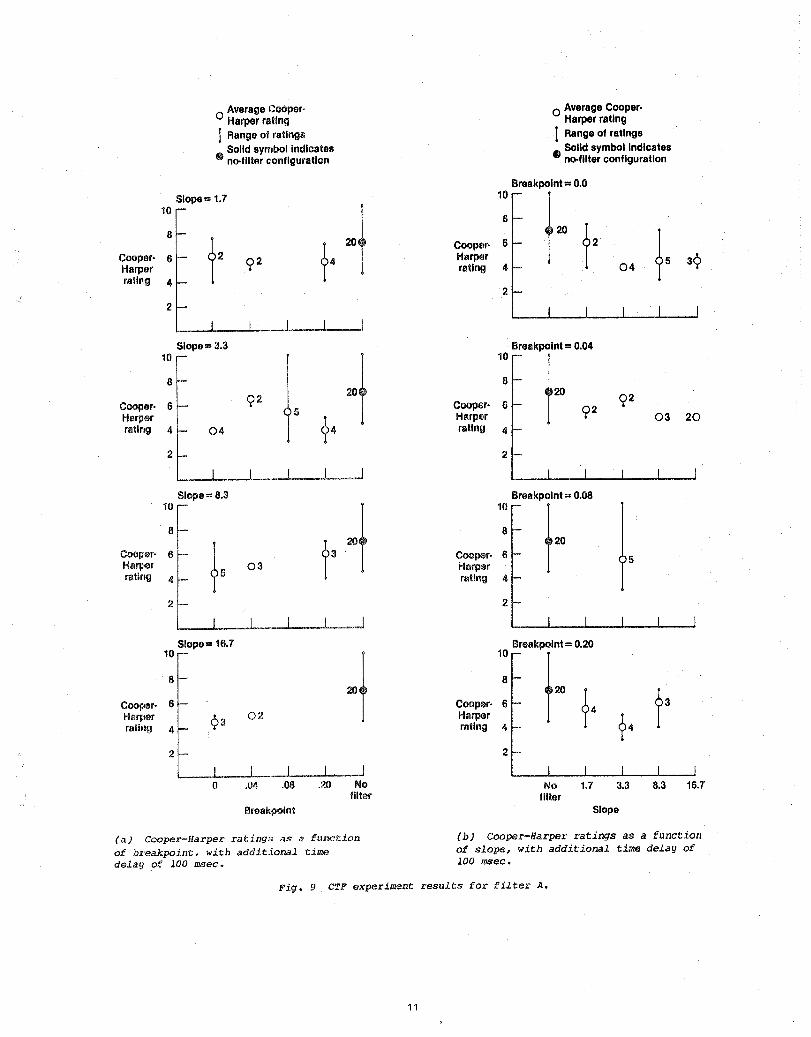
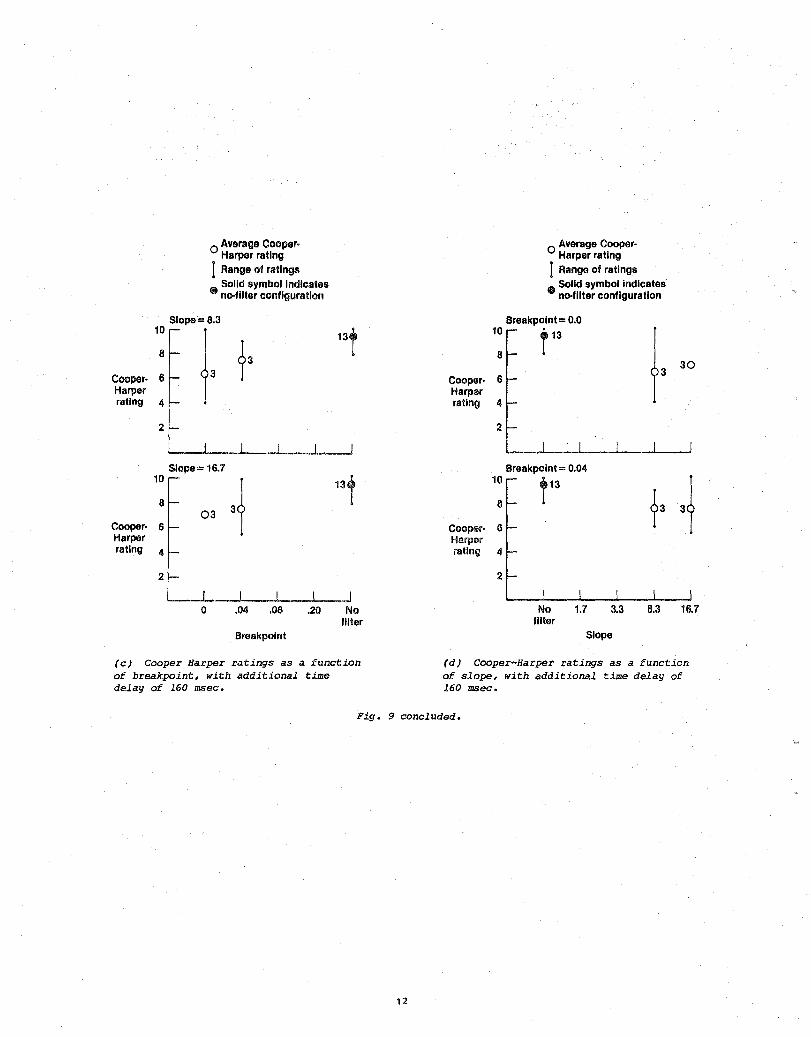
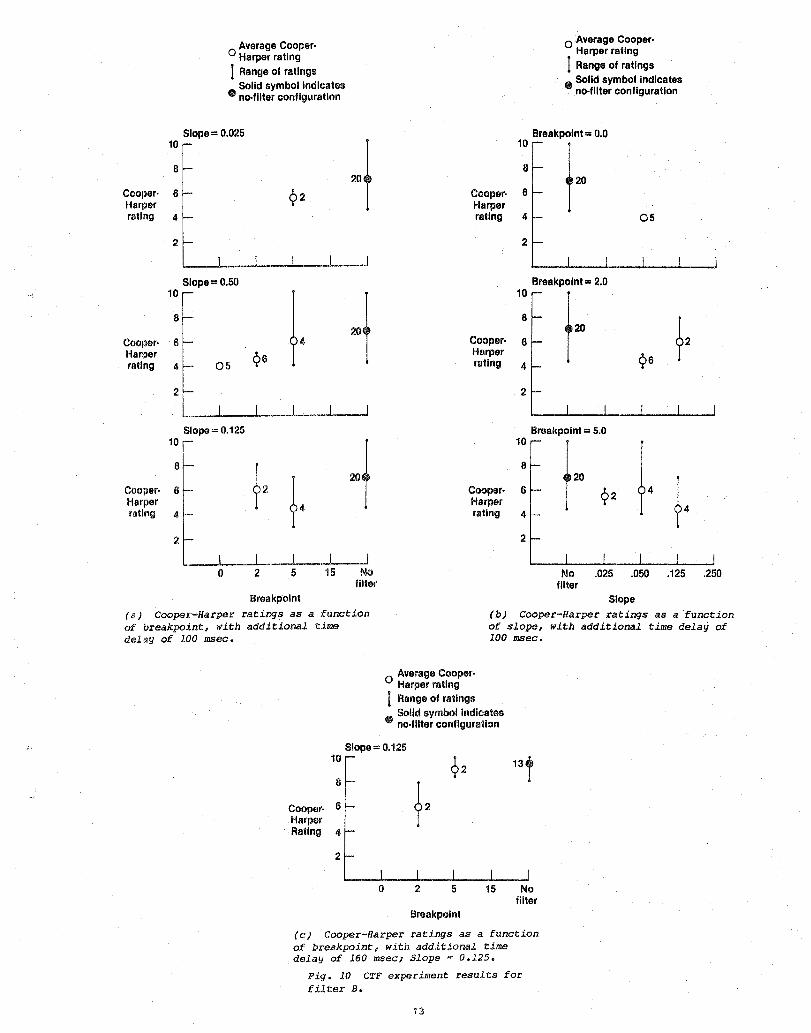
Figures 9 and 10 present the average CooperHarper ratings for various configurations of filter A and filter B, respectively, plotted as a function of the slope or the breakpoint of the PIOS filter for additional ti~e delays of 100 and 160 msec. These figures show the following:
1. Figure 9 shows that the average CooperHarper ratings for all configurat.Lons of filter A
4
are better that the average Cooper-Harper ratings for the no-filter configuration.
3. Figure 10 shows that for filter B the average Cooper-Harper ratings of the filter configurations are better than those for the no-filter configuration for both additional time delays. However, for this filter, not all the ranges of the Cooper-Harper ratings are smaller than the ranges for the no-filt~r configurations.
4. There is no clear trend with breakpoint and slope.
In the post flight briefing, the evaluation pilots made a number of comments about this experiment. In particular, they all commented that the CTF task was, to some extent, not well defined because the goal of obscuring the F-104 afterburner nozzle with the F-8 canopy bow allowed some room for inter-pretation. For example, they said that when they were evaluating a configuration that had exhibited degraded handling qualities in the approach, they tended not to approach the F-104 as closely as in other evaluations. The pilots reported that this inconsistency affected their evaluations and that they felt this task was not entirely representative of normal piloting tasks.
The PDR experiment
The PDR experiment consisted of three flights with 29 evaluations of 14 configurations, as summarized in Table 5. The flying qualities were first assessed in the DIRECT mode, but the pilot rated them as unacceptable, even without any additional time delay. The SAS mode was found to produce acceptable flying qualities for this task and was used throughout the experiment. The additional time delay of 140 msec was found to produce the required PIO-proneness for this experiment. Fig. 11, like Fig. 8, shows the average Cooper-Harper ratings for configurations without a filter plotted as a function of total system equivalent time delay. The agreement between predicted and actual degradation is not as good as that of the previous experiment.
The results for filter A for the 140 msec additional time delay are presented in Fig. 12. Because of the brevity of this experiment (it was terminated after only three flights because of constraints on equipment and personnel availability), there were only two filter configurations with more than one evaluation, and only one pilot participated in the experiment. The results show that the average Cooper-Harper ratings were improved by this filter. For one configuration, however, the range of the Cooper-Harper ratings is larger than that of the no-filter configuration.
The pilot commented that he felt that this task was a high-gain, precision task and was representative of normal piloting tasks.
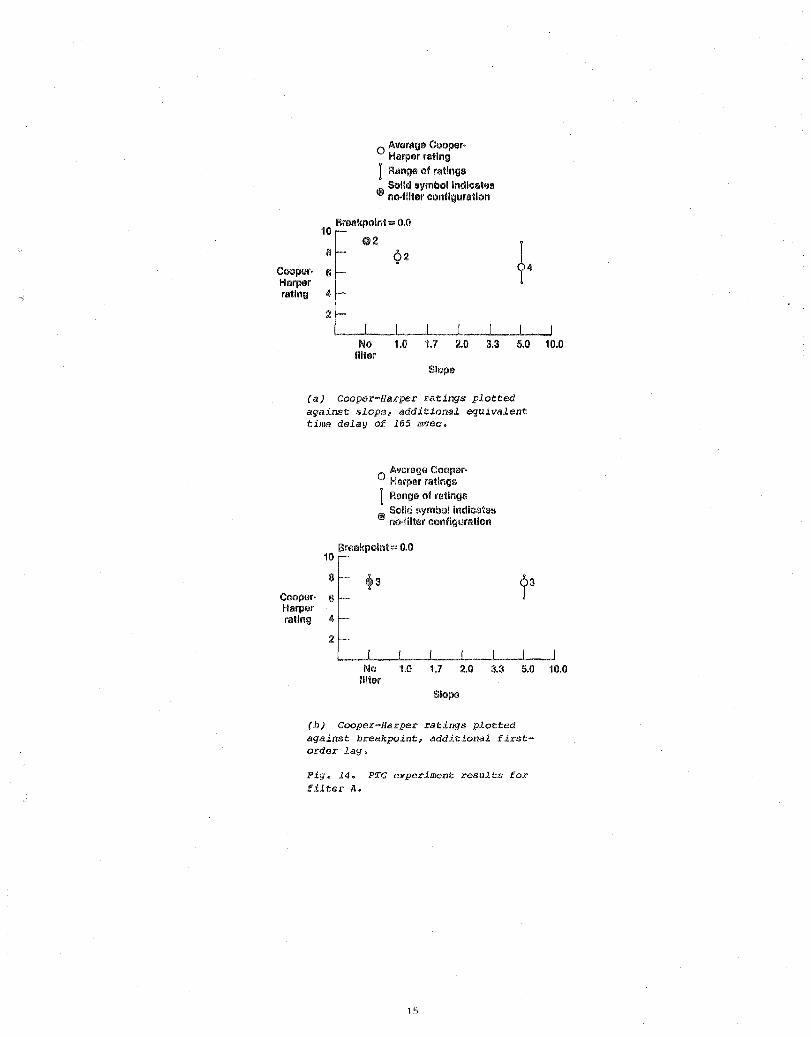
The PTG experiment
The PTG experiment consisted of eight flights with 40 evaluations of 27 configurations, as summarized in Table 6. Figure 13, like Figs. 8 and 11, is a plot of the average Cooper-Harper ratings for configurations with no filter. Again the predicted rating line is from Ref. 3; predicted and actual degradation agree well - better than they
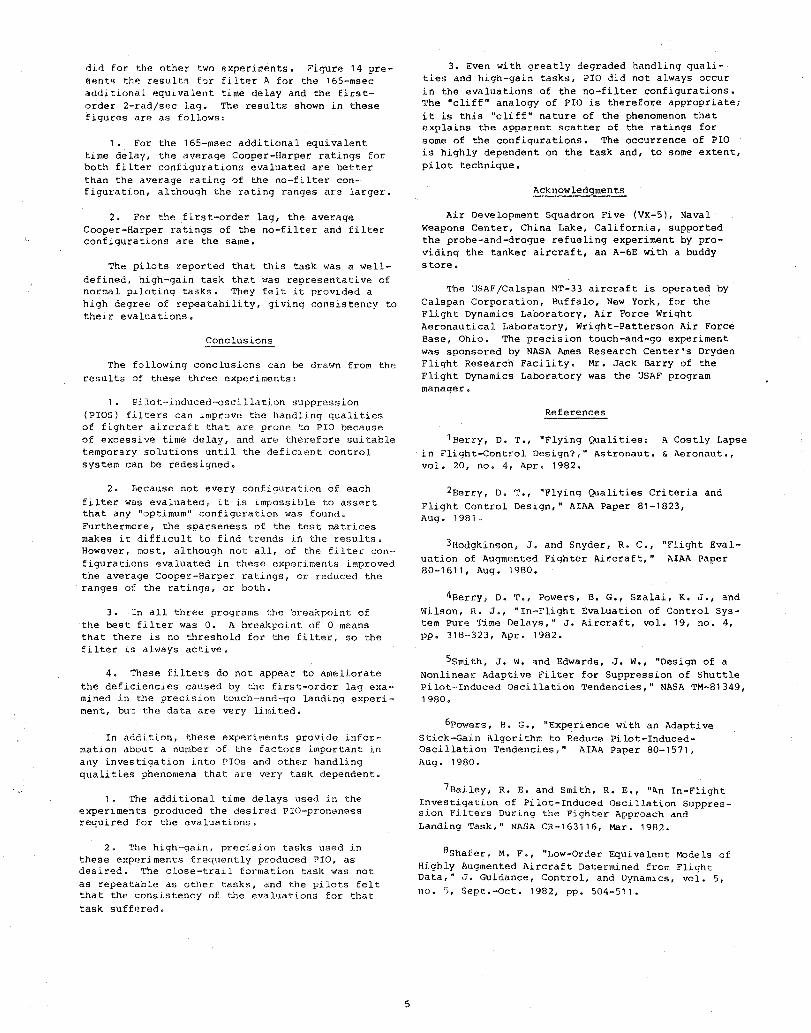
clicl for the other two experiments. Figure 14 pre.Antq th~ reaultq for filter A for the 165-msec additional equivalent time delay and the firstorder 2-rad/sec lag. The resu1t:s shown in these figures are as follows:
1. For the 165-msec additional equivalent time delay, the average Cooper-Harper ratings for both filter configurations evaluated are better than the average rating of the no-filter configuration, although the rating ranges are larger.
2. For the first-order lag, the average Cooper-Harper ratings of the no·-filter and filter configurations are the same.
The pilots reported that this task was a welldefined, hi.gh-gain task that was representative of normal piloting tasks. They felt it provided a high degree of repeatability, giving consistency to their evaluations.
Conclusions
The following conclusions can be drawn from the resul ts of these three experiments:
1. Pilot-induced-oscillation suppression (PIOS) filters can improve the handling qualities of fighter aircraft that are prone to PIO because of excessive time delay, and are therefore suitable temporary solutions until the deficient control system can be redesigned.
2. Because not every configuration of each filter was evaluated, it is impossible to assert that any "optimum" configuration was found. Furthermore, the sparseness of the test mat:rices makes it difficult to find trends in the results. However, most, although not all, of the filter configurations evaluated in these experiments improved the average Cooper-Harper ratings, or reduced the ranges of the ratings, or both.
3. In all three programs the breakpoint of the best filter was O. A breakpoint of 0 means that there is no threshold for the filter, so the filter is always active.
4. These filters do not appear to ameliorate the deficiencies caused by the first-order lag examined in t.he preCision touch-and-go landing experiment' but the data are very limited.
In addition, these experiments provide information about a number of the factors important in any inves tiga tion into PIOs and other handling quali ties phenomena that dr'e very task dependent.
1. The additional time delays used in the experiments produced the desired PIO-proneness required for the evaluations.
2. The high-gain, precision tasks used in these experiments frequently produced PIO, as de&ired. The close-trail formation task was not as repeatable as other'tasks, and the pilots felt that the consistency of the evaluations for that task suffered,
5
3. Even with greatly degraded handling qualities and high-gain tasks, PIO did not always occur in the evaluations of the no-filter configurations. The "cliff" analogy of PIO is therefore appropriate; it is this "cliff" nature of the phenomenon that explains the apparent scatter of the ratings for some of the configurations. The occurrence of PIO is highly dependent on the task and, to some extent, pilot technique.
Acknowledgments
Air Development Squadron Five (VX-5), Naval weapons Center, China Lake, California, supported the probe-and-drogue refueling experiment by providing the tanker aircraft, an A-6E with a buddy store.
The USAF/Calspan NT-33 aircraft is operated by Calspan Corporation, Buffalo, New York, for the Flight Dynamics Laboratory, Air Force Wright Aeronautical Laboratory, Wright-Patterson Air Force Base, Ohio. The precision touch-and-go experiment was sponsored by NASA Ames Research Center's Dryden Flight Research Facility. Mr. Jack Barry of the Flight Dynamics Laboratory was the USAF program manager.
References
1Berry, D. T., "Flying Qualities: A Costly Lapse in Flight-Control Design?," Astronaut. & Aeronaut., vol. 20, no. 4, Apr. 1982.
2Berry, D. T., "Flying Quali ties Cri teria and Flight Control Design," AIM Paper 81-1823, Aug. 1981.
3Hodgkinson, J. and Snyder, R. C., "Flight Evaluation of Augmented Fighter Aircraft," ALAI'. Paper 80-1611, Aug. 1980.
4Berry, D. T., Powers, B. G., Szalai, K. J., and Wilson, R. J., "In-Flight Evaluation of Control system Pure 'l'ime Delays," J. Aircraft, vol. 19, no. 4, pp. 318-323, Apr. 1982.
5S mith, J. W. and Edwards, J. W., "Design of a Nonlinear Adaptive Filter for Suppression of Shuttle Pilot-Induced Oscillation Tendencies," NASA TM-81349, 1980.
6Powers, B. G., "Experience with an Adaptive Stick-Gain Algorithm to Reduce Pi.lot-InducedOscillation Tendencies," AIAA Paper 80-1571, Aug. 1980.
7Bailey, R. E. and Smith, R. E., "An In-Flight Investigation of Pilot-Induced Oscillation Suppression Filters During the Fighter Approach and Landing Task," NASA CR-163116, Mar. 1982.
8Shafer, M. F., "LOW-Order Equivalent Models of Highly Augmented Aircraft Determined from Flight Data," J. Guidance, Control, and Dynamics, vol. 5, no. S, Sept.-Oct. 1982, pp. 504-511.
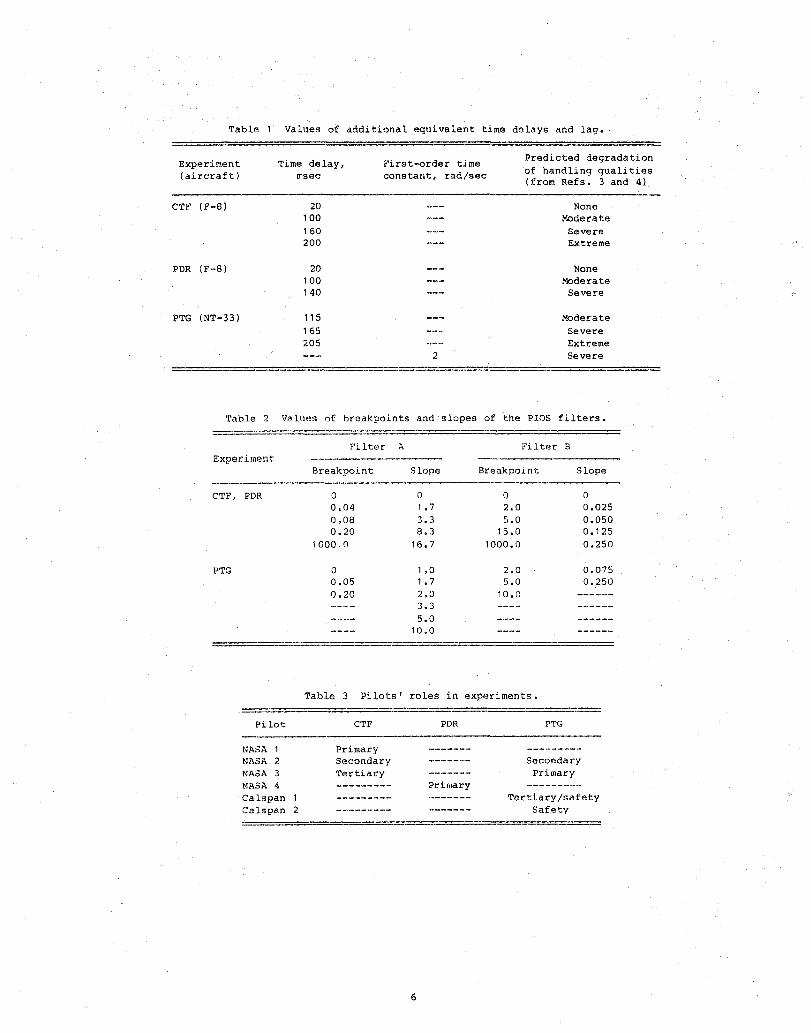
Table 1 Values of additional equivalent time delays and lag.
Experiment (aircraft)
Time delay, First-order time Predicted degradation
usec constant, rad/sec of handling qualities (from Refs. 3 and 4)
CTF (F-8) 20 None 100 Moderate 160 Severe 200 Extreme
PDR (F-8) 20 None 100 Moderate 140 Severe
PTG (NT-33) 115 Moderate 165 Severe 205 Extreme
2 Severe
Table 2 Values of breakpoints and slopes of the PIOS filters.
Fllter A Fi 1 ter B
Experiment Breakpoint Slope Breakpoint Slope
CTF, PDR 0 0 0 0 0.04 1.7 2.0 0.025 0,08 3.3 5.0 0.050 0.20 8.3 15.0 0.125
1000c() 16.7 1000.0 0.250
PTG 0 1.0 2.0 0.075 0.05 1.7 5.0 0.250 0.20 2.0 10.0
3.3 5.0
10.0
Table 3 Pilots' roles in experiments.
pilot CTF PDR PTG
NASA 1 Primary ------- ---------NASA 2 Secondary --.... ---- Secondary NASA 3 Tertiary ------- Primary NASA 4 --------- Primary ---------Calspan 1 --------- ... _----- Tertiary/safety Calspan 2 _ ........ _----- ------- Safety
6
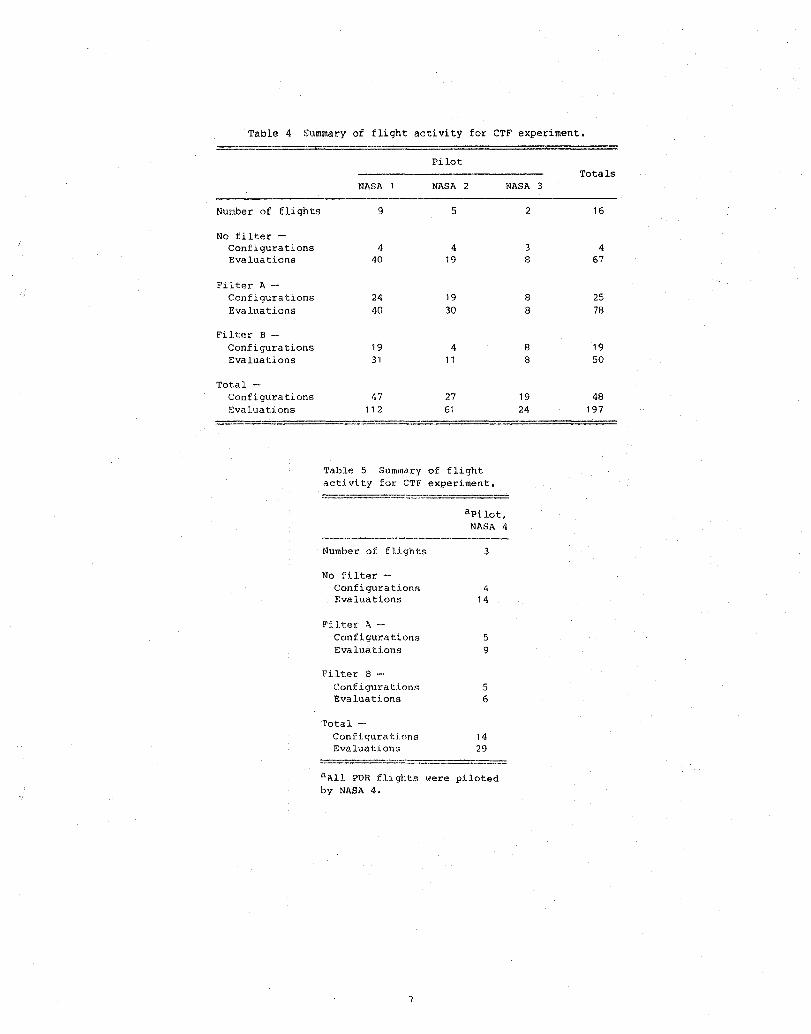
Table 4 Summary of flight activity for CTF experiment.
Number of flights
No filter Configurations Evaluations
Filter A -Configurations Evaluations
Filter B ._-
Configurations Evaluations
Total -Configura tions Evaluations
Pilot
NASA NASA 2 NASA
9 5
4 4 40 19
24 19
40 30
19 4 31 11
47 27 112 61
Table 5 Summary of flight activity for CTF experiment.
Number of flights
No filter Configura Hons Evaluations
}'"ilter 1\ -
Configurations Evaluations
Filter B -Configurations Evaluations
'fotal -Configura Hons Evaluations
apilot, NASA 4
3
4 14
5 9
5 6
14 29
aAll PDR flights were piloted by NASA 4.
.,
2
3 8
8 8
8 8
19 24
Totals 3
16
4 67
25 78
19 50
48 197
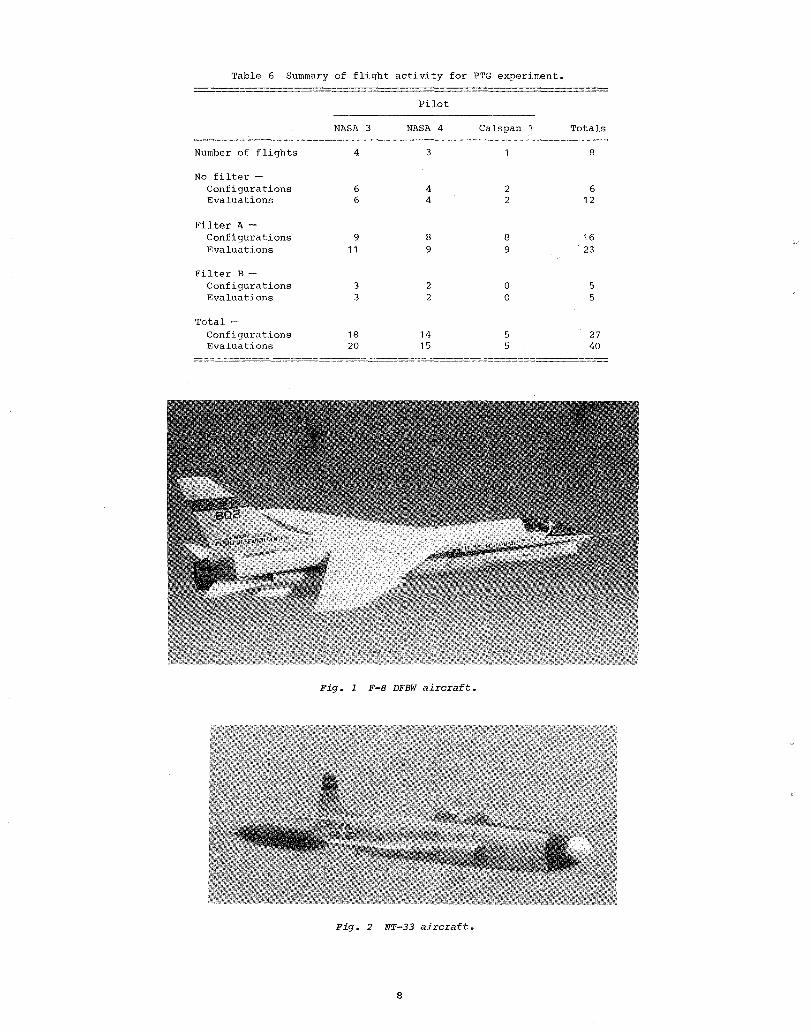
Table 6 Summary of flight activity for PTG experiment.
Pilot
NASA 3 NASA 4 Calspan Totals
Number of flights 4 3 8
No filter Configurations 6 4 2 6 Evaluations 6 4 2 12
Filter i\. -Configurations 9 8 8 16 Evaluations 11 9 9 23
Filter B -Configurations 3 2 0 5 Evaluations 3 2 0 5
Total -Configurations 18 14 5 27 Evaluations 20 15 5 40
Fig. 1 F-8 DFBW aircraft.
Fig. 2 NT-33 aircraft.
8
Pilot input
Fig. 3
Flight control system
Aircraft dynamics
Response feedback
General experiment implementation •
.--·----............ 1 Frequency ~ .-------.......... ·1 Stick-rate detector I Gain attenuation
schedule !
I ] Command_ L Stick shaping· ~ '--------.
(a) Filter )1.
Pilot input
Fig. 4 PIOS filters.
L.arge lateral offset i i (Approl(, 150 tt) .
Gain attenuation schedule !
Stick shaping I I
(b) Filter B.
Fig. 5 Evaluation task: runway 22 at: Edwards AFB.
9
I Command
I
/F.104 afterburner nozzle
~ Line of sight ....... ~ ............. /
,,~, F·8 canopy bow
Fig. 6 Relative positions of F-8 and F-I04 aircraft in the CTF task. (not to scale.)
Fig. 7 F-8 DFBW aircraft and A-6E tanker aircraft (with Drogue extended) in PDR task •
10
8
Cooper· 6 Harper rating 4
2
• Average Cooper· Harper rating I Range of ratings
Additional time delay, msec o 100 200
I I I !13
14+ ~predicted ratings 1-----./ (from Ref. 3)
o 100 200 300 Total system equivalent time delay, msec
Fig. 8 CTF experiment results for no filter. Numbers nest to symbols indicate number of evaluations.
10
" '~"-..".. [F.8 pilot ~~
~"~
o Average CooperHarper rating
I Range of ratings Solid symbol Indicates
ED no-filter configuration
Slope:::: 1.7 10
8
Cooper· 6 Harper rating 4
2
Slope = 3.3 10
8 -
Cooper· 6 Ha~r rating 4 04
2
Slope = 8.3 10
8
Harper Cooper· 6 f rating 4 . 5
2
Slope= 16.7 10
8
Cooper. 6 Harper raling 4
2
5
03
.1
02
.J
o .04 .08 .20 No filter
Breakpoint
(a) Cooper-Harper ratings as a function of breakpoint, with additional time delay ot 100 msec.
Cooper· Harper rating
Cooper· Harper rating
2
4
2
o Average Cooper· Harper rating
I Range of ratings Solid symbol Indicates
• no-filter configuration
04
03
18
6
0 BreakPfO'::-OOOO
Cooper· Harper rating 4
5
2
2
No 1.7 3.3 8.3 filter
Slope
20
16.7
(b) Cooper-Harper ratings as a function of slope, with additional time delay of 100 msec.
Fig. 9 CXF experiment results for filter A.
11
10
8
Cooper· 6 Harper rating 4
2
10
8
Cooper· 6 Harper rating 4
2
o Average Cooper· Harper rating
I Range of ratings Solid symbol indicates
• no-filter configuration
Slope = 8.3
f' f'
Slope = 16.7
03 '1 0 .04 .08 .20
Breakpoint
13t
131
No IIIter
o Average Cooper. Harper rating
I Range of ratings Solid symbol indicates
• no-filter configuration
Breakpoint = 0.0
1: t 13
Cooper· 6 Harper rating 4
2
Breakpoint = 0.04
1: 113
Cooper- 6 Harper rating 4
2
No 1.7 3.3 filter
Slope
8.3 16.7
(c) Cooper Harper ratings as a function (d) Cooper-Harper ratings as a function of slope, with additional time delay of 160 msec.
of breakpoint, with additional time delay of 160 msec.
Pig. 9 concluded.
12
o Average Cooper· Harper rating
I Range of ratings Solid symbol indicates
• no-filter configuration
Slope = 0.025 10
8
Cooper· S 92 Harper rating 4
2
Slope = 0.50 10
t· 8
Cool:ler· 6 Harper 96 flltlng 4 05
2
Slope'" 0.125 10
8
~, Cc)()per· 6 t, Harper rating 4
2
15
Breakpoint
~f
~t
~f -1 No
filter
Cooper-Harper rating
Cooper-Harper rating
Cooper· Harper rating
o Average Cooper· Harper rating
I Range of ratings Solid symbol indicates
• no·fllter configuration
10 """T = 0.0
8 20
6
4 05
2
Breakpoint = 2.0 10
f~ 8
~, S
96 4
2
2
No .025 .050 .125 .250 filter
Slope
(a) Cooper-Harper ratings as a function (b) Cooper-Harper ratings as a function of slope, with additional time delay of 100 msec.
of breakpoint, with delay of 100 msec.
additional time
10
8
Cooper· S Harper Rating 4
2
o Average Cooper· Harper rating
I Range of ratings Solid symbol indicates
• no-filter configuration
Slope = 0.125
92
~,
5 15
Breakpoint
No filter
(c) Cooper-Harper ratings as a function of breakpoint, with additional time delay of 160 msec; Slope = 0.125.
Fig. 10 CTF experiment results for filter B.
13
o Average Cooper· Harper rating
I Range of ratings Solid symbol Indicates
.. no-filter configuration
Breakpoint = 2.0 10 t13
8
f' Cooper· 6 Harper rating 4
2
Breakpoint = 5.0 10 t13 ~2 t, ¢2 8
Cooper· 6 Harper rating 4
2 No .025 .050 .125 .250
filter Slope
(d) Cooper-Harper ratings as a function of slope, with additional time delay of 160 msec.
Cooper· Harper rating
Fig. 10 concluded.
o Average Cooper· Harper rating
I Range of ratings Solid symbol Indicates
e no-filter configuration
Slope = 8.3 10
8
6
4 02
2
o .04 .08 .20 No filter
Breakpoint
Fig. 12 PDR experiment results for f,ilter A, with additional time delay of 140 msec. Numbers next to symbols indi-' cate number of evaluations; slope = 8.3.
14
10
8
Cooper· 6 Harper rating 4
2
0
o Average Cooper· Harper ratings I Ranoe of ratings
Additional time delay, msec o 100 200
I I I
6
""-predicted ratings (from Ref. 3)
200 300 Total system equivalent time delay, msec
Fig. 11 FDR experiment results for no filter. Numbers next to symbols indicate number of evaluations.
10
8
Cooper· 6 Harper rating 4
2
0
e Average Cooper· Harper rating
I Range of ratings
Additional equivalent time delay, msec
o 100 200
I I I
100
2
,2 ~Predlcted ratings
(from Ref. 3)
200 300 Total system equivalent delay, msec
Fig. 13 PTG experiment results for no filter. Numbers next to symbols indicate number of evaluations.
CooperHarper fating
o Average CooperHarper rating
1 Range of ratings Solid symbol Indicates
fi no-filter configuration
Breakpoint = 0.0 10
8
6
'I
2
112
~~--~.~--~~ No 1.0 1.7 2.0 3.3 5.0 10.0
filter Slope
(a) Cooper-Harper ratings plotted against slope, additional equivalent time delay of 165 msec.
Cooper· Harper rating
o Average Cooper· Harper ratings
I Range of fatings ~ Solid symbol indicates
no·lilter configuration
Breakpoint::::: 0.0 10 -
8 -- +3 S
'I
2
No 1.0 1.7 2.0 3.3 5.0 10.0 filter
Slope
(b) Cooper-Harper ratings plotted against breakpoint, additional firstorder lag.
Fig. 14. PTG experiment results for iLIter A.
15
1. Report No. 2. Government Accession No. 3. Recipient's Catalog No. NASA TM-86028
4. Title and Subtitle 5. Report Date
Flight Test Experience With Pilot-Induced-Oscillation January 1984
Suppression Filters 6. Performing Organization Code
7. Author(,) 8. Performing Organization Report No. Mary F. Shafer, Rogers E. Smith, James F. stewart, H-1216 and R.andall E. Bailey
10. Work Unit No. 9. Performing Organization Name and Address
NASA Ames Research Center Dryden Flight Research Facility 11. Contract or Grant No.
P.O. Box 273 Edwax'ds, California 93523
13. Type of Report and Period Covered 12. Sponsoring Agency Name and Address Technical Memorandum
National Aeronautics and Space Administration 14. Sponsoring Agency Code
Washi.ngton, D.C. 20546 RTOP 505-43-11
15. Supplementary Notes
This report is a slightly revised version of AIM Paper 83-2107, presented at the AIM Atmospheric Flight Mechanics Conference, Gatlinburg, Tennessee, August 15-17, 1983.
16. Abstract
Digital flight control systems are popular for their flexibility, reli-ability, and power; however, their use sometimes results in deficient handling qualities, including pilot-induced oscillation (PIO), which can require exten-sive redesign of the control system. When redesign is not immediately possible, temporary solutions, such as the PIO sur?ression (PIOS) filter developed for the space shuttle, have been proposed. To determine the effectiveness of such PIOS filters on more conventional, high-performance aircraft, three experiments were performed using the NASA F-8 digital fly-by-wire and USAF/Calspan NT-33 variable-stability aircraft. Two types of PIOS filters were evaluated, using high-gain, precision tasks (close formation, probe-and-drogue refueling, and precision touch-and-go landing) with a time delay or a first-order lag added to make the aircraft prone to PIO. Various configurations of the PI OS filter were evaluated in the flight programs, and most of the PIOS filter configura-tions reduced the occurrence of PIOs and improved the handling qualities of the PIo-prone aircraft. These experiments also confirmed the influence of high-gain tasks and excessive control system time delay in evoking pilot-induced osci llations.
17. Key Words ISuggested by Authorls)) 18. C:, istribution Statement
pi 101:-induced osci llation Unclassified-Unlimited Flight test Handling qualities Flight control systems STAR category 08 Nonlinear filters
r--" 19. Security Classif. lof this report) 20. Security Classl!. lof this page) 21. No. of Pages 22. Price
Uncl,!ssified Unclassified 16 AD2 _. "For sale by the National Technical Information Service, Springfield, Virginia 22161.

End of Document
Related Documents