Fleas, Hosts and Habitat: What can we predict about the spread of vector-borne zoonotic diseases? Ph.D. Dissertation 2010 Megan M. Friggens School of Forestry

Welcome message from author
This document is posted to help you gain knowledge. Please leave a comment to let me know what you think about it! Share it to your friends and learn new things together.
Transcript
Fleas, Hosts and Habitat: What can we predict about the spread of vector-borne zoonotic diseases?
Ph.D. Dissertation
2010
Megan M. Friggens School of Forestry
I I I \, l "
FLEAS, HOSTS AND HABITAT: WHAT CAN WE PREDICT ABOUT THE SPREAD
OF VECTOR-BORNE ZOONOTIC DISEASES?
by Megan M. Friggens
A Dissertation
Submitted in Partial Fulfillment
of the Requirements for the Degree of
Doctor of Philosophy
in Forest Science
Northern Arizona University
May 2010
?Jii@~-~-u-_-Robert R. Parmenter, Ph. D.
~",l(*~ l.~Paulette L. Ford, Ph. D.
--=z:r-J'l1jU~David M. Wagner, Ph. D.
ii
ABSTRACT
FLEAS, HOSTS AND HABITAT: WHAT CAN WE PREDICT ABOUT THE SPREAD
OF VECTOR-BORNE ZOONOTIC DISEASES?
MEGAN M. FRIGGENS
Vector-borne diseases of humans and wildlife are experiencing resurgence across the
globe. I examine the dynamics of flea borne diseases through a comparative analysis of
flea literature and analyses of field data collected from three sites in New Mexico: The
Sevilleta National Wildlife Refuge, the Sandia Mountains and the Valles Caldera
National Preserve (VCNP). My objectives were to use these analyses to better predict and
manage for the spread of diseases such as plague (Yersinia pestis).
To assess the impact of anthropogenic disturbance on flea communities, I compiled and
analyzed data from 63 published empirical studies. Anthropogenic disturbance is
associated with conditions conducive to increased transmission of flea-borne diseases.
Most measures of flea infestation increased with increasing disturbance or peaked at
intermediate levels of disturbance. Future trends of habitat and climate change will
probably favor the spread of flea-borne disease.
Rodents, including Gunnison’s prairie dogs (Cynomys gunnisoni), were trapped for three
years (2004-2006). Blood and flea samples were tested for the presence of plague and
another bacterial pathogen, Bartonella. I conduct two analyses with this data. The first
examines prairie dogs and their flea communities in the VCNP. Prairie dogs experienced
a plague epizootic in fall 2004, after which we found plague positive fleas and positive
antibody titers in three prairie dogs. We noted an increased tendency for flea exchange
opportunities in the spring before flea abundance peaked. Spring conditions, which favor
presence and exchange of certain flea species, may be just as important for determining
plague outbreaks as the summer conditions, which lead to build up in flea populations.
iii
In the second analyses, I found 38% of the rodents of 30 species and 60% of fleas of 24
species positive for Bartonella. Bartonella infections typically lasted two months and the
prevalence of Bartonella. Changes in prevalence related to host density and
environmental gradients, point to the importance of both fleas and rodents in Bartonella
transmission cycles.
This research shows environment influences the risk of flea-borne disease spread. It is
likely that future trends of habitat and climate change will favor the spread of flea-borne
diseases, including plague and Bartonella.
iv
ACKNOWLEDGEMENTS I thank my committee members, Drs. Paul Beier, Robert Parmenter, Paulette Ford, and David Wagner. Throughout my degree, my committee provided invaluable support and encouragement. Bob provided me with the opportunity to participate in his EID project as a research assistant and allowed me to use the data collected from this project for my own analyses. Paulette has been a huge influence in both my personal and professional life and her support allowed me to hire technicians and conduct my own work that formed an entire chapter (3) of this dissertation. She also supported my travel to scientific meetings and much of my writing time. Dave Wagner provided much needed advice regarding sampling logistics and laboratory procedures early on in the project and organized the efforts to allow me to use the Keim lab for much of the flea analyses conducted during this project. I am especially grateful for my committee chair, Paul Beier, who allowed me a great deal of freedom in the selection and pursuit of my research topic. He has been a wonderful mentor and example during this project and remains an invaluable source of wisdom and advice.
A number of people participated in the field and laboratory components of this project: Elizabeth Racz, Dr. Gabor Racz, Jessica Jakubinas, and Scott Knapp were present at the end of this project and contributed considerable effort towards getting the final dataset cleaned up and in order. In addition, E. and G. Racz and J. Jakubinas assisted with the Bartonella laboratory analyses. I also thank the numerous other EID/Hanta Field Crew members who helped collect field data. In particular, Brian Frank played a large role during the initial phase of this project. My own technicians, Ana Oyer, Mary Brandenburg, Levi Parks, Alexei Wajchman, Lief Emkeit and Sara Noel Parker all need to be recognized for their efforts and contributions towards the prairie dog work and for being very good sports during some hot and windy field days. Dr. Ken Gage, John Montieneri, Dr. Michael Kosoy, Kelly Sheff, and Dr. Ying Bai, all from the CDC in Ft Collins, provided training and advice and were incredibly good hosts during my many visits to their facility. Kelly Sheff in particular spent a good deal of time training and assisting me with the laboratory work. Christina Morway of the CDC helped me process some of my serology samples. Rebecca Wiesen of the CDC led me to the Navy Literature source for articles on vectors, which I used extensively for the first chapter of this dissertation. Dr. Donald Duszynski was a huge help by allowing me to use his lab in the UNM Biology Department for 2+ years and Drs. Coen Adema and Sara Brandt as well as other members of the Loker lab were very helpful during many of the laboratory phases of this research. Likewise, Dr. Terry Yates (and later Dr. Joseph Cook) and his lab within the UNM Biology Department, in particular Dr. Jerry Dragoo, allowed me to use their lab space and equipment during the latter half of this project. Mike Boyden processed the great majority of serology samples. Cheryl Parmenter of the UNM MSB Genomics Resources Division allowed me to use her freezers, helped with shipping samples, and kept everything in excellent order. George Rosenburg and Jennifer Hathaway of UNM’s Molecular facility were very helpful and allowed me to use their freezers, access to their equipment and even provided technical support with both DNA clean up and sequence reaction protocols. Chris Allender spent time introducing me to the Keim lab and provided training for the flea extraction procedures. Paul Keim allowed me to use his genetics lab at NAU for most of my flea extraction work. Dr. Sandy Brantly of UNM MSB Arthropod division has been very helpful throughout this process by
v
allowing me to camp out in the Arthropod Museum and providing company on many a long day of flea identifications.
April Sandoval of the NAU School of Forestry was incredibly helpful and on more than one occasion provided critical support by rounding up signature from various professors and department heads and mailing my documents around campus. The staff at the RMRS lab in Flagstaff graciously allowed me to conduct my committee meetings and defense using their facilities and provided support.
My family has also extended an incredible amount of support and patience during this time. Most especially I thank my husband, Mike, who has never faltered in his support of me as I pursued this PhD. He helped me in the field when I needed assistance, graciously dealt with my periodic absences, stay mostly awake during my numerous practice presentations, helped me navigate Arc Map and SAS and let me borrow his computer at various points in this project. During this time, he has also given me two most precious gifts, our children Abigail Kalika Friggens and Jake Thomas Friggens, and demonstrated an amazing capacity to do a variety of odd jobs in the yard, house and garage with one hand on the task and the other holding a child. I also thank my Stepmother, Sara, who has always been a source of bright optimism during the many phases of this degree and has carried the memory of my father so well. Though my father did not survive to see this project finished, his encouragement and approval were motivating influences. I am also grateful to my in-laws Aunt Mymm, Robert and Patricia Friggens who have been so supportive of this pursuit and never let on that they might have found my occupation rather odd. My brother Merle, Mo, Pleasant and all the other members of my family have graciously and patiently ignored my absence from many family events and provided many supportive words these last few years. Finally, I wish to mention my dear friend Denise Clement who has always been there when I needed her.
I thank many institutions that hosted parts of this research: Northern Arizona University and, in particular, the Wildlife Lab in the School of Forestry and Paul Keim’s Genetics Lab in the Department of Biology; The University of New Mexico and, in particular, the labs of Drs. Loker and Cook, the Museum of Southwestern Biology (Genomics Resources and Arthropod divisions), and the Biology Department’s Molecular Facility; The Sevilleta LTER; The Valles Caldera National Preserve; The Center for Disease Control, Ft. Collins; and, the RMRS, Albuquerque .
This dissertation was funded through a variety of sources. The NSF/NIH EID Grant # 0326757, paid my salary, all the laboratory work, and the great majority of fieldwork. The RMRS (Paulette Ford) funded prairie dog technicians, fieldwork, travel and writing time. Finally, two Sevilleta LTER Summer graduate stipends contributed to field housing and travel as well as supplies.
I am also grateful for the interlibrary loan program that fulfilled a large number of strange requests in a very timely manner. Finally, it simply would not have been possible for me to pursue the invaluable but low paying research experience jobs so critical to my successful entry to graduate college and later to my professional development without the assistance provided by the Federal Student Loan Program. I hope that my professional pursuits will demonstrate the value and importance of programs such as these that provide the opportunity for anyone of any background to pursue an advanced education.

vi
Table of Contents LIST OF TABLES .......................................................................................................................... vii LIST OF FIGURES ....................................................................................................................... viii CHAPTER 1: INTRODUCTION .......................................................................................................12 Literature Cited ..................................................................................................................................... 22 CHAPTER 2: ANTHROPOGENIC DISTURBANCE AND THE TRANSMISSION OF FLEA-BORNE DISEASES .......................................................................................................................................27 Abstract................................................................................................................................................. 29 Introduction .......................................................................................................................................... 30 Materials and Methods ......................................................................................................................... 32 Results .................................................................................................................................................. 38 Discussion............................................................................................................................................. 40 Acknowledgements .............................................................................................................................. 46 References ............................................................................................................................................ 47 CHAPTER 3: FLEA ABUNDANCE, DIVERSITY, AND PLAGUE IN GUNNISON'S PRAIRIE DOGS (CYNOMYS GUNNISONI) AND THEIR BURROWS IN MONTANE GRASSLANDS IN NORTHERN NEW MEXICO. ..............................................................................................................................58 Abstract................................................................................................................................................. 60 Introduction .......................................................................................................................................... 62 Materials and Methods ......................................................................................................................... 64 Results .................................................................................................................................................. 69 Discussion............................................................................................................................................. 72 Acknowledgments ................................................................................................................................ 77 Literature Cited ..................................................................................................................................... 79 CHAPTER 4: FLEA-BORNE TRANSMISSION OF BARTONELLA IN THREE RODENT AND FLEA COMMUNITIES IN NEW MEXICO .................................................................................................87 Abstract................................................................................................................................................. 89 Introduction .......................................................................................................................................... 90 Materials and Methods ......................................................................................................................... 91 Results ................................................................................................................................................ 102 Discussion........................................................................................................................................... 106 Acknowledgments .............................................................................................................................. 113 References .......................................................................................................................................... 115 CHAPTER 5: DISCUSSION AND CONCLUSIONS .........................................................................127 Literature Cited ................................................................................................................................... 132 LIST OF APPENDICES .................................................................................................................134

vii
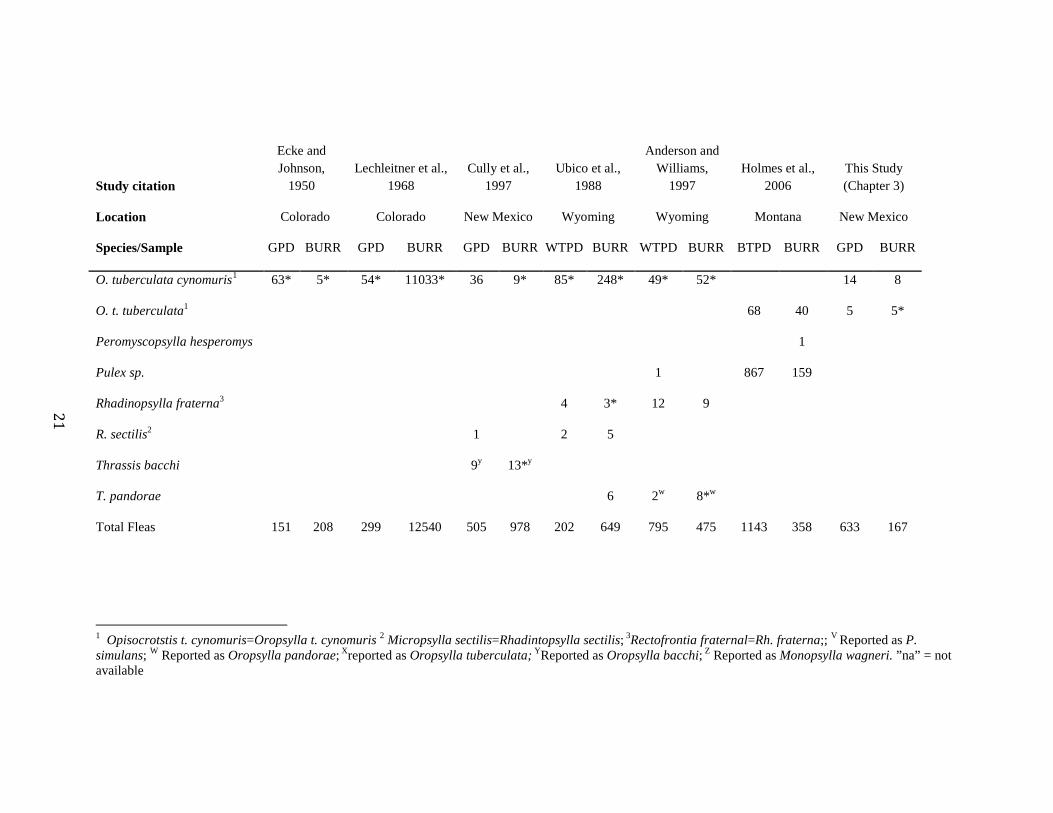
LIST OF TABLES Table 1. Studies which report fleas collected from both animals and burrows on Gunnison’s (GPD), White- (WTPD), and Black-tailed prairie dogs (BTPD) colonies. ................................... 20
Table 2.1. Continental distribution and biome classification of sites used in comparative analysis of anthropogenic disturbance and flea vector assemblage characteristics ..................................... 53
Table 2.2 A-C. Significant (P≤0.05) effects (X) for mixed model analysis of disturbance level (Low, Intermediate and High disturbance) and Biome (Forest, Desert, Grassland/ Savanna and Mediterranean) on mammal and flea communities surveyed in 63 studies. D. Significant difference across disturbance classes within Forest biomes. E-F. Significant differences among Biomes within each level of disturbance class. .............................................................................. 54
Table 3.1. Flea species and number collected from Gunnison's prairie dog burrows, prairie dogs (GPD), Cynomys gunnisoni, and golden mantled ground squirrels (GMGS), Spermophilus lateralis, caught in the Valles Caldera National Preserve in northern New Mexico, 2004-2006. . 83
Table 4.1. Prevalence of Bartonella spp in rodents and their fleas collected from 3 sites in New Mexico. Though Bartonella was found in 30 rodent species only those with more than 10 captures are listed here. ................................................................................................................ 119
Table 4.2. List of Bartonella positive fleas collected from rodents captured at three sites in New Mexico ......................................................................................................................................... 121

viii
LIST OF FIGURES Figure 2.1. Pearson correlation analysis for variables calculated from 63 studies conducted around the world. Scatter plots with loess (locally weighted scatterplot smoothing) lines are displayed above the diagonal and r values for significant associations (values in bold represent P<0.0001, otherwise 0.0009<P<0.03) are displayed below the diagonal. Stars indicate significant associations after variables were standardized for sampling effort and log transformed, but the plots reflect raw data. Descriptions of variables can be found in the text...................................... 55
Figure 2.2. Mean values for small mammal and flea variables from 63 studies categorized into three anthropogenic disturbance classes (low, intermediate, high) and four biomes (Forest , Grassland/Savanna ∙∙, Desert ∙∙∙∙∙∙, Mediterranean ─ ─ ─ ). P-values are for F-tests from Generalized Linear Model analysis of the overall model (y is a function of Disturbance class and Biome) and analyses of disturbance class within each Biome. Vertices without a common letter indicate statistically significant difference (P≤0.05 using Tukey-Kramer multiple comparison methods) among disturbance levels of that biome. Significant differences among biomes within a disturbance class are noted with circle symbols (significant differences are indicated by different fill shades). ..................................................................................................................................... 56
Figure 2.3. Mean values for flea measures in small mammal communities from 63 studies categorized into three anthropogenic disturbance classes (low, intermediate, high) and four biomes (Forest , Grassland/Savanna ∙∙, Desert ∙∙∙∙∙, Mediterranean ─ ─ ─ ). P-values are for F-tests from Generalized Linear Model analysis of the overall model (y is a function of Disturbance class and Biome) and analyses of disturbance class within each Biome. Vertices without a common letter indicate statistically significant difference (P≤0.05 using Tukey-Kramer multiple comparison methods) among disturbance levels of that biome. Significant differences among biomes within a disturbance class are noted with circle symbols (significant differences are indicated by different fill shades. ............................................................................................. 57
Figure 3.1. Location of three study sites in the Valles Caldera National Preserve in northern New Mexico. Outlines indicate perimeter of colony area that was the focus of trapping efforts and burrow sweeps from May 2004 until September 2006. One colony, El Cajete, contained areas where prairie dog burrows were blocked at the time of study (hatched polygons). ...................... 84
Figure 3.2. A) Mean abundance (Number of fleas/Host Individual ± SE) of fleas collected from prairie dogs captured from two colonies in the Valles Caldera National Preserve during six collection periods from 2004-2006. B) Mean abundance (Number of fleas/Host Individual ± SE) of fleas collected from prairie dog burrows sampled from three colonies in the Valles Caldera National Preserve during six collection periods from 2004-2006. Letters signify significant differences (p<0.05) among sampling periods for each site, where those points which share a letter are not different across sampling periods. ............................................................................ 85
Figure 3.3. A) Prevalence (Number of infested individuals/Total individuals collected) of fleas collected from prairie dogs captured from two colonies in the Valles Caldera National Preserve

ix
during six collection periods from 2004-2006. B) Prevalence (Number of infested burrow sweeps/Total sweeps) of fleas collected from prairie dog burrows sampled from three colonies in the Valles Caldera National Preserve during six collection periods from 2004-2006. Letters signify significant differences (p<0.05) among sampling periods for each site, where those points which share a letter are not different across sampling periods. ..................................................... 86
Figure 4.1. Number of recaptured animals that were Bartonella positive, negative, or with a loss or gain of infection. Left hand figures represent the infection status of animals caught for 2, 3 and 4 sequential months and right hand figures represent the infection status of animals caught every other month over 3, 4 and 5 month periods. ................................................................................ 123
Figure 4.2. Density of rodents and prevalence of Bartonella caught on webs trapped twice each year from May 2004 through May 2007 at three sites in New Mexico. Figures display results of a generalized linear model analysis of density-prevalence-trapping period relationships. Placitas had significant season and density effects. Trapping period*Density was significant for Sevilleta rodents. Prevalence of Bartonella in Valles Caldera was influenced Density, Elevation Density*Elevation and Density*sampling period effects. Not all sites were trapped at all time periods and is reflected in these figures. Bars represent standard deviation. ............................... 125
Figure 4.3. Seasonal patterns of rodent capture (standardized to animals/100 trap nights), and Bartonella prevalence in rodent blood and flea samples. Months were divided into seasons according to their climatic similarities, where winter is December, January, February (three coldest months), Spring is March, April, and May, Summer is June, July, and August, and Fall is September, October and November. ............................................................................................ 125
Figure 4.4. Monthly prevalence of Bartonella in rodents and their fleas capture from 2 sites. Perognathus flavus and Peromyscus leucopus were capture at both sites, whereas P. truei and P. boylii were not. ............................................................................................................................ 126

x
DEDICATION
To the memory my Grandmother, Beverly Watson FitzPatrick (aka Alex Sienna), a headstrong, free thinking, and independent woman. I am lucky to have had her influence
in my life.

xi
PREFACE- This dissertation is comprised of three articles submitted to peer-reviewed
journals for publication. Each article represents the culmination of one aspect of my
dissertation research and is meant to substitute for chapters that might appear in a more
traditional dissertation. This alternative format has the following conventions. First, the
format of each article varies according the specific journal to which it was submitted.
Second, there are some points of redundancy. In particular, the field methods are repeated
in chapters 2 and 3 as is some of the introductory material used for all three articles. For
this reason, and in order to minimize further redundancy, I have not included a separate
methods chapter. A complete review of the study design and laboratory work is presented
in Chapter 4 and detailed description of the prairie dog survey is presented in Chapter 3.
Chapter 2 contains a comprehensive description of the methods used for my comparative
analysis of flea communities. Third, the introduction and discussion review the major
points relevant to these chapters and are designed to provide the setting for and bring
together the major point of each individual chapter. A comprehensive review of the
relevant literature is contained within the body of each chapter. Finally, the articles
contained within this dissertation are the culmination of work and ideas from many
collaborators. Though I am responsible for the conception and analysis of these
manuscripts, each manuscript has or will have coauthors and, as such, I use words “we”
rather than “I” where the overall product has resulted from contributions made by
multiple individuals.
12
CHAPTER 1: INTRODUCTION Humans have the single greatest impact of any species on the world. Among
the most critical consequences of our large-scale modification of natural systems are
the effects on biological systems and, in particular, diseases (Daszak et al. 2001; Patz
et al. 2000; Wilcox and Gubler 2005). Pathogens both zoonotic and anthropogenically
derived are emerging and reemerging due to an increasingly interconnected world,
changes in habitat, and human encroachment into the remaining few wild areas
(Wilcox and Colwell, 2005). These factors have to lead to increase in the
transmission rates and incidence of diseases that are detrimental to both humans and
wildlife. Wildlife already under pressure from direct habitat loss and degradation are
threatened by increases in the incidence and severity of disease because of the
indirect effects of these changes on host-pathogen interactions (Crowl et al. 2008;
Daszak et al. 2001; Deem et al. 2001). Of particular concern for both human and
wildlife health, is the collective effect of anthropogenic disturbance on vector borne
diseases (Koontz and Daszak 2005). Vectors have free-living life stages and, thus, are
influenced by anthropogenic changes in both environmental and host habitats.
Human activities, such as agricultural or forestry practices that change site
microclimate (relative humidity, soil temperature), and anthropogenic changes in
seasonal temperature and precipitation regimes directly affect vector survivorship,
development and feeding rates (Harvell et al. 2002; Patz et al. 2000; Daszak et al.
2001; Keesing et al. 2006). Anthropogenic disturbances also have the potential to
change the availability, density and susceptibility of hosts to pathogens and vectors,

13
and thus indirectly influence the spread and persistence of disease within an
ecosystem (Patz et al. 2000; Daszak et al. 2001; Keesing et al. 2006). Human
disturbance processes have led to the recent range expansions of many vector-borne
pathogens including Lyme disease, malaria, dengue fever, tick-borne encephalitis,
yellow fever, West Nile fever and plague (Harvell et al. 2002).
Plague, caused by the bacteria Yersinia pestis, is a good example of a zoonotic
disease that has continues to perpetuate and spread to new populations due to human
activity. Yersinia pestis has a long and dramatic history in human populations
beginning at least as early as 542 A. D. where it is suspected to have caused the
Justinian plague, which lasted 60 years and left 100 million dead (Poland et al.,
1994). However, this pathogen is probably most famous for its role in the Black
Death in Medieval Europe that killed nearly a quarter of the population. We have just
emerged from a third pandemic that began in the late 1880’s and continued well into
the 1990’s. This pandemic originated in China and quickly reached Hong Kong,
where it was disseminated around the world on rat-infested ships. It was during this
time that plague was introduced to the U.S. Though it appears to have made contact at
several ports in the U. S., the fateful arrival of the Nippon Maru to San Francisco in
1899 resulted in the establishment of plague in native California ground squirrel
populations (Link, 1955; Adjemian et al., 2007). From that point, Yersinia pestis
made its way east eventually reaching as far as Texas by 1950. Today, plague is well
established in wild rodents throughout the western half of the U.S.
Prairie dogs (Cynomys spp.) have been particularly hard hit by the
introduction of plague (Gage and Kosoy, 2005; Cully and Williams, 2001). Prairie

14
dogs are important members of grassland systems and are considered a keystone
species of North American grasslands because they modify the landscape in such a
way that benefits other species (Kotliar et al., 1999). Hunting, eradication programs,
habitat loss due to agriculture, and the introduction of plague have reduced prairie
dogs species to less than 2% of their historic range (Millar et al., 1994). Prairie dogs
are extremely susceptible to plague because they have no innate immunity and live in
large colonies with elaborate burrow systems that favor reproduction and survival of
the flea vector (Cully and Williams, 2001; Gage and Kosoy, 2005). Plague causes
mortality rates in excess of 95% in exposed prairie dog colonies (Cully and Williams,
2001). A number of studies have identified prairie dogs themselves and their fleas as
short term reservoirs of plague (Girard and Wagner et al., 2004; Webb et al., 2006;
Wilder et al., 2008), but far less is known about how plague is maintained within the
environment over the long term. Whereas, many of the threats facing prairie dogs can
be managed, plague remains one of the single greatest threats to the survival of the
prairie dog.
Plague requires two things in order to perpetuate: 1) Susceptible animals that
become bacteriaemic and succumb to infection thereby becoming a source of
infection to flea vectors, and 2) A flea vector that is itself susceptible to infection
(Christie, 1982; Gage and Kosoy, 2005). The sylvatic lifecycle of plague in the U.S.
is divided into two parts: the first involves an enzootic or maintenance host and the
second an epizootic or amplification host (Poland et al., 1994; Gage and Kosoy,
1995). The enzootic host is typically described as having a high reproductive rate and
variable response to plague. Enzootic species are able to persist as a viable host for

15
plague by replacing or minimizing its losses due to the disease. In contrast, the
epizootic host is quite susceptible to plague and experiences high mortality and
widespread outbreaks when exposed to Y. pestis. Outbreaks in epizootic hosts can
amplify the presence of plague in an environment because the dying animals leave
behind a large number of infectious fleas and are a source of infection themselves.
However, these outbreaks are short-lived and, because of the widespread mortality
typical of epizootics, are not a viable means for the long-term maintenance of plague
within the environment. Prairie dogs are a classic example of an epizootic host and
several rodent species associated with prairie dogs have been implicated as enzootic
hosts, including grasshopper mice (Onychomys spp.) on black-tailed prairie dog
towns (C. ludovicianus) and Peromyscus spp. in white-tailed (C. leucurus) and
Gunnison’s prairie dog towns (C. gunnisoni) (Gage et al., 1995; Thiagarajan et al.,
2008). Fleas are also critical to the perpetuation of plague in the environment. Though
plague can be transmitted directly between individuals, this manifestation, know as
pneumonic plague, is highly virulent and kills the infected host in 1-3 days (Poland et
al., 1994). Thus, directly transmitted plague is short lived and self-limiting, whereas
the flea transmitted form, bubonic plague, is less pathogenic and moves more slowly
within and between individuals. Over 150 flea species are known to transmit plague
though they vary considerably in the efficiency in which they do this (Gratz, 1999).
Some fleas may act as short-term reservoirs of plague and in one instance Y. pestis
was found in a flea from a prairie dog burrow nearly one year after a prairie dog
epizootic that eliminated the entire colony (Lechleitner et al., 1968). Despite a
number of studies and observations regarding plague outbreaks in prairie dog towns

16
(Table 1), we have yet to identify the specific rodent and flea species responsible for
maintaining plague in the habitats of the Southwestern U.S. nor do we know how
plague is introduced into prairie dog colonies.
Fleas are ubiquitous parasites of small mammals and are vectors for a number
of diseases that affect humans including plague (Yersinia pestis) and the Rickettsia
organisms that cause murine typhus and Rocky Mountain fever (Gage, 1995). The
presence and abundance of fleas is linked to the likelihood and spread of flea-borne
disease like plague and are closely tied to the presence and abundance of their hosts
(Lorange, 2005; Eisen et al. 2006; Krasnov et al. 2006a). In general, plague is more
likely to spread in a population where flea species are highly susceptible to Y. pestis
and have low host specificity (Gage and Kosoy, 2005). However, low efficiency
vectors that exhibit some resistance to plague may actually be quite important to
spread of the disease if they are common in the environment (Kartman et al., 1962;
Lechleitner et al., 1968, Eisen et al., 2006). Indeed flea abundance is positively
related to flea species vector potential for plague (Krasnov et al., 2006) and
abundance and prevalence of flea species is an important determinant of Y. pestis
transmission in particular (Eisen et al., 2006; Lorange, 2005). In addition, infection
by Y. pestis may break down flea host specificity such that an infected flea is more
likely to attempt to feed and thereby infect a greater number of host species than an
uninfected flea. Thus, flea-borne disease spread is a function of the characteristics of
the flea communities and these characteristics, in turn, are influenced by host
availability and microclimate preferences.

17
The objectives of this dissertation project were to explore the mechanisms that
influence the spread of vector borne diseases and apply this knowledge to plague
cycles in the Western U.S. particularly with respect to prairie dogs. To do this,
rodents including Gunnison’s prairie dogs (Cynomys gunnisoni) were surveyed in
three locations in New Mexico over the course of 3 years. During these surveys, we
collected blood and fleas and tested these samples for the presence of two bacterial
pathogens, Yersinia pestis and Bartonella. Plague is difficult to detect outside of
prairie dog epizootics, which limits our knowledge of the pathogen-vector-host
system. Therefore, in this dissertation, I focus on the underlying dynamics of flea
borne diseases with three distinct analyses. The first chapter presents a comparative
analysis of fleas and flea communities surveyed from around the globe and asks how
anthropogenic habitat disturbance affects the likelihood of disease exchange by fleas.
Plague is globally distributed and maintained in a variety of host flea systems (Gratz,
1999). In central Asia, plague is primarily maintained in Great Gerbil, Rhombomys
opimus, populations and fleas. Yersinia pestis utilizes a number of hosts in Africa
including rats, gerbils, meriones and wild mice. Plague has established urban cycles
in both Vietnam and Madagascar where it is found in the rat, Rattus rattus and its flea
Xenopsylla cheopis. In the United States, plague cycles are typically described as a
two-cycle system involving enzootic and epizootic hosts. Several studies of plague
outbreaks link certain weather conditions to increased incidence of sylvatic plague
(Stapp et al., 2004; Collinge et al., 2005; Pole and Chan, 2006; Snäll et al., 2008).
Seasonal changes in plague levels in rodent populations are mediated through
precipitation and temperature regimes that have a direct effect on flea vector
18
populations (Collinge et al., 2005; Stenseth et al., 2006; Park, 2007). However,
climate explains only part of the pattern of plague outbreaks. The single most
important factor leading to plague outbreaks in human populations is contact with
infected wildlife. Increase contact may be due to climate events that lead to
population increases in rodent reservoirs (Stenseth et al., 2006), but may also be due
to human encroachment into new habitats or, as hypothesized in this chapter, by
changes in the rodent and flea communities due to human activity. The third and
fourth chapters of this dissertation are dedicated to the analysis of the field data
collected as part of this research project. In Chapter 3, I explore the dynamics of
plague outbreaks in Gunnison’s prairie dogs in the Valles Caldera National Preserve.
This work adds to knowledge gained by other studies, which have examined plague in
prairie dog towns (Table 1.1). Finally, Chapter 4 examines the infection dynamics of
Bartonella, another bacterial pathogen that infects the erythrocytes of a diversity of
mammals, in an attempt to identify the primary mechanisms driving the spread of
flea-borne diseases in rodents. Bartonella is also considered an emerging disease
(Azad et al., 1997; Boulouis et al., 2005) and has several characteristics that make it
an ideal candidate for studies of vector borne disease. Bartonella is common in rodent
species where it is most likely transmitted by fleas (Bown et al., 2004). Though many
Bartonella species are implicated in human disease (Greub and Raoult, 2003), it
appears to have little immunological consequences for its wild rodent hosts (Chomel
et al., 2003, Boulouis et al., 2001). Therefore, Bartonella is common within rodents
and rodent populations are not prone to extinction due to Bartonella, which allows us
to collect ample data for analysis of flea versus host-mediated mechanisms of
19
pathogen transmission. It is the hope that such studies will inform the approach of
studies on other, more difficult to detect, vector borne zoonotic disease such as
plague, caused by the bacterium Yersinia pestis. Though a number of studies (Kosoy
et al., 1997, 2004a,b; Jardine et al., 2006; Bai et al., 2007a; 2008; Reeves et al., 2005,
2007; Birtles et al., 2001; Holmberg et al., 2003; Telfer et al., 2007a,b; Stevenson et
al., 2003; Morway et al., 2008) have contributed considerably to our understanding of
the ecology of particular species, we lack a cohesive view on the nature of Bartonella
infections in rodents and flea vectors. In particular, the specific mechanisms influence
the transmission of this pathogen remains unknown. Therefore, this chapter is largely
dedicated to describing the life cycle of Bartonella in rodents at the three study sites
of this research.

20
Table 1.1. Number of prairie dogs, burrows and fleas sampled in six studies on Gunnison’s (GPD), White- (WTPD), and Black-tailed prairie dogs
(BTPD) colonies. *Asterisks indicate plague positive samples.
Study citation
Ecke and Johnson,
1950 Lechleitner et al.,
1968 Cully et al.,
1997 Ubico et al.,
1988
Anderson and Williams,
1997 Holmes et al.,
2006 This Study (Chapter 3)
Location Colorado Colorado New Mexico Wyoming Wyoming Montana New Mexico
Species/Sample GPD BURR GPD BURR GPD BURR WTPD BURR WTPD BURR BTPD BURR GPD BURR
Number sampled na na 59 2700 61 467 32 165 208 2161 107 na 130 280
Aetheca wagneri 1 1*z 1z 4z 2z 11z
Catallagia decipiens 4 8 2
Cediopsylla inaequalis 2
Hystrichopsylla gigas dippiei X* 1 6 1
Monopsylla vison 1
Neopsylla inopina 15 43* 38* 49*
O. hirsuta X 1 339* 662* 208 147 586* 120*
O. idahoensis 45 15* 85* 8* 24* 57* 25* 28 20
O. labis 9 82 19* 445* 58 289* 54* 314* 38* 54*
21
Study citation
Ecke and Johnson,
1950 Lechleitner et al.,
1968 Cully et al.,
1997 Ubico et al.,
1988
Anderson and Williams,
1997 Holmes et al.,
2006 This Study (Chapter 3)
Location Colorado Colorado New Mexico Wyoming Wyoming Montana New Mexico
Species/Sample GPD BURR GPD BURR GPD BURR WTPD BURR WTPD BURR BTPD BURR GPD BURR
O. tuberculata cynomuris1 63* 5* 54* 11033* 36 9* 85* 248* 49* 52* 14 8
O. t. tuberculata1 68 40 5 5*
Peromyscopsylla hesperomys 1
Pulex sp. 1 867 159
Rhadinopsylla fraterna3 4 3* 12 9
R. sectilis2 1 2 5
Thrassis bacchi 9y 13*y
T. pandorae 6 2w 8*w
Total Fleas 151 208 299 12540 505 978 202 649 795 475 1143 358 633 167
1 Opisocrotstis t. cynomuris=Oropsylla t. cynomuris 2 Micropsylla sectilis=Rhadintopsylla sectilis; 3Rectofrontia fraternal=Rh. fraterna;; V Reported as P. simulans; W Reported as Oropsylla pandorae; Xreported as Oropsylla tuberculata; YReported as Oropsylla bacchi; Z Reported as Monopsylla wagneri. ”na” = not available
22
Literature Cited
Adjemian, J. Z., P. Foley, K. L. Gage, and J.E. Foley (2007) Initiation and spread of traveling waves of plague, Yersinia pestis, in the western United States. American Journal of Tropical Medicine and Hygiene 76: 365-375.
Anderson, S. H., and E. Williams (1997) Plague in a complex of white-tailed prairie dogs and associated small mammals in Wyoming. Journal of Wildlife Diseases 33: 720-732.
Azad, A.F., S. Radulovic, J.A. Higgins, B.H. Noden, and J.M. Troyer (1997) Flea-borne Rickettsioses, Ecologic Considerations. Emerging Infectious Disease 3: 319-327.
Bai, Y., S. P. Montgomery, K. W. Sheff, M. A. Chowdhury, R. F. Breiman, H. K., and M. Y. Kosoy (2007) Bartonella Strains in Small Mammals from Dhaka, Bangladesh, Related to Bartonella in America and Europe Am. J. Trop. Med. Hygiene 77: 567-570
Bia, Y., M.Y. Kosoy, C. Ray, R. J. Brinkerhoff, and S. K. Collinge (2008) Temporal and spatial patterns of Bartonella infection in black-tailed prairie dogs (Cynomys ludovicianus). Microbial Ecology 56: 373-382.
Birtles, R.J.S., M. Hazel, M. Bennett, K Bown, D. Raoult, and M. Begon (2001) Longitudinal monitoring of the dynamics of infections due to Bartonella species in UK woodland rodents. Epidemiology and Infection 126:323-329.
Bown, K. J., M. Bennett, and M. Begon (2004) Flea-borne Bartonella grahamii and Bartonella taylorii in Bank Voles. Emerging Infectious Diseases 10: 684-687.
Boulouis, H. J., F. Barrat, D. Bermond, F. Bernex, D. Thibault, R. Heller, J. J. Fontaine, Y. Piemont, and B. B. Chomel (2001) Kinetics of Bartonella birtlesii infection in experimentally infected mice and pathogenic effect on reproductive functions. Infection and Immunity 69: 5313–5317.
Chomel, B. B., R. W. Kasten, J. E Sykes, H. J. Boulouis, and E. B. Breitschwerdt. (2003) Clinical impact of persistent Bartonella bacteremia in humans and animals. Annual of the New York Academy of Science 990: 267-278.
Christie, A. B. (1982) Plague: Review of Ecology. Ecology of Disease 1: 111-115.
Collinge, S. K., W. C. Johnson, C. Ray, R. Matchett, J. Grensten, J. F. Cully, Jr., K. L. Gage, M. Y. Kosoy, J. E. Loye and A. P. Martin (2005) Testing the generality of a trophic-cascade model for plague. Ecohealth 2: 1-11.
Crowl, T.A., T.O. Crist, R.R. Parmenter and A.E. Lugo (2008) The spread of invasive species and infectious disease as drivers of ecosystem change. Frontiers in Ecology 6: 238-246

23
Cully, J.F., A. M. Barnes, T. J. Quan and G. Maupin (1997) Dynamics of plague in a Gunnison’s prairie dog colony. Journal of Wildlife Diseases 33: 706-718.
Cully, J. F., and E. S. Williams (2001) Interspecific comparisons of sylvatic plague in prairie dogs. Journal of Mammalogy 82: 894-905.
Daszak, P., A.A. Cunningham and A.D. Hyatt (2001) Anthropogenic environmental change and the emergence of infectious disease in wildlife. Acta Tropica 78: 103-116.
Deem S.L., A.M. Kilbourn, N.D. Wolfe, R.A. Cook, and W.B. Karesh (2001) Conservation Medicine. Annals of the New York Academy of Sciences 916: 370-377.
Ecke, D. H. and C. W. Johnson. (1950) Sylvatic plague in Park County, Colorado. Transactions of the North American Wildlife Conference 15: 191-197.
Eisen, R.J., S.W. Bearden, A.P. Wilder, J.A. Montenieri, M.F. Antolin and K.L. Gage (2006) Early-phase transmission of Yersinia pestis by unblocked fleas as a mechanism explaining rapidly spreading plague epizootics. Proceedings of the National Academy of Science 103: 15380-15385.
Gage, K.L., R.S. Ostfeld and J.G. Olson (1995) Nonviral vector-borne zoonoses associated with mammals in the United States. Journal of Mammalogy 76: 695-715.
Gage, K., and M. Kosoy (2005) Natural History of Plague: perspectives from more than a century of research. Annual Review of Entomology 50: 505-528.
Girard, J. M., D. M. Wagner, A. J. Vogler, C. Keys, C. J. Allender, L. C. Drickamer and P. Keim. (2004)Differential plague-transmission dynamics determine Yersinia pestis population genetic structure on local, regional, and global scales. Proceedings of the National Academy of Science 101: 8408-8413.
Gratz, N. (1999) Rodent reservoirs and flea vectors of natural foci of plague. Plague Manual: Epidemiology, Distribution, Surveillance and Control WHO/CDS/CSR/EDC 22.2: 61- 96.
Harvell, D., C.E. Mitchell, J.R. Ward, S. Altizer, A.P. Dobson, R.S. Ostfeld and M.D. Samuel (2002) Climate warming and disease risk for terrestrial and marine biota. Science, 296, 2158-2162.
Holmberg, M., J. N. Mills, S. McGill, G. Benjamin, and B. A. Ellis (2003) Bartonella infection in sylvatic small mammals of central Sweden. Epidemiology and Infections 130: 149-157.
Holmes, B. E., K. R. Foresman and M. R. Matcett (2006) No evidence of persistent Yersinia pestis infection at prairie dog colonies in North-central Montana. Journal of Wildlife Diseases 42: 164-169.
24
Jardine, C. C. Waldner, G. Wobeser, and F. A. Leighton (2006) Demographic features of Bartonella infections in Richardson’s ground squirrels (Spermophilus richardsonii). Journal of Wildlife Disease 42: 739-749.
Kartman, L., S. F. Quan and R. R. Lechleitner (1962) Die-off of a Gunnison’s prairie dog colony in central Colorado. Zoonoses Research 12: 201-224.
Keesing, F, R.D. Holt and R.S. Ostfeld (2006) Effects of species diversity on disease risk. Ecology Letters 9: 485-498.
Koontz, F.W., and P. Daszak (2005) Sprawl and Disease 144-156 Nature in Fragments, The legacy of sprawl. (eds E.A Johnson & M. W. Klemens) Columbia University Press, New York USA.
Kotliar, N.B., B. W. Baker, A.D. Whicker and G. Plumb (1999) A critical review of assumptions about the prairie dog as a keystone species. Environmental Management 42: 177-192.
Kosoy, M. Y., R. L. Regnery, T. Tzianabos, E. L. Marston, D. C. Jones, D. Green, G. O. Maupin, J. G. Olson and J. E. Childs. (1997). Distribution, diversity and host specificity of Bartonella in rodents from the southeastern United States. American Journal of Tropical Medicines and Hygiene 57: 578-588.
Kosoy, M., E.Mandel, D. Green, E. Marston, and J. Childs. (2004a) Prospective Studies of Bartonella of Rodents. Part I. Demographic and Temporal Patterns in Population Dynamics. Vector-Borne and Zoonotic Diseases. Winter: 285-295.
Kosoy, M., E. Mandel, D. Green, E. Marston, D. Jones, and J. Childs (2004b) Prospective Studies of Bartonella of Rodents. Part II. Diverse Infections in a Single Rodent Community. Vector-Borne and Zoonotic Diseases. Winter: 296-305.
Krasnov, B.R., G.I. Shenbrot, D. Mouillot, I.S. Khokhlova & R. Poulin (2006) Ecological characteristics of flea species relate to their suitability as plague vectors. Oecologia 149: 474-481.
Lechleitner, R. R., L. Kartman, M. I. Godenberg, and B.W. Hudson. (1968). An epizootic of plague in Gunnison’s prairie dogs (Cynomys gunnisoni) in south-central Colorado. Ecology 49: 734-743.
Lorange, E.A. (2005) Poor vector competence of fleas and the evolution of hypervirulence in Yersinia pestis. Journal of Infectious Disease, 191, 1907-1912.
Millar, B., G. Ceballos and R. Reading (1994) The prairie dog and biotic diversity. Conservation Biology 8: 677-681.
Morway, C., M. Kosoy, R. Eisen, J. Montenieri, K. Sheff, P. J. Reynolds and N. Powers (2008) A longitudinal study of Bartonella infection in populations of woodrats and their fleas. Journal of Vector Ecology 33(2):353-364.
25
Patz, J.A., T.K. Graczyk, N. Geller and A.Y. Vittor (2000) Effects of environmental change on emerging parasitic diseases. International Journal for Parasitology, 30, 1395-1405.
Poland, J. D., T. J. Quan and A. M Barnes (1994) Plague. Handbook of Zoonoses: Bacterial, Rickettsial, Chlamydial, and Mycotic. CRC Press, Inc: 93-112.
Pole, S. B., and K.-S. Chan (2006) Plague dynamics are driven by climate variation. Proceedings of the National Academy of Science 103: 13110-13115.
Reeves, W. K, M. P. Nelder and J. A. Korecki (2005) Bartonella and Rickettsia in fleas and lice from mammals in South Carolina, U. S. A. Journal of Vector Ecology 30: 310-315.
Reeves, W. K., T. E. Rogers, L A. Durden and Gregory A. Dashch (2007) Association of Bartonella with the fleas (Siphonaptera) of rodents and bats using molecular techniques. Journal of Vector Ecology 118-122.
Snäll, T., R. B. O’Hara, C. Ray, and S. K. Collinge (2008) Climate-driven spatial dynamics of plague among prairie dog colonies. American Naturalist 171: 239-248.
Stapp, P., M. F. Antolin, and M. Ball (2004) Patterns of extinction in prairie dog metapopulations: plague outbreaks follow El Nino events. Frontiers in Ecology: 2: 235-240. Stenseth, N. C., N. I. Samia, H. Viljugrein, K. L. Kausrud, M. Begon, S. Davis, H. Leirs, V. M. Dubyanskiy, J. Esper,V. S. Ageyev, N. L. Klassovkiy, B.P. Sergey, and K-L. Chan (2006) Plague dynamics are driven by climate variation. Proceedings of the National Academy of Science 103: 13110-13115.
Stevenson, H.L., Bai, Y., Kosoy, M.Y., Montenieri, J.A., Lowell, J.L., Chu, M.C. and K. L. Gage (2003) Detection of novel Bartonella strains and Yersinia pestis in prairie dogs and their fleas (Siphonaptera: Ceratophyllidae and Pulicidae) using multiplex polymerase chain reaction. Journal of Medical Entomology 40: 329-337.
Telfer, S., H. E. Clough, R. J. Birtles, M. Bennett, D. Carslake, S. Helyar, and M begon (2007a) Ecological differences and coexistence in a guild of microparasites: Bartonella in Wild Rodents. Ecology 88: 1841-1849.
Telfer, S. M. Begon, M. Bennett, K. J. Bown, S. Burthe, X. Lambin, G. Telford and R. Birtles (2007b) Contrasting dynamics of Bartonella spp. in cyclic field vole populations: the impact of vector and host dynamics. Parasitology 134: 413-425.
Ubico, S. R., Maupin, G. O., Fagerstone, K. A. and R. G. McLean (1988) A plague epizootic in the white-tailed prairie dogs (Cynomys leucurus) of Meeteetse, Wyoming. Journal of Wildlife Diseases 24: 399-406.

26
Webb, C. T., C. P. Brooks, K. L. Gage, and M. F. Antolin (2006) Classic flea-borne transmission does not drive plague epizootics in prairie dogs. Proceedings of the National Academy of Science 103: 6236-6241.
Wilcox, B.A. & D. J. Gubler (2005) Disease ecology and the global emergence of zoonotic pathogens. Environmental Health and Preventive Medicine, 10, 263- 72.
Wilcox, B.A. & R. R. Colwell (2005) Emerging and reemerging infectious diseases, Biocomplexity as an interdisciplinary paradigm. EcoHealth, 2, 244-257
Wilder, A. P., R. J. Eisen, S. W. Bearden, J. A. Montenieri, K. L. Gage, and M. F. Antolin (2008) Oropsylla hirsuta (Siphonaptera: Ceratophyllidae) can support plague epizootics in Black-tailed prairie dogs (Cynomys ludovianus) by early-phase transmission of Yersinia pestis. Vector-borne and zoonotic Diseases 8: 359-366.

27
CHAPTER 2: ANTHROPOGENIC DISTURBANCE AND THE TRANSMISSION OF FLEA-BORNE DISEASES

28
PREFACE- This chapter is formatted for publication within Oecologia.

29
ANTHROPOGENIC DISTURBANCE AND THE TRANSMISSION OF FLEA-BORNE DISEASES
Abstract: Anthropogenic disturbance may lead to the spread of vector-borne
diseases through effects on pathogens, vectors, and hosts. Identifying the type and
extent of vector response to habitat change will enable better and more accurate
management strategies for anthropogenic disease spread. I compiled and analyzed
data from published empirical studies to test for patterns among flea and small
mammal diversity, abundance, several measures of flea infestation, and host
specificity in 70 small mammal communities spanning 5 biomes and 3 levels of
human disturbance: 1) remote/wild areas; 2) agricultural areas; and, 3) urban areas.
Ten of 12 mammal and flea characteristics showed a significant effect of disturbance
category (6 traits), biome (4), or both (2). Six variables had a significant disturbance
by biome interaction. For mammal-flea communities in forest habitats (39 of the 70
communities), disturbance affected all 12 characteristics. Overall, flea and mammal
richness were higher in remote versus urban sites. Most measures of flea infestation,
including percent of infested mammals and fleas/mammal and fleas/mammal species
increased with increasing disturbance or peaked at intermediate levels of disturbance.
In addition, host use increased, and the number of specialist fleas decreased, as
human disturbance increased. Of the three most common biomes (forest,
grassland/savanna, desert), deserts were most sensitive to disturbance. Finally, sites of
intermediate disturbance were most diverse and exhibited characteristics associated
with increased disease spread. Anthropogenic disturbance was associated with
conditions conducive to increased transmission of flea-borne diseases.

30
Introduction:
Anthropogenic habitat disturbance disrupts ecosystem processes in ways that
can affect zoonotic disease dynamics (Daszak et al. 2001; Patz et al. 2000; Wilcox
and Gubler 2005 and references therein). Human population growth and coinciding
increases in urbanization, agricultural intensification, and encroachment into wild
areas are directly linked to the emergence of many zoonotic diseases in human
populations (Wilcox and Colwell, 2005). Recent increases in the incidence and
severity of disease within wildlife species have been attributed to a variety of
interacting factors including habitat loss and degradation, animal and pest
introductions and increased connectivity between populations (Crowl et al. 2008;
Daszak et al. 2001; Deem et al. 2001). Of particular concern for both human and
wildlife health, is the collective effect of anthropogenic disturbance on vector borne
diseases (Koontz and Daszak 2005). Vectors have free-living life stages and, thus,
may respond to anthropogenic changes in both environmental and host habitats.
Human activities, such as agricultural or forestry practices that change site
microclimate (relative humidity, soil temperature), and anthropogenic changes in
seasonal temperature and precipitation regimes directly affect vector survivorship,
development and feeding rates (Harvell et al. 2002; Patz et al. 2000; Daszak et al.
2001; Keesing et al. 2006). Anthropogenic disturbances also have the potential to
change the availability, density and susceptibility of hosts to pathogens and vectors,
and thus indirectly influence the spread and persistence of disease within an
ecosystem (Patz et al. 2000; Daszak et al. 2001; Keesing et al. 2006). Human
disturbance processes have led to the recent range expansions of many vector-borne

31
pathogens including Lyme disease, malaria, dengue fever, tick-borne encephalitis,
yellow fever, West Nile fever and plague (Harvell et al. 2002).
Fleas are ubiquitous parasites of small mammals and are the primary vector
for a number of diseases that affect humans including plague (Yersinia pestis) and
Rickettsia spp. such as murine typhus and Rocky Mountain fever (Gage, 1995).
Human induced habitat change can affect small mammals (Tikhonova et al. 2006)
and flea-borne mammal diseases (Azad et al. 1997) but does not always lead to
increased disease incidence (Collinge et al. 2005). The presence and abundance of
fleas are directly linked to the likelihood and spread of flea-borne disease like plague
and are closely tied to the presence and abundance of their hosts (Lorange, 2005;
Eisen et al. 2006; Krasnov et al. 2006a). Disease transmission is also more likely
when fleas exhibit low host specificity (i.e. parasitize a diversity of host species)
(Gage and Kosoy, 2005). Thus, the overall effect of disturbance on disease spread is a
culmination of individual effects on host-parasite interactions, habitat dependencies
of host and flea species, and host specificity of fleas. For instance, anthropogenic
disturbance decreases mammal community diversity (Tikhonova et al. 2006), and
should lead to decreased flea diversity. However, diversity loss may favor common
host species, which tend to harbor more flea species (Egoscue, 1976) and lead to an
increase in overall flea abundance.
To understand how fleas and flea-borne diseases might be impacted by human
disturbance, we analyze flea community dynamics and flea host utilization patterns in
relation to disturbance intensity in a large sample of published studies conducted
across the globe and in a variety of habitats. We interpreted the resulting correlations

32
in light of current theory regarding habitat change and vector parasites. Our
objectives were to answer the questions: 1) Does anthropogenic disturbance affect
flea diversity, abundance and host specificity; and, 2) What does this mean for long-
term persistence of fleas and flea borne pathogens in a changing world?
Materials and Methods:
Data Compilation: We searched Scisearch, CSA biological abstracts, Scirus, the
Defense Pest Management Information Analysis Center Literature Retrieval System
(Armed Forces Pest Management Board—LRS http://lrs.afpmb.org/rlgn_app), and
Google scholar using the following search terms and combination of these terms:
flea(s), rodents, small mammals, vector, habitat/habitat change, parasite, flea/parasite
assemblage, abiotic and biotic, anthropogenic disturbance/ change, disease, plague,
climate, murine typhus, flea-borne, vector borne, rickessia. We found additional
articles in the literature cited sections of these papers.
We retained only those studies that 1) attempted to collect all fleas from
animals captured in surveys that targeted the entire small mammal community, 2)
live-trapped animals, 3) actively collected fleas (by brushing, etc.), 4) described the
location and habitat of trapping locale, and 5) included numerical data for each flea
and host species. Fleas are known to abandon dead hosts and thus studies of kill-
trapped mammals are likely to underestimate true flea abundance and diversity
(Murray, 1957). These criteria yielded a sample of 63 studies reporting small
mammal flea surveys for 70 distinct sites across the world (Table 1; Appendix S1 in
Supporting Information).

33
Classification Schemes: We assigned each field site to one of five vegetation-based
biomes and one of three disturbance levels (Table 1). We usually used latitude and
longitude to classify each site. If these data were not provided, we used city search
engines, Google Earth, travel sites, web pages and scientific articles on other studies
that used the same plots. The vegetation classifications used in this analysis were
condensed versions of those presented by Olson et al. 2001. The Olson et al. (2001)
terrestrial ecoregion and biome data are available in interactive form and as a GIS
database from the World Wildlife Fund website (www.worldwildlife.org/science). This
classification scheme identifies the dominant natural vegetation type based on latitude,
soil conditions, elevation, and climate regime, but ignores human land use. We
condensed the 14 biomes of Olsen’s classification system as follows: Tropical,
Temperate, and Boreal forests were condensed into Forests; Temperate
grassland/savannas and Tropical grassland/savannas were classified into
Grassland/Savannahs; Deserts, Arid Shrublands, and Arid steppe biomes were
classified as Deserts; Mediterranean and Chaparral were merged; and Alpine and
Tundra were merged. Canopy cover was the primary characteristic used to distinguish
between forest and grassland/savanna ecoregions and precipitation regime (xeric versus
mesic habitats) was the primary characteristic used to distinguish between
grassland/savanna and desert categories in situations where sites existed in an
intermediate type biome (e.g. those described as woodland or shrubland). Five sites
existed within a mosaic type landscape or had a study site description that differed from
the biome classification. In these instances, we considered the size and nature of the
habitat patch when assigning biome. We assigned the Olson classification to three of
34
these studies (Achuthan et al. 1971; Nava et al. 2004; Hastriter et al. 2004) and we used
the author’s description or a new classification for the remaining two studies. For
example, one study in Huambo, Angola (Linardi, et al., 1994) fell with the
Grassland/Savanna biome, but was described as a forest in the paper. Angola is
dominated by grasslands but has distinct forest patches at high elevations (McGinely,
2008). Because these montane forests are considered relics of a moist forest biome that
once dominated the region, we classified this study as a forest. Conversely, Shayan and
Rafinejad, 2006 conducted surveys of several sites in Iran, which encompassed three
ecoregions: Zagros Mountain forest steppe, Nubo sindian desert and semi-desert, and
central Persian desert basin (http://www.nationalgeographic.com -Terrestrial
Ecoregions-). Though the authors cite forest and meadow habitats, we categorized these
surveys within grassland/savanna category to represent more accurately the steppe like
nature of most of the study sites, which for the most part lacked a continuous canopy
cover.
We used the GIS database of the Olson terrestrial ecoregions from the WWF
website to assign a biome to each site. We used ArcView to open the database and then
saved the file as a zipped .kml (Keyhole Markup Language) file, or .kmz file, for use in
Google Earth. We used the anthropocentric biome map created by Ellis and
Ramankutty (2008) in Google Earth to assign disturbance level to each study site. The
map shows classification assignments conducted at 5 arc minute (5’=0.0833˚ or
~86km2 at equator) and is available in interactive form from Encyclopedia of Earth,
viewable maps in Google Earth and Microsoft Virtual Earth
(www.eoearth.org/article/Anthropogenic_biome_maps) or in GIS format (Ecotope.org).
35
Ellis and Ramankutty (2008) define four major anthropocentric biomes, namely wild
lands, rangelands, croplands and urban zones; these were further subdivided by
population density and other factors to create 18 distinct habitat types. We used a
simplified version of their scheme to recognize three disturbance levels: 1) Low
disturbance sites were relatively wild or remote habitats that may include light human
populations; 2) Intermediate included agricultural areas, rural villages, and pastures;
and, 3) High disturbance areas were urban or densely populated areas. For studies
published after 1990, the disturbance class assignments were based directly on the
output of the Ellis and Ramankutty (2008) map, which is projected for conditions in
2005. For studies that occurred before 1990, we used Ellis and Ramankutty (2008) for
initial classification and cross-checked this classification with the original study
description as well as other data including census information, news articles, or other
descriptions of the area near the time of the study. Using these methods, we reclassified
six sites. One site characterized by Ellis and Ramankutty (2008) as intermediate
(Walton and Hong 1976) was reclassified as urban and another “intermediate” site
(Davis et al. 2002) was reclassified as wild because the study areas were too small to be
mapped at the scale of the anthropocentric biome map. Four intermediate sites (Campos
et al. 1985; Chenchijtikul et al. 1983; Coutrip et al. 1973; Graves et al. 1974;
Poorbaugh and Gier 1961) were wild at the time of study but had converted to
agriculture by 2005.
Most studies reported data for small mammal surveys conducted at multiple
sites within an area. Where possible we pooled data from multiple surveys within a
single biome and disturbance level. Seven studies (Adler et al. 2001; Bengtson et al.
36
1986; Chenchijtikul et al. 1983; Heisch et al. 1953; Liat et al. 1980; and Sunstsov et
al. 1997) reported surveys from more than one disturbance class. For these studies,
each distinct survey was analyzed as an independent sample, yielding three sites for
Heisch et al. (1953) and two sites for each of the other studies.
Hypothesis Testing and Statistical Analysis: Small mammal and flea richness
(number of species), number of small mammal or flea individuals collected,
prevalence (percent of hosts parasitized), intensity of infection (mean number of
fleas/parasitized mammal), flea burden (mean number of fleas/mammal) and flea
species burden (mean flea species/mammal) were calculated for each host species
within each site. We used the average of prevalence, intensity and flea burden values
calculated for each species within a site to test for differences among communities.
Though these measures are typically used to compare parasite infections between host
species, they also describe the overall infection characteristics of each community.
We used the average number and proportion (number infested/number potential host
species) of host species used by each flea species within each site as a measure of the
breadth of flea host selectively (niche breadth) at each site. Finally, the proportion of
flea species infesting just one host or three or more host species were used as the
proportion of specialist or generalist flea species present, respectively.
Relationships between log transformed mammal and flea variables,
standardized for sampling effort, were assessed with Pearson’s correlation analysis
using a Bonferroni adjusted alpha level for multiple tests (PROC CORR, SAS 9.2).
Standardizing for sampling effort (number of mammals sampled) was appropriate
because many previous studies note positive associations between number of
37
mammals captured and measures of diversity (e.g., Holdenried et al. 1951, Nava et al.
2003, Vasquez et al. 2005; Stanko 2002, Krasnov et al. 2004a, b, 2007, and Watve
and Sukumar, 1995 for mammal number-flea richness and Krasnov et al. 2004b,
Stanko et al. 2002, and Morrone and Gutiérrez, 2005 for mammal richness-flea
richness relationships). Previous studies suggest that the number of mammals trapped
is correlated with flea burden and abundance both positively (Kotti and Kovalesky,
1996; Krasnov et al. 2004b, 2007; and Zhonglai and Yaoxing, 1997) and negatively
(Krasnov et al. 2006a; Stanko et al. 2002 and Schwan, 1986). Similarly, in our
review, total number of mammals captured was significantly (P < 0.05) correlated
with mammal and flea richness (r = 0.31 and 0.44, respectively), mammal diversity (r
= -0.29), fleas collected (r = 0.85), flea species burden (r = 0.44), and number of host
species infested (r = 0.30) (Online Resource 2). Though we did not find an
association between number of hosts captured and flea prevalence, others have shown
both positive (Lindsay and Galloway, 1997; Bossi et al. 2002) and negative
relationships (Schwan, 1986). Therefore, we used hosts captured as a covariate in all
analyses to minimize confounding the effect of capture effort with the effect of
human disturbance and habitat.
We used generalized linear model (PROC GLIMMIX, SAS 9.2) analysis with
a negative binomial distribution and log link to test for disturbance level and biome
effects on number of mammal and fleas collected, richness, intensity, burden, and flea
species burden. A negative binomial distribution is appropriate for count data with
overdispersion (Little et al. 2002) and was consistent with the distributions of our
data. We only analyzed data collected from the four dominant biomes (Forest, Desert,
38
Grassland/Savanna, and Mediterranean) because Alpine/Tundra habitats were not
represented in all disturbance classes. We used PROC GLIMMIX analysis with a
binomial distribution and logit link to test for disturbance and biome effects on
prevalence of hosts infested, proportion of specialists, generalists and host species
infested. Tukey adjusted tests of means were used to identify pair-wise differences
between disturbance classes or biomes for significant model variables. We also ran an
analysis as described above to test for differences among disturbance classes within
the most prevalent biome, forest, as well as to look for specific differences among
biomes within each disturbance level.
Results:
My sample of 63 studies included 70 sites (Table 2.1 and Appendix 1). These
studies described flea communities from 23 high (urban) disturbance, 22 intermediate
(agricultural), and 25 low (wild) disturbance sites. Sites were located on six
continents with Asia and North America hosting the majority of study locations.
Forest (both deciduous and rainforest) was the most well represented biome, followed
by deserts and grasslands.
Mammal and flea richness were positively correlated with each other (Fig.
2.1). Flea number was positively correlated with flea burden, prevalence and intensity
of infestation. Measures of flea infection (prevalence, intensity, flea burden) were
positively correlated with one another (Fig. 1). Proportion of host specialist at each
site was negatively correlated with the proportion of generalists (r= -0.50) and the
average number of hosts/flea species (r= -0.59).
39
Disturbance level
Disturbance was a significant predictor for six of the 12 variables related to
mammals and fleas; a significant interaction between disturbance class and biome
also affected six variables (Table 2.2). Disturbance class had a stronger influence than
biome on both small mammal community variables, whereas flea community
variables were more commonly explained by biome or by the interaction term (Table
2.2). Averaged across biome, richness peaked in intermediate disturbance
(agricultural) classes. Two of three abundance measures (number fleas, flea burden)
were greatest in urban sites, whereas number of mammals captured was significantly
greater in wild locations (Figs. 2.2 and 2.3). Two measures of infection, prevalence
and proportion of host species used, were significantly higher in urban sites and three
measures, number of host species used, intensity, and flea species burden, were
greatest in agricultural sites (Figs. 2.2 and 2.3). Mean proportions of generalist and
specialist fleas were greatest in agricultural sites (Fig. 2.3).
Within forest biomes, all 12 variables differed significantly among
disturbance classes (Table 2.2). Number of mammals and fleas collected were
significantly higher in urban sites, whereas most other variables were significantly
greater in agricultural sites (Figs. 2.2 and 2.3).
Biome
Biome was the primary factor explaining observed changes in the total fleas
collected at a site and significantly affected prevalence, proportion of host species
infested, and proportion of host specialists at a site (Table 2.2). Most measures of

40
infestation were relatively low with little variation across biomes for low disturbance
sites, but as disturbance increased, infestation increased also, with great variation
among biomes (Figs. 2.2 and 2.3; Table 2.2). The prevalence of infested mammals
showed the greatest degree of significant divergence across biomes. Forests had a
significantly greater number of mammals and proportion of specialist fleas in wild
sites and higher flea burden in agricultural sites, as compared to other habitats (Figs.
2.2 and 2.3). Deserts had a significantly higher number of fleas and higher prevalence
than any other biome, and fleas infested a greater proportion of available host species
in deserts versus other biomes (Figs. 2.2 and 2.3). Deserts also had a much lower
proportion of specialists, particularly in high disturbance sites. Mediterranean sites
had the greatest flea diversity and showed distinct trends with respect to the
proportion of generalist, specialists and flea burden (Fig. 2.2).
Discussion:
There were clear and statistically significant associations between
anthropogenic disturbance and mammal and flea community structure. Most
measures of flea infestation increased with increasing disturbance (Figs. 2.2 and 2.3)
and variables associated with increased risk of disease spread and transmission, in
particular number of mammals and fleas collected, prevalence and intensity of
infestation (Neito, et al. 2007; Krasnov et al. 2006a; Hawlena et al. 2007), increased
significantly as disturbance increased. Because we used “total mammals” as an offset
(covariate) in linear model analysis, the variable “total fleas” is equivalent to the flea
index (fleas/capture), a measure commonly used to quantify flea infestation levels and
associated with an increased likelihood of plague outbreaks (Hawlena et al., 2007).

41
The influence of disturbance on mammal and flea characteristics was most evident in
analyses restricted to the forest biome (Table 3), probably reflecting greater statistical
power as sample size increased. Like Wilcox and Gubler (2005) and Tikhonova et al.
(2006), we found that richness and diversity (Shannon's H, data not shown but trends
and significance tests mirrored those produced with richness measures) of mammal
communities decreased with increasing anthropogenic disturbance. Our analysis
extends this pattern, in that human disturbance also reduces richness and diversity of
flea communities when comparing wild and urban sites.
It is generally accepted that increased anthropogenic activity leads to
decreased ecosystem heterogeneity and stability (sensu Wilcox and Gubler, 2005;
Bradley and Altizer, 2006), which has several repercussions for disease transmission.
In particular, changes in diversity can have many consequences for flea community
structure with direct implications for disease spread. First, ecosystem simplification
can favor host species that are natural reservoirs or good intermediate hosts for
zoonotic disease (LoGuidice et al. 2003). Commonly, these host species are habitat
generalists that benefit from disturbance related declines in abundance of habitat
specialists (Keesing et al. 2006). In addition, these generalist host species often carry
more diverse flea communities and higher flea loads (number of fleas/host), both of
which are associated with increased disease transmission (Egoscue, 1976). Second,
increases in the densities of generalist host species favors transmission of vectors and
their pathogens (Egoscue, 1976; Keesing et al. 2006; Wilcox and Gubler, 2005).
Third, disturbance can also favor generalist vector species, which are important
determinants for the spread of zoonotic disease among wildlife populations due to
42
their tendency to feed from a variety of taxa (Molyneux, 2003; Gettinger and Ernest,
1995). For this reason, increased abundance of generalist vectors is strongly
associated with increased parasite transmission (Gettinger and Ernest, 1995) and
incidence of disease outbreaks in both human and wildlife population (Neito et al.
2007; Hawlena et al. 2007). In addition, at least one study found that fleas with broad
host spectrums (infest multiple host species) tended to be good plague vectors
(Krasnov et al. 2006), and thus there could be additional inherent characteristics of a
generalist species that predispose them to be good disease vectors.
When comparing remote and urban sites, this study showed trends of diversity
consistent with ecosystem simplification and flea host use became more generalized
as disturbance increased. Specifically, the proportion of generalist flea species
(excluding Mediterranean communities) and the average number and proportion of
host species infested by each flea species increased with increasing disturbance (Fig.
3), whereas the number of specialists decreased (except in Mediterranean
communities). Our analysis cannot suggest whether these trends reflect an
evolutionary mechanism (generalists are better adapted for dealing with disturbance),
or an ecological mechanism (specialist lost with loss of their host species).
Nonetheless, it is clear that fleas in more disturbed site tend to infect a greater number
of species. In addition, flea exchange among hosts is known to increase with the
percentage of hosts infested (Bossard, 2006), and prevalence increased with greater
disturbance in this study. Clearly anthropogenic activity can potentially increase
disease risk through changes in flea host utilization patterns.
43
Flea host specificity was measured in two ways in this study: 1) by
quantifying individual flea species host utilization or the number or host species used
versus available at each site; and, 2) by classifying flea species according to the
number (1 or greater than 3) of host species parasitized. A number of studies have
examined the relationship between various measures of host specificity and
environmental or host community characteristics. Many found that habitat type and
the physical characteristics of habitat affect how fleas use hosts (Cole and Koepke,
1947; Krasnov et al. 2004a; Trpis, 1994; Chandrahas and Krishnaswami, 1971; and
Castleberry et al. 2003). In contrast, Poulin (1998), in his review of specificity
patterns of small mammal parasites, considered host traits such as density, lifespan,
diversity of habitats used, and social structure most important in determining the host
breadth of parasite species (e.g., Poulin et al. 2006). Poulin’s view is supported by
Krasnov et al. (2004c, 2006c) who found specialization negatively related to host
body size and abundance. Our analysis only found a significant relationship between
flea specificity and disturbance or host variables when measuring the number or
proportion of host species used rather than quantifying fleas as specialists or
generalist. It may be that our definition of specialists and generalist were limited (raw
species counts versus an index). Host phylogeny, which was not addressed in this
review, may have also affected our results (e.g. Felsenstein, 1985, but see Guègan et
al. 2005). The proportion of hosts used by a flea species was significantly and
negatively related to the host availability (mammal richness) (Fig. 1) indicating that
fleas did not increase their host species spectrum linearly with host species
availability. In analysis of disturbance effects, average number of host species used
44
and mammal richness trends correspond, but the proportion of host species used is
clearly tied to disturbance (Fig. 2.3). Thus, the trend for broader host species
utilization with increasing disturbance does not relate solely to host or flea diversity.
Many infection parameters peaked at sites of intermediate disturbance (Fig.
2.2 and 2.3). Most notably, the intensity of infestation, average number of hosts
species utilized by flea species, and flea burden were significantly higher in
intermediate disturbance sites (Fig. 2.2 and 2.3). Sites of intermediate disturbance
can be important areas for disease exchange and emergence because they contain
peridomestic mammal species, which readily carry disease between wild reservoir
hosts and the commensal mammal species that live in proximity to humans. Indeed,
plague in humans is commonly associated with the presence of peridomestic mammal
species (Perry and Featherston, 1997). In this study, intermediate disturbance sites
contained the greatest number of host and flea species, which may reflect the merging
of domestic, peridomestic and wild mammal communities. Therefore, these sites
provide not only greater opportunity for vector exchange between reservoir and
commensal mammals, but also exhibit characteristics commonly associated with both
increase vector exchange and disease transmission.
Biome was associated with both the magnitude and direction of the observed
effects of disturbance on flea communities (Figs. 2.2 and 2.3). Forest and
Mediterranean sites were most diverse, whereas grassland/savanna and desert sites
contained the fewest species, which may reflect a relationship between habitat
complexity and species richness. Deserts appeared to be more sensitive to disturbance
than other biomes (Figs. 2.2 and 2.3). Mammals in deserts also had higher prevalence

45
and carried more fleas per individual than other sites. The tendency for high flea
burden may be a result of the relatively low diversity and richness of fleas in desert
sites, which could lead to a predominance of generalist species that tend to be more
abundant within communities (Krasnov et al. 2004c). This tendency is also reflected
in a much lower proportion of specialists in deserts relative to other habitats (Fig.
2.3). The degree and type of disturbance may be an important factor in how a system
responds to disturbance. For instance, grassland to agriculture transitions are less
dramatic than a forest to agriculture transitions with respect to overstory structure and
species exchange and, therefore, grassland communities may be more tolerant to this
particular change. These differences might explain why grassland /savanna
communities appear to be the less susceptible to disturbance related changes in host
and flea community characteristics (Figs. 2.2 and 2.3).
Global warming is predicted to lead to range expansions of many arthropod
vector species (particularly in regions of reduced frost occurrence) and increase the
frequency of vector borne disease outbreaks (Githeko et al. 2000; Epstein, 2001;
Harvell et al. 2002). However, because higher temperatures reduce adult survivorship,
population density of vector species could decrease and lead to lower disease
transmission rates (Harvell et al. 2002). In addition, local climatic conditions (or
biome) are likely to play an important role in determining disease emergence
(Lafferty, 2009). While the ultimate effects of global warming remain to be seen, this
study presents clear evidence for the important role of habitat disturbance in
increasing flea-borne disease risk.

46
Anthropogenic disturbance favors several conditions conducive to flea-borne
disease spread, namely higher infestation levels, greater flea abundance, and greater
host utilization. Disturbance also facilitates greater flea exchange and higher flea
infestation levels through its effect on diversity, which may favor generalist host and
vector species. Disturbed habitats may play an important role in facilitating the range
expansion of vectors predicted by global warming scenarios (Cummings and Van
Vuren, 2006). Those regions that are already destabilized are most prone to the
negative consequences of such expansion, whereas range expansions may be more
limited in areas less affected by disturbance due to the presence of natural checks and
balances, which reduce the conditions that promote flea exchange. Thus, preservation
of functional and diverse ecosystems may be an effective strategy for limiting
zoonotic disease spread.
Acknowledgements: We thank Dave Wagner, Bob Parmenter, Paulette Ford
and Boris Krasnov for their helpful comments, which greatly improved this paper.
SAS 9.2 statistical software was provided by the Sevilleta Wildlife Refuge and Long
Term Ecological Research Site. This research was funded by the Ecology of
Infectious Diseases program of the NSF/NIH (EF-0326757) and the U.S. Forest
Service, Rocky Mountain Research Station.

47
References:
Achuthan, C. & Chandrahas, R. K. (1971) Seasonal prevalence of rat fleas in Kolar (Mysore State). The Indian Journal of Medical Research, 59, 833-837.
Adler, G.H., Suntsova, N.I., Suntsov, V.V. & Mangan, S.A (2001) Fleas (Siphonaptera) Collected from Small Mammals in Southern Viet Nam in 1997-1998. Journal of Medical Entomology, 38, 210-213. doi:10.1603/0022-2585-38.2.210
Azad, A.F., Radulovic, S., Higgins, J.A., Noden, B.H. & Troyer, J.M. (1997) Flea-borne Rickettsioses, Ecologic Considerations. Emerging Infectious Disease, 3, 319-327. doi:10.3201/eid0303.970308
Bengston, S.A., Brinck-Lindroth, G., Lundquvist, L., Nilsson, A. & Rundgren, S. (1986) Ectoparasites on small mammals in Iceland, Origin and population characteristics of a species-poor insular community. Holarctic Ecology, 9, 143-148.
Bossi, D.E.P., Linhares, A.X. & de Godoy Bergallo, H. (2002) Parasititic arthropods of some wild rodents from Juréia-Itatins Ecological Station, State of São Paulo, Brazil Memorias do Instituto Oswaldo Cruz, 7, 959-963.
Bossard, M. (2006) Mammal and flea relationships in the Great Basin Desert: From H. J. Egoscue's collections. Journal of Parasitology, 92, 260-266. doi:10.1645/GE-3545.1
Bradley, C.A., & Altizer, S. (2006) Urbanization and the ecology of Wildlife diseases. Trends in Ecology and Evolution, 22, 95-102. doi:10.1016/j.tree.2006.11.001
Castleberry, S.B., Castleberry, N.I., Wood, P.B., Ford, W.M, & Mengak, M.T. (1983) Flea (Siphonaptera) of the Allegheny woodrat (Neotoma magister) in West Virginia with comments on host specificity. American Midland Naturalist, 149, 233-236. doi:10.1674/0003-0031(2003)149[0233:FSOTAW]2.0.CO;2
Chandrahas, R.K. and Krishnaswami, A.K. (1971) Host preference of Siphonaptera on wild rodents in the south Indian plague focus. Indian journal of Medical Research, 59, 1807-1815.
Chenchijtikul, M., Daengpium, S. Hasegawa, M., Itoh, T. & Phanthumadchinda, B. (1983) A study of commensal rodents and shrews with reference to the parasites of medical importance in Chanthaburi Province, Thailand. Southeast Asian Journal of Tropical Medicine and Public Health, 14, 255-259.
Cole, L.C. & Koepke, J.A. (1947) Problems of interpretation of the data of rodent-ectoparasite surveys and Studies of rodent ectoparasites in Honolulu, T. H., Savannah, Ga., and Dothan, Ala. Public Health Report, Supplemental, 202, 1-71.
Collinge, S.K., Johnson, W.C., Ray, C., Matchett, R., Grensten, J., Cully, Jr., J.F., Gage, K.L., Kosoy, M.Y., Loye, J.E., & Martin, A.P.(2005) Landscape structure and

48
plague occurrence in black-tailed prairie dogs on grasslands of the western USA. Landscape Ecology, 20, 941-955. doi:10.1007/s10980-005-4617-5
Crowl, T.A., Crist, T.O., Parmenter, R.R., & Lugo, A.E (2008) The spread of invasive specie sand infectious disease as drivers of ecosystem change. Frontiers in Ecology, 6, 238-246. doi:10.1890/070151
Cumming G.S. & Van Vuuren, D.P. (2006) RESEARCH PAPER, Will climate change affect ectoparasite species ranges? Global Ecology and Biogeograph,y 15, 486-97.
Daszak, P., Cunningham, A.A., & Hyatt, A.D. (2001) Anthropogenic environmental change and the emergence of infectious disease in wildlife. Acta Tropica, 78, 103-116.doi:10.1016/S0001-706X(00)00179-0
Deem S.L., Kilbourn, A.M., Wolfe, N.D., Cook, R.A., & Karesh, W.B. (2001) Conservation Medicine. Annals of the New York Academy of Sciences, 916, 370-377.
Ellis, E.C., & Ramankutty, N. (2008) Putting people in the map, Anthropogenic biomes of the world. Frontiers in Ecology and the Environment, 6, 439-447.doi:10.1890/070062
Eisen, R.J., Bearden, S.W., Wilder, A.P., Montenieri, J.A., Antolin, M.F., & Gage, K.L. (2006) Early-phase transmission of Yersinia pestis by unblocked fleas as a mechanism explaining rapidly spreading plague epizootics. Proceedings of the National Academy of Science, 103, 15380-15385.doi:10.1073/pnas.0606831103
Epstein, P.R. (2001) Climate change and emerging infectious diseases. Microbes and Infection, 3, 747–754.doi:10.1016/S1286-4579(01)01429-0
Egoscue, H.J. (1976) Flea exchange between deer mice and some associated small mammals in western Utah. Great Basin Naturalist, 36,475–480.
Felsenstein, J. (1985) Phylogenies and the comparative method. American Naturalist, 125, 1-15.doi:10.1086/284325
Gage, K.L., Ostfeld, R.S., & Olson, J.G. (1995) Nonviral vector-borne zoonoses associated with mammals in the United States. Journal of Mammalogy, 76, 695-715.doi:10.2307/1382741
Gage, K., and Kosoy, M. (2005) Natural History of Plague, Perspectives from more than a century of research. Annual Review of Entomology 50, 505-528. doi:10.1146/annurev.ento.50.071803.130337
Gettinger, D. & Ernest, K.A. (1995) Small-mammal community structure and the specificity of ectoparasite associations in central Brazil. Revista brasileira de biologia, 55, 331-341.
49
Githeko, A.K., Lindsay, S.W., Confalonieri, U.E. & Patz, J.A. (2000) Climate change and vector-borne diseases: a regional analysis. Bulletin of the World Health Organization, 78, 1136-1147.
Guègan, G., Morand, S. & Poulin, R. (2005) Are there general laws in parasite community ecology? The emergence of spatial parasitology and epidemiology. Parasitism and Ecosytems (eds Thomas, Renaud, & Guègan) Oxford University Press, USA.
Hastriter, M.W., Frafjord, K. & Whiting, M.F. (2004) A Collection of Norwegian Fleas (Siphonaptera) North of the Arctic Circle. Proceedings of the Entomological Society of Washington, 106, 877-883.
Harvel, D. Mitchell, C.E., Ward, J.R., Altizer, S., Dobson, A.P., Ostfeld, R.S. & Samuel, M.D. (2002) Climate warming and disease risk for terrestrial and marine biota. Science, 296, 2158-2162.doi:10.1126/science.1063699
Hawlena, H., Abramsky, Z., Krasnov, B.R. & Saltz, D. (2007) Host defense versus intraspecific competition in the regulation of infrapopulations of the flea Xenopsylla conformis on it rodent host Meriones crassus. International Journal for Parasitology, 37, 919-925. doi:10.1016/j.ijpara.2007.01.015
Heisch, R.B., Grainger, W.E. & D'Souza, Jr., S.T.A. (1953) Results of a plague investigation in Kenya. Transactions of the Royal Society of Tropical Medicine and Hygiene, 47, 503-521. doi:10.1016/S0035-9203(53)80004-0
Holdenried, R., Evans, F.C. & Longanecker, D.S. (1951) Host-parasite-disease relationships in a mammalian community in the Central Coast Range of California. Ecological Monographs, 2–13.
Keesing, F, Holt, R.D. & Ostfeld, R.S. (2006) Effects of species diversity on disease risk. Ecology Letters, 9, 485-498.doi:10.1111/j.1461-0248.2006.00885.x
Koontz, F.W. & Daszak, P. (2005) Sprawl and Disease 144-156 Nature in Fragments, The legacy of sprawl. (eds E.A Johnson & M. W. Klemens) Columbia University Press, New York USA.
Krasnov B., Shenbrot G. & Khokhlova, I. (2002) The effect of host density on ectoparasite distribution: An example of a rodent parasitized by fleas. Ecology, 83, 164-75. doi:10.1890/0012-9658(2002)083[0164:TEOHDO]2.0.CO;2
Krasnov B.R., Shenbrot G.I., Khokhlova I.S., & Degen, A.A. (2004a) Flea species richness and parameters of host body, host geography and host 'milieu'. Journal of Animal Ecology 73(6), 1121-8.doi:10.1111/j.0021-8790.2004.00883.x
Krasnov, B.R., Shenbrot, G.I., Khokhlova, I.S., & Degen, A. (2004b) Relationship between host diversity and parasite diversity, flea assemblages on small mammals. Journal of Biogeography, 31, 1857-1866.doi:10.1111/j.1365-2699.2004.01132.x

50
Krasnov B.R., Poulin R., Shenbrot G.I., Mouillot D. & Khokhlova, I.S. (2004c) Ectoparasitic "jacks-of-all-trades": Relationship between abundance and host specificity in fleas (siphonaptera) parasitic on small mammals. American Naturalist, 164, 506-16.doi:10.1086/423716
Krasnov B.R., Stanko M., Miklisova D., & Morand, S. (2006a) Habitat variation in species composition of flea assemblages on small mammals in central Europe. Ecological Research, 21, 460-9.doi:10.1007/s11284-005-0142-x
Krasnov, B.R., Shenbrot, G.I., Mouillot, D., Khokhlova, I.S. & Poulin, R. (2006b) Ecological characteristics of flea species relate to their suitability as plague vectors. Oecologia, 149, 474-481.doi:10.1007/s00442-006-0455-7
Krasnov, B.R., Stanko, M., Miklisova, D., & Morand, S. (2006c) Host specificity, parasite community size and the relation between abundance and its variance. Evolutionary Ecology, 20, 75-91.doi:10.1007/s10682-005-4731-5
Krasnov, B.R., Shenbrot, G.I., Khokhlova, I.S., & Poulin, R. (2007) Geographical variation in the “bottom-up” control of diversity, fleas and their small mammalian hosts. Global Ecology and Biogeography, 16, 179-186.doi:10.1111/j.1466-8238.2006.00273.x Kotti, V.K., & Kovalevskiy, Y.V. (1996) Flea of small mammals in the AmurBureya Interfluve. Entomological Review, 75, 121-127.
Kevin D. & Lafferty, K. (2009) The ecology of climate change and infectious diseases. Ecology, 90, 888-900.doi:10.1890/08-0079.1
Liat, L.B., Sustriayu, N., Hadi, T.R., & Bang, Y.H. (1980) A study of small mammals in the Ciloto Field station area, West Java, Indonesia, with special reference to vectors of plague and scrub typhus. Southeast Asian Journal of Tropical Medicine and Public Health, 11, 71-80.
Lindsay, L.R. & Galloway, T.D (1997) Seasonal activity and temporal separation of four species of fleas (Insecta: Siphonaptera) infesting Richardson's ground squirrels, Spermophilus richardsonii (Rodentia: Sciuridae), in Manitoba. Canadian Journal of Zoology, 75, 1310-1322.doi:10.1139/z97-155
Little, R.C. Stroup, W.W. & Freund, R.J. (2002) SAS for linear models. 4th Ed. SAS Publishing pp466.
LoGuidice, K., Ostfeld, R.S., Schmidt, K.A, & Keesing, F. (2003) The ecology of infectious disease: Effects of host diversity and community composition on Lyme disease risk. Proceeding of the National Academy of Science, 100, 567-571.doi:10.1073/pnas.0233733100
Lorange, E.A. (2005) Poor vector competence of fleas and the evolution of hypervirulence in Yersinia pestis. Journal of Infectious Disease, 191, 1907-1912.doi:10.1086/429931
51
Ma, L. (1988) Abundance of fleas in relation to population fluctuations of their hosts. Acta Entomologica Sinica, 31, 50-4.
Molyneux, D.H. (2003) Climate change and tropical disease: Common themes in changing vector-borne disease scenarios. Transactions of the Royal Society of Tropical Medicine and Hygiene, 97, 129-132.doi:10.1016/S0035-9203(03)90097-6
Morrone, J.J. & Gutiérrez, A. (2005) Do fleas (Insecta, Siphonaptera) parallel their mammal host diversification in the Mexican transition zone? Journal of Biogeography, 32, 1315-1325.
Mouillot, D., Krasnov, B.R, Shenbrot, I., Gaston, K. & Poulin, R. (2006) Conservatism of host specificity in parasites. Ecography, 29, 596-602. doi:10.1111/j.0906-7590.2006.04507.x
Murray, K.F. (1957) An ecological appraisal of host-ectoparasite relationships in a zone of epizootic plague in central California. American Journal of Tropical Medicine and Hygiene, 6, 1068-1086.
Nava, S., Lareschi, M. & Voglino, D. (2003) Interrelationship between Ectoparasites and Wild Rodents from Northeastern Buenos Aires Province, Argentina. Memorias do Instituto Oswaldo Cruz, 98, 45-49.
Nieto, N.C., Dabritz, H., Foley, P., Drazenovich, N., Calder, L., Adjemian, J., Conrad, P.A., & Foley, J.E. (2007) Ectoparasite diversity and exposure to vector-borne disease agents in wild rodents in central coastal California. Journal of Medical Entomology, 44, 328-35. doi:10.1603/0022-2585(2007)44[328:EDAETV]2.0.CO;2
Olson, D.M., Dinerstein, E., Wikramanayake, E.D., Burgess, N.D., Powell, G.V.N., Underwood, E.C., D'amico, J.A., Itoua, I., Strand, H.E., Morrison, J.C., Loucks, C. J., Allnutt, T.F., Ricketts, T.H., Kura, Y., Lamoreux, J.F., Wettengel, W.W., Hedao, P., & Kassem, K.R. (2001) Terrestrial Ecoregions of the World, A New Map of Life on Earth. Bioscience, 51, 933-38.doi:10.1641/0006-3568(2001)051[0933:TEOTWA]2.0.CO;2
Patz, J.A., Graczyk, T.K., Geller, N. & Vittor, A.Y. (2000) Effects of environmental change on emerging parasitic diseases. International Journal for Parasitology, 30, 1395-1405. doi:10.1016/S0020-7519(00)00141-7
Perry, R.D., & Fetherston, J.D. (1997) Yersinia pestis-Etiological agent of plague. Clinical Microbiological Reviews, 10, 35-66.
Poulin, R. (1998) Host Specificity. 41-69. Evolutionary Ecology of Parasites: from Individuals to Communities. Chapman & Hall, London.
52
Poulin R., Krasnov B.R., Shenbrot G.I., Mouillot D., & Khokhlova, I.S. (2006) Evolution of host specificity in fleas: Is it directional and irreversible? International Journal of Parasitology, 36, 185-91.doi:10.1016/j.ijpara.2005.09.017
Schwan, T.G. (1986) Seasonal abundance of fleas (Siphonaptera) on grassland rodents in Lake Nakuru National Park, Kenya, and potential for plague transmission. Bulletin of Entomological Research, 76, 633-648.doi:10.1017/S0007485300015133
Stanko M., Miklisova D., Gouey de Bellocq J., & Morand, S. (2002) Mammal density and patterns of ectoparasite species richness and abundance. Oecologia, 131, 289-95.doi:10.1007/s00442-002-0889-5
Stunstov, V.V., Huong, L.T., Suntsova, N.I., & Gratz, H.G. (1997) Plague foci in Viet Nam: zoological and parasitological aspects. Bulletin of the WHO, 75, 117-123.
Tikhonova, G.N., Tikhonov, I.A., & Pogomolov, P.L. (2006) Impact of a small city on the structure of small mammal fauna in forests of the northeastern Moscow region. Russian Journal of Ecology, 37, 278-2893.doi:10.1134/S1067413606040102
Trpis, M. (1994) Host specificity and ecology of fleas (Siphonaptera) of small mammals in mountains of north-central Slovakia. Bulletin of Soc Vector Ecologists, 19, 18-22.
Vazquez D.P., Poulin R, Krasnov B.R., & Shenbrot, G.I. (2005) Species abundance and the distribution of specialization in host-parasite interaction networks. Journal of Animal Ecology, 74, 946-55.doi:10.1111/j.1365-2656.2005.00992.x
Watve, M.G. & Sukumar, R. (1995) Parasite abundance and diversity in mammals: Correlates with host ecology. Proceedings of the National Academy of Science, Ecology, 92, 8945-8949.
Wilcox, B.A. & Gubler, D.J. (2005) Disease ecology and the global emergence of zoonotic pathogens. Environmental Health and Preventive Medicine, 10, 263- 72. doi:10.1007/BF02897701
Wilcox, B.A. & Colwell, R.R. (2005) Emerging and reemerging infectious diseases, Biocomplexity as an interdisciplinary paradigm. EcoHealth, 2, 244-257.doi:10.1007/s10393-005-8961-3
Zhonglai, L., & Yaozing (1997) Analysis on the yearly dynamics relation between body flea index and population of Citellus dauricus. Acta Entomologica Sinica, 40, 166-170.
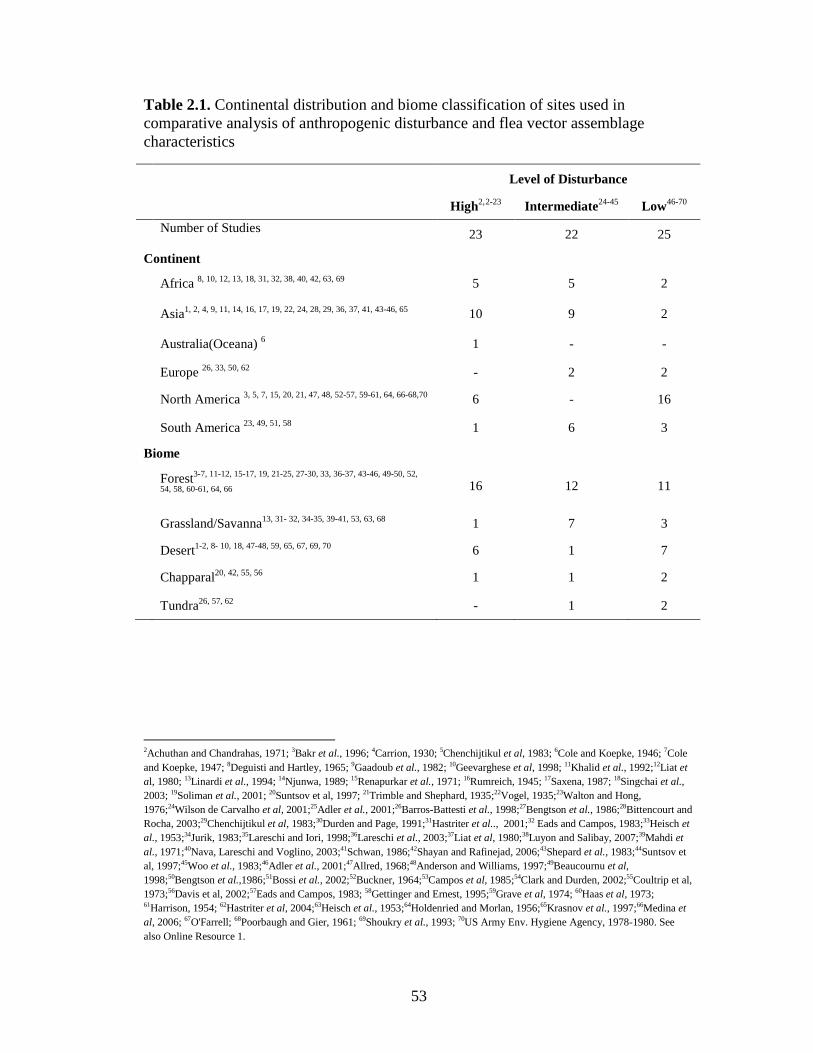
53
Table 2.1. Continental distribution and biome classification of sites used in comparative analysis of anthropogenic disturbance and flea vector assemblage characteristics
Level of Disturbance
High2,2 Intermediate24-45 -23 Low46-70
Number of Studies 23 22 25
Continent
Africa 8, 10, 12, 13, 18, 31, 32, 38, 40, 42, 63, 69 5 5 2
Asia1, 2, 4, 9, 11, 14, 16, 17, 19, 22, 24, 28, 29, 36, 37, 41, 43-46, 65 10 9 2
Australia(Oceana) 6 1 - -
Europe 26, 33, 50, 62 - 2 2
North America 3, 5, 7, 15, 20, 21, 47, 48, 52-57, 59-61, 64, 66-68,70 6 - 16
South America 23, 49, 51, 58 1 6 3
Biome
Forest3-7, 11-12, 15-17, 19, 21-25, 27-30, 33, 36-37, 43-46, 49-50, 52,
54, 58, 60-61, 64, 66 16 12 11
Grassland/Savanna13, 31- 32, 34-35, 39-41, 53, 63, 68 1 7 3
Desert1-2, 8- 10, 18, 47-48, 59, 65, 67, 69, 70 6 1 7
Chapparal20, 42, 55, 56 1 1 2
Tundra26, 57, 62 - 1 2
2Achuthan and Chandrahas, 1971; 3Bakr et al., 1996; 4Carrion, 1930; 5Chenchijtikul et al, 1983; 6Cole and Koepke, 1946; 7Cole and Koepke, 1947; 8Deguisti and Hartley, 1965; 9Gaadoub et al., 1982; 10Geevarghese et al, 1998; 11Khalid et al., 1992;12Liat et al, 1980; 13Linardi et al., 1994; 14Njunwa, 1989; 15Renapurkar et al., 1971; 16Rumreich, 1945; 17Saxena, 1987; 18Singchai et al., 2003; 19Soliman et al., 2001; 20Suntsov et al, 1997; 21Trimble and Shephard, 1935;22Vogel, 1935;23Walton and Hong, 1976;24Wilson de Carvalho et al, 2001;25Adler et al., 2001;26Barros-Battesti et al., 1998;27Bengtson et al., 1986;28Bittencourt and Rocha, 2003;29Chenchijtikul et al, 1983;30Durden and Page, 1991;31Hastriter et al.., 2001;32 Eads and Campos, 1983;33Heisch et al., 1953;34Jurik, 1983;35Lareschi and Iori, 1998;36Lareschi et al., 2003;37Liat et al, 1980;38Luyon and Salibay, 2007;39Mahdi et al., 1971;40Nava, Lareschi and Voglino, 2003;41Schwan, 1986;42Shayan and Rafinejad, 2006;43Shepard et al., 1983;44Suntsov et al, 1997;45Woo et al., 1983;46Adler et al., 2001;47Allred, 1968;48Anderson and Williams, 1997;49Beaucournu et al, 1998;50Bengtson et al.,1986;51Bossi et al., 2002;52Buckner, 1964;53Campos et al, 1985;54Clark and Durden, 2002;55Coultrip et al, 1973;56Davis et al, 2002;57Eads and Campos, 1983; 58Gettinger and Ernest, 1995;59Grave et al, 1974; 60Haas et al, 1973; 61Harrison, 1954; 62Hastriter et al, 2004;63Heisch et al., 1953;64Holdenried and Morlan, 1956;65Krasnov et al., 1997;66Medina et al, 2006; 67O'Farrell; 68Poorbaugh and Gier, 1961; 69Shoukry et al., 1993; 70US Army Env. Hygiene Agency, 1978-1980. See also Online Resource 1.
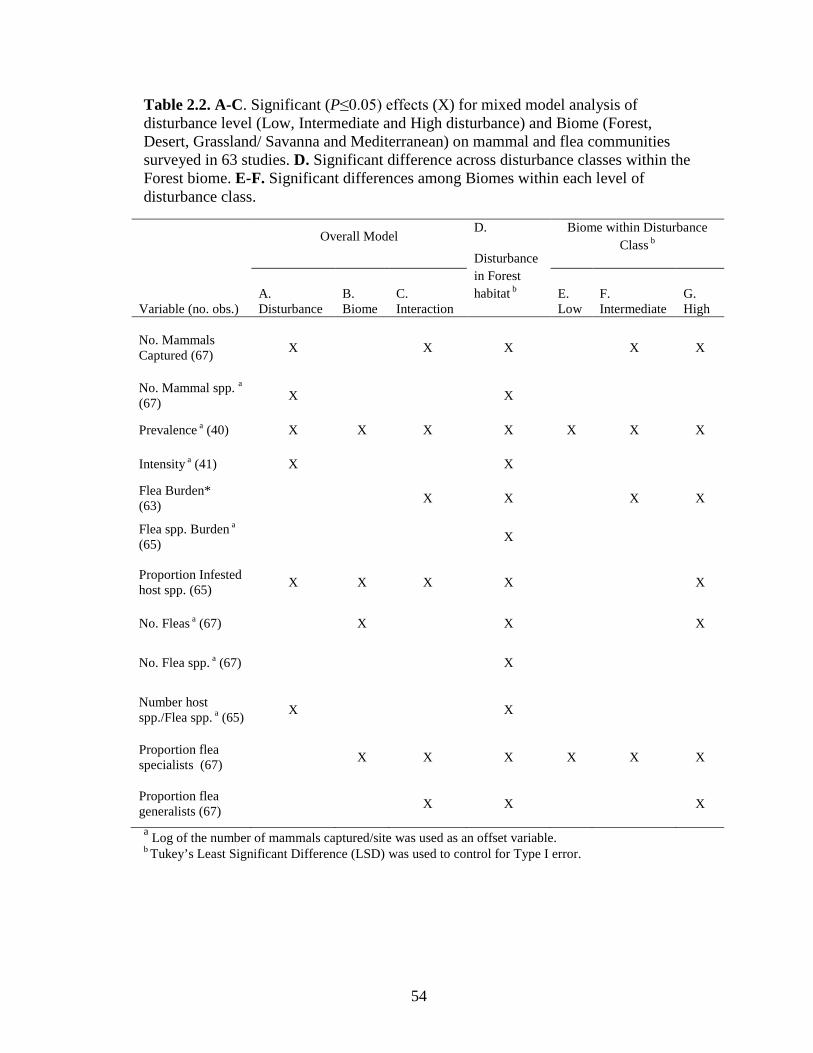
54
Table 2.2. A-C. Significant (P≤0.05) effects (X) for mixed model analysis of disturbance level (Low, Intermediate and High disturbance) and Biome (Forest, Desert, Grassland/ Savanna and Mediterranean) on mammal and flea communities surveyed in 63 studies. D. Significant difference across disturbance classes within the Forest biome. E-F. Significant differences among Biomes within each level of disturbance class.
Overall Model
D.
Disturbance in Forest habitat b
Biome within Disturbance Class b
Variable (no. obs.) A. Disturbance
B. Biome
C. Interaction
E. Low
F. Intermediate
G. High
No. Mammals Captured (67) X X X X X
No. Mammal spp. a (67) X X
Prevalence a (40) X X X X X X X
Intensity a (41) X X
Flea Burden* (63) X X X X
Flea spp. Burden a (65) X
Proportion Infested host spp. (65) X X X X X
No. Fleas a (67) X X X
No. Flea spp. a (67) X
Number host spp./Flea spp. a (65) X X
Proportion flea specialists (67) X X X X X X
Proportion flea generalists (67) X X X
a Log of the number of mammals captured/site was used as an offset variable. b Tukey’s Least Significant Difference (LSD) was used to control for Type I error.

55
Figure 2.1. Pearson correlation analysis for variables calculated from 63 studies conducted around the world. Scatter plots with loess (locally weighted scatterplot smoothing) lines are displayed above the diagonal and r values for significant associations (values in bold represent P<0.0001, otherwise 0.0009<P<0.03) are displayed below the diagonal. Stars indicate significant associations after variables were standardized for sampling effort and log transformed, but the plots reflect raw data. Descriptions of variables can be found in the text.
-0.30

56
Figure 2.2. Mean values for small mammal and flea variables from 63 studies categorized into three anthropogenic disturbance classes (low, intermediate, high) and four biomes (Forest , Grassland/Savanna ∙∙, Desert ∙∙∙∙∙∙, Mediterranean ─ ─ ─ ). P-values are for F-tests from Generalized Linear Model analysis of the overall model (y is a function of Disturbance class and Biome) and analyses of disturbance class within each Biome. Vertices without a common letter indicate statistically significant difference (P≤0.05 using Tukey-Kramer multiple comparison methods) among disturbance levels of that biome. Significant differences among biomes within a disturbance class are noted with circle symbols (significant differences are indicated by different fill shades).

57
Figure 2.3. Mean values for flea measures in small mammal communities from 63 studies categorized into three anthropogenic disturbance classes (low, intermediate, high) and four biomes (Forest , Grassland/Savanna ∙∙, Desert ∙∙∙∙∙, Mediterranean ─ ─ ─ ). P-values are for F-tests from Generalized Linear Model analysis of the overall model (y is a function of Disturbance class and Biome) and analyses of disturbance class within each Biome. Vertices without a common letter indicate statistically significant difference (P≤0.05 using Tukey-Kramer multiple comparison methods) among disturbance levels of that biome. Significant differences among biomes within a disturbance class are noted with circle symbols (significant differences are indicated by different fill shades.

58
CHAPTER 3: FLEA ABUNDANCE, DIVERSITY, AND PLAGUE IN GUNNISON'S PRAIRIE DOGS (CYNOMYS GUNNISONI) AND THEIR BURROWS IN MONTANE GRASSLANDS IN NORTHERN NEW MEXICO.

59
PREFACE- This chapter had been formatted for publication in the Journal of Wildlife Disease where it was published in the April, 2010 issue as “Flea abundance, diversity, and plague in Gunnison's prairie dogs (Cynomys gunnisoni) and their burrows in montane grasslands in northern New Mexico “by Megan M. Friggens, Robert R. Parmenter, Michael Boyden, Paulette L. Ford, Ken Gage, and Paul Keim.

60
FLEA ABUNDANCE, DIVERSITY, AND PLAGUE IN GUNNISON'S PRAIRIE DOGS (CYNOMYS GUNNISONI) AND THEIR BURROWS IN MONTANE GRASSLANDS IN
NORTHERN NEW MEXICO.
Abstract: Plague, a flea-transmitted infectious disease caused by the bacterium Yersinia
pestis, is a primary threat to the persistence of prairie dog populations (Cynomys spp.). In
this paper, we report the results of a three-year survey (2004-2006) of fleas taken from
Gunnison’s prairie dogs (Cynomys gunnisoni) and their burrows in montane grasslands
located in the Valles Caldera National Preserve in New Mexico. Our primary objectives
were to describe these flea communities and identify flea and rodent species important to
the maintenance and transfer of plague. We trapped prairie dogs and conducted burrow
sweeps at three colonies in the spring and summer of each year. One hundred and thirty
prairie dogs and 51 golden mantled ground squirrels (Spermophilus lateralis) were
captured over 3,640 trap nights and 320 burrows were swabbed for fleas. Five flea
species were identified from prairie dogs and ground squirrels and four were identified
from burrow samples. Oropsylla hirsuta was the most abundant species found on prairie
dogs and in burrows. Oropsylla idahoensis was most common on ground squirrels. Two
colonies experienced plague epizootics in the fall, 2004. Plague positive fleas were
recovered from burrows (Oropsylla hirsuta and O. tuberculata tuberculata) and a prairie
dog (Oropsylla hirsuta) in the spring of 2005 and summer of 2006. Three prairie dogs
collected in the summer of 2005 and 2006 had positive antibody titers. We found a
significant surge in flea abundance and prevalence, particularly within burrows,
following plague exposure. We noted an increased tendency for flea exchange
opportunities in the spring before O. hirsuta reached its peak population. We hypothesize
that spring conditions, which favor presence and exchange of certain flea species, may be

61
just as important for determining plague outbreaks as the summer conditions, which lead
to build up in O. hirsuta populations.

62
Introduction:
Plague is an infectious vector-borne disease caused by the bacterium Yersinia
pestis and transmitted between mammals by fleas (Biggins and Kosoy, 2001). Since its
introduction to the United States around 1899-1900, sylvatic plague has become
established in native rodent species and contributed to the precipitous decline of endemic
prairie dog (Cynomys spp.) populations (Gage and Kosoy, 2005; Cully and Williams,
2001). Prairie dogs are particularly susceptible to plague because they have no innate
immunity and live in large colonies with elaborate burrow systems that favor
reproduction and survival of the flea vector (Cully and Williams, 2001; Gage and Kosoy,
2005). Mortality rates in excess of 95% in exposed prairie dog colonies (Cully and
Williams, 2001) affect not only prairie dogs, but also prairie dog dependent species like
the black-footed ferret, Mustela nigripes (Houston et al., 1986). In addition, prairie dog
epizootics can amplify plague in an area by releasing large numbers of infected fleas into
the environment. Predators that are attracted to the sick and dead prairie dogs can become
infected by consuming these animals or as a result of being bitten by their fleas. Even
more importantly, predators can spread potentially infectious fleas to other sites,
including previously unaffected prairie dog colonies, thereby contributing to the local
spread of plague (Lechenleitner et al., 1968). Although we have yet to identify the
reservoir host and flea vector species important to the maintenance and spread of plague
within the United States, it is clear that prairie dog fleas are able to perpetuate plague
among colony members over the course of the epizootic (Webb et al., 2006; Wilder et al.,
2008). However, there is little evidence to suggest that these fleas, or the prairie dogs
themselves, can contribute to long-term plague maintenance cycles. Thus, research

63
focused on the factors that precede and lead to prairie dog plague epizootics must aim to
identify other host and flea species that maintain plague in the ecosystem and, ultimately,
transfer plague to prairie dog colonies.
Several rodent species have been proposed as enzootic or maintenance hosts,
including grasshopper mice (Onychomys spp.) on black-tailed prairie dog towns (C.
ludovicianus) and Peromyscus spp. in white-tailed (C. leucurus) and Gunnison’s prairie
dog towns (C. gunnisoni) (Gage et al., 1995; Thiagarajan et al., 2008). Others have
provided evidence for maintenance cycles that involve soil or flea stages (Lechleitner et
al., 1968; Ayyadurai et al., 2008; Eisen et al., 2008). The most likely long-term scenario
involves several factors and relies on a suite of animals, all connected by flea vectors
(Biggins and Kosoy, 2001). In general, flea species are more likely to spread plague if
they have a high susceptibility to Y. pestis and exhibit low host specificity (Gage and
Kosoy, 2005). However, low efficiency vectors may actually be quite important to spread
of plague if they are common in the environment (Kartman et al., 1962; Lechleitner et al.,
1968, Eisen et al., 2006). Indeed flea abundance is positively related to flea species vector
potential for plague (Krasnov et al., 2006) and abundance and prevalence of flea species
is an important determinant of Y. pestis transmission in particular (Eisen et al., 2006;
Lorange, 2005).
In this paper, we report the results of a three-year survey of flea populations taken
from Gunnison’s prairie dogs and their burrows in montane grassland habitats located in
the Valles Caldera National Preserve (VCNP) in New Mexico. We also analyzed flea and
prairie dog blood samples for the presence of plague. Our primary objectives were to
describe the flea communities within the VCNP prairie dog towns, compare animal and

64
burrow flea loads across years and seasons in sites with and without plague, and identify
flea species, which may be important to the maintenance or transfer of plague within this
population.
Materials and Methods:
Site descriptions- The study was conducted on the Valles Caldera National Preserve,
Sandoval County, New Mexico. The study areas were located in montane grassland
habitat, with elevations ranging between 2,460 m and 2,640 m. Annual precipitation
averages 638 mm, with approximately 45% falling during the summer monsoon season
(July-September). Mean annual temperature is 4.5° C, with mean July temperatures of
15° C and mean January temperatures of -5.3° C. Three grassland habitats with prairie
dog towns were selected for sampling (Fig. 3.1): Redondo Meadow (N 35˚51’33”, W
106˚36’15”), El Cajete (N 35˚50’18”, W 106˚33’33”), and Valle Grande (N 35˚51’21”,
W 106˚29’29”). The Redondo Meadow site (2,459 m) vegetation was dominated by
Bouteloua gracilis, Potentilla hippiana, Erigeron flagellaris, Artemisia carruthii, and
Polygonum douglasii. Soils on this site were classified as fine, smectitic, superactive,
frigid, Vertic Argialboll (Lyquilar series). The El Cajete site (elevation 2,638 m)
vegetation was dominated by Bromus inermis, P. hippiana, Taraxacum officinale,
Erigeron flagellaris, and Achillea millefolium. Soils on this site were ashy, glassy, frigid,
Vitrandic Argiustoll (Jarmillo series). The Valle Grande site (elevation 2,590 m)
vegetation was dominated by Festuca arizonica, Koelaria macrantha, Poa pratensis,
Muhlenbergia montana, P. hippiana, Carex spp., and Antennaria rosea. Soils on this site
were classified as loamy over ashy-pumiceous, mixed over glassy, superactive, frigid
Vitrandic Argisutoll (Vallande series).
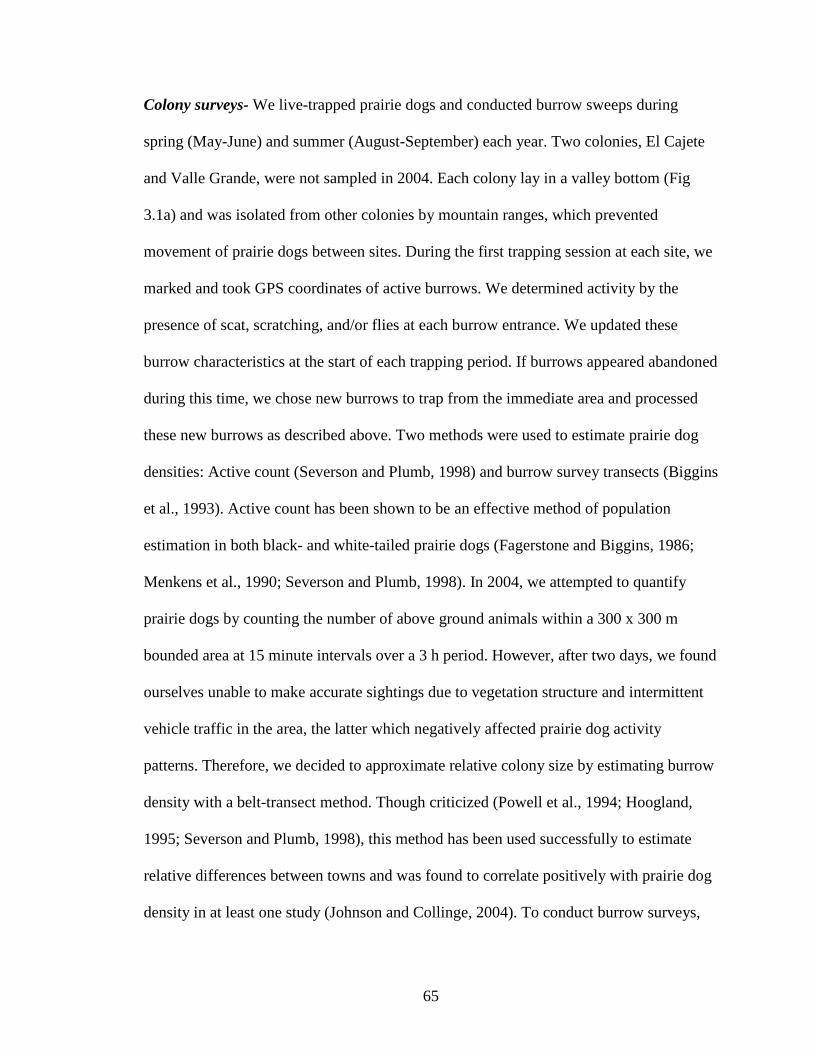
65
Colony surveys- We live-trapped prairie dogs and conducted burrow sweeps during
spring (May-June) and summer (August-September) each year. Two colonies, El Cajete
and Valle Grande, were not sampled in 2004. Each colony lay in a valley bottom (Fig
3.1a) and was isolated from other colonies by mountain ranges, which prevented
movement of prairie dogs between sites. During the first trapping session at each site, we
marked and took GPS coordinates of active burrows. We determined activity by the
presence of scat, scratching, and/or flies at each burrow entrance. We updated these
burrow characteristics at the start of each trapping period. If burrows appeared abandoned
during this time, we chose new burrows to trap from the immediate area and processed
these new burrows as described above. Two methods were used to estimate prairie dog
densities: Active count (Severson and Plumb, 1998) and burrow survey transects (Biggins
et al., 1993). Active count has been shown to be an effective method of population
estimation in both black- and white-tailed prairie dogs (Fagerstone and Biggins, 1986;
Menkens et al., 1990; Severson and Plumb, 1998). In 2004, we attempted to quantify
prairie dogs by counting the number of above ground animals within a 300 x 300 m
bounded area at 15 minute intervals over a 3 h period. However, after two days, we found
ourselves unable to make accurate sightings due to vegetation structure and intermittent
vehicle traffic in the area, the latter which negatively affected prairie dog activity
patterns. Therefore, we decided to approximate relative colony size by estimating burrow
density with a belt-transect method. Though criticized (Powell et al., 1994; Hoogland,
1995; Severson and Plumb, 1998), this method has been used successfully to estimate
relative differences between towns and was found to correlate positively with prairie dog
density in at least one study (Johnson and Collinge, 2004). To conduct burrow surveys,

66
we used a Trimble© GPS unit (Trimble Navigation Ltd, 2009, Worldwide) to track our
path as we walked the perimeter of each colony and to calculate area based on that
perimeter. We marked the boundary with pin flags and then walked a series of randomly
placed 100 x 2 m transects until we had covered 10% of the colony area. We counted and
classified (active or not) all burrows that fell within 2 m swath of the transect line by
carrying a 2 m piece of polyvinyl chloride (pvc) pipe perpendicular to the transect and
parallel to the ground as we walked along a 100 m measuring tape.
Rodent trapping-Two to four Tomahawk® live traps (Size #70, Tomahawk Live Trap
Company, Tomahawk, WI, USA) were set around each burrow for a total of 76-104 traps
per colony. Traps were baited with a combination of rolled oats and sweet feed and wired
open for at least 4 days prior to trapping to acclimatize prairie dogs to traps. Prairie dogs
were trapped for three consecutive days following the prebaiting period. Traps were
opened and baited before sunrise (approx. 0530 hr) each morning and checked between
0830-0930 hr. Depending on capture success and weather conditions, traps were
sometimes left open and checked every 45 minutes until 1200 hr. At a processing station
removed from the trapping site, each prairie dog was weighed to the nearest gram with a
Pesola® scale (Pesola AG, Rebmattli, Switzerland), sexed, and given a uniquely
numbered ear tag (Gey Band and Tag Co., Norristown, PA, USA). Animals were
processed with the aid of canvas cones described in Hoogland (2005). Blood samples
were collected by clipping a toenail on a rear foot just distal to the quick and blotting the
blood onto a Nobuto filter strip (Toyo Roshi Kaisha, Ltd., Tokyo, Japan). Toenails were
thoroughly cleaned with alcohol pads before clipping and treated with a sulfur compound
(styptic) after clipping to prevent infection. Nobuto strips were air dried and put into an

67
envelope for short-term storage. Fleas were collected by holding each animal over a
plastic basin containing a 20 x 20 cm felt cloth and thoroughly brushing the fur with a
flea comb and/or toothbrush until all observed fleas had fallen into the basin. Fleas were
then collected from the felt cloth, placed into a labeled cryovial and flash frozen in liquid
nitrogen (-70˚C). After processing, prairie dogs were returned to their trap and released at
the site of capture. Prairie dogs were processed only during the first capture of each
trapping period. Animal handling procedures were approved by the Animal Care and Use
Committee of the University of New Mexico (04MCC002). Blood and flea samples were
processed under the guidelines and standardized protocols for the safe handling of
biohazard material where appropriate (Mills et al., 1995; Keim lab, NAU, Flagstaff,
Arizona and CDC, Ft Collins, Colorado unpublished protocols)
Burrow sampling-Fleas were collected from burrows just prior to, or following, prairie
dog trapping. Twenty burrows were swabbed at each site and during each season by
attaching a white flannel cloth (20 x 20 cm) to the end of a plumber’s snake and
extending the cloth down into burrow to depth of at least 1 m. After 30 seconds, the cloth
was removed, put into a 1 gal plastic zipper-seal bag, sealed and placed in a cooler with
dry ice. Burrow sweep cloths were kept frozen until examination. Each felt cloth was
carefully examined for ectoparasites using a dissecting microscope or magnifying glass.
All ectoparasites were stored in labeled cryovials and kept frozen until laboratory
analysis.
Flea Identification- Fleas were examined under a dissecting microscope and identified to
genus, species or subspecies according to Furman and Catts (1982), Hubbard (1947) and
Lewis (2002). Voucher specimens of each flea species were deposited in the Division of

68
Vector-borne Infectious Diseases of the Center for Disease Control and Prevention in
Fort Collins, Colorado.
Plague tests- Blood samples were analyzed for the presence of F1 plague antibodies
using a standard passive hema-agglutination (PHA) test (Williams et al., 1976; Chu,
2000). Briefly, blood samples were eluted overnight in a 1M Sodium Borate solution and
a 25ul volume of the eluant was used for PHA analysis. Positive samples were confirmed
with passive hema-inhibition (PHI) tests. Seropositive results were recorded as reciprocal
titers, denoting the concentrations as determined by titration. Reciprocal titers below 1:32
were considered nonspecific and not positive.
Fleas were examined for the presence of plague using a multiplex PCR reaction as
described in Stevenson et al. (2007). This analysis targets a region of the plasminogen
(pla) activator gene of Yersinia pestis (478-basepairs). Most fleas were analyzed
individually for the presence of Y. pestis DNA. However, for nine hosts and two burrows
that yielded >25 fleas only the first five individuals were analyzed individually. The
remaining fleas (104 fleas) were analyzed in pools of 2 to 5 fleas each. DNA was
obtained from the first 30 fleas by triturating individual fleas in 100ul BHI (Becton
Dickenson, Sparks, MD, USA). The remaining fleas were processed with a DNA
extraction procedure described in Allender et al. (2004). Following processing, 2.5ul of
triturate or extracted DNA was used for PCR analysis.
Statistical Analysis- We did not compare flea abundance and prevalence across the sites
because we surveyed colonies that were accessible by vehicle rather than randomly
selecting among all available colonies in the VCNP. We assessed differences in flea

69
abundance and flea prevalence between sampling periods, seasons (spring vs. summer),
and years across all sites and within each site using generalized linear model analysis
(PROC GLIMMIX, Statistical Analysis Software, SAS 9.2). For comparisons across all
sites, we included colony as a random effect in our model. Prevalence data was analyzed
with a binomial distribution and logit link, whereas abundance data was analyzed with a
Gaussian distribution and log link. Statistical significance was set at P < 0.05 and Tukey
adjusted p-values were used to reduce the likelihood of Type I errors.
Results:
The Redondo Meadow colony encompassed approximately 14 ha with an average
of 273 active burrows/ha, El Cajete was 15 ha with 60 active burrows/ha, and Valle
Grande was 2.7 ha with 120 burrows/ha.
One hundred and thirty prairie dogs were captured over 3,640 trap nights
(including 22 recaptures). The majority (107 including 10 recaptures) were from
Redondo meadow, 22 (including 1 recapture) were from Valle Grande, and none were
caught in El Cajete. In addition, 51 golden mantled ground squirrels (Spermophilus
lateralis) were captured from El Cajete (40 including 5 recaptures) and Valle Grande (11
including 1 recapture). Voucher specimens of three S. lateralis were deposited in the
Museum of Southwestern Biology, University of New Mexico, Albuquerque, New
Mexico (NK143015, NK 143434, and NK143450).
Prairie dogs were abundant in Redondo during 2004 (72 captures), but few
animals emerged from burrows the following spring, 2005. By summer of 2005, many
burrows began showing obvious signs of decline, and capture success was low (5

70
animals). The population appeared to be in recovery in 2006 and we captured 10 and 15
prairie dogs in the spring and summer, respectively. El Cajete was reported to have a
large and active population of prairie dogs in 2004 (pers. comm., R.R. Parmenter). When
trapping began there in spring of 2005, over 100 burrows were surveyed and, though
open, very few appeared to be occupied by prairie dogs. Many additional burrows had
blocked entrances. Trapping efforts yielded no prairie dogs, but 25 golden mantled
ground squirrels were caught in traps laid around prairie dog burrows. No prairie dogs
and only 15 squirrels were captured from El Cajete in 2006. Valle Grande had small but
stable populations of prairie dogs and ground squirrels over the course of this study, with
14 and eight prairie dog captures and six and five squirrel captures for 2005 and 2006,
respectively.
We collected 633 fleas from prairie dogs, 167 fleas from prairie dog burrows, and
66 fleas from golden mantled ground squirrels (Table 3.1). Golden mantled ground
squirrels were not sufficiently sampled for further analysis. Prevalence and abundance
were positively correlated across sites and years for both prairie dogs (r2=0.61, P=0.007,
df=9) and burrows (r2=0.63, P=0.0007, df=13). Trends in flea abundance and prevalence
between prairie dogs and burrows were similar in Redondo Meadow prior to plague, but
did not correspond after plague outbreaks. Trends in flea abundance and prevalence were
not similar for prairie dogs and burrows at other sites.
Across all sites, mean abundance (number fleas/sample ± StDev) and prevalence
(% infested) were 4.89 ±8.31 and 65% for prairie dogs and 0.62±2.79 and 18% for
burrow samples. Annual flea abundance on prairie dogs was significantly greater in 2006
(6.4±7.74) than 2005 (5.2±10.4) and 2004 (4.1±7.74) (P = 0.04, df =3). Annual
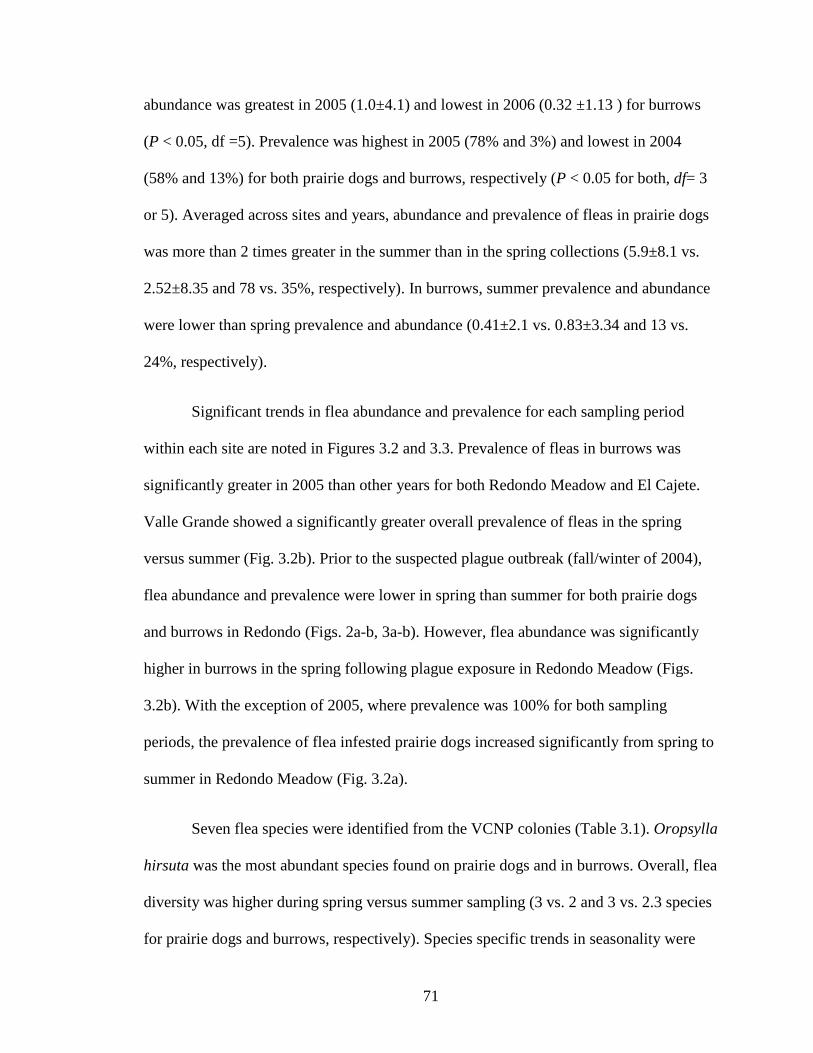
71
abundance was greatest in 2005 (1.0±4.1) and lowest in 2006 (0.32 ±1.13 ) for burrows
(P < 0.05, df =5). Prevalence was highest in 2005 (78% and 3%) and lowest in 2004
(58% and 13%) for both prairie dogs and burrows, respectively (P < 0.05 for both, df= 3
or 5). Averaged across sites and years, abundance and prevalence of fleas in prairie dogs
was more than 2 times greater in the summer than in the spring collections (5.9±8.1 vs.
2.52±8.35 and 78 vs. 35%, respectively). In burrows, summer prevalence and abundance
were lower than spring prevalence and abundance (0.41±2.1 vs. 0.83±3.34 and 13 vs.
24%, respectively).
Significant trends in flea abundance and prevalence for each sampling period
within each site are noted in Figures 3.2 and 3.3. Prevalence of fleas in burrows was
significantly greater in 2005 than other years for both Redondo Meadow and El Cajete.
Valle Grande showed a significantly greater overall prevalence of fleas in the spring
versus summer (Fig. 3.2b). Prior to the suspected plague outbreak (fall/winter of 2004),
flea abundance and prevalence were lower in spring than summer for both prairie dogs
and burrows in Redondo (Figs. 2a-b, 3a-b). However, flea abundance was significantly
higher in burrows in the spring following plague exposure in Redondo Meadow (Figs.
3.2b). With the exception of 2005, where prevalence was 100% for both sampling
periods, the prevalence of flea infested prairie dogs increased significantly from spring to
summer in Redondo Meadow (Fig. 3.2a).
Seven flea species were identified from the VCNP colonies (Table 3.1). Oropsylla
hirsuta was the most abundant species found on prairie dogs and in burrows. Overall, flea
diversity was higher during spring versus summer sampling (3 vs. 2 and 3 vs. 2.3 species
for prairie dogs and burrows, respectively). Species specific trends in seasonality were

72
apparent among the fleas though patterns did not correspond between animals and
burrows (Table 3.1). Plague positive fleas were recovered from two burrows (2-
Oropsylla hirsuta, 1-O. t. tuberculata) and one prairie dog (1-Oropsylla hirsuta) from
Redondo Meadow during the spring, 2005. Three prairie dogs collected in the summer of
2005 had positive antibody titers: one from Redondo Meadow with a titer of 1:256 and
two from Valle Grande each with titers of 1:1024. Plague was detected again in the
summer of 2006 in fleas (1-O. hirsuta) recovered from a burrow in El Cajete, and from a
prairie dog (14-O. hirsuta) captured in Redondo Meadow. Two prairie dogs from
Redondo Meadow (one recapture) showed positive titers (1:512 and 1:2048) to plague in
the spring of 2006.
Discussion:
During this study, plague epizootics occurred in two of three colonies. Though we
found plague antibodies in two prairie dogs captured at Valle Grande, there were no other
overt signs, such as infected fleas or prairie dog die-off, of a plague epizootic in this
colony. In contrast, the prairie dogs inhabiting Redondo Meadow and El Cajete
experienced severe population declines and both fleas and prairie dogs were found with
recent exposure to plague. We were only able to detect plague immediately following the
prairie dog population crash, an observation that is similar to those reported for other
Gunnison's colonies (Lechleitner et al., 1968), but stands in contrast to trends reported for
white-tailed prairie dogs (Anderson and Williams, 1997).
We found that the number of fleas per host and per infested host and burrow were
higher in plague-affected than non-affected colonies. Anderson and Williams (1997)
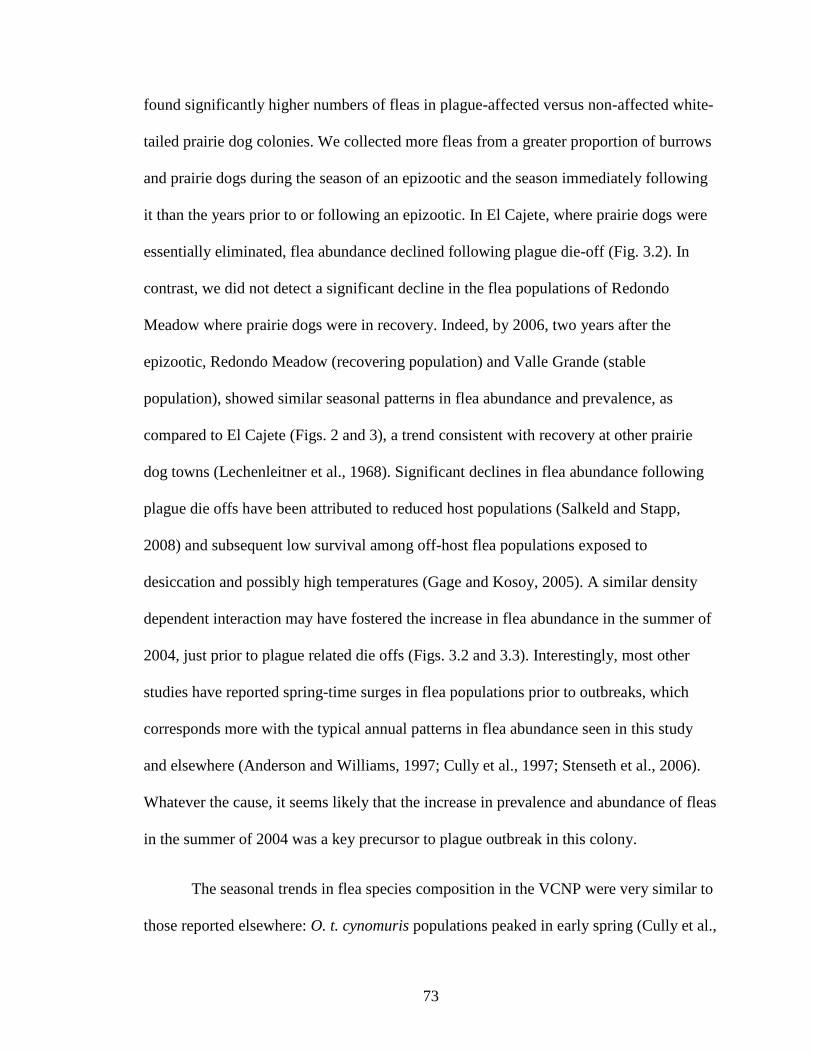
73
found significantly higher numbers of fleas in plague-affected versus non-affected white-
tailed prairie dog colonies. We collected more fleas from a greater proportion of burrows
and prairie dogs during the season of an epizootic and the season immediately following
it than the years prior to or following an epizootic. In El Cajete, where prairie dogs were
essentially eliminated, flea abundance declined following plague die-off (Fig. 3.2). In
contrast, we did not detect a significant decline in the flea populations of Redondo
Meadow where prairie dogs were in recovery. Indeed, by 2006, two years after the
epizootic, Redondo Meadow (recovering population) and Valle Grande (stable
population), showed similar seasonal patterns in flea abundance and prevalence, as
compared to El Cajete (Figs. 2 and 3), a trend consistent with recovery at other prairie
dog towns (Lechenleitner et al., 1968). Significant declines in flea abundance following
plague die offs have been attributed to reduced host populations (Salkeld and Stapp,
2008) and subsequent low survival among off-host flea populations exposed to
desiccation and possibly high temperatures (Gage and Kosoy, 2005). A similar density
dependent interaction may have fostered the increase in flea abundance in the summer of
2004, just prior to plague related die offs (Figs. 3.2 and 3.3). Interestingly, most other
studies have reported spring-time surges in flea populations prior to outbreaks, which
corresponds more with the typical annual patterns in flea abundance seen in this study
and elsewhere (Anderson and Williams, 1997; Cully et al., 1997; Stenseth et al., 2006).
Whatever the cause, it seems likely that the increase in prevalence and abundance of fleas
in the summer of 2004 was a key precursor to plague outbreak in this colony.
The seasonal trends in flea species composition in the VCNP were very similar to
those reported elsewhere: O. t. cynomuris populations peaked in early spring (Cully et al.,
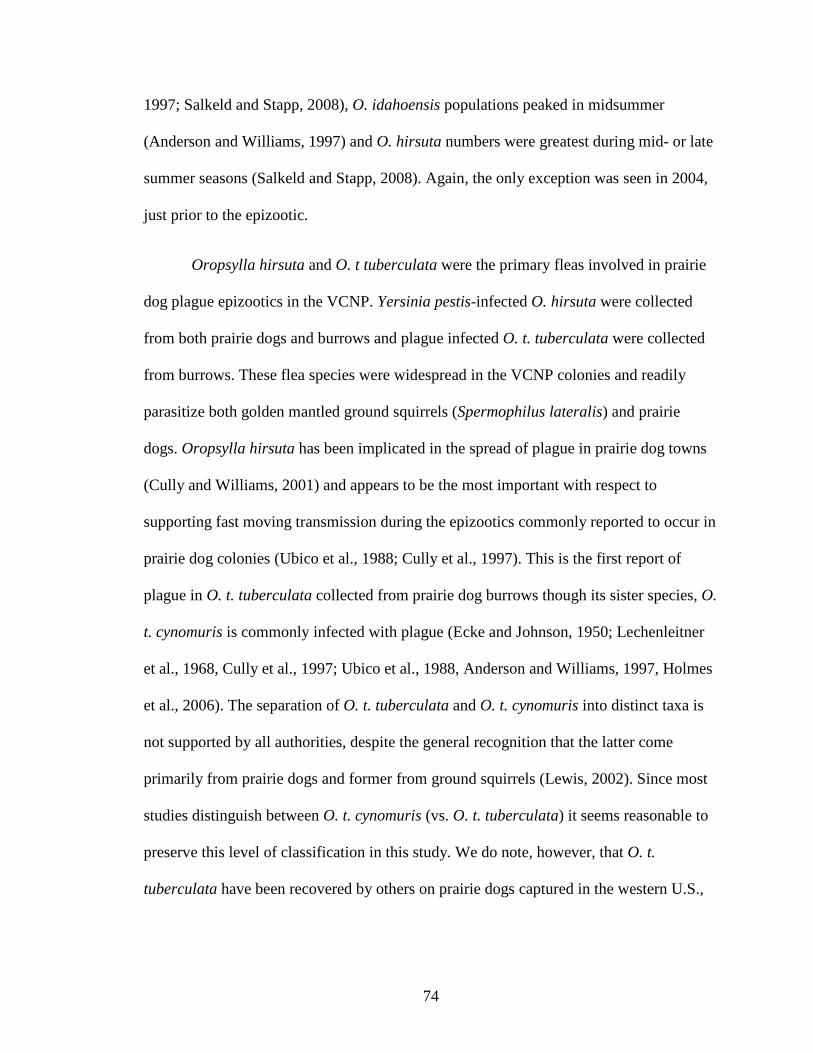
74
1997; Salkeld and Stapp, 2008), O. idahoensis populations peaked in midsummer
(Anderson and Williams, 1997) and O. hirsuta numbers were greatest during mid- or late
summer seasons (Salkeld and Stapp, 2008). Again, the only exception was seen in 2004,
just prior to the epizootic.
Oropsylla hirsuta and O. t tuberculata were the primary fleas involved in prairie
dog plague epizootics in the VCNP. Yersinia pestis-infected O. hirsuta were collected
from both prairie dogs and burrows and plague infected O. t. tuberculata were collected
from burrows. These flea species were widespread in the VCNP colonies and readily
parasitize both golden mantled ground squirrels (Spermophilus lateralis) and prairie
dogs. Oropsylla hirsuta has been implicated in the spread of plague in prairie dog towns
(Cully and Williams, 2001) and appears to be the most important with respect to
supporting fast moving transmission during the epizootics commonly reported to occur in
prairie dog colonies (Ubico et al., 1988; Cully et al., 1997). This is the first report of
plague in O. t. tuberculata collected from prairie dog burrows though its sister species, O.
t. cynomuris is commonly infected with plague (Ecke and Johnson, 1950; Lechenleitner
et al., 1968, Cully et al., 1997; Ubico et al., 1988, Anderson and Williams, 1997, Holmes
et al., 2006). The separation of O. t. tuberculata and O. t. cynomuris into distinct taxa is
not supported by all authorities, despite the general recognition that the latter come
primarily from prairie dogs and former from ground squirrels (Lewis, 2002). Since most
studies distinguish between O. t. cynomuris (vs. O. t. tuberculata) it seems reasonable to
preserve this level of classification in this study. We do note, however, that O. t.
tuberculata have been recovered by others on prairie dogs captured in the western U.S.,
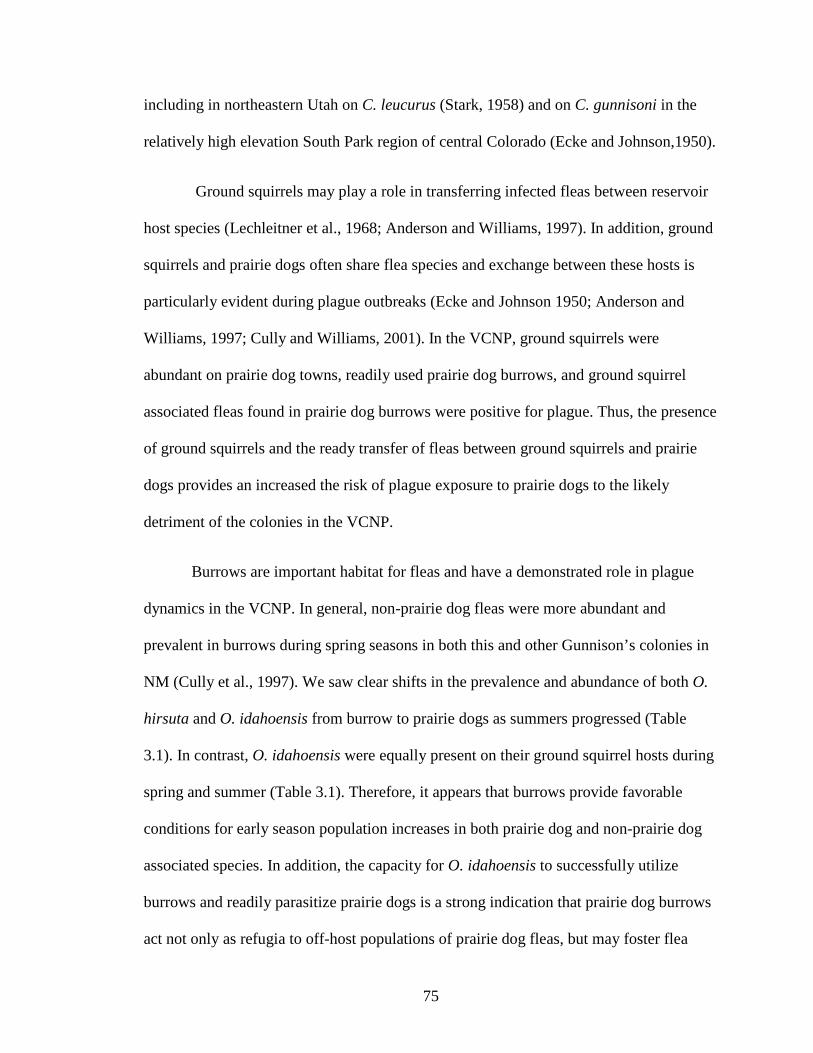
75
including in northeastern Utah on C. leucurus (Stark, 1958) and on C. gunnisoni in the
relatively high elevation South Park region of central Colorado (Ecke and Johnson,1950).
Ground squirrels may play a role in transferring infected fleas between reservoir
host species (Lechleitner et al., 1968; Anderson and Williams, 1997). In addition, ground
squirrels and prairie dogs often share flea species and exchange between these hosts is
particularly evident during plague outbreaks (Ecke and Johnson 1950; Anderson and
Williams, 1997; Cully and Williams, 2001). In the VCNP, ground squirrels were
abundant on prairie dog towns, readily used prairie dog burrows, and ground squirrel
associated fleas found in prairie dog burrows were positive for plague. Thus, the presence
of ground squirrels and the ready transfer of fleas between ground squirrels and prairie
dogs provides an increased the risk of plague exposure to prairie dogs to the likely
detriment of the colonies in the VCNP.
Burrows are important habitat for fleas and have a demonstrated role in plague
dynamics in the VCNP. In general, non-prairie dog fleas were more abundant and
prevalent in burrows during spring seasons in both this and other Gunnison’s colonies in
NM (Cully et al., 1997). We saw clear shifts in the prevalence and abundance of both O.
hirsuta and O. idahoensis from burrow to prairie dogs as summers progressed (Table
3.1). In contrast, O. idahoensis were equally present on their ground squirrel hosts during
spring and summer (Table 3.1). Therefore, it appears that burrows provide favorable
conditions for early season population increases in both prairie dog and non-prairie dog
associated species. In addition, the capacity for O. idahoensis to successfully utilize
burrows and readily parasitize prairie dogs is a strong indication that prairie dog burrows
act not only as refugia to off-host populations of prairie dog fleas, but may foster flea
76
exchange among hosts. This may also be a mechanism for flea exchange between prairie
dogs and other species such as the American badger, black-footed ferrets, and burrowing
owls known to inhabit prairie dog burrows (Hoogland, 2005 and references therein).
Fleas are thought to play an important role in the maintenance of plague over time
and are the primary mechanism by which plague is transmitted among hosts (Gage and
Kosoy, 2005). At least two prairie dog fleas have been found in burrows and infected
with plague up to a year after an epizootic (Lechleitner et al., 1968), implicating a
significant role in plague maintenance cycles. However, the low resistance of prairie dogs
to plague means that these fleas are unlikely to maintain plague in any kind of enzootic
cycle. On the other hand, burrows harbor plague infected fleas of many species for at
least many months following the occurrences of epizootics (Lechleitner et al., 1968;
Cully et al., 1997; Ubico et al., 1988; Anderson and Williams, 1997; Holmes et al.,
2006). Also, the immigration of other rodent species into areas that have previously
experienced plague epizootics (as reported by Ecke and Johnson, 1950 and Lechleitner et
al., 1962) would allow fleas to continue to transmit plague to new animals. The findings
of this study support the conclusion of Cully and Williams (2001) that prairie dog
burrows provide ample opportunity for the interspecific spread of Y. pestis between
prairie dogs and other animals. In addition, recent evidence for the persistence of plague
in soil may point to a more direct role of burrows in providing refuge for plague
pathogens (Ayyadurai et al., 2008; Eisen et al., 2008).
Environmental conditions which differentially favor flea species or favor flea
reproduction will influence the spread and intensity of epizootics (Rayor, 1985; Ubico et
al., 1998). The ready exchange of cool weather flea species like O. t. tuberculata, O. t.
77
cynomuris, and O. idahoensis, between ground squirrel and prairie dog hosts and the
tendency for O. hirsuta, a warm weather species, to support explosive epizootics in
prairie dogs towns suggests that seasonal shifts in flea species composition influences the
persistence and spread of plague. A mild winter followed by early onset of spring might
allow larger populations of fleas to persist in burrows and increase the likelihood of
disease exchange between prairie dogs and other mammals which utilize prairie dog
burrows. Similarly, an early onset of summer conditions might favor early emergence and
population increases of O. hirsuta, creating conditions that readily support the spread of
plague epizootics. Therefore, warming trends that shorten winters and lead to longer
summers might increase the probability of both exchange and build up of flea species that
transmit plague and lead to more epizootics (Stenseth et al., 2006). Thus far, studies that
compare prairie dog epizootics with respect to weather have not considered the species-
specific implications of weather effects on prairie dog fleas (Stapp et al., 2004; Stenseth
et al., 2006).
In conclusion, prairie dog burrows are an important component of plague cycles
as a source for infectious off-host fleas, a site of flea exchange, and potentially by
harboring the plague pathogen itself in the soils of the burrows. In addition, the ready
exchange of fleas between ground squirrels and other species, in particular, prairie dogs,
effectively increases prairie dog exposure to fleas and flea-borne pathogens and the
likelihood of interspecific flea transfer in areas where Spermophilus and Cynomys
coexist.
Acknowledgments: John Montieneri provided training for the identification of fleas.
Kelly Sheff, Ying Bai and Christina Moray provided laboratory assistance/training. Lab
78
space and equipment were proved by the Keim genetics lab at Northern Arizona
University (Chris Allender, Dave Wagner), the laboratories of Don Duszynski, Sam
Loker, and Joe Cook at the University of New Mexico, UNM's MSB arthropod and tissue
collections division (Sandra Brantley, David Lightfoot, Cheryl Parmenter), the UNM
molecular facility (George Rosenburg, Jennifer Hathaway) and the Sevilleta Long Term
Ecological Research Program and Wildlife Refuge. We thank the technicians who
assisted with burrow sweeps and prairie dog captures: Ana Oyer, Mary Brandenburg,
Levi Parks, Alexei Wajchman, Sara Noel Ross, and Leif Emkeit. Mike T. Friggens
created Figure 1. This research was funded by the Ecology of Infectious Diseases
program at NSF/NIH EID (EF-0326757), Sevilleta LTER Graduate Student Fellowships,
and the USDA Forest Service Rocky Mountain Research Station.
Addendum Note: The significant increase in prevalence of fleas on prairie dogs and burrows following plague outbreak is likely a result of the sudden loss of host animals. The flea population is suddenly focused on a few remaining individuals and are more prone to collection by burrow sweeps.

79
Literature Cited:
ALLENDER, C. J., W. R. EASERDAY, M. N. WANERT, D. M. WAGNER, AND P. KEIM. 2004. High-throughput extraction of arthropod vector and pathogen DNA using bead milling. Biotechniques 37: 730-734.
ANDERSON, S. H., AND E. WILLIAMS. 1997. Plague in a complex of white-tailed prairie dogs and associated small mammals in Wyoming. Journal of Wildlife Diseases 33: 720-732.
AYYADURAI, S., L.HOUHAMDI, H. LEPIDI, C. HAPPEZ, D. RAOULT, AND M. DRANCOURT. 2008. Long-term persistence of virulent Yersinia pestis in soil. Microbiology 154: 2865-2871.
BIGGINS, D. E., MILLER, B. J., HANEBURY, L. R., OAKLEAF, B., FARMER, A. H., CRETE, R., AND A. DOOD. 1993. A technique for evaluating black footed ferret habitat. In Proceedings of the symposium on the management of prairie dog complexes for the reintroduction of the black-footed ferret, J. L. Odemeyer, D. E. Biggins and B. J. Miller (eds.). Biological Report 13US Fish and Wildlife Service, WA, D.C., pp. 73-88.
_______ AND M.Y. KOSOY. 2001. Influences of introduced plague on North American mammals: implications from ecology of plague in Asia. Journal of Mammalogy 82: 906-916.
CULLY, J. F., A. M. BARNES, T. J. QUAN, AND G. MAUPIN. 1997. Dynamics of plague in a Gunnison’s prairie dog colony. Journal of Wildlife Diseases 33: 706-718.
_________, AND E. S. WILLIAMS. 2001. Interspecific comparisons of sylvatic plague in prairie dogs. Journal of Mammalogy 82: 894-905.
CHU, M. C. 2000. Laboratory Manual of Plague Diagnostic Tests. Centers for Disease Control and Prevention, Atlanta, Georgia and World Health Organization, Geneva, Switzerland. 1-129.
ECKE, D. H., AND C. W. JOHNSON. 1950. Sylvatic plague in Park County, Colorado. Transactions of the North American Wildlife Conference 15: 191-197.
EISEN, R. J., S.W. BEARDEN, A. P. WILDER, J. A. MONTENIERI, M. F. ANTOLIN, AND K. L. GAGE. 2006. Early-phase transmission of Yersinia pestis by unblocked fleas as a mechanism explaining rapidly spreading plague epizootics. Proceedings of the National Academy of Science 103: 15380-15385.
_________, J. M. PETERSEN, M. S. HIGGINS, D. WONG, C. E. LEVY, P. S. MEAD, M. E.
SCHRIEFER, K. S. GRIFFIN, K. L. GAGE, AND C. B. BEARD. 2008. Persistence of Yersinia pestis in soil under natural conditions. Emerging Infectious Disease 14: Available from http://www.cdc.gov/EID/content/14/6/941.htm
80
FAGERSTONE, K. A., AND D. E. BIGGINS. 1986. Comparison of capture-recapture and visual count indices of prairie dog densities in black-footed ferret habitat. Great Basin Naturalist Memoirs 8: 94-98.
FURMAN , D. P., AND E. P. CATTS. 1982. Manual of Medical Entomology, 4th ed. Cambridge University Press, Cambridge, 207 pp. (Chapter 18. Siphonaptera, pp. 138-157.)
GAGE, K. L., AND M. Y. KOSOY. 2005. Natural History of plague: perspectives from more than a century of research. Annual Review of Entomology 50: 505-528.
__________, R. S. OSTFELD, AND J. G. OLSON. 1995. Nonviral vector-borne zoonoses associated with mammals in the United States. Journal of Mammalogy 76: 695-715.
HOLMES, B. E., K. R. FORESMAN, AND M. R. MATCETT. 2006. No evidence of persistent Yersina pestis infection at prairie dog colonies in North-central Montana. Journal of Wildlife Diseases 42: 164-169.
HOOGLAND, J. L., 1995. The black-tailed prairie dog: social life of a burrowing mammal. TheUniversity of Chicago Press, Chicago, p557.
_________, 2005. Conservation of the black-tailed prairie dog: Saving North America's western grasslands. Island Press, p350.
HOUSTON, B. R., T. W. CLARK, AND S. C. MINTA. 1986. Habitat suitability index model for the black-footed ferret: A method to locate transplant sites. Great Basin Naturalist Memoirs 8: 99-114.
JOHNSON, W. C., AND S. K. COLLINGE. 2004. Landscape effects on black-tailed prairie dog colonies. Biological Conservation 115: 487-497.
HUBBARD, C. A. 1947. Fleas of Western North America. The Iowa State College Press, Ames, Iowa. pp 533.
JOHNSON, W. C., AND S. K. COLLINGE. 2004. Landscape effects on black-tailed prairie dog colonies. Biological Conservation 115: 487-497.
KARTMAN, L., QUAN, S. F., AND R. R. LECHLEITNER. 1962. Die-off of a Gunnison’s prairie dog colony in central Colorado. Zoonoses Research 12: 201-224.
KRASNOV, B. R., G. I. SHENBROT, D. MOUILLOT, I. S. KHOKHLOVA, AND R. POULIN. 2006. Ecological characteristics of flea species relate to their suitability as plague vectors. Oecologia 149: 474-481. LECHLEITNER, R. R., J. V. TILESTON, AND L. KARTMAN. 1962. Die-off of a Gunnison’s prairie dog colony in central Colorado: I. Ecological observations and description of the epizootic. Zoonoses Research 1: 185-199.

81
___________, L. KARTMAN, M. I. GODENBERG, AND B. W. HUDSON. 1968. An epizootic of plague in Gunnison’s prairie dogs (Cynomys gunnisoni) in south-central Colorado. Ecology 49: 734-743.
LEWIS, R. E. 2002. A review of the North America species of Oropsylla Wagner and Ioff, 1926 (Siphonaptera: Ceratophyllidea: Ceratophyllinae). Journal of Vector Ecology 27: 184-206.
LORANGE, E. A. 2005. Poor vector competence of fleas and the evolution of hypervirulence in Yersinia pestis. Journal of Infectious Disease 191: 1907-1912.
MENKENS, G. E. JR ., B. J. MILLER, AND S. H. ANDERSON. 1990. Visual counts as an index of white tailed prairie dog density. Wildlife Society Bulletin 83: 290-296.
MILLS J. N., T. L. YATES, J. E. CHILDS, R. R. PARMENTER, T. G. KSIAZEK, P. E. ROLLIN, AND C. J. PETERS. 1995. Guidelines for working with rodents potentially infected with Hantavirus. Journal of Mammalogy 76: 716-722.
PERRY, R. D., AND J. D. FETHERSTON. 1997. Yersinia pestis-Etiologic agent of plague. Clinical Microbiology Reviews 10: 35-66.
POWELL, K. L., R. J. ROBEL, K. E. KEMP, AND M. D. NELLIS. 1994. Above ground counts of black-tailed prairie dogs: Temporal nature and relationship to burrow entrance density. Journal of Wildlife Management 58: 361-366.
RAYOR, L. S. 1985. Dynamics of a plague outbreak in Gunnison’s prairie dog. Journal of Mammalogy 66: 194-196.
SALKELD, D. J., AND P. STAPP. 2008. Prevalence and abundance of fleas in black-tailed prairie dog burrows: Implications for the transmission of plague (Yersinia pestis). Journal of Parasitology 94: 616-621.
SEVERSON, K. E., AND G. E. PLUMB. 1998. Comparison of methods to estimate population densities of black-tailed prairie dogs. Wildlife Society Bulletin 1998: 859-866.
STAPP, P., M. F. ANTOLIN, AND M. BALL. 2004. Patterns of extinction in prairie dog metapopulations: plague outbreaks follow El Nino events. Frontiers in Ecology: 2: 235-240. STARK, H. E. 1958. The Siphonaptera of Utah. United States Department of Health, Education, and Welfare, Communicable Disease Center, Atlanta, Georgia. STENSETH, N. C., N. I. SAMIA, H. VILJUGREIN, K. L. KAUSRUD, M. BEGON, S. DAVIS, H. LEIRS, V. M. DUBYANSKIY, J. ESPER,V. S. AGEYEV, N. L. KLASSOVKIY, B.P. SERGEY, AND K-L. CHAN. 2006. Plague dynamics are driven by climate variation. Proceedings of the National Academy of Science 103: 13110-13115.
STEVENSON, H. L., Y. BAI, M. Y. KOSOY, J. A. MONTENEIRI, J. L. LOWELL, M. C. CHU, AND K. L. GAGE. 2007. Detection of novel Bartonella strains and Yersinia pestis in
82
prairie dogs and their fleas (Siphonaptera: Ceratophyllidae and Pulicidae) using multiplex polymerase chain reaction. Journal of Medical Entomology 40: 329-337.
THIAGARAJAN, B., Y. BAI, K. L. GAGE, AND J. F. CULLY JR. 2008. Prevalence of Yersinia pestis in rodents and fleas associated with black-tailed prairie dogs (Cynomys ludovicianus) at Thunder Basin National Grassland, Wyoming. Journal of Wildlife Diseases 44: 731-736.
WEBB, C. T., C. P. BROOKS, K. L. GAGE, AND M. F. ANTOLIN. 2006. Classic flea-borne transmission does not drive plague epizootics in prairie dogs. Proceedings of the National Academy of Science 103: 6236-6241.
WILLIAMS J. E., M. ATAS, AND D. C. CAVANAUGH. 1976. A comparison of the serological test for detecting antibody to plague. Bulletin of the World Health Organization 54: 232-3.
WILDER, A. P., R. J. EISEN, S. W. BEARDEN, J. A. MONTENIERI, K. L. GAGE, AND M. F. ANTOLIN. 2008. Oropsylla hirsuta (Siphonaptera: Ceratophyllidae) can support plague epizootics in Black-tailed prairie-dogs (Cynomys ludovianus) by early-phase transmission of Yersinia pestis. Vector-borne and zoonotic Diseases 8: 359-366.
UBICO, S. R., G. O. MAUPIN, K. A. FAGERSTONE, AND R. G. MCLEAN. 1988. A plague epizootic in the white-tailed prairie dogs (Cynomys leucurus) of Meeteetse, Wyoming. Journal of Wildlife Diseases 24: 399-40

83
Table 3.1 Flea species and number collected from Gunnison's prairie dog burrows, prairie dogs (GPD), Cynomys gunnisoni, and golden mantled ground squirrels (GMGS), Spermophilus lateralis, caught in the Valles Caldera National Preserve in northern New Mexico, 2004-2006.
Sample Flea Species Spring Summer Total
Burrow Catallagia decipiens 1 1 2
(n=280) Oropsylla hirsuta 85 47 132
Oropsylla idahoensis 16 4 20
Oropsylla t. cynomuris 7 1 8
Oropsylla t. tuberculata 5 -- 5
Total 114 53 167
GPD Oropsylla hirsuta 79 507 586
(n=130) Oropsylla idahoensis 5 23 28
Oropsylla t. cynomuris 14 -- 14
Oropsylla t. tuberculata 3 2 5
Total 101 532 633
GMGS Eumolpianus e. cyrturus 3 2 5
(n=51) Opisodaysis enoplus -- 1 1
Oropsylla hirsuta -- 9 9
Oropsylla idahoensis 21 29 50
Oropsylla t. tuberculata 1 1
Total 25 41 66
Grand Total 240 626 866
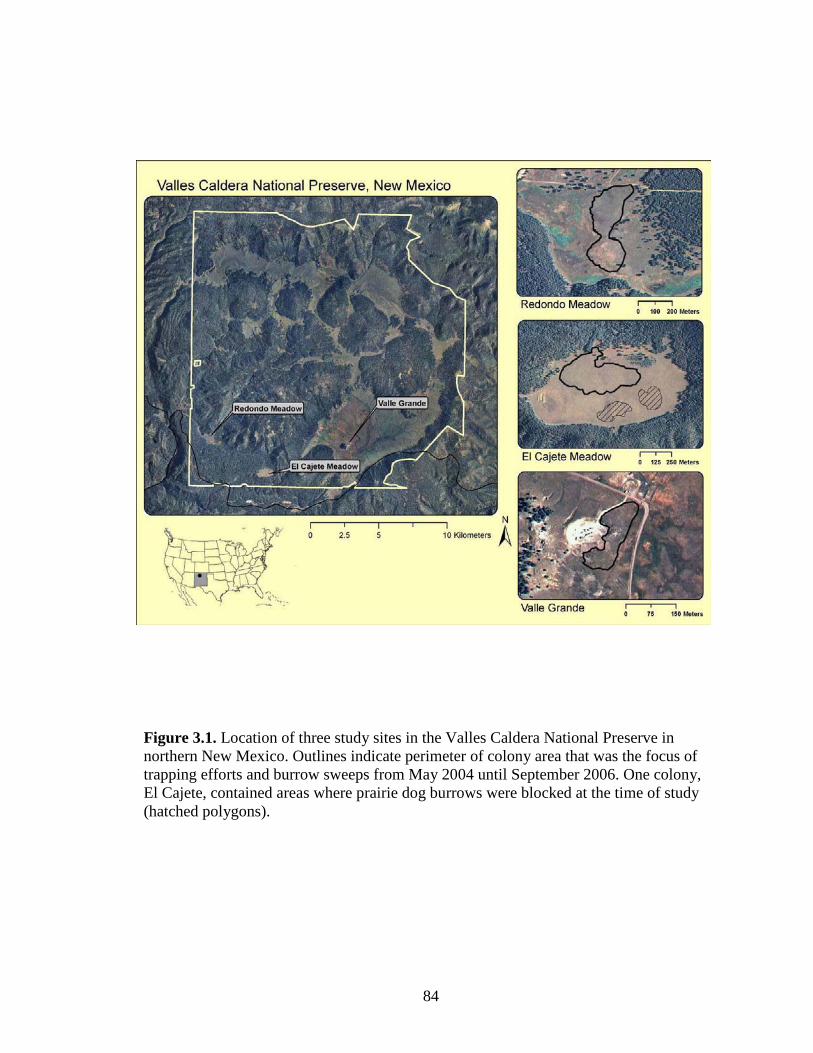
84
Figure 3.1. Location of three study sites in the Valles Caldera National Preserve in northern New Mexico. Outlines indicate perimeter of colony area that was the focus of trapping efforts and burrow sweeps from May 2004 until September 2006. One colony, El Cajete, contained areas where prairie dog burrows were blocked at the time of study (hatched polygons).

85
Figure 3.2. A) Mean abundance (Number of fleas/Host Individual ± SE) of fleas collected from prairie dogs captured from two colonies in the Valles Caldera National Preserve during six collection periods from 2004-2006. B) Mean abundance (Number of fleas/Host Individual ± SE) of fleas collected from prairie dog burrows sampled from three colonies in the Valles Caldera National Preserve during six collection periods from 2004-2006. Letters signify significant differences (p<0.05) among sampling periods for each site, where those points which share a letter are not different across sampling periods.
*Significant difference (p<0.05) between Redondo and Valle Grande. #Significant difference (p<0.05) between Redondo and El Cajete.

86
Figure 3.3. A) Prevalence (Number of infested individuals/Total individuals collected) of fleas collected from prairie dogs captured from two colonies in the Valles Caldera National Preserve during six collection periods from 2004-2006. B) Prevalence (Number of infested burrow sweeps/Total sweeps) of fleas collected from prairie dog burrows sampled from three colonies in the Valles Caldera National Preserve during six collection periods from 2004-2006. Letters signify significant differences (p<0.05) among sampling periods for each site, where those points which share a letter are not different across sampling periods.
*Significant difference (p<0.05) between Redondo and Valle Grande.+Significant difference (p<0.05) between El Cajete and Valle Grande.
87
CHAPTER 4: FLEA-BORNE TRANSMISSION OF BARTONELLA IN THREE RODENT AND FLEA COMMUNITIES IN NEW MEXICO

88
PREFACE- This chapter has been formatted for publication within The Journal of Vector Borne and Zoonotic Disease. However, the final submitted manuscript is likely to be considerable shorter than that presented here.

89
ECOLOGY OF BARTONELLA IN THREE RODENT AND FLEA COMMUNITIES IN
NEW MEXICO. Abstract: A number of rodent-borne bacteria in the genus Bartonella are agents of
human disease. Bartonella, transmitted between rodent hosts by fleas, are considered an
emerging pathogen. We explore the natural course of Bartonella infections in rodents at
three sites in New Mexico: the Valles Caldera National Preserve (VCNP); the Sevilleta
National Wildlife Refuge (NWR); and the Sandia Mountains. We analyze, using
Spearman correlations and generalized linear models, the site level characteristics of
Bartonella infections in rodent and flea communities. Rodents (n=3,515) were sampled
for Bartonella from May 2004 to May 2007. Overall, 38% of rodents and 30 rodent
species were positive for Bartonella. Prevalence was lowest at the Sevilleta NWR
(24.6%) and highest at the VCNP (53%). Fleas (n=827) were collected from these
rodents and 478 (60%) fleas of 24 species were positive for Bartonella. Bartonella
infections typically lasted two months, though three animals tested positive for three
consecutive months. The prevalence of Bartonella corresponded with rodent density at
each site though the nature of this relationship changed with season and elevation.
Analysis of temporal patterns of Bartonella infection found no significant effect of
sampling period, though sites were significantly different. Bartonella is a dynamic
parasite that appears to maintain a steady cycle of infection in wild rodent species.
Changes in prevalence related to host density and environmental gradients point to the
importance of both rodent and flea-mediated transmission mechanisms in Bartonella
cycles.

90
Introduction
The mechanisms driving the spread of vector-borne zoonotic diseases are often
difficult to identify due to the complexity of the vector-host-pathogen system. Changes in
the abundance or susceptibility of hosts and vector communities have far reaching and
often unpredictable consequences for vector borne diseases. Vector-borne pathogens
dominate lists of emerging diseases (Githeko et al., 2000; Epstein, 2001) and include the
bacterial pathogen Bartonella, which causes a number of human diseases including cat
scratch disease, endocarditis, and bacillary angiomatosis (Azad et al., 1997; Boulouis et
al., 2005).
Bartonella is a gram negative fastidious bacterium that infects the erythrocytes of
a diversity of mammal species (Breitschwerdt and Kordick, 2000). Bartonella is common
in rodent species, where it is most likely transmitted by fleas (Bown et al., 2004). Though
this blood-borne pathogen appears to have little immunological consequences for its wild
rodent hosts (Chomel et al., 2003, Boulouis et al., 2001), many Bartonella species are
implicated in human disease (Greub and Raoult, 2003). In particular, B. elizabethae, B.
grahamii, B. vinsonii, and B. washoensis, naturally found in rodent species within the
U.S., have been associated with cases of endocarditis and uveitis in humans (Jacomo et
al. 2002). A number of studies have described Bartonella species in the rodents (e.g.,
Kosoy et al., 1997; Jardine et al., 2006; Bai et al., 2007a; 2008; Reeves et al., 2005, 2007)
and fleas (Stevenson et al., 2003; Reeves et al., 2005, 2007; Morway et al., 2008) of
North America. In addition, many analyses have addressed the seasonal and density
dependent changes in the prevalence of Bartonella in rodent species. (Birtles et al., 2001;
Holmberg et al., 2003; Kosoy et al., 2004a,b; Jardine et al., 2006; Telfer et al., 2007a,b;
91
Bai et al., 2008). Though these studies have contributed considerably to our
understanding of the ecology of particular species, we lack a cohesive view on the nature
of Bartonella infections in rodents and flea vectors. In particular, the specific
mechanisms that influence the transmission of this pathogen remain unknown.
Such studies are important not only to understand the spread of Bartonella
infections, but also may contribute to understanding other, more difficult to detect,
vector-borne zoonotic bacterial diseases, such as plague (caused by the bacterium
Yersinia pestis). Plague continues to threaten humans and wildlife in the Western U.S.
and remains elusive to efforts to identify the means by which it is maintained in wild
animal populations. Of particular interest in studies of Bartonella is the relative influence
of flea dependent versus vertebrate host dependent transmission dynamics.
In this paper, we present the first of a two-part analysis of Bartonella infections in
rodents from three mountain ranges in New Mexico. We analyze, at the site level,
characteristics of Bartonella infections in rodent and flea communities. Our primary
objectives are to: 1) Describe the course of Bartonella infections in rodent species at each
site; 2) identify the potential flea vectors of Bartonella; 3) examine the relationship
between host density and parasite prevalence; and 4) assess seasonal patterns in infection
prevalence. By comparing trends seen in all three sites, we identify the degree to which
fleas and rodent population dynamics influence the spread of Bartonella.
Materials and Methods
This study represents part of an effort to track the movement of three rodent-
borne pathogens, Hanta virus, plague (Yersinia pestis) and Bartonella, along elevational

92
gradients (EID grant # 0326757). This study was conducted on three mountain ranges
within New Mexico: the Sandia Mountains in the Cibola National Forest, Bernalillo
County, NM (N 35˚ 16' 45.5087, W 106˚ 23' 51.1680), the Los Pinos Mountains in the
Sevilleta National Wildlife Refuge (NWR), Soccoro County, NM (N 34˚ 23' 43.8432, W
106˚ 34' 0.4800), and the Jemez Mountains of the Valles Caldera National Preserve
(VCNP), Sandoval County, NM (N 35˚ 52' 2.8524, W 106˚ 35' 37.6441). This effort
employed two trapping scheme. In the first, we used transects to live-trapped rodents
each month at each site, unless snowpack was present, along an elevational gradient from
grassland habitats to upper montane forest habitats. Transects consisted of 2 rows of 10
Sherman© live traps (LFA and SFA Folding Traps, H.B. Sherman Traps, Tallahassee, FL)
placed 10 m apart (20 traps/transect). Transects were located 100-400 m apart along an
elevational gradient at each site. In the second, we used a web arrangement to live-
trapped rodents biannually. Each web contained 144 Sherman traps set in a radial pattern
with a diameter of 200 m (see Parmenter et al., 2003). Webs were placed at upper and
lower elevations at the Sevilleta and VCNP and approximately mid-elevation at the
Sandia mountain site. The current analysis is not concerned with rodent movement
patterns and uses the transect data to explore temporal trends in the prevalence of
Bartonella and the web data to explore the relationship between rodent density and
prevalence of Bartonella.
Site descriptions
Sandia Mountains- The primary habitat vegetation of this site is pinyon-juniper
woodland consisting primarily of Pinyon pine (Pinus edulis), one seed juniper (Juniperus
monosperma) and blue grama grass (Bouteloua gracilis). Annual precipitation of study
93
site is 314 mm, with most moisture falling during the summer monsoon season. Mean
annual temperature is 12.8° C, with mean July temperature of 19.9° C and mean January
temperature of 1.5° C.
Sevilleta NWR - Lowland habitats are characterized as Chihuahuan desert grasslands
graduating to midlevel Juniper Savanna habitat and to Pinyon-Juniper woodland at upper
elevations. Dominate vegetation in desert grasslands included burrograss (Scleropogaon
brevifolius), sand dropseed (Sporobolus cryptandrus) and black grama (Bouteloua
eriopoda). One seed-juniper (Juniperus monosperma), honey mesquite (Prosopis gland
µlosa) are dominate in Savanna habitats. The pinyon juniper woodland is dominated by
Colorado pinyon (Pinus edulis), one seed juniper (Juniperus monosperma) with various
grass species including blue, hairy, sideoats and black grama species (Bouteloua
gracilis,B. hirsuta, B. curtipendula and B. eriopoda), and purple threeawn (Aristida
purpurea). Annual precipitation of study site is 242 mm, with about 60% falling during
the summer monsoon season. Mean annual temperature is 12.9° with mean July
temperature of 20.5° C and mean January temperature of 1.5° C.
Valles Caldera National Preserve - Habitats ranged from meadows dominated by
various grass and forb species (Bouteloua gracilis, Potentilla hippiana, Erigeron
flagellaris, Artemisia carruthii, Polygonum douglasii, Bromus inermis, Taraxacum
officinale, Achillea millefolium, Festuca arizonica, Koelaria macrantha, Poa pratensis,
Muhlenbergia montana, and Antennaria rosea) to midrange mixed conifer forests
dominated by Ponderosa pine (Pinus ponderosa), Douglas-fir (Pseudotsuga menziesii var
glauca), white fir (Abies concolor) and Spruce-fir forest with quaking aspen (Populus
tremuloides), Engelmann spruce (Picea engelmannii) and Corkbark fir (Abies arizonica)
94
at highest elevations. Annual precipitation averages 638 mm, with approximately 45%
falling during the summer monsoon season (July-September). Mean annual temperature
is 4.5° C, with mean July temperatures of 15° C and mean January temperatures of -5.3°
C.
Rodent Captures
Monthly Rodent collections, 2004-2007- At the Sevilleta NWR, 15 transects were set
from 1595 to 1971 m. At the VCNP, 15 transects covered a range of elevation of 2462 to
3200 m. At the Sandia Mountains site, 15 transects were placed along a gradient ranging
from 1761 to 1939 m. Small mammals were trapped for three consecutive nights. Traps
were baited with sweet feed (multi-grain mix with molasses) and left open each evening
and checked each morning at dawn. Each captured animal was identified to species, ear-
tagged (Gey Band and Tag Co, Norristown, PA, USA), measured (ear length, right hind
foot, total length, tail length) and weighed to the nearest gram with a Pesola ® scale
(Baar, Switzerland). Small animals (<10grams) were toe-clipped in lieu of ear tags.
Blood samples were obtained from rodents via an occipital puncture with a
heparenized capillary tube. Whole blood samples were either instantly frozen in liquid
nitrogen or blotted onto Nobuto filter strips (Toyo Roshi Kaisha, Ltd., Tokyo, Japan).
Each Nobuto strip was air dried and placed in a manila envelope for short term storage.
Whole blood samples were kept at -20º C until processed in the laboratory, and Nobuto
strips were largely stored at room temperature (though some were stored at 4º C).
During certain trapping periods, the first 10 individuals of each rodent species
were actively searched for fleas. Otherwise, fleas were collected when observed in the fur

95
of an animal, but an active search may or may not have been conducted. Fleas were
picked or brushed from fur of animal and then placed into a labeled cryovial and flash
frozen in liquid nitrogen (-70˚C). After processing, rodents were returned to their trap and
released at the site of capture. All animals were processed as described above only during
the first capture of each trapping period. Animal handling procedures were approved by
the Animal Care and Use Committee of the University of New Mexico (04MCC002).
Blood and flea samples were processed under the guidelines and standardized protocols
for the safe handling of biohazard material where appropriate (Mills et al., 1995; Keim
lab, NAU and CDC, Fort Collins, unpublished protocols).
Biannual rodent population density estimates – We trapped rodents at nine webs, three
at high elevation sites, three at lower elevation, and three on prairie dog towns in the
VCNP. We trapped rodents on seven webs, three at high elevation sites, three at lower
elevation, and one on a prairie dog colony at the Sevilleta NWR. We trapped rodents on 3
webs place approximately mid-elevation at the Sandia mountain site. Therefore, rodent
densities were calculated for high, intermediate and low elevation locations for the
Sevilleta and VCNP. Webs were sampled in spring and autumn 2004-2006, and spring of
2007. Trapping methods and animal processing followed the guidelines noted above.
Prairie Dog trapping- Prairie dogs at two sites, Sevilleta NWR and the VCNP were
trapped during spring (May-June) and summer (August-September) of each year.
Detailed methods are described elsewhere (Friggens et al., 2010). Briefly, one colony at
the Sevilleta NWR and three colonies at the VCNP were trapped for three consecutive
nights during each trapping session (Spring/Fall). This trapping either preceded or
followed the web trapping meant to capture other small mammal species. We trapped
96
prairie dogs for effect and place traps near active burrows rather than using a standard
formation. Two to four Tomahawk ® live traps (Size #70, Tomahawk Live Trap
Company, Tomahawk,Wisconsin, USA) were set around each burrow for a total of 76-
104 traps per colony. Traps were baited with a combination of rolled oats and sweet feed
and wired open for at least 4 days prior to trapping to acclimatize prairie dogs to traps.
At a processing station removed from the trapping site, each prairie dog was
weighed to the nearest gram with a Pesola ® scale (Baar, Switzerland), sexed, and given
a uniquely numbered ear tag (Gey Band and Tag Co, Norristown, PA, USA). Animals
were processed with the aid of canvas cones described in Hoogland (2005). Blood
samples were collected by clipping a toenail on a rear foot just distal to the quick and
blotting the blood onto a Nobuto filter strip (Toyo Roshi Kaisha, Ltd., Tokyo, Japan).
Toenails were thoroughly cleaned with alcohol pads before clipping and treated with a
sulfur compound (styptic) after clipping to prevent infection. Nobuto strips were air dried
and put into an envelope for short term storage. Fleas were collected by holding each
animal over a plastic basin containing a 20 x 20 cm felt cloth and thoroughly brushing the
fur with a flea comb and/or toothbrush until all observed fleas had fallen into the basin.
Fleas were then collected from the felt cloth, placed into a labeled cryovial and flash
frozen in liquid nitrogen (-70˚ C). After processing, prairie dogs were returned to their
trap and released at the site of capture. Prairie dogs were processed only during the first
capture of each trapping period.
Flea Identification- Fleas were examined under a dissecting microscope and identified to
genus, species or subspecies according to Furman and Catts (1982), Hubbard (1947) and
Lewis (2002). Voucher specimens of each flea species were deposited in the Division of
97
Vector-borne Infectious Diseases of the Center for Disease Control and Prevention in
Fort Collins, Colorado.
Bartonella methods
DNA extraction for Whole Blood Samples- Whole blood samples were processed with
DNeasy Blood and Tissue Kits (DNeasy 250 or 96, Qiagen, Hilden, Germany) using
manufacturer's instructions with minor modifications for tissue samples. For each sample,
25 µl of blood was combined with 125 µl of Bovine brain serum and the entire mixture
was used in the extraction process. Final products were gathered from a single elution of
50 µl buffer AE.
DNA extraction procedures for Nobuto filter strips- We used the Qiagen DNeasy® Blood
and Tissue Kit and the dried blood protocol from the QIAamp® 96 DNA mini Kit. The
following modifications were made to the published protocol: The pK lyses step was
extended to 2 hours; an additional spin step was added after the addition of Buffer AW2.
Final products were gathered in a single elution of 150 µl Buffer AE.
PCR amplification of Bartonella DNA
Blood Samples- A nested PCR procedure using Promega Taqman or Promega GoTaq
(Promega Corp, Madison Wisconsin, USA ) and Bartonella-specific primers for the
citrate synthase (gltA) gene were used to amplify target from whole blood samples. The
first set of primers correspond to a 500 bp target of the gltA gene (Sheff et al.,
unpublished protocol): Forward primer 600F (5’-TAT GTG TTT TTC TGT TCC TTG
TGA-3’), and reverse 1243R(5’-AGA GTT GGC GTG GTC GGC TAA T-3’); The
second set of primers amplified a 329 bp product of the same gene as described before
98
(Bai et al., 2008). Forward and reverse primers were BhCS781.P (5’-GGG GAC CAG
CTC ATG GTG G-3’) and BhCS137.n (5’-AAT GCA AAA AGA ACA GTA AAC A-
3’), respectively. Distilled water and DNA of B. doshiae were used as negative and
positive controls, respectively, in all PCR runs. All PCR amplifications were conducted
in 96 well plates on BioRad or Applied Biosystems Thermocyclers.
For each reaction, 2.5 µl template DNA was added to a 50 µl reaction mixture
containing 2.5 µl Taq, 5 µl 10X Buffer with MgCl (or 10 µl 10X Buffer with MgCl), 0.5
µl dNTP’s (40µM solution of Promega’s deoxynucleoside triphosphate mixture dATP,
dCTP, dGTP, and dTTP), and 0.5 µl of each primer 600F, 1243R (10µM). This reaction
was then run in the following thermocycler program: Initial 5 minute denaturization at
95˚ C , 4 cycles of 95˚ C for 1 minute, 56.3˚ C for 1 minute, and 72˚C for 1 minute,
followed by 34 cycles of 95̊ C for 55 seconds, 56.3˚ C for 55 seconds, 72˚ C degrees for
1 minute, and finally 95˚C for 1 minute, 56.2˚C for 1 minute and a final annealing stage
of 72˚ C for 10 minutes. The second reaction used 2.5 µl of the first reaction and an
identical reaction mixture but substituted the inner primer set (BhCS781.p, BhCS137.n).
The thermocycler program for the second step was: 95˚ C for 5 minutes, followed by 34
cycles of 95˚C for 1 minute, 58.3˚C for 1 minute, and 72˚C for 1 minute, followed by a
final annealing step of 72 ˚C for 10 minutes.
Initial runs of the nested protocol on dried blood samples gave poor results with
many positive samples showing weak and hard to interpret bands as compared to whole
blood samples in side by side experiments. After modifying DNA extraction steps as
described above for Nobuto strips, results improved somewhat. However, results were
improved considerably by using the inner primer set (BhCS781.p, BhCS137.n) in a

99
reoptimized single step PCR procedure. Thus, the great majority of Nobuto derived DNA
samples were amplified using this single step PCR procedure and the inner primer pair.
Specifically, a 25 µl PCR reaction mixture containing 2.5 µl DNA template (DNA=1/10
reaction volume), 5 µl 5X buffer, 0.25 µl dNTPs (40mM), 0.25 µl each primer (10µM),
0.25 Taq DNA polymerase (GoTaq Green, Promega Co), 3 µl of MgCl2 (for a final
concentration of 4.5mM of MgCl2) and water to volume was run in the following
thermocycler program: 5 minute denaturization at 95˚C , 34 cycles of 95˚C for 1 minute,
52.3˚C for 1 minute, and 72˚C for 1 minute, followed by a final annealing stage of 72˚C
for 10 minutes.
The high concentration of MgCl2 led to nonspecific banding in certain instances
(most commonly manifested as a rodent amplicon measuring 250 bp), which was
remedied by processing samples on ice or using a hotstart method. We also found the 5'
HotMaster Mix (Fischer) with variable Mg2+ to work very well with this protocol.
Flea samples: Fleas were assessed for presence of Bartonella DNA using a multiplex
reaction as described elsewhere (Stevenson et al., 2003). Briefly, primers OF-G2 and OR-
G2 described above were used to amplify a 328 kb length of the citrate synthase (gltA)
gene and as described elsewhere (Stevenson et al., 2003). Each reaction used 2.5 µl of
Flea DNA or homogenate in a 50 µl a solution containing the following reagents: 0.5 µl
dNTP’s, 0.5 µl each primer, and 2.5 µl of Taq (Promega Taqman) and was run in the
following thermocycler program: 95˚ C for 5 minutes, followed by 34˚ C cycles of 95˚ C
for 1 minute, 56˚ C for 1 minute, 72˚ C for 1 minute followed by a final annealing step of
72˚ C for 10 minutes.
100
All amplified products were visualized on a 1.5% Agar gel for run for 10-20
minutes followed by a five minute soak in an Ethidium Bromide solution. A 50bp ladder
(Invitrogen) was used as a standard. We also used E-gel precast agarose gels (E-Gel 96®,
Invitrogen) for high throughput processing of samples.
Statistical Analysis
Bartonella prevalence was calculated as the number of infected samples/total
samples tested for each rodent species and all rodent species combined at each site.
Bartonella prevalence was calculated for each trapping period and web or transect at each
site. Because a large number of transects had no data due to lack of captures, we also
calculated prevalence for all transects combined within a trapping period and used these
values in generalized linear models to assess the relationship between prevalence and
season and site. Rodent densities were calculated for each web in each site and each
trapping period (typically twice per year) using a uniform cosine model in DISTANCE
(Thomas et al., 2010). The trapping scheme used for prairie dogs did not allow us to
estimate prairie dog density and this specie is not included in the density analyses.
Relationships between Bartonella prevalence and density used web capture data, whereas
seasonal patterns of Bartonella infection were analyzed using the monthly transect data.
To account for the effect of sampling effort in analyses, which did not include density
(tests for effect of season), we calculated the average number of captures/100 trap-nights
and used this as a covariate in linear model analysis (offset variable).
Spearman correlations were used to assess the relationships between prevalence
of Bartonella in small mammal populations and sampling effort, capture numbers, and
prevalence of Bartonella in fleas (PROC CORR, SAS 9.2). We used a generalized linear
101
model with binomial distribution and logit link (PROC GLIMMIX SAS 9.2.) for analysis
of the site level relationships between prevalence and rodent density. We also used this
model to examine the seasonal trends in the prevalence of Bartonella. For web density
analyses, elevation and sampling period were included as fixed effects. We treated web
(nested within elevation) as a random effect and, to account for the repeated sampling at
each site, we included sampling period (Year-Season) as a random effect with web-
within-elevation as a subject. We fit our model by a backwards stepwise process where
we first fit the fully crossed model and then sequentially dropped factors with the highest
P value until only significant factors remained.
For transect data, the full model with season and site fixed effects and a random
sampling period with transect as a subject would not converge. Therefore, we ran a model
that used the average of all transects and sampling periods condensed into seasons as
fixed effects. December, January, February were classified as winter, March, April, and
May were classified as spring, Summer was June, July, and August, and Fall was
September, October and November. Our final model used site (Sandia Mountains,
Sevilleta NWR, VCNP) and season as fixed effects and included a season nested within
years and as a random effect and defined the subject as “site”. Differences among
significant variables were assessed using means tests with Tukey adjusted P values to
account for multiple comparisons (PROC GLIMMIX. SAS 9.2). All tests were
considered significant at the 0.05 alpha level.
102
Results
Bartonella Prevalence- We sampled 3,515 rodents for Bartonella over the course of this
study (Table 4.1). Overall prevalence was lowest at the Sevilleta NWR (24.6%) and
highest at the VCNP (53%). Of those species with greater than 10 samples, Onychomys
arenicola and Perognathus flavus both from the Sevilleta NWR had the highest and
lowest overall prevalence (64.8 and 9%, respectively). Prevalence was similar among
species (with greater than 10 captures) at different sites with the following exceptions:
Bartonella was 3 times as prevalent in Dipodomys ordii captured from the Sandia
Mountains (28 vs. 6%) than animals captured on the Sevilleta NWR. Similarly,
Perognathus flavus and Peromyscus leucopus from the Sandia Mountains had twice the
prevalence of Bartonella over those captured at the Sevilleta NWR (21 vs 9 % and 40 vs
22%, respectively).
Of the 827 fleas that were tested for Bartonella, 478 (60%) were positive for
Bartonella. Overall, 24 flea species were positive for Bartonella (Table 4.2; see
Appendix 5 for a complete list of flea species by each rodent host and site). Thirteen
percent of the fleas from the Sandia Mountains and 20% of the fleas from the Sevilleta
NWR and VCNP were positive for Bartonella.
Bartonella prevalence was correlated with captures/100 trap-nights across all
years and sites for both transect (r=0.38, P=0.0001, n=66) and web (r=0.225, P=0.0077,
n=139) data. When analyzed by year, only 2005 showed a significant correlation for
transects (r=0.595, P=0.053, n=11).
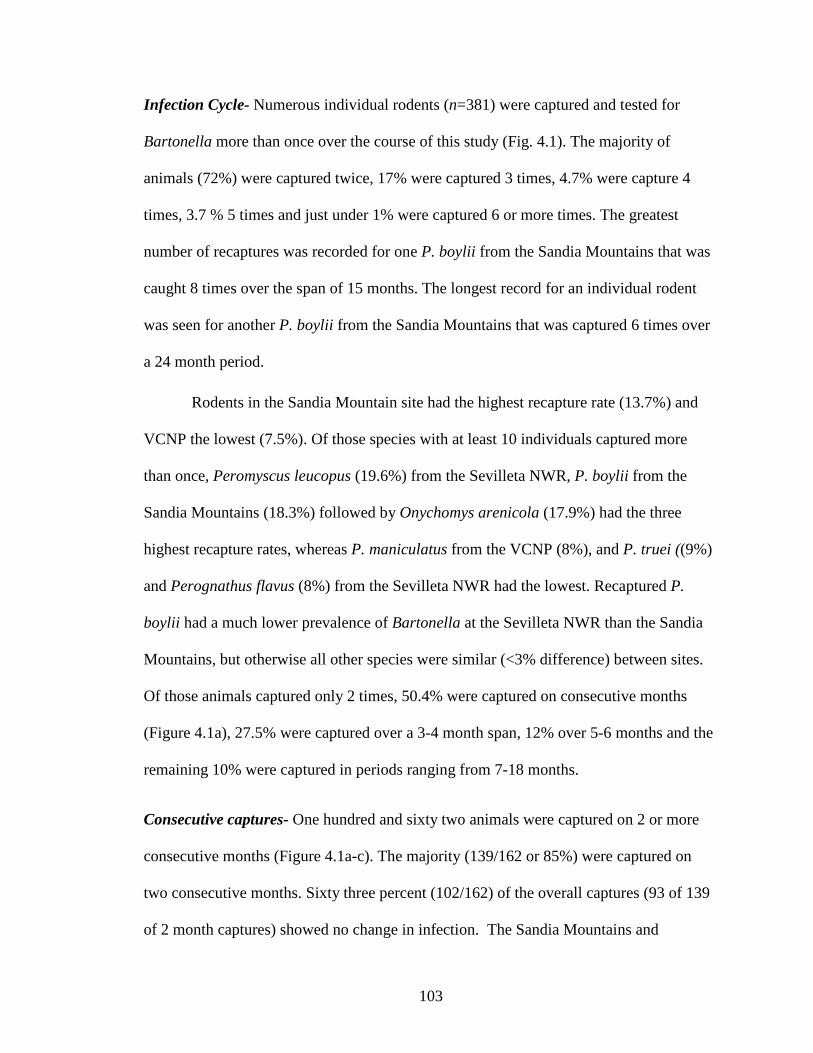
103
Infection Cycle- Numerous individual rodents (n=381) were captured and tested for
Bartonella more than once over the course of this study (Fig. 4.1). The majority of
animals (72%) were captured twice, 17% were captured 3 times, 4.7% were capture 4
times, 3.7 % 5 times and just under 1% were captured 6 or more times. The greatest
number of recaptures was recorded for one P. boylii from the Sandia Mountains that was
caught 8 times over the span of 15 months. The longest record for an individual rodent
was seen for another P. boylii from the Sandia Mountains that was captured 6 times over
a 24 month period.
Rodents in the Sandia Mountain site had the highest recapture rate (13.7%) and
VCNP the lowest (7.5%). Of those species with at least 10 individuals captured more
than once, Peromyscus leucopus (19.6%) from the Sevilleta NWR, P. boylii from the
Sandia Mountains (18.3%) followed by Onychomys arenicola (17.9%) had the three
highest recapture rates, whereas P. maniculatus from the VCNP (8%), and P. truei ((9%)
and Perognathus flavus (8%) from the Sevilleta NWR had the lowest. Recaptured P.
boylii had a much lower prevalence of Bartonella at the Sevilleta NWR than the Sandia
Mountains, but otherwise all other species were similar (<3% difference) between sites.
Of those animals captured only 2 times, 50.4% were captured on consecutive months
(Figure 4.1a), 27.5% were captured over a 3-4 month span, 12% over 5-6 months and the
remaining 10% were captured in periods ranging from 7-18 months.
Consecutive captures- One hundred and sixty two animals were captured on 2 or more
consecutive months (Figure 4.1a-c). The majority (139/162 or 85%) were captured on
two consecutive months. Sixty three percent (102/162) of the overall captures (93 of 139
of 2 month captures) showed no change in infection. The Sandia Mountains and

104
Sevilleta were mostly negative for Bartonella infections and remained so when captured
1 month later (Figure 4.1a). Most animals sampled for 2 months in the VCNP were
Bartonella positive for both samples. About equal proportions gained or lost infections
from the first to second sampling at each site.
Animals tested for 3 consecutive months tended to show a change in infection
status though 1 animal from the Sevilleta was found to be positive for all 3 months
(Figure 4.1b). The Sandia Mountains and Sevilleta had 1 and 2 animals, respectively,
which were never positive for Bartonella, whereas all other captures showed some
change in infection status over the course of the study. One Onychomys arenicola from
the Sevilleta was captured 5 times in five months, gained Bartonella infection, which
lasted for 2 months, was negative at the next sample and positive during a final survey.
Bimonthly captures- One hundred and twenty animals were captured on a bimonthly
basis, 49 of which showed some change infection status over the course of the study.
Animals sampled over a three month period were largely negative for Bartonella for both
samples (Figure 4.1d). There was a slight tendency to lose infections from first to second
sampling. Over a four-month period, six animals from the Sandia Mountains and three
from VCNP appeared to have chronic infections with Bartonella, whereas 11 from the
Sandia Mountains, four from Sevilleta, and one from the VCNP were negative for the
same period (Figure 4.1e).
Duration of infections- Fifty-three animals tested positive for two or more consecutive
months. The longest consecutive infection recorded in this study was three months (1
Onychomys from Sevilleta, and 2 Peromyscus maniculatus from the VCNP). Within
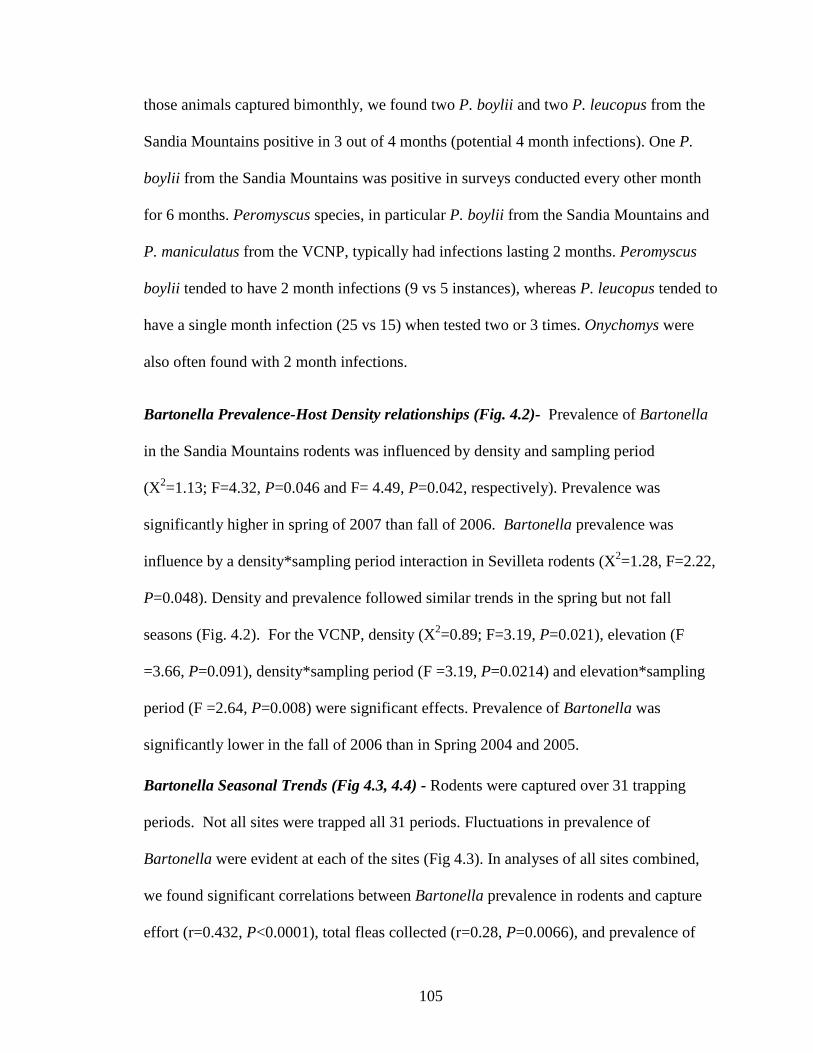
105
those animals captured bimonthly, we found two P. boylii and two P. leucopus from the
Sandia Mountains positive in 3 out of 4 months (potential 4 month infections). One P.
boylii from the Sandia Mountains was positive in surveys conducted every other month
for 6 months. Peromyscus species, in particular P. boylii from the Sandia Mountains and
P. maniculatus from the VCNP, typically had infections lasting 2 months. Peromyscus
boylii tended to have 2 month infections (9 vs 5 instances), whereas P. leucopus tended to
have a single month infection (25 vs 15) when tested two or 3 times. Onychomys were
also often found with 2 month infections.
Bartonella Prevalence-Host Density relationships (Fig. 4.2)- Prevalence of Bartonella
in the Sandia Mountains rodents was influenced by density and sampling period
(X2=1.13; F=4.32, P=0.046 and F= 4.49, P=0.042, respectively). Prevalence was
significantly higher in spring of 2007 than fall of 2006. Bartonella prevalence was
influence by a density*sampling period interaction in Sevilleta rodents (X2=1.28, F=2.22,
P=0.048). Density and prevalence followed similar trends in the spring but not fall
seasons (Fig. 4.2). For the VCNP, density (X2=0.89; F=3.19, P=0.021), elevation (F
=3.66, P=0.091), density*sampling period (F =3.19, P=0.0214) and elevation*sampling
period (F =2.64, P=0.008) were significant effects. Prevalence of Bartonella was
significantly lower in the fall of 2006 than in Spring 2004 and 2005.
Bartonella Seasonal Trends (Fig 4.3, 4.4) - Rodents were captured over 31 trapping
periods. Not all sites were trapped all 31 periods. Fluctuations in prevalence of
Bartonella were evident at each of the sites (Fig 4.3). In analyses of all sites combined,
we found significant correlations between Bartonella prevalence in rodents and capture
effort (r=0.432, P<0.0001), total fleas collected (r=0.28, P=0.0066), and prevalence of
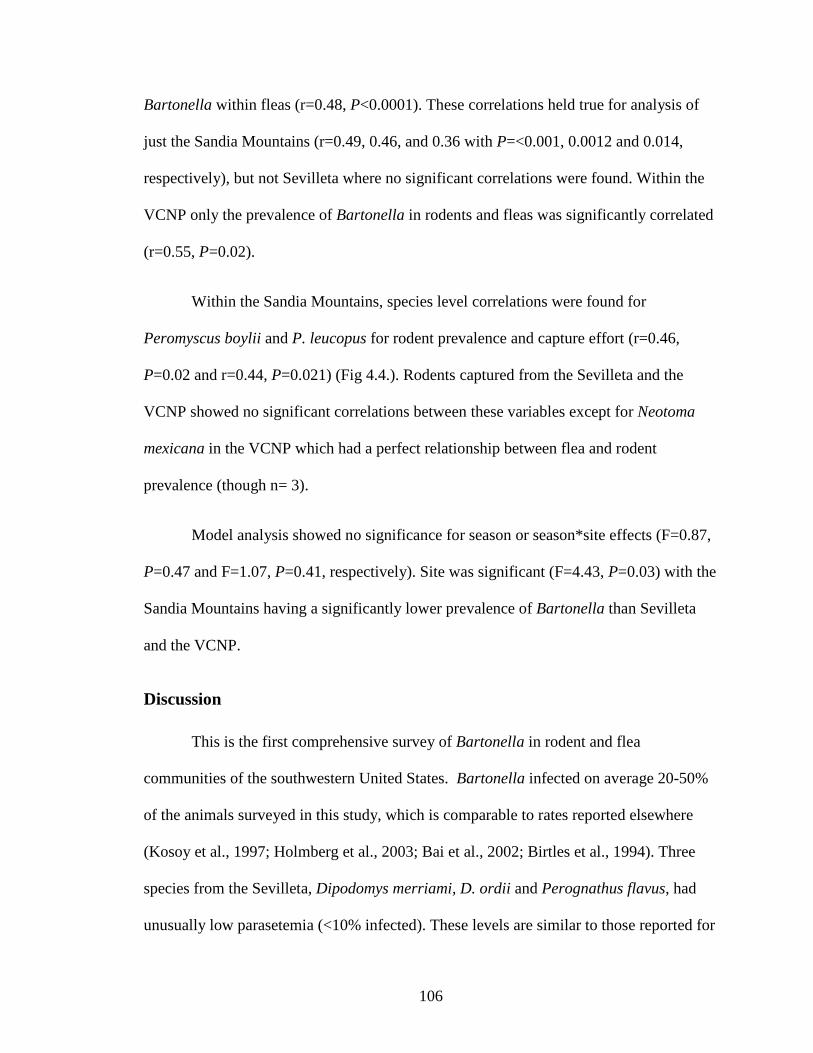
106
Bartonella within fleas (r=0.48, P<0.0001). These correlations held true for analysis of
just the Sandia Mountains (r=0.49, 0.46, and 0.36 with P=<0.001, 0.0012 and 0.014,
respectively), but not Sevilleta where no significant correlations were found. Within the
VCNP only the prevalence of Bartonella in rodents and fleas was significantly correlated
(r=0.55, P=0.02).
Within the Sandia Mountains, species level correlations were found for
Peromyscus boylii and P. leucopus for rodent prevalence and capture effort (r=0.46,
P=0.02 and r=0.44, P=0.021) (Fig 4.4.). Rodents captured from the Sevilleta and the
VCNP showed no significant correlations between these variables except for Neotoma
mexicana in the VCNP which had a perfect relationship between flea and rodent
prevalence (though n= 3).
Model analysis showed no significance for season or season*site effects (F=0.87,
P=0.47 and F=1.07, P=0.41, respectively). Site was significant (F=4.43, P=0.03) with the
Sandia Mountains having a significantly lower prevalence of Bartonella than Sevilleta
and the VCNP.
Discussion
This is the first comprehensive survey of Bartonella in rodent and flea
communities of the southwestern United States. Bartonella infected on average 20-50%
of the animals surveyed in this study, which is comparable to rates reported elsewhere
(Kosoy et al., 1997; Holmberg et al., 2003; Bai et al., 2002; Birtles et al., 1994). Three
species from the Sevilleta, Dipodomys merriami, D. ordii and Perognathus flavus, had
unusually low parasetemia (<10% infected). These levels are similar to those reported for

107
rodents from Thailand (9%) where it was suggested that a lack of flea vectors might be
the cause (Castle et al, 2004). We did collect fewer fleas from rodents captured on the
Sevilleta (Table 4.1), but a greater proportion of those fleas carried Bartonella (19%
versus 13%). In addition, though fewer fleas were collected on D. merriami, D. ordii and
P. flavus as compared to other rodent species on the Sevilleta, Bartonella was found in
those fleas (Table 4.1 and 4.2). Conversely, Bartonella was not always found in fleas
from rodents, which had high prevalence of Bartonella (e.g. Neotoma albigula and P.
flavus from The Sandia Mountains). Therefore, the presence of infected fleas does not
always correspond to an infected host.
Differences in the immune response of different hosts, alternative non-flea
vectors, or a decrease host interactions that influences transmission might also cause a
low prevalence of Bartonella. Immunity is probably not a factor for P. flavus, which
shows 21% infected at the Sandia Mountains though only 9% of animals at the Sevilleta
were positive for Bartonella. It may be that there are different Bartonella with different
immunological profiles infesting P. flavus at each site. Alternatively, there may be an
alternative flea or tick vector present within the Sandia Mountains but not the Sevilleta.
Fleas were rarely collected from this species at either site, though of these, only a flea
from the Sevilleta was found to contain Bartonella. Interestingly, temporal patterns of
capture success show that the Sevilleta populations were much more stable (Fig. 4.4)
compared to the Sandia Mountains population. Though the Sandia Mountains showed a
near absence of P. flavus for many trapping sessions, peaks in capture numbers were an
order of magnitude greater at the Sandia Mountains than Sevilleta. It may be that animals
at the Sandia Mountain site are reaching a critical density threshold beyond which
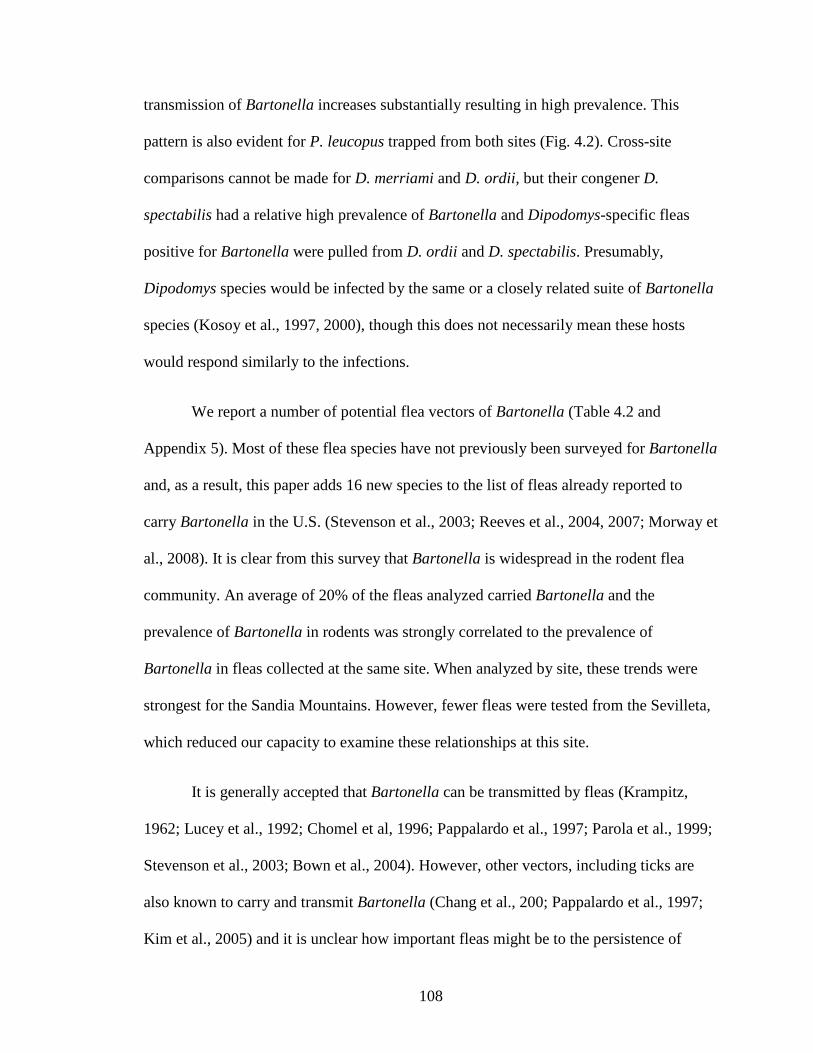
108
transmission of Bartonella increases substantially resulting in high prevalence. This
pattern is also evident for P. leucopus trapped from both sites (Fig. 4.2). Cross-site
comparisons cannot be made for D. merriami and D. ordii, but their congener D.
spectabilis had a relative high prevalence of Bartonella and Dipodomys-specific fleas
positive for Bartonella were pulled from D. ordii and D. spectabilis. Presumably,
Dipodomys species would be infected by the same or a closely related suite of Bartonella
species (Kosoy et al., 1997, 2000), though this does not necessarily mean these hosts
would respond similarly to the infections.
We report a number of potential flea vectors of Bartonella (Table 4.2 and
Appendix 5). Most of these flea species have not previously been surveyed for Bartonella
and, as a result, this paper adds 16 new species to the list of fleas already reported to
carry Bartonella in the U.S. (Stevenson et al., 2003; Reeves et al., 2004, 2007; Morway et
al., 2008). It is clear from this survey that Bartonella is widespread in the rodent flea
community. An average of 20% of the fleas analyzed carried Bartonella and the
prevalence of Bartonella in rodents was strongly correlated to the prevalence of
Bartonella in fleas collected at the same site. When analyzed by site, these trends were
strongest for the Sandia Mountains. However, fewer fleas were tested from the Sevilleta,
which reduced our capacity to examine these relationships at this site.
It is generally accepted that Bartonella can be transmitted by fleas (Krampitz,
1962; Lucey et al., 1992; Chomel et al, 1996; Pappalardo et al., 1997; Parola et al., 1999;
Stevenson et al., 2003; Bown et al., 2004). However, other vectors, including ticks are
also known to carry and transmit Bartonella (Chang et al., 200; Pappalardo et al., 1997;
Kim et al., 2005) and it is unclear how important fleas might be to the persistence of
109
Bartonella within the environment. Though the presence of Bartonella in fleas is not
enough in and of itself to determine whether fleas are transmitting Bartonella, the large
number of Bartonella positive flea species found in this study points to their potential as
vectors in these systems.
Characteristics of Bartonella Infections- Rodents in this study were transiently infected
with Bartonella. Most species appear to maintain infections for about two months and
experience frequent reinfections with Bartonella. Thus, in support of the findings of
Kosoy et al. (1997), it appears unlikely that these rodents are acquiring immunity to
Bartonella. Arguments for the development of acquired immunity in these hosts come
from studies, which report a significantly higher prevalence of Bartonella in juvenile
versus adult animals (Kosoy et al., 2004; Jardine et al., 2006; Tefler et al., 2007a). We
did not examine the demographics of the infected rodent population and it may be that
young rodents are infected more frequently by Bartonella. However, the consistent nature
of the infections observed at times on animals captured over the span of several months
(Fig 4.1) indicates that, in general, these rodents remain susceptible to Bartonella
infections. Interestingly, Kosoy et al. (2004a) and Birtles et al., (2001) found Sigmodon
hispidus sequentially infected by novel Bartonella variants, which may indicate
immunity at the species level, though not against Bartonella in general. However, Birtles
et al. (2001) report repeated infections within a single animal by the same variants though
these infections were always separated in time. Acute infections have also been reported
in black-tailed prairie dogs (Cynomys ludovicianus) in the Western U.S. (Bai et al., 2008)
and bank voles (Clethrionomys glareous) and wood mice (Apodemus sylvaticus)
populations in England (Birtles et al., 2001). We found species level differences in the

110
duration of infection in rodents (2 months in P. boylii and 1 month in P. leucopus), but
did not detect site level differences in length of infection of different rodent species.
Therefore, if rodents are exhibiting differential immunity to Bartonella species then
similar Bartonella are infesting rodents at both sites.
Seasonal patterns of Bartonella prevalence- Bartonella prevalence changed
significantly over time (when analyzed across individual trapping periods) but was not
significantly different among seasons. Prevalence is expected to increase during warmer
months, which corresponds to the activity of the ectoparasite that transmits these
organisms. We did find a tendency at all three sites for a peak in prevalence during the
spring-summer months. However, we also saw peaks during fall collections in the VCNP
and in winter months for the Sevilleta (Fig 4.3, 4.4). Three studies have found that
Bartonella infections peak in late summer and autumn (Jardine et al., 2006; Calvet et al.,
2000; Kosoy et al., 2004) though these studies sampled only part of the year. Jardine et
al. (2006) identified late summer as the period of greatest transmission where prevalence
of both Bartonella and fleas was highest. Significant seasonal effects have also been
observed in studies conducted year-round on two rodent species in England (Telfer et al.,
2007a). This study found similar patterns for three species of Bartonella. Specifically,
prevalence of Bartonella peaked in the late summer/fall followed by a drop in the winter
and spring seasons. However, as observed in our data, Telfer et al., (2007a) also found a
peak in Bartonella prevalence in the winter/early spring that they attributed to a single
Bartonella species. Though they suggest that a non-flea or non-ecto mode of transmission
may be responsible for this pattern, it is also possible that these patterns are due to nest or
other fleas, which may not be dormant during winter months.
111
Seasonal patterns are particularly interesting to examine in light of our
observations of Bartonella. It is likely that different Bartonella species are driving the
patterns seen in our study (Figs. 4.1, 4.3, 4.4). These species-specific trends in timing of
peak prevalence indicate some reliance on different flea species with unique ecological
and microclimate requirements. Through this mechanism, climate is expected to play a
significant role in influencing overall trends in Bartonella prevalence. Bai et al. (2008)
found geographic variation in the timing of peak prevalence in their study of black tailed
prairie dogs that may be due to the impact of climatic variations on flea activity patterns.
Similarly, Jardine et al. (2006) note that cool and wet weather conditions may have
negatively influenced the presence of Bartonella by reducing flea vector reproduction.
The sites surveyed in this study each showed unique patterns of prevalence rise and fall
(Figs. 4.1, 4.3, and 4.4) that may be due to climate variations among the sites. Sevilleta,
the warmest and driest site, shows a consistent drop off in prevalence during the hottest
months, which may be due to reductions in flea activity. This pattern is not seen at the
other two sites. Conversely, all three sites showed an increase in prevalence during the
fall of 2006 that may have resulted from regional wide climate patterns, which favored
Bartonella transmission.
Flea vs. Rodent mediated transmission dynamics- Previous studies in the U. S. failed
to find density-prevalence relationships in black-tailed prairie dogs and Richardson’s’
ground squirrels (Jardine et al., 2006; Bai et al., 2008). However, the longitudinal study
conducted in England (Tefler et al., 2007a) found both delayed and current density
dependence for two rodent species. In this study, the prevalence of Bartonella was
influenced by rodent density though this relationship was differently affected by season

112
and sampling location within the three sites surveyed in this study. Bartonella prevalence
was related to host density in spring seasons on the Sevilleta but appear inversely related
for fall seasons. Similarly, within the VCNP, density and prevalence corresponded during
spring but not fall seasons (for low elevation sites). These patterns may reflect a shift
from rodent mediated transmission dynamics to flea mediated processes. Specifically,
transmission of Bartonella during spring months, when flea populations are small is
determined primarily by host contact rates, which corresponds to host density. As
summer progresses, flea populations become much larger (see Chapter 3) and
transmission becomes a function not only of host contact rate but also of the increased
likelihood of begin bitten by a flea vector. In particular, transmission likely becomes a
function of the presence and abundance of certain flea species. Therefore, fall seasons
may vary from year to year depending on the characteristics of flea communities, which
in turn are influenced by seasonal and annual patterns of weather. Elevational trends in
density were evident at the VCNP where density was lowest in upper elevation webs and
highest in lower elevations. Despite these differences in density, prevalence of Bartonella
was similar across all three elevations. However, unlike the low elevation populations,
prevalence of Bartonella at the highest sites tended to follow trends in density despite the
season in which samples were collected. At mid elevations, density and prevalence were
inversely related during the first three sampling periods, but corresponded during the last
three sampling periods (Fig 4.2). Again, this may reflect a change in the mechanism
driving Bartonella cycles. The lower elevations sites on the VCNP contain prairie dog
towns, which tend to carry high flea loads relative to other species (Table 4.1). At higher
elevations, prairie dogs are absent and flea communities may be more restricted by cold

113
weather. Seasonal patterns in the abundance of some flea communities have been
attributed to differential tolerances to cold temperatures (Krasnov et al. 2001). Therefore,
at higher elevation sites, transmission of pathogens between individuals is dependent on
host contact rates as influenced by host density. Conversely, low elevation sites exhibit
large build-ups in the flea populations (see Chapter 3), which presumably increases the
probability of inter-host contacts, thereby increasing the likelihood of disease exchange.
In addition, host contact may be more limiting at upper elevation sites, which show a
lower rodent density than lower elevation sites (Fig. 4.2).
Bartonella is a dynamic parasite that appears to maintain a steady cycle of
infection in wild rodent species. Prevalence of Bartonella appears to be influenced not
only by annual variations in temperature, but also by latitudinal and elevational gradients
,which are characterized by climate gradients. These seasonal and environmental changes
in prevalence point to the importance of flea-mediated mechanisms of Bartonella
transmission. However, host rodent species also play significant roles in determining
overall prevalence in these rodent communities.
Acknowledgments: John Montieneri provided training for the identification of fleas.
Laboratory space and equipment were provided by the Keim genetics lab at Northern
Arizona University (Chris Allender, Dave Wagner), the laboratories of Donald
Duszynski, Samuel Loker, and Joseph Cook at the University of New Mexico, the
University of New Mexico’s Museum of Southwestern Biology, Arthropod Division and
Genomic Resources Division (Sandra Brantley, David Lightfoot, Cheryl Parmenter), the
University of New Mexico’s molecular facility (George Rosenburg, Jennifer Hathaway)
and the Sevilleta Long-Term Ecological Research (LTER) Program. Sequence analysis
114
was conducted at the CDC laboratory in Ft. Collins and the UNM molecular facility. We
also thank the U.S. Fish and Wildlife Service, Sevilleta National Wildlife Refuge, the
U.S. Forest Service, Cibola National Forest, and the VCNP National Preserve for the use
of their lands for this study. This research was funded by the NSF/NIH Ecology of
Infectious Diseases Program (EID-0326757), Sevilleta LTER Graduate Student
Fellowships, and the USDA Forest Service’s Rocky Mountain Research Station,
Albuquerque, NM.

115
References
ALLENDER, C. J., W. R. EASERDAY, M. N. WANERT, D. M. WAGNER AND P. KEIM. 2004. High-throughput extraction of arthropod vector and pathogen DNA using bead milling. Biotechniques 37: 730-734.
AZAD, A. F., S. RADULOVIC, J. A. HIGGINS, B. H. NODEN, AND J.M. TROYER. 1997. Flea-borne Rickettsioses: Ecologic Considerations Emerging Infectious Disease 3: 319-327.
BIA, Y., M. Y. KOSOY, G. O. MAUPIN, R. TSUCHIYA AND K.L GAGE. 2002. Genetic and ecologic characteristics of Bartonella communities in rodents in Southern China American Journal for Tropical Medicine and Hygiene 66: 622-627.
BAI, Y., S. P. MONTGOMERY, K. W. SHEFF, M. A. CHOWDHURY, R. F. BREIMAN, H. K., AND M. Y. KOSOY. 2007 Bartonella Strains in Small Mammals from Dhaka, Bangladesh, Related to Bartonella in America and Europe. American Journal for Tropical Medicine and Hygiene 77: 567-570
BIA, Y. M.Y. KOSOY, C. RAY, R. J. BRINKERHOFF, AND S. K. COLLINGE. 2008. Temporal and spatial patterns of Bartonella infection in black-tailed prairie dogs (Cynomys ludovicianus). Microbial Ecology 56: 373-382.
BIA, Y., M. Y. KOSOY, J.F. CULLY, T. BALA, C. RAY, AND S. K. COLLINGE. 2009. Acquistition of nonspecific Bartonella strains by the northern grasshopper mouse (Onychomys leucogaster). FEMS Microbiological Ecology 61: 438-448.
BIRTLES, R. J., T.J HARRISON, AND DH. MOLYNEUX. 1994. Grahemilla in small woodland mammals in the U.K.: isolation prevalence, and host specificity. Annuals of Tropical Medical Parasitology 88: 317-327.
BIRTLES, R. J. S. M. HAZEL, M. BENNETT, K. BOWN, D. RAOULT, AND M BEGON. 2001. Longitudinal monitoring of the dynamics of infections due to Bartonella species in UK woodland rodents. Epidemiology and Infection 126:323-329.
BOWN, K. J., M. BENNETT, AND M. BEGON. 2004. Flea-borne Bartonella grahamii and Bartonella taylorii in Bank Voles. Emerging Infectious Diseases 10: 684-687.
BREITSCHWERDT, E. B., AND D. L. KORDICK. 2000. Bartonella infection in animals: carriership reservoir potential, pathogenicity, and zoonotic potential for human infection. Clinical Microbiology Reviews 13: 428-438.
BOULOUIS, H. J., F. BARRAT, D. BERMOND, F. BERNEX, D. THIBAULT, R. HELLER, J. J. FONTAINE, Y. PIEMONT, AND B. B. CHOMEL. 2001. Kinetics of Bartonella birtlesii infection in experimentally infected mice and pathogenic effect on reproductive functions. Infection and Immunity 69: 5313–5317.
CASTLE, K.T., M. KOSOY, K. LERDETHUSNEE, L. PHELAN, Y. BAI, K.L. GAGE, W. LEEPITAKRAT, T MONKANNA, N. KHLAIMANEE, K. CHANDRANOI, J.W. JONES, AND R.E. COLEMAN. 2004. Prevalence and diversity of Bartonella in rodents of northern Thailand:

116
a comparison with Bartonella in rodents from southern China. American Journal of Tropical Medicine and Hygiene 70: 429-433.
CHANG, C.-C., H. HAYASHIDANI, N.P. RICKIE, W. KASTEN, J. E. MADIGAN AND B. B. CHOME 2002. Investigation of Bartonella infection in ixodid ticks from California. Comparative Immunology, Microbiology and Infectious Diseases 25: 229-236.
CHOMEL, B. B., R. W. KASTEN, J. E SYKES, H. J BOULOUIS, AND E. B. BREITSCHWERDT. 2003. Clinical impact of persistent Bartonella bacteremia in humans and animals. Annual of the New York Academy of Science 990: 267-278.
CHOMEL, B. B., H-J. BOULOUI, E. B. BREITSCHWERDT, R. W. KASTEN, M. VAYSSIER-TAUSSAT, R. J. BIRTLES, J.E. KOEHLER, AND C. DEHIO. 2009. Ecological fitness and strategies of adaptation of Bartonella species to their hosts and vectors. Veterinary Research 40: 29
DURDEN, L. A., B.A. ELLIS, C. W. BANKS, J. D. CROWE AND J.H. OLIVER, JR. 2004. Ectoparasites of Gray Squirrels in Two Different Habitats and Screening of Selected Ectoparasites for Bartonella. The Journal of Parasitology 90: 485-489
EPSTEIN, P. R. 2001. Climate Change and emerging infectious diseases. Microbes and Infections 3: 747-754.
FICHET-CALVET, E., I. JOMAA, R. BENISMAIL, AND R. W. ASHFORD. 2000. Patterns of infection of haemoparasites in the fat sand rat, Psammomys obesus, in Tunisia, and effect on the host. Annals of Tropical Medicine and Parasitology 94: 55–68.
GITHEKO, A. K. S. W. LINDSAY, U. E. CONFALONIERI, AND J. A. PATZ. 2000. Climate change and vector-borne diseases: a regional analysis. Bulletin of the World Health Organization 78: 1136-1147.
HOLMBERG, M. J. N. MILLS, S. MCGILL, G. BENJAMIN, AND B. A. ELLIS. 2003. Bartonella infection in sylvatic small mammals of central Sweden. Epidemiology and Infections 130: 149-157.
HUBBARD, C. A. 1947. Fleas of Western North America. The Iowa State College Press, Ames, Iowa. pp 533.
INOUE, K. S. MARUYAMA, H. KABEYA, K. HAGIYA, Y. IZUMI, Y. UNE, AND Y. YOSHIKAWA. 2009. Exotic small mammals as potential reservoirs of zoonotic Bartonella spp. Emerging Infectious Diseases 15: 526-532.
JACOMO, V, P. J. KELLY AND D. RAOULT. 2002. Natural history of Bartonella infections (an exception to Koch’s postulate). Clinical and Diagnostic laboratory immunology Jan: 8-18.
JARDINE, C. C. WALDNER, G. WOBESER, AND F. A. LEIGHTON. 2006. Demographic features of Bartonella infections in Richardson’s ground squirrels (Spermophilus richardsonii). Journal of Wildlife Disease 42: 739-749.

117
JONES, R. T. , MCCORMICK, K. F. AND A. P. MARTIN. 2008. Bacterial communities of Bartonella-positive fleas: Diversity and Community assemblage patterns. Applied and Environmental Microbiology 74: 1667-1670. R N A L O F
KIM, CHUL-MIN, JI-YOUNG KIM, YING-HUA YI, MI-JIN LEE, MAE-RIM CHO, DEVENDRA H. SHAH,TERRY A. KLEIN, HEUNG-CHUL KIM, JIN-WON SONG, SUNG-TAE CHONG, MONICA L. O’GUINN, JOHN S. LEE, IN-YONG LEE, JIN-HO PARK, JOON-SEOK CHAE. 2005. Detection of Bartonella species from ticks, mites and small mammals in Korea. Veterinary Science 6: 327–334
KOSOY, M. Y., R. L. REGNERY, T. TZIANABOS, E. L. MARSTON, D. C. JONES, D. GREEN, G. O. MAUPIN, J. G. OLSON AND J. E. CHILDS. 1997. Distribution, diversity and host specificity of Bartonella in rodents from the southeastern United States. American Journal of Tropical Medicines and Hygiene 57: 578-588.
KOSOY, M. Y., E.K. SAITO, D. GREEN, E. L. MARSTON, D.C. JONES, J. E. CHILDS. 2000. Experimental evidence of host specificity of Bartonella infection in rodents. Comparative Immunology, Microbiology and Infectious Disease 23: 221-238.
KOSOY, M., E.MANDEL, D. GREEN, E. MARSTON, J. CHILDS. 2004. Prospective Studies of Bartonella of Rodents. Part I. Demographic and Temporal Patterns in Population Dynamics. Vector-Borne and Zoonotic Diseases. Winter: 285-295.
KOSOY, M., E. MANDEL, D. GREEN, E. MARSTON, D. JONES, J. CHILDS. 2004. Prospective Studies of Bartonella of Rodents. Part II. Diverse Infections in a Single Rodent Community. Vector-Borne and Zoonotic Diseases. Winter: 296-305.
KRASNOV, B. R. SHIKHLOVA, I. S., FEILDEN, L. J. AND N. V. BURDELOVA. 2001. Effect of air temperature and humidity on the survival of imaginal stages of two flea species (Siphonaptera: Pulidea). Journal of Medical Entomology 38: 629-637.
LEWIS, R. E. 2002. A review of the North America species of Oropsylla Wagner and Ioff, 1926 (Siphonaptera: Ceratophyllidea: Ceratophyllinae). Journal of Vector Ecology 27: 184-206.
MILLS, J.N., T.L YATES, J.E. CHILDS, R.R. PARMENTER, T.G. KSIAZEK, P.E. ROLLIN AND C.J. PETERS. 1995 Guidelines for working with rodents potentially infected with Hantavirus. Journal of Mammalogy 76: 716-722.
MORWAY, C., M. KOSOY, R. EISEN, J. MONTENIERI, K. SHEFF, P. J. REYNOLDS AND N. POWERS. 2008. A longitudinal study of Bartonella infection in populations of woodrats and their fleas Journal of Vector Ecology 33(2):353-364.
NOWAL, R. M. AND J. L. PARADISO. 1983. Walker’s Mammals of the World 4th Edition. Volume 1. John Hopkins University Press, Baltimore, pp 568.
PARMENTER, R.R., YATES, T.L., ANDERSON, D.R., BURNHAM, K.P., DUNNUM, J.L., FRANKLIN, A.B., FRIGGENS, M.T., LUBOW, B.C., MILLER, M., OLSON, G.S., PARMENTER, C. A., POLLARD, J., REXSTAD, E., SHENK, T.M., STANLEY, T.R., AND G. C. WHITE. 2003b.
118
Small mammal density estimation: a field comparison of grid-based versus web-based density estimators. Ecological Monographs 73: 1-26.
PRETORIUS, A.-M., L. BEATI AND R. J. BIRTLES 2004. Diversity of bartonellae associated with small mammals inhabiting Free State province, South Africa International Journal of Systematics and Evolutionary Microbiology 54: 1959-1967
REEVES, W. K,, M. P. NELDER AND J. A. KORECKI 2005. Bartonella and Rickettsia in fleas and lice from mammals in South Carolina, U. S. A. Journal of Vector Ecology 30: 310-315.
REEVES, W. K., ROGERS, T. E., DURDEN, L A., AND GREGORY A. DASHCH. 2007. Association of Bartonella with the fleas (Siphonaptera) or rodents and bats using molecular techniques. Journal of Vector Ecology 118-122.
STEVENSON, H.L., BAI, Y., KOSOY, M.Y., MONTENIERI, J.A., LOWELL, J.L., CHU, M.C. AND K.L. GAGE. 2003. Detection of novel Bartonella strains and Yersinia pestis in prairie dogs and their fleas (Siphonaptera: Ceratophyllidae and Pulicidae) using multiplex polymerase chain reaction. Journal of Medical Entomology 40: 329-337.
TELFER, S., H. E. CLOUGH, R. J. BIRTLES, M. BENNETT, D. CARSLAKE, S. HELYAR, AND M BEGON. 2007a. Ecological differences and coexistence in a guild of microparasites: Bartonella in Wild Rodents. Ecology 88: 1841-1849.
TELFER, S. M. BEGON, M. BENNETT, K. J. BOWN, S. BURTHE, X. LAMBIN, G. TELFORD AND R. BIRTLES. 2007b Contrasting dynamics of Bartonella spp. in cyclic field vole populations: the impact of vector and host dynamics. Parasitology 134: 413-425.
THOMAS, L., S.T. BUCKLAND, E.A. REXSTAD, J. L. LAAKE, S. STRINDBERG, S. L. HEDLEY, J. R.B. BISHOP, T. A. MARQUES, AND K. P. BURNHAM. 2010. Distance software: design and analysis of distance sampling surveys for estimating population size. Journal of Applied Ecology 47: 5-14.
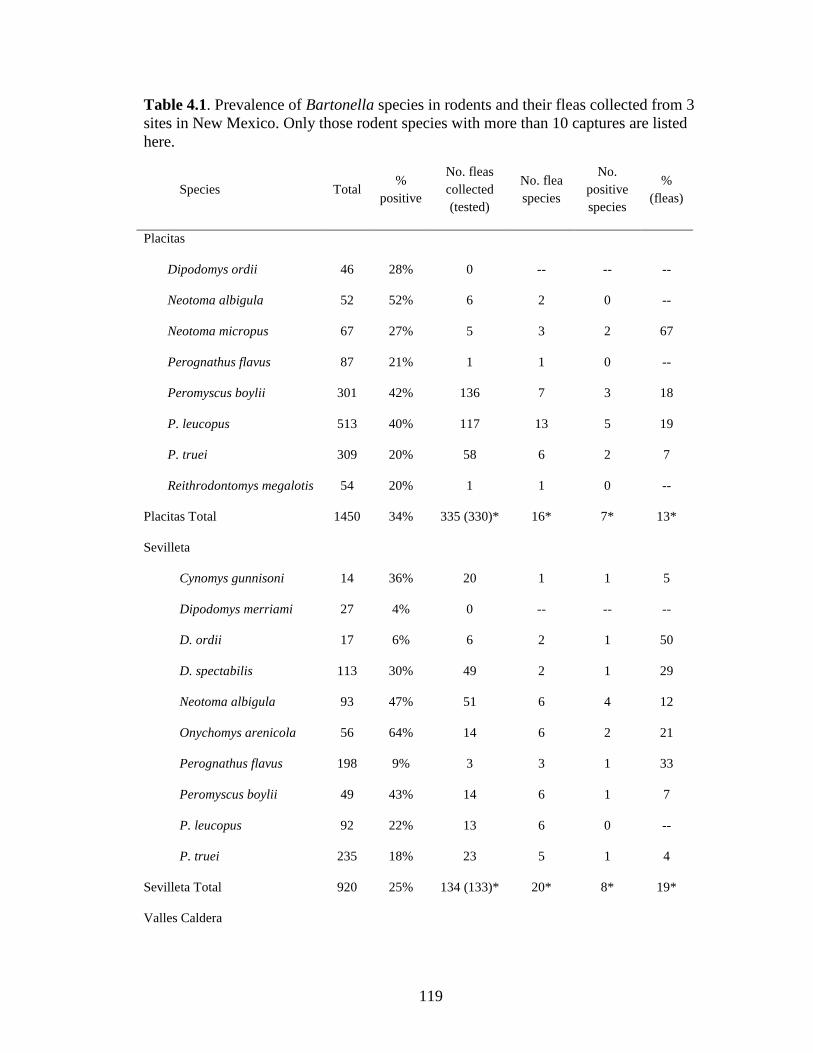
119
Table 4.1. Prevalence of Bartonella species in rodents and their fleas collected from 3 sites in New Mexico. Only those rodent species with more than 10 captures are listed here.
Species Total %
positive
No. fleas collected (tested)
No. flea species
No. positive species
% (fleas)
Placitas
Dipodomys ordii 46 28% 0 -- -- --
Neotoma albigula 52 52% 6 2 0 --
Neotoma micropus 67 27% 5 3 2 67
Perognathus flavus 87 21% 1 1 0 --
Peromyscus boylii 301 42% 136 7 3 18
P. leucopus 513 40% 117 13 5 19
P. truei 309 20% 58 6 2 7
Reithrodontomys megalotis 54 20% 1 1 0 --
Placitas Total 1450 34% 335 (330)* 16* 7* 13*
Sevilleta
Cynomys gunnisoni 14 36% 20 1 1 5
Dipodomys merriami 27 4% 0 -- -- --
D. ordii 17 6% 6 2 1 50
D. spectabilis 113 30% 49 2 1 29
Neotoma albigula 93 47% 51 6 4 12
Onychomys arenicola 56 64% 14 6 2 21
Perognathus flavus 198 9% 3 3 1 33
Peromyscus boylii 49 43% 14 6 1 7
P. leucopus 92 22% 13 6 0 --
P. truei 235 18% 23 5 1 4
Sevilleta Total 920 25% 134 (133)* 20* 8* 19*
Valles Caldera
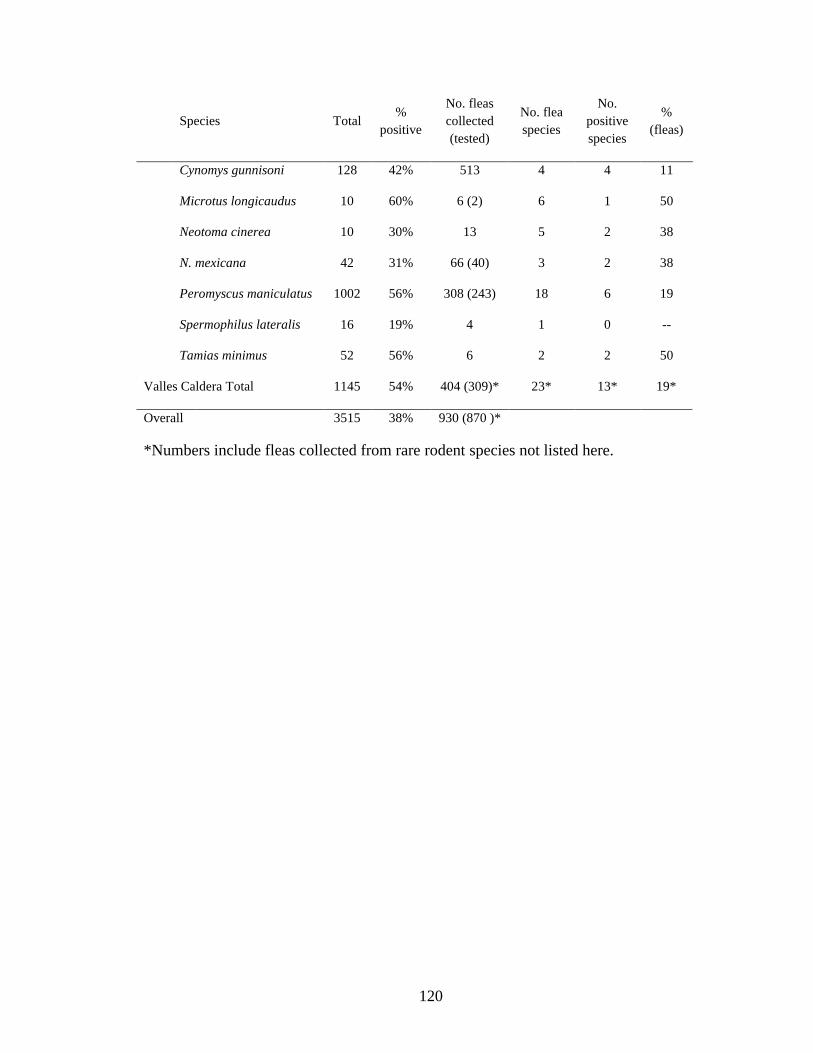
120
Species Total %
positive
No. fleas collected (tested)
No. flea species
No. positive species
% (fleas)
Cynomys gunnisoni 128 42% 513 4 4 11
Microtus longicaudus 10 60% 6 (2) 6 1 50
Neotoma cinerea 10 30% 13 5 2 38
N. mexicana 42 31% 66 (40) 3 2 38
Peromyscus maniculatus 1002 56% 308 (243) 18 6 19
Spermophilus lateralis 16 19% 4 1 0 --
Tamias minimus 52 56% 6 2 2 50
Valles Caldera Total 1145 54% 404 (309)* 23* 13* 19*
Overall 3515 38% 930 (870 )*
*Numbers include fleas collected from rare rodent species not listed here.

121
Table 4.2. List of Bartonella positive fleas collected from rodents captured at three sites in New Mexico.
Site Species Flea Species No. Tested Prevalence
Placitas Neotoma micropus Orchopeas s. agilis 1 1
Orchopeas s. neotomae 1 1
Peromyscus boylii Malaraeus sinomus 116 0.20
Orchopeas leucopus 4 0.25
Peromyscopsylla hesperomys 11 0.09
P. leucopus Malaraeus sinomus 45 0.09
Orchopeas leucopus 30 0.32
Peromyscopsylla adelpha 2 1
Peromyscopsylla hemispherium 3 0.33
Peromyscopsylla hesperomys 24 0.17
P. truei Malaraeus sinomus 41 0.07
Orchopeas leucopus 7 0.14
Sevilleta Dipodomys ordii Meringis arachis 4 0.75
D. spectabilis Meringis arachis 44 0.32
Neotoma albigula Echidnophaga gallinacea 22 0.05
Orchopeas s. agilis 10 0.3
Orchopeas s. schisintus 11 0.09
Orchopeas s.agilis 2 0.5
Onychomys arenicola Malaraeus telchinus 7 0.14
Pleochaetis e. exilis 2 0.5
O. leucopus Pleochaetis e. triptus 1 1
Perognathus flavus Meringis shannoni 1 1
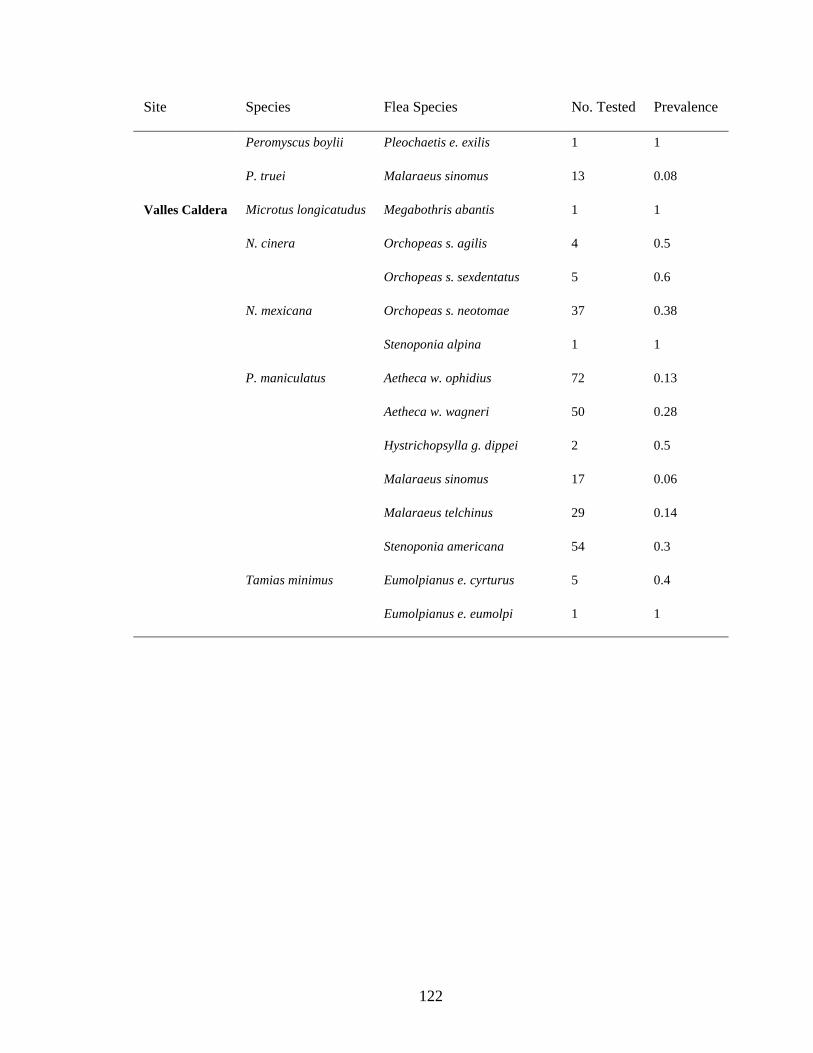
122
Site Species Flea Species No. Tested Prevalence
Peromyscus boylii Pleochaetis e. exilis 1 1
P. truei Malaraeus sinomus 13 0.08
Valles Caldera Microtus longicatudus Megabothris abantis 1 1
N. cinera Orchopeas s. agilis 4 0.5
Orchopeas s. sexdentatus 5 0.6
N. mexicana Orchopeas s. neotomae 37 0.38
Stenoponia alpina 1 1
P. maniculatus Aetheca w. ophidius 72 0.13
Aetheca w. wagneri 50 0.28
Hystrichopsylla g. dippei 2 0.5
Malaraeus sinomus 17 0.06
Malaraeus telchinus 29 0.14
Stenoponia americana 54 0.3
Tamias minimus Eumolpianus e. cyrturus 5 0.4
Eumolpianus e. eumolpi 1 1
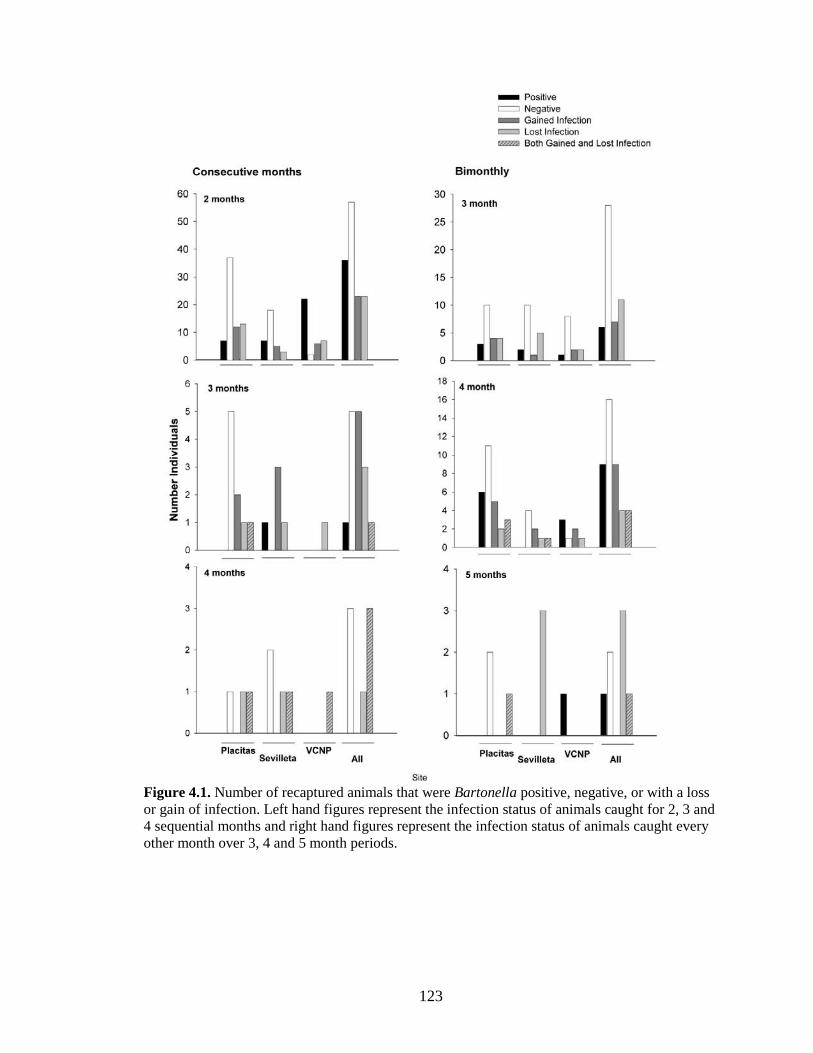
123
Figure 4.1. Number of recaptured animals that were Bartonella positive, negative, or with a loss or gain of infection. Left hand figures represent the infection status of animals caught for 2, 3 and 4 sequential months and right hand figures represent the infection status of animals caught every other month over 3, 4 and 5 month periods.
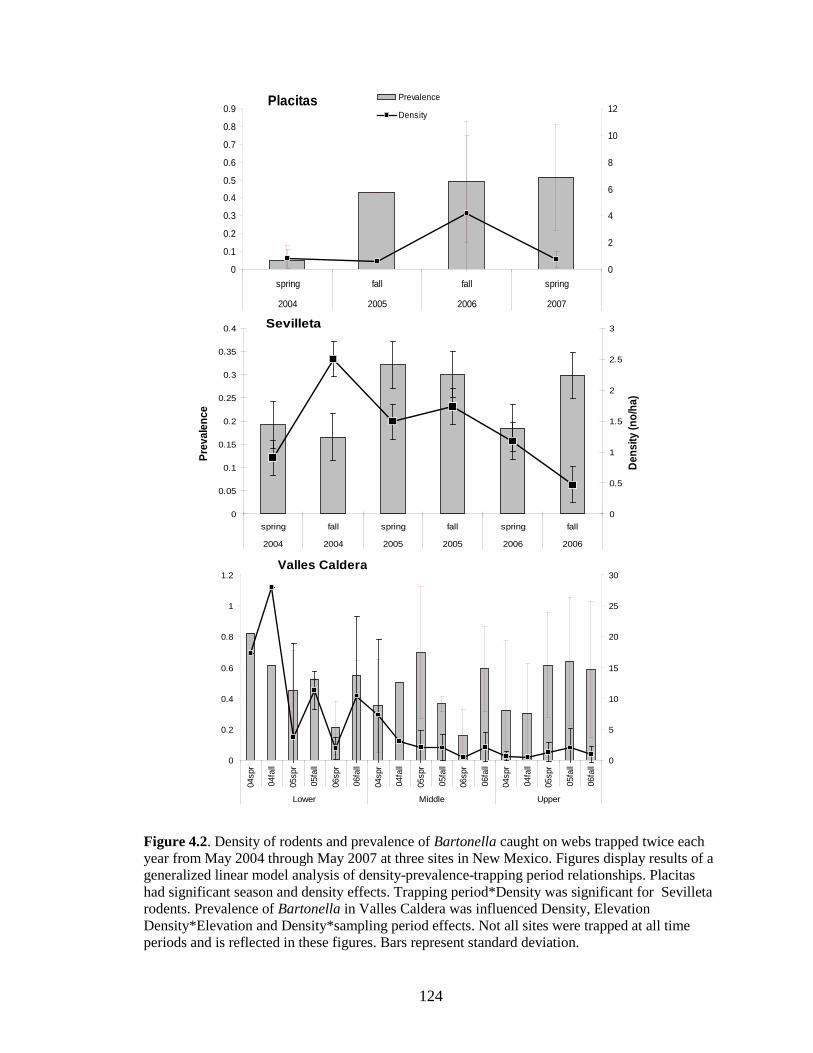
124
0
0.05
0.1
0.15
0.2
0.25
0.3
0.35
0.4
spring fall spring fall spring fall
2004 2004 2005 2005 2006 2006
0
0.5
1
1.5
2
2.5
3
Dens
ity (n
o/ha
)
Prev
alen
ce
Sevilleta
0
0.2
0.4
0.6
0.8
1
1.2
04sp
r
04fa
ll
05sp
r
05fa
ll
06sp
r
06fa
ll
04sp
r
04fa
ll
05sp
r
05fa
ll
06sp
r
06fa
ll
04sp
r
04fa
ll
05sp
r
05fa
ll
06fa
ll
Lower Middle Upper
0
5
10
15
20
25
30Valles Caldera
0
0.1
0.2
0.3
0.4
0.5
0.6
0.7
0.8
0.9
spring fall fall spring
2004 2005 2006 2007
0
2
4
6
8
10
12Prevalence
DensityPlacitas
Figure 4.2. Density of rodents and prevalence of Bartonella caught on webs trapped twice each year from May 2004 through May 2007 at three sites in New Mexico. Figures display results of a generalized linear model analysis of density-prevalence-trapping period relationships. Placitas had significant season and density effects. Trapping period*Density was significant for Sevilleta rodents. Prevalence of Bartonella in Valles Caldera was influenced Density, Elevation Density*Elevation and Density*sampling period effects. Not all sites were trapped at all time periods and is reflected in these figures. Bars represent standard deviation.
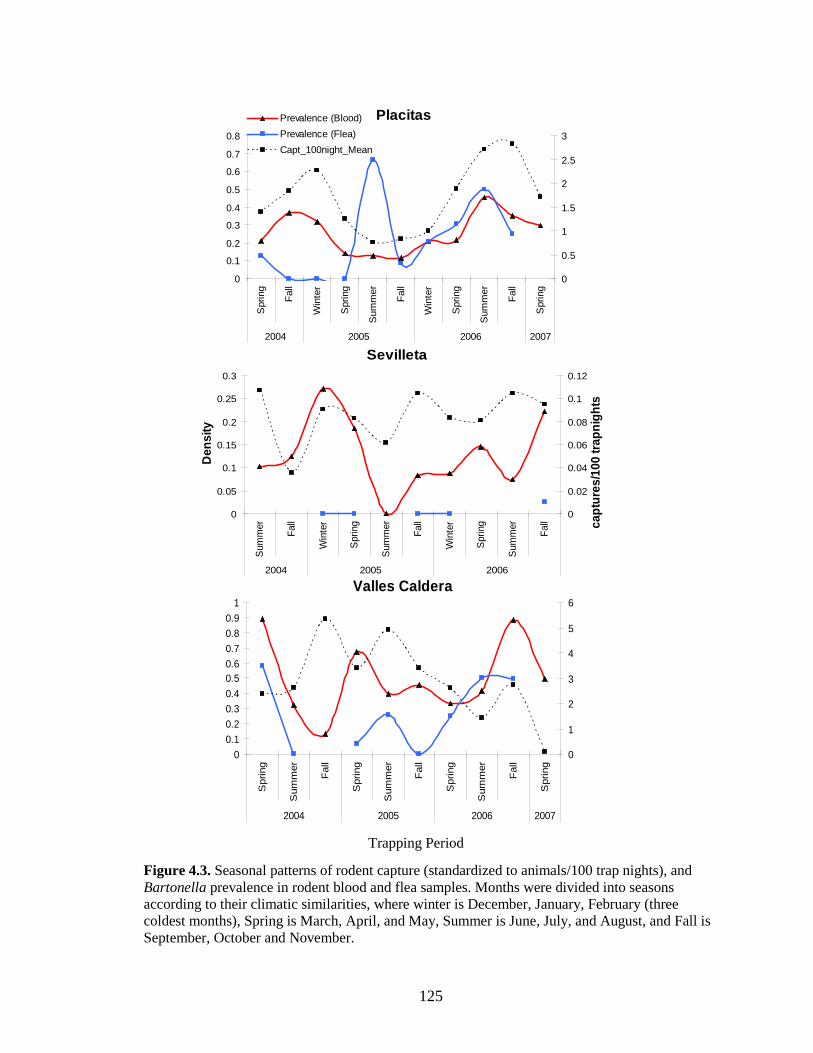
125
Placitas
0
0.1
0.2
0.3
0.4
0.5
0.6
0.7
0.8
Spr
ing
Fall
Win
ter
Spr
ing
Sum
mer
Fall
Win
ter
Spr
ing
Sum
mer
Fall
Spr
ing
2004 2005 2006 2007
0
0.5
1
1.5
2
2.5
3
Prevalence (Blood)Prevalence (Flea)Capt_100night_Mean
Valles Caldera
00.10.20.30.40.50.60.70.80.9
1
Spr
ing
Sum
mer
Fall
Spr
ing
Sum
mer
Fall
Spr
ing
Sum
mer
Fall
Spr
ing
2004 2005 2006 2007
0
1
2
3
4
5
6
Sevilleta
0
0.05
0.1
0.15
0.2
0.25
0.3
Sum
mer
Fall
Win
ter
Sprin
g
Sum
mer
Fall
Win
ter
Sprin
g
Sum
mer
Fall
2004 2005 2006
0
0.02
0.04
0.06
0.08
0.1
0.12
capt
ures
/100
trap
nigh
ts
Den
sity
Figure 4.3. Seasonal patterns of rodent capture (standardized to animals/100 trap nights), and Bartonella prevalence in rodent blood and flea samples. Months were divided into seasons according to their climatic similarities, where winter is December, January, February (three coldest months), Spring is March, April, and May, Summer is June, July, and August, and Fall is September, October and November.
Trapping Period
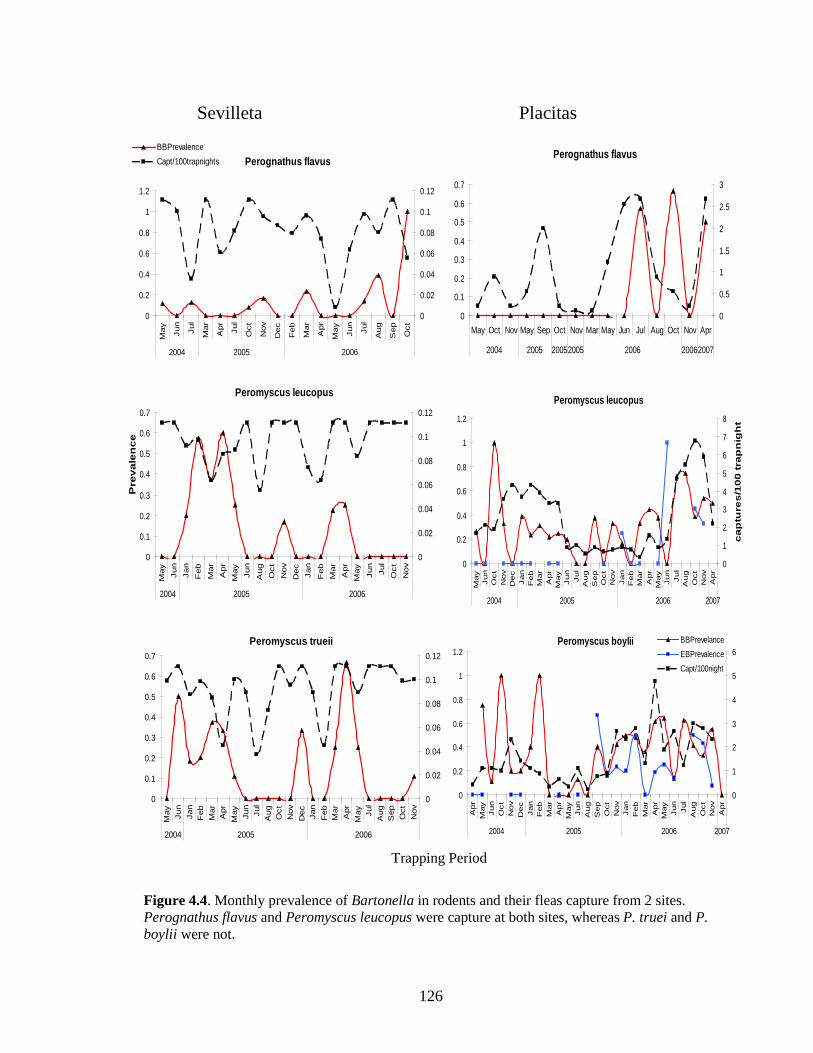
126
Peromyscus trueii
0
0.1
0.2
0.3
0.4
0.5
0.6
0.7
May Ju
nJa
nF
ebM
arA
prM
ay Jun
Jul
Aug Oct
Nov
Dec Ja
nF
ebM
arA
prM
ay Jul
Aug
Sep Oct
Nov
2004 2005 2006
0
0.02
0.04
0.06
0.08
0.1
0.12
Peromyscus leucopus
0
0.1
0.2
0.3
0.4
0.5
0.6
0.7
May Ju
nJa
nF
eb
Mar
Apr
May Ju
n
Aug Oct
Nov
Dec Ja
n
Feb
Mar
Apr
May Ju
nJu
lO
ctN
ov
2004 2005 2006
0
0.02
0.04
0.06
0.08
0.1
0.12
Pre
vale
nce
Perognathus flavus
0
0.2
0.4
0.6
0.8
1
1.2
May Ju
n
Jul
Mar
Apr Ju
l
Oct
Nov
Dec
Feb
Mar
Apr
May Ju
n
Jul
Aug
Sep Oct
2004 2005 2006
0
0.02
0.04
0.06
0.08
0.1
0.12
BBPrevalenceCapt/100trapnights
Perognathus flavus
0
0.1
0.2
0.3
0.4
0.5
0.6
0.7
May Oct Nov May Sep Oct Nov Mar May Jun Jul Aug Oct Nov Apr
2004 2005 20052005 2006 20062007
0
0.5
1
1.5
2
2.5
3
Peromyscus boylii
0
0.2
0.4
0.6
0.8
1
1.2
Apr
May
Jun
Oct
Nov
Dec
Jan
Feb
Mar
Apr
May
Jun
Aug
Sep
Oct
Nov
Jan
Feb
Mar
Apr
May
Jun
Jul
Aug
Oct
Nov
Apr
2004 2005 2006 2007
0
1
2
3
4
5
6BBPrevelanceEBPrevalenceCapt/100night
Peromyscus leucopus
0
0.2
0.4
0.6
0.8
1
1.2
May
Jun
Oct
Nov
Dec
Jan
Feb
Mar
Apr
May
Jun
Jul
Aug
Sep
Oct
Nov
Jan
Feb
Mar
Apr
May
Jun
Jul
Aug
Oct
Nov
Apr
2004 2005 2006 2007
0
1
2
3
4
5
6
7
8
ca
ptu
res
/10
0 t
rap
nig
ht
Figure 4.4. Monthly prevalence of Bartonella in rodents and their fleas capture from 2 sites. Perognathus flavus and Peromyscus leucopus were capture at both sites, whereas P. truei and P. boylii were not.
Sevilleta Placitas
Trapping Period

127
CHAPTER 5: DISCUSSION AND CONCLUSIONS Fleas are important for the maintenance of plague over time and are the primary
mechanism by which plague is transmitted among hosts (Gage and Kosoy 2005). Flea
lifecycles, which include both on host and off host stages, are influenced not only by their
physical surroundings but also by changes in host populations. These influences are
dynamic and interact to determine the final composition of flea communities at a given
site and time. The analysis presented in Chapter 2 demonstrates a relationship between
flea community composition and habitat disturbance. The impact of human land use and
change on flea communities is mediated through changes in host populations and the
physical environment of their habitat. Loss of diversity favors generalist species, both in
host and flea communities. Generalist rodents tend to carry high flea burdens and diverse
flea communities and are commonly reservoirs to zoonotic diseases (Keesing et al., 2006;
Escogue 1976; Wilcox and Gubler, 2006). Peromyscus maniculatus, a reservoir of Hanta
virus and potentially of plague, is an excellent example of such a species captured during
this study. This species harbored the most diverse flea communities and was among the
most heavily infested rodents (Table 4.2). Generalist flea species, which infest a diversity
of hosts, are often important vectors for diseases (Molynuex et al., 2003; Hawlena et al.,
2007; Neito et al., 2007). Not only do these species facilitate transmission among
different wildlife species, but they also tend to be numerically dominate on their hosts.
Two flea species found in this study, Aetheca sinomus and Malareus telchinus, infest a
diversity of hosts and are known to transmit Y. pestis (Appendix 5, Table 4.2).
High flea burdens and a high prevalence of fleas are also associated with
increased disease transmission in rodent communities. In Chapter 2, both intensity of
128
infestation and prevalence increased with increasing disturbance, which indicates high
disturbance sites may be more prone to disease outbreak. An increase in flea abundance
leads to greater transmission of flea borne diseases by increasing the likelihood that fleas
will be transfer between host species. This effect may also be achieved when host density
increases and leads to greater contact between individuals and a greater likelihood of flea
and disease exchange. Thus, the conclusions of Chapter 4, which found a relationship
between current rodent density and prevalence of Bartonella, indicate a role of fleas in
transferring this pathogen. In Chapter 3, increases in flea abundance observed just prior
to a prairie dog plague epizootic and it may be that plague arose because the ideal
conditions were present in the flea communities.
The prairie dogs inhabiting the Valles Caldera underwent a plague epizootic
during this study, which allowed us to examine the characteristics of the flea
communities associated with plague affected and non-affected towns. We found the
number of fleas per host and per infested host and burrow were higher in plague-affected
than non-affected colonies. Though some of the increase was due to the sudden loss of
host species, which left a large number of fleas remaining in burrows and concentrated on
surviving animals, we do not have an explanation for the pre-plague build-up in flea
populations. One likely source of variation, not examined in this study, is the influence of
seasonal and annual weather patterns on flea reproduction and survival. Oropsylla hirsuta
and O. t tuberculata were the primary fleas involved in prairie dog plague epizootics.
Oropsylla hirsuta is the most common flea implicated in the spread of plague in prairie
dog towns (Cully and Williams, 2001) particularly with respect to supporting the fast
moving epizootics commonly reported to occur in prairie dog colonies (Ubico et al.,

129
1988; Cully et al., 1997). However, this was the first report of plague infected O. t.
tuberculata from prairie dog burrows. One of the most important conclusions to come
from these observations regards the important role of the prairie dog burrow for the
exchange of fleas and flea-borne diseases.
P. maniculatus and O. leucopus have been proposed as potential enzootic hosts.
Both species show variable resistance and exhibit the population characteristics (e.g. high
reproductive rates) that are characteristic of enzoonotic hosts (Gratz, 1999). In this study,
Peromyscus maniculatus were abundant around prairie dog towns that became infected
with plague (Chapter 3) and P. maniculatus carried a diversity of fleas that could
potentially carry plague (Table 4.2). However, plague was not found in P. maniculatus
nor any of rodents of the Valles Caldera (other than prairie dogs) surveyed in this study.
Plague was detected in a number of non-prairie dog fleas however. Plague positive fleas
were pulled from Peromyscus maniculatus (2), Neotoma mexicana (1) and Spermophilus
spilosoma (1) in the VCNP and from Dipodomys spectabilis (2), N. albigula (1), and
Onychomys arenicola (1) on the Sevilleta. Thus, there is only indirect evidence that these
species may be reservoirs of plague. However, the results of these surveys point to the
potentially greater sensitivity of flea over rodent surveys for the detection of plague in the
environment.
Ground squirrels, Spermophilus lateralis, may play a role in transferring infected
fleas between reservoir host species (Lechleitner et al., 1968; Anderson and Williams,
1997). Ground squirrels and prairie dogs often share flea species and exchange between
these hosts is particularly evident during plague outbreaks (Ecke and Johnson 1950;
Anderson and Williams, 1997; Cully and Williams, 2001). In the Valles Caldera, ground

130
squirrels were abundant on prairie dog towns, readily used prairie dog burrows, and
ground squirrel associated fleas were positive for plague. It seems likely that S. lateralis
are important to the plague cycle in the Valles Caldera and should be included in future
investigations of potential enzootic hosts.
In conclusion, environmental factors can influence the realized role of fleas as
disease vectors in a number of ways. In this dissertation, I show that anthropogenic
disturbance can increase the risk of flea borne disease spread through changes in flea
community composition. Specifically, fleas infested a larger proportion of hosts with a
greater number of individuals in high disturbance sites. These characteristics appear
important in prairie dog epizootics where a buildup in flea populations in burrows were
associated with prairie dog plague outbreaks in the Valles Caldera. In addition, rodents in
the Valles Caldera carried more fleas and a greater diversity of flea species, which may
explain why we see plague in the Valles Caldera but not the Sevilleta. Bartonella cycles
within rodent populations most likely reflect a relationship with flea vector species. In
addition, it is likely that pathogen-vector interactions are species-specific where seasonal
variations in the prevalence of Bartonella match variations seen for their favored flea
species. Thus, it is likely that the emergence of Bartonella as a pathogen of global
importance will be prone to the same influences as plague and other flea-borne diseases.
Bartonella may prove valuable for future research that aims to identify species-specific
interactions within flea-borne pathogen systems. Through these individual analyses, I
found evidence for anthropogenic mediated and seasonally related changes in flea
communities that are associated with an increased risk for disease transmission and
perhaps initiated an outbreak in a Gunnison’s prairie dog colony. This supports

131
predictions and observations made by others that warn of the potential for increase in the
range and frequency of vector borne diseases (Githeko et al. 2000; Epstein, 2001; Harvell
et al. 2002). Arthropod vectors are pivotal components in the disease cycles. At this time,
it appears that many of the conditions projected for the future will benefit those species
and conditions that promote disease transmission.
132
Literature Cited Anderson, S. H., and E. Williams (1997) Plague in a complex of white-tailed prairie dogs and associated small mammals in Wyoming. Journal of Wildlife Diseases 33: 720-732
Cully, J. F., and E. S. Williams (2001) Interspecific comparisons of sylvatic plague in prairie dogs. Journal of Mammalogy 82: 894-905.
Ecke, D. H., and C. W. Johnson (1950) Sylvatic plague in Park County, Colorado. Transactions of the North American Wildlife Conference 15: 191-197.
Egoscue, H. J. (1976) Flea exchange between deer mice and some associated small mammals in western Utah. Great Basin Naturalist 36: 475–480.
Epstein, P.R. (2001) Climate change and emerging infectious diseases. Microbes and Infection 3: 747–754
Gage, K., and Kosoy, M. (2005) Natural History of Plague, Perspectives from more than a century of research. Annual Review of Entomology 50: 505-528.
Gettinger, D. & Ernest, K.A. (1995) Small-mammal community structure and the specificity of ectoparasite associations in central Brazil. Revista brasileira de biologia 55: 331-341.
Githeko, A.K., Lindsay, S.W., Confalonieri, U.E. and J.A. Patz (2000) Climate change and vector-borne diseases: a regional analysis. Bulletin of the World Health Organization 78: 1136-1147.
Gratz, N. (1999) Rodent reservoirs and flea vectors of natural foci of plague. Plague Manual: Epidemiology, Distribution, Surveillance and Control WHO/CDS/CSR/EDC 22.2: 61- 96
Hawlena, H., Abramsky, Z., Krasnov, B.R. and D. Saltz (2007) Host defense versus intraspecific competition in the regulation of infrapopulations of the flea Xenopsylla conformis on it rodent host Meriones crassus. International Journal for Parasitology 37: 919-925.
Harvel, D. Mitchell, C.E., Ward, J.R., Altizer, S., Dobson, A.P., Ostfeld, R.S. and M.D. Samuel (2002) Climate warming and disease risk for terrestrial and marine biota. Science 296: 2158-2162.
Keesing, F, Holt, R.D. and R.S. Ostfeld (2006) Effects of species diversity on disease risk. Ecology Letters 9: 485-498.
Lechleitner, L. Kartman, M. I. Godenberg, and B. W. Hudson (1968) An epizootic of plague in Gunnison’s prairie dogs (Cynomys gunnisoni) in south-central Colorado. Ecology 49: 734-743.

133
Molyneux, D.H. (2003) Climate change and tropical disease: Common themes in changing vector-borne disease scenarios. Transactions of the Royal Society of Tropical Medicine and Hygiene 97: 129-132.
Nieto, N.C., Dabritz, H., Foley, P., Drazenovich, N., Calder, L., Adjemian, J., Conrad, P.A., and J.E. Foley (2007) Ectoparasite diversity and exposure to vector-borne disease agents in wild rodents in central coastal California. Journal of Medical Entomology 44: 328-35.
Wilcox, B.A. and D.J. Gubler (2005) Disease ecology and the global emergence of zoonotic pathogens. Environmental Health and Preventive Medicine 10: 263- 72.
134
APPENDICES Appendix 1- Papers used in comparative analysis of anthropogenic disturbance on flea communities and flea-host associations. .............................................................................................135
Appendix 2. Scatter plot diagrams with loess (locally weighted scatterplot smoothing) lines for variables relating to mammal and flea community characteristics compiled from 63 studies reporting the fleas of small mammal communities at a variety of locations across the world. All values are log transformed. .................................................................................................................142
Appendix 3. List of small mammal species reported in 70 studies used for a comparative analysis of anthropogenic disturbance on flea communities and flea- host associations. Parentheses indicate original reporting name .........................................................................................................143
Appendix 4-List of flea species reported in 70 studies used for a comparative analysis of anthropogenic disturbance on flea communities and flea- host associations. Parentheses indicate original reporting name .......................................................................................................................150
Appendix 5. List of flea species, number and prevalence with Bartonella that were collected from rodent species trapped at three sites in New Mexico from May 2004 through May 2007. Questionable flea identifications are not listed here. ..........................................................................156

135
Appendix 1- Papers used in comparative analysis of anthropogenic disturbance on flea communities and flea-host associations.
1. Achuthan, C. and R. K. Chandrahas. 1971. Seasonal prevalence of rat fleas in Kolar (Mysore State). The Indian Journal of Medical Research 59: 833-837.
2. Adler, G.H., Suntsova, N.I., Suntsov, V.V. and S.A. Mangan. 2001. Fleas (Siphonaptera) Collected from Small Mammals in Southern Viet Nam in 1997-1998. Journal of Medical Entomology 38: 210-213.
3. Allred, D. M. 1968. Fleas of the national reactor testing station. Great Basin Naturalist 2: 73-87.
4. Anderson, S.H., and E.S. Williams. 1997. Plague in a complex of white-tailed prairie dogs and associated small mammals in Wyoming. Journal of Wildlife Diseases 33: 720–732
5. Bakr, M.E., Morsy, T.A., Nassef, N.E., and M.A El Meligi. 1996. Flea ectoparasites of commensal rodents in Shebin El Kom, Menoufia Governorate, Egypt. Journal of the Egyptian Society of Parasitology 26: 39-52.
6. Barros-Battesti, D.M., Arzua, M., Linardi, P.M., Botelho, J.R., and I.J. Sbalqueiro. 1998. Interrelationship between ectoparasites and wild rodents from Tijucas do Sul, state of Parana, Brazil. Memorias do Instituto Oswaldo Cruz 93: 719-725.
7. Beaucournu, J., Sountsova, N.I., Ly, T.V.H., and V.V. Sountsov. 2002. Contribution to the study of plague from Vietnam: Historical views and list of the collected fleas (Insecta - Siphonaptera) in anthropic zones. Parasite 9: 3-10.
8. Bengston, S. A., Brinck-Lindroth, G., Lundquvist, L., Nilsson, A. and S. Rundgren. 1986. Ectoparasites on small mammals in Iceland: Origin and population characteristics of a species-poor insular community. Holarctic Ecology 9: 143-148.
9. Bittencourt, E.B. and C.F.D. Rocha. 2003. Host-ectoparasite specificity in a small mammal community in an area of Atlantic rain forest (Ilha Grande, State of Rio
136
de Janeiro), Southeastern Brazil. Memorias do Instituto Oswaldo Cruz 98: 793-798.
10. Bossi, D. E. P., Linhares, A. X. and H. de Godoy Bergallo. 2002. Parasititic arthropods of some wild rodents from Juréia-Itatins Ecological Station, State of São Paulo, Memorias do Instituto Oswaldo Cruz 7: 959-963.
11. Bossard, R.L. 2006. Mammal and Flea Relationships In The Great Basin Desert: From H. J. Egoscue's Collections. Journal of Parasitology 92: 260-266.
12. Buckner, C. H. 1964. Fleas (Siphonaptera) of Manitoba mammals. Canadian Entomology 96: 850-856.
13. Campos, E.G., Maupin, G.O., Barnes, A.M. and R.B. Eads. 1985. Seasonal occurrence of fleas (Siphonaptera) on rodents in a foothills habitat in Larimer County, Colorado, USA. Journal of Medical Entomology 22: 266-270.
14. Carrión, A. L. 1930.Third report on a rat-flea survey of the city of San Juan, Porto Rico. Public Health Reports 45: 150.
15. Chenchijtikul, M., Daengpium, S. Hasegawa, M., Itoh, T. and B. Phanthumadchinda. 1983. A study of commensal rodents and shrews with reference to the parasites of medical importance in Chanthaburi Province, Thailand. Southeast Asian Journal of Tropical Medicine and Public Health 14: 255-259.
16. Clark, K.L. and L.A. Durden. 2002. Parasitic Arthropods of Small Mammals in Mississippi. Journal of Mammalogy 83: 1039-1048.
17. Cole, L.C., and J.A. Koepke. 1946. A study of rodent ectoparasites in Mobile Alabama. Public Health Reports 41: 1469-1487.
18. Cole, L.C., and J.A. Koepke. 1947. Problems of interpretation of the data of rodent-ectoparasite surveys and studies of rodent ectoparasites in Honolulu, T.H., Savannah, GA, and Dothan, AL. Public Health Report Supplement 202: 1-72.
19. Coultrip, R.L., Emmons, R.W., Legsters, L. J., Marshall, Jr., J.D., and K. F. Murray. 1973. Survey for the arthropod vectors and mammalian host of Rocky
137
Mountain spotted fever and plague at Fort Ord. California Journal of Medical Entomology 10: 303-309.
20. Davis, R.M., Smith, R.T., Madon, M.B. and E. Sitko-Cleugh. 2002. Flea, rodent, and plague ecology at Chuchupate Campground, Ventura County, California. Journal of Vector Ecology 27: 107-127.
21. Deguisti, D.L, and C.F. Hartley. 1965. Ectoparasites of rats from Detroit, Michigan. American Journal of Tropical Medicine and Hygiene 14: 309-313.
22. Durden, L.A. and B.F. Page. 1991. Ectoparasites of commensal rodents in Sulawesi Utara, Indonesia, with notes on species of medical importance. Medical and Veterinary Entomology 5: 1-7.
23. Eads, R. B. and E. G. Campos. 1983. Deer mouse, Peromyuscus maniculatus, and associated rodent fleas (Siphonaptera) in the artic-alpine life zone of Rocky mountain National Park, Colorado. Great Basin Naturalist 43: 169-174.
24. Gaaboub, I.A., Widaatalla, A.E.E. and N.L. Kelada. 1981. Survey of rats and mice and their ectoparasites in relation to cultivated areas in the vicinity of Alexandria Governorate, Egypt. Journal of Agricultural Science 97: 551-555.
25. Geevarghese, G., Mourya, D.T., Shetty, P.S. and M.D. Gokhale. 1997. Note on the fleas of small mammals in Beed district, Maharashtra State, India. The Journal of Communicable Diseases 29: 361-362.
26. Gettinger, D. & K.A. Ernest. 1995. Small-mammal community structure and the specificity of ectoparasite associations in central Brazil. Revista brasileira de biologia 55: 331-341.
27. Graves, G.N., Bennett, W. C., Wheeler, J.R., Miller, B. E., and D.L. Forcum. 1974. Sylvatic plague studies in southeast New Mexico: I. Flea-Host relationships from six years' study. Journal of Medical Entomology 11: 488-498.
28. Haas, G. E. Martin, R. P., Swichard, M., and B. E. Miller. 1973. Siphonaptera-mammal relationships in north central New Mexico. Journal of Medical Entomology 10: 281-289.
138
29. Harrison, J.O. (1954). An ectoparasite study of the cotton rat, Sigmodon hispidus hispidus (Say & Ord), and some other small mammals of Georgia. Thesis, Athens Georgia, Mercer University.
30. Hastriter, M.W., Alarcon, M.E. and M. F. Whiting. 2001. A Collection of fleas (Siphonaptera) from the San Martin Reserve, Valdivia Province, Chile. Proceedings of the Entomological Society of Washington 103: 437-443.
31. Hastriter, M.W., Frafjord, K. and M.F. Whiting. 2004. A collection of Norwegian fleas (Siphonaptera) north of the Arctic Circle. Proceedings of the Entomological Society of Washington 106: 877-883.
32. Heisch, R.B., Grainger, W.E. and S.T.A. D'Souza, Jr. 1953. Results of a plague investigation in Kenya. Transactions of the Royal Society of Tropical Medicine and Hygiene 47: 503-521.
33. Holdenried, R, and S.F. Quan. 1956. Susceptibility of New Mexico rodents to experimental plague. Public Health Reports 71: 979–984.
34. Jurík, M. 1983. To the knowledge of ecological conditions affecting the occurrence of specific and non-specific flea species on their host (Talpa europaea- Siphonaptera). Biologia (Bratislava) 38: 949-957.
35. Khalid, M.L., Morsy, T.A., el Shennawy, S.F., Farrag, A.M., Sabry, A.H. and Mostafa, H.A. 1992. Studies on flea fauna in El Fayoum Governorate, Egypt. Journal of the Egyptian Society of Parasitology 22: 783-799.
36. Krasnov, B.R., Shenbrot, G.I., Medvedev, S.G., Vatschenok, V.S., and I.S. Khokhlova. 1997. Host-habitat relations as an important determinant of spatial distribution of flea assemblages (Siphonaptera) on rodents in the Negev desert. Parasitology 114:159-74.
37. Lareschi, M. and A. Iori.1998. Nuevas citas de Siphonaptera (Phopalopsyllidae e Hystrichopsyllidae) parasitos de redores (Rodentia, Muridea) de la provinical de Buenos Aires, Argentina. Revista Barileira de Entomologia 41:165-167.
38. Lareschi, M., Notarnicola, J., Navone, G, and P.M. Linardi. 2003. Arthropod and filaroid parasite associated with wild rodents in the northeast marshes of Buenos Aires. Argentina Memorias do Instituto Oswaldo Cruz 98: 637-677.

139
39. Liat, L.B., Sustriayu, N., Hadi, T.R., and Y. H. Bang. 1980. A study of small mammals in the Ciloto Field station area, West Java, Indonesia, with special reference to vectors of plague and scrub typhus. Southeast Asian Journal of Tropical Medicine and Public Health 11: 71-80.
40. Linardi, P.M., Gomes, A.F., Botelho, J.R., and C.M.L. Lopes. 1994. Some ectoparasites of commensal rodents from Huambo, Angola. Journal of Medical Entomology 31: 754-756.
41. Luyon, H.A.V. Salibay, C.C. 2007. Ectoparasites on murid rodents caught in MTS. Palay-palay/mataas NA Gulod National Park, Luzon Island, Philippines. Southeast Asian Journal of Tropical Medicine and Public Health 38: 194-202
42. Mahdi, A.H., Arafa, M.S., and S.M. Ismail. 1971. A preliminary survey of domestic rodents and fleas in a newly developed area (Tahriri Province), U. A. R.. Journal of the Egyptian Public Health Association 106: 33-44.
43. Medina, G.T., Torres, J.M., Rodriguez-Castro, V.A., Quiroz-Martinez, H., and J.I. González-Rojas. 2006. Fleas (Siphonaptera) and Ticks (Arachnida: Acari: Ixodida) parasitizing small mammals in the Sierra San Antonio Peña Nevada State of Nuevo León. Mexico Entomological News 117: 95-100.
44. Nava, S., Lareschi, M. and Voglino, D. 2003. Interrelationship between Ectoparasites and Wild Rodents from Northeastern Buenos Aires Province, Argentina. Memorias do Instituto Oswaldo Cruz 98: 45-49.
45. Njunwa, K.J., Mwaiko, G.L., Kilonzo, B.S. and Mhina, J.I. 1989. Seasonal patterns of rodents, fleas and plague status in the Western Usambara Mountains, Tanzania. Medical and Veterinary Entomology 3: 17-22.
46. O'Farrell, T. P. 1975. Small mammals, their parasites and pathologic lesion on the arid lands ecology reserve, Benton County. Washington American Midland Naturalist 93: 377-387.
47. Poorbaugh, J.H., and H.T. Gier. 1961. Fleas (Siphonaptera) of small mammals in Kansas. Journal of the Kansas Entomological Society 39: 1-10.

140
48. Renapurkar, D.M., Chaturvedi, G.C., Vad, N.E., Tare, T.G., and M.V. Sant. 1971. Plague epidemiological studies in Nasik District, Maharashtra State. Journal of Communicable Disease 3: 182-189.
49. Rumreich, A., and R. S. Wynn. 1945. A study of the rodent-ectoparasite populations of Jacksonville, Florida. Public Health Research 60: 885-905.
50. Saxena, V. K. 1987. Rodent-ectoparasite association in selected biotopes of Mirzapur and Varanasi districts of Uttar Pradesh. Journal of Communicable Disease 19: 310-316.
51. Schwan, T. G. 1986. Seasonal abundance of fleas (Siphonaptera) on grassland rodents in Lake Nakuru National Park, Kenya, and potential for plague transmission. Bulletin of Entomology Research 76: 633-648.
52. Shayan, A. and J. Rafinejad. 2006. Arthropod parasites of rodents in Khorram Abbad district Lorestan Provincen of Iran. Journal of Public Health 35: 70-76.
53. Shepherd A. J., P. A. Leman, and D. E. Hummitszch. 1983. Studies on plague in the Eastern Cape province of South-Africa. Transactions of the Royal Society of Tropical Medicine and Hygiene 77: 800-808.
54. Shingchai, C., Srisawat, R., Phanphuwong, T., Vimutisunthorn, E., Deesin, V., Yamput, S., Pongwatanakulsiri, and P. Puthavathana. 2003. Surveillance of commensal rat and shrew populations in the Bangkok area with references to flea index and the risk indicator of plague. Journal of the Medical Association of Thailand 86: 795-801.
55. Shoukry, A., El Kady, G.A., Morsym, T.A., Salama M.M.I. (1993) Rodents and their arthropod ectoparasites in south Sinai Governorate, Egypt. Journal of the Egyptian Society of Parasitology 23: 775–783
56. Soliman, S., Main, A.J., Marzouk, A.S. and Montasser, A.A. 2001. Seasonal studies on commensal rats and their ectoparasites in a rural area of Egypt: The relationship of ectoparasites to the species, locality, and relative abundance of the host. Journal of Parasitology 87: 545-553.

141
57. Stunstov, V.V., Huong, L.T., Suntsova, N.I., and H.G. Gratz. 1997. Plague foci in Viet Nam: zoological and parasitological aspects. Bulletin of the WHO 75: 117-123.
58. Trimble, H. E. and G. C. Shepard. 1935. Rat and rat-flea survey of Los Angeles Harbor. Public Health Report 50: 74-79.
59. US Army Environmental Hygiene Agency, 1978-1980. Rodent and flea surveys. Plague Surveillance Study No. 16-66-0575-80, Fort Huachuca, Arizona July 1978-July 1980.
60. Vogel, C.W. and C. Cadwallader. 1935. Rat-flea survey of the port of Philadelphia, Pa. Public Health Report 50: 952-957.
61. Walton, D.W., and H.K. Hong. 1976. Fleas of small mammals form the endemic hemorrhagic fever zones of Kyonggi and Kanwon provinces of the republic of Korea. World Health Organization 2766 9: 10pp.
62. Wilson de Carvalho, R.W., Serra-Freire, N.M., Linardi, P.M., de Almeida, A.B. and J.N. Costa. 2001. Small Rodents Fleas from the Bubonic Plague Focus Located in the Serra dos Orgaos Mountain Range, State of Rio de Janeiro, Brazil. Memorias do Instituto Oswaldo Cruz 96: 603-609.
63. Woo, L.K., Candler, W.H. and D.L. Stanley. 1983. Studies on ectoparasites from wild rodents collected in three areas of Korea. Korean Journal of Entomology 13: 23-29.

142
Appendix 2. Scatter plot diagrams with loess (locally weighted scatterplot smoothing) lines for variables relating to mammal and flea community characteristics compiled from 63 studies reporting the fleas of small mammal communities at a variety of locations across the world. All values are log transformed.

143
Appendix 3. List of small mammal species reported in 70 studies used for a comparative analysis of anthropogenic disturbance on flea communities and flea- host associations. Parentheses indicate original reporting name
Aethomys kaiseri
Akodon montensis
Akodon olivaceus
Akodon serrensis
Apodemus agrarius
Apodemus agrarius corea
Apodemus flaviocollis
Arvicola terrestris
Bandicota bengalensis
Bolomys lasiurus
Calomys tener
Calomyscus bailwardi
Caluromys philander
Abrothix longipilis
Acomys cahirinus cahirinus
Acomys cahirinus dimidiatus
Acomys russatus
Acomys spinosissimus
Aethomys namaquensis
Akodon azarae
Akodon cursor
Apodemus peninsulae
Apodemus sylvaticus
Apodemus sylvaticus
Arvicanthis niloticus
Arvicanthis niloticus niloticus
Arvicantis abyssinicus
Bandicota indica
Bandicota savilei
Berylmys berdmorei
Berylmys bowersi
Berylmys dermorei
Blarina blarina manitobensis
Blarina brevicauda
Agouti paca
Apodemus microps
Blarina blarina carolinensis
Cavia a. aperea
Chaetodipus (Perognathus) formosus
Chaetodipus (Perognathus) hispidus
Chaetodipus (Perognathus) intermedius
Chaetodipus (Perognathus) penicillatus

144
Chaetodipus californicus
Chiropodomys gliroides (trees)
Chromyscus chiropus
Citellus spilosoma
Citellus t. tridecemlineatus
Citellus variegatus
Clethrionomys gapperi
Clethrionomys gapperi loringi
Clethrionomys glareolus
Clethrionomys rufocanus
Clethrionomys rutilus
Coendou prehensilis
Cratogeomys castanops
Cricetulus migratorius
Cricetus cricetus
Crocidura lasiura
Crocidura renticola
Crocidura suaveolens
Cryptotis parva
Cynomys gunnisoni
Cynomys leucurus
Cynomys ludovicianus
Dasyprocta leporina
Delomys sublineatus
Deltamys kempi
Dendrogale murina
Dendromus sp.
Didelphis albiventris
Didelphis aurita
Didelphis marsupialis
Didelphis virgininia
Dipodillus dasyurus
Dipodomys agilis
Dipodomys heermanni
Dipodomys merriami
Dipodomys mesomelas
Dipodomys ordii
Dipodomys spectabilis
Dremomys rufigenis
Echimys chrysurus
Eliomys malanurus
Eliomys quircinus
Eothenomys regulus
Eutamias minimus
Eutamias minimus borealis
Eutamias quadrivittatus
Euxerus sp.
Gerbillus dasyurus
Gerbillus gerbillus
Gerbillus henleyi
145
Gerbillus nanus
Gerbillus pyramidum
Glaucomys sabrinus canescens
Grammomys dlichurus
Hermpestes spp
Holochilus brasiliensis
Hylomys suillus
Isothrix sinnamariensis
Jaculus jaculus
Lagurus curtatus
Leggada
Lemniscomys striatus
Leopoldamy sabanus
Leopoldamys edwarsi
Lepus californicus
Lepus townsendii
Liomys irroratus
Lophouromys aquilus
Lophuromys flavopunctatus
Makalata armata
Marmosops incanus
Marmota flaviventris
Marmota marmota canadensis
Mastomys (Praomys) natalensis
Mastomys coucha
Maxomys moi
Maxomys surifer
Menetes berdmorei
Meriones crassus
Meriones persicus
Meriones sacramenti
Mesomys hispidus
Metachirus nudicaudatus
Micoureus demerarae
Micromys minutus
Microsorex h. hoyi
Microtus agrestis
Microtus arvalis
Microtus californicus
Microtus drummondii
Microtus fortis
Microtus longicaudus
Microtus mexicanus
Microtus montanus
Microtus ochrogaster
Microtus pennsylvanicus
Microtus pinetorum
Microtus socialis
Millardia meltada
Mus caroli
146
Mus cervicolor
Mus minutoides
Mus mus castaneus
Mus musculus
Mus musculus brevirostris
Mus musculus praetextus
Mus norvegicus
Mus pahari
Mus triton
Myoprocta acouchy
Nectomys squamipes
Neomys anomalus
Neotoma albigula
Rodent species (cont).
Neotoma cinerea
Neotoma floridana
Neotoma fuscipes
Neotoma goldmani
Neotoma mexicana
Neotoma micropus
Niviventer cremoriventer
Niviventer fulvescens
Niviventer langbianis
Niviventer niniventer
Ochontona princeps
Ochrotomys nuttalli
Oenomys sp.
Oligoryzomys flavescens
Oligoryzomys microtis
Oligoryzomys nigripes
Oligorzoyms delticola
Oligorzoyms longicaudatus
Onlychomys torridus
Onychomys leucogaster
Oryzomys angoya
Oryzomys flavescens
Oryzomys nigriges
Oryzomys palustris
Oryzomys russatus
Oryzomys subflavus
Otomys angoniensis
Otomys denti
Otomys irroratus
Otomys unisulcatus
Oxymycterus judex
Oxymycterus roberti
Oxymycterus rufus
Pearsonomys annectus
Perognathus baileyi
Perognathus californicus
147
Perognathus flavus
Perognathus parvus
Peromuscus maniculatus
Peromyscus boylii
Peromyscus californicus
Peromyscus crinitus
Peromyscus difficilis
Peromyscus difficillus
Peromyscus eremicus
Peromyscus gossypinus
Peromyscus leucopus
Peromyscus maniculatus
Peromyscus maniculatus bairdii
Peromyscus maniculatus nubiterrae
Peromyscus n. aureolus
Peromyscus pectoralis
Peromyscus polionotus
Peromyscus truei
Phenacomys intermdius
Phenacomys u. soperi
Philander opossum
Pitomys subterraneus
Pitymus p. pinetorum
Proechimys iheringi
Psammomys obesus
Rattu rattus alexandrinus
Rattus (koratensis) sikkimensis
Rattus argentiventer
Rattus bartelsii
Rattus blanfordi
Rattus bukit
Rattus everetti
Rattus exulans
Rattus hawaiiensis
Rattus losea
Rattus megalotus
Rattus nitidus
Rattus norvegiucs
Rattus rattus diardii
Rattus rattus frugivorus
Rattus rattus kijabius
Rattus rattus palelae
Rattus rattus rattus
Rattus rattus rufescens
Rattus surifer
Rattus tanezumi
Rattus tiomanicus
Reithrodontomys fulvescens
Reithrodontomys humulis
Reithrodontomys megalotis

148
Reithrodontomys montanus
Rhabdomys pumilio
Rhipidomys sp.
Saccostomus capestri
Scapteromys aquaticus
Sciurillus pusillus
Sciuris aestuans
Sciuris arizonensis
Sciurus aberti
Sciurus aestuans
Sciurus carolinensis
Sekeetamys calurus
Sigmodon hispidus hispidus
Sigmodon minimus
Sigmodon orchrognathus
Sorex minutus
Sorex araneus
Sorex articus laricorum
Sorex caecutiens
Sorex cinereus cinereus
Sorex merriami
Sorex ornatus
Sorex palustris
Sorex palustris palustris
Sorex vagrans
Spermophilus beecheyi
Spermophilus lateralis
Spermophilus townsendii
Spermophilus variegatus
Spermphilus spilosoma
Speromphilus armatus
Speromphilus beecheyi
Speromphilus lateralis
Sphiggurus insidiosus
Suneus murinus
Sylvilagus aquaticus
Sylvilagus audubonii
ASylvilagus bachmani
Sylvilagus f. mallurus
Sylvilagus floridanus
Sylvilagus idahoensis
Sylvilagus nuttallli
Sylvilagus palustris
Synaptomys cooperi
Tachyoryctes splendens
Tamias merriami
Tamias s. griseus
Tamias striatus
Tamiasciurus (Tamias) hudsonicus
Tamiops macclellandi
149
Tatera indica
Thaptomys nigrita
Thomomys talpoides
Thomomys umbrinus
Tupaia glis
Vandeleuria oleracea
Zapus h. hudsonius
150
Appendix 4-List of flea species reported in 70 studies used for a comparative analysis of anthropogenic disturbance on flea communities and flea- host associations. Parentheses indicate original reporting name
Acropsylla girshami
Adoratopsylla (T) i. intermedia
Adoratopsylla antiquorum
Aetheca (E.) fornacis
Aetheca (Monopsylla) e. americanus
Aetheca (Monopsylla) e. cyrturus
Aetheca (Monopsylla) tripus
Aetheca (Monopsylla) vison
Aetheca (Monopsylla) wagneri systalius
Aetheca (Monopsyllus) anisus
Aetheca (Monopsyllus) e. eumolpi
Aetheca (Monopsyllus) e. kansensis
Aetheca (Monopsyllus) exilis
Aetheca (Monopsyllus) thambus
Aetheca (Monopsyllus) wagneri
Aetheca wagneri
Amalaraeus p. pedias
Amophalius necopinus
Amphipsylla siberica
Anomiopsylla novomexicanensis
Anomiopsylla nudatus
Anomiopsyllus amphibous
Anomiopsyllus f. congruens
Anomiopsyllus falsicialifornicus
Anomiopsyllus nudatus nudatus
Atyphloceras echis echis
Atyphloceras longipalpus
Atyphloceras m. multidentatus
Atyphlooeras multidentatus
Barreropsylla excelsa
Callistopsyllus campetris
Callistopsyllus terinus
Callistopsyllus terinus
Carteretta carteri
Catallagia calsheri
Catallagia decipiens
Catallagia luski
Cediopsylla inaequalis
Cediopsylla interrupta interrupta
Cediopsylla simplex
Ceratophyllus acutus
Ceratophyllus fasciatus
151
Chaetopsylla lotoris
Chiastopsylla rossi
Chiliopsylla alloophyla allophyla
Conorhinopsylla nidocola
Coptopsylla africana
Corrodopsylla birulai
Corrodopsylla c. curvata
Craneopsylla m. wolffheugeli
Craneopsylla minerva minerva
Ctenocephalides canis
Ctenocephalides felis
Ctenoparia inopinata
Ctenophthalmus (Ethioctenaphthalmus) machadoi Ctenophthalmus agyrtes
Ctenophthalmus assimilis
Ctenophthalmus calceatus
Ctenophthalmus caviae
Ctenophthalmus crataepus
Ctenophthalmus felis strongylus
Ctenophthalmus solutus
Ctenophthalmus topali
Ctenophthalmus vulceatus
Ctenophthalums pseudogyrtes
Ctenophthalumus cabirus
Ctenophyllus erribilis
Ctenopthalmus congeneroides congeneroides
Dactylopsylla rara
Delotelis telegoni
Diamanus montanus
Dinopsyllus ellobius
Dinopsyllus lypusus
Dinopsyllus smiti
Doratopsylla blarinae
Doratopsylla c. curvata
Echindophaga gallicacea
Echinocephalus (C.) u. unicinatus
Epitedia stanfordi
Epitedia wenmanni
Eumolpi e. eumolpi
Foxella ignota
Gryphopsylla jacobsoni
Hechtiella lakoi
Hoplopsyllus affinis
Hoplopsyllus anomalus
Hoplopsyllus g. foxi
Hystrichopsylla dippiei
Hystrichopsylla dippiei neotomae
Hystrichopsylla dippiei truncata
Hystrichopsylla linsdalei

152
Hystrichopsylla microti
Hystrichopsylla occidentalis
Hystrichopsylla orientalis orientalis
Hystrick lindalei
Lentistivalius insolli
Lentistivalius klossi
Lentistivalius occidentayunnanus
Leptopsylla algira costai
Leptopsylla musculi
Leptopsylla nuttalli
Leptopsylla segnis
Letopsylla aethiopica
Letopsylla musculi
Listropsylla agrippinae
Macrostylophora pilata
Malaraeus bitterrootensis
Malaraeus euphorbi
Malareaus telchinum
Malareus euphorbi
Malareus sinomus
Malareus vonfintelis
Megaborthris clantoni
Megabothris a. megacoplus
Megabothris abantis
Megabothris d. divisus
Megabothris quirini
Megabothris rectangulatus
Megabothrisobscurus
Megarthroglossus cavernicolus
Megarthroglossus d. bisetis
Megarthroglossus weaveri
Megarthroglossus wilsoni
Megarthroglussus d.(aff.) divisus
Megarthroglussus pygaerus
Merengis dipodomys
Merengis jamesoni
Merengis parkeri
Meringis bilsingi
Meringis cummingi
Meringis hubbardi
Meringis nidi
Meringis parkeri
Meringis rectus
Meringis rectus
Meringis shannoni
Micropsylla sectilis
Micropsylla sectilis sectilis
Myoxopsylla laverani traubi
Nearctopsylla spp.
Neopsylla avida
153
Neopsylla bidentiatiformis
Neopsylla inopina
Neopsylla specialis
Neopsylla tricata
Nosopsyllus fasciatus
Nosopsyllus iranus
Nosopsyllus theodori
Odontopsyllus dentatus
Opisodasys k. nesiotus
Opisodasys keeni
Opisodasys pseudoarctomys
Opisodasys robustus
Orchopeas c. caedens
Orchopeas howardii
Orchopeas leucopus
Orchopeas pennsylvanicus
Orchopeas s. agilis
Orchopeas s. pennsylvanicus
Orchopeas sexdentatus
Orchopeas sexdentatus neotomae
Orchopeas wickhami
Oropsylla (Opisocrostis tuberculatus) tuberculata tuberculata Oropsylla (Opisocrostis) bruneri
Oropsylla (Opisocrostis) labis
Oropsylla (Opisocrostis) washingtonensis
Oropsylla arctomys
Oropsylla hirsuta (Opisocrotis hirsutus)
Oropsylla idahoensis
Oropsylla labis
Oropsylla montana
Oropsylla pandorae
Oropsylla rupestris
Oropsylla t. cynomuris
Palaeopsylla s. soricis
Palaeopsylla soricis starki
Parapulex chephrenis
Peromyscopsylla b. bidentata
Peromyscopsylla catitina
Peromyscopsylla draco
Peromyscopsylla h. adelpha
Peromyscopsylla h. cuneata
Peromyscopsylla h. vigens
Peromyscopsylla scotti
Peromyscopsylla selenis
Peromyscopsylla sylvatica
Peromysopsylla hesperomys
Phalacropsylla allos
Pleocheatis exilis
Plusaetis sibynus

154
Polygenis a. axius
Polygenis atopus
Polygenis axius pessoai
Polygenis b. bohlsi
Polygenis frustratus
Polygenis gwyni
Polygenis k. klagesi
Polygenis massoiai
Polygenis occidentalis
Polygenis pradoi
Polygenis puelche
Polygenis pygaeurus
Polygenis r. beebei
Polygenis rimatus
Polygenis tripus
Polygenus occidentalis occidentalis
Polygenus roberti roberti
Polyplax spinulosa
Pulex irritans
Pulex simulans
Rectofrontia fraterna
Rhadinopsylla multidenticulata
Rhadinopsylla concava
Rhadinopsylla fraterna
Rhadinopsylla insolata
Rhadinopsylla masculana
Rhadinopsylla sectilis
Rhopalopsylllus garbei
Rhopalopsylllus gwyni
Rhopalopsyllus australis australis
Rhopalopsyllus l. lugbris
Sphinctopsyllaa ares
Stenistomera macrodactlya
Stenoponia alpina
Stenoponia americana
Stenoponia macrodactyla
Stenoponia montanta
Stenoponia sidimi
Stenoponia tripectinata medialis
Stivalius cognatus
Tetrapsyllus rhombus
Thrassis a. capestris
Thrassis aridis
Thrassis b. johnsoni
Thrassis bacchi
Thrassis campestris
Thrassis fotus
Thrassis francisi
Thrassis howelli
Thrassis o. coloradensis

155
Thrassis pandorae
Thrassis petiolatus
Thrassis standfordi
Thrips sp.
Xenopslla cheopis
Xenopsylla astia
Xenopsylla bantoum
Xenopsylla baxtoni
Xenopsylla braziliensis
Xenopsylla cheopis
Xenopsylla conformis mycerini
Xenopsylla dipodilli
Xenopsylla hawaiiensis
Xenopsylla nubicus
Xenopsylla ramesis
Xenopsylla robertsi
Xenopsylla scopulifer
Xenopsylla vexabilis
Xiphiopsylla hyparetes
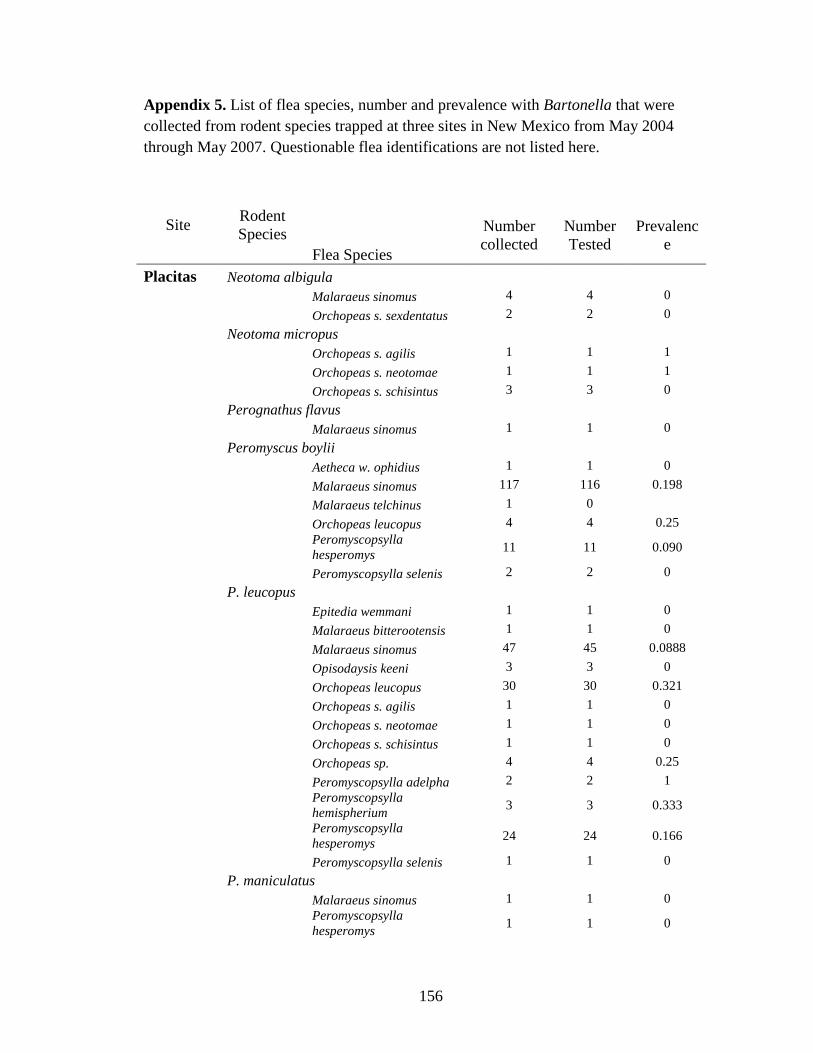
156
Appendix 5. List of flea species, number and prevalence with Bartonella that were collected from rodent species trapped at three sites in New Mexico from May 2004 through May 2007. Questionable flea identifications are not listed here.
Site Rodent Species Number
collected Number Tested
Prevalence Flea Species
Placitas Neotoma albigula Malaraeus sinomus 4 4 0 Orchopeas s. sexdentatus 2 2 0 Neotoma micropus Orchopeas s. agilis 1 1 1 Orchopeas s. neotomae 1 1 1 Orchopeas s. schisintus 3 3 0 Perognathus flavus Malaraeus sinomus 1 1 0 Peromyscus boylii Aetheca w. ophidius 1 1 0 Malaraeus sinomus 117 116 0.198 Malaraeus telchinus 1 0 Orchopeas leucopus 4 4 0.25
Peromyscopsylla hesperomys 11 11 0.090
Peromyscopsylla selenis 2 2 0 P. leucopus Epitedia wemmani 1 1 0 Malaraeus bitterootensis 1 1 0 Malaraeus sinomus 47 45 0.0888 Opisodaysis keeni 3 3 0 Orchopeas leucopus 30 30 0.321 Orchopeas s. agilis 1 1 0 Orchopeas s. neotomae 1 1 0 Orchopeas s. schisintus 1 1 0 Orchopeas sp. 4 4 0.25 Peromyscopsylla adelpha 2 2 1
Peromyscopsylla hemispherium 3 3 0.333
Peromyscopsylla hesperomys 24 24 0.166
Peromyscopsylla selenis 1 1 0 P. maniculatus Malaraeus sinomus 1 1 0
Peromyscopsylla hesperomys 1 1 0
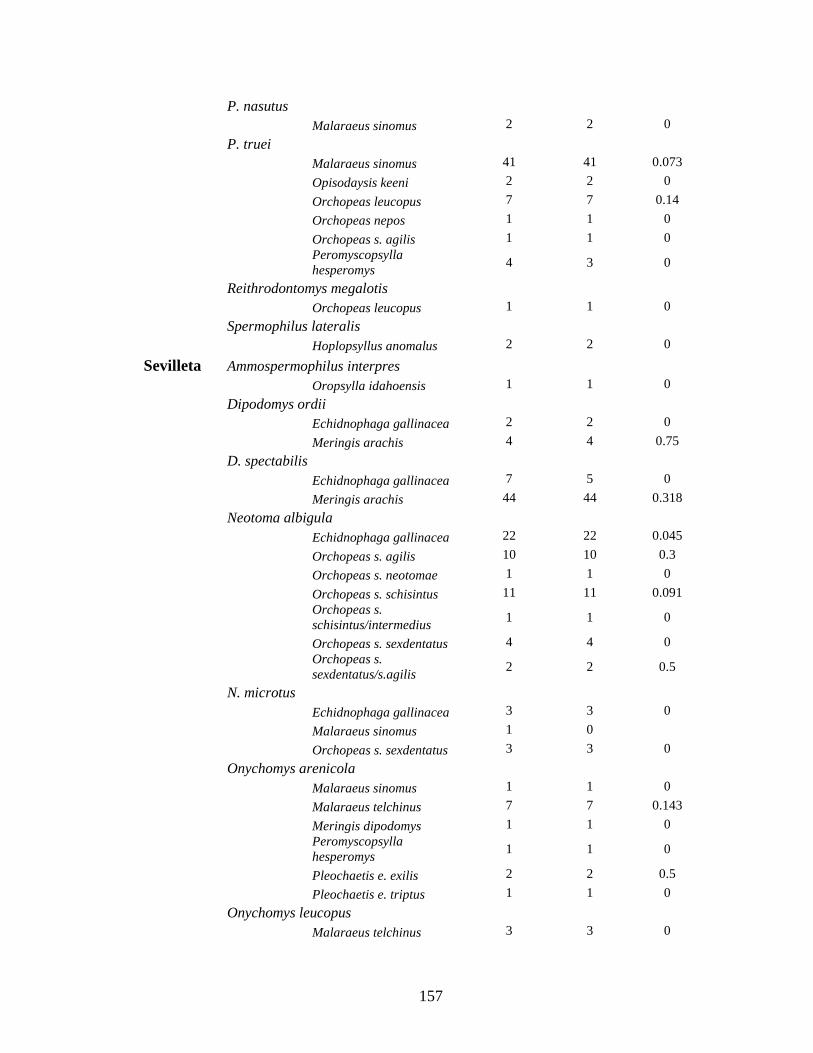
157
P. nasutus Malaraeus sinomus 2 2 0 P. truei Malaraeus sinomus 41 41 0.073 Opisodaysis keeni 2 2 0 Orchopeas leucopus 7 7 0.14 Orchopeas nepos 1 1 0 Orchopeas s. agilis 1 1 0
Peromyscopsylla hesperomys 4 3 0
Reithrodontomys megalotis Orchopeas leucopus 1 1 0 Spermophilus lateralis Hoplopsyllus anomalus 2 2 0
Sevilleta Ammospermophilus interpres
Oropsylla idahoensis 1 1 0 Dipodomys ordii Echidnophaga gallinacea 2 2 0 Meringis arachis 4 4 0.75 D. spectabilis Echidnophaga gallinacea 7 5 0 Meringis arachis 44 44 0.318 Neotoma albigula Echidnophaga gallinacea 22 22 0.045 Orchopeas s. agilis 10 10 0.3 Orchopeas s. neotomae 1 1 0 Orchopeas s. schisintus 11 11 0.091
Orchopeas s. schisintus/intermedius 1 1 0
Orchopeas s. sexdentatus 4 4 0
Orchopeas s. sexdentatus/s.agilis 2 2 0.5
N. microtus Echidnophaga gallinacea 3 3 0 Malaraeus sinomus 1 0 Orchopeas s. sexdentatus 3 3 0 Onychomys arenicola Malaraeus sinomus 1 1 0 Malaraeus telchinus 7 7 0.143 Meringis dipodomys 1 1 0
Peromyscopsylla hesperomys 1 1 0
Pleochaetis e. exilis 2 2 0.5 Pleochaetis e. triptus 1 1 0 Onychomys leucopus Malaraeus telchinus 3 3 0

158
Oropsylla hirsuta 1 1 0 Pleochaetis e. triptus 1 1 1 Perognathus flavus Meringis dipodomys 1 1 0 Meringis shannoni 1 1 1 Orchopeas leucopus 1 1 0 P. boylii Atyphloceras echis 1 1 0 Malaraeus sinomus 5 5 0 Orchopeas leucopus 4 4 0
Peromyscopsylla hesperomys 1 1 0
Pleochaetis e. exilis 1 1 1 Thrassis bacchi 1 1 0 P. leucopus Malaraeus sinomus 2 2 0 Malaraeus telchinus 1 1 0 Opisodaysis keeni 1 1 0 Orchopeas leucopus 5 5 0 Peromyscopsylla adelpha 1 1 0
Peromyscopsylla hesperomys 3 3 0
P. truei Malaraeus sinomus 13 13 0.077 Megabothris d. divisus 1 1 0 Orchopeas leucopus 7 7 0 Orchopeas s. neotomae 1 1 0
Peromyscopsylla hesperomys 1 1 0
Spermophilus spilosoma Thrassis a. desertorum 1 1 0 Thrassis pansus 2 2 0 Valles Caldera Microtus longicatudus
Malaraeus sinomus 1 0 Malaraeus telchinus 1 0 Megabothris abantis 1 1 1 Megabothris quirini 1 1 0 Peromyscopsylla selenis 2 0 N. cinera Orchopeas s. agilis 4 4 0.5 Orchopeas s. neotomae 2 2 0 Orchopeas s. schisintus 1 1 0 Orchopeas s. sexdentatus 5 5 0.6 N. mexicana Malaraeus sinomus 3 2 0
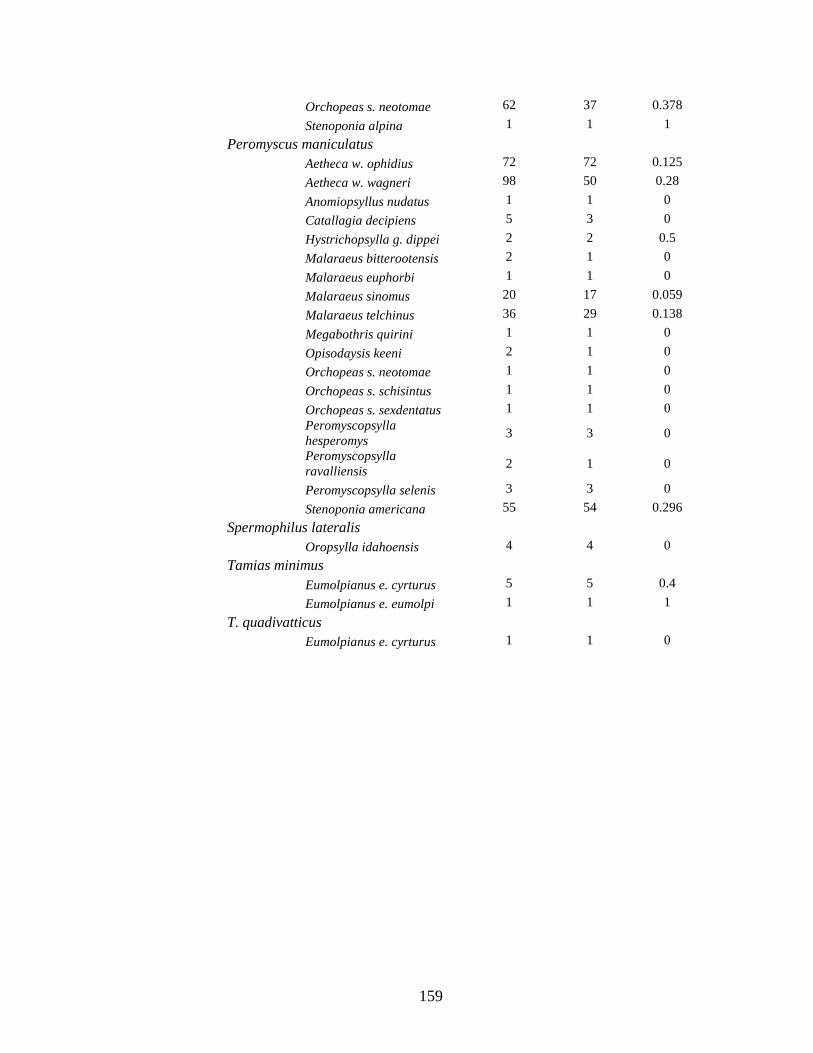
159
Orchopeas s. neotomae 62 37 0.378 Stenoponia alpina 1 1 1 Peromyscus maniculatus Aetheca w. ophidius 72 72 0.125 Aetheca w. wagneri 98 50 0.28 Anomiopsyllus nudatus 1 1 0 Catallagia decipiens 5 3 0 Hystrichopsylla g. dippei 2 2 0.5 Malaraeus bitterootensis 2 1 0 Malaraeus euphorbi 1 1 0 Malaraeus sinomus 20 17 0.059 Malaraeus telchinus 36 29 0.138 Megabothris quirini 1 1 0 Opisodaysis keeni 2 1 0 Orchopeas s. neotomae 1 1 0 Orchopeas s. schisintus 1 1 0 Orchopeas s. sexdentatus 1 1 0
Peromyscopsylla hesperomys 3 3 0
Peromyscopsylla ravalliensis 2 1 0
Peromyscopsylla selenis 3 3 0 Stenoponia americana 55 54 0.296 Spermophilus lateralis Oropsylla idahoensis 4 4 0 Tamias minimus Eumolpianus e. cyrturus 5 5 0.4 Eumolpianus e. eumolpi 1 1 1 T. quadivatticus Eumolpianus e. cyrturus 1 1 0
Related Documents


