PNWD-3675 WTP-RPT-112, Rev. 0 Final Report: Technical Basis for HLW Vitrification Stream Physical and Rheological Property Bounding Conditions A. P. Poloski* S. T. Arm* O. P. Bredt* T. B. Calloway** Y. Onishi* R. A. Peterson* G. L. Smith* H. D. Smith* *Battelle—Pacific Northwest Division **Savannah River National Laboratory January 2006 Prepared for Bechtel National, Inc. under Contract 24590-101-TSA-W000-00004

Welcome message from author
This document is posted to help you gain knowledge. Please leave a comment to let me know what you think about it! Share it to your friends and learn new things together.
Transcript
PNWD-3675 WTP-RPT-112, Rev. 0
Final Report: Technical Basis for HLW Vitrification Stream Physical and Rheological Property Bounding Conditions A. P. Poloski* S. T. Arm* O. P. Bredt* T. B. Calloway** Y. Onishi* R. A. Peterson* G. L. Smith* H. D. Smith* *Battelle—Pacific Northwest Division **Savannah River National Laboratory January 2006 Prepared for Bechtel National, Inc. under Contract 24590-101-TSA-W000-00004
LEGAL NOTICE This report was prepared by Battelle Memorial Institute (Battelle) as an account of sponsored research activities. Neither Client nor Battelle nor any person acting on behalf of either: MAKES ANY WARRANTY OR REPRESENTATION, EXPRESS OR IMPLIED, with respect to the accuracy, completeness, or usefulness of the information contained in this report, or that the use of any information, apparatus, process, or composition disclosed in this report may not infringe privately owned rights; or Assumes any liabilities with respect to the use of, or for damages resulting from the use of, any information, apparatus, process, or composition disclosed in this report. Reference herein to any specific commercial product, process, or service by trade name, trademark, manufacturer, or otherwise, does not necessarily constitute or imply its endorsement, recommendation, or favoring by Battelle. The views and opinions of authors expressed herein do not necessarily state or reflect those of Battelle.
COMPLETENESS OF TESTING
This report describes the results of work and testing specified by Test Specification 24590- WTP-TSP-RT-01-007, Rev. 0, Test Plan TP-RPP- WTP-205, Rev. 0, and Test Exceptions 24590- WTP-TEF-RT-02-070, 24590- WTP-TEF-RT-02-072, and 24590-HL W-TEF-RT-05-00005. The work and any associated testing followed the quality assurance requirements outlined in the Test Specification/Plan. The descriptions provided in this test report are an accurate account of both the conduct of the work and the data collected. Test plan results are reported. Also reported are any unusual or anomalous occurrences that are dgerent from expected results. The test results and this report have been reviewed and verified.
m H. Beernan, Manager Date / WTP R&T Support Project
iii
Summary
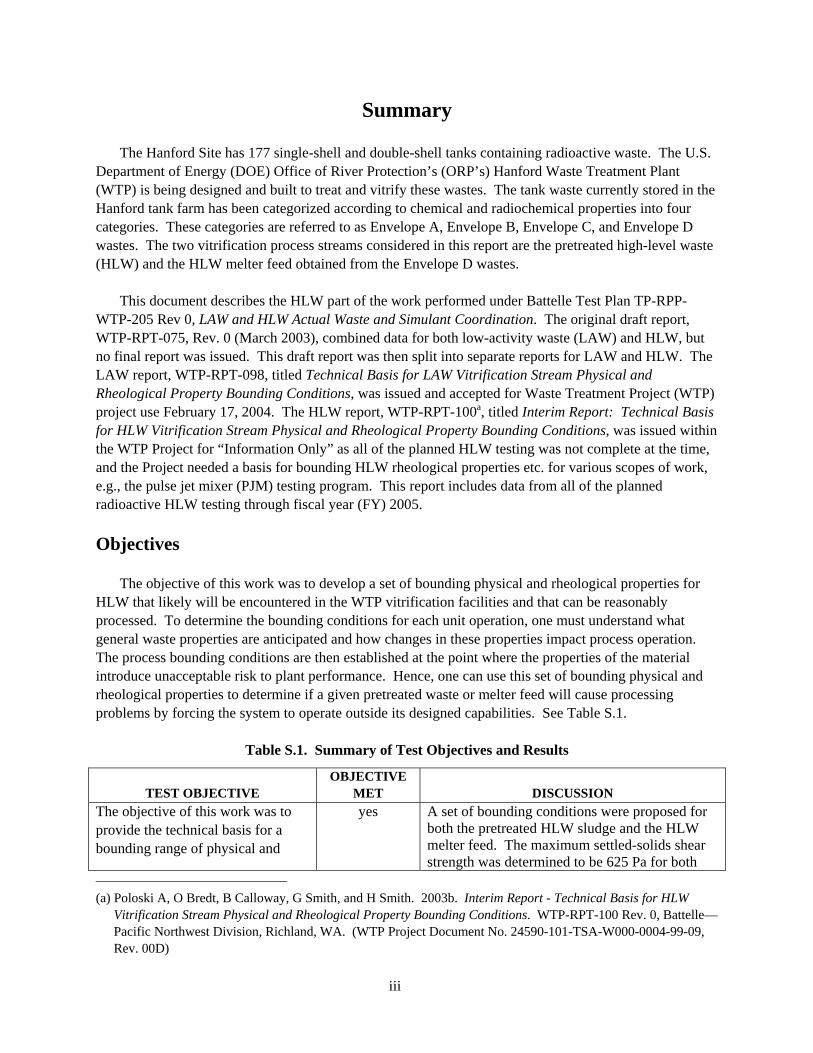
The Hanford Site has 177 single-shell and double-shell tanks containing radioactive waste. The U.S. Department of Energy (DOE) Office of River Protection’s (ORP’s) Hanford Waste Treatment Plant (WTP) is being designed and built to treat and vitrify these wastes. The tank waste currently stored in the Hanford tank farm has been categorized according to chemical and radiochemical properties into four categories. These categories are referred to as Envelope A, Envelope B, Envelope C, and Envelope D wastes. The two vitrification process streams considered in this report are the pretreated high-level waste (HLW) and the HLW melter feed obtained from the Envelope D wastes.
This document describes the HLW part of the work performed under Battelle Test Plan TP-RPP-
WTP-205 Rev 0, LAW and HLW Actual Waste and Simulant Coordination. The original draft report, WTP-RPT-075, Rev. 0 (March 2003), combined data for both low-activity waste (LAW) and HLW, but no final report was issued. This draft report was then split into separate reports for LAW and HLW. The LAW report, WTP-RPT-098, titled Technical Basis for LAW Vitrification Stream Physical and Rheological Property Bounding Conditions, was issued and accepted for Waste Treatment Project (WTP) project use February 17, 2004. The HLW report, WTP-RPT-100a, titled Interim Report: Technical Basis for HLW Vitrification Stream Physical and Rheological Property Bounding Conditions, was issued within the WTP Project for “Information Only” as all of the planned HLW testing was not complete at the time, and the Project needed a basis for bounding HLW rheological properties etc. for various scopes of work, e.g., the pulse jet mixer (PJM) testing program. This report includes data from all of the planned radioactive HLW testing through fiscal year (FY) 2005. Objectives
The objective of this work was to develop a set of bounding physical and rheological properties for HLW that likely will be encountered in the WTP vitrification facilities and that can be reasonably processed. To determine the bounding conditions for each unit operation, one must understand what general waste properties are anticipated and how changes in these properties impact process operation. The process bounding conditions are then established at the point where the properties of the material introduce unacceptable risk to plant performance. Hence, one can use this set of bounding physical and rheological properties to determine if a given pretreated waste or melter feed will cause processing problems by forcing the system to operate outside its designed capabilities. See Table S.1.
Table S.1. Summary of Test Objectives and Results
TEST OBJECTIVE OBJECTIVE
MET DISCUSSION The objective of this work was to provide the technical basis for a bounding range of physical and
yes A set of bounding conditions were proposed for both the pretreated HLW sludge and the HLW melter feed. The maximum settled-solids shear strength was determined to be 625 Pa for both
(a) Poloski A, O Bredt, B Calloway, G Smith, and H Smith. 2003b. Interim Report - Technical Basis for HLW
Vitrification Stream Physical and Rheological Property Bounding Conditions. WTP-RPT-100 Rev. 0, Battelle—Pacific Northwest Division, Richland, WA. (WTP Project Document No. 24590-101-TSA-W000-0004-99-09, Rev. 00D)
iv
TEST OBJECTIVE OBJECTIVE
MET DISCUSSION rheological properties for HLW that likely will be encountered in the WTP vitrification facilities and conversely be taken into account when sizing a plant.
streams upon plant upset conditions to allow the solids to be resuspended. The maximum Hedstrom number in 2-in. pipe was determined to be 108 for both streams for pumping conditions. The maximum yield stress was proposed to be 30 Pa in both streams with the maximum consistency to be 30 cP in the HLW pretreated sludge and 40 cP in the HLW melter feed for pumping, mixing, erosion, and settling in pipes.
An additional objective was to provide a consensus of testing methods for particle size distribution, heat capacity, thermal conductivity, and particle morphology that are currently unavailable in Guidelines for Performing Chemical, Physical, and Rheological Properties Measurements (24590-WTP-GPG-RTD-001 Rev 0).
no Separated from this work by Test Exception 24590-HLW-TEF-RT-05-00005. NOTE: Disposition of the objective on.. “consensus of testing methods”.. will be addressed by WTP issuing a revision of the “Guidelines For Performing Chemical, Physical, and Rheological Properties Measurements” (24590-WTP-GPG-RTD-001 Rev 0) that addresses this objective.
Test Exceptions Table S.2 describes the test exceptions relevant to the work presented in this report.
Table S.2. Test Exceptions
Test Exceptions Description 24590-WTP-TEF-RT-02-070 This report shall also contain a section that summarizes the compiled
physical property data in a manner requested by Dr. Art Etchells (DuPont mixing expert) in support of modeling of mixing systems for the vitrification streams.
24590-WTP-TEF-RT-02-072 The purpose of this test exception is to document the applicability of NQA-1-1989, Part 1, Basic and Supplementary Requirements and NQA-2a-1990, Part 2.7 requirements that were not specified in the test plan, TP-RPP-WTP-205 Rev 0, LAW and HLW Actual Waste and Simulant Coordination, that initiated this work and that QARD/RW-0333P was not necessary.
24590-HLW-TEF-RT-05-00005
The scope associated with defining consensus testing methods for heat capacity, thermal conductivity, and particle morphology was deleted. The consensus testing method for particle size distribution will be included in a revised version of Guidelines for Performing Chemical, Physical, and Rheological Properties Measurements (24590-WTP-GPG-RTD-001 Rev 0).
v
Test Exceptions Description The scope related to test exception 24590-WTP-TEF-RT-02-070, Rev. 0 was deleted.
vi
Results and Performance Against Success Criteria Table S.3 discusses the test criteria and how they were met. The test criteria mirror the test objectives
of proposing bounding conditions for the pretreated HLW sludge and the HLW melter feed.
Table S.3. Summary of Success Criteria
Success Criterion How the Criterion Was Met Issue a report documenting a critical review and evaluation of existing chemical, physical and rheological data on actual and simulated wastes relevant to the WTP HLW vitrification processes. The process streams to be addressed include pretreated HLW sludge and HLW melter feed for Envelope D. The report will summarize available information on chemical, physical, and rheological properties as defined in Table 1 in Guidelines for Performing Chemical Physical, and Rheological Properties Measurements (24590-WTP-GPG-RTD-001). Include in the report bounding physical and rheological properties for pretreated HLW sludge and HLW melter feeds based upon actual waste and simulant testing.
Success criterion met. This report addresses the topics of previous work completed in the annotated bibliography and provides an evaluation of the bounding conditions and how they relate to the available data. These bounding conditions are summarized in Tables S.5 and S.6 below. Success criterion met. A set of bounding conditions was proposed for both the pretreated HLW sludge and the HLW melter feed. The maximum settled solids shear strength was determined to be 625 Pa for both streams upon plant upset conditions to allow the solids to be resuspended. The maximum Hedstrom number in 2-in. pipe was determined to be 108 for both streams for pumping conditions. The maximum yield stress was proposed to be 30 Pa in both streams with the maximum consistency to be 30 cP in the HLW pretreated sludge and 40 cP in the HLW melter feed for pumping, mixing, erosion, and settling in pipes. See Tables S.5 and S.6 below.
Quality Assurance Requirements
Application of RPP-WTP Quality Assurance Requirements Battelle—Pacific Northwest Division’s (PNWD’s) Quality Assurance (QA) Program is based upon
the requirements as defined in DOE Order 414.1A, Quality Assurance and 10 CFR 830, Energy/Nuclear Safety Management, Subpart A—Quality Assurance Requirements (a.k.a. the Quality Rule). PNWD has chosen to implement the requirements of DOE Order 414.1A and 10 CFR 830, Subpart A by integrating
vii
them into the laboratory's management systems and daily operating processes. The procedures necessary to implement the requirements are documented through PNWD’s Standards-Based Management System (SBMS).
PNWD implements the River Protection Project (RPP)-WTP quality requirements by performing
work in accordance with the PNWD Waste Treatment Plant Support Project quality assurance project plan (QAPjP) approved by the RPP-WTP QA organization. This work was performed to the quality requirements of NQA-1-1989 Part I, Basic and Supplementary Requirements, and NQA-2a-1990, Part 2.7. These quality requirements are implemented through PNWD’s Waste Treatment Plant Support Project (WTPSP) Quality Assurance Requirements and Description Manual. The analytical requirements are implemented through WTPSP’s Statement of Work (WTPSP-SOW-005) with the Radiochemical Processing Laboratory (RPL) Analytical Service Operations (ASO).
A matrix that cross-references the NQA-1, NQA-2a and Quality Assurance Requirements and
Description (QARD) requirements with PNWD’s procedures for this work was given in the Test Plan, TP-RPP-WTP-205, LAW and HLW Actual Waste and Simulant Coordination. It included justification for those requirements not implemented.
Conduct of Experimental and Analytical Work
Experiments that were not method-specific were performed in accordance with PNWD’s procedures
QA-RPP-WTP-1101 “Scientific Investigations” and QA-RPP-WTP-1201 “Calibration Control System” verifying that sufficient data were taken with properly calibrated measuring and test equipment (M&TE) to obtain quality results.
As specified in Test Specification, 24590-WTP-TSP-RT-01-007, Rev. 0, BNI’s QAPjP,
PL-24590-QA00001, is not applicable because the work was not performed in support of environmental/regulatory testing, and the data will not be used as such.
Internal Data Verification and Validation
PNWD addresses internal verification and validation activities by conducting an Independent
Technical Review (ITR) of the final data report in accordance with PNWD’s Procedure QA-RPP-WTP-604. This review verifies that the reported results are traceable, that inferences and conclusions are soundly based, and that the reported work satisfies the Test Plan objectives. This review procedure is part of PNWD’s WTPSP Quality Assurance Requirements and Description Manual.
R&T Test Conditions
Table S.4 describes the research and technology (R&T) test conditions and how they were followed
in this testing.
viii
Table S.4. R&T Test Conditions
R&T Test Conditions Test Conditions Followed? Results 1) Existing pretreated waste and melter feed simulants (HLW Pretreated Sludge and HLW Melter Feed) data and preparation procedures from PNWD, Savannah River Technology Center (SRTC), and Vitreous States Laboratory (VSL) will be reviewed and compared to actual radioactive waste measurements. No new testing is planned. Guidelines for reviewing simulant development, definition, and verification methodologies are provided in Simulant Definition and Verification Methodology (24590-WTP-RPT-TE-01-003).
The report will summarize available information on chemical, physical, and rheological properties as defined Table 1 in Guidelines for Performing Chemical Physical, and Rheological Properties Measurements (24590-WTP-GPG-RTD-001).
Other waste and simulant property data, including particle morphology, tendency to consolidate into hard-pan clay, some measure of tendency to adhere to stainless steel components, and glass yield, should be provided as available. The viscosity behavior (e.g., Bingham plastic, power law) of wastes and simulants shall be characterized. The quality level of the compiled data shall also be documented.
Rheological and physical property data from existing waste feed and melter feed reports will be reviewed, and a set of bounding conditions will be established along with the degree of accuracy required based on the mixing/pump/ transfer system operability limits. This range must be defined to confirm that the mixing and transfer process can be successfully restarted following a downtime of 7 days to support maintenance requirements.
2) Simulant and Waste Characterization Consensus Methods Report Issue a document that provides consensus test
1) Work performed: • Existing pretreated waste and melter feed
simulants (HLW Pretreated Sludge and HLW Melter Feed) data and preparation procedures from PNWD, SRTC, and VSL were reviewed and compared to actual radioactive waste measurements.
• No new testing was conducted. • Available information on chemical,
physical, and rheological properties was summarized per Guidelines for Performing Chemical Physical, and Rheological Properties Measurements (24590-WTP-GPG-RTD-001).
• Other waste and simulant property data including particle morphology, tendency to consolidate into hard-pan clay, some measure of tendency to adhere to stainless steel components, and glass yield, was provided as available.
• A set of bounding physical and rheological properties for waste materials that can be reasonably processed and that likely will be encountered in the WTP HLW vitrification facility is provided.
• The evaluation assessed important design considerations, including kinematic viscosity for pump selection and a worst case senario for particle settling. These validation criteria and bounding conditions are based upon engineering design techniques, including dimensional analysis for conventional processing unit operations.
2) Work not performed. Outside present scope. See Test Exception # 24590-HLW-TEF-RT-05-00005.
ix
R&T Test Conditions Test Conditions Followed? Results methods for:
• particle size distribution • heat capacity • thermal conductivity • particle morphology (scanning electron
microscopy [SEM])
for inclusion in the next revision to Guidelines for Performing Chemical Physical, and Rheological Properties Measurements (24590-WTP-GPG-RTD-001 Rev 0).
3) HLW and LAW Waste and Simulant Review Report (Rev 0.)- Rev 0 of the HLW and LAW Waste and Simulant Review Report shall incorporate additional data on recycle streams and other observed waste properties. Information on process and recycle streams should be reviewed, including recycle to the LAW Condensate Recycle Vessel (CRV) from the LAW Submerged Bed Scrubber (SBS) and Wet Electrostatic Precipitator (WESP) and recycle to the HLW CRV from the HLW SBS, WESP, and high efficiency mist eliminator (HEME) as available.
Other relevant work with simulants including work for the Hanford Waste Vitrification Plant (HWVP), the West Valley Demonstration Project (WVDP), and the Defense Waste Processing Facility (DWPF) should also be considered. Experience with restarting mixing and any changes in properties as a result of down time should also be considered.
3) The HLW portion of the bounding conditions has focused on updating the interim HLW bounding conditions report with additional data produced by PNWD, SRNL, and VSL. In addition some attention has been given to pretreated HLW slurry particles (types, sizes and densities), expected rheology changes as waste is processed through the plant, the effects of surfactants and anti-foaming agents on rheology of pretreated waste and melter feed, and the question of predicting pretreated HLW and HLW melter feed based on available data. Other relevant work with simulants, including work for the Hanford Waste Vitrification Plant (HWVP), the West Valley Demonstration Project (WVDP), and the Defense Waste Processing Facility (DWPF) as well as the Wet Electrostatic Precipitator (WESP) and recycle to the HLW CRV, and a high efficiency mist eliminator (HEME) as available were not included in this report because of programmatic limitations.
Simulant Use Not applicable.
x
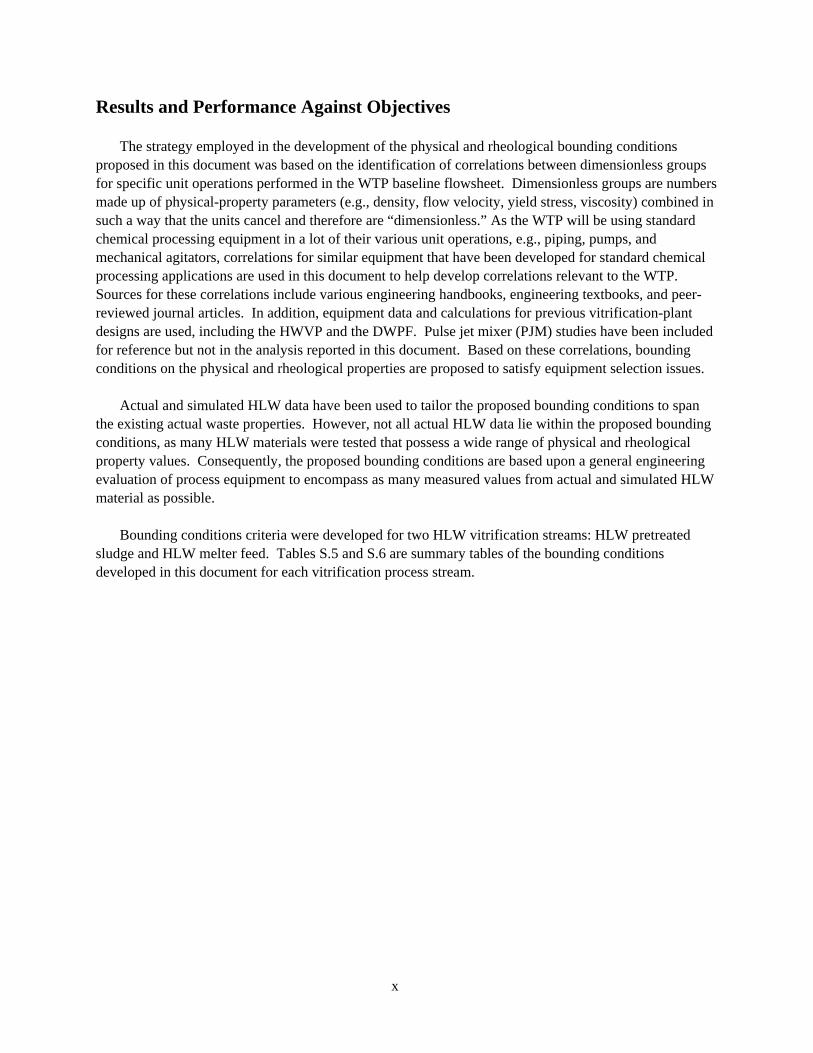
Results and Performance Against Objectives
The strategy employed in the development of the physical and rheological bounding conditions proposed in this document was based on the identification of correlations between dimensionless groups for specific unit operations performed in the WTP baseline flowsheet. Dimensionless groups are numbers made up of physical-property parameters (e.g., density, flow velocity, yield stress, viscosity) combined in such a way that the units cancel and therefore are “dimensionless.” As the WTP will be using standard chemical processing equipment in a lot of their various unit operations, e.g., piping, pumps, and mechanical agitators, correlations for similar equipment that have been developed for standard chemical processing applications are used in this document to help develop correlations relevant to the WTP. Sources for these correlations include various engineering handbooks, engineering textbooks, and peer-reviewed journal articles. In addition, equipment data and calculations for previous vitrification-plant designs are used, including the HWVP and the DWPF. Pulse jet mixer (PJM) studies have been included for reference but not in the analysis reported in this document. Based on these correlations, bounding conditions on the physical and rheological properties are proposed to satisfy equipment selection issues.
Actual and simulated HLW data have been used to tailor the proposed bounding conditions to span the existing actual waste properties. However, not all actual HLW data lie within the proposed bounding conditions, as many HLW materials were tested that possess a wide range of physical and rheological property values. Consequently, the proposed bounding conditions are based upon a general engineering evaluation of process equipment to encompass as many measured values from actual and simulated HLW material as possible.
Bounding conditions criteria were developed for two HLW vitrification streams: HLW pretreated sludge and HLW melter feed. Tables S.5 and S.6 are summary tables of the bounding conditions developed in this document for each vitrification process stream.
xi
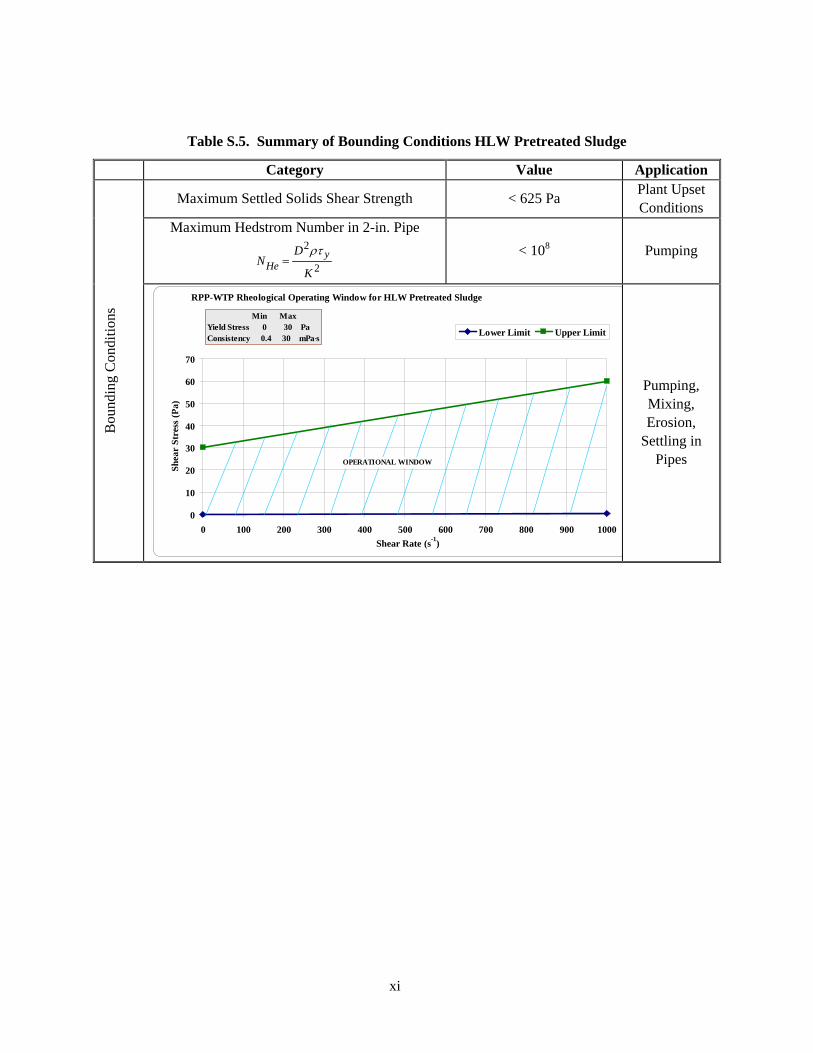
Table S.5. Summary of Bounding Conditions HLW Pretreated Sludge
Category Value Application
Maximum Settled Solids Shear Strength < 625 Pa Plant Upset Conditions
Maximum Hedstrom Number in 2-in. Pipe
2
2
K
DN y
Heρτ
= < 108 Pumping
Bou
ndin
g C
ondi
tions
0
10
20
30
40
50
60
70
0 100 200 300 400 500 600 700 800 900 1000Shear Rate (s-1)
Shea
r St
ress
(Pa)
Lower Limit Upper Limit
OPERATIONAL WINDOW
Min MaxYield Stress 0 30 PaConsistency 0.4 30 mPa·s
RPP-WTP Rheological Operating Window for HLW Pretreated Sludge
Pumping, Mixing, Erosion,
Settling in Pipes
xii
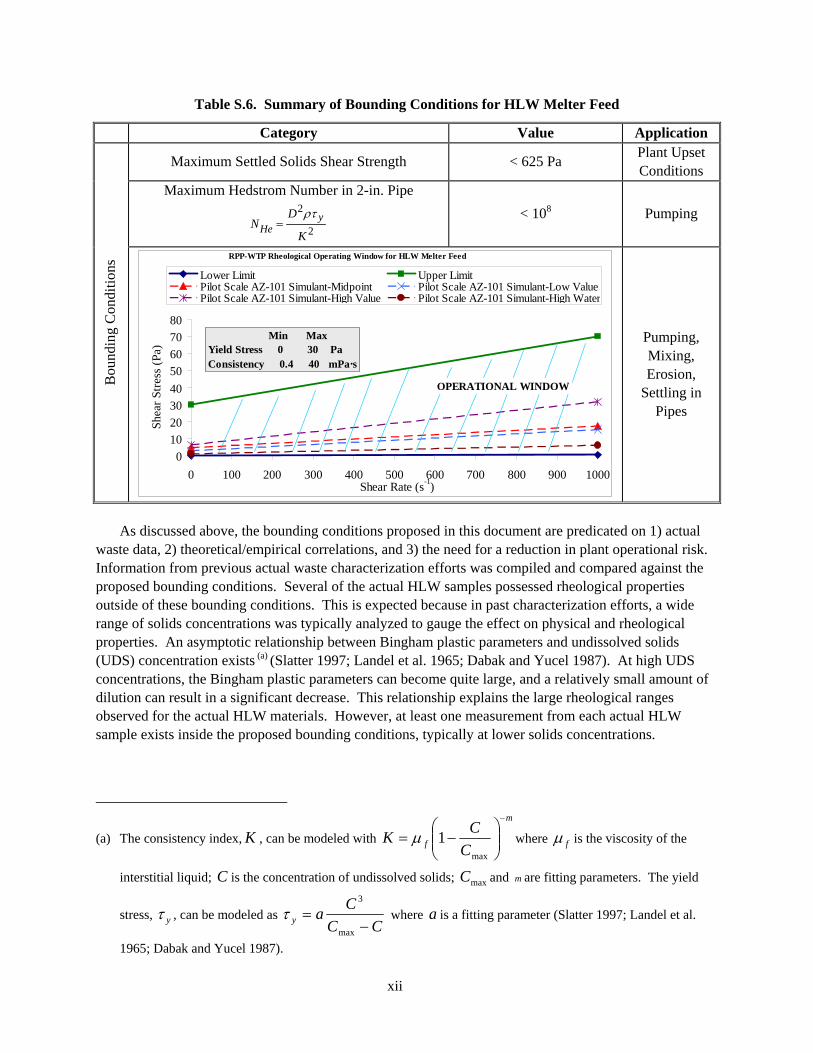
Table S.6. Summary of Bounding Conditions for HLW Melter Feed
Category Value Application
Maximum Settled Solids Shear Strength < 625 Pa Plant Upset Conditions
Maximum Hedstrom Number in 2-in. Pipe
2
2
K
DN y
Heρτ
= < 108 Pumping
Bou
ndin
g C
ondi
tions
01020304050607080
0 100 200 300 400 500 600 700 800 900 1000Shear Rate (s-1)
Shea
r Stre
ss (P
a)
Lower Limit Upper LimitPilot Scale AZ-101 Simulant-Midpoint Pilot Scale AZ-101 Simulant-Low ValuePilot Scale AZ-101 Simulant-High Value Pilot Scale AZ-101 Simulant-High Water
Min MaxYield Stress 0 30 PaConsistency 0.4 40 mPa·s
OPERATIONAL WINDOW
RPP-WTP Rheological Operating Window for HLW Melter Feed
Pumping, Mixing, Erosion,
Settling in Pipes
As discussed above, the bounding conditions proposed in this document are predicated on 1) actual
waste data, 2) theoretical/empirical correlations, and 3) the need for a reduction in plant operational risk. Information from previous actual waste characterization efforts was compiled and compared against the proposed bounding conditions. Several of the actual HLW samples possessed rheological properties outside of these bounding conditions. This is expected because in past characterization efforts, a wide range of solids concentrations was typically analyzed to gauge the effect on physical and rheological properties. An asymptotic relationship between Bingham plastic parameters and undissolved solids (UDS) concentration exists (a) (Slatter 1997; Landel et al. 1965; Dabak and Yucel 1987). At high UDS concentrations, the Bingham plastic parameters can become quite large, and a relatively small amount of dilution can result in a significant decrease. This relationship explains the large rheological ranges observed for the actual HLW materials. However, at least one measurement from each actual HLW sample exists inside the proposed bounding conditions, typically at lower solids concentrations.
(a) The consistency index, K , can be modeled with
m
f CCK
−
⎟⎟⎠
⎞⎜⎜⎝
⎛−=
max
1μ where fμ is the viscosity of the
interstitial liquid; C is the concentration of undissolved solids; maxC and m are fitting parameters. The yield
stress, yτ , can be modeled as CC
Cay −=
max
3
τ where a is a fitting parameter (Slatter 1997; Landel et al.
1965; Dabak and Yucel 1987).
xiii
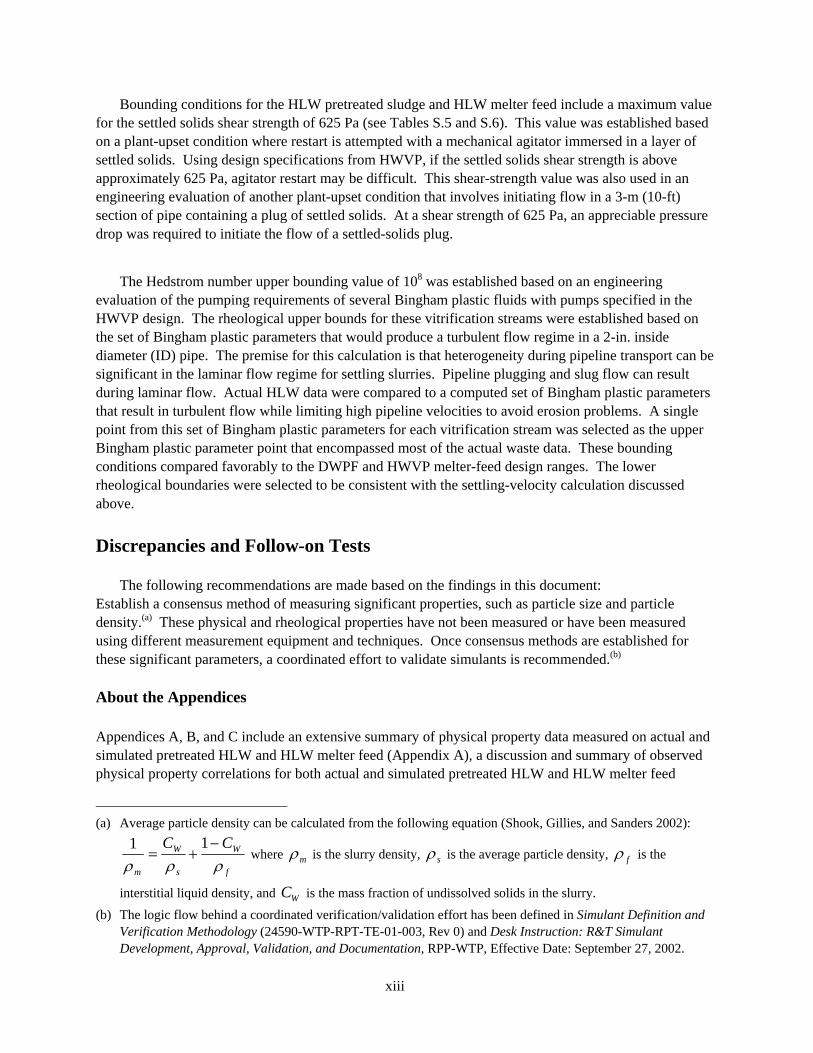
Bounding conditions for the HLW pretreated sludge and HLW melter feed include a maximum value for the settled solids shear strength of 625 Pa (see Tables S.5 and S.6). This value was established based on a plant-upset condition where restart is attempted with a mechanical agitator immersed in a layer of settled solids. Using design specifications from HWVP, if the settled solids shear strength is above approximately 625 Pa, agitator restart may be difficult. This shear-strength value was also used in an engineering evaluation of another plant-upset condition that involves initiating flow in a 3-m (10-ft) section of pipe containing a plug of settled solids. At a shear strength of 625 Pa, an appreciable pressure drop was required to initiate the flow of a settled-solids plug.
The Hedstrom number upper bounding value of 108 was established based on an engineering
evaluation of the pumping requirements of several Bingham plastic fluids with pumps specified in the HWVP design. The rheological upper bounds for these vitrification streams were established based on the set of Bingham plastic parameters that would produce a turbulent flow regime in a 2-in. inside diameter (ID) pipe. The premise for this calculation is that heterogeneity during pipeline transport can be significant in the laminar flow regime for settling slurries. Pipeline plugging and slug flow can result during laminar flow. Actual HLW data were compared to a computed set of Bingham plastic parameters that result in turbulent flow while limiting high pipeline velocities to avoid erosion problems. A single point from this set of Bingham plastic parameters for each vitrification stream was selected as the upper Bingham plastic parameter point that encompassed most of the actual waste data. These bounding conditions compared favorably to the DWPF and HWVP melter-feed design ranges. The lower rheological boundaries were selected to be consistent with the settling-velocity calculation discussed above. Discrepancies and Follow-on Tests
The following recommendations are made based on the findings in this document: Establish a consensus method of measuring significant properties, such as particle size and particle density.(a) These physical and rheological properties have not been measured or have been measured using different measurement equipment and techniques. Once consensus methods are established for these significant parameters, a coordinated effort to validate simulants is recommended.(b) About the Appendices Appendices A, B, and C include an extensive summary of physical property data measured on actual and simulated pretreated HLW and HLW melter feed (Appendix A), a discussion and summary of observed physical property correlations for both actual and simulated pretreated HLW and HLW melter feed
(a) Average particle density can be calculated from the following equation (Shook, Gillies, and Sanders 2002):
f
W
s
W
m
CCρρρ−
+=11
where mρ is the slurry density, sρ is the average particle density, fρ is the
interstitial liquid density, and WC is the mass fraction of undissolved solids in the slurry. (b) The logic flow behind a coordinated verification/validation effort has been defined in Simulant Definition and
Verification Methodology (24590-WTP-RPT-TE-01-003, Rev 0) and Desk Instruction: R&T Simulant Development, Approval, Validation, and Documentation, RPP-WTP, Effective Date: September 27, 2002.

xiv
(Appendix B), and a discussion of physical property variation during HLW pretreatment (Appendix C). Appendix D is a rheology tutorial, and Appendix E provides QA information relating to the measurement and reporting of the data included in this report. Appendices A and B provide detail on the data available on which bounding conditions were set and various ways in which they can affect bounding conditions.

xv
Acronyms
ASO Analytical Service Operations
BNI Bechtel National, Inc.
CRV Condensate Recycle Vessel
CUF cell unit filter (crossflow ultrafiltration)
DOE U.S. Department of Energy
DWPF Defense Waste Processing Facility
ES&H Environmental Safety and Health
ESP Environmental Simulation Program
GFC glass-former chemicals
HEME high efficiency mist eliminator
HLW high-level waste
HWVP Hanford Waste Vitrification Plant
ID inside diameter
ILAW immobilized low-activity waste
ITR Internal Technical Review
LAW low-activity waste
MFPV Melter Feed Preparation Vessel
MFV Melter Feed Vessel
M&TE measuring and test equipment
MTTR mean time to repair
NCAW neutralized current acid waste
OR Operations Research Model
PJM pulse jet mixer
PNNL Pacific Northwest National Laboratory
PNWD Battelle—Pacific Northwest Division
PSD particle size distribution
xvi
QA quality assurance
QAPjP quality assurance project plan
QARD Quality Assurance Requirements and Description
RPL Radiochemical Processing Laboratory
RPP River Protection Project
R&T research and technology
SBMS Standards Based Management System
SBS Submerged Bed Scrubber
SEM scanning electron microscopy
SIPP Semi-Integrated Pilot Plant
SOW Statement of Work
SRNL Savannah River National Laboratory
SRTC Savannah River Technology Center
TP test plan
TRU Transuranics
TS total solids
UDS undissolved solids
UFP2 Ultrafiltration Feed Process-2
VSL Vitreous States Laboratory
WESP wet electrostatic precipitator
WLW wash-leach-wash
WSRC Westinghouse Savannah River Company
WTP Waste Treatment Plant
WTPSP Waste Treatment Plant Support Project
xvii
Contents
Summary ...................................................................................................................................................... iii
Acronyms.................................................................................................................................................... xv
Contents ....................................................................................................................................................xvii
Figures ....................................................................................................................................................... xix
Tables......................................................................................................................................................... xxi
1.0 Introduction....................................................................................................................................... 1.1
2.0 Dimensional Analysis as a Basis for Vitrification Stream Bounding Conditions ............................ 2.1
3.0 Summary Review of RPP-WTP Project Reports on Actual and Simulated Wastes and Melter Feeds ..................................................................................................................................... 3.1
3.1 Brief Rheological Relationship Review .................................................................................. 3.1
3.2 Annotated Bibliography for Envelope-D Process Streams...................................................... 3.2
3.3 Waste, Melter Feeds, and Purely Physical Simulants.............................................................. 3.6
3.4 Database Summary .................................................................................................................. 3.7
4.0 Discussion......................................................................................................................................... 4.1
4.1 Development of Bounding Conditions .................................................................................... 4.1 4.1.1 Mechanical Mixing (Low-Shear-Rate Viscosity) ......................................................... 4.1 4.1.2 Mixing Operations (Maximum Settled-Solids Shear Strength) .................................... 4.5 4.1.3 Mixing Operations (Near Homogeneous Vessel) ......................................................... 4.7 4.1.4 Material Transfer Operations (Pipeline Flow) .............................................................. 4.9 4.1.5 Material Transfer Operations (Startup Pipeline Flow)................................................ 4.16
4.2 Bounding Conditions Recommendation................................................................................ 4.16 4.2.1 Prediction of Yield Stress and Bingham Consistency for Pretreated HLW
and HLW Melter Feed................................................................................................. 4.30
4.3 Selection of a Shear Rate Range to Fit Realistic Boundary Conditions ................................ 4.30 4.3.1 Pipe Flow Evaluation .................................................................................................. 4.30 4.3.2 Mechanical Mixing Evaluations.................................................................................. 4.30
4.4 Application of Boundary Conditions..................................................................................... 4.31
4.5 Rheology Modifier Assessment............................................................................................. 4.34
xviii
4.6 Submerged Bed Scrubber (SBS) Recycle Analysis............................................................... 4.35
5.0 Quality Assurance Requirements...................................................................................................... 5.1
5.1 Application of RPP-WTP Quality Assurance Requirements................................................... 5.1
5.2 Conduct of Experimental and Analytical Work ...................................................................... 5.1
5.3 Internal Data Verification and Validation ............................................................................... 5.1
6.0 Summary and Recommendations ..................................................................................................... 6.1
7.0 References......................................................................................................................................... 7.1
Appendix A: Chemical, Rheological, and Physical Properties Database ................................................. A.1
Appendix B: Physical-Property Correlations and Discussions..................................................................B.1
Appendix C: Expected HLW Behavior During Pretreatment ...................................................................C.1
Appendix D: Rheology Primer ................................................................................................................. D.1
Appendix E: Quality Level Summary........................................................................................................E.1
xix
Figures
1.1. Schematic Pretreatment Facility Process Flow.................................................................................. 1.2
1.2. Simplified HLW Vitrification Process Diagram................................................................................ 1.3
3.1. Rheogram Illustrating the Concept of Dynamic and Static Yield Stress ........................................... 3.2
4.1. Calculation of Maximum Viscosity for Mixing Operations .............................................................. 4.4
4.2. Maximum Shear-Strength Calculation for Restarting an Impeller in a Gelled Waste....................... 4.6
4.3. Maximum Shear Strength as a Function of Impeller Diameter when Impeller Width is One-Fifth Impeller Diameter, and Mixing Motor Starting Torque is 400 N•m................................. 4.7
4.4. Minimum Supernate Viscosity Calculation ..................................................................................... 4.10
4.5. Supernate Viscosity Required to Maintain a Free-Settling Velocity of 0.03 m/s as a Function of Particle Diameter and Density in a Suspending Fluid with Density of 1.0 g/mL ........ 4.11
4.6. Supernate Viscosity Required to Maintain Free-Settling Velocity of 0.03 m/s as a Function of Particle Diameter and Density in a Suspending Fluid with Density of 1.3 g/mL........................ 4.11
4.7. Bingham Plastic Parameters Required for Turbulent Flow Regime at 10 ft/s in a 2-in. Pipe.......... 4.13
4.8. Fanning Friction Factor as a Function of Reynolds Number and Hedstrom Number ..................... 4.15
4.9. System Curves for Fluids with Rheological Properties Defined by Points A-H in 4.7 (100-ft Length of 2-in.-Diameter Pipe)............................................................................................ 4.15
4.10. Pressure Drop Required to Initiate Flow of a 10-ft Plug of Yield Strength Material in a 2-in. Pipe ....................................................................................................................................... 4.17
4.11. Proposed Rheological Operating Envelope for Pretreated HLW Sludge ...................................... 4.22
4.12. Proposed Rheological Operating Envelope for HLW Melter Feed ............................................... 4.23
4.13. Bingham Consistency Index as a Function of Weight-Percent Total Solids for Pretreated HLW Sludge at 25°C ....................................................................................................................... 4.25
4.14. Bingham Yield Index as a Function of Weight-Percent Total Solids for Pretreated HLW Sludge at 25°C ................................................................................................................................. 4.26
4.15. Bingham Consistency Index as a Function of Weight-Percent Total Solids for HLW Melter Feed at 25°C......................................................................................................................... 4.27
xx
4.16. Bingham Yield Index as a Function of Weight-Percent Total Solids for HLW Melter Feed at 25°C .................................................................................................................................... 4.28
4.17. Proposed Bounding Conditions for Pretreated HLW Sludge, Including Plots for Pretreated HLW AZ-101, AZ-102, and C-104 ................................................................................ 4.29
4.18. Proposed Bounding Conditions for Pretreated HLW Melter Feed, Including Plots for AZ-101, AZ-102, and C-104 HLW Melter Feed ............................................................................. 4.29
4.19. Basis for Calculating the Maximum Shear Rate at a Pipe Wall..................................................... 4.32
4.20. Basis for Calculating a Maximum Shear Rate in a Mixing Tank .................................................. 4.32
4.21. Pretreated HLW Rheological Bounding Conditions...................................................................... 4.33
4.22. HLW Melter Feed Rheological Bounding Conditions................................................................... 4.33
4.23. Basic HLW SBS Recycle Schematic ............................................................................................. 4.37
xxi
Tables
S.1. Summary of Test Objectives and Results ............................................................................................ iii
S.2. Test Exceptions.................................................................................................................................... iv
S.3. Summary of Success Criteria............................................................................................................... vi
S.4. R&T Test Conditions.........................................................................................................................viii
S.5. Summary of Bounding Conditions HLW Pretreated Sludge............................................................... xi
S.6. Summary of Bounding Conditions for HLW Melter Feed .................................................................xii 1.1. Glass-Former Chemicals and Minerals.............................................................................................. 1.4
2.1. Examples of Dimensionless Groups Significant in Fluid Flow, Heat, and Mass Transfer ................ 2.3
2.2. Physical Properties Considered in Smith and Prindiville (2002) for HLW Pretreated Sludge and Melter Feed ................................................................................................................................. 2.4
3.1. Documents Reporting Physical and Rheological Measurements of Hanford HLW Pretreated Sludge and Corresponding Melter Feeds ........................................................................................... 3.1
3.2. Summary of AZ-101 HLW Physical and Rheological Property Measurements ............................... 3.5
3.3. Summary of Appendix A Database ................................................................................................... 3.8
4.1. Settling Information on Glass-Former Chemicals ............................................................................. 4.8
4.2. Compilation of Physical-Property Bounding Conditions ................................................................ 4.17
4.3. Rheological Comparison of Estimated Actual HLW Pretreated Sludge Data to Proposed Operating Envelope at 25°C ............................................................................................................ 4.20
4.4. Rheological Comparison of Estimated Actual HLW Melter Feed Data to Proposed Operating Envelope at 25°C ............................................................................................................ 4.21
4.5. Parameters Used to Correlate Bingham Plastic Indices to Total Solids Loading at 25°C ............... 4.23
4.6. Operating Conditions for Pretreated HLW Waste and Melter Feed ................................................ 4.33
6.1. Summary of Bounding Conditions for HLW Pretreated Sludge ....................................................... 6.2
6.2. Summary of Bounding Conditions for HLW Melter Feed ................................................................ 6.3
1.1
1.0 Introduction
The Hanford Site has 177 single-shell and double-shell tanks containing radioactive waste. The Office of River Protection’s (ORP) Hanford Waste Treatment Plant (WTP) is being designed and built to treat and vitrify these wastes. The WTP consists of three primary facilities: a pretreatment facility and two facilities for low-activity and high-level waste vitrification. The pretreatment facility receives waste feed from the Hanford tank farms and separates it into two treated process streams: a high-volume, low-activity, liquid process stream stripped of most solids and radioisotopes and a much smaller volume high-level waste (HLW) slurry containing most of the solids and radioactivity. In the pretreatment facility, solids and radioisotopes are removed from the tank waste by precipitation, filtration, and ion exchange processes to produce the low-activity waste (LAW) streams. The slurry of filtered solids will be blended with ion exchange eluate streams containing soluble radioisotopes to produce the HLW streams. The pretreated HLW mixture routes to the High-Level Waste Vitrification Facility and the pretreated LAW stream routes to the Low-Activity Waste Vitrification Facility. These two vitrification facilities convert these process streams into glass, which is poured directly into stainless steel containers.
The tank waste currently stored in the Hanford tank farm has been categorized according to chemical
and radiochemical properties into four categories. These categories are referred to as Envelope A, Envelope B, Envelope C, and Envelope D wastes. The two vitrification process streams considered in this report are the pretreated HLW and the HLW melter feed obtained from the Envelope D wastes.
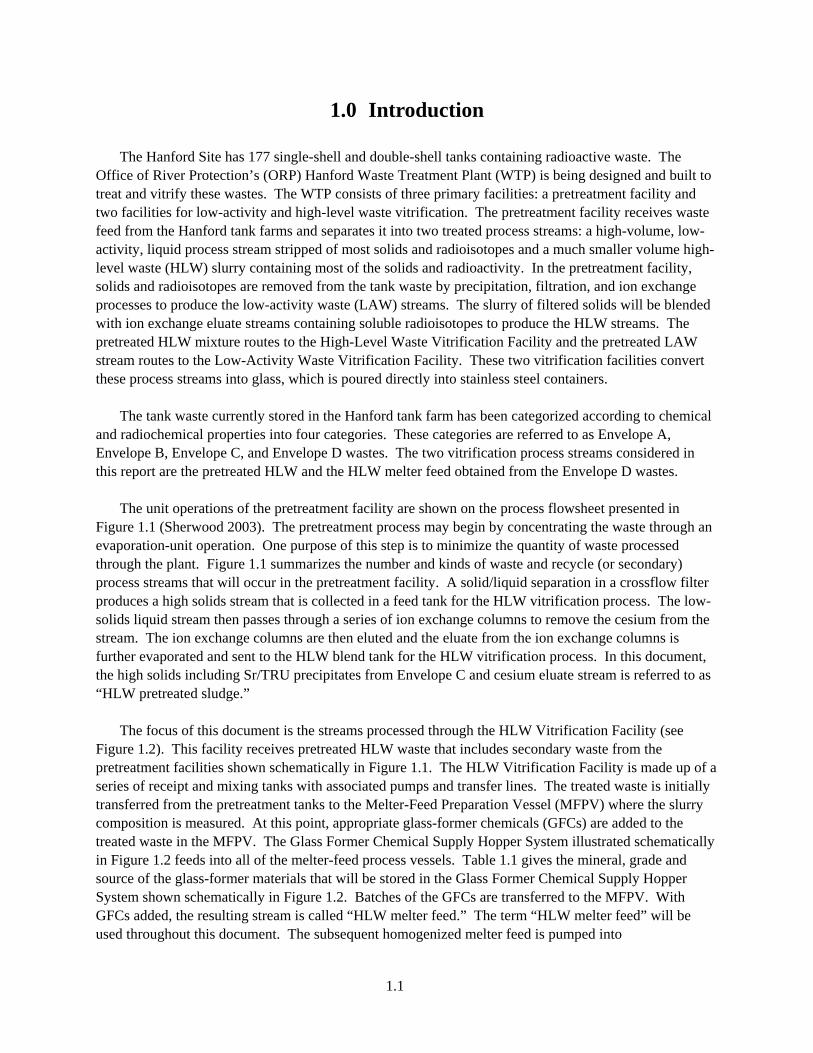
The unit operations of the pretreatment facility are shown on the process flowsheet presented in
Figure 1.1 (Sherwood 2003). The pretreatment process may begin by concentrating the waste through an evaporation-unit operation. One purpose of this step is to minimize the quantity of waste processed through the plant. Figure 1.1 summarizes the number and kinds of waste and recycle (or secondary) process streams that will occur in the pretreatment facility. A solid/liquid separation in a crossflow filter produces a high solids stream that is collected in a feed tank for the HLW vitrification process. The low-solids liquid stream then passes through a series of ion exchange columns to remove the cesium from the stream. The ion exchange columns are then eluted and the eluate from the ion exchange columns is further evaporated and sent to the HLW blend tank for the HLW vitrification process. In this document, the high solids including Sr/TRU precipitates from Envelope C and cesium eluate stream is referred to as “HLW pretreated sludge.”
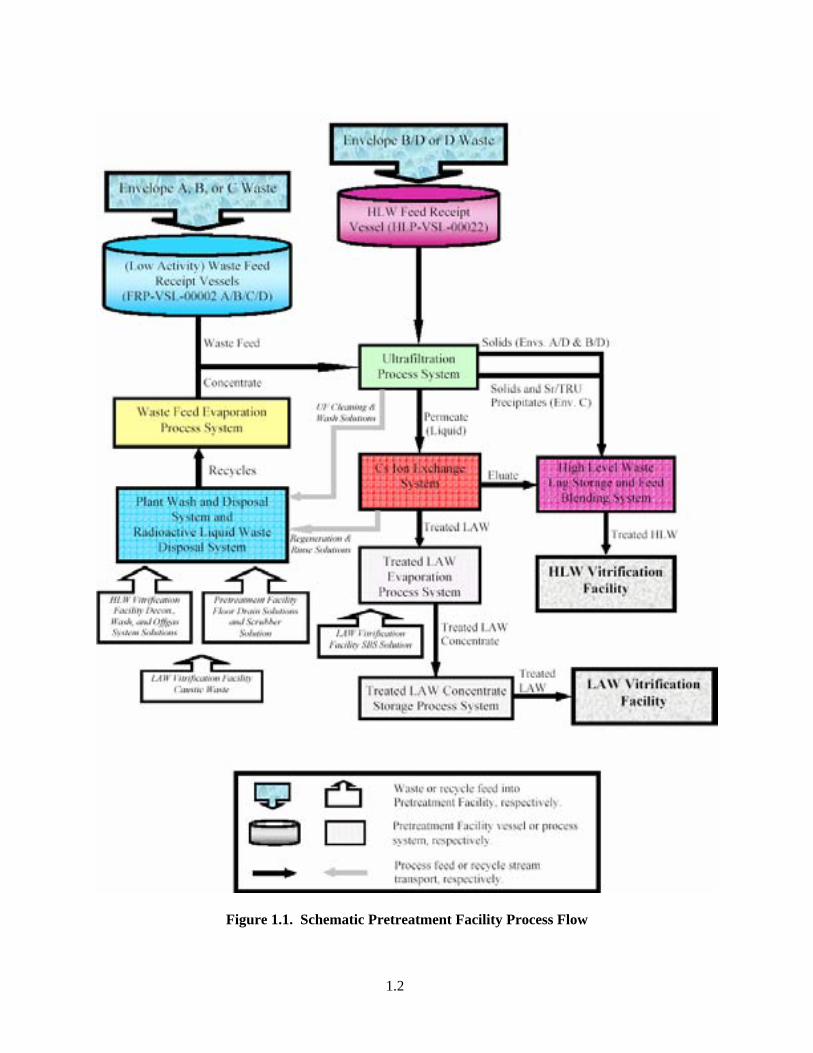
The focus of this document is the streams processed through the HLW Vitrification Facility (see
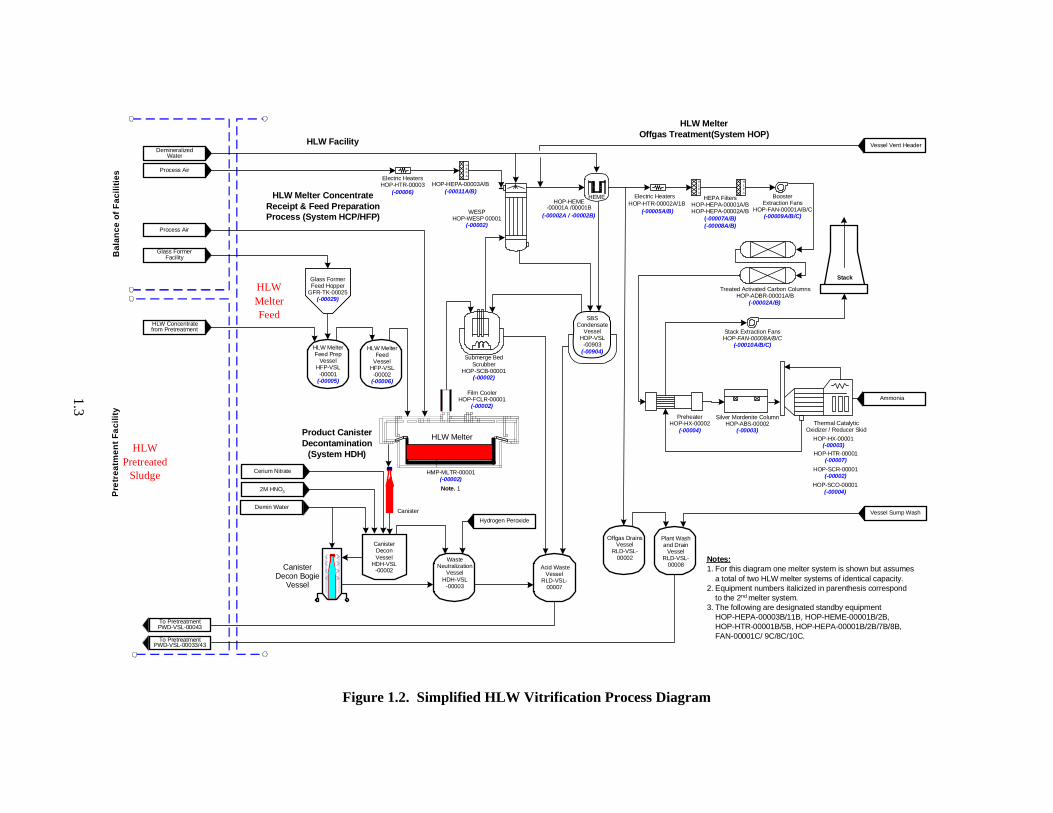
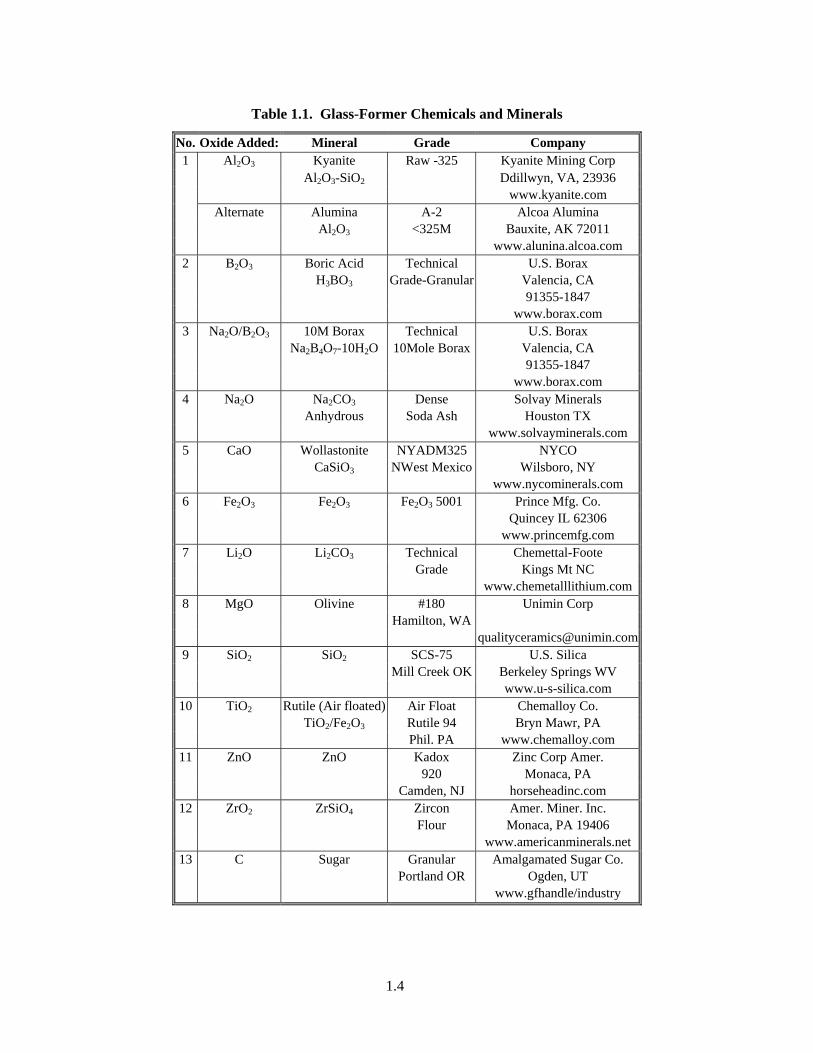
Figure 1.2). This facility receives pretreated HLW waste that includes secondary waste from the pretreatment facilities shown schematically in Figure 1.1. The HLW Vitrification Facility is made up of a series of receipt and mixing tanks with associated pumps and transfer lines. The treated waste is initially transferred from the pretreatment tanks to the Melter-Feed Preparation Vessel (MFPV) where the slurry composition is measured. At this point, appropriate glass-former chemicals (GFCs) are added to the treated waste in the MFPV. The Glass Former Chemical Supply Hopper System illustrated schematically in Figure 1.2 feeds into all of the melter-feed process vessels. Table 1.1 gives the mineral, grade and source of the glass-former materials that will be stored in the Glass Former Chemical Supply Hopper System shown schematically in Figure 1.2. Batches of the GFCs are transferred to the MFPV. With GFCs added, the resulting stream is called “HLW melter feed.” The term “HLW melter feed” will be used throughout this document. The subsequent homogenized melter feed is pumped into
1.2
Figure 1.1. Schematic Pretreatment Facility Process Flow
1.3
Notes:1. For this diagram one melter system is shown but assumes a total of two HLW melter systems of identical capacity.2. Equipment numbers italicized in parenthesis correspond to the 2nd melter system.3. The following are designated standby equipment HOP-HEPA-00003B/11B, HOP-HEME-00001B/2B, HOP-HTR-00001B/5B, HOP-HEPA-00001B/2B/7B/8B, FAN-00001C/ 9C/8C/10C.
HMP-MLTR-00001(-00002)
Film CoolerHOP-FCLR-00001
(-00002)
Treated Activated Carbon ColumnsHOP-ADBR-00001A/B
SBSCondensate
VesselHOP-VSL
-00903(-00904)
Submerge BedScrubber
HOP-SCB-00001(-00002)
WESPHOP-WESP 00001
(-00002)
Stack
HLW MelterOffgas Treatment(System HOP)
HLW Melter ConcentrateReceipt & Feed PreparationProcess (System HCP/HFP)
Canister
Pre
trea
tmen
t Fac
ility
Bal
ance
of F
acili
ties
HLW Facility
To PretreatmentPWD-VSL-00033/43
Process Air
HLW Concentratefrom Pretreatment
Demin WaterVessel Sump Wash
BoosterExtraction Fans
HOP-FAN-00001A/B/C(-00009A/B/C)
Acid WasteVessel
RLD-VSL-00007
Note. 1
Offgas DrainsVessel
RLD-VSL-00002
2M HNO3
CanisterDeconVessel
HDH-VSL-00002
Process Air
WasteNeutralization
VesselHDH-VSL
-00003
DemineralizedWater
HEPA FiltersHOP-HEPA-00001A/BHOP-HEPA-00002A/B
(-00007A/B)(-00008A/B)
Stack Extraction FansHOP-FAN-00008A/B/C
(-00010A/B/C)
Cerium Nitrate
HLW Melter
Plant Washand Drain
VesselRLD-VSL-
00008
Product CanisterDecontamination
(System HDH)
PreheaterHOP-HX-00002
(-00004)
HOP-HEME-00001A /00001B
Silver Mordenite ColumnHOP-ABS-00002
(-00003)
CanisterDecon Bogie
Vessel
Hydrogen Peroxide
Glass FormerFacility
To PretreatmentPWD-VSL-00043
HLW MelterFeed Prep
VesselHFP-VSL
-00001(-00005)
HLW MelterFeed
VesselHFP-VSL-00002
(-00006)
Glass FormerFeed Hopper
GFR-TK-00025(-00029)
HEPA
HOP-HTR-00002A/1B(-00005A/B)
Electric Heaters
Vessel Vent Header
(-00002A / -00002B)
Thermal CatalyticOxidizer / Reducer Skid
Ammonia
HOP-HX-00001(-00003)
HEPA
Electric HeatersHOP-HTR-00003
(-00006)HEME
(-00002A/B)
HOP-SCO-00001(-00004)
HOP-SCR-00001(-00002)
HOP-HTR-00001(-00007)
HEPA
HOP-HEPA-00003A/B(-00011A/B)
HLW Pretreated
Sludge
HLW Melter Feed
Figure 1.2. Simplified HLW Vitrification Process Diagram
1.4
Table 1.1. Glass-Former Chemicals and Minerals
No. Oxide Added: Mineral Grade Company 1 Al2O3 Kyanite Raw -325 Kyanite Mining Corp Al2O3-SiO2 Ddillwyn, VA, 23936 www.kyanite.com Alternate Alumina A-2 Alcoa Alumina Al2O3 <325M Bauxite, AK 72011 www.alunina.alcoa.com
2 B2O3 Boric Acid Technical U.S. Borax H3BO3 Grade-Granular Valencia, CA 91355-1847 www.borax.com
3 Na2O/B2O3 10M Borax Technical U.S. Borax Na2B4O7-10H2O 10Mole Borax Valencia, CA 91355-1847 www.borax.com
4 Na2O Na2CO3 Dense Solvay Minerals Anhydrous Soda Ash Houston TX www.solvayminerals.com
5 CaO Wollastonite NYADM325 NYCO CaSiO3 NWest Mexico Wilsboro, NY www.nycominerals.com
6 Fe2O3 Fe2O3 Fe2O3 5001 Prince Mfg. Co. Quincey IL 62306 www.princemfg.com
7 Li2O Li2CO3 Technical Chemettal-Foote Grade Kings Mt NC www.chemetalllithium.com
8 MgO Olivine #180 Unimin Corp Hamilton, WA [email protected]
9 SiO2 SiO2 SCS-75 U.S. Silica Mill Creek OK Berkeley Springs WV www.u-s-silica.com
10 TiO2 Rutile (Air floated) Air Float Chemalloy Co. TiO2/Fe2O3 Rutile 94 Bryn Mawr, PA Phil. PA www.chemalloy.com
11 ZnO ZnO Kadox Zinc Corp Amer. 920 Monaca, PA Camden, NJ horseheadinc.com
12 ZrO2 ZrSiO4 Zircon Amer. Miner. Inc. Flour Monaca, PA 19406 www.americanminerals.net
13 C Sugar Granular Amalgamated Sugar Co. Portland OR Ogden, UT www.gfhandle/industry
1.5
the Melter Feed Vessel (MFV) and then fed to the melter. The remainder of the flowsheet consists of unit operations dedicated to treatment of the melter-generated offgas stream.
The objective of this document is to develop a set of bounding physical and rheological properties for
waste materials that can be reasonably processed and that likely will be encountered in the WTP HLW Vitrification Facility. To determine the physical and rheological bounding conditions for each unit operation, one must understand what general waste properties are anticipated and how changes in these properties impact process operation. The process boundaries are then established at the point where the properties of the material introduce unacceptable risk to plant performance. Hence, this set of bounding physical and rheological properties can be used to determine if a given pretreated waste or melter feed will cause processing problems by forcing the system to operate outside its design capabilities. The technical basis for these processing boundaries is established in this document.
2.1
2.0 Dimensional Analysis as a Basis for Vitrification Stream Bounding Conditions
The correlations used in the calculation of the bounding physical and rheological conditions are based on dimensionless numbers and dimensional analysis. Given the complexity of the problem and the multiple scenarios where problems arise, dimensional analysis is the only feasible method of determining realistic bounding conditions for the WTP. This section provides the foundation for the determination of the bounding conditions.
In this work, a two-phased approach has been taken. The first phase involved creating a list of
physical properties that are believed to have a role in the process flowsheet. The physical-property bounding conditions can be established by simply compiling the actual waste physical-property data into a range of values that account for all the previously measured values. This approach has the advantage of requiring a minimal amount of process-engineering knowledge. However, not considering the engineering knowledge of the flowsheet may lead to a set of bounding conditions that cannot be efficiently processed.
The second phase in developing physical-property bounding conditions involved examining
performance correlations for the unit operations described in the process flowsheet. With these correlations, a list of significant physical properties can be developed. The effect on the performance of the equipment by varying the physical properties can be examined with these correlations. These correlations can be used to find limits on the physical properties where equipment performance may drop to unacceptable levels.
The intersection of actual waste measurements (first phase) and bounding conditions based on
performance criteria (second phase) was evaluated to establish a set of overall bounding conditions. When engineering design information is needed, Hanford Waste Vitrification Plant (HWVP) and Defense Waste Processing Facility (DWPF) engineering data was used to eliminate conflict with ongoing WTP design efforts.
To begin this process, the unit operations described in the flowsheet needed to be established. The
simplified process flowsheet discussed in Section 1.0 consists of several unit operations that involve the following processes: • fluid flow
o piping o pumps
• fluid mixing o mechanical agitators o pulse jet mixers (PJMs) with sparging
• vitrification.
In addition, there are several unit operations that precede the vitrification streams that have a direct impact on the physical properties of the vitrification streams. Such unit operations cannot typically be designed completely by theoretical or mathematical methods. One method of attacking a problem for
2.2
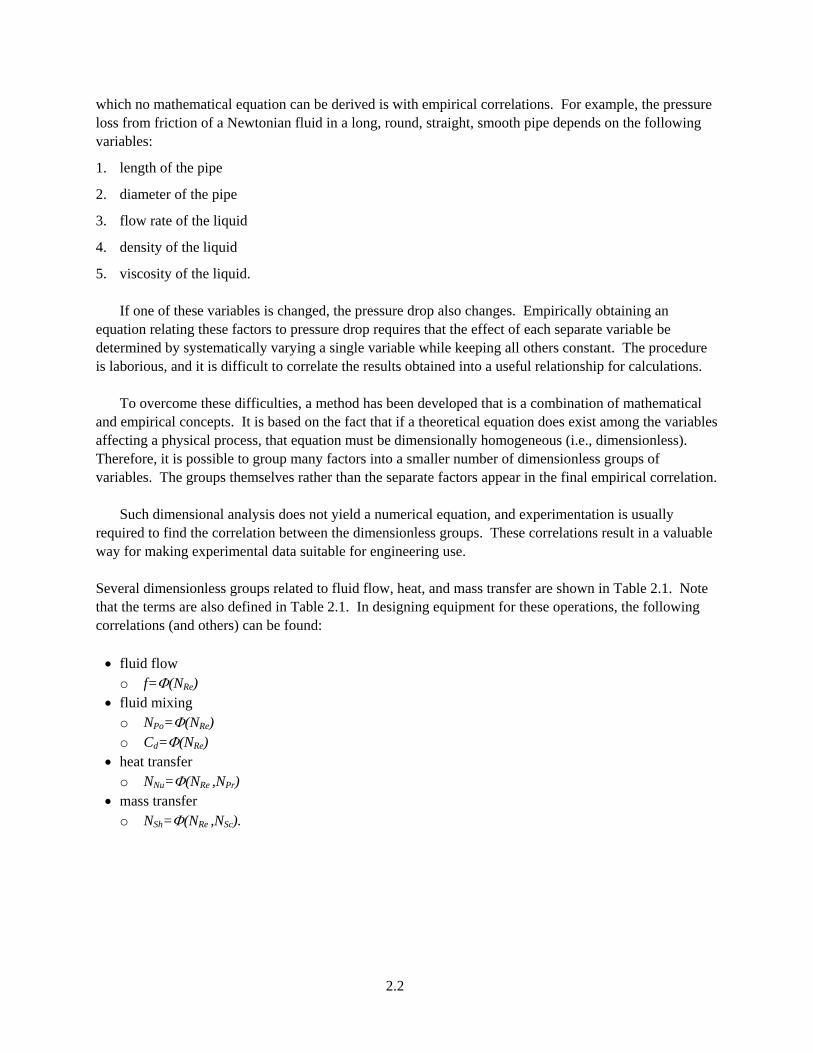
which no mathematical equation can be derived is with empirical correlations. For example, the pressure loss from friction of a Newtonian fluid in a long, round, straight, smooth pipe depends on the following variables:
1. length of the pipe
2. diameter of the pipe
3. flow rate of the liquid
4. density of the liquid
5. viscosity of the liquid.
If one of these variables is changed, the pressure drop also changes. Empirically obtaining an equation relating these factors to pressure drop requires that the effect of each separate variable be determined by systematically varying a single variable while keeping all others constant. The procedure is laborious, and it is difficult to correlate the results obtained into a useful relationship for calculations.
To overcome these difficulties, a method has been developed that is a combination of mathematical and empirical concepts. It is based on the fact that if a theoretical equation does exist among the variables affecting a physical process, that equation must be dimensionally homogeneous (i.e., dimensionless). Therefore, it is possible to group many factors into a smaller number of dimensionless groups of variables. The groups themselves rather than the separate factors appear in the final empirical correlation.
Such dimensional analysis does not yield a numerical equation, and experimentation is usually required to find the correlation between the dimensionless groups. These correlations result in a valuable way for making experimental data suitable for engineering use. Several dimensionless groups related to fluid flow, heat, and mass transfer are shown in Table 2.1. Note that the terms are also defined in Table 2.1. In designing equipment for these operations, the following correlations (and others) can be found: • fluid flow
o f=Φ(NRe) • fluid mixing
o NPo=Φ(NRe) o Cd=Φ(NRe)
• heat transfer o NNu=Φ(NRe ,NPr)
• mass transfer o NSh=Φ(NRe ,NSc).
2.3
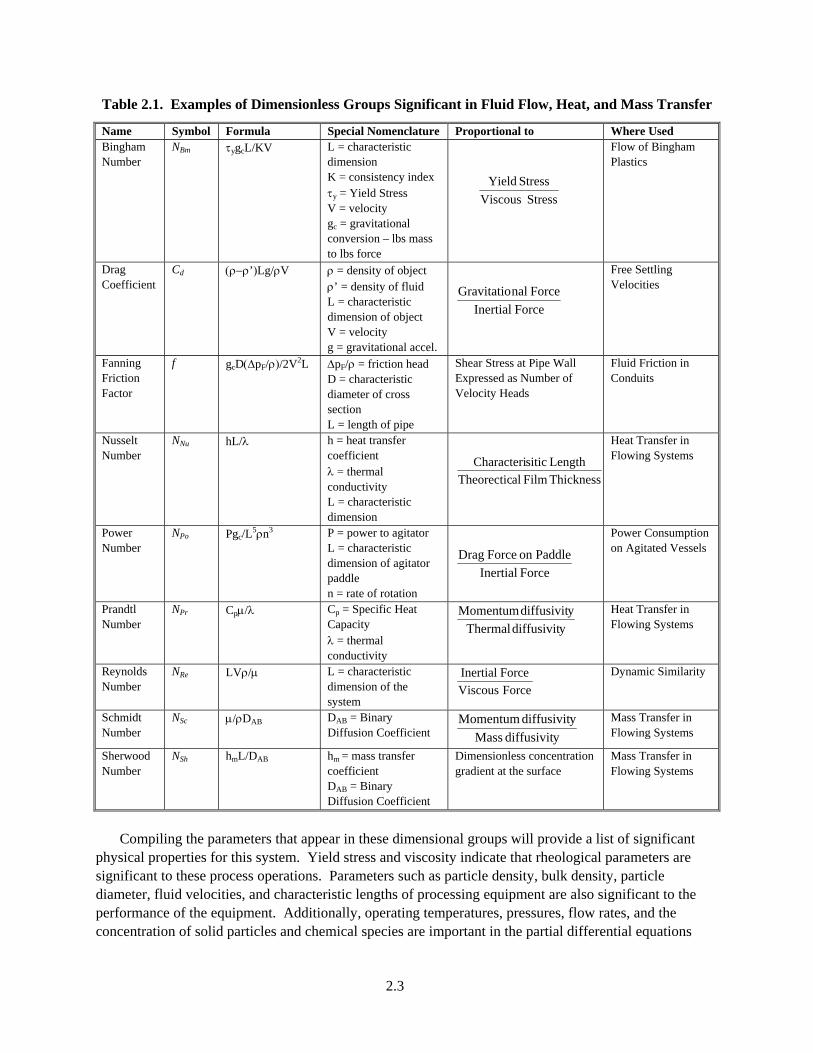
Table 2.1. Examples of Dimensionless Groups Significant in Fluid Flow, Heat, and Mass Transfer
Name Symbol Formula Special Nomenclature Proportional to Where Used Bingham Number
NBm τygcL/KV L = characteristic dimension K = consistency index τy = Yield Stress V = velocity gc = gravitational conversion – lbs mass to lbs force
Stress ViscousStress Yield
Flow of Bingham Plastics
Drag Coefficient
Cd (ρ−ρ’)Lg/ρV ρ = density of object ρ’ = density of fluid L = characteristic dimension of object V = velocity g = gravitational accel.
Force InertialForce nalGravitatio
Free Settling Velocities
Fanning Friction Factor
f gcD(ΔpF/ρ)/2V2L ΔpF/ρ = friction head D = characteristic diameter of cross section L = length of pipe
Shear Stress at Pipe Wall Expressed as Number of Velocity Heads
Fluid Friction in Conduits
Nusselt Number
NNu hL/λ h = heat transfer coefficient λ = thermal conductivity L = characteristic dimension
Thickness Film alTheorecticLength siticCharacteri
Heat Transfer in Flowing Systems
Power Number
NPo Pgc/L5ρn3 P = power to agitator L = characteristic dimension of agitator paddle n = rate of rotation
Force InertialPaddleon Force Drag
Power Consumption on Agitated Vessels
Prandtl Number
NPr Cpμ/λ Cp = Specific Heat Capacity λ = thermal conductivity
ydiffusivit Thermalydiffusivit Momentum Heat Transfer in
Flowing Systems
Reynolds Number
NRe LVρ/μ L = characteristic dimension of the system
Force ViscousForce Inertial Dynamic Similarity
Schmidt Number
NSc μ/ρDAB DAB = Binary Diffusion Coefficient ydiffusivit Mass
ydiffusivit Momentum Mass Transfer in Flowing Systems
Sherwood Number
NSh hmL/DAB hm = mass transfer coefficient DAB = Binary Diffusion Coefficient
Dimensionless concentration gradient at the surface
Mass Transfer in Flowing Systems
Compiling the parameters that appear in these dimensional groups will provide a list of significant
physical properties for this system. Yield stress and viscosity indicate that rheological parameters are significant to these process operations. Parameters such as particle density, bulk density, particle diameter, fluid velocities, and characteristic lengths of processing equipment are also significant to the performance of the equipment. Additionally, operating temperatures, pressures, flow rates, and the concentration of solid particles and chemical species are important in the partial differential equations
2.4
relevant to fluid flow, heat, and mass-transfer operations. Such partial differential equations include the continuity, momentum, energy, and conservation of mass equations.
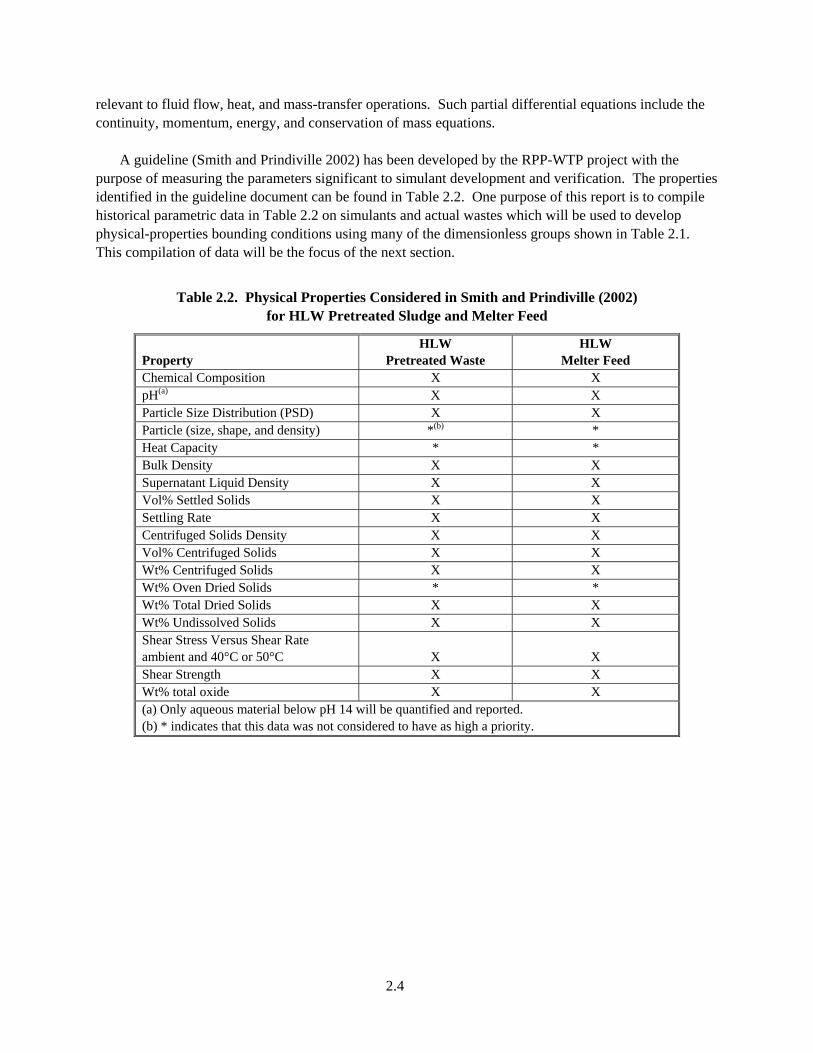
A guideline (Smith and Prindiville 2002) has been developed by the RPP-WTP project with the
purpose of measuring the parameters significant to simulant development and verification. The properties identified in the guideline document can be found in Table 2.2. One purpose of this report is to compile historical parametric data in Table 2.2 on simulants and actual wastes which will be used to develop physical-properties bounding conditions using many of the dimensionless groups shown in Table 2.1. This compilation of data will be the focus of the next section.
Table 2.2. Physical Properties Considered in Smith and Prindiville (2002) for HLW Pretreated Sludge and Melter Feed
Property HLW
Pretreated Waste HLW
Melter Feed Chemical Composition X X pH(a) X X Particle Size Distribution (PSD) X X Particle (size, shape, and density) *(b) * Heat Capacity * * Bulk Density X X Supernatant Liquid Density X X Vol% Settled Solids X X Settling Rate X X Centrifuged Solids Density X X Vol% Centrifuged Solids X X Wt% Centrifuged Solids X X Wt% Oven Dried Solids * * Wt% Total Dried Solids X X Wt% Undissolved Solids X X Shear Stress Versus Shear Rate ambient and 40°C or 50°C X X Shear Strength X X Wt% total oxide X X (a) Only aqueous material below pH 14 will be quantified and reported. (b) * indicates that this data was not considered to have as high a priority.
3.1
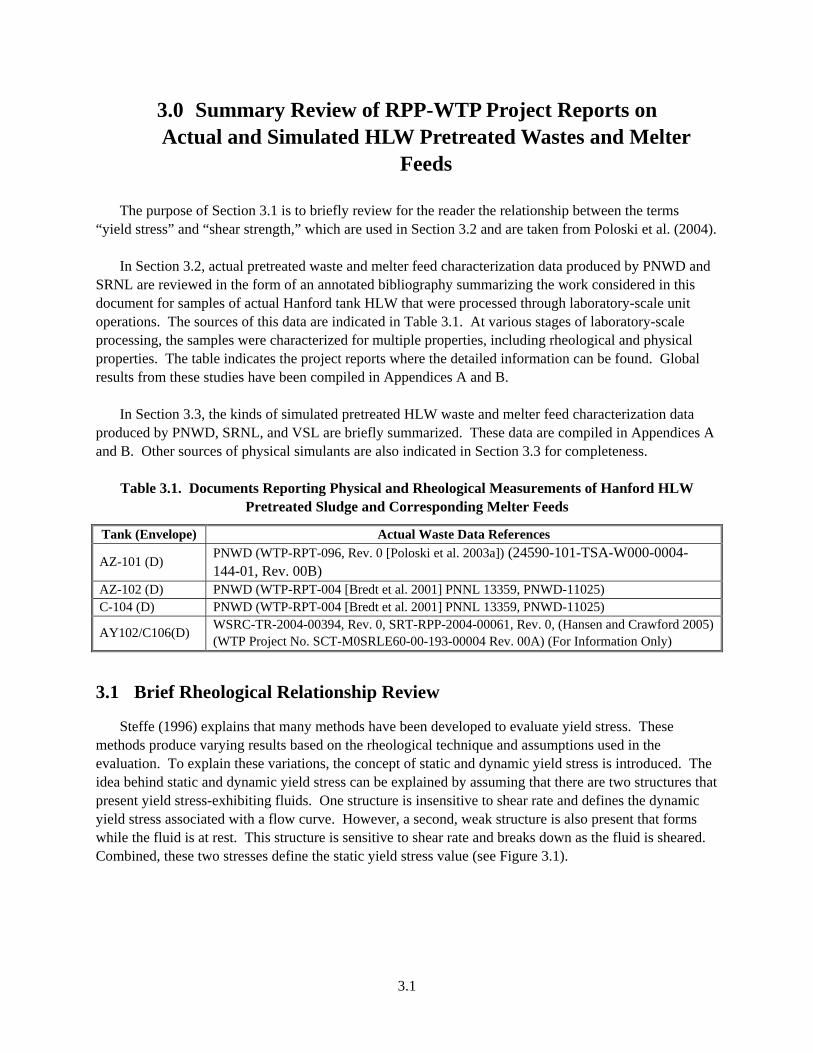
3.0 Summary Review of RPP-WTP Project Reports on Actual and Simulated HLW Pretreated Wastes and Melter
Feeds
The purpose of Section 3.1 is to briefly review for the reader the relationship between the terms “yield stress” and “shear strength,” which are used in Section 3.2 and are taken from Poloski et al. (2004).
In Section 3.2, actual pretreated waste and melter feed characterization data produced by PNWD and
SRNL are reviewed in the form of an annotated bibliography summarizing the work considered in this document for samples of actual Hanford tank HLW that were processed through laboratory-scale unit operations. The sources of this data are indicated in Table 3.1. At various stages of laboratory-scale processing, the samples were characterized for multiple properties, including rheological and physical properties. The table indicates the project reports where the detailed information can be found. Global results from these studies have been compiled in Appendices A and B.
In Section 3.3, the kinds of simulated pretreated HLW waste and melter feed characterization data
produced by PNWD, SRNL, and VSL are briefly summarized. These data are compiled in Appendices A and B. Other sources of physical simulants are also indicated in Section 3.3 for completeness.
Table 3.1. Documents Reporting Physical and Rheological Measurements of Hanford HLW
Pretreated Sludge and Corresponding Melter Feeds
Tank (Envelope) Actual Waste Data References
AZ-101 (D) PNWD (WTP-RPT-096, Rev. 0 [Poloski et al. 2003a]) (24590-101-TSA-W000-0004-144-01, Rev. 00B)
AZ-102 (D) PNWD (WTP-RPT-004 [Bredt et al. 2001] PNNL 13359, PNWD-11025) C-104 (D) PNWD (WTP-RPT-004 [Bredt et al. 2001] PNNL 13359, PNWD-11025)
AY102/C106(D) WSRC-TR-2004-00394, Rev. 0, SRT-RPP-2004-00061, Rev. 0, (Hansen and Crawford 2005) (WTP Project No. SCT-M0SRLE60-00-193-00004 Rev. 00A) (For Information Only)
3.1 Brief Rheological Relationship Review
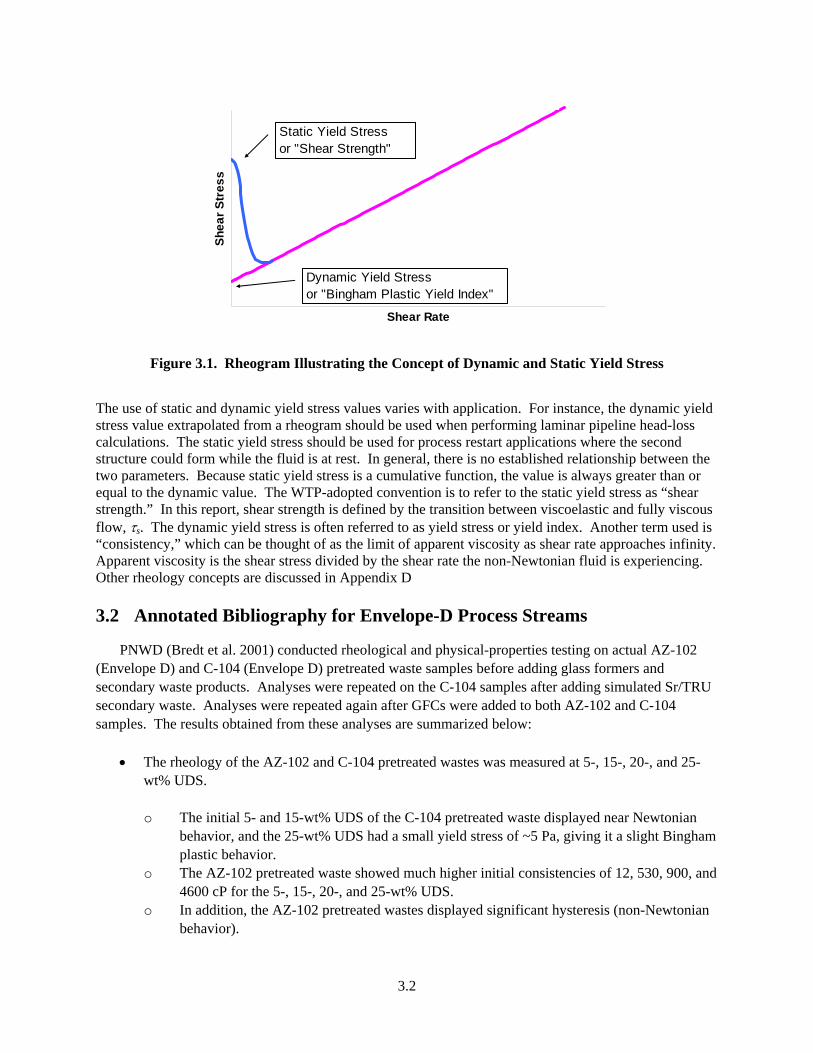
Steffe (1996) explains that many methods have been developed to evaluate yield stress. These methods produce varying results based on the rheological technique and assumptions used in the evaluation. To explain these variations, the concept of static and dynamic yield stress is introduced. The idea behind static and dynamic yield stress can be explained by assuming that there are two structures that present yield stress-exhibiting fluids. One structure is insensitive to shear rate and defines the dynamic yield stress associated with a flow curve. However, a second, weak structure is also present that forms while the fluid is at rest. This structure is sensitive to shear rate and breaks down as the fluid is sheared. Combined, these two stresses define the static yield stress value (see Figure 3.1).
3.2
Shear Rate
Shea
r Str
ess
Dynamic Yield Stressor "Bingham Plastic Yield Index"
Static Yield Stressor "Shear Strength"
Figure 3.1. Rheogram Illustrating the Concept of Dynamic and Static Yield Stress
The use of static and dynamic yield stress values varies with application. For instance, the dynamic yield stress value extrapolated from a rheogram should be used when performing laminar pipeline head-loss calculations. The static yield stress should be used for process restart applications where the second structure could form while the fluid is at rest. In general, there is no established relationship between the two parameters. Because static yield stress is a cumulative function, the value is always greater than or equal to the dynamic value. The WTP-adopted convention is to refer to the static yield stress as “shear strength.” In this report, shear strength is defined by the transition between viscoelastic and fully viscous flow, τs. The dynamic yield stress is often referred to as yield stress or yield index. Another term used is “consistency,” which can be thought of as the limit of apparent viscosity as shear rate approaches infinity. Apparent viscosity is the shear stress divided by the shear rate the non-Newtonian fluid is experiencing. Other rheology concepts are discussed in Appendix D
3.2 Annotated Bibliography for Envelope-D Process Streams
PNWD (Bredt et al. 2001) conducted rheological and physical-properties testing on actual AZ-102 (Envelope D) and C-104 (Envelope D) pretreated waste samples before adding glass formers and secondary waste products. Analyses were repeated on the C-104 samples after adding simulated Sr/TRU secondary waste. Analyses were repeated again after GFCs were added to both AZ-102 and C-104 samples. The results obtained from these analyses are summarized below:
• The rheology of the AZ-102 and C-104 pretreated wastes was measured at 5-, 15-, 20-, and 25-wt% UDS.
o The initial 5- and 15-wt% UDS of the C-104 pretreated waste displayed near Newtonian
behavior, and the 25-wt% UDS had a small yield stress of ~5 Pa, giving it a slight Bingham plastic behavior.
o The AZ-102 pretreated waste showed much higher initial consistencies of 12, 530, 900, and 4600 cP for the 5-, 15-, 20-, and 25-wt% UDS.
o In addition, the AZ-102 pretreated wastes displayed significant hysteresis (non-Newtonian behavior).
3.3
o No significant temperature effects on rheological properties were observed for the C-104 or AZ-102 samples measured at 25 and 50°C.
• A mixing and aging study was conducted on the 15-wt% UDS(waste) AZ-102 and 25-wt%
UDS(waste) C-104 melter feeds.
o The yield stress and consistency of the AZ-102 HLW melter feed decreased over a 1-week mixing period during this mixing/aging study.
o The C-104 HLW melter feed yield stress increased from 28 Pa after 1 hour of mixing to 56 Pa after 1 week of mixing.
o Over this same time period, the Bingham consistency of the C-104 HLW melter feed increased from 910 cP to 1700 cP at a shear rate of 33 s-1.
• Following the mixing study, the 15-wt% UDS(waste) AZ-102 and 25-wt% UDS(waste) C-104
HLW melter feeds were allowed to settle for 1 week.
o The 15-wt% UDS AZ-102 sample displayed standing liquid whereas the 25-wt% UDS C-104 sample did not.
o The 15-wt% UDS AZ-102 sample displayed shear thinning behavior while the 25-wt% UDS C-104 sample continued to thicken.
Morrey et al. (1996) compared the rheological properties of AZ-101 and AZ-102 actual wastes to NCAW simulant made up to the same composition chemically and found that the simulant rheological properties exceeded those of the actual waste. The importance of Morrey et al.’s work was that it compared a carefully made simulant with the actual waste that the simulant was made up to mimic. Brooks et al. (2000a) present work on actual AZ-102 sludge properties before and after it had been through the prescribed pretreatment process.
PNWD (Poloski et al. 2003a) conducted rheological and physical-properties testing on actual AZ-101
(Envelope D) pretreated waste samples before adding glass formers and secondary waste products. A sample of AZ-101 HLW pretreated sludge was received at an initial UDS concentration of 10.3 wt%. The 10.3-wt% UDS sample was concentrated to 22-wt% UDS by decanting the supernate.
The AZ-101 22-wt% UDS sample was diluted to 10- and 15-wt% UDS concentrations so its
rheological properties could be studied over a range of UDS concentrations. The results from the testing of the AZ-101 HLW pretreated sludge at 10-, 15-, and 22-wt% UDS concentrations are listed in Table 3.2 and summarized below:
• Flow curves from these samples indicate that the fluid should be characterized as a Bingham- plastic fluid.
o The maximum measured rheological parameters occurring at 22-wt% UDS were a
Bingham consistency of 11 cP and Bingham yield stress of 11 Pa at 25°C. o At 40°C, the Bingham-plastic parameters of the 22-wt% UDS pretreated sludge were a
Bingham consistency of 7 cP and Bingham yield stress of 10 Pa. o The pH of the 22-wt% UDS sample was determined to be 12.1.
3.4
• The shear strength behavior of the 22-wt% UDS AZ-101 HLW pretreated sludge sample was determined by agitating (i.e., stirring) the sample and allowing it to sit undisturbed for various periods of time (the periods are also known as “gel time”) between measurements.
o The shear strength appeared to stabilize after approximately 16 hours at approximately
30 Pa. • GFCs were mixed with an AZ-101 22-wt% UDS HLW pretreated sludge sample to make a melter
feed. The melter feed was continuously mixed, and the rheology and pH of the sample were measured at intervals of 1 hour, 1 day, and 1 week.
o When GFCs were added to the AZ-101 pretreated HLW, the pH of the solution dropped
from 12.1 to a range of 9.9 to 10.4. This is most likely because of the relatively large quantity of soluble carbonate species in the melter-feed formulation used for this test.
o At 10-wt% UDS (waste solids), the AZ-101 HLW melter feed still exhibited Bingham-plastic rheological behavior.
SRNL (Hansen and Crawford 2005) has characterized a sample of AY102/C106 HLW sludge.
However, the results were not included in this report because the weight percent solids data for the AY102/C106 HLW sludge were found to be wrong and the resulting melter feed compositions were outside of the envelope of desirable glass batch make-up compositions and therefore were not relevant. Note that because the previous sludge weight percent solids measurements were performed on two different samples which gave different weight percent solids and it is not known if one or both were incorrect, a meaningful back calculation is not possible.
3.5
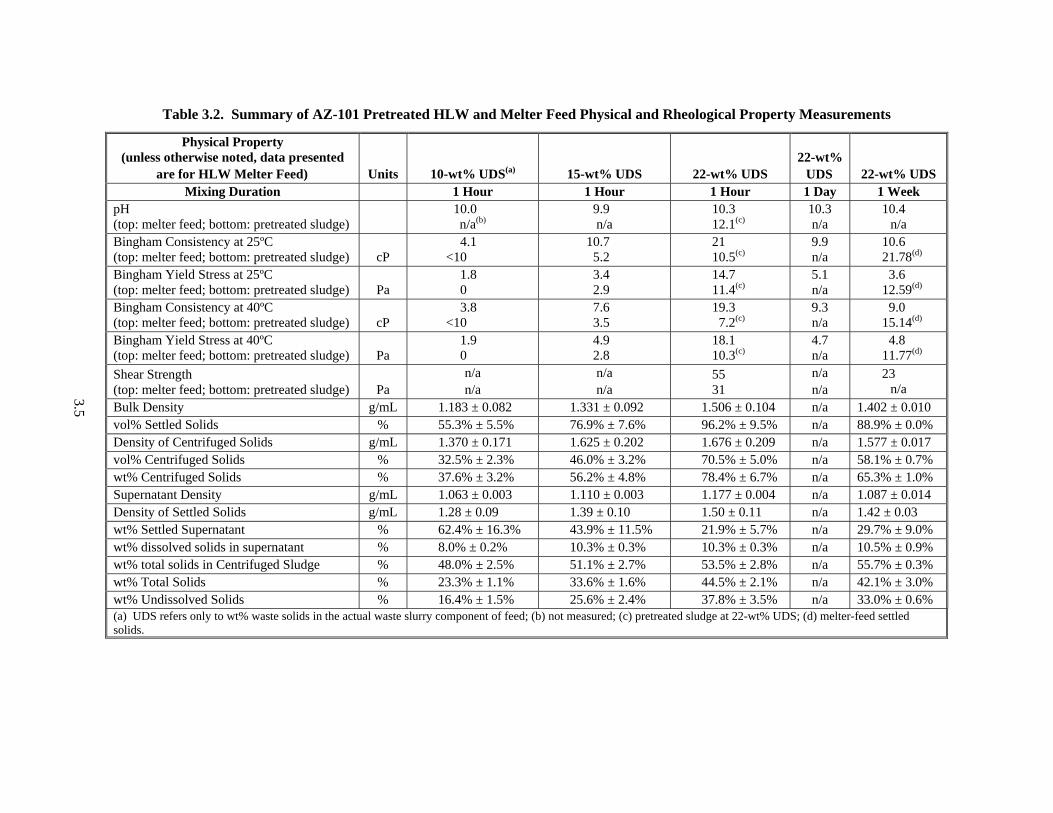
Table 3.2. Summary of AZ-101 Pretreated HLW and Melter Feed Physical and Rheological Property Measurements
Physical Property (unless otherwise noted, data presented
are for HLW Melter Feed) Units 10-wt% UDS(a) 15-wt% UDS 22-wt% UDS 22-wt%
UDS 22-wt% UDS Mixing Duration 1 Hour 1 Hour 1 Hour 1 Day 1 Week
pH (top: melter feed; bottom: pretreated sludge)
10.0 n/a(b)
9.9 n/a
10.3 12.1(c)
10.3 n/a
10.4 n/a
Bingham Consistency at 25ºC (top: melter feed; bottom: pretreated sludge) cP
4.1 <10
10.7 5.2
21 10.5(c)
9.9 n/a
10.6 21.78(d)
Bingham Yield Stress at 25ºC (top: melter feed; bottom: pretreated sludge) Pa
1.8 0
3.4 2.9
14.7 11.4(c)
5.1 n/a
3.6 12.59(d)
Bingham Consistency at 40ºC (top: melter feed; bottom: pretreated sludge) cP
3.8 <10
7.6 3.5
19.3 7.2(c)
9.3 n/a
9.0 15.14(d)
Bingham Yield Stress at 40ºC (top: melter feed; bottom: pretreated sludge) Pa
1.9 0
4.9 2.8
18.1 10.3(c)
4.7 n/a
4.8 11.77(d)
Shear Strength (top: melter feed; bottom: pretreated sludge) Pa
n/a n/a
n/a n/a
55 31
n/a n/a
23 n/a
Bulk Density g/mL 1.183 ± 0.082 1.331 ± 0.092 1.506 ± 0.104 n/a 1.402 ± 0.010 vol% Settled Solids % 55.3% ± 5.5% 76.9% ± 7.6% 96.2% ± 9.5% n/a 88.9% ± 0.0% Density of Centrifuged Solids g/mL 1.370 ± 0.171 1.625 ± 0.202 1.676 ± 0.209 n/a 1.577 ± 0.017 vol% Centrifuged Solids % 32.5% ± 2.3% 46.0% ± 3.2% 70.5% ± 5.0% n/a 58.1% ± 0.7% wt% Centrifuged Solids % 37.6% ± 3.2% 56.2% ± 4.8% 78.4% ± 6.7% n/a 65.3% ± 1.0% Supernatant Density g/mL 1.063 ± 0.003 1.110 ± 0.003 1.177 ± 0.004 n/a 1.087 ± 0.014 Density of Settled Solids g/mL 1.28 ± 0.09 1.39 ± 0.10 1.50 ± 0.11 n/a 1.42 ± 0.03 wt% Settled Supernatant % 62.4% ± 16.3% 43.9% ± 11.5% 21.9% ± 5.7% n/a 29.7% ± 9.0% wt% dissolved solids in supernatant % 8.0% ± 0.2% 10.3% ± 0.3% 10.3% ± 0.3% n/a 10.5% ± 0.9% wt% total solids in Centrifuged Sludge % 48.0% ± 2.5% 51.1% ± 2.7% 53.5% ± 2.8% n/a 55.7% ± 0.3% wt% Total Solids % 23.3% ± 1.1% 33.6% ± 1.6% 44.5% ± 2.1% n/a 42.1% ± 3.0% wt% Undissolved Solids % 16.4% ± 1.5% 25.6% ± 2.4% 37.8% ± 3.5% n/a 33.0% ± 0.6% (a) UDS refers only to wt% waste solids in the actual waste slurry component of feed; (b) not measured; (c) pretreated sludge at 22-wt% UDS; (d) melter-feed settled solids.
3.6
3.3 Waste, Melter Feeds, and Purely Physical Simulants
This section presents most of the pertinent recent references covering the types and applications of HLW pretreated slurry and melter feed simulants. The data obtained using the chemically similar simulants (as opposed to strictly physical simulants, i.e., PJM simulants) are also included in Appendix A and provide a basis of comparison between the actual wastes and melter feeds and their simulants. The PJM physical simulants are important in that they are environmentally benign in contrast to the “chemically correct” simulants given in Appendix A and can provide important rheological information. Also, a significant amount of older waste treatment studies data have not been included here that originated from the DWPF, HWVP, and West Valley Projects and some even older data originating from simulant work performed at PNWD for the purposes of waste treatment and melter design. Some of these data sources were not completely investigated for this report because of programmatic limitations.
SRNL and VSL have performed extensive studies on simulated wastes and melter feeds modeled after actual wastes. These results are also included in the Appendix A database along with the results for actual pretreated HLW and HLW melter feed. Note also that Appendices B (Physical Property Correlations) and C (Expected HLW Behavior During Pretreatment) are omnibus data comparisons. These appendices each have a reference section that includes references pertaining just to the subject matter of that appendix.
SRNL has focused on developing chemically accurate waste simulants based on measured waste
compositions and knowledge of the waste components plus carbon steel passivating agents that were placed in the tanks at Hanford. Reports by Eibling and Nash (2001), Eibling et al. (2003), Hansen and Eibling (2001), and Zamecnik et al. (2004) relate to the fabrication and the rheological and physical properties of chemically accurate waste simulants. Reports by Hansen et al. (2001), Hansen and Schumacher (2003), Hansen and Crawford (2005), Hansen and Williams (2005), Rosencrance et al. (2000), Stone et al. (2003), and Crowder et al. (2004)(a) deal with simulant physical characterization issues with and without glass formers. Duignan et al. (2005)(b) cover the Semi-Integrated Pilot Plant (SIPP) work at SRNL and provide physical property and rheological property data on the simulants used.
VSL has focused on compositionally accurate simulants and melter feeds for supporting various
melter tests. Kot et al. (2000) is a good source for the physical and rheological properties of these simulants. Reports by Kot and Pegg (2001) and Kot et al. (2003) provide additional physical and rheological property information. Reports by Matlack et al. (2000a,b,c; 2002a,b; 2003a,b,c,d,e; 2004a,b; 2005)(c) characterize melter feeds used for melter tests.
(a) ML Crowder, EK Hansen, CL Crawford, WE Daniel, Jr., RF Schumacher, PR Burket, and JL Siler. 2004.
Evaporation, Rheology, and Vitrification of a Radioactive Hanford Tank AN-104 Sample Mixed with Recycle. WSRC-TR-2004-00232, Draft A, SRNL-RPP-2004-00044, Draft A. Westinghouse Savannah River Company, Aiken, SC.
(b) MR Duignan, DJ Adamson, TB Calloway, MD Fowley, ZH Qureshi, JL Steimke, MR Williams, and JR Zamecnik, SRNL. 2005. Final Report: RPP-WTP Semi-Integrated Pilot Plant. WSRC-TR-2005-00105, DRAFT B. Westinghouse Savannah River Company, Aiken, SC.
(c) KS Matlack, W Gong, and IL Pegg. 2005. DuraMelter 100 HLW Simulation Validation Tests with C-106/AY-102 Feeds. VSL-05R5710-1, Rev. A, Vitreous State Laboratory, The Catholic University of America, Washington, DC.
3.7
Additional physical simulant data were generated for the PJM Project sponsored by Bechtel National,
Inc. (BNI) and performed by PNWD. For this work, Laponite (a weak silica gel) and a Kaolin-Bentonite clay mixture (80% Kaolin and 20% Bentonite slurry with water) were the principal physical simulants used. These physical simulants were well characterized rheologically over a range of concentrations. Reports giving potentially useful information on these physical waste simulants include Bamberger et al. (2005), Bontha et al. (2000), Enderlin et al. (2003), Poloski et al. (2004, 2005), and Russell et al. (2005).
3.4 Database Summary
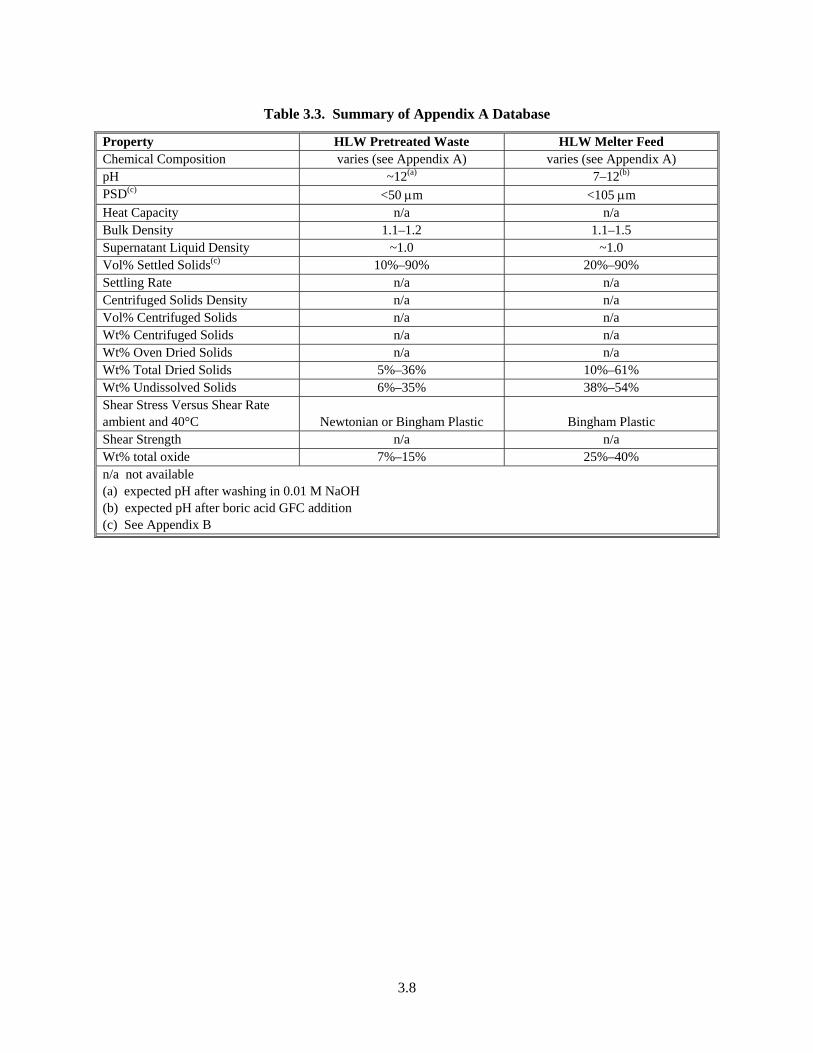
Limited data have been acquired on actual wastes, both because of the limited number of tanks sampled and limited quantities of sample available for physical-property characterization. Thus far, only small quantities of three pretreated actual tank wastes have been prepared as melter feeds (AZ-101, AZ-102, and C-104). Data from the reports shown in Table 3.1 have been compiled into a database. This database was designed to present the data in a form compliant with the guideline reporting formation developed by Smith and Prindiville (2002). This database can be found in Appendix A. Additional information from these reports can be found in Appendix B. A high-level summary of the data compiled in Appendices A and B is shown in Tables 3.2 and 3.3.
3.8
Table 3.3. Summary of Appendix A Database
Property HLW Pretreated Waste HLW Melter Feed Chemical Composition varies (see Appendix A) varies (see Appendix A) pH ~12(a) 7–12(b) PSD(c) <50 μm <105 μm Heat Capacity n/a n/a Bulk Density 1.1–1.2 1.1–1.5 Supernatant Liquid Density ~1.0 ~1.0 Vol% Settled Solids(c) 10%–90% 20%–90% Settling Rate n/a n/a Centrifuged Solids Density n/a n/a Vol% Centrifuged Solids n/a n/a Wt% Centrifuged Solids n/a n/a Wt% Oven Dried Solids n/a n/a Wt% Total Dried Solids 5%–36% 10%–61% Wt% Undissolved Solids 6%–35% 38%–54% Shear Stress Versus Shear Rate ambient and 40°C Newtonian or Bingham Plastic Bingham Plastic Shear Strength n/a n/a Wt% total oxide 7%–15% 25%–40% n/a not available (a) expected pH after washing in 0.01 M NaOH (b) expected pH after boric acid GFC addition (c) See Appendix B
4.1
4.0 Discussion
The purpose of this section is to establish bounding conditions for the data discussed in the previous section and compiled in the database shown as Appendix A. Individual unit operations are examined in an effort to identify parameters significant to plant performance. Bounds are established on these parameters in an effort to verify successful processing of the simulant material during pilot testing. Actual waste data are used to tailor the bounding ranges such that the proposed bounding conditions span the existing actual waste materials at concentrations proposed for use in the WTP. In this regard, the proposed bounding conditions are based upon a general engineering evaluation of process equipment and measured values from actual waste material. When needed, equipment design specifications from the HWVP and DWPF are used. These bounding conditions are evaluated against the data presented in Appendix A. Conclusions and recommendations based on this critical review are documented.
4.1 Development of Bounding Conditions
The strategy employed to establish bounding conditions is to identify correlations between dimensionless groups for specific unit operations performed in the WTP flowsheet. As the WTP will be using standard chemical processing equipment in a lot of their various unit operations, e.g. piping, pumps, and mechanical agitators, correlations for similar equipment that have been developed for standard chemical processing applications are used in this document to help develop correlations relevant to the WTP. Sources for these correlations include Perry’s Chemical Engineers Handbook (Perry and Green 1984), various engineering textbooks, and peer-reviewed journal articles. In addition, equipment data and calculations for previous vitrification-plant designs may be used when available. These previous designs include the HWVP and the DWPF. The use of these data and correlations assumes that the equipment selected for use in the WTP will possess similar performance properties to equipment generally used in the chemical processing industry, HWVP, and DWPF. Typically, based on these correlations, engineering judgment determines the overarching percentage variation that can be allowed in a given dimensionless group, e.g., drag coefficient, based on its effect on the unit-operation performance. NOTE: A concise rheology tutorial can be found in Appendix D
4.1.1 Mechanical Mixing (Low-Shear-Rate Viscosity)
Based on the HWVP and DWPF designs, mixing operations considered in this section consist of mechanical agitators in mixing vessels. The WTP design employs mechanical agitators in the MFPV and MFV that will initially contain HLW pretreated sludge (MFPV) and then melter feed (MFPV and MFV). The WTP design employs pulsed jet mixers (PJM) and spargers in the HLW Lag Storage (HLP-VSL-00027A/B), and HLW Blend (HLP-VSL-00028) vessels, which are designed to mix and transfer HLW pretreated sludge. However, as no PJM-specific correlations were initially available for mixing of non-Newtonian slurries, WTP used the set of bounding physical and rheological properties for waste materials presented in the original interim version of this report (Poloski et al. 2003b)a as the starting point to
(a) Poloski A, O Bredt, B Calloway, G Smith, and H Smith. 2003b. Interim Report - Technical Basis for HLW Vitrification Stream Physical and Rheological Property Bounding Conditions. WTP-RPT-100 Rev. 0, Battelle—Pacific Northwest Division, Richland, WA. (WTP Project Document No. 24590-101-TSA-W000-0004-99-09, Rev. 00D)
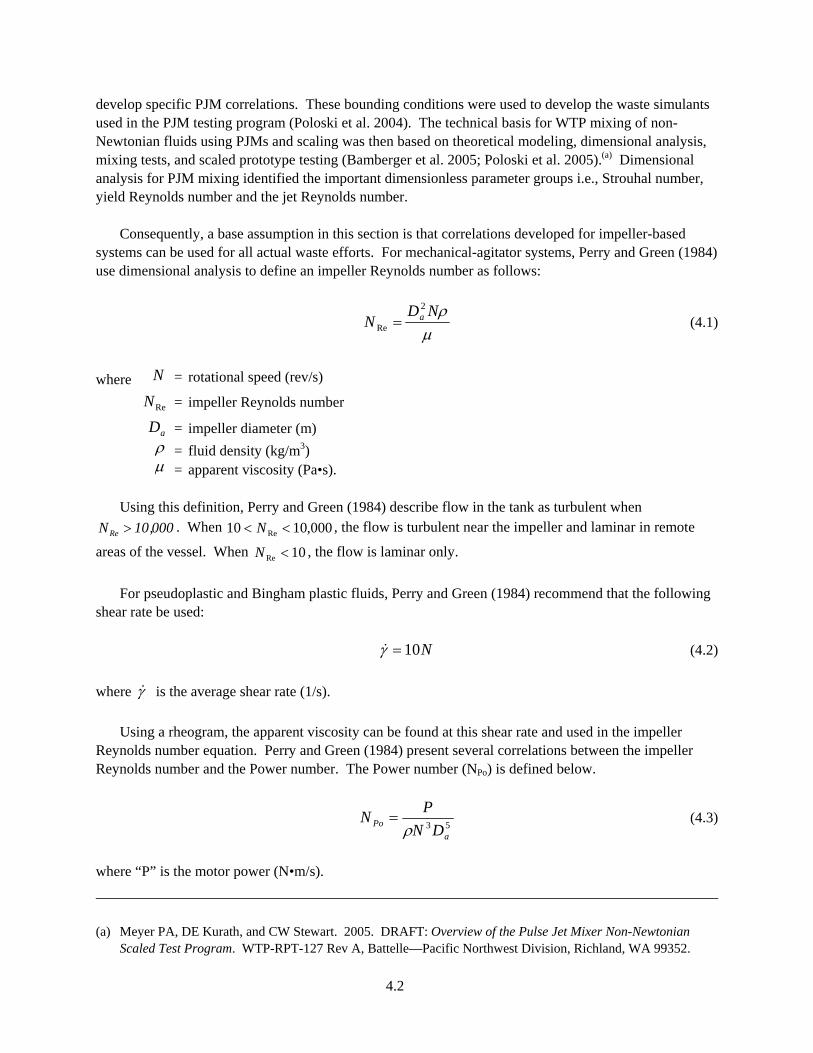
4.2
develop specific PJM correlations. These bounding conditions were used to develop the waste simulants used in the PJM testing program (Poloski et al. 2004). The technical basis for WTP mixing of non-Newtonian fluids using PJMs and scaling was then based on theoretical modeling, dimensional analysis, mixing tests, and scaled prototype testing (Bamberger et al. 2005; Poloski et al. 2005).(a) Dimensional analysis for PJM mixing identified the important dimensionless parameter groups i.e., Strouhal number, yield Reynolds number and the jet Reynolds number.
Consequently, a base assumption in this section is that correlations developed for impeller-based systems can be used for all actual waste efforts. For mechanical-agitator systems, Perry and Green (1984) use dimensional analysis to define an impeller Reynolds number as follows:
μρND
N a2
Re = (4.1)
where N = rotational speed (rev/s)
ReN = impeller Reynolds number
aD = impeller diameter (m) ρ = fluid density (kg/m3) μ = apparent viscosity (Pa•s).
Using this definition, Perry and Green (1984) describe flow in the tank as turbulent when
000,10NRe > . When 000,1010 Re << N , the flow is turbulent near the impeller and laminar in remote
areas of the vessel. When 10Re <N , the flow is laminar only.
For pseudoplastic and Bingham plastic fluids, Perry and Green (1984) recommend that the following shear rate be used:
N10=γ& (4.2)
where γ& is the average shear rate (1/s).
Using a rheogram, the apparent viscosity can be found at this shear rate and used in the impeller Reynolds number equation. Perry and Green (1984) present several correlations between the impeller Reynolds number and the Power number. The Power number (NPo) is defined below.
53a
Po DNPN
ρ= (4.3)
where “P” is the motor power (N•m/s).
(a) Meyer PA, DE Kurath, and CW Stewart. 2005. DRAFT: Overview of the Pulse Jet Mixer Non-Newtonian
Scaled Test Program. WTP-RPT-127 Rev A, Battelle—Pacific Northwest Division, Richland, WA 99352.
4.3
Perry and Green (1984) present correlations for several tank geometries. To achieve a homogeneously suspended tank, a turbulent flow regime must be established. As described above, this can occur when
000,10Re ≥N . As the power number increases, the power requirement for the mixing motor also increases. Therefore, the correlation that results in efficient mixing was used as a basis for this calculation. At 000,10Re =N , a conservative correlation with a given impeller-to-tank diameter ratio,
impeller pitch, and number of tank baffles produces 3.0=PoN .(a) According to DWPF design specifications (Jones and Peterson 1996), a 100-hp motor with an impeller diameter of 36 in. would be used for homogenization purposes. A value for the bulk density of the fluid is also assumed to be at 1.2 g/mL. Using these parameters, the calculation presented in Figure 4.1 can be performed.
(a) See Perry and Green (1984), Curve 5, Figure 19-13, pg 19-10.
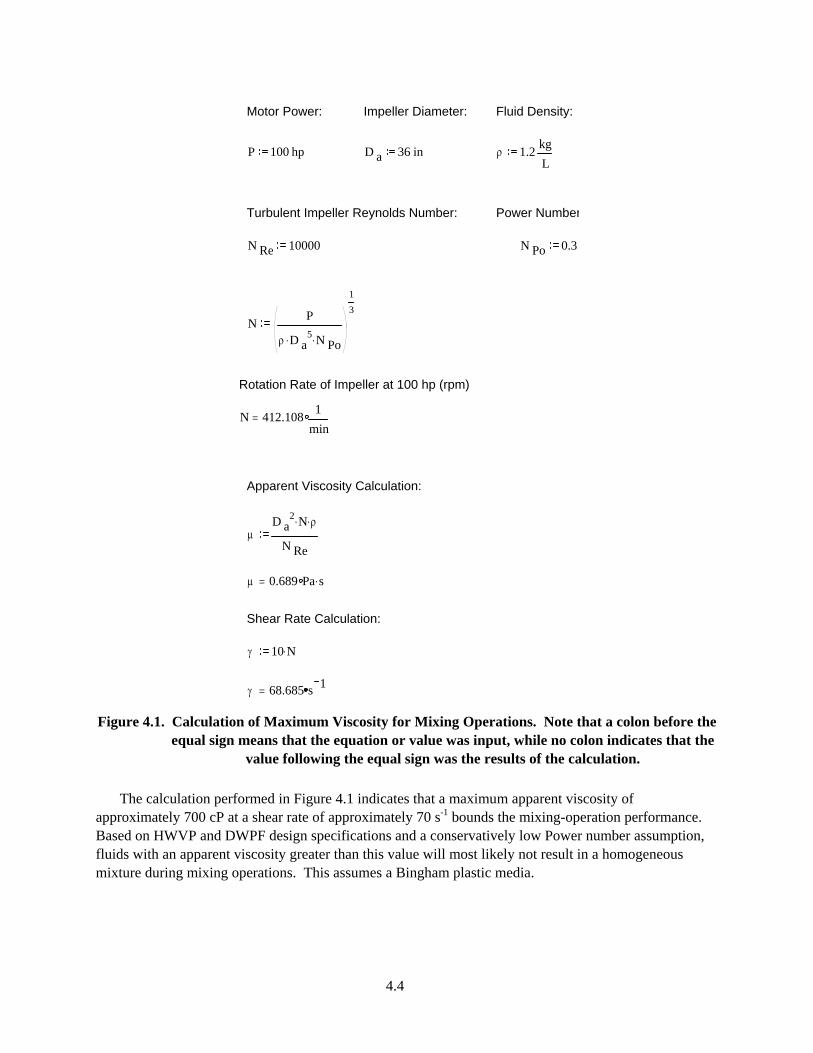
4.4
Motor Power: Impeller Diameter: Fluid Density:
P 100 hp D a 36 in ρ 1.2 kgL
Turbulent Impeller Reynolds Number: Power Number
N Re 10000 N Po 0.3
N P
ρ D a5. N Po.
13
Rotation Rate of Impeller at 100 hp (rpm)
N 412.108 1min
=
Apparent Viscosity Calculation:
μD a
2 N. ρ.
N Re
μ 0.689 Pa s.=
Shear Rate Calculation:
γ 10 N.
γ 68.685 s 1= Figure 4.1. Calculation of Maximum Viscosity for Mixing Operations. Note that a colon before the
equal sign means that the equation or value was input, while no colon indicates that the value following the equal sign was the results of the calculation.
The calculation performed in Figure 4.1 indicates that a maximum apparent viscosity of
approximately 700 cP at a shear rate of approximately 70 s-1 bounds the mixing-operation performance. Based on HWVP and DWPF design specifications and a conservatively low Power number assumption, fluids with an apparent viscosity greater than this value will most likely not result in a homogeneous mixture during mixing operations. This assumes a Bingham plastic media.
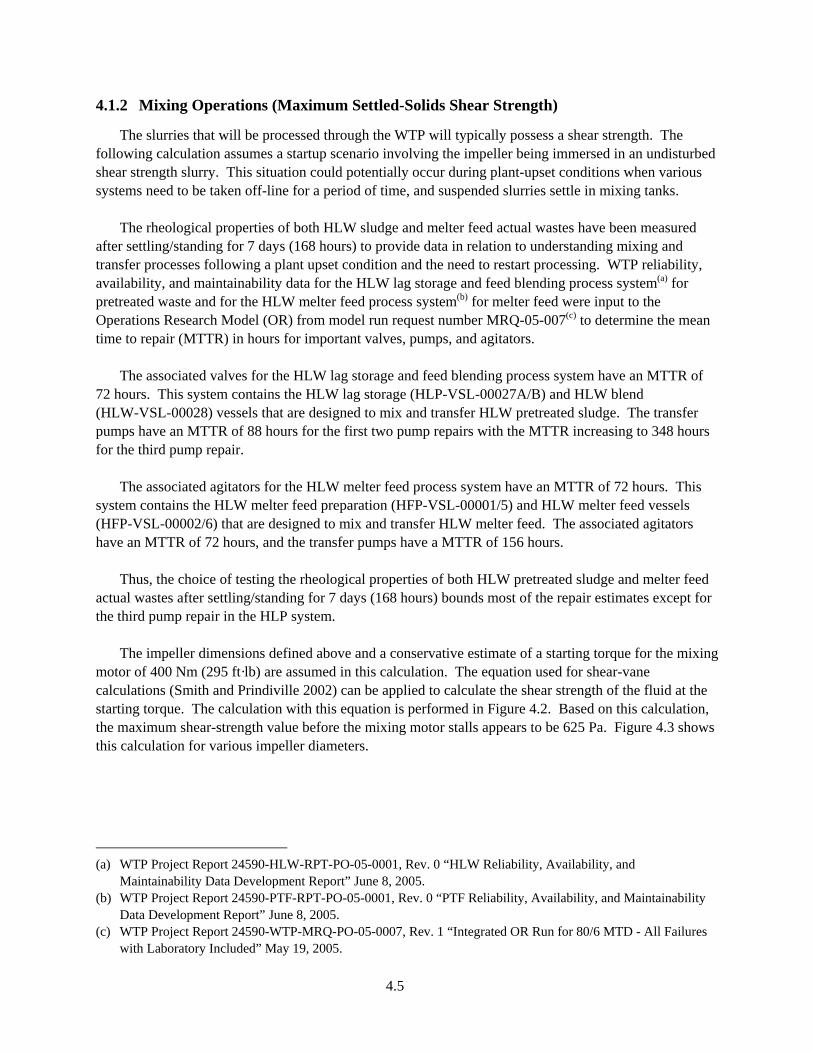
4.5
4.1.2 Mixing Operations (Maximum Settled-Solids Shear Strength)
The slurries that will be processed through the WTP will typically possess a shear strength. The following calculation assumes a startup scenario involving the impeller being immersed in an undisturbed shear strength slurry. This situation could potentially occur during plant-upset conditions when various systems need to be taken off-line for a period of time, and suspended slurries settle in mixing tanks.
The rheological properties of both HLW sludge and melter feed actual wastes have been measured
after settling/standing for 7 days (168 hours) to provide data in relation to understanding mixing and transfer processes following a plant upset condition and the need to restart processing. WTP reliability, availability, and maintainability data for the HLW lag storage and feed blending process system(a) for pretreated waste and for the HLW melter feed process system(b) for melter feed were input to the Operations Research Model (OR) from model run request number MRQ-05-007(c) to determine the mean time to repair (MTTR) in hours for important valves, pumps, and agitators.
The associated valves for the HLW lag storage and feed blending process system have an MTTR of 72 hours. This system contains the HLW lag storage (HLP-VSL-00027A/B) and HLW blend (HLW-VSL-00028) vessels that are designed to mix and transfer HLW pretreated sludge. The transfer pumps have an MTTR of 88 hours for the first two pump repairs with the MTTR increasing to 348 hours for the third pump repair.
The associated agitators for the HLW melter feed process system have an MTTR of 72 hours. This system contains the HLW melter feed preparation (HFP-VSL-00001/5) and HLW melter feed vessels (HFP-VSL-00002/6) that are designed to mix and transfer HLW melter feed. The associated agitators have an MTTR of 72 hours, and the transfer pumps have a MTTR of 156 hours.
Thus, the choice of testing the rheological properties of both HLW pretreated sludge and melter feed actual wastes after settling/standing for 7 days (168 hours) bounds most of the repair estimates except for the third pump repair in the HLP system.
The impeller dimensions defined above and a conservative estimate of a starting torque for the mixing
motor of 400 Nm (295 ft·lb) are assumed in this calculation. The equation used for shear-vane calculations (Smith and Prindiville 2002) can be applied to calculate the shear strength of the fluid at the starting torque. The calculation with this equation is performed in Figure 4.2. Based on this calculation, the maximum shear-strength value before the mixing motor stalls appears to be 625 Pa. Figure 4.3 shows this calculation for various impeller diameters.
(a) WTP Project Report 24590-HLW-RPT-PO-05-0001, Rev. 0 “HLW Reliability, Availability, and
Maintainability Data Development Report” June 8, 2005. (b) WTP Project Report 24590-PTF-RPT-PO-05-0001, Rev. 0 “PTF Reliability, Availability, and Maintainability
Data Development Report” June 8, 2005. (c) WTP Project Report 24590-WTP-MRQ-PO-05-0007, Rev. 1 “Integrated OR Run for 80/6 MTD - All Failures
with Laboratory Included” May 19, 2005.
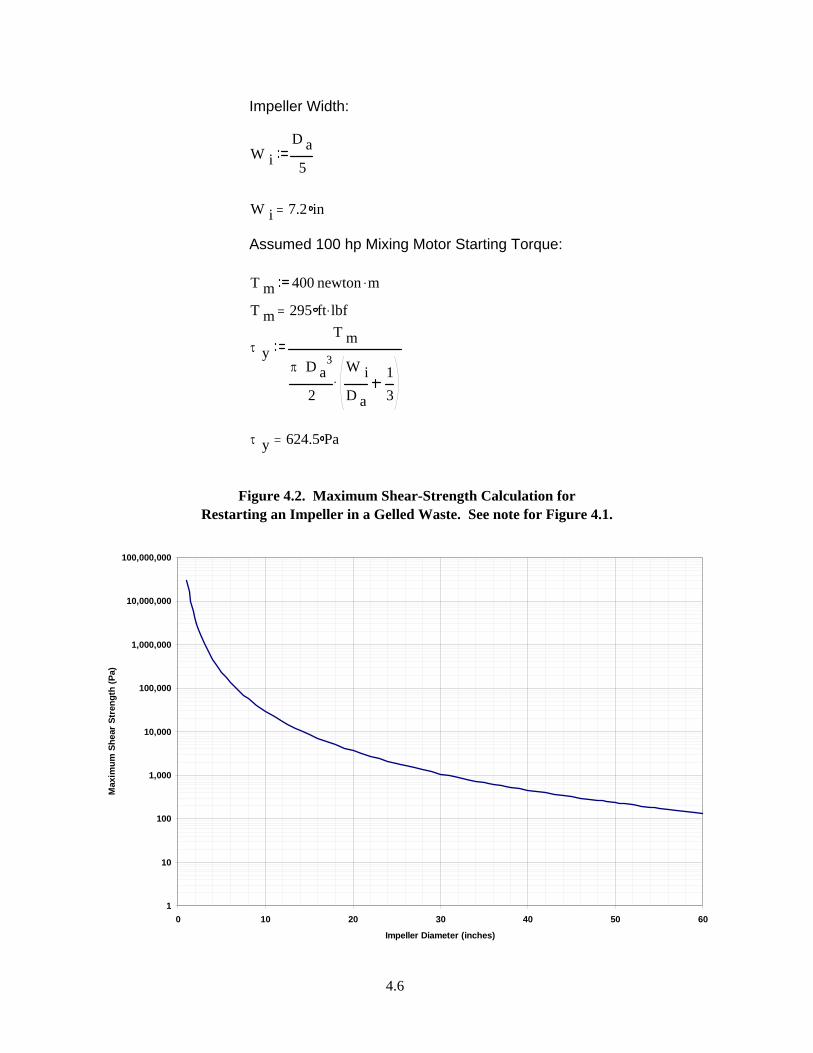
4.6
Impeller Width:
W iD a5
W i 7.2 in=
Assumed 100 hp Mixing Motor Starting Torque:
T m 400 newton m.
T m 295 ft lbf.=
τ yT m
π D a3
2
W iD a
13
.
τ y 624.5 Pa=
Figure 4.2. Maximum Shear-Strength Calculation for Restarting an Impeller in a Gelled Waste. See note for Figure 4.1.
1
10
100
1,000
10,000
100,000
1,000,000
10,000,000
100,000,000
0 10 20 30 40 50 60
Impeller Diameter (inches)
Max
imum
She
ar S
tren
gth
(Pa)
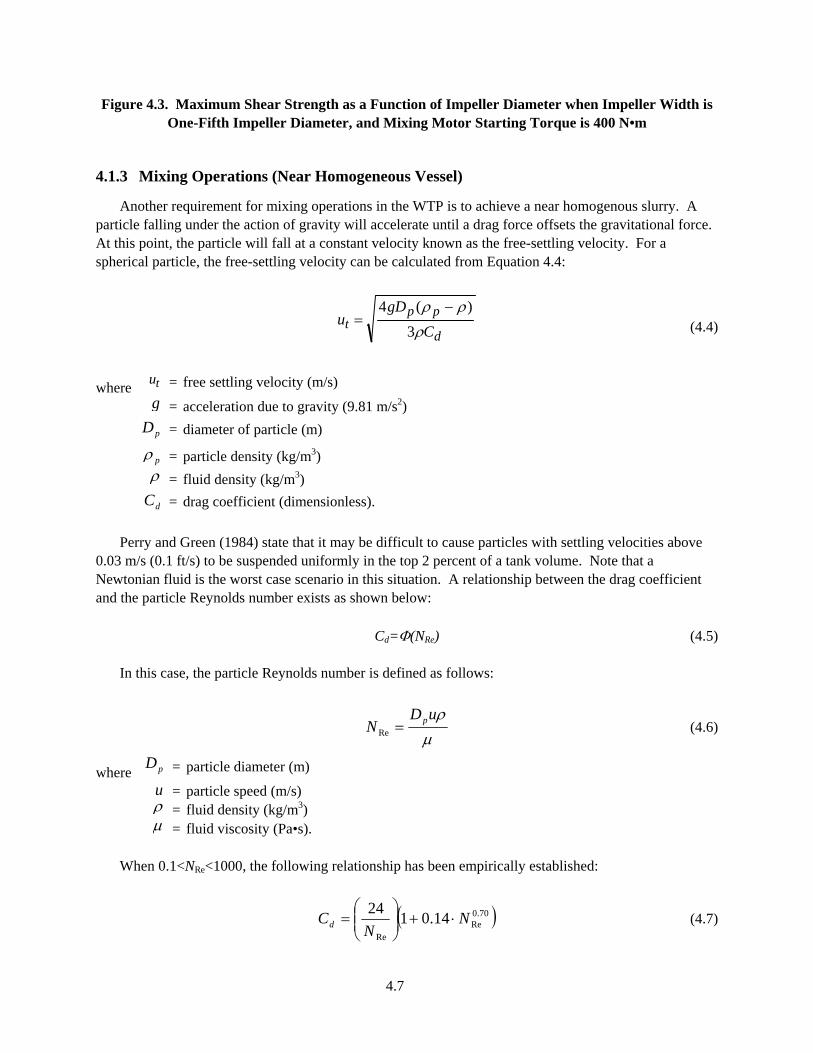
4.7
Figure 4.3. Maximum Shear Strength as a Function of Impeller Diameter when Impeller Width is One-Fifth Impeller Diameter, and Mixing Motor Starting Torque is 400 N•m
4.1.3 Mixing Operations (Near Homogeneous Vessel)
Another requirement for mixing operations in the WTP is to achieve a near homogenous slurry. A particle falling under the action of gravity will accelerate until a drag force offsets the gravitational force. At this point, the particle will fall at a constant velocity known as the free-settling velocity. For a spherical particle, the free-settling velocity can be calculated from Equation 4.4:
d
ppt C
gDu
ρ
ρρ
3)(4 −
= (4.4)
where tu = free settling velocity (m/s) g = acceleration due to gravity (9.81 m/s2)
pD = diameter of particle (m)
pρ = particle density (kg/m3) ρ = fluid density (kg/m3)
dC = drag coefficient (dimensionless).
Perry and Green (1984) state that it may be difficult to cause particles with settling velocities above 0.03 m/s (0.1 ft/s) to be suspended uniformly in the top 2 percent of a tank volume. Note that a Newtonian fluid is the worst case scenario in this situation. A relationship between the drag coefficient and the particle Reynolds number exists as shown below:
Cd=Φ(NRe) (4.5)
In this case, the particle Reynolds number is defined as follows:
μρuD
N p=Re (4.6)
where pD = particle diameter (m) u = particle speed (m/s) ρ = fluid density (kg/m3) μ = fluid viscosity (Pa•s).
When 0.1<NRe<1000, the following relationship has been empirically established:
( )70.0Re
Re
14.0124 NN
Cd ⋅+⎟⎟⎠
⎞⎜⎜⎝
⎛= (4.7)
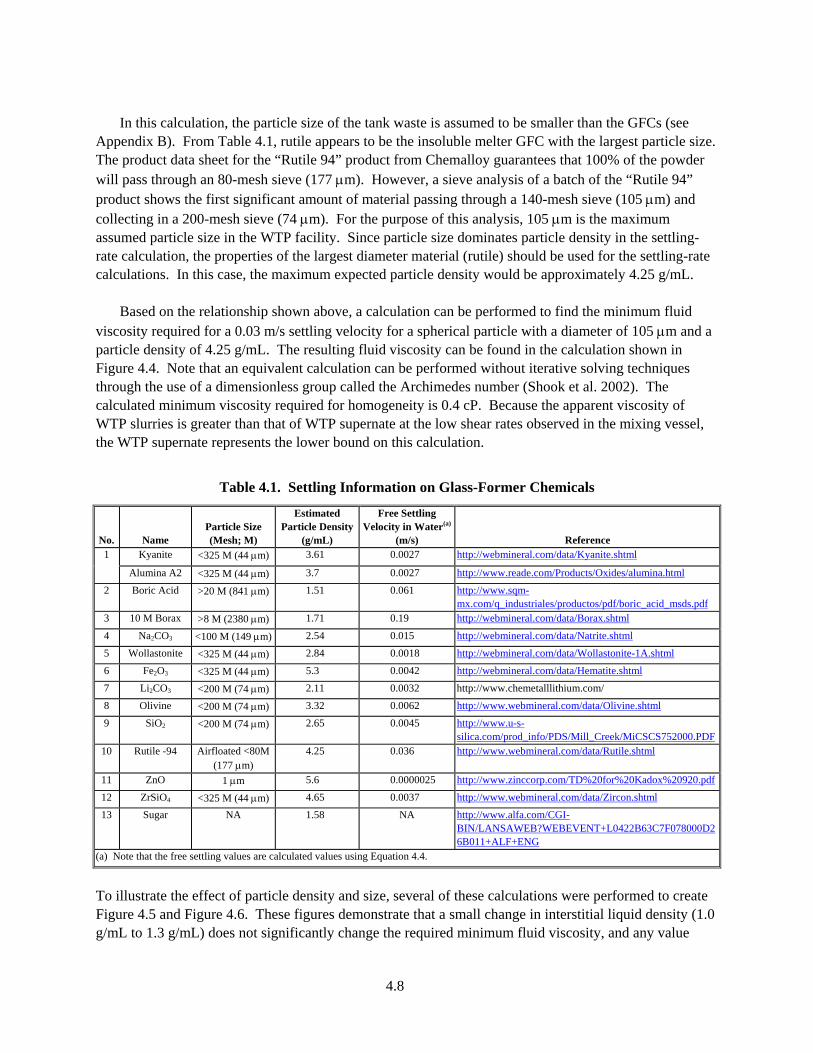
4.8
In this calculation, the particle size of the tank waste is assumed to be smaller than the GFCs (see
Appendix B). From Table 4.1, rutile appears to be the insoluble melter GFC with the largest particle size. The product data sheet for the “Rutile 94” product from Chemalloy guarantees that 100% of the powder will pass through an 80-mesh sieve (177 μm). However, a sieve analysis of a batch of the “Rutile 94” product shows the first significant amount of material passing through a 140-mesh sieve (105 μm) and collecting in a 200-mesh sieve (74 μm). For the purpose of this analysis, 105 μm is the maximum assumed particle size in the WTP facility. Since particle size dominates particle density in the settling-rate calculation, the properties of the largest diameter material (rutile) should be used for the settling-rate calculations. In this case, the maximum expected particle density would be approximately 4.25 g/mL.
Based on the relationship shown above, a calculation can be performed to find the minimum fluid viscosity required for a 0.03 m/s settling velocity for a spherical particle with a diameter of 105 μm and a particle density of 4.25 g/mL. The resulting fluid viscosity can be found in the calculation shown in Figure 4.4. Note that an equivalent calculation can be performed without iterative solving techniques through the use of a dimensionless group called the Archimedes number (Shook et al. 2002). The calculated minimum viscosity required for homogeneity is 0.4 cP. Because the apparent viscosity of WTP slurries is greater than that of WTP supernate at the low shear rates observed in the mixing vessel, the WTP supernate represents the lower bound on this calculation.
Table 4.1. Settling Information on Glass-Former Chemicals
No. Name Particle Size (Mesh; M)
Estimated Particle Density
(g/mL)
Free Settling Velocity in Water(a)
(m/s) Reference 1 Kyanite <325 M (44 μm) 3.61 0.0027 http://webmineral.com/data/Kyanite.shtml
Alumina A2 <325 M (44 μm) 3.7 0.0027 http://www.reade.com/Products/Oxides/alumina.html
2 Boric Acid >20 M (841 μm) 1.51 0.061 http://www.sqm-mx.com/q_industriales/productos/pdf/boric_acid_msds.pdf
3 10 M Borax >8 M (2380 μm) 1.71 0.19 http://webmineral.com/data/Borax.shtml
4 Na2CO3 <100 M (149 μm) 2.54 0.015 http://webmineral.com/data/Natrite.shtml
5 Wollastonite <325 M (44 μm) 2.84 0.0018 http://webmineral.com/data/Wollastonite-1A.shtml
6 Fe2O3 <325 M (44 μm) 5.3 0.0042 http://webmineral.com/data/Hematite.shtml
7 Li2CO3 <200 M (74 μm) 2.11 0.0032 http://www.chemetalllithium.com/
8 Olivine <200 M (74 μm) 3.32 0.0062 http://www.webmineral.com/data/Olivine.shtml
9 SiO2 <200 M (74 μm) 2.65 0.0045 http://www.u-s-silica.com/prod_info/PDS/Mill_Creek/MiCSCS752000.PDF
10 Rutile -94 Airfloated <80M (177 μm)
4.25 0.036 http://www.webmineral.com/data/Rutile.shtml
11 ZnO 1 μm 5.6 0.0000025 http://www.zinccorp.com/TD%20for%20Kadox%20920.pdf
12 ZrSiO4 <325 M (44 μm) 4.65 0.0037 http://www.webmineral.com/data/Zircon.shtml
13 Sugar NA 1.58 NA http://www.alfa.com/CGI-BIN/LANSAWEB?WEBEVENT+L0422B63C7F078000D26B011+ALF+ENG
(a) Note that the free settling values are calculated values using Equation 4.4.
To illustrate the effect of particle density and size, several of these calculations were performed to create Figure 4.5 and Figure 4.6. These figures demonstrate that a small change in interstitial liquid density (1.0 g/mL to 1.3 g/mL) does not significantly change the required minimum fluid viscosity, and any value
4.9
over 1.0 g/mL is satisfactory. Based on a calculation to homogenize 105-μm particles with a particle density of 4.25 g/mL in an agitated vessel, the minimum viscosity of interstitial liquid in the WTP slurries should be considered 0.4 cP. For reference, water at 70°C possesses a viscosity of 0.4 cP. At 40°C, water has a viscosity of 0.7 cP.
4.1.4 Material Transfer Operations (Pipeline Flow)
Jones and Peterson (1996) state that solids settling in process lines does not usually occur if the slurry flow is turbulent. Turbulent flow generally exists at high line velocities above 3 to 5 ft/s in 2-in. piping. However, high fluid velocities will cause excessive erosion, and a maximum line velocity of 10 ft/s has been specified for the DWPF (Jones and Peterson 1996). Therefore, the purpose of this section is to find the set of rheological parameters that will create turbulent flow conditions with a maximum superficial velocity of 10 ft/s.
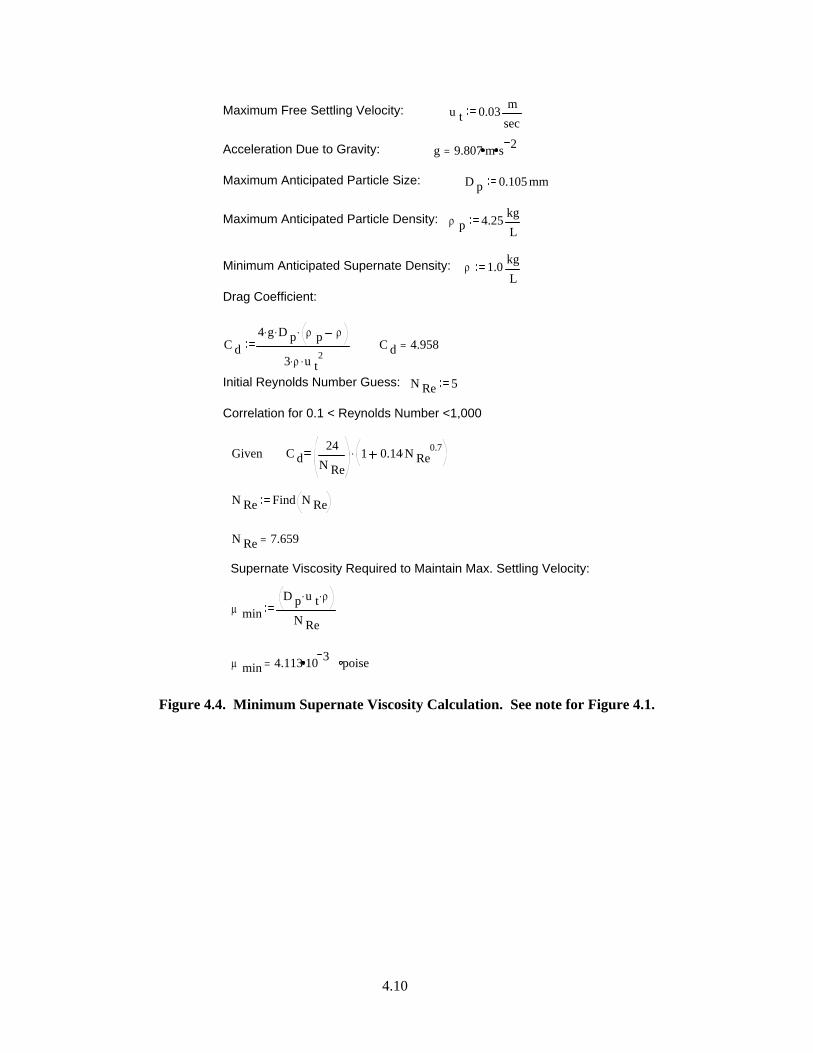
4.10
Maximum Free Settling Velocity: u t 0.03 msec
Acceleration Due to Gravity: g 9.807 m s 2=
Maximum Anticipated Particle Size: D p 0.105 mm
Maximum Anticipated Particle Density: ρ p 4.25 kgL
Minimum Anticipated Supernate Density: ρ 1.0 kgL
Drag Coefficient:
C d4 g. D p. ρ p ρ.
3 ρ. u t2.
C d 4.958=
Initial Reynolds Number Guess: N Re 5
Correlation for 0.1 < Reynolds Number <1,000
Given C d24
N Re1 0.14 N Re
0.7..
N Re Find N Re
N Re 7.659=
Supernate Viscosity Required to Maintain Max. Settling Velocity:
μ minD p u t. ρ.
N Re
μ min 4.113 10 3 poise=
Figure 4.4. Minimum Supernate Viscosity Calculation. See note for Figure 4.1.
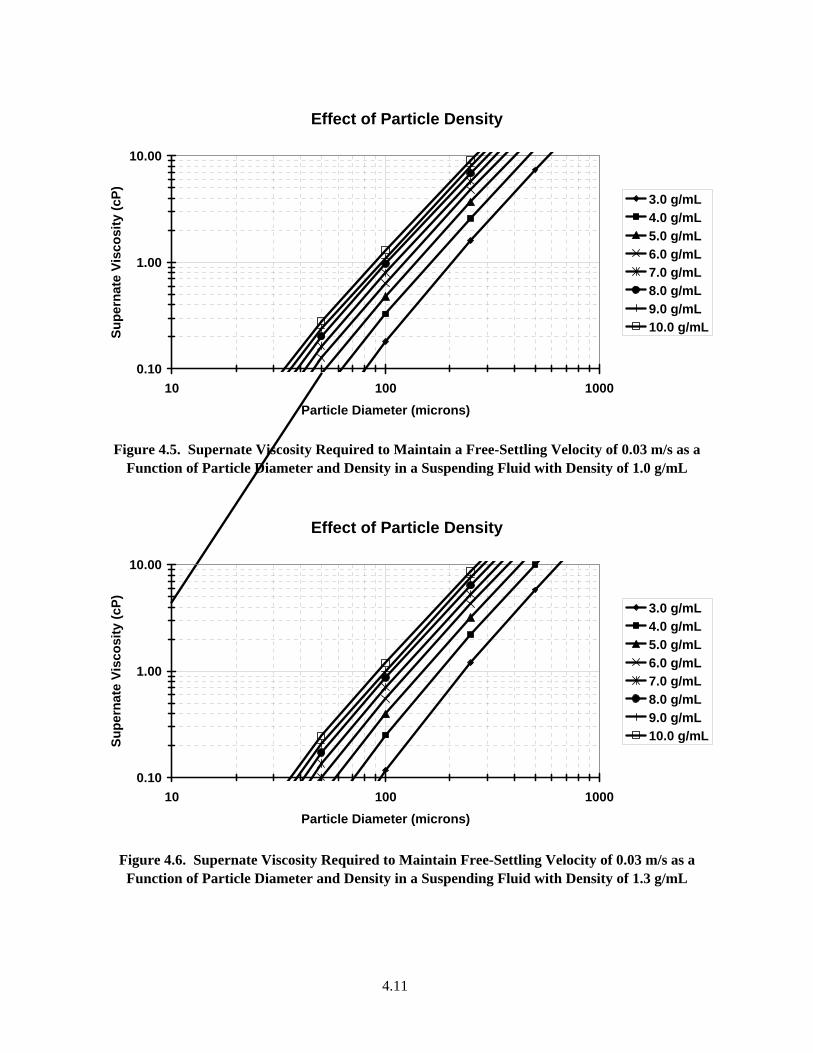
4.11
Effect of Particle Density
0.10
1.00
10.00
10 100 1000Particle Diameter (microns)
Supe
rnat
e Vi
scos
ity (c
P) 3.0 g/mL4.0 g/mL5.0 g/mL6.0 g/mL7.0 g/mL8.0 g/mL9.0 g/mL10.0 g/mL
Figure 4.5. Supernate Viscosity Required to Maintain a Free-Settling Velocity of 0.03 m/s as a
Function of Particle Diameter and Density in a Suspending Fluid with Density of 1.0 g/mL
Effect of Particle Density
0.10
1.00
10.00
10 100 1000Particle Diameter (microns)
Supe
rnat
e Vi
scos
ity (c
P) 3.0 g/mL4.0 g/mL5.0 g/mL6.0 g/mL7.0 g/mL8.0 g/mL9.0 g/mL10.0 g/mL
Figure 4.6. Supernate Viscosity Required to Maintain Free-Settling Velocity of 0.03 m/s as a Function of Particle Diameter and Density in a Suspending Fluid with Density of 1.3 g/mL
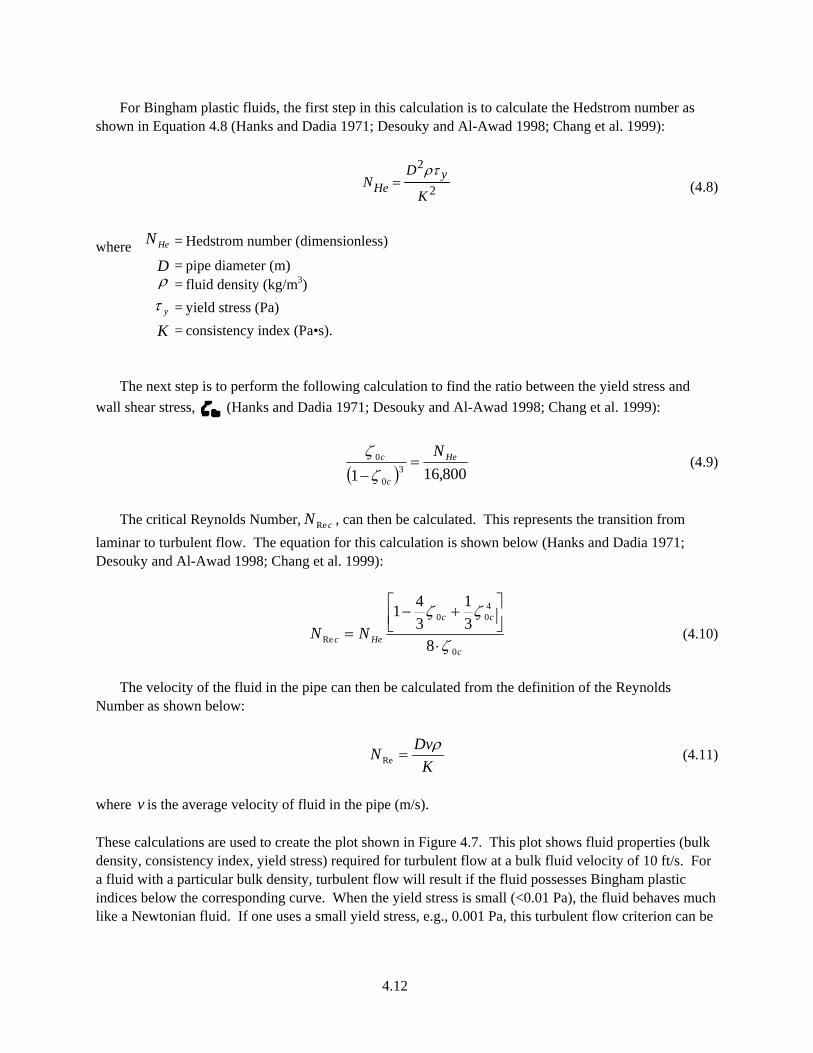
4.12
For Bingham plastic fluids, the first step in this calculation is to calculate the Hedstrom number as shown in Equation 4.8 (Hanks and Dadia 1971; Desouky and Al-Awad 1998; Chang et al. 1999):
2
2
K
DN y
Heρτ
= (4.8)
where HeN = Hedstrom number (dimensionless)
D = pipe diameter (m) ρ = fluid density (kg/m3)
yτ = yield stress (Pa) K = consistency index (Pa•s).
The next step is to perform the following calculation to find the ratio between the yield stress and
wall shear stress, (Hanks and Dadia 1971; Desouky and Al-Awad 1998; Chang et al. 1999):
( ) 800,161 3
0
0 He
c
c N=
−ζζ
(4.9)
The critical Reynolds Number, cNRe , can then be calculated. This represents the transition from
laminar to turbulent flow. The equation for this calculation is shown below (Hanks and Dadia 1971; Desouky and Al-Awad 1998; Chang et al. 1999):
c
cc
Hec NN0
400
Re 831
341
ζ
ζζ
⋅
⎥⎦⎤
⎢⎣⎡ +−
= (4.10)
The velocity of the fluid in the pipe can then be calculated from the definition of the Reynolds
Number as shown below:
K
DvN ρ=Re (4.11)
where v is the average velocity of fluid in the pipe (m/s). These calculations are used to create the plot shown in Figure 4.7. This plot shows fluid properties (bulk density, consistency index, yield stress) required for turbulent flow at a bulk fluid velocity of 10 ft/s. For a fluid with a particular bulk density, turbulent flow will result if the fluid possesses Bingham plastic indices below the corresponding curve. When the yield stress is small (<0.01 Pa), the fluid behaves much like a Newtonian fluid. If one uses a small yield stress, e.g., 0.001 Pa, this turbulent flow criterion can be
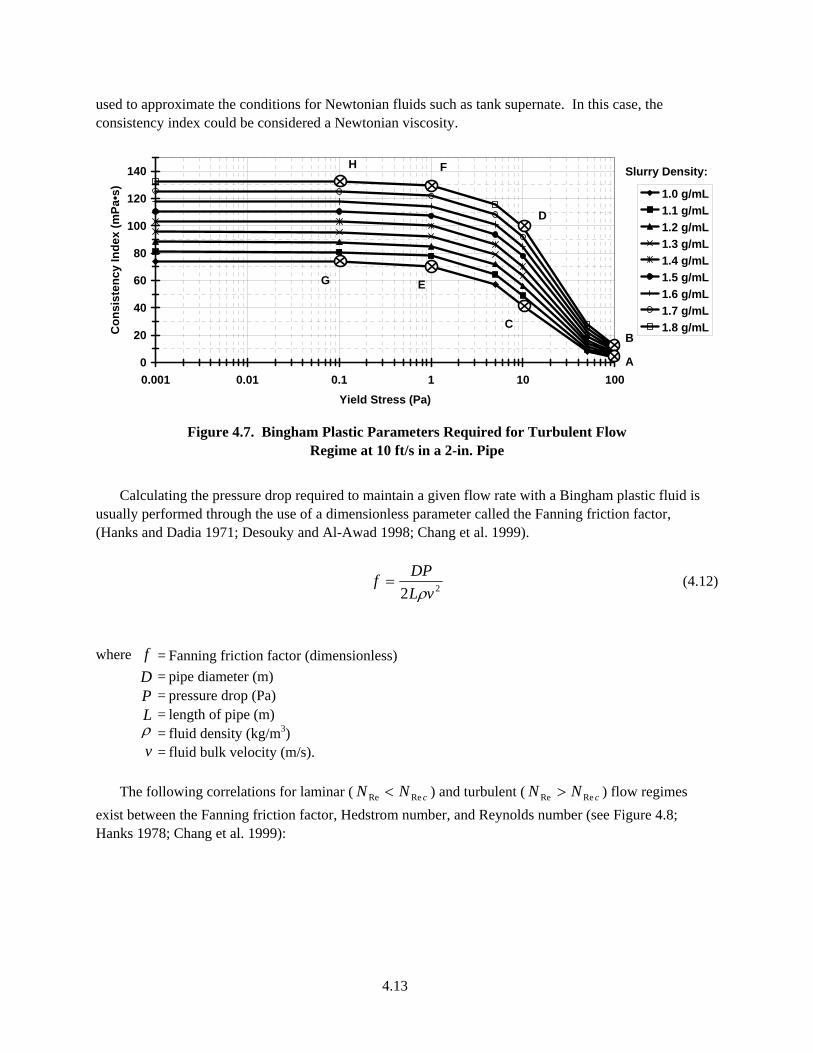
4.13
used to approximate the conditions for Newtonian fluids such as tank supernate. In this case, the consistency index could be considered a Newtonian viscosity.
0
20
40
60
80
100
120
140
0.001 0.01 0.1 1 10 100Yield Stress (Pa)
Con
sist
ency
Inde
x (m
Pa•s
)
1.0 g/mL1.1 g/mL1.2 g/mL1.3 g/mL1.4 g/mL1.5 g/mL1.6 g/mL1.7 g/mL1.8 g/mL
B
A
D
C
F
E
H
G
Slurry Density:
Figure 4.7. Bingham Plastic Parameters Required for Turbulent Flow
Regime at 10 ft/s in a 2-in. Pipe
Calculating the pressure drop required to maintain a given flow rate with a Bingham plastic fluid is
usually performed through the use of a dimensionless parameter called the Fanning friction factor, (Hanks and Dadia 1971; Desouky and Al-Awad 1998; Chang et al. 1999).
22 vLDPfρ
= (4.12)
where f = Fanning friction factor (dimensionless)
D = pipe diameter (m) P = pressure drop (Pa) L = length of pipe (m) ρ = fluid density (kg/m3) v = fluid bulk velocity (m/s).
The following correlations for laminar ( cNN ReRe < ) and turbulent ( cNN ReRe > ) flow regimes
exist between the Fanning friction factor, Hedstrom number, and Reynolds number (see Figure 4.8; Hanks 1978; Chang et al. 1999):
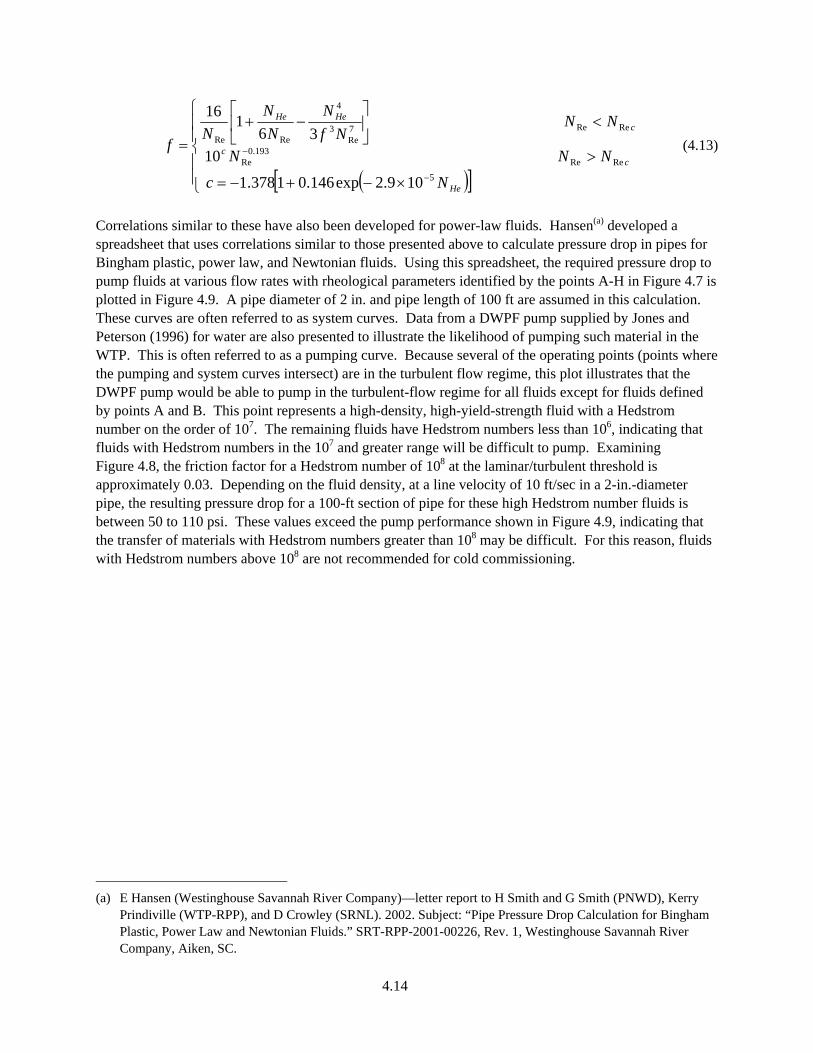
4.14
( )[ ]⎪⎪⎩
⎪⎪⎨
⎧
×−+−=
>
<⎥⎦
⎤⎢⎣
⎡−+
=
−
−
109.2exp146.01378.1
10
36
116
5ReRe
193.0Re
ReRe7Re
3
4
ReRe
He
cc
cHeHe
Nc
NNN
NNNf
NN
NN
f (4.13)
Correlations similar to these have also been developed for power-law fluids. Hansen(a) developed a spreadsheet that uses correlations similar to those presented above to calculate pressure drop in pipes for Bingham plastic, power law, and Newtonian fluids. Using this spreadsheet, the required pressure drop to pump fluids at various flow rates with rheological parameters identified by the points A-H in Figure 4.7 is plotted in Figure 4.9. A pipe diameter of 2 in. and pipe length of 100 ft are assumed in this calculation. These curves are often referred to as system curves. Data from a DWPF pump supplied by Jones and Peterson (1996) for water are also presented to illustrate the likelihood of pumping such material in the WTP. This is often referred to as a pumping curve. Because several of the operating points (points where the pumping and system curves intersect) are in the turbulent flow regime, this plot illustrates that the DWPF pump would be able to pump in the turbulent-flow regime for all fluids except for fluids defined by points A and B. This point represents a high-density, high-yield-strength fluid with a Hedstrom number on the order of 107. The remaining fluids have Hedstrom numbers less than 106, indicating that fluids with Hedstrom numbers in the 107 and greater range will be difficult to pump. Examining Figure 4.8, the friction factor for a Hedstrom number of 108 at the laminar/turbulent threshold is approximately 0.03. Depending on the fluid density, at a line velocity of 10 ft/sec in a 2-in.-diameter pipe, the resulting pressure drop for a 100-ft section of pipe for these high Hedstrom number fluids is between 50 to 110 psi. These values exceed the pump performance shown in Figure 4.9, indicating that the transfer of materials with Hedstrom numbers greater than 108 may be difficult. For this reason, fluids with Hedstrom numbers above 108 are not recommended for cold commissioning.
(a) E Hansen (Westinghouse Savannah River Company)—letter report to H Smith and G Smith (PNWD), Kerry
Prindiville (WTP-RPP), and D Crowley (SRNL). 2002. Subject: “Pipe Pressure Drop Calculation for Bingham Plastic, Power Law and Newtonian Fluids.” SRT-RPP-2001-00226, Rev. 1, Westinghouse Savannah River Company, Aiken, SC.
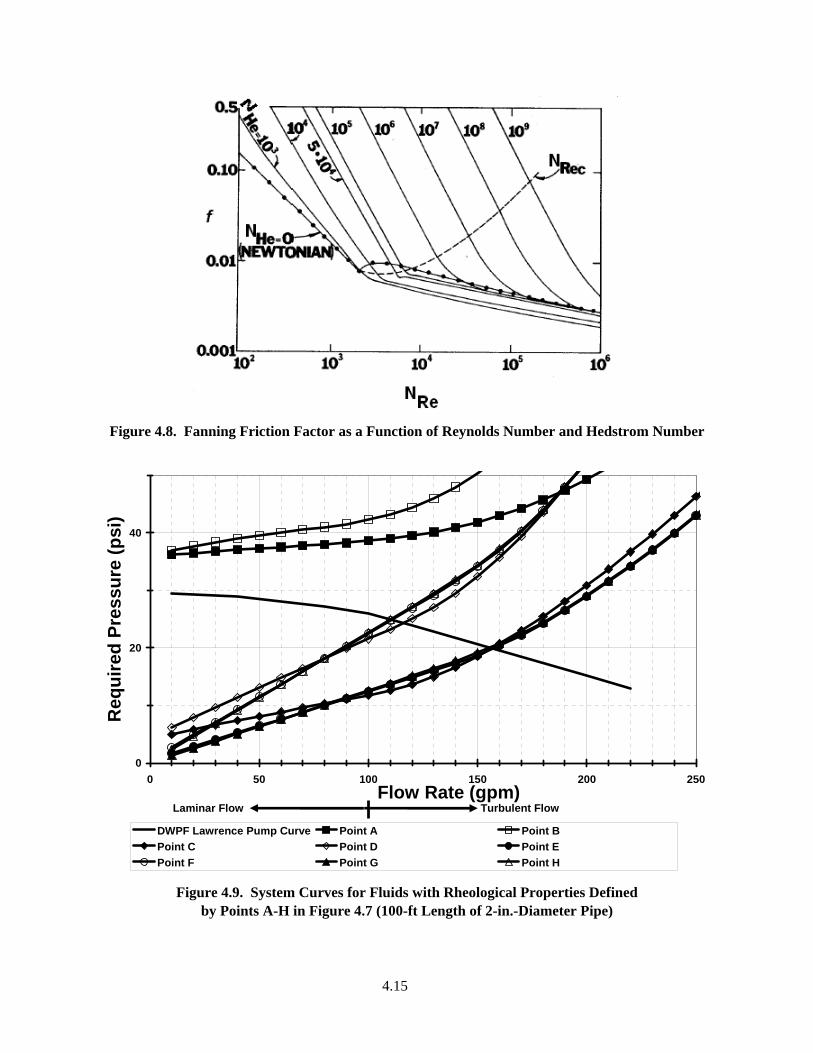
4.15
Figure 4.8. Fanning Friction Factor as a Function of Reynolds Number and Hedstrom Number
0
20
40
0 50 100 150 200 250Flow Rate (gpm)
Req
uire
d Pr
essu
re (p
si)
DWPF Lawrence Pump Curve Point A Point BPoint C Point D Point EPoint F Point G Point H
Turbulent FlowLaminar Flow
Figure 4.9. System Curves for Fluids with Rheological Properties Defined
by Points A-H in Figure 4.7 (100-ft Length of 2-in.-Diameter Pipe)
4.16
4.1.5 Material Transfer Operations (Startup Pipeline Flow)
Chang et al. (1999) explain that fluids with shear strength will not flow unless the following condition is met:
yw LDP ττ >=4
(4.14)
where
wτ = shear stress of the fluid at the pipe wall (Pa) D = pipe diameter (m) P = pressure drop (Pa) L = pipe length (m)
yτ = shear strength of the fluid (Pa).
Given a 10-ft section of 2-in.-diameter pipe plugged with settled solids, the required pressure to transport the material as a function of shear strength is shown in Figure 4.10. The previously established shear strength value of 625 Pa would result in a pressure of approximately 22 psi to begin flow that appears achievable. This situation would most likely occur during plant upset when systems go offline and solids settle and remain undisturbed until a plant restart is attempted.
4.2 Bounding Conditions Recommendation
Table 4.2 can be constructed if the most restrictive values for the operating boundaries discussed above are taken. This set of operating boundaries represents rheological parameters that should be compatible with many industrial operations of chemical processing units used in the WTP.
It has been demonstrated in Section 4.1.1 that materials with apparent viscosities above 700 cP at low shear conditions (~70 s-1) can lead to difficulties in obtaining homogenous mixing in agitated vessels. Therefore, we wish to restrict the use of material to those with low shear viscosities below 700 cP.
The settled-solids shear strength is a parameter that may be important during plant-upset conditions. When a plant upset occurs, the slurries in vessels and pipes may become motionless, allowing the solids to settle. When the plant is restarted, flow must be reinitiated for the settled solids in pipes and tanks. One such scenario occurs if an impeller in a tank is submerged in settled solids and then restarted. As indicated in Section 4.1.2, a motor with a stall torque of 400 Nm would have difficulty initiating rotation in a fluid with 625 Pa shear strength. One-hundred-horsepower motors typically have stall torques in this range.
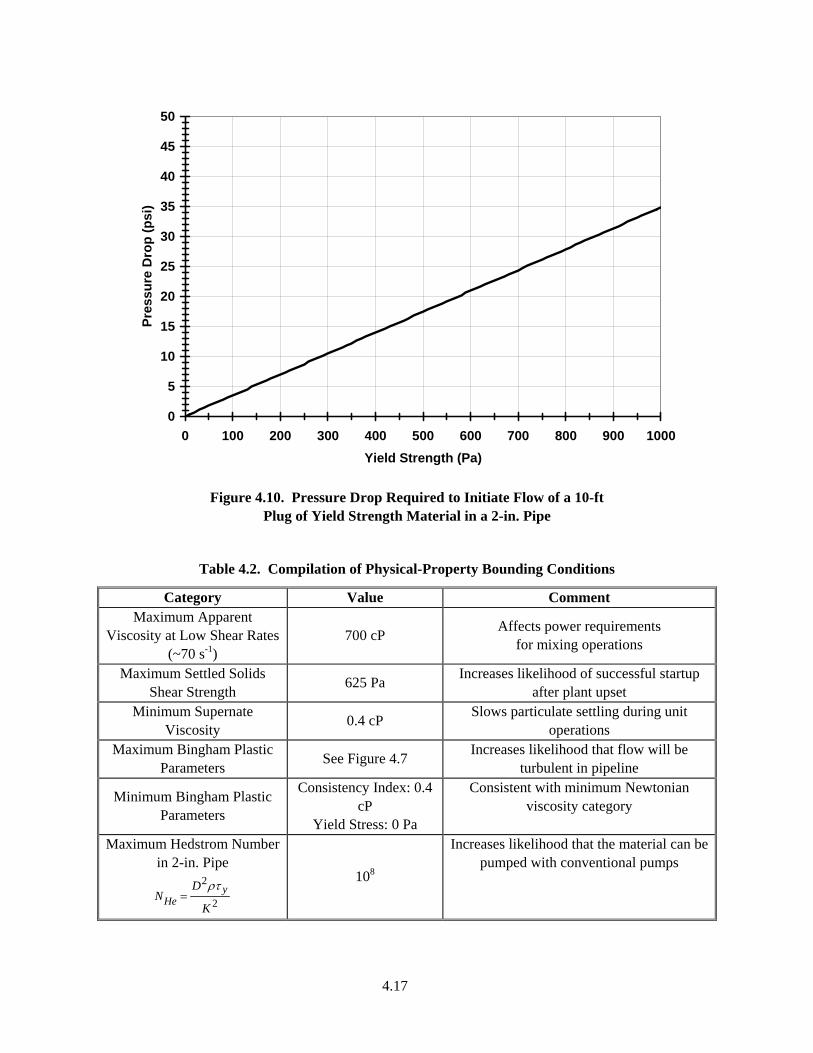
4.17
0
5
10
15
20
25
30
35
40
45
50
0 100 200 300 400 500 600 700 800 900 1000Yield Strength (Pa)
Pres
sure
Dro
p (p
si)
Figure 4.10. Pressure Drop Required to Initiate Flow of a 10-ft
Plug of Yield Strength Material in a 2-in. Pipe
Table 4.2. Compilation of Physical-Property Bounding Conditions
Category Value Comment Maximum Apparent
Viscosity at Low Shear Rates (~70 s-1)
700 cP Affects power requirements for mixing operations
Maximum Settled Solids Shear Strength 625 Pa Increases likelihood of successful startup
after plant upset Minimum Supernate
Viscosity 0.4 cP Slows particulate settling during unit operations
Maximum Bingham Plastic Parameters See Figure 4.7 Increases likelihood that flow will be
turbulent in pipeline
Minimum Bingham Plastic Parameters
Consistency Index: 0.4 cP
Yield Stress: 0 Pa
Consistent with minimum Newtonian viscosity category
Maximum Hedstrom Number in 2-in. Pipe
2
2
K
DN y
Heρτ
= 108
Increases likelihood that the material can be pumped with conventional pumps
4.18
It was demonstrated in Section 4.1.3 that 105-μm rutile particles will be difficult to keep homogenized in an agitated vessel with a suspending fluid possessing a viscosity of less than 0.4 cP. Since the insoluble GFCs have rutile particle sizes in this range, it is anticipated that a 0.4-cP suspending medium would be a sufficient minimum viscosity for testing purposes. Suspending fluid density was shown not to be a major concern for this particular combination of fluid viscosity and particle size.
On the basis that particulate settling in pipes is difficult in the turbulent flow regime, a set of Bingham plastic parameters was constructed in Section 4.1.4 that indicates the laminar/turbulent flow threshold in a 2-in. pipe at a fluid velocity of 10 ft/sec. Above this velocity, equipment erosion becomes a concern. These Bingham plastic parameters represent upper boundaries on material and are presented in Figure 4.7. The lower Bingham plastic boundaries were selected to be consistent with the Newtonian viscosity lower boundaries discussed above.
The Hedstrom number appears to have a large impact on the pumping performance of Bingham
plastic materials. Using pump performance data from DWPF, it was shown in Section 4.1.4 that fluids with Hedstrom numbers above approximately 108 would be difficult to pump in the turbulent flow regime. Consequently, this value was set as an upper bound for the slurry material.
Table 4.2 can be simplified by comparing the bounding conditions to measurements on the actual waste (when available). The resulting sets of bounding conditions developed for each process stream are based on the intersection of the actual waste data and the engineering performance data.
The slurry process streams are expected to behave as Bingham plastic fluids. Using the data compiled in Appendices A and B, estimates of the actual waste data for HLW pretreated sludge and HLW melter feed stream are shown in Table 4.3 and Table 4.4. These data were used to calculate the critical transition velocity for these fluids in a 2-in.-diameter pipe. Several of these critical velocity values are above the 10-ft/s pipe erosion threshold. To define a set of bounding conditions for the vitrification streams, a slurry density of 1.2 g/mL was used as a high characteristic slurry density for the actual pretreated HLW sludge streams, and a slurry density of 1.5 g/mL was used as a high characteristic slurry density for the actual HLW melter feed streams. With these densities, the laminar turbulent transition data in Figure 4.7 were plotted in Figures 4.11 and 4.12. The Bingham plastic parameters that encompass the most actual waste points at these slurry densities (1.2 g/mL or 1.5 g/mL) while maintaining a critical velocity of approximately 10 ft/s were calculated as upper bounding conditions and define the upper right corner of the boundary conditions. Figure 4.11 and Figure 4.12 present the resulting rheological bounding conditions graphically along with the actual waste data (see Tables 4.2, 4.3, and 4.4), the mechanical mixing criterion developed (Section 4.1.1), and the DWPF/HWVP design basis.(a) Note that in each case for mechanical mixers, the low shear mechanical mixing criteria exceed the proposed bounding conditions. This removes the mechanical mixing criteria from further examination. In addition, the proposed bounding conditions generally encompass the DWPF design basis and are comparable to the HWVP design basis.
(a) DWPF Design Basis: DPSTD-80-38-2; Part 10, Item 230, Date 9-82 Rev. 2. HWVP Design Basis:
WHC-SD-HWV-DP-01; Section, Item 300 October 1990. HWVP consistency index presented in this document calculated from apparent viscosity design ranges at high and low yield stress design ranges.
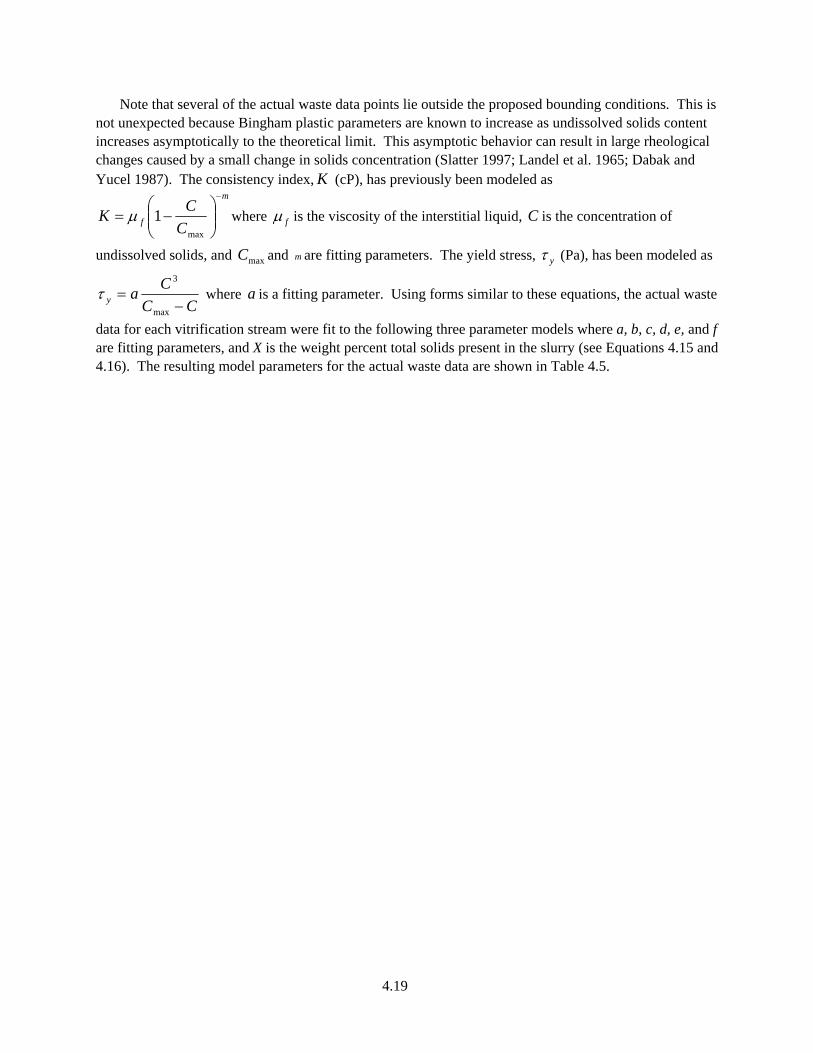
4.19
Note that several of the actual waste data points lie outside the proposed bounding conditions. This is not unexpected because Bingham plastic parameters are known to increase as undissolved solids content increases asymptotically to the theoretical limit. This asymptotic behavior can result in large rheological changes caused by a small change in solids concentration (Slatter 1997; Landel et al. 1965; Dabak and Yucel 1987). The consistency index, K (cP), has previously been modeled as
m
f CCK
−
⎟⎟⎠
⎞⎜⎜⎝
⎛−=
max
1μ where fμ is the viscosity of the interstitial liquid, C is the concentration of
undissolved solids, and maxC and m are fitting parameters. The yield stress, yτ (Pa), has been modeled as
CCCay −
=max
3
τ where a is a fitting parameter. Using forms similar to these equations, the actual waste
data for each vitrification stream were fit to the following three parameter models where a, b, c, d, e, and f are fitting parameters, and X is the weight percent total solids present in the slurry (see Equations 4.15 and 4.16). The resulting model parameters for the actual waste data are shown in Table 4.5.

4.20
Table 4.3. Rheological Comparison of Estimated Actual HLW Pretreated Sludge Data to Proposed Operating Envelope at 25°C
Description (Proposed Bounding
Conditions) Wt% Total
Solids Slurry Density
Consistency Index
(0.4,30) Yield Stress
(0,30)
Hedstrom Numberin 2-in. Pipe
(0,108)
Critical Reynolds Number
in 2-in. Pipe
Critical Velocity in 2-in. Pipe
(0,10) Meets Proposed
Bounding Conditions?
g/mL mPa·s Pa ft/sec Yes/No Pretreated HLW Sludge AZ101 25°C PNWD
10 1.08 <10 0 0 2,100 1.3 Yes
Pretreated HLW Sludge AZ-101 25°C PNWD
15 1.12 5.2 2.9 3.1E+05 10,000 3.0 Yes
Pretreated HLW Sludge AZ101 25°C PNWD 22 1.19 10.5 11.4 3.2E+05 10,000 5.8 Yes
Pretreated HLW Sludge AZ102 25°C PNWD 15 1.14 30 18.5 6.0E+04 5,700 9.8 Yes
Pretreated HLW Sludge AZ-102 25°C PNWD
20 1.17 34 * 26.3 6.9E+04 6,000 11.3 * No
Pretreated HLW Sludge AZ102 25°C PNWD
25 1.24 99 * 209.1 * 6.8E+04 6,000 30.8 * No
Pretreated HLW Sludge C-104 25°C PNWD
5 1.0 3 0.2 5.7E+04 5,600 1.1 Yes
Pretreated HLW Sludge C-104 25°C PNWD 15 1.05 5 0.4 4.3E+04 5,100 1.6 Yes
Pretreated HLW Sludge C-104 25°C PNWD 25 1.12 10 5.8 1.7E+05 8,200 4.7 Yes
* Outside of bounding conditions
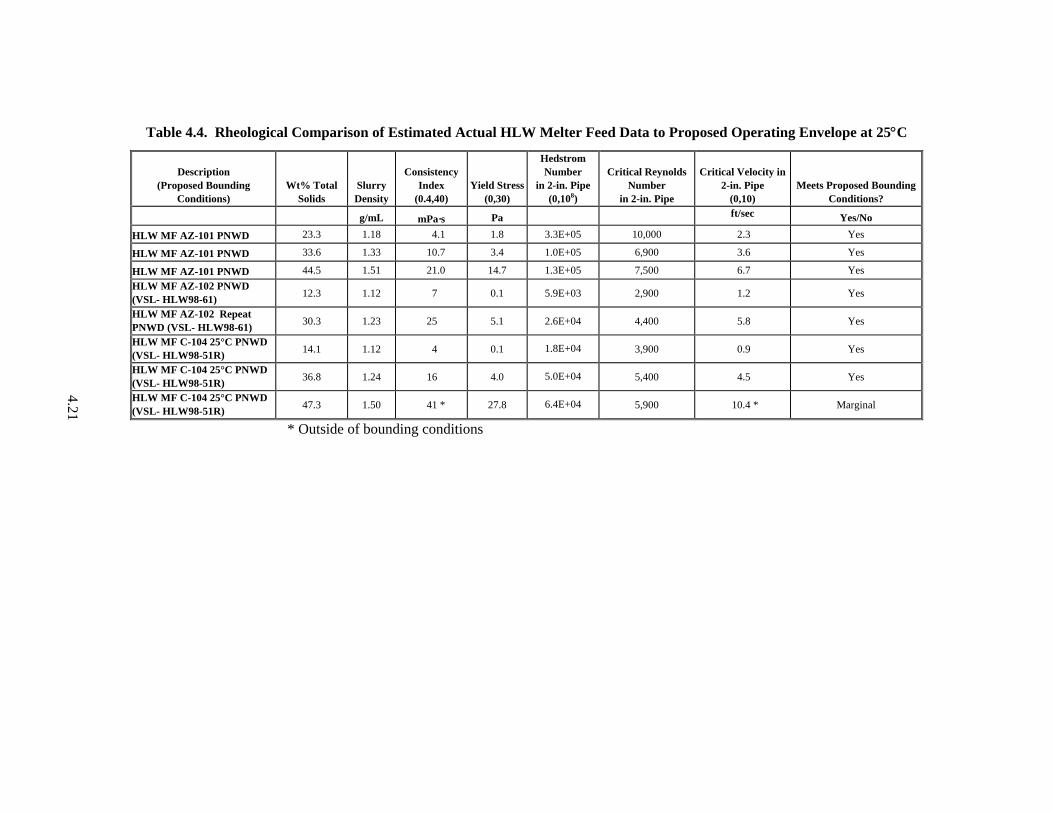
4.21
Table 4.4. Rheological Comparison of Estimated Actual HLW Melter Feed Data to Proposed Operating Envelope at 25°C
Description (Proposed Bounding
Conditions) Wt% Total
Solids Slurry Density
Consistency Index
(0.4,40) Yield Stress
(0,30)
Hedstrom Number
in 2-in. Pipe (0,108)
Critical Reynolds Number
in 2-in. Pipe
Critical Velocity in 2-in. Pipe
(0,10) Meets Proposed Bounding
Conditions?
g/mL mPa·s Pa ft/sec Yes/No
HLW MF AZ-101 PNWD 23.3 1.18 4.1 1.8 3.3E+05 10,000 2.3 Yes
HLW MF AZ-101 PNWD 33.6 1.33 10.7 3.4 1.0E+05 6,900 3.6 Yes
HLW MF AZ-101 PNWD 44.5 1.51 21.0 14.7 1.3E+05 7,500 6.7 Yes HLW MF AZ-102 PNWD (VSL- HLW98-61) 12.3 1.12 7 0.1 5.9E+03 2,900 1.2 Yes
HLW MF AZ-102 Repeat PNWD (VSL- HLW98-61) 30.3 1.23 25 5.1 2.6E+04 4,400 5.8 Yes
HLW MF C-104 25°C PNWD (VSL- HLW98-51R) 14.1 1.12 4 0.1 1.8E+04 3,900 0.9 Yes
HLW MF C-104 25°C PNWD (VSL- HLW98-51R) 36.8 1.24 16 4.0 5.0E+04 5,400 4.5 Yes
HLW MF C-104 25°C PNWD (VSL- HLW98-51R) 47.3 1.50 41 * 27.8 6.4E+04 5,900 10.4 * Marginal
* Outside of bounding conditions
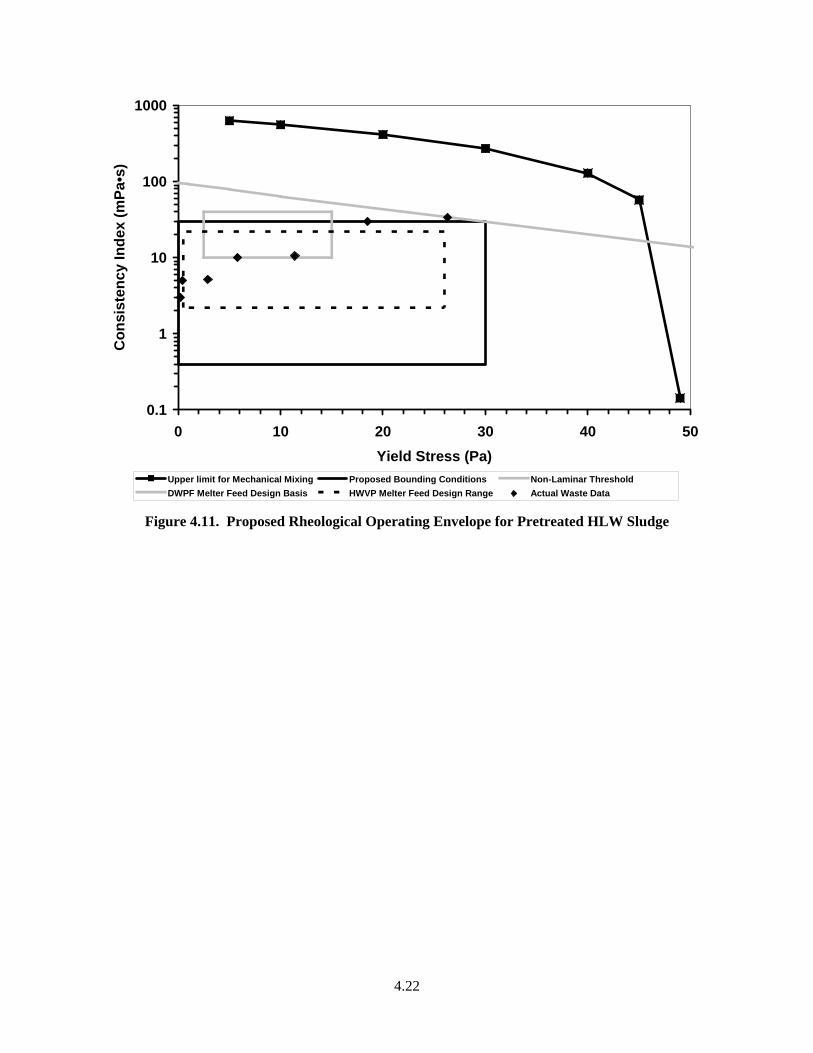
4.22
0.1
1
10
100
1000
0 10 20 30 40 50Yield Stress (Pa)
Con
sist
ency
Inde
x (m
Pa•s
)
Upper limit for Mechanical Mixing Proposed Bounding Conditions Non-Laminar ThresholdDWPF Melter Feed Design Basis HWVP Melter Feed Design Range Actual Waste Data
Figure 4.11. Proposed Rheological Operating Envelope for Pretreated HLW Sludge
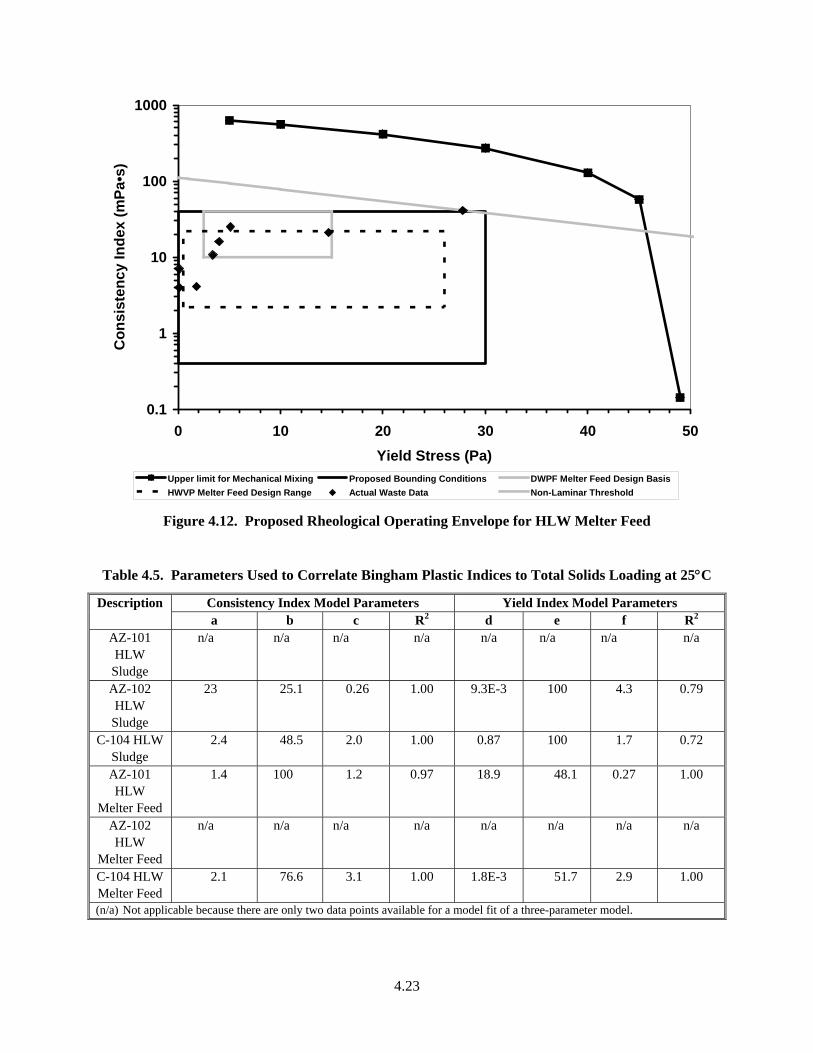
4.23
0.1
1
10
100
1000
0 10 20 30 40 50Yield Stress (Pa)
Con
sist
ency
Inde
x (m
Pa•s
)
Upper limit for Mechanical Mixing Proposed Bounding Conditions DWPF Melter Feed Design BasisHWVP Melter Feed Design Range Actual Waste Data Non-Laminar Threshold
Figure 4.12. Proposed Rheological Operating Envelope for HLW Melter Feed
Table 4.5. Parameters Used to Correlate Bingham Plastic Indices to Total Solids Loading at 25°C
Consistency Index Model Parameters Yield Index Model Parameters Description a b c R2 d e f R2
AZ-101 HLW
Sludge
n/a n/a n/a n/a n/a n/a n/a n/a
AZ-102 HLW
Sludge
23 25.1 0.26 1.00
9.3E-3 100 4.3 0.79
C-104 HLW Sludge
2.4 48.5 2.0 1.00 0.87 100 1.7 0.72
AZ-101 HLW
Melter Feed
1.4 100 1.2 0.97 18.9 48.1 0.27 1.00
AZ-102 HLW
Melter Feed
n/a n/a n/a n/a n/a n/a n/a n/a
C-104 HLW Melter Feed
2.1 76.6 3.1 1.00
1.8E-3 51.7 2.9 1.00
(n/a) Not applicable because there are only two data points available for a model fit of a three-parameter model.
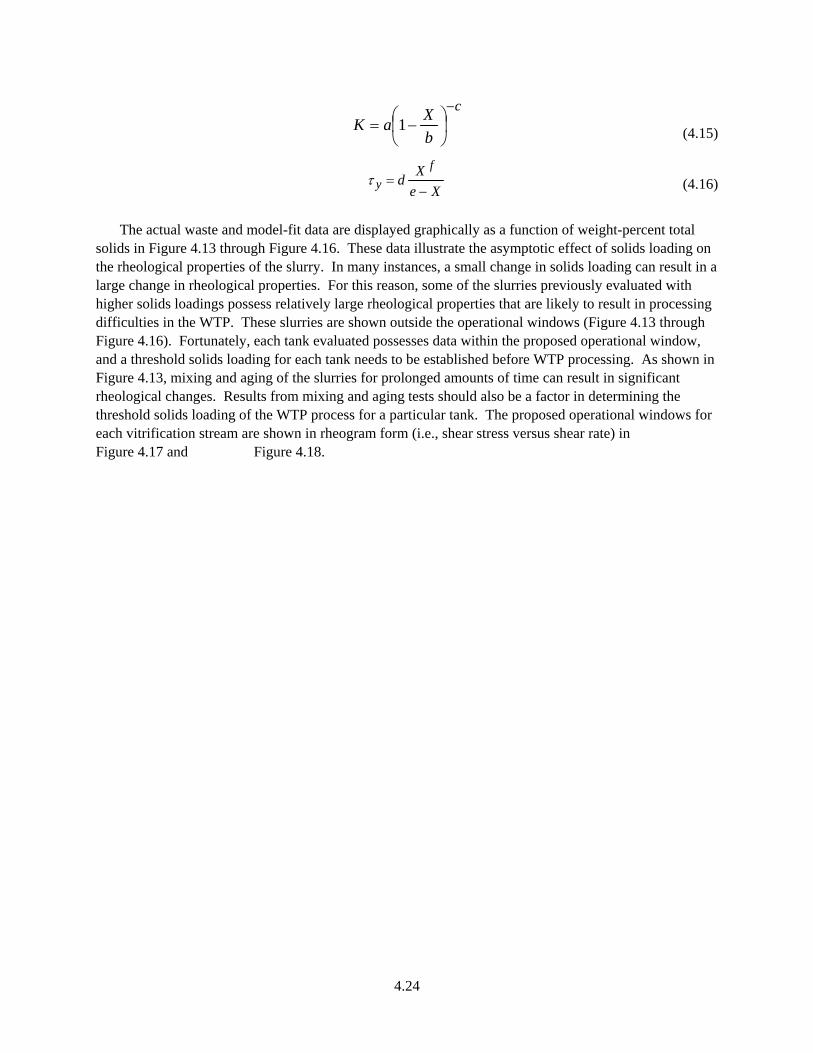
4.24
c
bXaK
−⎟⎠
⎞⎜⎝
⎛ −= 1 (4.15)
XeXd
fy −=τ (4.16)
The actual waste and model-fit data are displayed graphically as a function of weight-percent total
solids in Figure 4.13 through Figure 4.16. These data illustrate the asymptotic effect of solids loading on the rheological properties of the slurry. In many instances, a small change in solids loading can result in a large change in rheological properties. For this reason, some of the slurries previously evaluated with higher solids loadings possess relatively large rheological properties that are likely to result in processing difficulties in the WTP. These slurries are shown outside the operational windows (Figure 4.13 through Figure 4.16). Fortunately, each tank evaluated possesses data within the proposed operational window, and a threshold solids loading for each tank needs to be established before WTP processing. As shown in Figure 4.13, mixing and aging of the slurries for prolonged amounts of time can result in significant rheological changes. Results from mixing and aging tests should also be a factor in determining the threshold solids loading of the WTP process for a particular tank. The proposed operational windows for each vitrification stream are shown in rheogram form (i.e., shear stress versus shear rate) in Figure 4.17 and Figure 4.18.
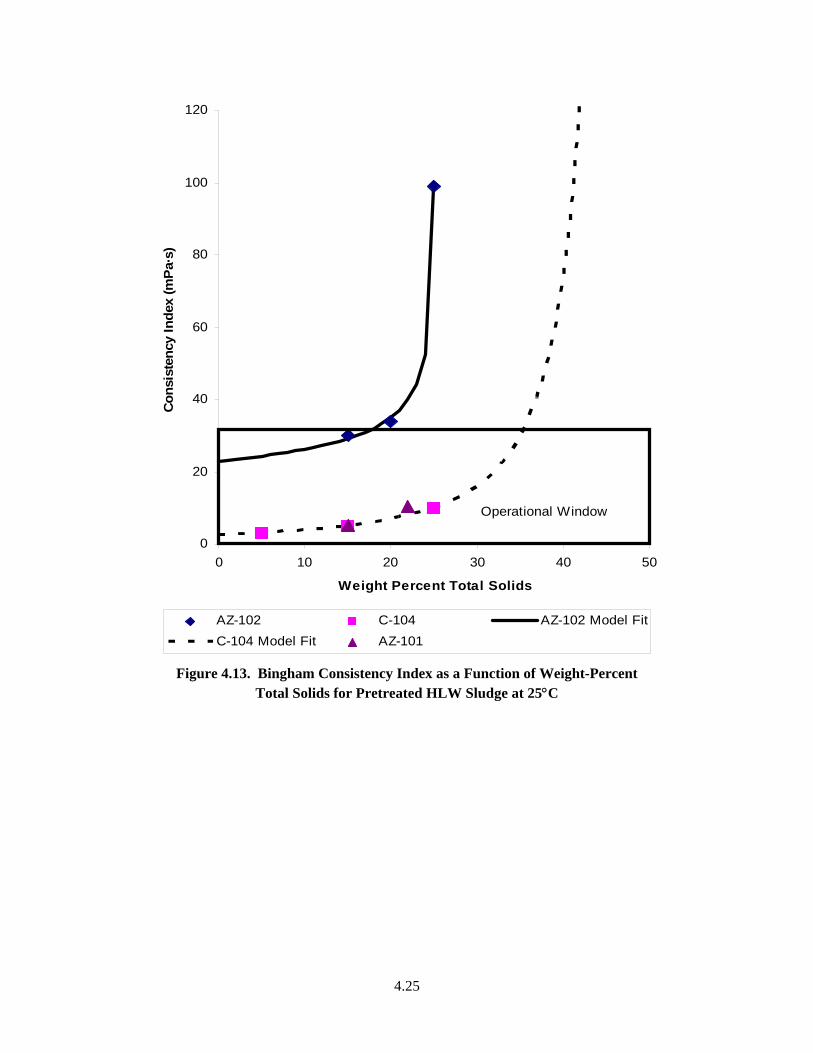
4.25
0
20
40
60
80
100
120
0 10 20 30 40 50
Weight Percent Total Solids
Con
sist
ency
Inde
x (m
Pa·
s)
AZ-102 C-104 AZ-102 Model FitC-104 Model Fit AZ-101
Operational Window
Figure 4.13. Bingham Consistency Index as a Function of Weight-Percent
Total Solids for Pretreated HLW Sludge at 25°C
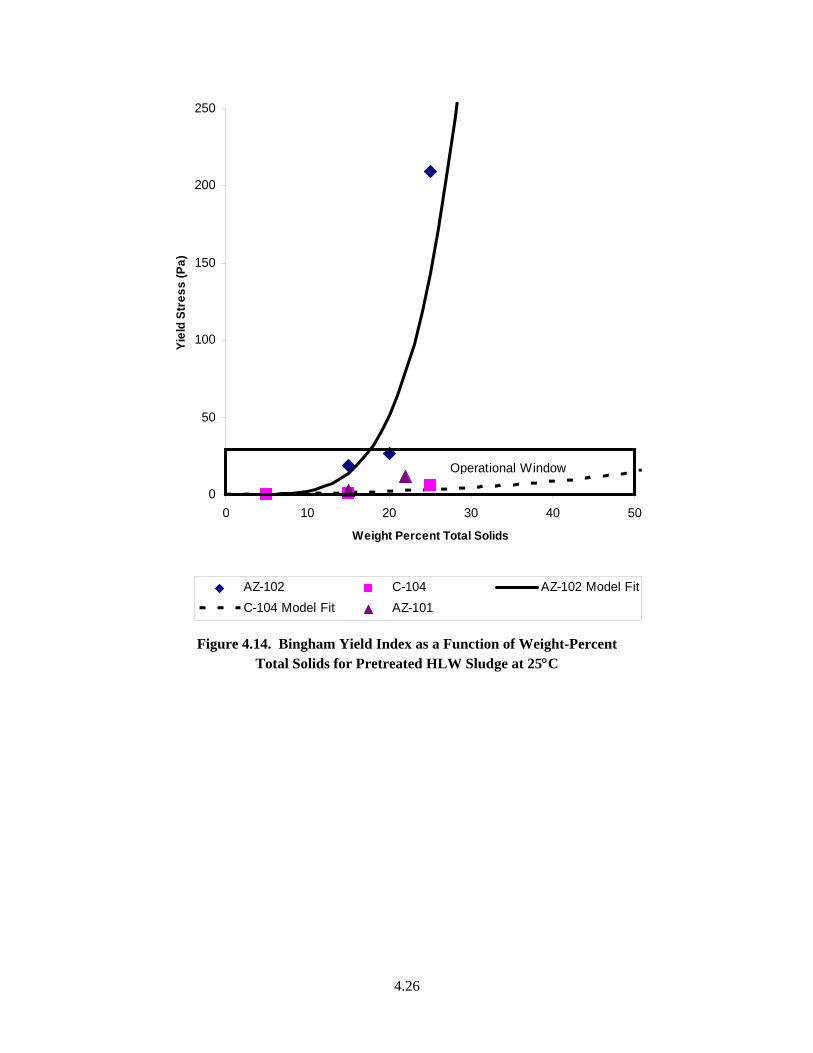
4.26
0
50
100
150
200
250
0 10 20 30 40 50
Weight Percent Total Solids
Yiel
d St
ress
(Pa)
AZ-102 C-104 AZ-102 Model FitC-104 Model Fit AZ-101
Operational Window
Figure 4.14. Bingham Yield Index as a Function of Weight-Percent
Total Solids for Pretreated HLW Sludge at 25°C
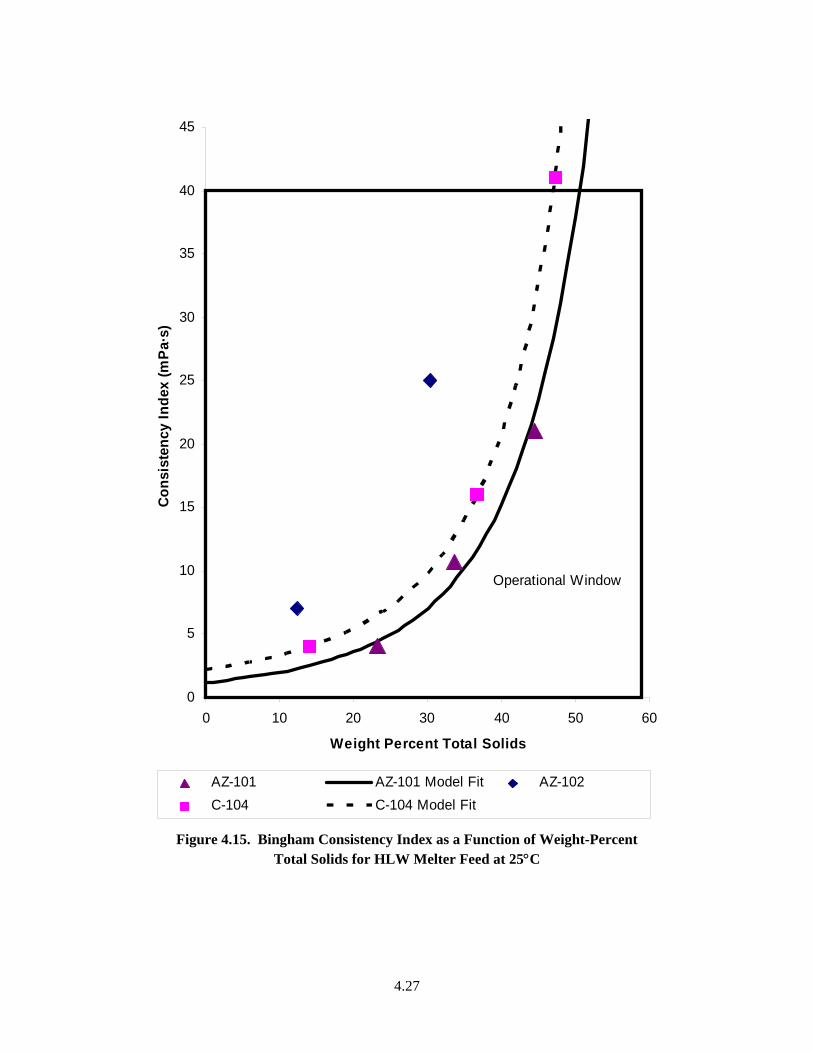
4.27
0
5
10
15
20
25
30
35
40
45
0 10 20 30 40 50 60
Weight Percent Total Solids
Con
sist
ency
Inde
x (m
Pa·s
)
AZ-101 AZ-101 Model Fit AZ-102C-104 C-104 Model Fit
Operational Window
Figure 4.15. Bingham Consistency Index as a Function of Weight-Percent
Total Solids for HLW Melter Feed at 25°C
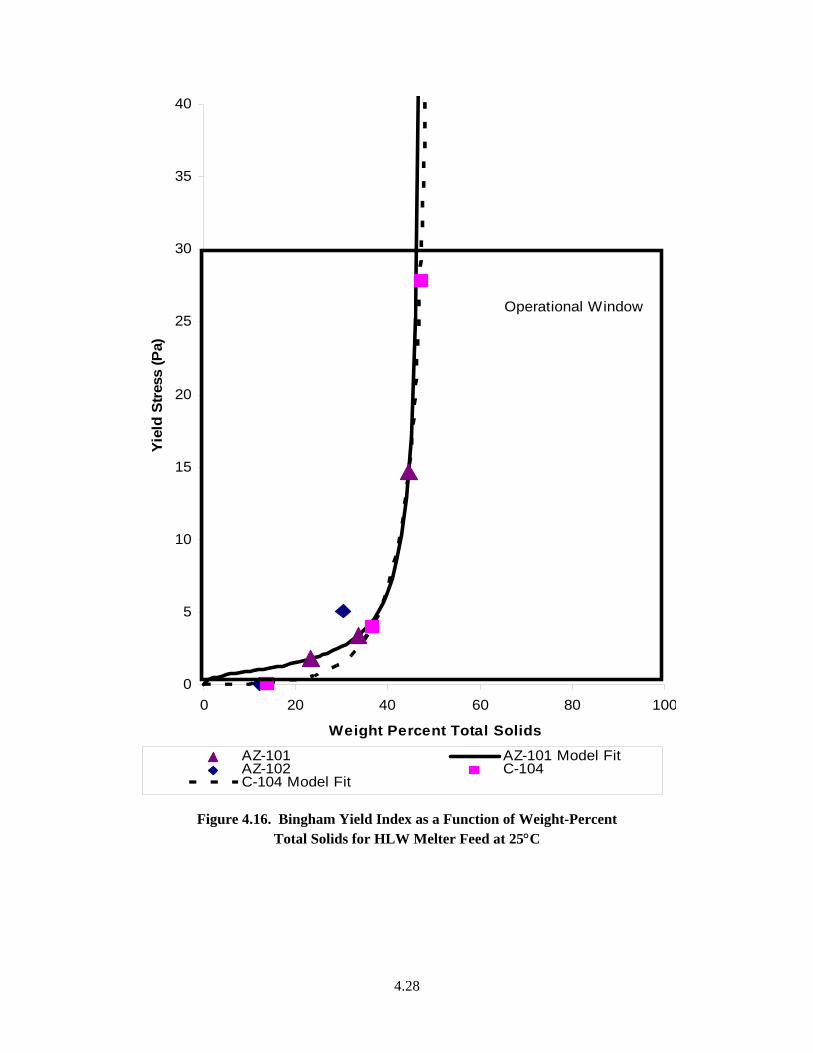
4.28
0
5
10
15
20
25
30
35
40
0 20 40 60 80 100
Weight Percent Total Solids
Yiel
d St
ress
(Pa)
AZ-101 AZ-101 Model FitAZ-102 C-104C-104 Model Fit
Operational Window
Figure 4.16. Bingham Yield Index as a Function of Weight-Percent Total Solids for HLW Melter Feed at 25°C
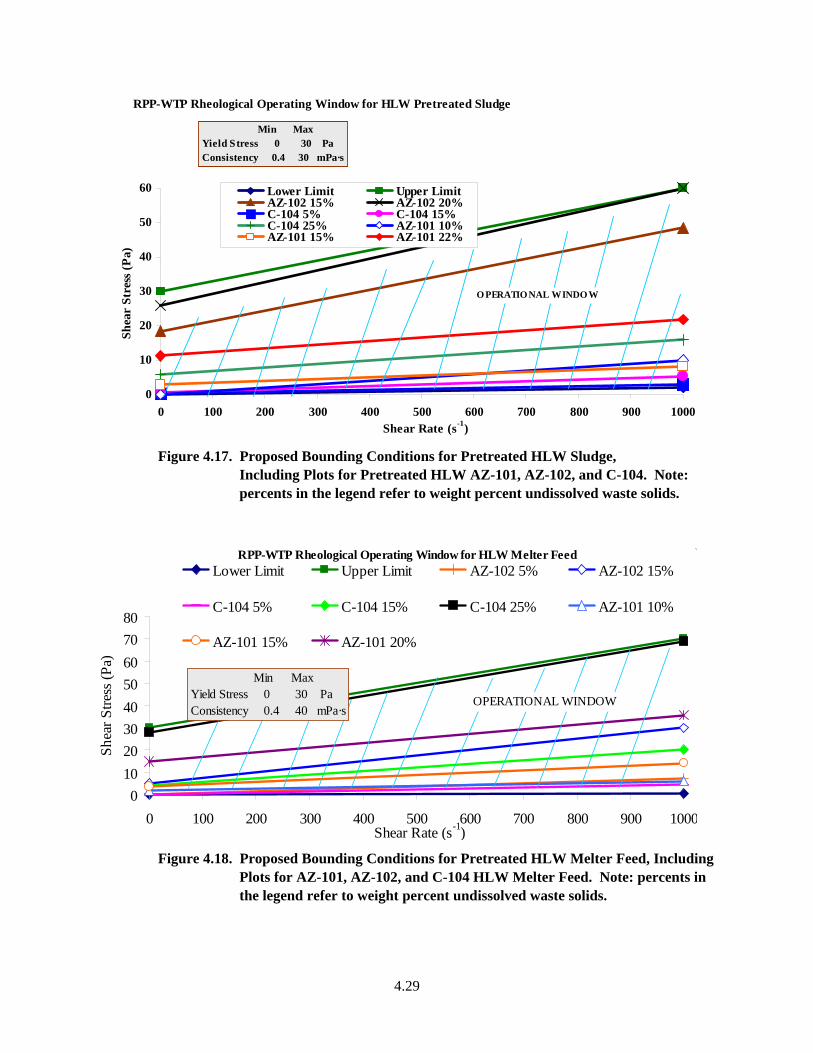
4.29
0
10
20
30
40
50
60
0 100 200 300 400 500 600 700 800 900 1000Shear Rate (s-1)
Shea
r St
ress
(Pa)
Lower Limit Upper LimitAZ-102 15% AZ-102 20%C-104 5% C-104 15%C-104 25% AZ-101 10%AZ-101 15% AZ-101 22%
O PERATIO NAL WINDO W
Min MaxYield Stress 0 30 PaConsistency 0.4 30 mPa·s
RPP-WTP Rheological Operating Window for HLW Pretreated Sludge
Figure 4.17. Proposed Bounding Conditions for Pretreated HLW Sludge,
Including Plots for Pretreated HLW AZ-101, AZ-102, and C-104. Note: percents in the legend refer to weight percent undissolved waste solids.
01020304050607080
0 100 200 300 400 500 600 700 800 900 1000Shear Rate (s-1)
Shea
r Stre
ss (P
a)
Lower Limit Upper Limit AZ-102 5% AZ-102 15%
C-104 5% C-104 15% C-104 25% AZ-101 10%
AZ-101 15% AZ-101 20%
OPERATIONAL WINDOW
RPP-WTP Rheological Operating Window for HLW Melter Feed
Min MaxYield Stress 0 30 PaConsistency 0.4 40 mPa·s
Figure 4.18. Proposed Bounding Conditions for Pretreated HLW Melter Feed, Including
Plots for AZ-101, AZ-102, and C-104 HLW Melter Feed. Note: percents in the legend refer to weight percent undissolved waste solids.
4.30
4.2.1 Prediction of Yield Stress and Bingham Consistency for Pretreated HLW and HLW Melter Feed
The parameters shown in Table 4.5 for Equations 4.15 and 4.16 provide rheological property predictions for each source waste tank as a function of solids concentration in the slurry. These data indicate that each source waste tank has a different set of rheological parameters that are likely a function of solids concentration, PSD, particle shape, particle composition, aqueous phase composition, etc. Because of this level of complexity, rheological performance curves should be determined for each source tank waste with similar particle properties and constant waste composition.
Tracey et al. (1996), using a Hanford HLW simulant, plotted “Bingham viscosity” and yield stress as a function of solids wt% and found an exponential increase of these physical properties beginning at about 23- to 25-wt% solids. The magnitude of the increase strongly increased with increasing pH. For the HLW melter feed, a rheological upper bound of 40-Pa Bingham yield stress and 30-cP Bingham consistency (a solids loading of 36 wt% total solids) meets the 90% prediction interval for both rheological properties. Note that the HLW melter feed is much better behaved than the pretreated HLW. It is believed that this is because the rheology is dominated by the GFCs in the melter feed whereas the varying solids species in the pretreated waste result in a large amount of statistical variance.
4.3 Selection of a Shear Rate Range to Fit Realistic Boundary Conditions
To define a shear-rate range that should be used when assessing if a material fits within the bounding range, two process operations are considered: pipeline flow and mechanical mixing. These process operations have been previously evaluated as explained below.
4.3.1 Pipe Flow Evaluation
The pipe velocity and diameter are based on the evaluation completed in Section 4.1.4. From that section, Jones and Peterson (1996) state that solids settling in process lines does not usually occur if the slurry flow is turbulent. Turbulent flow generally exists at high line velocities above 3 to 5 ft/s in 2-in. piping. However, high fluid velocities will cause excessive erosion, and a maximum line velocity of 10 ft/s has been specified for the DWPF (Jones and Peterson 1996).
The rheology parameters are established in Section 4.2. Table 4.2 succinctly summarizes those parameters and indicates their importance to pipe flow where appropriate, such as maximum Bingham plastic parameters and the maximum Hedstrom number in 2-in. pipe. The shear stress at the pipe wall is calculated for conditions that produce a maximum shear (equation is taken from Shook et al. [2002]) (Figure 4.19). This result indicates that rheological properties should be measured to at least 800·sec-1 to match an estimate of the potential range of service conditions.
4.3.2 Mechanical Mixing Evaluations
Mechanical mixing evaluations were carried out in Section 4.1.1, Mixing Operations (Low-Shear-Rate Viscosity), and 4.1.2, Mixing Operations (Maximum Settled Solids Shear Strength), using the impeller diameter and rotational rate from Section 4.1.1 and assuming that the impeller diameter is 90% of the tank diameter. Reducing the gap between the tank wall and the impeller results in an even higher shear rate, and 90% is a reasonably conservative estimate for typical process operations. The maximum-
4.31
shear-rate equation for this geometry is found in Steffe (1996) and gives a value for the shear rate at the tank wall of 377·s-1 for an impeller rotational rate of 400 rpm (Figure 4.20).
It is concluded that rheological properties should be measured over a shear-rate range of 0 to 800·s-1 to include an estimate of the full range of conditions that a slurry might see.
4.4 Application of Boundary Conditions
A stated objective of this report is to develop a set of bounding physical and rheological properties for waste materials that can be reasonably processed and likely encountered in the WTP vitrification facilities. To determine the bounds for each operation, one must understand what general waste properties are anticipated and how changes in those properties can affect process operation. The process bounds are then established at the point where the properties of the material induce unacceptable risk to plant performance. Hence, one can use this set of bounding physical and rheological properties to judge when a given pretreated waste or melter feed may cause transfer or processing problems by causing the system to have to operate outside its design capabilities. In this brief section, examples of HLW pretreated waste or melter feed rheology are discussed with respect to the recommended rheological bounding conditions.
Table 4.6 summarizes the boundary conditions for HLW pretreated waste and melter feed. Figure 4.21 and Figure 4.22 plot these conditions. The pretreated HLW sludge simulant is assumed to display Bingham behavior as the actual low-activity pretreated wastes are observed to do, so in Figure 4.21, the apparent viscosity of a HLW pretreated waste simulant for the asymptotic limit at high shear rates will lay between 0.4 and 30 cP if it is to represent a waste that can be appropriately mixed and transported by a pretreatment facility. The Bingham behavior of the actual high-activity pretreated wastes, and their simulants are anticipated on the basis that they are solutions with significant suspended solid matter. The lower boundary is based on the need to maintain the fastest settling glass-former particles in suspension while the glass formers are being added to the waste to make a melter feed. The upper boundary reflects the fact that HLW melter feed slurries with less than about 50-wt% solids have apparent viscosities less than 30 cP (cf. Figure 4.16).
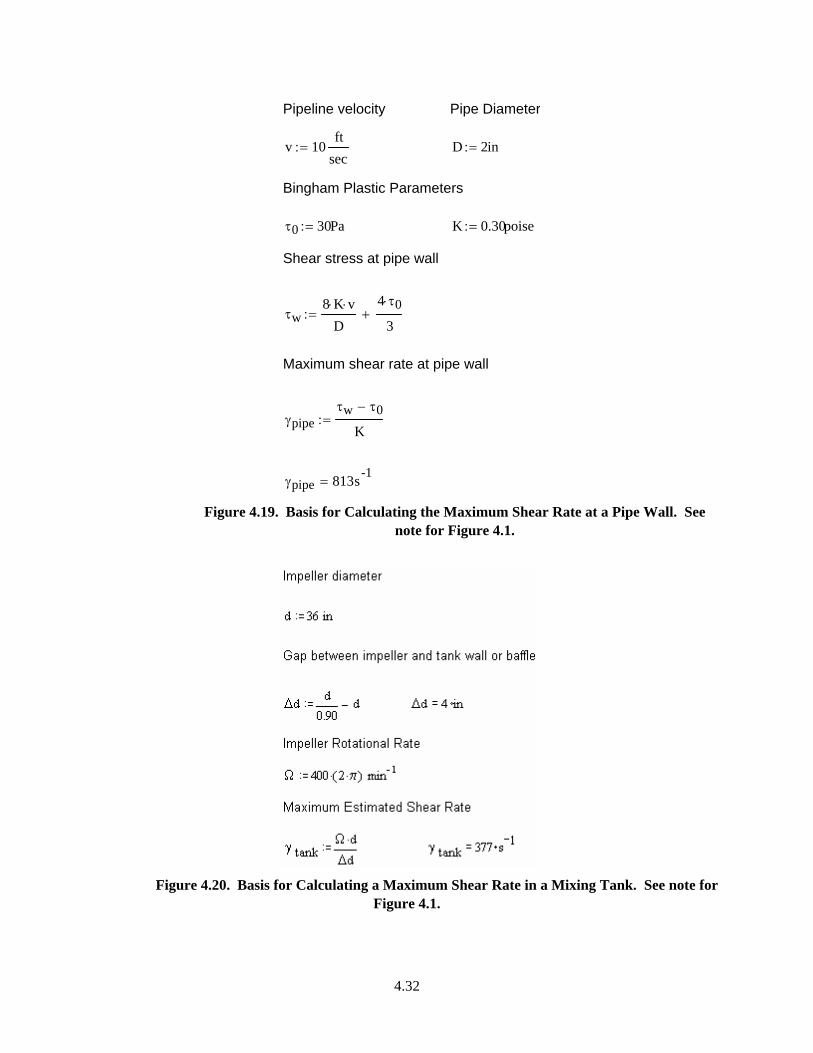
4.32
Pipeline velocity Pipe Diameter
v 10ft
sec:= D 2in:=
Bingham Plastic Parameters
τ0 30Pa:= K 0.30poise:=
Shear stress at pipe wall
τw8 K⋅ v⋅
D
4 τ0⋅
3+:=
Maximum shear rate at pipe wall
γpipeτw τ0−
K:=
γpipe 813s-1=
Figure 4.19. Basis for Calculating the Maximum Shear Rate at a Pipe Wall. See note for Figure 4.1.
Figure 4.20. Basis for Calculating a Maximum Shear Rate in a Mixing Tank. See note for
Figure 4.1.
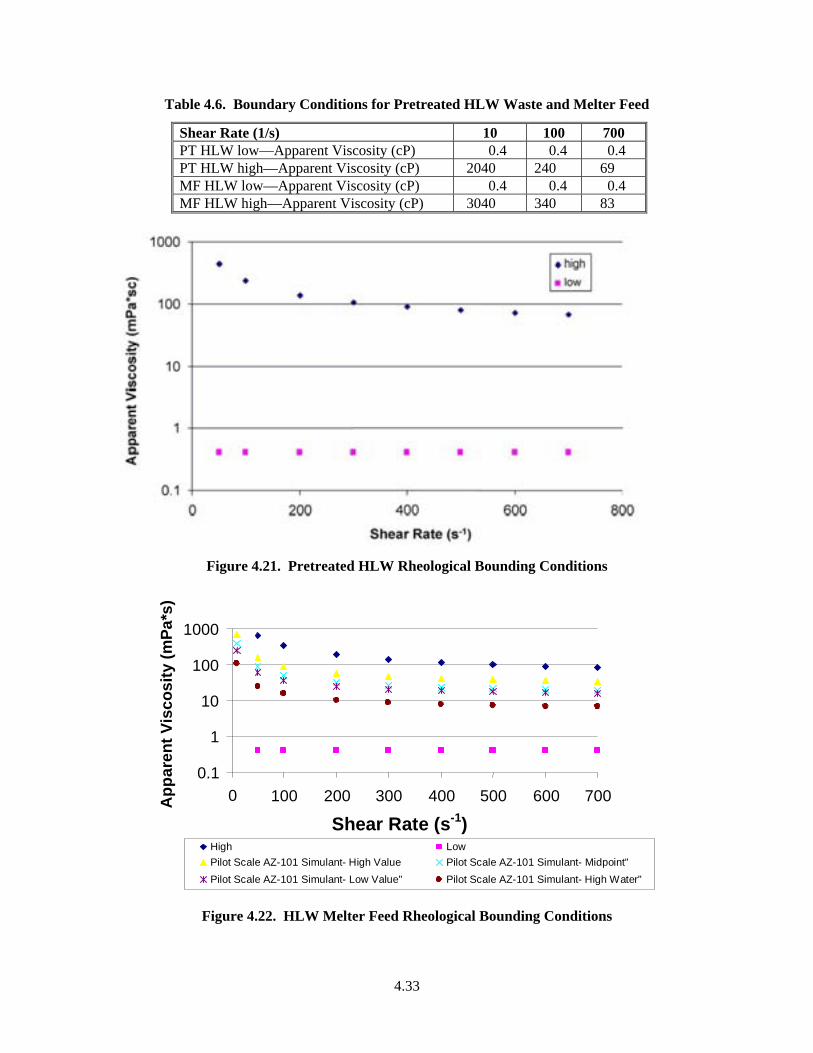
4.33
Table 4.6. Boundary Conditions for Pretreated HLW Waste and Melter Feed
Shear Rate (1/s) 10 100 700 PT HLW low—Apparent Viscosity (cP) 0.4 0.4 0.4 PT HLW high—Apparent Viscosity (cP) 2040 240 69 MF HLW low—Apparent Viscosity (cP) 0.4 0.4 0.4 MF HLW high—Apparent Viscosity (cP) 3040 340 83
Figure 4.21. Pretreated HLW Rheological Bounding Conditions
0.1
1
10
100
1000
0 100 200 300 400 500 600 700
Shear Rate (s-1)
App
aren
t Vis
cosi
ty (m
Pa*s
)
High LowPilot Scale AZ-101 Simulant- High Value Pilot Scale AZ-101 Simulant- Midpoint" Pilot Scale AZ-101 Simulant- Low Value" Pilot Scale AZ-101 Simulant- High Water"
Figure 4.22. HLW Melter Feed Rheological Bounding Conditions
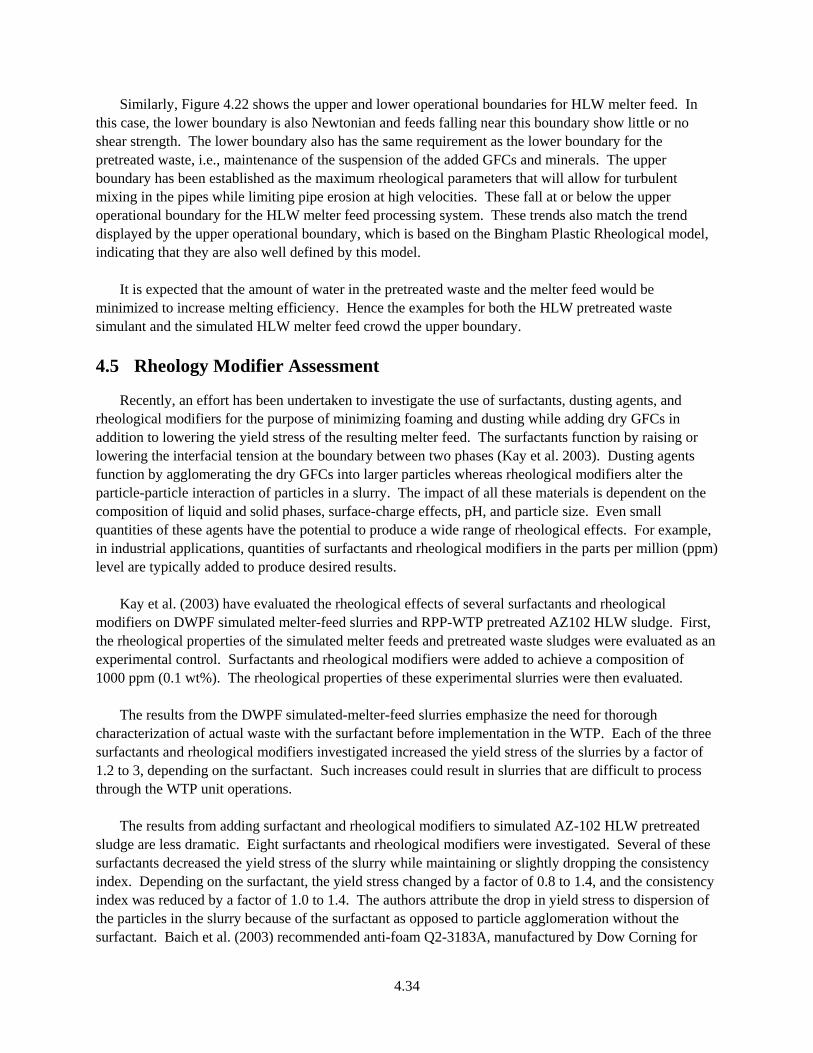
4.34
Similarly, Figure 4.22 shows the upper and lower operational boundaries for HLW melter feed. In this case, the lower boundary is also Newtonian and feeds falling near this boundary show little or no shear strength. The lower boundary also has the same requirement as the lower boundary for the pretreated waste, i.e., maintenance of the suspension of the added GFCs and minerals. The upper boundary has been established as the maximum rheological parameters that will allow for turbulent mixing in the pipes while limiting pipe erosion at high velocities. These fall at or below the upper operational boundary for the HLW melter feed processing system. These trends also match the trend displayed by the upper operational boundary, which is based on the Bingham Plastic Rheological model, indicating that they are also well defined by this model.
It is expected that the amount of water in the pretreated waste and the melter feed would be
minimized to increase melting efficiency. Hence the examples for both the HLW pretreated waste simulant and the simulated HLW melter feed crowd the upper boundary.
4.5 Rheology Modifier Assessment
Recently, an effort has been undertaken to investigate the use of surfactants, dusting agents, and rheological modifiers for the purpose of minimizing foaming and dusting while adding dry GFCs in addition to lowering the yield stress of the resulting melter feed. The surfactants function by raising or lowering the interfacial tension at the boundary between two phases (Kay et al. 2003). Dusting agents function by agglomerating the dry GFCs into larger particles whereas rheological modifiers alter the particle-particle interaction of particles in a slurry. The impact of all these materials is dependent on the composition of liquid and solid phases, surface-charge effects, pH, and particle size. Even small quantities of these agents have the potential to produce a wide range of rheological effects. For example, in industrial applications, quantities of surfactants and rheological modifiers in the parts per million (ppm) level are typically added to produce desired results.
Kay et al. (2003) have evaluated the rheological effects of several surfactants and rheological modifiers on DWPF simulated melter-feed slurries and RPP-WTP pretreated AZ102 HLW sludge. First, the rheological properties of the simulated melter feeds and pretreated waste sludges were evaluated as an experimental control. Surfactants and rheological modifiers were added to achieve a composition of 1000 ppm (0.1 wt%). The rheological properties of these experimental slurries were then evaluated.
The results from the DWPF simulated-melter-feed slurries emphasize the need for thorough characterization of actual waste with the surfactant before implementation in the WTP. Each of the three surfactants and rheological modifiers investigated increased the yield stress of the slurries by a factor of 1.2 to 3, depending on the surfactant. Such increases could result in slurries that are difficult to process through the WTP unit operations.
The results from adding surfactant and rheological modifiers to simulated AZ-102 HLW pretreated sludge are less dramatic. Eight surfactants and rheological modifiers were investigated. Several of these surfactants decreased the yield stress of the slurry while maintaining or slightly dropping the consistency index. Depending on the surfactant, the yield stress changed by a factor of 0.8 to 1.4, and the consistency index was reduced by a factor of 1.0 to 1.4. The authors attribute the drop in yield stress to dispersion of the particles in the slurry because of the surfactant as opposed to particle agglomeration without the surfactant. Baich et al. (2003) recommended anti-foam Q2-3183A, manufactured by Dow Corning for
4.35
use in the WTP, based on its chemical and radiolytic stability, and Hassan et al. (2004) have further provided an initial recommendation to add Q2-3183 to a concentration of 350 mg/L to the HLW pretreated sludge. Anti-foam Q2-3183A was not investigated by Kay et al. (2003). Russell et al. (2005) investigated the impact of the Q2-3183A anti-foam on gas holdup in kaolin-bentonite clay and simulated pretreated AZ102 HLW slurries and measured the rheology of each mixture, but rheologies of the same slurries without anti-foam were not measured. There has been no systematic study of the impact of the Q2-3183A anti-foam on rheology, and one is recommended.
Schumacher et al. (2003) have investigated several wetting agents for use in dry GFCs addition to minimize dusting. Of the 11 wetting agents considered, two (water and Van-Gel) were recommended for potential implementation in the WTP.
Adding water is expected to decrease the rheological properties of the resulting melter feeds. The quantities of water added to the GFCs are small, 2.5 wt% for LAW and 5 wt% for HLW. In this amount, adding water to the dry GFCs is not expected to be large enough to significantly lower throughput through the melters.
Van-Gel is the trade name of a bentonite product produced by RT Vanderbilt. Bentonite is a water-swelling clay that has dramatic rheological effects at low solids concentrations. At the concentrations investigated, 1.75 to 2.0 wt% of a 1.85-wt% Van-Gel solution, the effect on the resulting melter feed rheology is expected to be minimal, although bentonite is often used to impart a yield stress in industrial materials at higher concentrations. The rheological properties of the 1.85 wt% Van-Gel solution were small with a yield stress of 0.2 Pa and consistency of 3.0 cP. It should also be noted that the effect of the wetting agent on the rheology of the resulting melter feeds was not considered in this report.
Results from these experiments on simulated vitrification streams show that the use of surfactants, wetting agents, and rheological modifiers may produce beneficial results. However, some surfactants and rheological modifiers have been shown to increase the yield stress and consistency indices of simulated melter feeds and simulated HLW pretreated sludges. Order-of-magnitude changes in rheological properties are not unexpected (Kay et al. 2003), but for slurries with rheological properties near the upper bounding conditions, such increases can produce a slurry that is difficult to process. The rheological effects of adding surfactants, wetting agents, and rheological modifiers should be thoroughly investigated with actual waste samples for each tank before WTP implementation.
4.6 Submerged Bed Scrubber (SBS) Recycle Analysis
A significant issue that has not thoroughly been investigated with actual waste experiments is the recycling of secondary waste streams. The primary recycled secondary waste stream for the HLW vitrification facility consists of an SBS solution that is recycled to the pretreatment facility to an evaporator that is upstream from the crossflow ultrafiltration (CUF) unit (see Figure 4.23). The SBS consisted of a bubbler bed submerged in water. The melter feed offgas is passed through the bubbler bed and through the water. This unit operation is used to cool the melter offgas stream and collect particulates carried over from the melter.
In creating the lower bounding condition of 0.4 cP for the clear liquid (i.e., supernate) viscosity, a particle size of 105 μm was assumed. The particle size of the simulated SBS solution has been measured
4.36
and can be compared to this assumption. Results indicate that the D95 values for SBS fluids from six melter runs were as follows: 1) 24.50 μm, 2) 54.40 μm, 3) 26.39 μm, 4) 4.040 μm, 5) 9.571 μm, and 6) 13.86 μm (Matlack et al. 2002a). The largest particles were detected in the second set of tests and possessed a small quantity of particles (~0.5 vol%) in the 105-μm range. This particle size is consistent with the assumed maximum value 105 μm, and no significant change to the lower viscosity bound is warranted because of SBS particulates.
However, the particle sizes of the solids that precipitate during evaporation have not been measured.
These solids may precipitate on the SBS particulates, resulting in larger particles. Large particles that are created during solids precipitation as a result of evaporation of the SBS solution/pretreated LAW mixture may result in fast settling, difficult-to-process slurries. In addition, the solids that precipitated in the simulated mixtures of SBS recycle and pretreated LAW were sodium aluminosilicates. These solids have historically caused processing difficulties in DWPF (Josephs et al. 2003) and may pose a problem in the HLW side of the WTP. The effects of evaporated SBS recycle streams should be evaluated with actual waste experimentation to limit risk to the WTP.
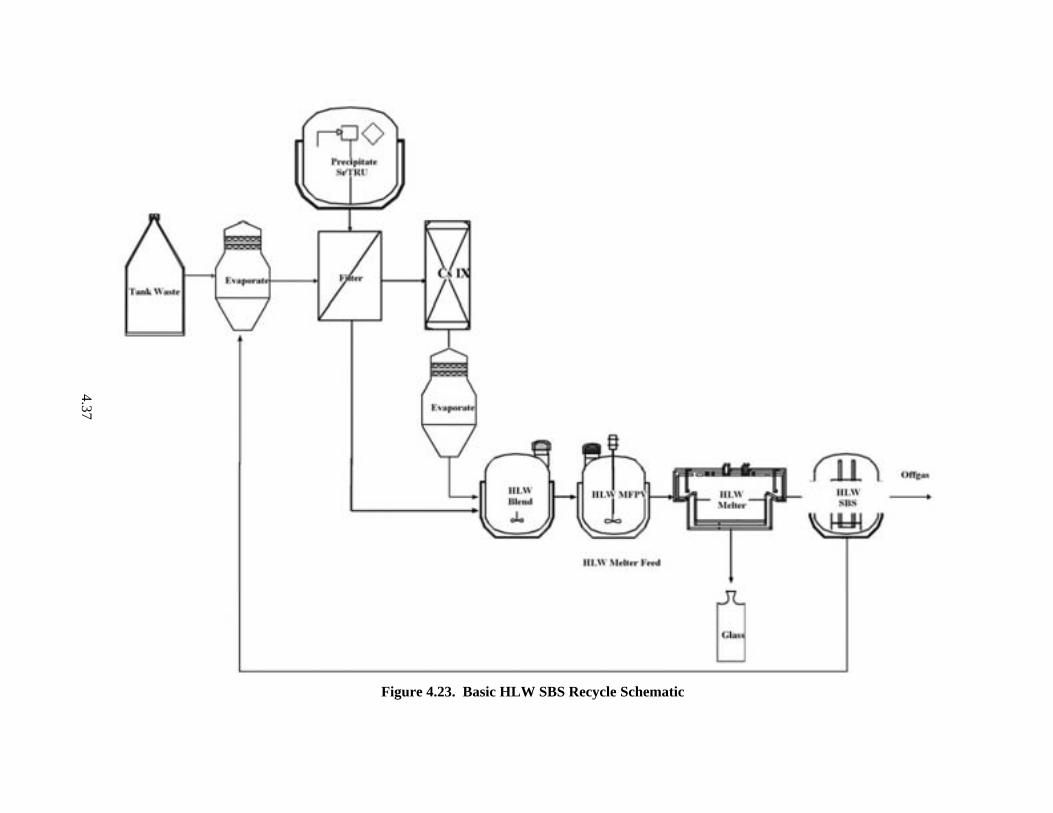
4.37
Figure 4.23. Basic HLW SBS Recycle Schematic
5.1
5.0 Quality Assurance Requirements
5.1 Application of RPP-WTP Quality Assurance Requirements
The PNWD Quality Assurance Program is based upon the requirements as defined in the U.S. Department of Energy (DOE) Order 414.1A, Quality Assurance and 10 CFR 830, Energy/Nuclear Safety Management, Subpart A—Quality Assurance Requirements (a.k.a. the Quality Rule). PNWD has chosen to implement the requirements of DOE Order 414.1A and 10 CFR 830, Subpart A by integrating them into the laboratory’s management systems and daily operating processes. The procedures necessary to implement the requirements are documented through PNWD’s Standards-Based Management System (SBMS).
PNWD implements the RPP-WTP quality requirements by performing work in accordance with the
PNWD Waste Treatment Plant Support Project quality assurance project plan (QAPjP) approved by the RPP-WTP Quality Assurance (QA) organization. This work was performed to the quality requirements of NQA-1-1989 Part I, Basic and Supplementary Requirements, and NQA-2a-1990, Part 2.7. These quality requirements are implemented through PNWD’s Waste Treatment Plant Support Project (WTPSP) Quality Assurance Requirements and Description Manual. The analytical requirements are implemented through WTPSP’s Statement of Work (WTPSP-SOW-005) with the Radiochemical Processing Laboratory (RPL) Analytical Service Operations (ASO).
A matrix that cross-references the NQA-1, NQA-2a, and Quality Assurance Requirements and
Description (QARD) requirements with the PNWD’s procedures for this work was given in Test Plan, TP-RPP-WTP-205, LAW and HLW Actual Waste and Simulant Coordination. It included justification for those requirements not implemented.
5.2 Conduct of Experimental and Analytical Work
Experiments that were not method-specific were performed in accordance with PNWD’s procedures QA-RPP-WTP-1101 “Scientific Investigations” and QA-RPP-WTP-1201 “Calibration Control System,” ensuring that sufficient data were taken with properly calibrated measuring and test equipment (M&TE) to obtain quality results.
As specified in Test Specification, 24590-WTP-TSP-RT-01-007, Rev. 0, BNI’s QAPjP,
PL-24590-QA00001, is not applicable because the work was not performed in support of environmental/regulatory testing, and the data will not be used as such.
5.3 Internal Data Verification and Validation
PNWD addresses internal verification and validation activities by conducting an independent technical review (ITR) of the final data report in accordance with PNWD’s Procedure QA-RPP-WTP-604. This review verifies that the reported results are traceable, that inferences and conclusions are soundly based, and that the reported work satisfies the Test Plan objectives. This review procedure is part of PNWD’s WTPSP Quality Assurance Requirements and Description Manual.
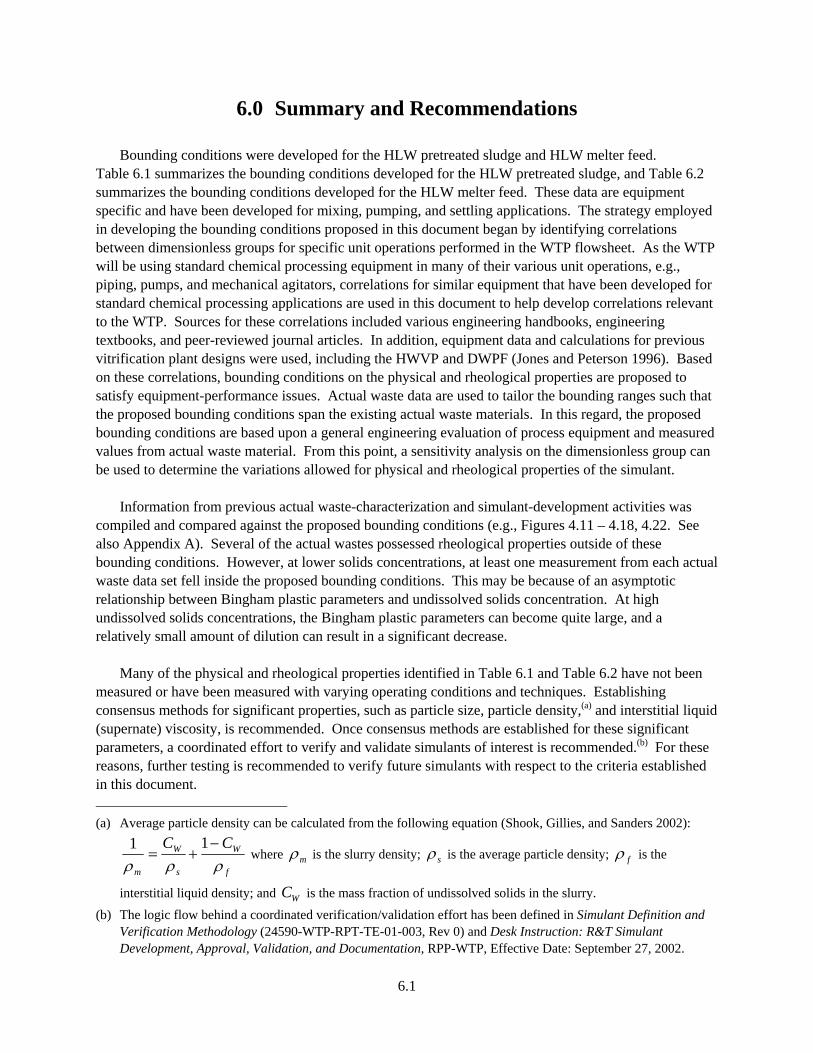
6.1
6.0 Summary and Recommendations
Bounding conditions were developed for the HLW pretreated sludge and HLW melter feed. Table 6.1 summarizes the bounding conditions developed for the HLW pretreated sludge, and Table 6.2 summarizes the bounding conditions developed for the HLW melter feed. These data are equipment specific and have been developed for mixing, pumping, and settling applications. The strategy employed in developing the bounding conditions proposed in this document began by identifying correlations between dimensionless groups for specific unit operations performed in the WTP flowsheet. As the WTP will be using standard chemical processing equipment in many of their various unit operations, e.g., piping, pumps, and mechanical agitators, correlations for similar equipment that have been developed for standard chemical processing applications are used in this document to help develop correlations relevant to the WTP. Sources for these correlations included various engineering handbooks, engineering textbooks, and peer-reviewed journal articles. In addition, equipment data and calculations for previous vitrification plant designs were used, including the HWVP and DWPF (Jones and Peterson 1996). Based on these correlations, bounding conditions on the physical and rheological properties are proposed to satisfy equipment-performance issues. Actual waste data are used to tailor the bounding ranges such that the proposed bounding conditions span the existing actual waste materials. In this regard, the proposed bounding conditions are based upon a general engineering evaluation of process equipment and measured values from actual waste material. From this point, a sensitivity analysis on the dimensionless group can be used to determine the variations allowed for physical and rheological properties of the simulant.
Information from previous actual waste-characterization and simulant-development activities was
compiled and compared against the proposed bounding conditions (e.g., Figures 4.11 – 4.18, 4.22. See also Appendix A). Several of the actual wastes possessed rheological properties outside of these bounding conditions. However, at lower solids concentrations, at least one measurement from each actual waste data set fell inside the proposed bounding conditions. This may be because of an asymptotic relationship between Bingham plastic parameters and undissolved solids concentration. At high undissolved solids concentrations, the Bingham plastic parameters can become quite large, and a relatively small amount of dilution can result in a significant decrease.
Many of the physical and rheological properties identified in Table 6.1 and Table 6.2 have not been
measured or have been measured with varying operating conditions and techniques. Establishing consensus methods for significant properties, such as particle size, particle density,(a) and interstitial liquid (supernate) viscosity, is recommended. Once consensus methods are established for these significant parameters, a coordinated effort to verify and validate simulants of interest is recommended.(b) For these reasons, further testing is recommended to verify future simulants with respect to the criteria established in this document. (a) Average particle density can be calculated from the following equation (Shook, Gillies, and Sanders 2002):
f
W
s
W
m
CCρρρ−
+=11
where mρ is the slurry density; sρ is the average particle density; fρ is the
interstitial liquid density; and WC is the mass fraction of undissolved solids in the slurry. (b) The logic flow behind a coordinated verification/validation effort has been defined in Simulant Definition and
Verification Methodology (24590-WTP-RPT-TE-01-003, Rev 0) and Desk Instruction: R&T Simulant Development, Approval, Validation, and Documentation, RPP-WTP, Effective Date: September 27, 2002.
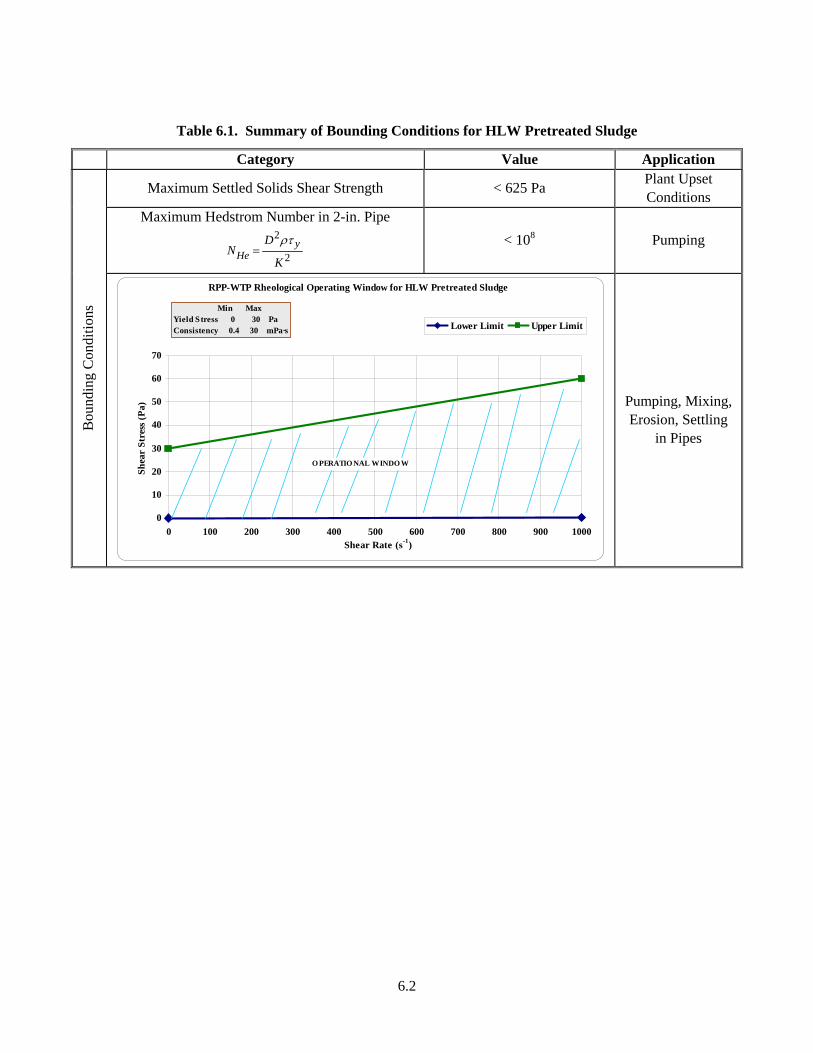
6.2
Table 6.1. Summary of Bounding Conditions for HLW Pretreated Sludge
Category Value Application
Maximum Settled Solids Shear Strength < 625 Pa Plant Upset Conditions
Maximum Hedstrom Number in 2-in. Pipe
2
2
K
DN y
Heρτ
= < 108 Pumping
Bou
ndin
g C
ondi
tions
0
10
20
30
40
50
60
70
0 100 200 300 400 500 600 700 800 900 1000Shear Rate (s-1)
Shea
r St
ress
(Pa)
Lower Limit Upper Limit
O PERATIO NAL WINDO W
Min MaxYield Stress 0 30 PaConsistency 0.4 30 mPa·s
RPP-WTP Rheological Operating Window for HLW Pretreated Sludge
Pumping, Mixing, Erosion, Settling
in Pipes
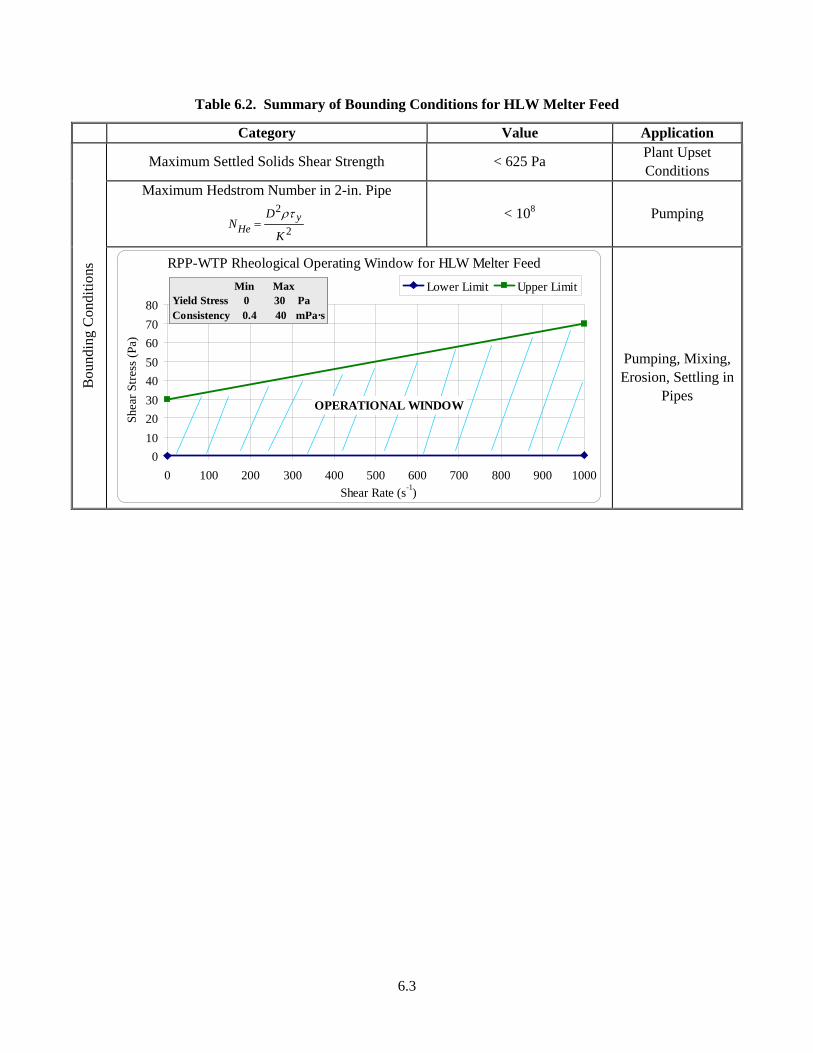
6.3
Table 6.2. Summary of Bounding Conditions for HLW Melter Feed
Category Value Application
Maximum Settled Solids Shear Strength < 625 Pa Plant Upset Conditions
Maximum Hedstrom Number in 2-in. Pipe
2
2
K
DN y
Heρτ
= < 108 Pumping
Bou
ndin
g C
ondi
tions
01020304050607080
0 100 200 300 400 500 600 700 800 900 1000Shear Rate (s-1)
Shea
r Stre
ss (P
a)
Lower Limit Upper Limit
OPERATIONAL WINDOW
Min MaxYield Stress 0 30 PaConsistency 0.4 40 mPa·s
RPP-WTP Rheological Operating Window for HLW Melter Feed
Pumping, Mixing, Erosion, Settling in
Pipes
7.1
7.0 References
Atiemo-Obeng VA, P Armenante, and WR Penney. 2003. “Solid Liquid Mixing.” Handbook of Industrial Mixing, Ch. 10, pp. 543–582. EL Paul, SM Kresta, and VA Atiemo-Obeng (eds). Wiley and Sons, NY. Baich, MA, ME Stone, TL White, TB Calloway and JC George. 2003. Waste Treatment Plant LAW Evaporation: Antifoam Performance. WSRC-TR-2003-00216, Westinghouse Savannah River Company, Savannah River Site, Aiken, SC.
Bamberger JA, PA Meyer, JR Bontha, CW Enderlin, DA Wilson, AP Poloski, JA Fort, ST Yokuda, HD Smith, F Nigl, MA Friedrich, DE Kurath, GL Smith, JM Bates, and MA Gerber. 2005. Technical Basis for Testing Scaled Pulse Jet Mixing Systems for Non-Newtonian Slurries. PNWD-3551, Battelle—Pacific Northwest Division, Richland, WA. (24590-101-TSA-W0000004-114-00016, Rev. 00A)
Bontha JR, and GR Golcar (Battelle), N Hannigan (BNFL, Inc.). 2000. Demonstration and Optimization of BNFL’s Pulsed Jet Mixing and RFD Sampling Systems Performance Using NCAW Simulant. PNWD-3054, Battelle—Pacific Northwest Division, Richland, WA.
Bredt PR, LK Jagoda, and DE Rinehart. 2001. Rheological Studies on Pretreated Feed and Melter Feed from C-104 and AZ-102. PNNL-13359, Pacific Northwest National Laboratory, Richland, WA.
Brooks KP, PR Bredt, SK Cooley, GR Golcar, LK Jagoda, KG Rappe, and MW Urie. 2000a. Characterization, Washing, Leaching, and Filtration of AZ-102 Sludge. PNWD-3045, Battelle—Pacific Northwest Division, Richland, WA.
Brooks KP, PR Bredt, GR Golcar, SA Hartley, LK Jagoda, KG Rappe, and MW Urie. 2000b. Characterization, Washing, Leaching, and Filtration of C-104 Sludge. PNWD-3024, Battelle—Pacific Northwest Division, Richland, WA.
Buck EC. 2003. Identification of Washed Solids from Hanford Tanks 241-AN-102 and 241-AZ-101 with X-ray Diffraction, Scanning Electron Microscopy, and Light-Scattering Particle Analysis. PNWD-3300, Battelle—Pacific Northwest Division, Richland, WA. (24590-101-TSA-W0000004-134-01, Rev. 00C)
Callaway WS, and GA Cooke. 2004. Distribution of Plutonium-Rich Particles in Tank 241-SY-102 Sludge. CH2M Hill Doc. No. CH2M-0400872, CH2MHill Hanford Group, Inc., Richland, WA.
Chang C, DG Nguyen, and HP Ronningsen. 1999. “Isothermal start-up of pipeline transporting waxy crude oil.” J. Non-Newtonian Fluid Mech. 87:127-154.
Dabak T, and O Yucel. 1987. “Modeling of the concentration and particle size distribution effects on the rheology of highly concentrated suspensions.” Powder Tech. 52:193-206.
Desouky SE, and MN Al-Awad. 1998. “A new laminar-to-turbulent transition criterion for yield-pseudoplastic fluids.” J. Petro. Sci. Eng. 19:171-176.
Dzuy NQ and DV Boger. 1985. Direct Yield Stress Measurement with the Vane Method. J. Rheology 29:335-347.
7.2
Eibling RE, and C Nash. 2001. Hanford Waste Simulants Created to Support the Research and Development on the River Protection Project – Waste Treatment Plant. WSRC-TR-2000-00338, Westinghouse Savannah River Company, Aiken, SC.
Eibling RE, RF Schumacher, and EK Hansen. 2003. Development of Simulants to Support Mixing Tests for High Level Waste and Low Activity Waste. WSRC-TR 2003-00220, Rev. 0, Westinghouse Savannah River Company, Savannah River Site, Aiken, SC. (SCT-M0SRLE60-00-193-02, Rev. 00A)
Enderlin CW, MG Dodson, F Nigl, J Bontha, and JM Bates. 2003. Results of Small-Scale Particle Cloud Tests and Non-Newtonian Fluid Cavern Tests. PNWD-3360, Battelle—Pacific Northwest Division, Richland, WA. (24590-101-TSA-W0000004-72-08, Rev 00B) Geeting, J.G.H., R. T. Hallen, L. K. Jagoda, A. P. Poloski, R. D. Scheele, and D. R. Weier. 2003. Filtration, Washing, and Caustic Leaching of Hanford Tank AZ-101 Sludge. PNWD-3206, Rev 1. (WTP-RPT-043, Rev 1) Battelle—Pacific Northwest Division, Richland, WA. (24590-101-TSA-W000-0004-87-09, Rev 00C)
Hanks RW, and BH Dadia. 1971. “Theoretical Analysis of the Turbulent Flow of Non-Newtonian Slurries in Pipes.” AIChE Journal 17(3):554-557.
Hanks RW. 1978. “Low Reynolds Number Turbulent Pipeline Flow of Pseudohomogeneous Slurries.” Proc. 5th Hydrotransport 5 : papers presented at the fifth International Conference on the Hydraulic Transport of Solids in Pipes; held at Hanover; Federal Republic (sic) of Germany; May 8th to 11th; 1978.
Hansen EK, and C Crawford. 2005. Hanford HLW AY102/C106 Pretreated Sludge Physical and Chemical Properties Prior to Melter Feed Processing (U). WSRC-TR-2004-00394, Rev. 0, SRT-RPP-2004-00061, Rev. 0, Savannah River National Laboratory, Aiken, SC. (WTP Project No. SCT-M0SRLE60-00-193-00004 Rev. 00A)
Hansen EK, and RE Eibling. 2001. Status Report for Mixing Envelope D Sludge with LAW Intermediate Products with and without Glass Formers. SRT-RPP-2001-00008, Savannah River National Laboratory, Aiken, SC.
Hansen EK, and RF Schumacher. 2003. Characterization of HLW and LAW Glass Formers – Final Report. SRT-RPP-2002-00146, Rev. 1, Savannah River National Laboratory, Aiken, SC.
Hansen EK, and V Williams. 2005. Physical Characterization of Vitreous State Laboratory AY102/C106 and AZ102 High Level Waste Melter Feed Simulants (u). WSRC-TR-2005-00035, Rev. 0, SRNL-RPP-2005-00003, Rev. 0, Westinghouse Savannah River Company, Aiken, SC. (SCT-M0SRLE60-00-211-00001 Rev. 00A)
Hansen EK, RE Eibling, and TB Calloway, Jr. 2001. Mixing Envelope D Sludge with LAW Intermediate Products with and without Glass Formers. WSRC-TR-2001-00203, Rev. 0, Westinghouse Savannah River Company, Aiken, SC.
Hassan, NM, TM Jones, WE Daniel, EK Hansen, RE Eibling and TB Calloway. 2004. Evaluation of Foaming / Antifoaming in WTP Tanks Equipped with Pulse Jet Mixers and Air Spargers. WSRC-TR-2004-00387, Westinghouse Savannah River Company, Savannah River Site, Aiken, SC.
7.3
Hrma, P., J. V. Crum, D. R. Bates, P. R. Bredt, L. R. Greenwood, and H. D. Smith. 2004. Vitrification and Product Testing of AZ-101 Pretreated High-Level Waste Envelope D Glass. (WTP-RPT-116, Rev. 0) PNWD-3499, Battelle—Pacific Northwest Division, Richland, WA. (24590-101-TSA-W000-0004-150-00004, REV 00A)
Jewett JR, and L Jensen. 2000. Assessment of Available Particle Size Data to Support an Analysis of the Waste Feed Delivery System Transfer System. RPP-6427, Rev. 0, CH2M Hill Hanford Group, Inc., Richland, WA.
Jewett JR, DA Reynolds, SD Estey, NW Kirch, and Y Onishi. 2002. Values of Particle Sizes, Particle Density, and Slurry Viscosity to Use in Waste Feed Delivery Transfer System Analysis. RPP-9805, CH2M Hill Hanford Group, Inc., Richland, WA.
Johnson SB, GV Franks, PJ Scales, and TW Healy, 1999. “The Binding of Monovalent Electrolyte Ions on -Alumina. II. The Shear Yield Stress of Concentrated Suspensions.” Langmuir 15(8):2844-2853.
Jones EO, and ME Peterson. 1996. Draft Letter Report-Evaluation of the Adaptability of the DWPF Feed Preparation System to the HWVP. PNNL-11063, Pacific Northwest National Laboratory, Richland, WA.
Josephs JE, ME Stone, TB Calloway, RE Eibling, CD Barnes, and EK Hansen. 2003. Treated LAW feed evaporation: physical properties and solubility determination. WSRC-TR-2003-00119, Rev. 0, Westinghouse Savannah River Company, Aiken, SC. (SCT-M0SRLE60-00-184-01, Rev. 00B; -184-01 Rev. 00C (cleared).)
Kay ED, TD Calloway, DC Koopman, RL Brigmon, and RL Eibling. 2003. Rheological Modifiers for Radioactive Waste Slurries. WSRC-MS-2003-00136, Rev. 0, Westinghouse Savannah River Company, Aiken, SC.
Kot WK, H Gan, and IL Pegg. 2000. Physical and Rheological Properties of Waste Simulants and Melter Feeds for RPP-WTP HLW Vitrification. VSL-00R2520-1, Vitreous States Laboratory, The Catholic University of America, Washington DC.
Kot WK, and IL Pegg. 2001. Final Report: Glass Formulation and Testing with RPP-WTP HLW Simulants. VSL-01R2540-2, Vitreous State Laboratory, The Catholic University of America, Washington, DC. (24590-101-TSA-W0000010-06-04A)
Kot, WK, K Klatt, and IL Pegg. 2003. Glass Formulation to Support Melter Runs with HLW Simulants. VSL-03R3760-2, Vitreous State Laboratory, The Catholic University of America, Washington, DC. (24590-101-TSA-W000-0009-82-02, REV00B)
Landel R, BG Moser, and AJ Bauman. 1965. 4th International Congress on Rheology (1963) Proceedings Part 2, p 663, Interscience Publishers, NY.
Matlack KS, WK Kot, and IL Pegg. 2000a. Screening Tests on DuraMelter™ 10 with C-106/AY-102 Simulant in Support of DuraMelter™ 1000 Throughput Tests. VSL-00R2501-2, Rev. 0, Vitreous States Laboratory, The Catholic University of America, Washington DC.
7.4
Matlack KS, WK Kot, F Perez-Cardenas, and IL Pegg. 2000b. Tests on DuraMelter™ 10 with AZ-101 Simulant in Support of DuraMelter™ 1000 Throughput Tests. VSL-00R2501-1, Rev. 0, Vitreous States Laboratory, The Catholic University of America, Washington DC.
Matlack KS, WK Kot, F Perez-Cardenas, and IL Pegg. 2000c. Determination of the Processing Rate of RPP-WTP Simulants Using a DuraMelter™ 1000 Vitrification System. VSL-00R2590-1, Rev. 0, Vitreous States Laboratory, The Catholic University of America, Washington DC.
Matlack KS, WK Kot, T Bardakci, W Gong, NA D’Angelo, NA Schatz, and IL Pegg. 2002a. Tests on the DuraMelter 1200 HLW Pilot Melter System Using AZ-101 HLW Simulants. VSL-02R0100-2 Rev. 1, Vitreous States Laboratory, The Catholic University of America, Washington DC.
Matlack KS, WK Kot, and IL Pegg. 2002b. Melter Tests with AZ-101 HLW Simulant Using a DuraMelter 100 Vitrification System. VSL-01R10NO-1, Rev.1, Vitreous State Laboratory, The Catholic University of America, Washington, DC. (24590-101-TSA-W000-0009-48-01, Rev. 00C)
Matlack KS, W Gong, T Bardakci, NA D’Angelo, WK Kot, and IL Pegg. 2003a. Final Report Integrated DM1200 Melter Testing of HLW AZ-102 Composition Using Bubblers. VSL-03R3800-2, Vitreous State Laboratory, The Catholic University of America, Washington, DC. (24590-101-TSA-W000-0009-144-02, Rev. 00B)
Matlack KS, W Gong, T Bardakci, NA D’Angelo, WK Kot, and IL Pegg. 2003b. Final Report Integrated DM1200 Melter Testing of HLW AZ-101 and C-106/AY-102 Composition Using Bubblers. VSL-03R3800-1. Vitreous State Laboratory, The Catholic University of America, Washington, DC. (24590-101-TSA-W000-0009-144-01, Rev. 00B)
Matlack KS, WK Kot, T Bardakci, W Gong, NA D’Angelo, TR Schatz, and IL Pegg. 2003c. Tests on the DuraMelter 1200 HLW Pilot Melter System Using AZ-101HLW Simulants. VSL-02R0100-2, Rev.1, Vitreous State Laboratory, The Catholic University of America, Washington, DC.
Matlack KS, W Gong, T Bardakci, NA D’Angelo, WK Kot, and IL Pegg. 2003d. DM1200 Tests with C-104/AY-101 HLW Simulants. VSL-03R3800-3, Vitreous State Laboratory, The Catholic University of America, Washington, DC. (24590-101-TSA-W000-0009-98-07, Rev. 00B)
Matlack KS, W Gong, T Bardakci, NA D’Angelo, WK Kot, and IL Pegg. 2003e. Final Report DM1200 Tests with AZ-101 HLW Simulants. VSL-03R3800-4, Vitreous State Laboratory, The Catholic University of America, Washington, DC. (24590-101-TSA-W000-0009-144-00005, Rev. 00A)
Matlack KS, W Gong, T Bardakci, NA D’Angelo, W Lutze, PM Bizot, RA Callow, M Brandys, WK Kot and IL Pegg. 2004a. Final Report DM1200 Melter Testing of Redox Effects using HLW AZ-101 and C-106/AY-102 Simulants. VSL-04R4800-1, Vitreous State Laboratory, The Catholic University of America, Washington, DC. (24590-101-TSA-W000-000911800009, Rev. 00A)
Matlack KS, W Gong, T Bardakci, NA D’Angelo, W Lutze, RA Callow, M Brandys, WK Kot and IL Pegg. 2004b. Final Report: Integrated DM1200 Melter Testing of Bubbler Configurations Using HLW AZ-101 Simulants. VSL-04R4800-4, Vitreous State Laboratory, The Catholic University of America, Washington, DC. (24590-101-TSA-W000-0009-158-00001, Rev. 00A)
7.5
Matlack KS, W Gong, T Bardakci, NA D’Angelo, M Brandys, WK Kot, and IL Pegg. 2005. Final Report Integrated DM1200 Melter Testing using AZ-101 and C-106/AY-102 HLW Simulants: HLW Simulant Verification. VSL-05R5800-1, Vitreous State Laboratory, The Catholic University of America, Washington, DC.
Morrey EV, JM Tingey, and ML Elliott. 1996. Comparison of Simulants to Actual Neutralized Current Acid Waste: Process and Product Testing of Three NCAW Core Samples from Tanks 101-AZ and 102-AZ. PNNL-11025, Pacific Northwest National Laboratory, Richland, WA.
Perry RH, and DW Green. 1984. Perry’s Chemical Engineers’ Handbook, 6th Ed. McGraw Hill, NY.
Poloski AP, PR Bredt, JW Chenault, and RG Swoboda. 2003a. Rheological and Physical Properties of AZ 101 HLW Pretreated Sludge and Melter Feed. PNWD-3366, Battelle—Pacific Northwest Division, Richland, WA. (24590-101-TSA-W000-0004-144-01, Rev. 00B)
Poloski AP, PA Meyer, LK Jagoda, and PR Hrma. 2004. Non-Newtonian Slurry Simulant Development and Selection for Pulse Jet Mixer Testing. PNWD-3495, Battelle—Pacific Northwest Division, Richland, WA. (24590-101-TSA-W000-0004-99-00010, REV00A; -99-00010, Rev. 00B)
Poloski AP, ST Arm, JA Bamberger, B Barnett, R Brown, BJ Cook, CW Enderlin, MS Fountain, M Friedrich, BG Fritz, RP Mueller, F Nigl, Y Onishi, LA Schienbein, LA Snow, S Tzemos, M White, and JA Vucelick. 2005. Technical Basis for Scaling of Air Sparging Systems for Mixing in Non-Newtonian Slurries. PNWD-3541, Battelle—Pacific Northwest Division, Richland, WA. (24590-101-TSA-W000-0004-160-00001 Rev. 00A) Rapko BM, DL Blanchard, NG Colton, AR Felmy, J Liu, and GJ Lumetta. 1996. The Chemistry of Sludge Washing and Caustic Leaching Processes for Selected Hanford Wastes. PNNL-11089, Pacific Northwest National Laboratory, Richland, WA.
Rosencrance SW, WD King, and C Nash. 2000. Physical Characterization for Hanford Tank Waste Samples AN-102, AN-103, and AZ-102. WSRC-TR-2000-00352, Westinghouse Savannah River Company, Aiken, SC. (SCT-M0SRLE60-00-83-01A)
Russell RL, CW Stewart, SD Rassat, CD Johnson, ST Arm, PA Meyer, MS Fountain, CE Guzman-Leong, and BK Hatchell. 2005. Final Report: Gas Retention and Release in Hybrid Pulse Jet Mixed Tanks Containing Non-Newtonian Waste Simulants. PNWD-3552 Rev. 1, Battelle—Pacific Northwest Division, Richland, WA. (24590-101-TSA-W000-0004-153-00002 Rev. 00B)
Schlosser RL, Y Onishi, G Piot, MR Poirier, DA Reynolds, and EJ Wasp. 2002. Slurry Transfer Expert Panel Final Report. RPP-13651, CH2M Hill Hanford Group, Inc., Richland, WA.
Schumacher RW, CL Crawford, DM Ferrara, and NE Bibler. 2002. Final Report for Crucible Scale Vitrification of Waste Envelope D (C-106). WSRC-TR-2001-00252 (SRT-RPP-2001-00068), Westinghouse Savannah River Company, Aiken, SC.
Schumacher RW, EK Hansen, TM Jones, and JE Josephs. 2003. Interim Report – Evaluation of Wetting Agents to Mitigate Dusting of Glass Forming Chemicals During Delivery to the Melter Feed Preparation Vessel. WSRC-TR-2003-00209 Rev. 0, Westinghouse Savannah River Company, Aiken, SC. (SCT-M0SRLE60-00-187-02, REV00B; -187-02 Rev. 00C(cleared))
7.6
Sherwood, David J. 2003. Execution Strategy for Research & Technology Department Pretreatment Integration Program. Issued CCN 066843 by Waste Treatment Project (WTP) Project Document Control.
Shook CA, RG Gillies, and RS Sanders. 2002. Pipeline Hydrotransport with Applications in the Oil Sand Industry. Saskatchewan Research Council.
Slatter PT. 1997. “The Rheological Characterization of Sludges.” Wat. Sci. Tech. 36(11):9-18.
Smith GL, and K Prindiville. 2002. Guidelines for Performing Chemical, Physical, and Rheological Properties Measurements. 24590-WTP-GPG-RTD-001, Revision 0, Bechtel National, Inc., Richland, WA.
Steffe JF. 1996. Rheological Methods in Food Process Engineering, 2nd Edition. Freeman Press, New York, NY.
Stone ME, TB Calloway, EK Hansen, and FF Fondeur. 2003. Waste Feed Evaporation: Physical Properties and Solubility Determination. WSRC-TR-2003-00212, Rev. 0, SRT-RPP-2003-0094, Rev. 0, Westinghouse Savannah River Company, Aiken, SC. (SCT-M0SRLE60-00-154-06, Rev. 00B; -154-06 Rev. 00C (cleared))
Tracey, E., P. A. Smith, and E. V. Morrey. 1996. Rheology of Concentrated, Heterogeneous Slurries Containing > 1M Electrolyte – A Case Study in Nuclear Waste Suspensions. Journal of Nuclear Materials 230: 19-35.
Vanoni VA, ed. 1975. Sedimentation Engineering. American Society of Civil Engineers, New York, NY.
Zamecnik JR, PR Burket, and RE Eibling. 2004. Tank 241-AY-102 Simulant Development, Ultrafiltration, and Washing. WSRC-TR-2003-00547, Rev. 0, SRT-RPP-2003-00240, Rev. 0, Westinghouse Savannah River Company, Aiken, SC. (SCT-M0SRLE60-00-110-00023, Rev. 00A)
Zwietering TN. 1958. “Suspending of Solid Particles in Liquids.” Chem. Eng. Sci. 8:244.
Appendix A
Chemical, Rheological, and Physical Properties Database(a)
(a) Note that Appendices A and B contain data from previous reports on the physical, chemical, and rheological
properties of actual and simulated WTP vitrification streams. The data in Appendix A are contained in a spreadsheet that is broken into four worksheets: 1) “Envelope D Waste Composition” contains information on the chemical and radiochemical composition of the materials, 2) “Envelope D Melter Feed Preparation” contains information on the melter-feed composition and mixing of the melter feed materials, 3) “Envelope D Waste and Melter Feed Physical Property Data” contains information on the physical properties of the materials, 4) “Envelope D Waste and Melter Feed Rheological Property Data” contains information on the rheological properties of the materials. Note that the sample number is given in the first row of each page of the table to allow the reader to follow the sample data from page to page. A reference for each sample is given on the first page of each the four worksheets of Appendix A. In some cases calculations and approximations of the reported values from the source documents were performed to transform these data to a common reporting basis. If performed, it is described in the reference row of the tables. Entries in the first column of the tables apply to all the other columns of the table. Data from one section of Appendix A relates to data in other sections of Appendix A through the references given in the third row of each section (A.1, A.2, etc). Because of the large amount of data in the source documents, the summarized data in Appendices A and B may not be comprehensive, though that was the original intent. Blank spaces in these tables indicate that relevant data was not identified by the author in the cited reports.
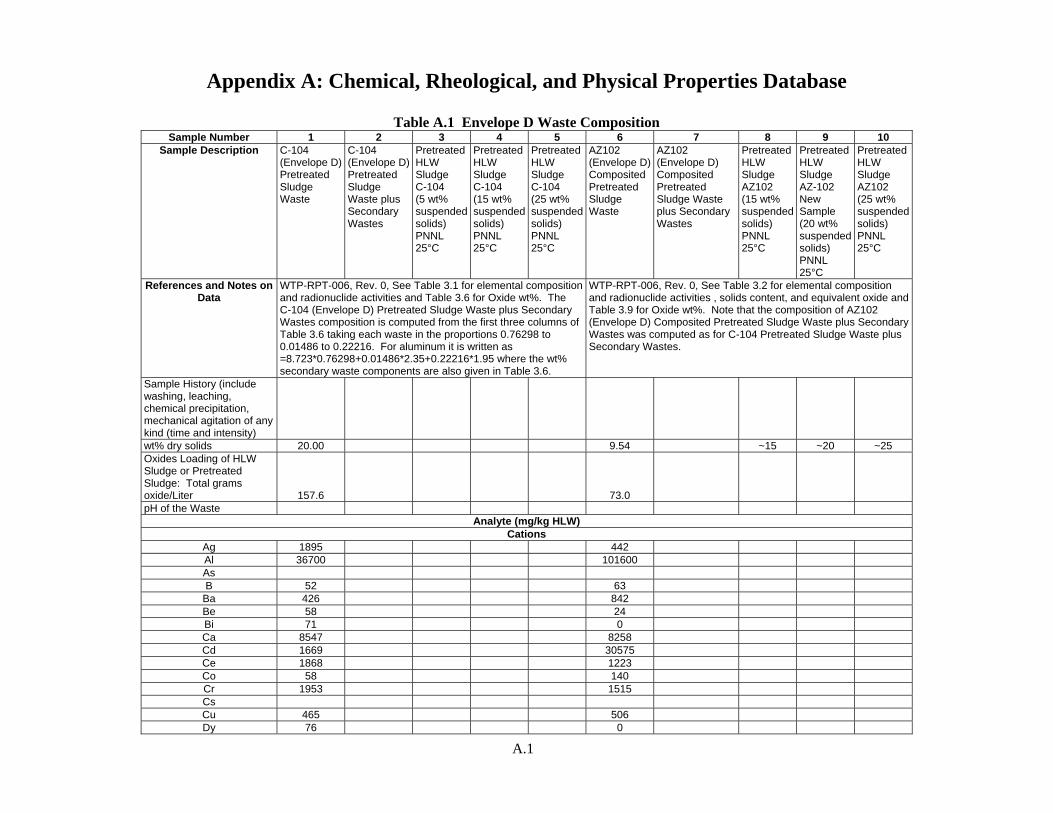
A.1
Appendix A: Chemical, Rheological, and Physical Properties Database
Table A.1 Envelope D Waste Composition Sample Number 1 2 3 4 5 6 7 8 9 10
Sample Description C-104 (Envelope D) Pretreated Sludge Waste
C-104 (Envelope D) Pretreated Sludge Waste plus Secondary Wastes
Pretreated HLW Sludge C-104 (5 wt% suspended solids) PNNL 25°C
Pretreated HLW Sludge C-104 (15 wt% suspended solids) PNNL 25°C
Pretreated HLW Sludge C-104 (25 wt% suspended solids) PNNL 25°C
AZ102 (Envelope D) Composited Pretreated Sludge Waste
AZ102 (Envelope D) Composited Pretreated Sludge Waste plus Secondary Wastes
Pretreated HLW Sludge AZ102 (15 wt% suspended solids) PNNL 25°C
Pretreated HLW Sludge AZ-102 New Sample (20 wt% suspended solids) PNNL 25°C
Pretreated HLW Sludge AZ102 (25 wt% suspended solids) PNNL 25°C
References and Notes on Data
WTP-RPT-006, Rev. 0, See Table 3.1 for elemental composition and radionuclide activities and Table 3.6 for Oxide wt%. The C-104 (Envelope D) Pretreated Sludge Waste plus Secondary Wastes composition is computed from the first three columns of Table 3.6 taking each waste in the proportions 0.76298 to 0.01486 to 0.22216. For aluminum it is written as =8.723*0.76298+0.01486*2.35+0.22216*1.95 where the wt% secondary waste components are also given in Table 3.6.
WTP-RPT-006, Rev. 0, See Table 3.2 for elemental composition and radionuclide activities , solids content, and equivalent oxide and Table 3.9 for Oxide wt%. Note that the composition of AZ102 (Envelope D) Composited Pretreated Sludge Waste plus Secondary Wastes was computed as for C-104 Pretreated Sludge Waste plus Secondary Wastes.
Sample History (include washing, leaching, chemical precipitation, mechanical agitation of any kind (time and intensity) wt% dry solids 20.00 9.54 ~15 ~20 ~25 Oxides Loading of HLW Sludge or Pretreated Sludge: Total grams oxide/Liter 157.6 73.0 pH of the Waste
Analyte (mg/kg HLW) Cations
Ag 1895 442 Al 36700 101600 As B 52 63
Ba 426 842 Be 58 24 Bi 71 0 Ca 8547 8258 Cd 1669 30575 Ce 1868 1223 Co 58 140 Cr 1953 1515 Cs Cu 465 506 Dy 76 0
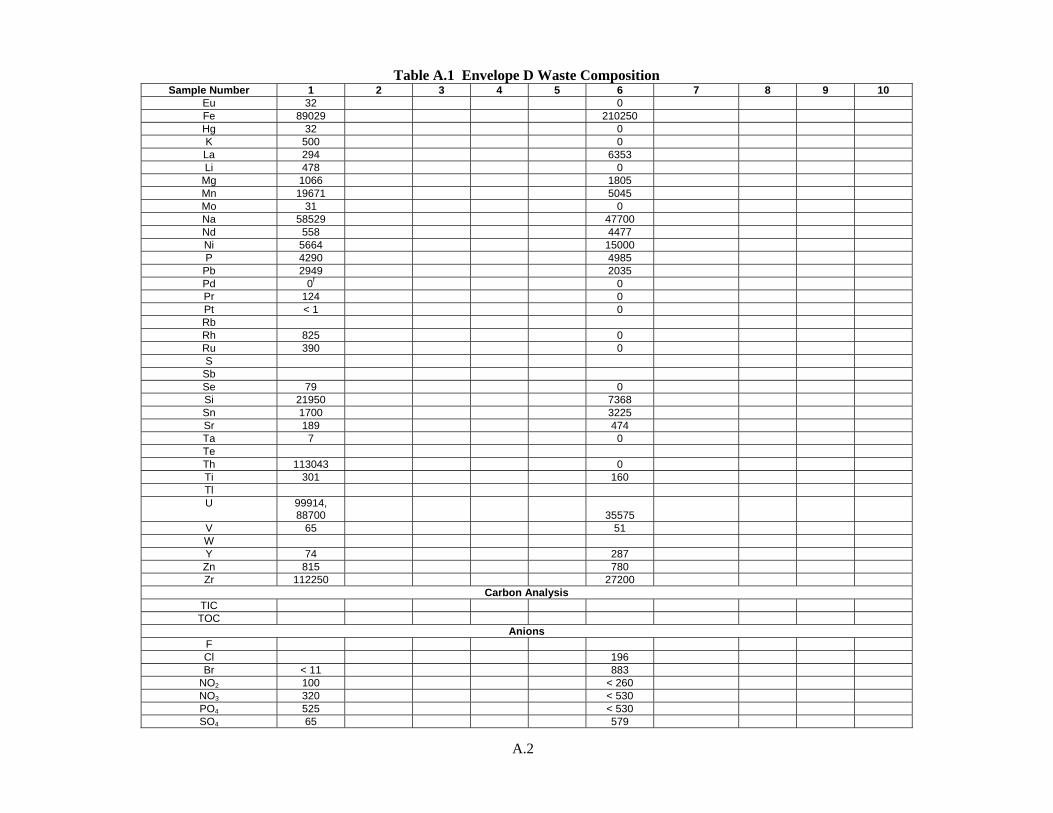
A.2
Table A.1 Envelope D Waste Composition Sample Number 1 2 3 4 5 6 7 8 9 10
Eu 32 0 Fe 89029 210250 Hg 32 0 K 500 0 La 294 6353 Li 478 0
Mg 1066 1805 Mn 19671 5045 Mo 31 0 Na 58529 47700 Nd 558 4477 Ni 5664 15000 P 4290 4985
Pb 2949 2035 Pd 0f 0 Pr 124 0 Pt < 1 0 Rb Rh 825 0 Ru 390 0 S
Sb Se 79 0 Si 21950 7368 Sn 1700 3225 Sr 189 474 Ta 7 0 Te Th 113043 0 Ti 301 160 Tl U 99914,
88700 35575 V 65 51 W Y 74 287 Zn 815 780 Zr 112250 27200
Carbon Analysis TIC TOC
Anions F Cl 196 Br < 11 883
NO2 100 < 260 NO3 320 < 530 PO4 525 < 530 SO4 65 579
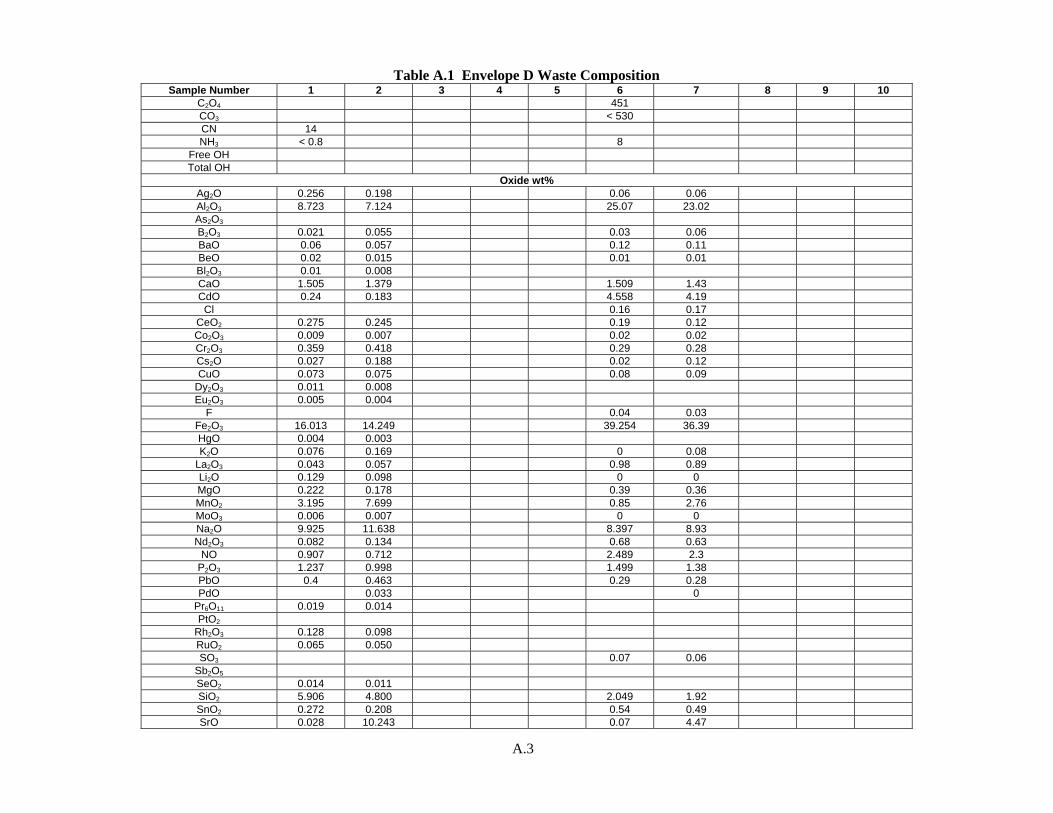
A.3
Table A.1 Envelope D Waste Composition Sample Number 1 2 3 4 5 6 7 8 9 10
C2O4 451 CO3 < 530 CN 14 NH3 < 0.8 8
Free OH Total OH
Oxide wt% Ag2O 0.256 0.198 0.06 0.06 Al2O3 8.723 7.124 25.07 23.02 As2O3 B2O3 0.021 0.055 0.03 0.06 BaO 0.06 0.057 0.12 0.11 BeO 0.02 0.015 0.01 0.01 Bl2O3 0.01 0.008 CaO 1.505 1.379 1.509 1.43 CdO 0.24 0.183 4.558 4.19 Cl 0.16 0.17
CeO2 0.275 0.245 0.19 0.12 Co2O3 0.009 0.007 0.02 0.02 Cr2O3 0.359 0.418 0.29 0.28 Cs2O 0.027 0.188 0.02 0.12 CuO 0.073 0.075 0.08 0.09
Dy2O3 0.011 0.008 Eu2O3 0.005 0.004
F 0.04 0.03 Fe2O3 16.013 14.249 39.254 36.39 HgO 0.004 0.003 K2O 0.076 0.169 0 0.08
La2O3 0.043 0.057 0.98 0.89 Li2O 0.129 0.098 0 0 MgO 0.222 0.178 0.39 0.36 MnO2 3.195 7.699 0.85 2.76 MoO3 0.006 0.007 0 0 Na2O 9.925 11.638 8.397 8.93 Nd2O3 0.082 0.134 0.68 0.63
NO 0.907 0.712 2.489 2.3 P2O3 1.237 0.998 1.499 1.38 PbO 0.4 0.463 0.29 0.28 PdO 0.033 0
Pr6O11 0.019 0.014 PtO2
Rh2O3 0.128 0.098 RuO2 0.065 0.050 SO3 0.07 0.06
Sb2O5 SeO2 0.014 0.011 SiO2 5.906 4.800 2.049 1.92 SnO2 0.272 0.208 0.54 0.49 SrO 0.028 10.243 0.07 4.47
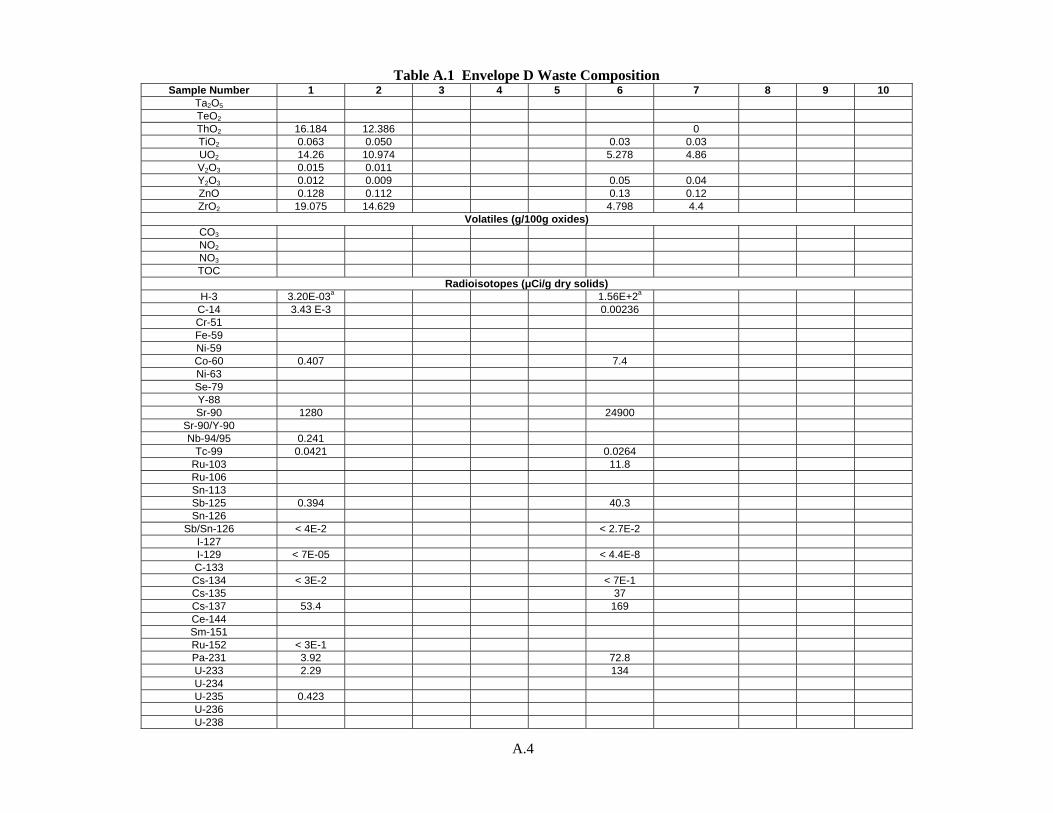
A.4
Table A.1 Envelope D Waste Composition Sample Number 1 2 3 4 5 6 7 8 9 10
Ta2O5 TeO2 ThO2 16.184 12.386 0 TiO2 0.063 0.050 0.03 0.03 UO2 14.26 10.974 5.278 4.86 V2O3 0.015 0.011 Y2O3 0.012 0.009 0.05 0.04 ZnO 0.128 0.112 0.13 0.12 ZrO2 19.075 14.629 4.798 4.4
Volatiles (g/100g oxides) CO3 NO2 NO3 TOC
Radioisotopes (μCi/g dry solids) H-3 3.20E-03a 1.56E+2a
C-14 3.43 E-3 0.00236 Cr-51 Fe-59 Ni-59 Co-60 0.407 7.4 Ni-63 Se-79 Y-88 Sr-90 1280 24900
Sr-90/Y-90 Nb-94/95 0.241
Tc-99 0.0421 0.0264 Ru-103 11.8 Ru-106 Sn-113 Sb-125 0.394 40.3 Sn-126
Sb/Sn-126 < 4E-2 < 2.7E-2 I-127 I-129 < 7E-05 < 4.4E-8 C-133 Cs-134 < 3E-2 < 7E-1 Cs-135 37 Cs-137 53.4 169 Ce-144 Sm-151 Ru-152 < 3E-1 Pa-231 3.92 72.8 U-233 2.29 134 U-234 U-235 0.423 U-236 U-238
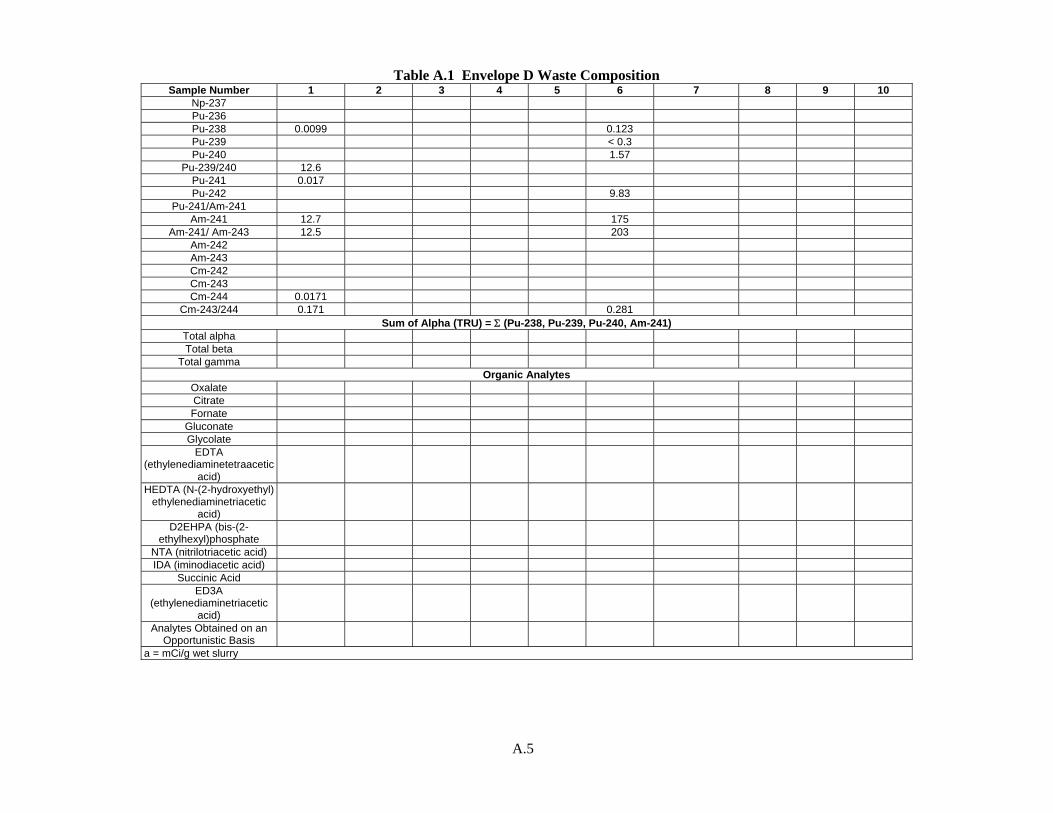
A.5
Table A.1 Envelope D Waste Composition Sample Number 1 2 3 4 5 6 7 8 9 10
Np-237 Pu-236 Pu-238 0.0099 0.123 Pu-239 < 0.3 Pu-240 1.57
Pu-239/240 12.6 Pu-241 0.017 Pu-242 9.83
Pu-241/Am-241 Am-241 12.7 175
Am-241/ Am-243 12.5 203 Am-242 Am-243 Cm-242 Cm-243 Cm-244 0.0171
Cm-243/244 0.171 0.281 Sum of Alpha (TRU) = Σ (Pu-238, Pu-239, Pu-240, Am-241)
Total alpha Total beta
Total gamma Organic Analytes
Oxalate Citrate Fornate
Gluconate Glycolate
EDTA (ethylenediaminetetraacetic
acid) HEDTA (N-(2-hydroxyethyl)
ethylenediaminetriacetic acid)
D2EHPA (bis-(2-ethylhexyl)phosphate
NTA (nitrilotriacetic acid) IDA (iminodiacetic acid)
Succinic Acid ED3A
(ethylenediaminetriacetic acid)
Analytes Obtained on an Opportunistic Basis
a = mCi/g wet slurry
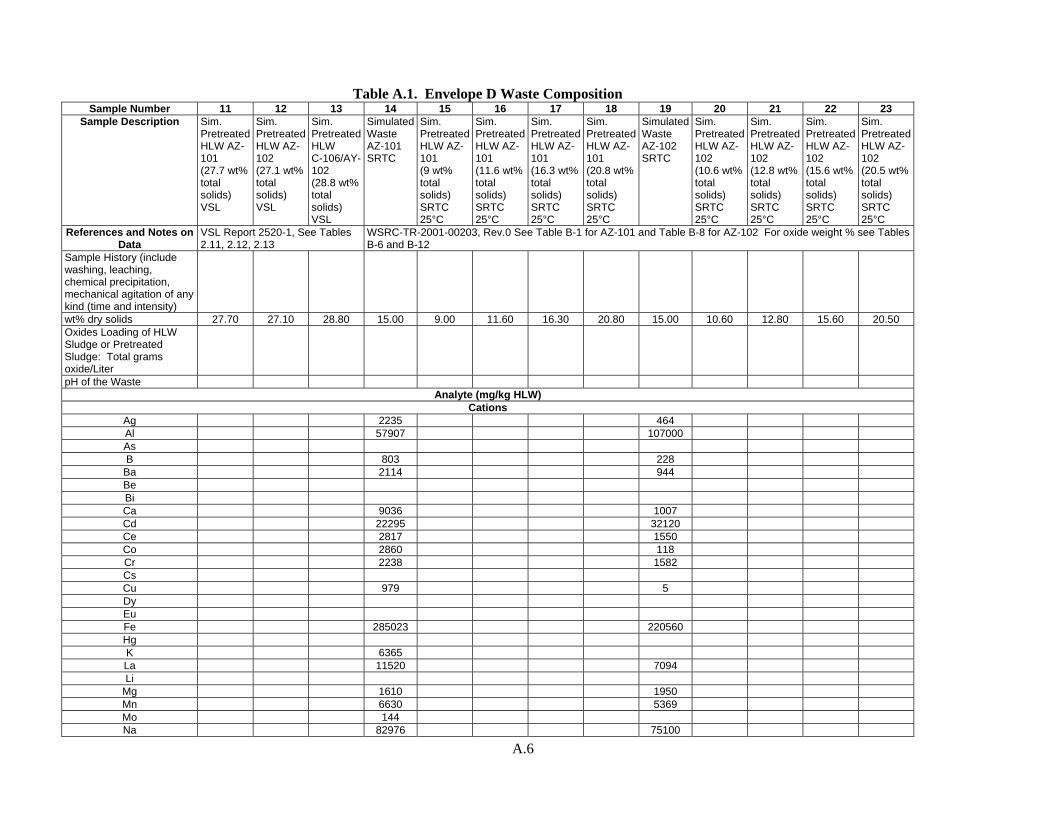
A.6
Table A.1. Envelope D Waste Composition
Sample Number 11 12 13 14 15 16 17 18 19 20 21 22 23 Sample Description Sim.
Pretreated HLW AZ-101 (27.7 wt% total solids) VSL
Sim. Pretreated HLW AZ-102 (27.1 wt% total solids) VSL
Sim. Pretreated HLW C-106/AY-102 (28.8 wt% total solids) VSL
Simulated Waste AZ-101 SRTC
Sim. Pretreated HLW AZ-101 (9 wt% total solids) SRTC 25°C
Sim. Pretreated HLW AZ-101 (11.6 wt% total solids) SRTC 25°C
Sim. Pretreated HLW AZ-101 (16.3 wt% total solids) SRTC 25°C
Sim. Pretreated HLW AZ-101 (20.8 wt% total solids) SRTC 25°C
Simulated Waste AZ-102 SRTC
Sim. Pretreated HLW AZ-102 (10.6 wt% total solids) SRTC 25°C
Sim. Pretreated HLW AZ-102 (12.8 wt% total solids) SRTC 25°C
Sim. Pretreated HLW AZ-102 (15.6 wt% total solids) SRTC 25°C
Sim. Pretreated HLW AZ-102 (20.5 wt% total solids) SRTC 25°C
References and Notes on Data
VSL Report 2520-1, See Tables 2.11, 2.12, 2.13
WSRC-TR-2001-00203, Rev.0 See Table B-1 for AZ-101 and Table B-8 for AZ-102 For oxide weight % see Tables B-6 and B-12
Sample History (include washing, leaching, chemical precipitation, mechanical agitation of any kind (time and intensity) wt% dry solids 27.70 27.10 28.80 15.00 9.00 11.60 16.30 20.80 15.00 10.60 12.80 15.60 20.50 Oxides Loading of HLW Sludge or Pretreated Sludge: Total grams oxide/Liter pH of the Waste
Analyte (mg/kg HLW) Cations
Ag 2235 464 Al 57907 107000 As B 803 228
Ba 2114 944 Be Bi Ca 9036 1007 Cd 22295 32120 Ce 2817 1550 Co 2860 118 Cr 2238 1582 Cs Cu 979 5 Dy Eu Fe 285023 220560 Hg K 6365 La 11520 7094 Li
Mg 1610 1950 Mn 6630 5369 Mo 144 Na 82976 75100
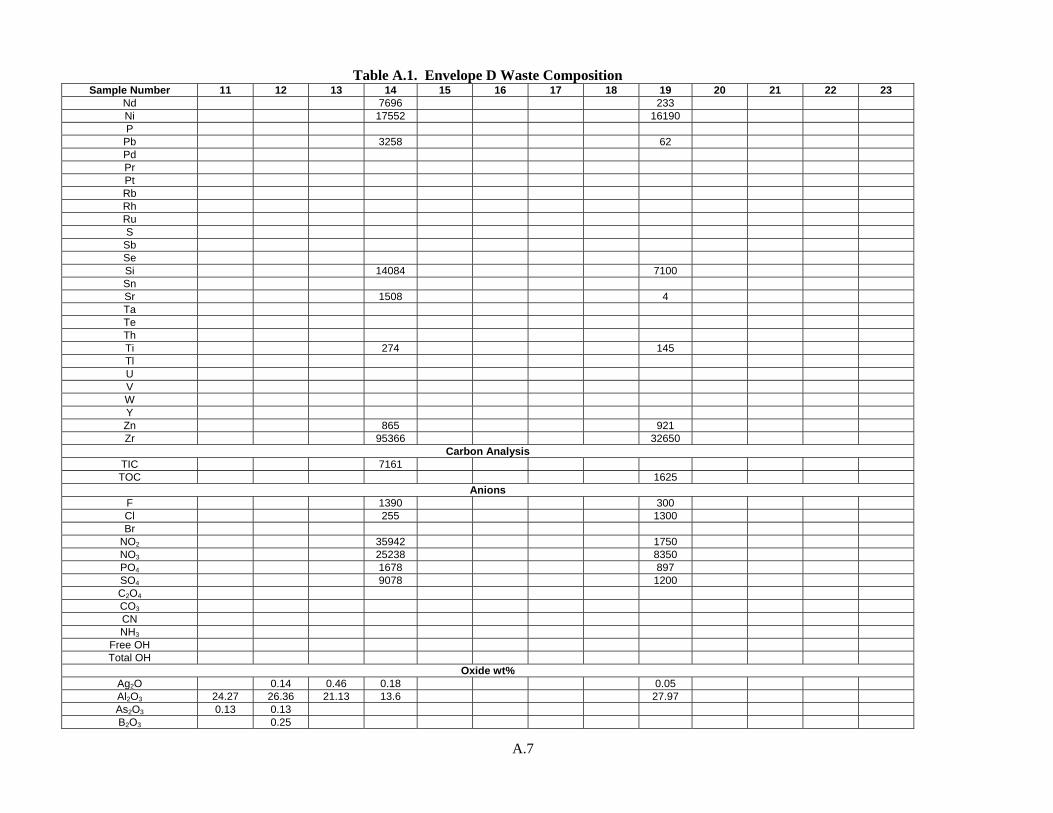
A.7
Table A.1. Envelope D Waste Composition Sample Number 11 12 13 14 15 16 17 18 19 20 21 22 23
Nd 7696 233 Ni 17552 16190 P
Pb 3258 62 Pd Pr Pt Rb Rh Ru S
Sb Se Si 14084 7100 Sn Sr 1508 4 Ta Te Th Ti 274 145 Tl U V W Y Zn 865 921 Zr 95366 32650
Carbon Analysis TIC 7161 TOC 1625
Anions F 1390 300 Cl 255 1300 Br
NO2 35942 1750 NO3 25238 8350 PO4 1678 897 SO4 9078 1200 C2O4 CO3 CN NH3
Free OH Total OH
Oxide wt% Ag2O 0.14 0.46 0.18 0.05 Al2O3 24.27 26.36 21.13 13.6 27.97 As2O3 0.13 0.13 B2O3 0.25
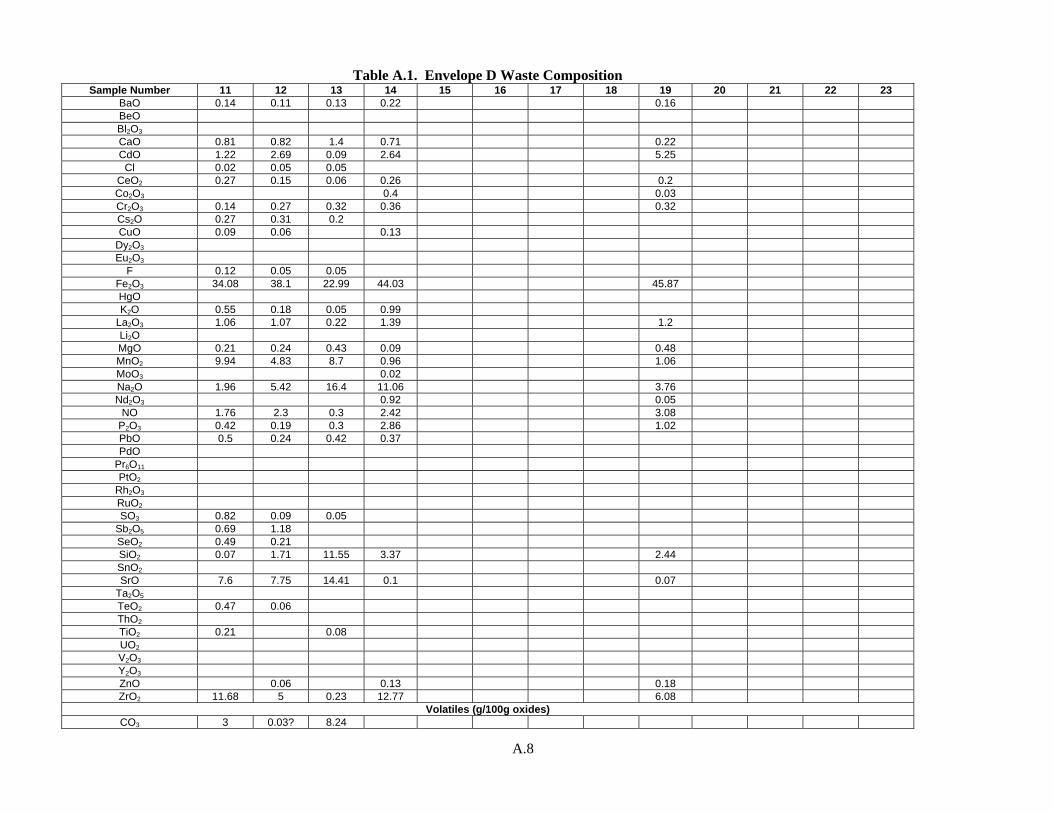
A.8
Table A.1. Envelope D Waste Composition Sample Number 11 12 13 14 15 16 17 18 19 20 21 22 23
BaO 0.14 0.11 0.13 0.22 0.16 BeO Bl2O3 CaO 0.81 0.82 1.4 0.71 0.22 CdO 1.22 2.69 0.09 2.64 5.25 Cl 0.02 0.05 0.05
CeO2 0.27 0.15 0.06 0.26 0.2 Co2O3 0.4 0.03 Cr2O3 0.14 0.27 0.32 0.36 0.32 Cs2O 0.27 0.31 0.2 CuO 0.09 0.06 0.13
Dy2O3 Eu2O3
F 0.12 0.05 0.05 Fe2O3 34.08 38.1 22.99 44.03 45.87 HgO K2O 0.55 0.18 0.05 0.99
La2O3 1.06 1.07 0.22 1.39 1.2 Li2O MgO 0.21 0.24 0.43 0.09 0.48 MnO2 9.94 4.83 8.7 0.96 1.06 MoO3 0.02 Na2O 1.96 5.42 16.4 11.06 3.76 Nd2O3 0.92 0.05
NO 1.76 2.3 0.3 2.42 3.08 P2O3 0.42 0.19 0.3 2.86 1.02 PbO 0.5 0.24 0.42 0.37 PdO
Pr6O11 PtO2
Rh2O3 RuO2 SO3 0.82 0.09 0.05
Sb2O5 0.69 1.18 SeO2 0.49 0.21 SiO2 0.07 1.71 11.55 3.37 2.44 SnO2 SrO 7.6 7.75 14.41 0.1 0.07
Ta2O5 TeO2 0.47 0.06 ThO2 TiO2 0.21 0.08 UO2 V2O3 Y2O3 ZnO 0.06 0.13 0.18 ZrO2 11.68 5 0.23 12.77 6.08
Volatiles (g/100g oxides) CO3 3 0.03? 8.24
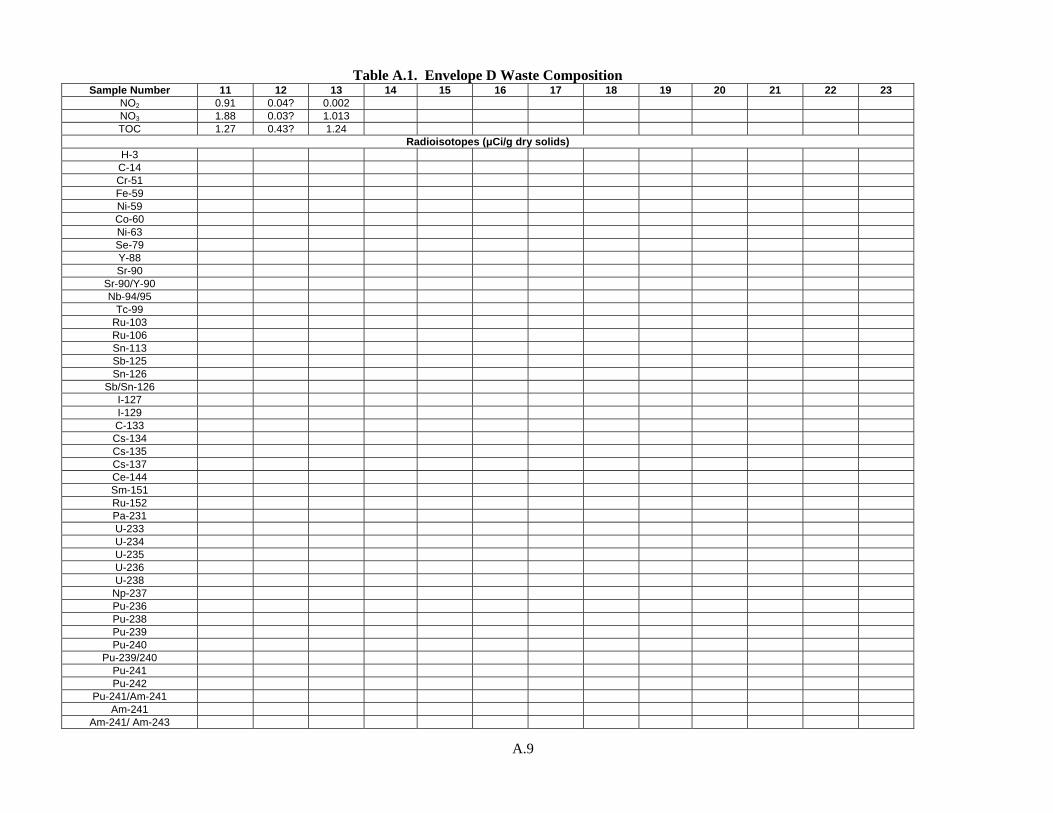
A.9
Table A.1. Envelope D Waste Composition Sample Number 11 12 13 14 15 16 17 18 19 20 21 22 23
NO2 0.91 0.04? 0.002 NO3 1.88 0.03? 1.013 TOC 1.27 0.43? 1.24
Radioisotopes (μCi/g dry solids) H-3
C-14 Cr-51 Fe-59 Ni-59 Co-60 Ni-63 Se-79 Y-88 Sr-90
Sr-90/Y-90 Nb-94/95
Tc-99 Ru-103 Ru-106 Sn-113 Sb-125 Sn-126
Sb/Sn-126 I-127 I-129 C-133 Cs-134 Cs-135 Cs-137 Ce-144 Sm-151 Ru-152 Pa-231 U-233 U-234 U-235 U-236 U-238
Np-237 Pu-236 Pu-238 Pu-239 Pu-240
Pu-239/240 Pu-241 Pu-242
Pu-241/Am-241 Am-241
Am-241/ Am-243
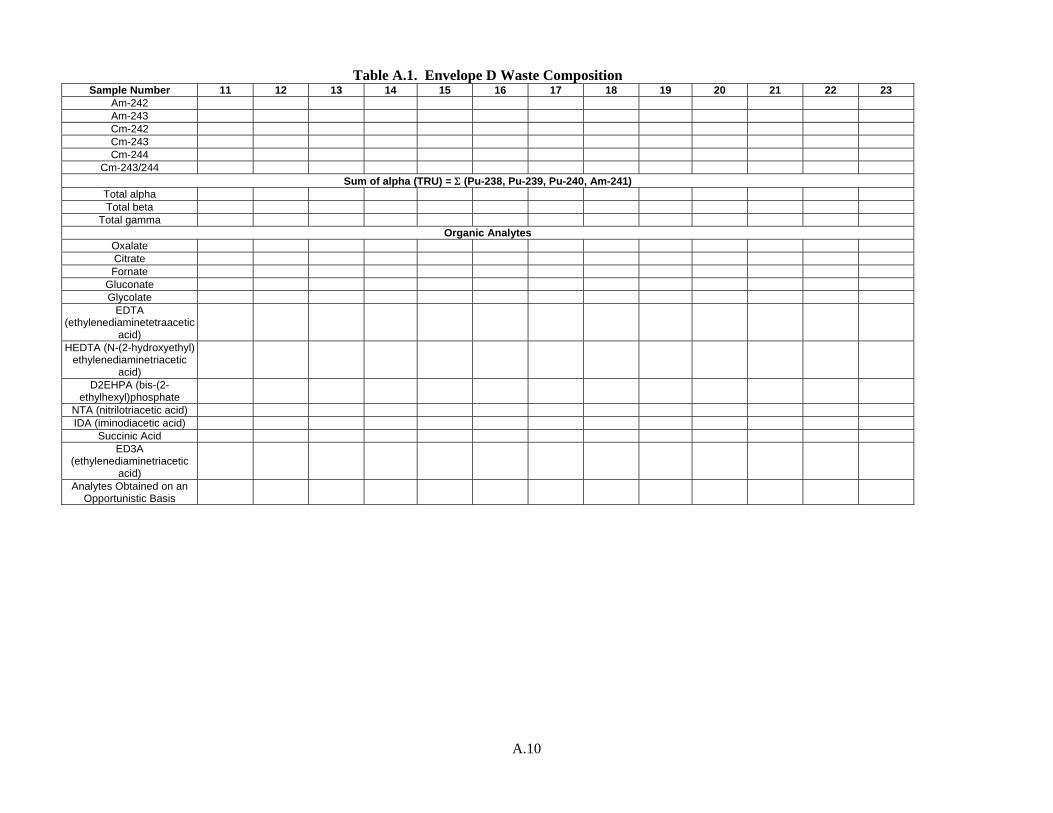
A.10
Table A.1. Envelope D Waste Composition Sample Number 11 12 13 14 15 16 17 18 19 20 21 22 23
Am-242 Am-243 Cm-242 Cm-243 Cm-244
Cm-243/244 Sum of alpha (TRU) = Σ (Pu-238, Pu-239, Pu-240, Am-241)
Total alpha Total beta
Total gamma Organic Analytes
Oxalate Citrate Fornate
Gluconate Glycolate
EDTA (ethylenediaminetetraacetic
acid) HEDTA (N-(2-hydroxyethyl)
ethylenediaminetriacetic acid)
D2EHPA (bis-(2-ethylhexyl)phosphate
NTA (nitrilotriacetic acid) IDA (iminodiacetic acid)
Succinic Acid ED3A
(ethylenediaminetriacetic acid)
Analytes Obtained on an Opportunistic Basis
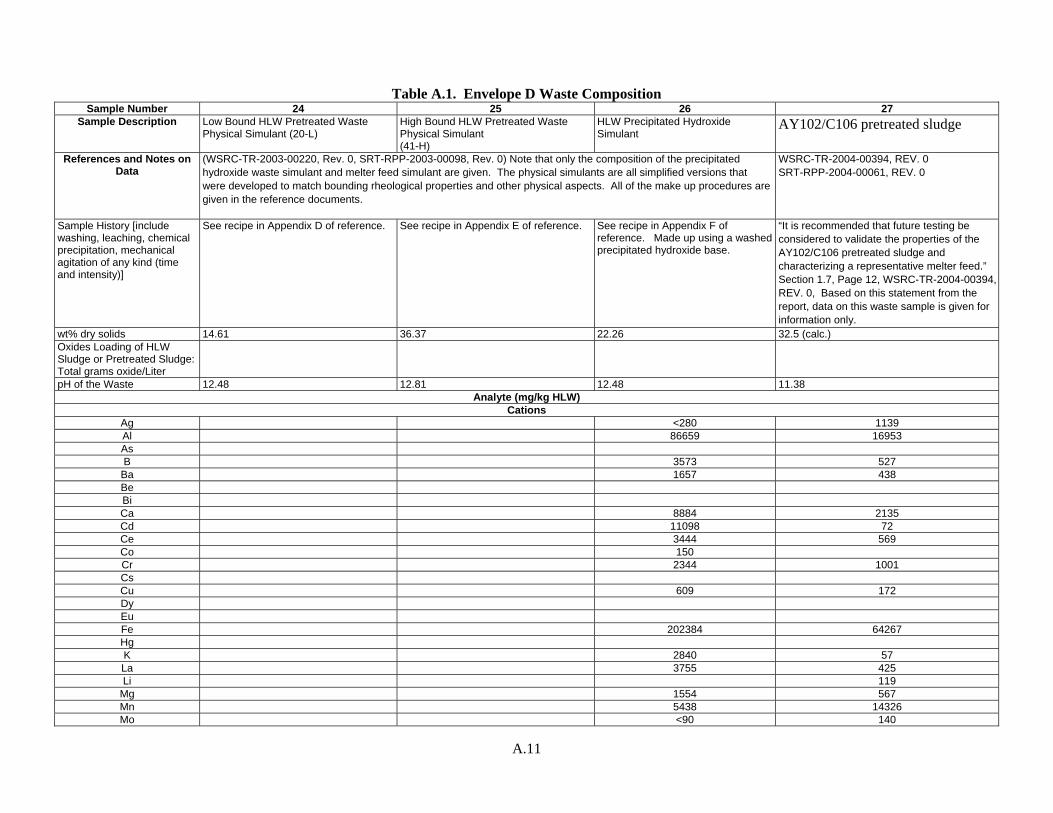
A.11
Table A.1. Envelope D Waste Composition
Sample Number 24 25 26 27 Sample Description Low Bound HLW Pretreated Waste
Physical Simulant (20-L) High Bound HLW Pretreated Waste Physical Simulant (41-H)
HLW Precipitated Hydroxide Simulant
AY102/C106 pretreated sludge
References and Notes on Data
(WSRC-TR-2003-00220, Rev. 0, SRT-RPP-2003-00098, Rev. 0) Note that only the composition of the precipitated hydroxide waste simulant and melter feed simulant are given. The physical simulants are all simplified versions that were developed to match bounding rheological properties and other physical aspects. All of the make up procedures are given in the reference documents.
WSRC-TR-2004-00394, REV. 0 SRT-RPP-2004-00061, REV. 0
Sample History [include washing, leaching, chemical precipitation, mechanical agitation of any kind (time and intensity)]
See recipe in Appendix D of reference. See recipe in Appendix E of reference. See recipe in Appendix F of reference. Made up using a washed precipitated hydroxide base.
“It is recommended that future testing be considered to validate the properties of the AY102/C106 pretreated sludge and characterizing a representative melter feed.” Section 1.7, Page 12, WSRC-TR-2004-00394, REV. 0, Based on this statement from the report, data on this waste sample is given for information only.
wt% dry solids 14.61 36.37 22.26 32.5 (calc.) Oxides Loading of HLW Sludge or Pretreated Sludge: Total grams oxide/Liter
pH of the Waste 12.48 12.81 12.48 11.38 Analyte (mg/kg HLW)
Cations Ag <280 1139 Al 86659 16953 As B 3573 527
Ba 1657 438 Be Bi Ca 8884 2135 Cd 11098 72 Ce 3444 569 Co 150 Cr 2344 1001 Cs Cu 609 172 Dy Eu Fe 202384 64267 Hg K 2840 57 La 3755 425 Li 119
Mg 1554 567 Mn 5438 14326 Mo <90 140
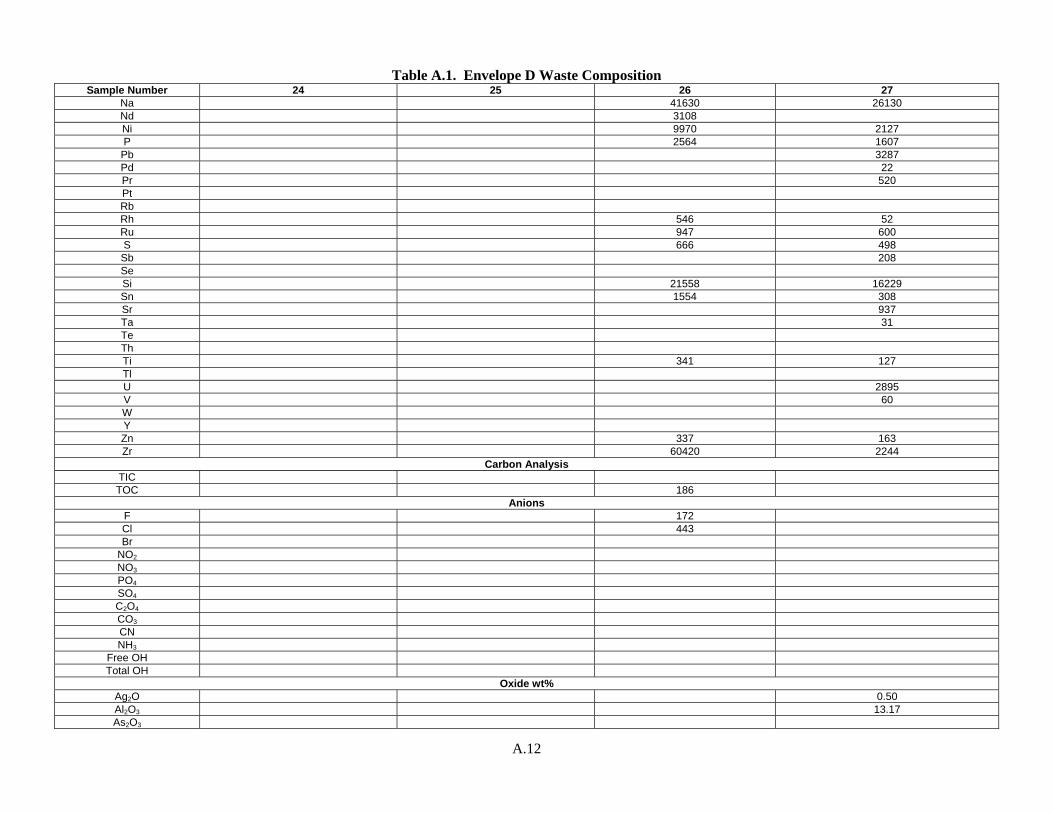
A.12
Table A.1. Envelope D Waste Composition Sample Number 24 25 26 27
Na 41630 26130 Nd 3108 Ni 9970 2127 P 2564 1607
Pb 3287 Pd 22 Pr 520 Pt Rb Rh 546 52 Ru 947 600 S 666 498
Sb 208 Se Si 21558 16229 Sn 1554 308 Sr 937 Ta 31 Te Th Ti 341 127 Tl U 2895 V 60 W Y Zn 337 163 Zr 60420 2244
Carbon Analysis TIC TOC 186
Anions F 172 Cl 443 Br
NO2 NO3 PO4 SO4 C2O4 CO3 CN NH3
Free OH Total OH
Oxide wt% Ag2O 0.50 Al2O3 13.17 As2O3
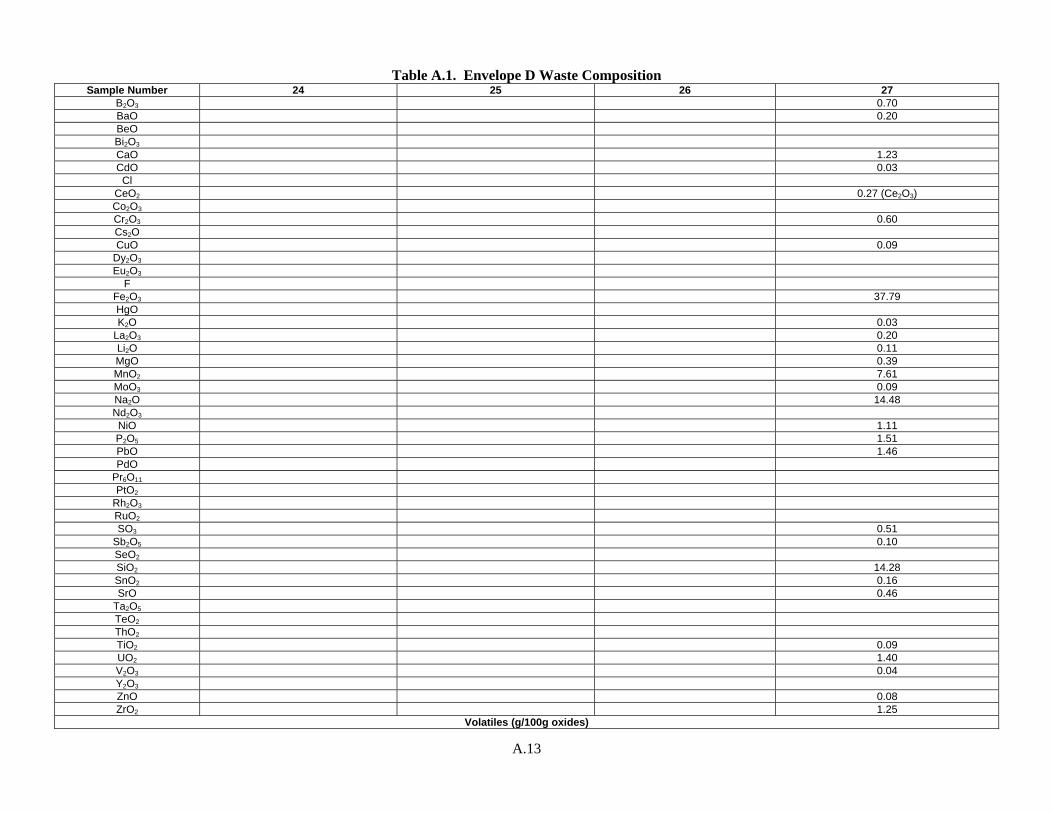
A.13
Table A.1. Envelope D Waste Composition Sample Number 24 25 26 27
B2O3 0.70 BaO 0.20 BeO Bi2O3 CaO 1.23 CdO 0.03 Cl
CeO2 0.27 (Ce2O3) Co2O3 Cr2O3 0.60 Cs2O CuO 0.09
Dy2O3 Eu2O3
F Fe2O3 37.79 HgO K2O 0.03
La2O3 0.20 Li2O 0.11 MgO 0.39 MnO2 7.61 MoO3 0.09 Na2O 14.48 Nd2O3 NiO 1.11 P2O5 1.51 PbO 1.46 PdO
Pr6O11 PtO2
Rh2O3 RuO2 SO3 0.51
Sb2O5 0.10 SeO2 SiO2 14.28 SnO2 0.16 SrO 0.46
Ta2O5 TeO2 ThO2 TiO2 0.09 UO2 1.40 V2O3 0.04 Y2O3 ZnO 0.08 ZrO2 1.25
Volatiles (g/100g oxides)
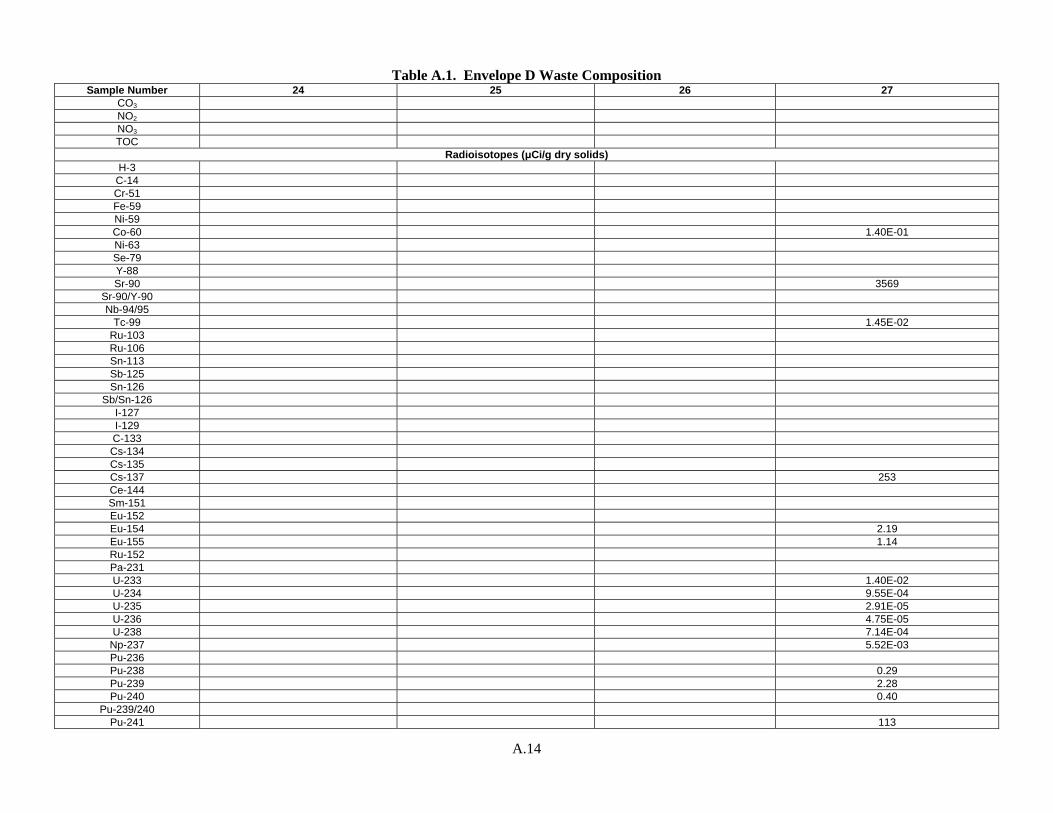
A.14
Table A.1. Envelope D Waste Composition Sample Number 24 25 26 27
CO3 NO2 NO3 TOC
Radioisotopes (μCi/g dry solids) H-3
C-14 Cr-51 Fe-59 Ni-59 Co-60 1.40E-01 Ni-63 Se-79 Y-88 Sr-90 3569
Sr-90/Y-90 Nb-94/95
Tc-99 1.45E-02 Ru-103 Ru-106 Sn-113 Sb-125 Sn-126
Sb/Sn-126 I-127 I-129 C-133 Cs-134 Cs-135 Cs-137 253 Ce-144 Sm-151 Eu-152 Eu-154 2.19 Eu-155 1.14 Ru-152 Pa-231 U-233 1.40E-02 U-234 9.55E-04 U-235 2.91E-05 U-236 4.75E-05 U-238 7.14E-04
Np-237 5.52E-03 Pu-236 Pu-238 0.29 Pu-239 2.28 Pu-240 0.40
Pu-239/240 Pu-241 113
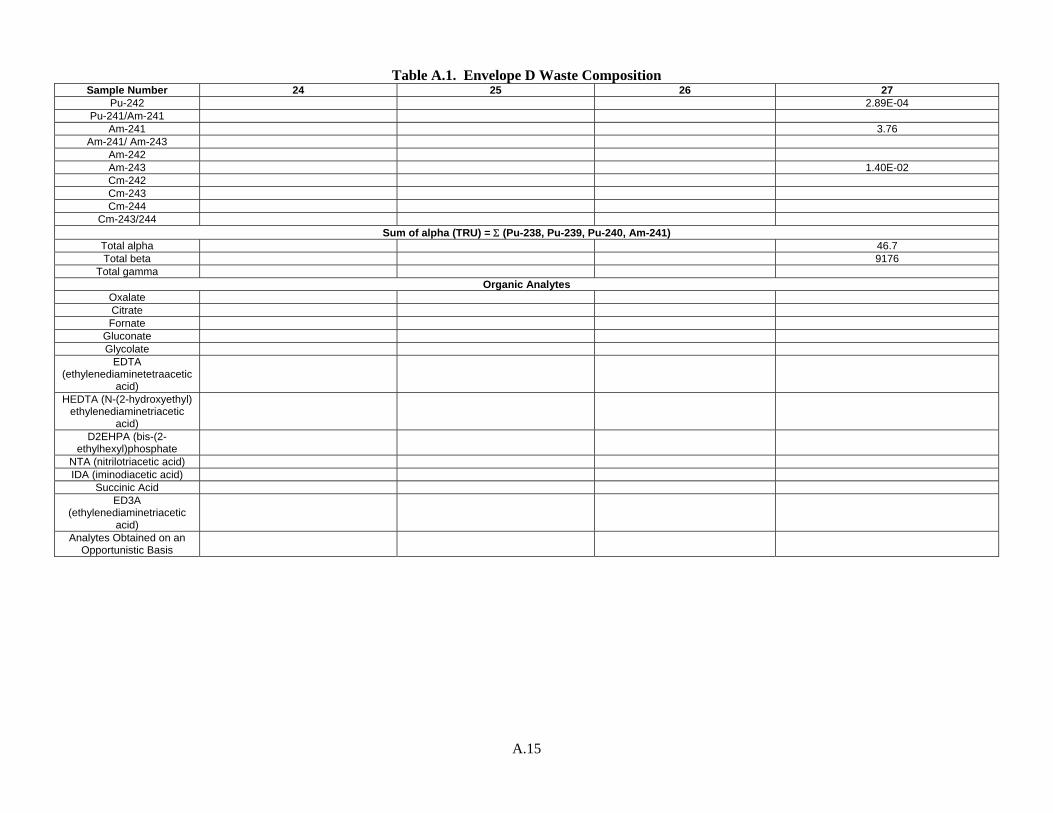
A.15
Table A.1. Envelope D Waste Composition Sample Number 24 25 26 27
Pu-242 2.89E-04 Pu-241/Am-241
Am-241 3.76 Am-241/ Am-243
Am-242 Am-243 1.40E-02 Cm-242 Cm-243 Cm-244
Cm-243/244 Sum of alpha (TRU) = Σ (Pu-238, Pu-239, Pu-240, Am-241)
Total alpha 46.7 Total beta 9176
Total gamma Organic Analytes
Oxalate Citrate Fornate
Gluconate Glycolate
EDTA (ethylenediaminetetraacetic
acid)
HEDTA (N-(2-hydroxyethyl) ethylenediaminetriacetic
acid)
D2EHPA (bis-(2-ethylhexyl)phosphate
NTA (nitrilotriacetic acid) IDA (iminodiacetic acid)
Succinic Acid ED3A
(ethylenediaminetriacetic acid)
Analytes Obtained on an Opportunistic Basis
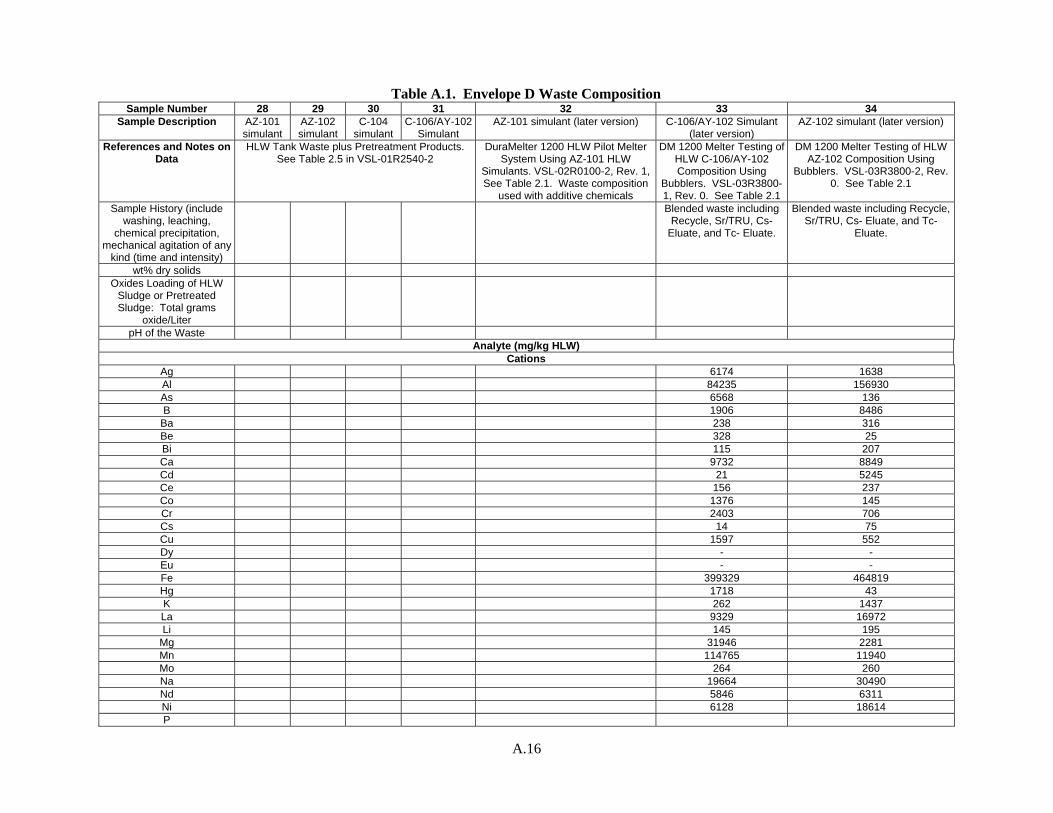
A.16
Table A.1. Envelope D Waste Composition
Sample Number 28 29 30 31 32 33 34 Sample Description AZ-101
simulant AZ-102 simulant
C-104 simulant
C-106/AY-102 Simulant
AZ-101 simulant (later version) C-106/AY-102 Simulant (later version)
AZ-102 simulant (later version)
References and Notes on Data
HLW Tank Waste plus Pretreatment Products. See Table 2.5 in VSL-01R2540-2
DuraMelter 1200 HLW Pilot Melter System Using AZ-101 HLW
Simulants. VSL-02R0100-2, Rev. 1, See Table 2.1. Waste composition
used with additive chemicals
DM 1200 Melter Testing of HLW C-106/AY-102 Composition Using
Bubblers. VSL-03R3800-1, Rev. 0. See Table 2.1
DM 1200 Melter Testing of HLW AZ-102 Composition Using
Bubblers. VSL-03R3800-2, Rev. 0. See Table 2.1
Sample History (include washing, leaching,
chemical precipitation, mechanical agitation of any
kind (time and intensity)
Blended waste including Recycle, Sr/TRU, Cs-
Eluate, and Tc- Eluate.
Blended waste including Recycle, Sr/TRU, Cs- Eluate, and Tc-
Eluate.
wt% dry solids Oxides Loading of HLW
Sludge or Pretreated Sludge: Total grams
oxide/Liter pH of the Waste
Analyte (mg/kg HLW) Cations
Ag 6174 1638 Al 84235 156930 As 6568 136 B 1906 8486
Ba 238 316 Be 328 25 Bi 115 207 Ca 9732 8849 Cd 21 5245 Ce 156 237 Co 1376 145 Cr 2403 706 Cs 14 75 Cu 1597 552 Dy - - Eu - - Fe 399329 464819 Hg 1718 43 K 262 1437 La 9329 16972 Li 145 195
Mg 31946 2281 Mn 114765 11940 Mo 264 260 Na 19664 30490 Nd 5846 6311 Ni 6128 18614 P
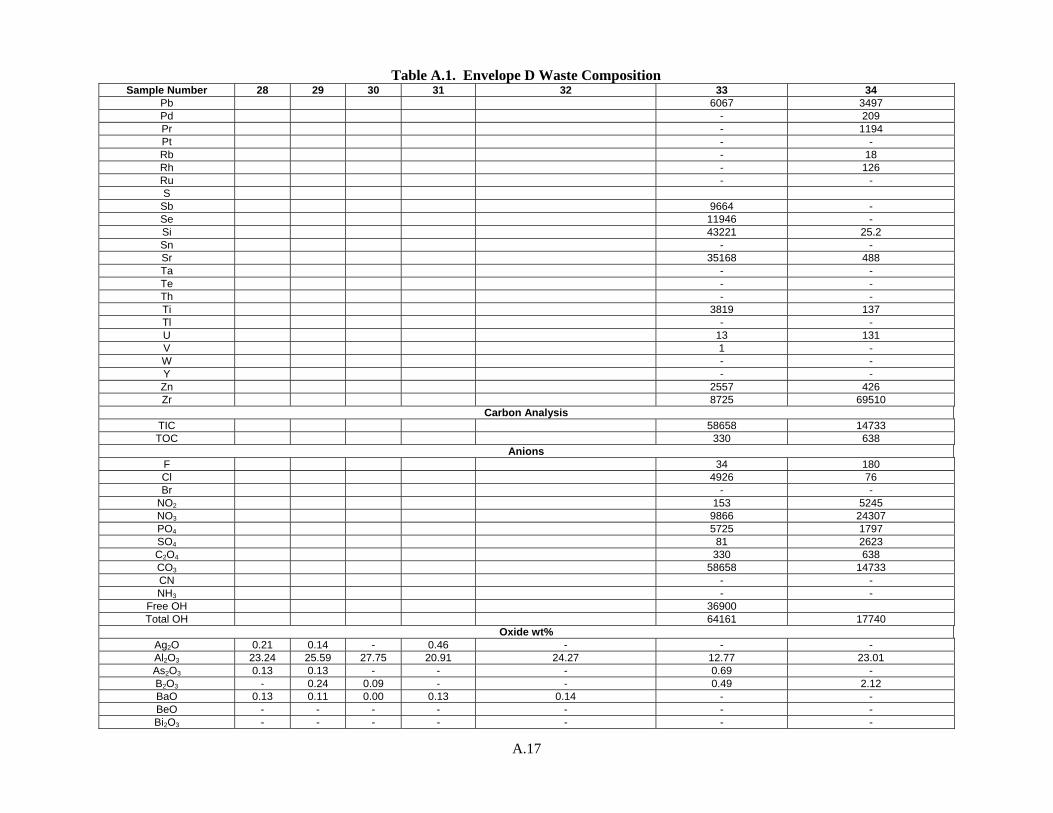
A.17
Table A.1. Envelope D Waste Composition Sample Number 28 29 30 31 32 33 34
Pb 6067 3497 Pd - 209 Pr - 1194 Pt - - Rb - 18 Rh - 126 Ru - - S
Sb 9664 - Se 11946 - Si 43221 25.2 Sn - - Sr 35168 488 Ta - - Te - - Th - - Ti 3819 137 Tl - - U 13 131 V 1 - W - - Y - - Zn 2557 426 Zr 8725 69510
Carbon Analysis TIC 58658 14733 TOC 330 638
Anions F 34 180 Cl 4926 76 Br - -
NO2 153 5245 NO3 9866 24307 PO4 5725 1797 SO4 81 2623 C2O4 330 638 CO3 58658 14733 CN - - NH3 - -
Free OH 36900 Total OH 64161 17740
Oxide wt% Ag2O 0.21 0.14 - 0.46 - - - Al2O3 23.24 25.59 27.75 20.91 24.27 12.77 23.01 As2O3 0.13 0.13 - - - 0.69 - B2O3 - 0.24 0.09 - - 0.49 2.12 BaO 0.13 0.11 0.00 0.13 0.14 - - BeO - - - - - - - Bi2O3 - - - - - - -
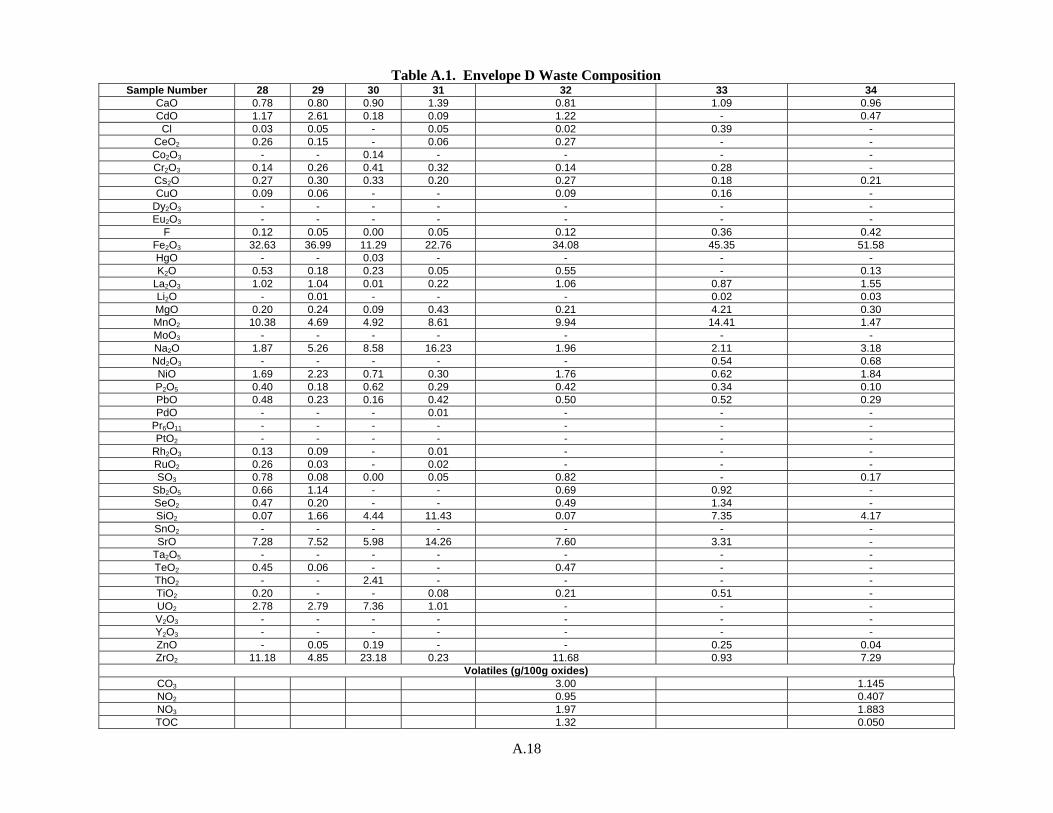
A.18
Table A.1. Envelope D Waste Composition Sample Number 28 29 30 31 32 33 34
CaO 0.78 0.80 0.90 1.39 0.81 1.09 0.96 CdO 1.17 2.61 0.18 0.09 1.22 - 0.47 Cl 0.03 0.05 - 0.05 0.02 0.39 -
CeO2 0.26 0.15 - 0.06 0.27 - - Co2O3 - - 0.14 - - - - Cr2O3 0.14 0.26 0.41 0.32 0.14 0.28 - Cs2O 0.27 0.30 0.33 0.20 0.27 0.18 0.21 CuO 0.09 0.06 - - 0.09 0.16 -
Dy2O3 - - - - - - - Eu2O3 - - - - - - -
F 0.12 0.05 0.00 0.05 0.12 0.36 0.42 Fe2O3 32.63 36.99 11.29 22.76 34.08 45.35 51.58 HgO - - 0.03 - - - - K2O 0.53 0.18 0.23 0.05 0.55 - 0.13
La2O3 1.02 1.04 0.01 0.22 1.06 0.87 1.55 Li2O - 0.01 - - - 0.02 0.03 MgO 0.20 0.24 0.09 0.43 0.21 4.21 0.30 MnO2 10.38 4.69 4.92 8.61 9.94 14.41 1.47 MoO3 - - - - - - - Na2O 1.87 5.26 8.58 16.23 1.96 2.11 3.18 Nd2O3 - - - - - 0.54 0.68 NiO 1.69 2.23 0.71 0.30 1.76 0.62 1.84 P2O5 0.40 0.18 0.62 0.29 0.42 0.34 0.10 PbO 0.48 0.23 0.16 0.42 0.50 0.52 0.29 PdO - - - 0.01 - - -
Pr6O11 - - - - - - - PtO2 - - - - - - -
Rh2O3 0.13 0.09 - 0.01 - - - RuO2 0.26 0.03 - 0.02 - - - SO3 0.78 0.08 0.00 0.05 0.82 - 0.17
Sb2O5 0.66 1.14 - - 0.69 0.92 - SeO2 0.47 0.20 - - 0.49 1.34 - SiO2 0.07 1.66 4.44 11.43 0.07 7.35 4.17 SnO2 - - - - - - - SrO 7.28 7.52 5.98 14.26 7.60 3.31 -
Ta2O5 - - - - - - - TeO2 0.45 0.06 - - 0.47 - - ThO2 - - 2.41 - - - - TiO2 0.20 - - 0.08 0.21 0.51 - UO2 2.78 2.79 7.36 1.01 - - - V2O3 - - - - - - - Y2O3 - - - - - - - ZnO - 0.05 0.19 - - 0.25 0.04 ZrO2 11.18 4.85 23.18 0.23 11.68 0.93 7.29
Volatiles (g/100g oxides) CO3 3.00 1.145 NO2 0.95 0.407 NO3 1.97 1.883 TOC 1.32 0.050
A.19
Table A.1. Envelope D Waste Composition Sample Number 28 29 30 31 32 33 34
Radioisotopes (μCi/g dry solids) H-3
C-14 Cr-51 Fe-59 Ni-59 Co-60 Ni-63 Se-79 Y-88 Sr-90
Sr-90/Y-90 Nb-94/95
Tc-99 Ru-103 Ru-106 Sn-113 Sb-125 Sn-126
Sb/Sn-126 I-127 I-129 C-133 Cs-134 Cs-135 Cs-137 Ce-144 Sm-151 Ru-152 Pa-231 U-233 U-234 U-235 U-236 U-238
Np-237 Pu-236 Pu-238 Pu-239 Pu-240
Pu-239/240 Pu-241 Pu-242
Pu-241/Am-241 Am-241
Am-241/ Am-243 Am-242 Am-243 Cm-242
A.20
Table A.1. Envelope D Waste Composition Sample Number 28 29 30 31 32 33 34
Cm-243 Cm-244
Cm-243/244 Sum of alpha (TRU) = Σ (Pu-238, Pu-239, Pu-240, Am-241)
Total alpha Total beta
Total gamma Organic Analytes
Oxalate Citrate Fornate
Gluconate Glycolate
EDTA (ethylenediaminetetraacetic
acid) HEDTA (N-(2-hydroxyethyl)
ethylenediaminetriacetic acid)
D2EHPA (bis-(2-ethylhexyl)phosphate
NTA (nitrilotriacetic acid) IDA (iminodiacetic acid)
Succinic Acid ED3A
(ethylenediaminetriacetic acid)
Analytes Obtained on an Opportunistic Basis
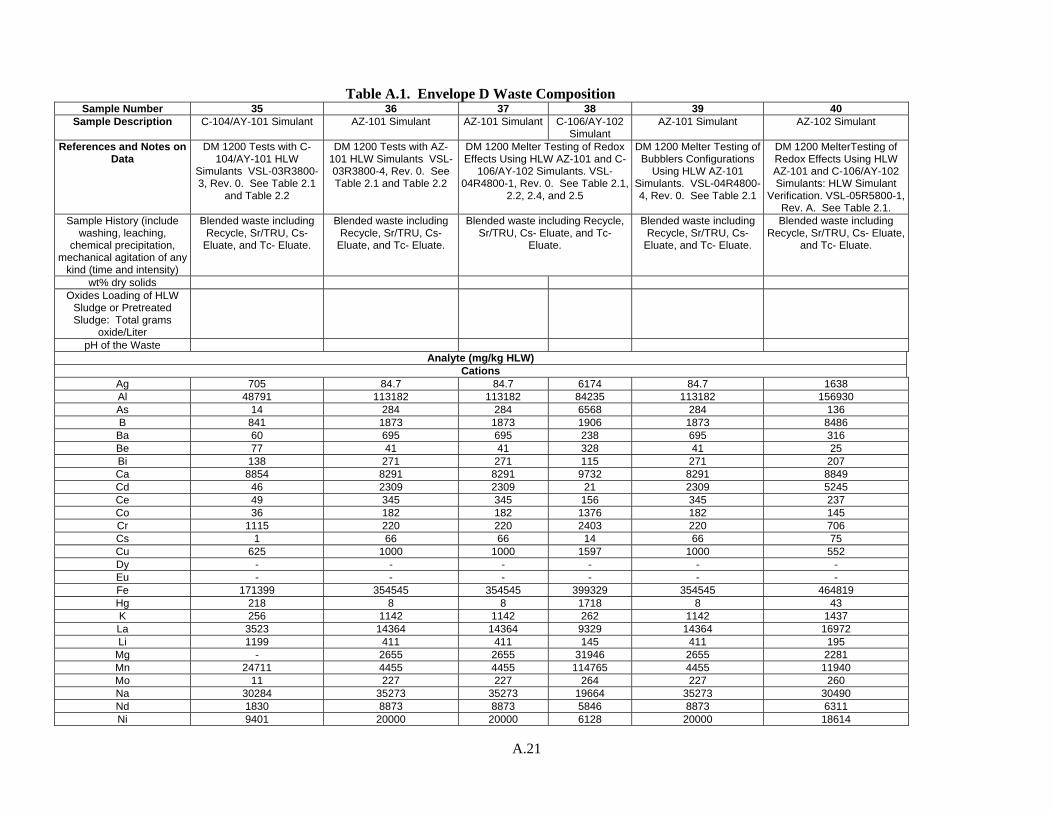
A.21
Table A.1. Envelope D Waste Composition
Sample Number 35 36 37 38 39 40 Sample Description C-104/AY-101 Simulant AZ-101 Simulant AZ-101 Simulant C-106/AY-102
Simulant AZ-101 Simulant AZ-102 Simulant
References and Notes on Data
DM 1200 Tests with C-104/AY-101 HLW
Simulants VSL-03R3800-3, Rev. 0. See Table 2.1
and Table 2.2
DM 1200 Tests with AZ-101 HLW Simulants VSL-03R3800-4, Rev. 0. See Table 2.1 and Table 2.2
DM 1200 Melter Testing of Redox Effects Using HLW AZ-101 and C-
106/AY-102 Simulants. VSL-04R4800-1, Rev. 0. See Table 2.1,
2.2, 2.4, and 2.5
DM 1200 Melter Testing of Bubblers Configurations
Using HLW AZ-101 Simulants. VSL-04R4800-4, Rev. 0. See Table 2.1
DM 1200 MelterTesting of Redox Effects Using HLW AZ-101 and C-106/AY-102 Simulants: HLW Simulant
Verification. VSL-05R5800-1, Rev. A. See Table 2.1.
Sample History (include washing, leaching,
chemical precipitation, mechanical agitation of any
kind (time and intensity)
Blended waste including Recycle, Sr/TRU, Cs-
Eluate, and Tc- Eluate.
Blended waste including Recycle, Sr/TRU, Cs-
Eluate, and Tc- Eluate.
Blended waste including Recycle, Sr/TRU, Cs- Eluate, and Tc-
Eluate.
Blended waste including Recycle, Sr/TRU, Cs-
Eluate, and Tc- Eluate.
Blended waste including Recycle, Sr/TRU, Cs- Eluate,
and Tc- Eluate.
wt% dry solids Oxides Loading of HLW
Sludge or Pretreated Sludge: Total grams
oxide/Liter pH of the Waste
Analyte (mg/kg HLW) Cations
Ag 705 84.7 84.7 6174 84.7 1638 Al 48791 113182 113182 84235 113182 156930 As 14 284 284 6568 284 136 B 841 1873 1873 1906 1873 8486
Ba 60 695 695 238 695 316 Be 77 41 41 328 41 25 Bi 138 271 271 115 271 207 Ca 8854 8291 8291 9732 8291 8849 Cd 46 2309 2309 21 2309 5245 Ce 49 345 345 156 345 237 Co 36 182 182 1376 182 145 Cr 1115 220 220 2403 220 706 Cs 1 66 66 14 66 75 Cu 625 1000 1000 1597 1000 552 Dy - - - - - - Eu - - - - - - Fe 171399 354545 354545 399329 354545 464819 Hg 218 8 8 1718 8 43 K 256 1142 1142 262 1142 1437 La 3523 14364 14364 9329 14364 16972 Li 1199 411 411 145 411 195
Mg - 2655 2655 31946 2655 2281 Mn 24711 4455 4455 114765 4455 11940 Mo 11 227 227 264 227 260 Na 30284 35273 35273 19664 35273 30490 Nd 1830 8873 8873 5846 8873 6311 Ni 9401 20000 20000 6128 20000 18614
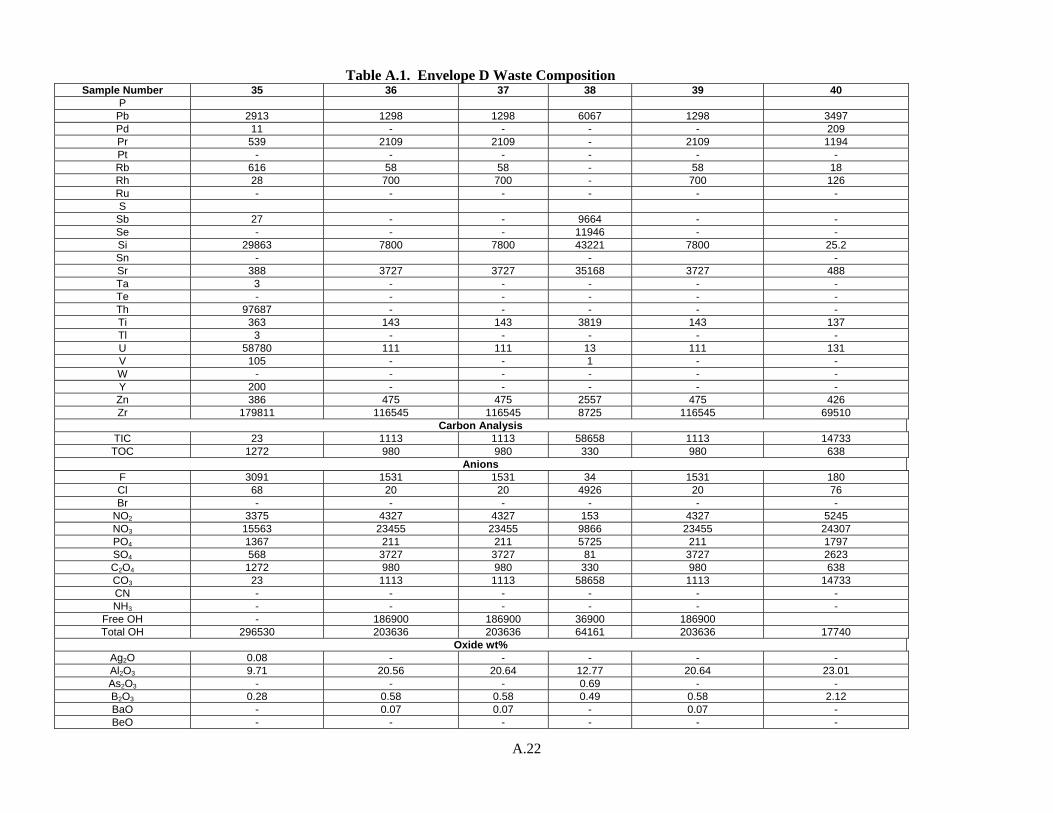
A.22
Table A.1. Envelope D Waste Composition Sample Number 35 36 37 38 39 40
P Pb 2913 1298 1298 6067 1298 3497 Pd 11 - - - - 209 Pr 539 2109 2109 - 2109 1194 Pt - - - - - - Rb 616 58 58 - 58 18 Rh 28 700 700 - 700 126 Ru - - - - - - S
Sb 27 - - 9664 - - Se - - - 11946 - - Si 29863 7800 7800 43221 7800 25.2 Sn - - - Sr 388 3727 3727 35168 3727 488 Ta 3 - - - - - Te - - - - - - Th 97687 - - - - - Ti 363 143 143 3819 143 137 Tl 3 - - - - - U 58780 111 111 13 111 131 V 105 - - 1 - - W - - - - - - Y 200 - - - - - Zn 386 475 475 2557 475 426 Zr 179811 116545 116545 8725 116545 69510
Carbon Analysis TIC 23 1113 1113 58658 1113 14733 TOC 1272 980 980 330 980 638
Anions F 3091 1531 1531 34 1531 180 Cl 68 20 20 4926 20 76 Br - - - - - -
NO2 3375 4327 4327 153 4327 5245 NO3 15563 23455 23455 9866 23455 24307 PO4 1367 211 211 5725 211 1797 SO4 568 3727 3727 81 3727 2623 C2O4 1272 980 980 330 980 638 CO3 23 1113 1113 58658 1113 14733 CN - - - - - - NH3 - - - - - -
Free OH - 186900 186900 36900 186900 Total OH 296530 203636 203636 64161 203636 17740
Oxide wt% Ag2O 0.08 - - - - - Al2O3 9.71 20.56 20.64 12.77 20.64 23.01 As2O3 - - - 0.69 - - B2O3 0.28 0.58 0.58 0.49 0.58 2.12 BaO - 0.07 0.07 - 0.07 - BeO - - - - - -
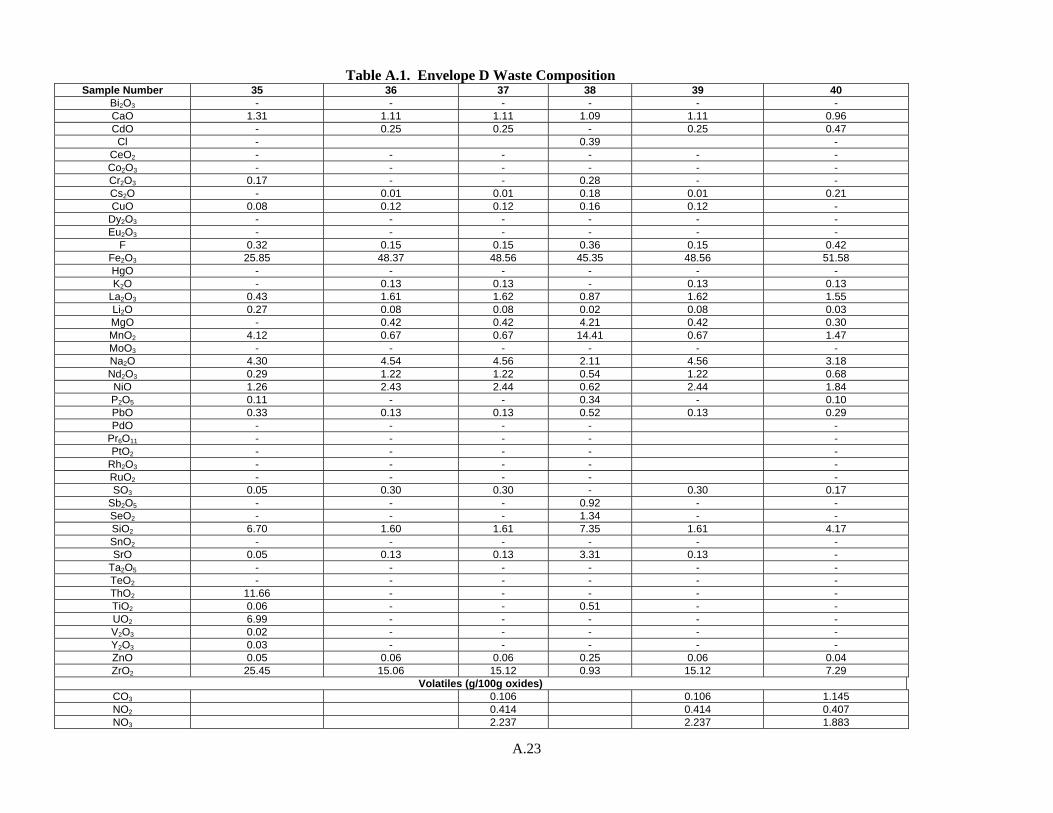
A.23
Table A.1. Envelope D Waste Composition Sample Number 35 36 37 38 39 40
Bi2O3 - - - - - - CaO 1.31 1.11 1.11 1.09 1.11 0.96 CdO - 0.25 0.25 - 0.25 0.47 Cl - 0.39 -
CeO2 - - - - - - Co2O3 - - - - - - Cr2O3 0.17 - - 0.28 - - Cs2O - 0.01 0.01 0.18 0.01 0.21 CuO 0.08 0.12 0.12 0.16 0.12 -
Dy2O3 - - - - - - Eu2O3 - - - - - -
F 0.32 0.15 0.15 0.36 0.15 0.42 Fe2O3 25.85 48.37 48.56 45.35 48.56 51.58 HgO - - - - - - K2O - 0.13 0.13 - 0.13 0.13
La2O3 0.43 1.61 1.62 0.87 1.62 1.55 Li2O 0.27 0.08 0.08 0.02 0.08 0.03 MgO - 0.42 0.42 4.21 0.42 0.30 MnO2 4.12 0.67 0.67 14.41 0.67 1.47 MoO3 - - - - - - Na2O 4.30 4.54 4.56 2.11 4.56 3.18 Nd2O3 0.29 1.22 1.22 0.54 1.22 0.68 NiO 1.26 2.43 2.44 0.62 2.44 1.84 P2O5 0.11 - - 0.34 - 0.10 PbO 0.33 0.13 0.13 0.52 0.13 0.29 PdO - - - - -
Pr6O11 - - - - - PtO2 - - - - -
Rh2O3 - - - - - RuO2 - - - - - SO3 0.05 0.30 0.30 - 0.30 0.17
Sb2O5 - - - 0.92 - - SeO2 - - - 1.34 - - SiO2 6.70 1.60 1.61 7.35 1.61 4.17 SnO2 - - - - - - SrO 0.05 0.13 0.13 3.31 0.13 -
Ta2O5 - - - - - - TeO2 - - - - - - ThO2 11.66 - - - - - TiO2 0.06 - - 0.51 - - UO2 6.99 - - - - - V2O3 0.02 - - - - - Y2O3 0.03 - - - - - ZnO 0.05 0.06 0.06 0.25 0.06 0.04 ZrO2 25.45 15.06 15.12 0.93 15.12 7.29
Volatiles (g/100g oxides) CO3 0.106 0.106 1.145 NO2 0.414 0.414 0.407 NO3 2.237 2.237 1.883
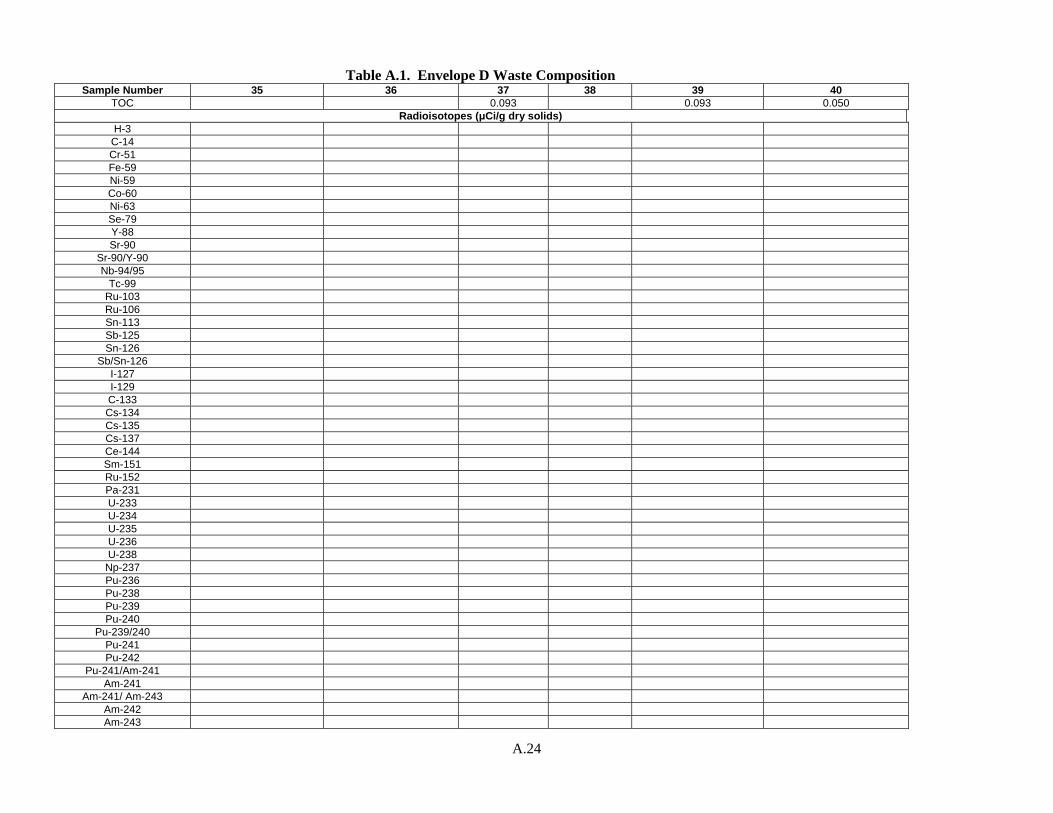
A.24
Table A.1. Envelope D Waste Composition Sample Number 35 36 37 38 39 40
TOC 0.093 0.093 0.050 Radioisotopes (μCi/g dry solids)
H-3 C-14 Cr-51 Fe-59 Ni-59 Co-60 Ni-63 Se-79 Y-88 Sr-90
Sr-90/Y-90 Nb-94/95
Tc-99 Ru-103 Ru-106 Sn-113 Sb-125 Sn-126
Sb/Sn-126 I-127 I-129 C-133 Cs-134 Cs-135 Cs-137 Ce-144 Sm-151 Ru-152 Pa-231 U-233 U-234 U-235 U-236 U-238
Np-237 Pu-236 Pu-238 Pu-239 Pu-240
Pu-239/240 Pu-241 Pu-242
Pu-241/Am-241 Am-241
Am-241/ Am-243 Am-242 Am-243
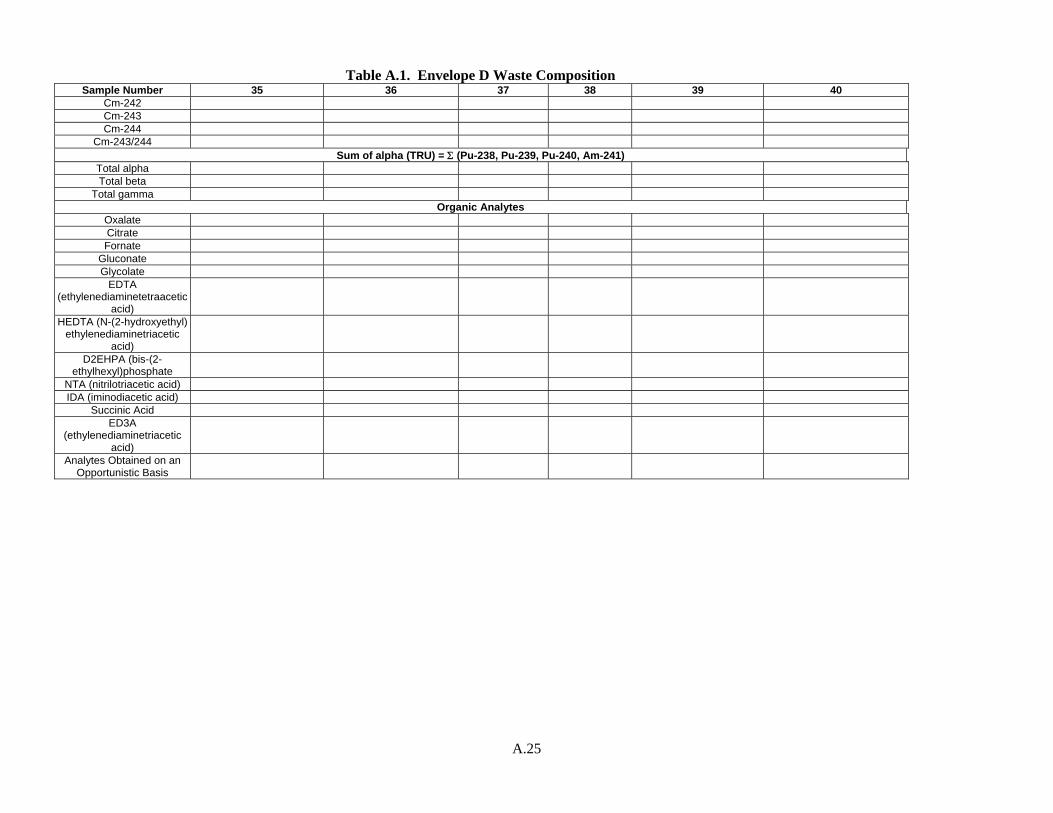
A.25
Table A.1. Envelope D Waste Composition Sample Number 35 36 37 38 39 40
Cm-242 Cm-243 Cm-244
Cm-243/244 Sum of alpha (TRU) = Σ (Pu-238, Pu-239, Pu-240, Am-241)
Total alpha Total beta
Total gamma Organic Analytes
Oxalate Citrate Fornate
Gluconate Glycolate
EDTA (ethylenediaminetetraacetic
acid) HEDTA (N-(2-hydroxyethyl)
ethylenediaminetriacetic acid)
D2EHPA (bis-(2-ethylhexyl)phosphate
NTA (nitrilotriacetic acid) IDA (iminodiacetic acid)
Succinic Acid ED3A
(ethylenediaminetriacetic acid)
Analytes Obtained on an Opportunistic Basis
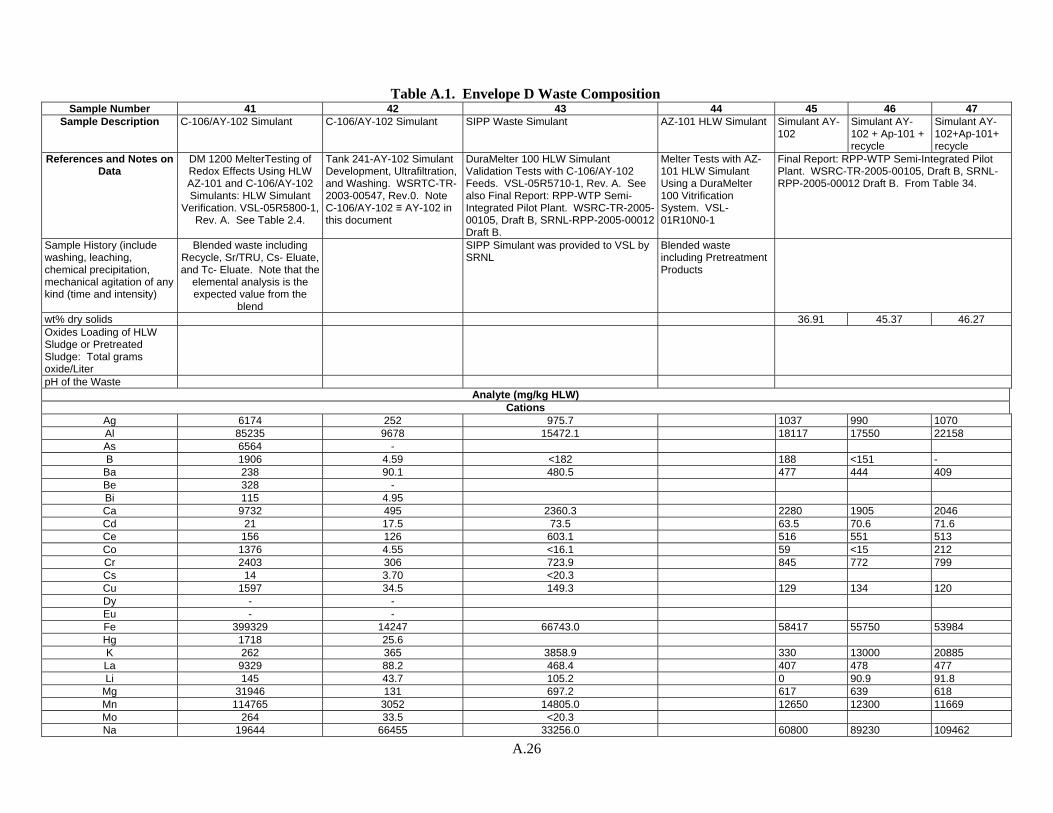
A.26
Table A.1. Envelope D Waste Composition
Sample Number 41 42 43 44 45 46 47 Sample Description C-106/AY-102 Simulant C-106/AY-102 Simulant SIPP Waste Simulant AZ-101 HLW Simulant Simulant AY-
102 Simulant AY-102 + Ap-101 + recycle
Simulant AY-102+Ap-101+ recycle
References and Notes on Data
DM 1200 MelterTesting of Redox Effects Using HLW AZ-101 and C-106/AY-102 Simulants: HLW Simulant
Verification. VSL-05R5800-1, Rev. A. See Table 2.4.
Tank 241-AY-102 Simulant Development, Ultrafiltration, and Washing. WSRTC-TR-2003-00547, Rev.0. Note C-106/AY-102 ≡ AY-102 in this document
DuraMelter 100 HLW Simulant Validation Tests with C-106/AY-102 Feeds. VSL-05R5710-1, Rev. A. See also Final Report: RPP-WTP Semi-Integrated Pilot Plant. WSRC-TR-2005-00105, Draft B, SRNL-RPP-2005-00012 Draft B.
Melter Tests with AZ-101 HLW Simulant Using a DuraMelter 100 Vitrification System. VSL-01R10N0-1
Final Report: RPP-WTP Semi-Integrated Pilot Plant. WSRC-TR-2005-00105, Draft B, SRNL-RPP-2005-00012 Draft B. From Table 34.
Sample History (include washing, leaching, chemical precipitation, mechanical agitation of any kind (time and intensity)
Blended waste including Recycle, Sr/TRU, Cs- Eluate, and Tc- Eluate. Note that the
elemental analysis is the expected value from the
blend
SIPP Simulant was provided to VSL by SRNL
Blended waste including Pretreatment Products
wt% dry solids 36.91 45.37 46.27 Oxides Loading of HLW Sludge or Pretreated Sludge: Total grams oxide/Liter pH of the Waste
Analyte (mg/kg HLW) Cations
Ag 6174 252 975.7 1037 990 1070 Al 85235 9678 15472.1 18117 17550 22158 As 6564 - B 1906 4.59 <182 188 <151 -
Ba 238 90.1 480.5 477 444 409 Be 328 - Bi 115 4.95 Ca 9732 495 2360.3 2280 1905 2046 Cd 21 17.5 73.5 63.5 70.6 71.6 Ce 156 126 603.1 516 551 513 Co 1376 4.55 <16.1 59 <15 212 Cr 2403 306 723.9 845 772 799 Cs 14 3.70 <20.3 Cu 1597 34.5 149.3 129 134 120 Dy - - Eu - - Fe 399329 14247 66743.0 58417 55750 53984 Hg 1718 25.6 K 262 365 3858.9 330 13000 20885 La 9329 88.2 468.4 407 478 477 Li 145 43.7 105.2 0 90.9 91.8
Mg 31946 131 697.2 617 639 618 Mn 114765 3052 14805.0 12650 12300 11669 Mo 264 33.5 <20.3 Na 19644 66455 33256.0 60800 89230 109462
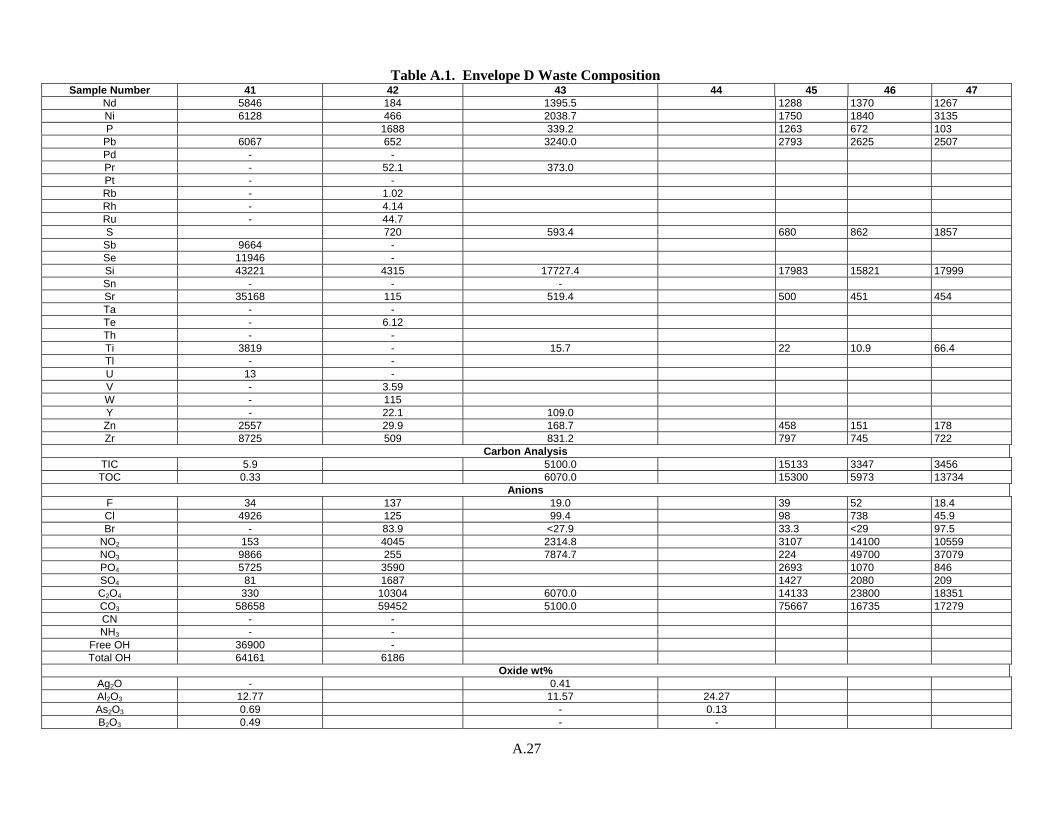
A.27
Table A.1. Envelope D Waste Composition Sample Number 41 42 43 44 45 46 47
Nd 5846 184 1395.5 1288 1370 1267 Ni 6128 466 2038.7 1750 1840 3135 P 1688 339.2 1263 672 103
Pb 6067 652 3240.0 2793 2625 2507 Pd - - Pr - 52.1 373.0 Pt - - Rb - 1.02 Rh - 4.14 Ru - 44.7 S 720 593.4 680 862 1857
Sb 9664 - Se 11946 - Si 43221 4315 17727.4 17983 15821 17999 Sn - - - Sr 35168 115 519.4 500 451 454 Ta - - Te - 6.12 Th - - Ti 3819 - 15.7 22 10.9 66.4 Tl - - U 13 - V - 3.59 W - 115 Y - 22.1 109.0 Zn 2557 29.9 168.7 458 151 178 Zr 8725 509 831.2 797 745 722
Carbon Analysis TIC 5.9 5100.0 15133 3347 3456 TOC 0.33 6070.0 15300 5973 13734
Anions F 34 137 19.0 39 52 18.4 Cl 4926 125 99.4 98 738 45.9 Br - 83.9 <27.9 33.3 <29 97.5
NO2 153 4045 2314.8 3107 14100 10559 NO3 9866 255 7874.7 224 49700 37079 PO4 5725 3590 2693 1070 846 SO4 81 1687 1427 2080 209 C2O4 330 10304 6070.0 14133 23800 18351 CO3 58658 59452 5100.0 75667 16735 17279 CN - - NH3 - -
Free OH 36900 - Total OH 64161 6186
Oxide wt% Ag2O - 0.41 Al2O3 12.77 11.57 24.27 As2O3 0.69 - 0.13 B2O3 0.49 - -
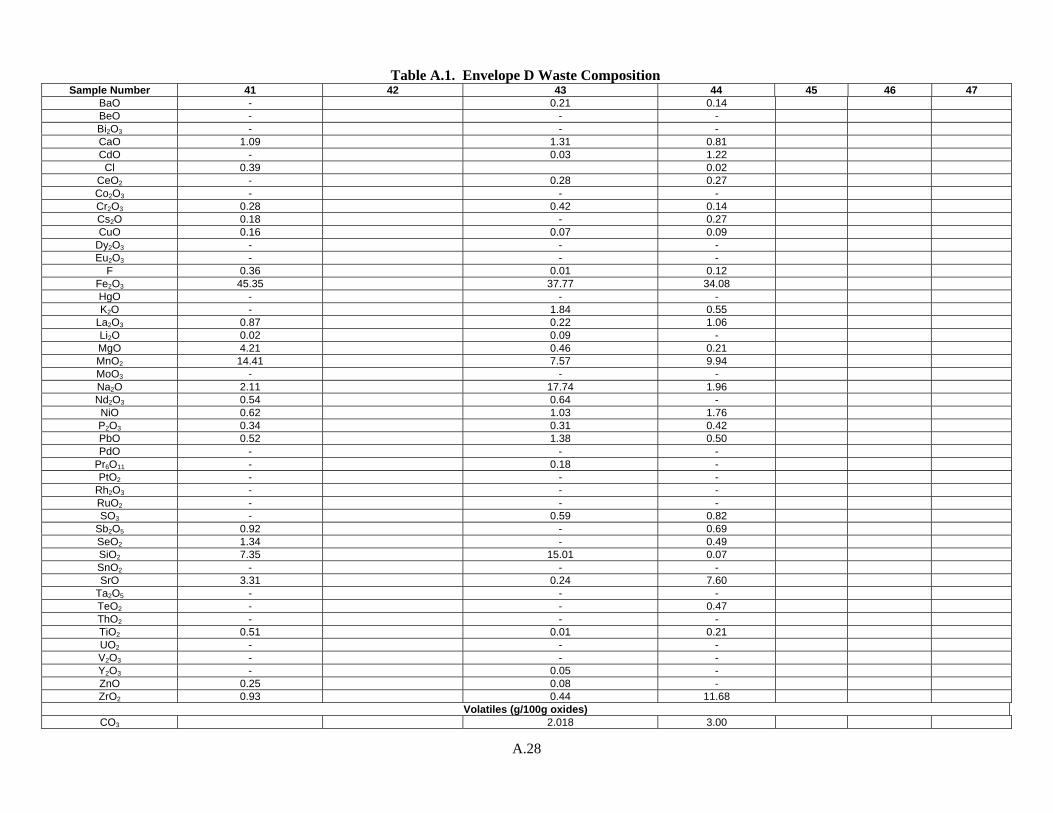
A.28
Table A.1. Envelope D Waste Composition Sample Number 41 42 43 44 45 46 47
BaO - 0.21 0.14 BeO - - - Bi2O3 - - - CaO 1.09 1.31 0.81 CdO - 0.03 1.22 Cl 0.39 0.02
CeO2 - 0.28 0.27 Co2O3 - - - Cr2O3 0.28 0.42 0.14 Cs2O 0.18 - 0.27 CuO 0.16 0.07 0.09
Dy2O3 - - - Eu2O3 - - -
F 0.36 0.01 0.12 Fe2O3 45.35 37.77 34.08 HgO - - - K2O - 1.84 0.55
La2O3 0.87 0.22 1.06 Li2O 0.02 0.09 - MgO 4.21 0.46 0.21 MnO2 14.41 7.57 9.94 MoO3 - - - Na2O 2.11 17.74 1.96 Nd2O3 0.54 0.64 - NiO 0.62 1.03 1.76 P2O3 0.34 0.31 0.42 PbO 0.52 1.38 0.50 PdO - - -
Pr6O11 - 0.18 - PtO2 - - -
Rh2O3 - - - RuO2 - - - SO3 - 0.59 0.82
Sb2O5 0.92 - 0.69 SeO2 1.34 - 0.49 SiO2 7.35 15.01 0.07 SnO2 - - - SrO 3.31 0.24 7.60
Ta2O5 - - - TeO2 - - 0.47 ThO2 - - - TiO2 0.51 0.01 0.21 UO2 - - - V2O3 - - - Y2O3 - 0.05 - ZnO 0.25 0.08 - ZrO2 0.93 0.44 11.68
Volatiles (g/100g oxides) CO3 2.018 3.00
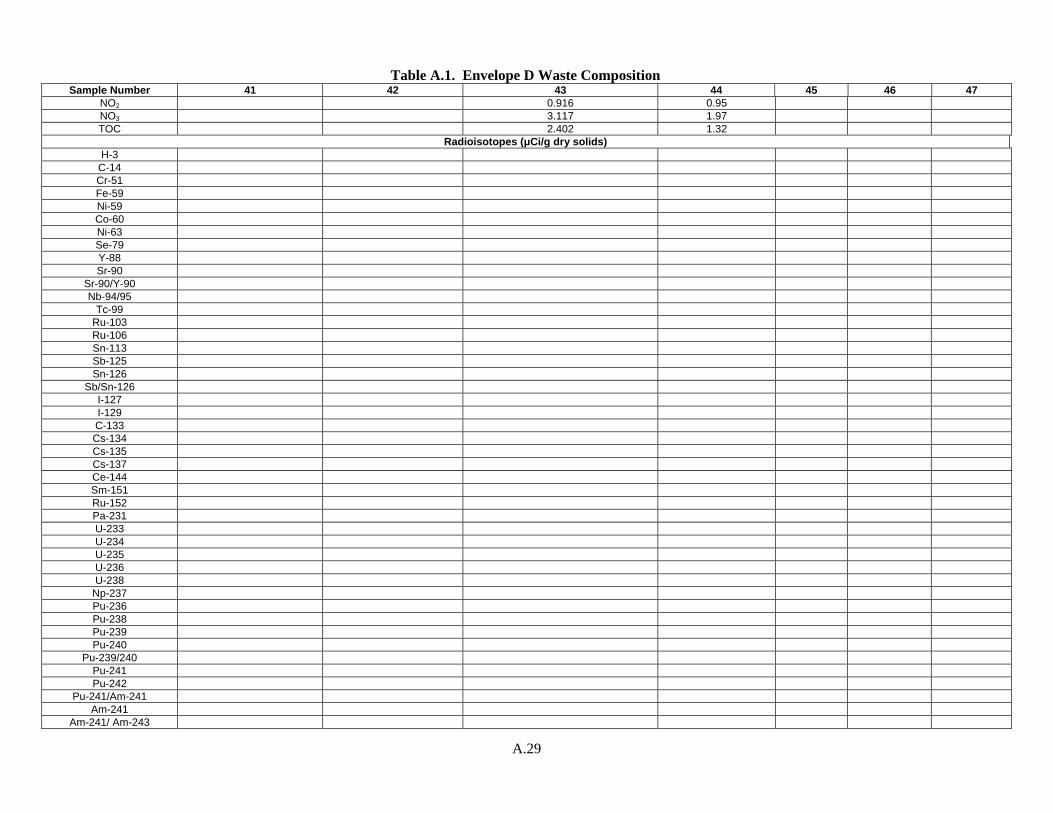
A.29
Table A.1. Envelope D Waste Composition Sample Number 41 42 43 44 45 46 47
NO2 0.916 0.95 NO3 3.117 1.97 TOC 2.402 1.32
Radioisotopes (μCi/g dry solids) H-3
C-14 Cr-51 Fe-59 Ni-59 Co-60 Ni-63 Se-79 Y-88 Sr-90
Sr-90/Y-90 Nb-94/95
Tc-99 Ru-103 Ru-106 Sn-113 Sb-125 Sn-126
Sb/Sn-126 I-127 I-129 C-133 Cs-134 Cs-135 Cs-137 Ce-144 Sm-151 Ru-152 Pa-231 U-233 U-234 U-235 U-236 U-238
Np-237 Pu-236 Pu-238 Pu-239 Pu-240
Pu-239/240 Pu-241 Pu-242
Pu-241/Am-241 Am-241
Am-241/ Am-243
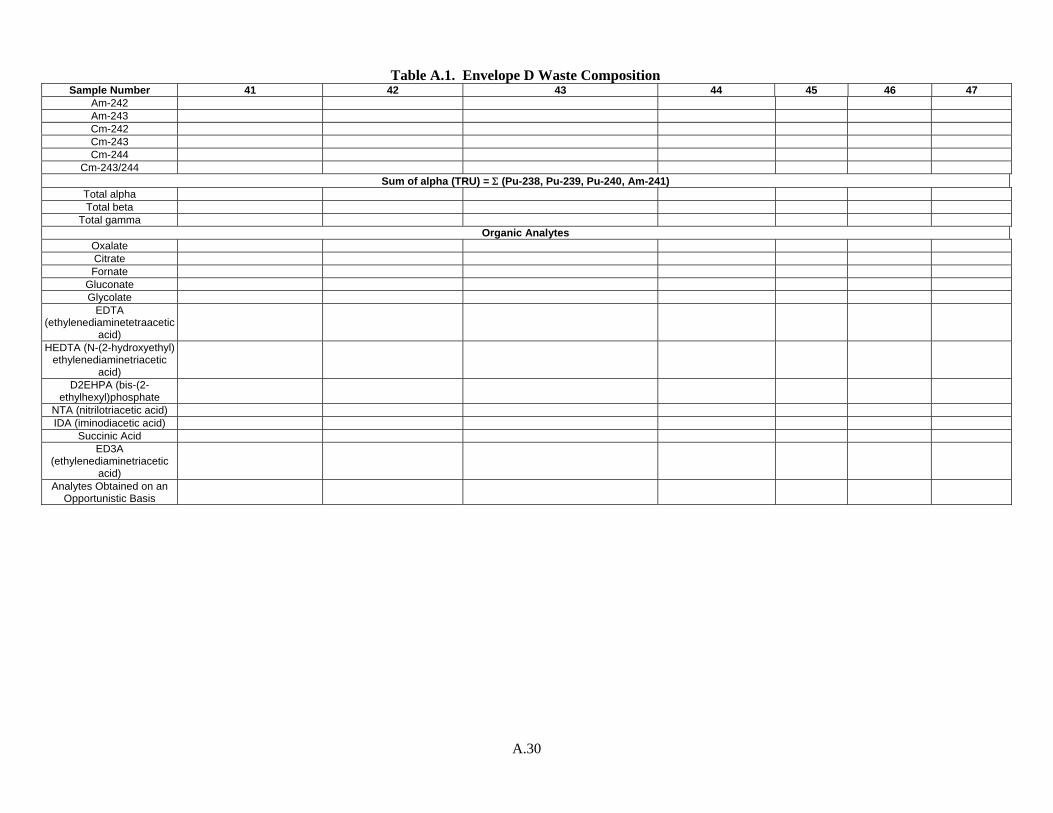
A.30
Table A.1. Envelope D Waste Composition Sample Number 41 42 43 44 45 46 47
Am-242 Am-243 Cm-242 Cm-243 Cm-244
Cm-243/244 Sum of alpha (TRU) = Σ (Pu-238, Pu-239, Pu-240, Am-241)
Total alpha Total beta
Total gamma Organic Analytes
Oxalate Citrate Fornate
Gluconate Glycolate
EDTA (ethylenediaminetetraacetic
acid) HEDTA (N-(2-hydroxyethyl)
ethylenediaminetriacetic acid)
D2EHPA (bis-(2-ethylhexyl)phosphate
NTA (nitrilotriacetic acid) IDA (iminodiacetic acid)
Succinic Acid ED3A
(ethylenediaminetriacetic acid)
Analytes Obtained on an Opportunistic Basis
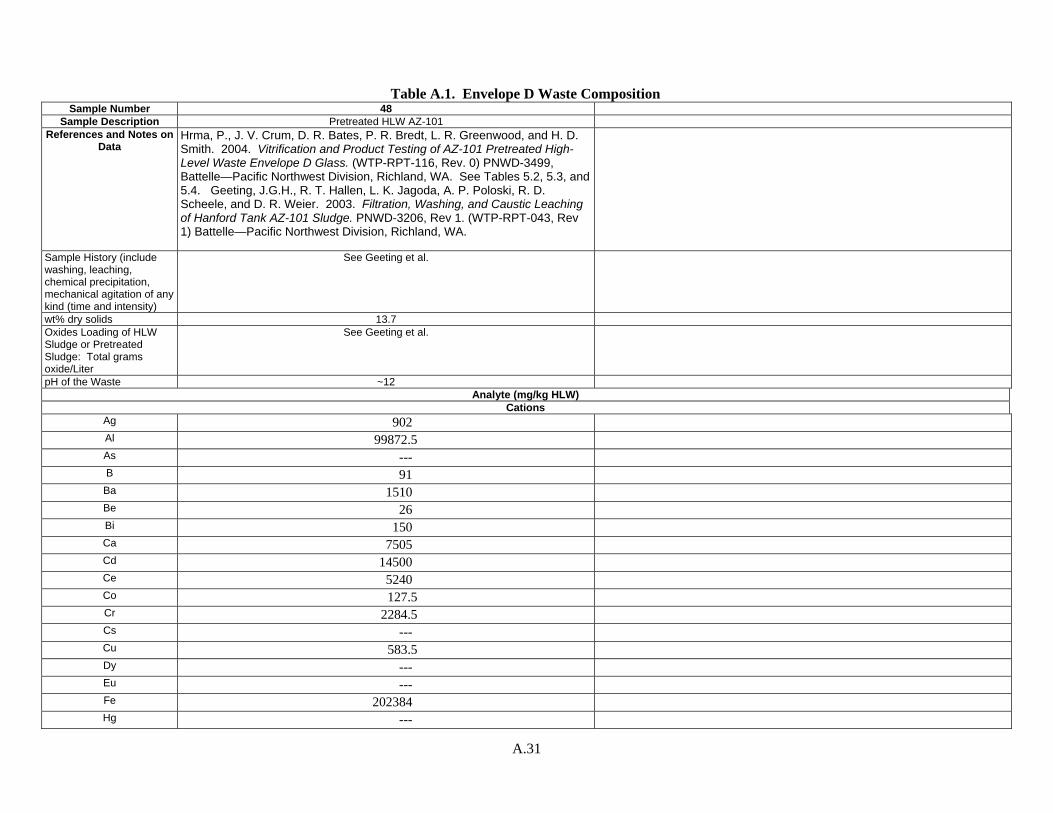
A.31
Table A.1. Envelope D Waste Composition
Sample Number 48 Sample Description Pretreated HLW AZ-101
References and Notes on Data
Hrma, P., J. V. Crum, D. R. Bates, P. R. Bredt, L. R. Greenwood, and H. D. Smith. 2004. Vitrification and Product Testing of AZ-101 Pretreated High-Level Waste Envelope D Glass. (WTP-RPT-116, Rev. 0) PNWD-3499, Battelle—Pacific Northwest Division, Richland, WA. See Tables 5.2, 5.3, and 5.4. Geeting, J.G.H., R. T. Hallen, L. K. Jagoda, A. P. Poloski, R. D. Scheele, and D. R. Weier. 2003. Filtration, Washing, and Caustic Leaching of Hanford Tank AZ-101 Sludge. PNWD-3206, Rev 1. (WTP-RPT-043, Rev 1) Battelle—Pacific Northwest Division, Richland, WA.
Sample History (include washing, leaching, chemical precipitation, mechanical agitation of any kind (time and intensity)
See Geeting et al.
wt% dry solids 13.7 Oxides Loading of HLW Sludge or Pretreated Sludge: Total grams oxide/Liter
See Geeting et al.
pH of the Waste ~12
Analyte (mg/kg HLW) Cations
Ag 902 Al 99872.5 As --- B 91
Ba 1510 Be 26 Bi 150 Ca 7505 Cd 14500 Ce 5240 Co 127.5 Cr 2284.5 Cs --- Cu 583.5 Dy --- Eu --- Fe 202384 Hg ---
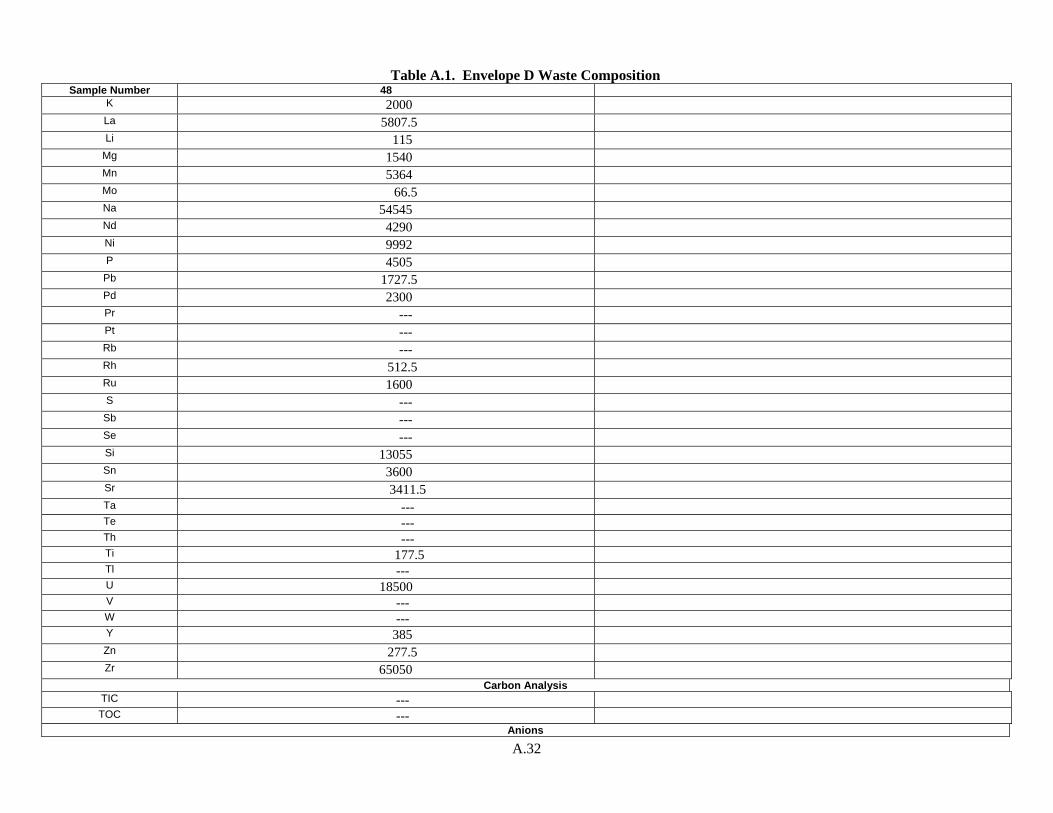
A.32
Table A.1. Envelope D Waste Composition Sample Number 48
K 2000 La 5807.5 Li 115
Mg 1540 Mn 5364 Mo 66.5 Na 54545 Nd 4290 Ni 9992 P 4505
Pb 1727.5 Pd 2300 Pr --- Pt --- Rb --- Rh 512.5 Ru 1600 S ---
Sb --- Se --- Si 13055 Sn 3600 Sr 3411.5 Ta --- Te --- Th --- Ti 177.5 Tl --- U 18500 V --- W --- Y 385 Zn 277.5 Zr 65050
Carbon Analysis TIC --- TOC ---
Anions
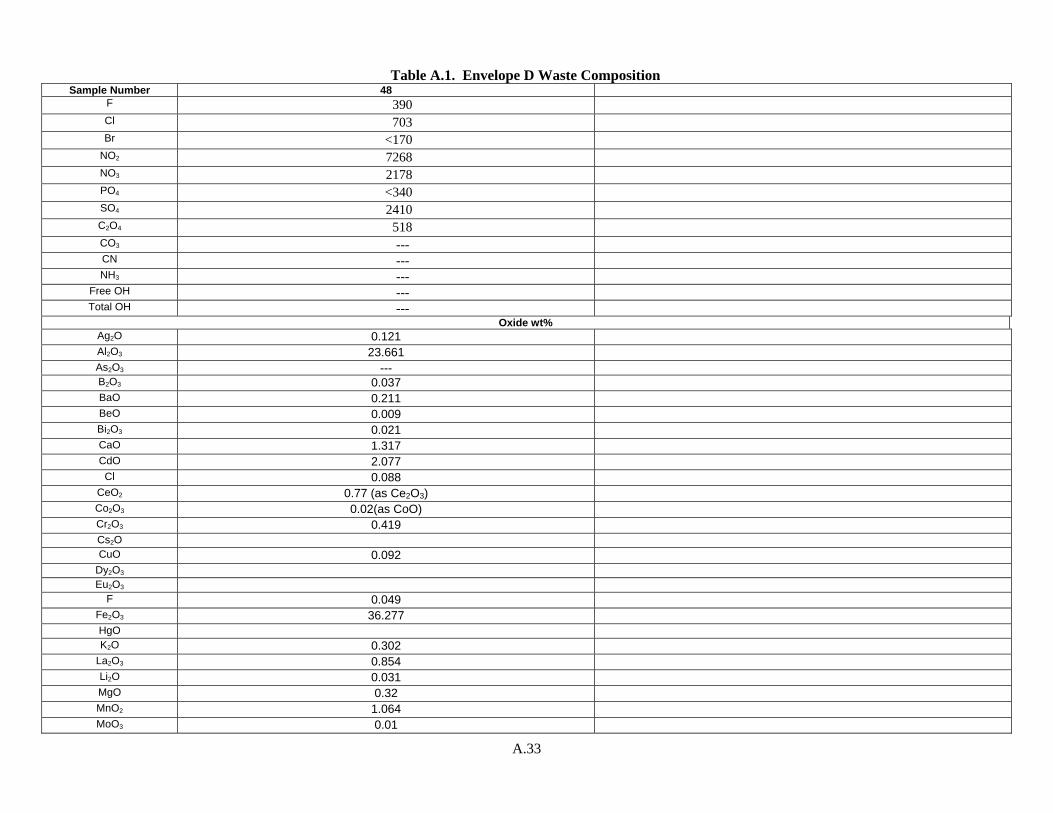
A.33
Table A.1. Envelope D Waste Composition Sample Number 48
F 390 Cl 703 Br <170
NO2 7268 NO3 2178 PO4 <340 SO4 2410 C2O4 518 CO3 --- CN --- NH3 ---
Free OH --- Total OH ---
Oxide wt% Ag2O 0.121 Al2O3 23.661 As2O3 --- B2O3 0.037 BaO 0.211 BeO 0.009 Bi2O3 0.021 CaO 1.317 CdO 2.077 Cl 0.088
CeO2 0.77 (as Ce2O3) Co2O3 0.02(as CoO) Cr2O3 0.419 Cs2O CuO 0.092
Dy2O3 Eu2O3
F 0.049 Fe2O3 36.277 HgO K2O 0.302
La2O3 0.854 Li2O 0.031 MgO 0.32 MnO2 1.064 MoO3 0.01
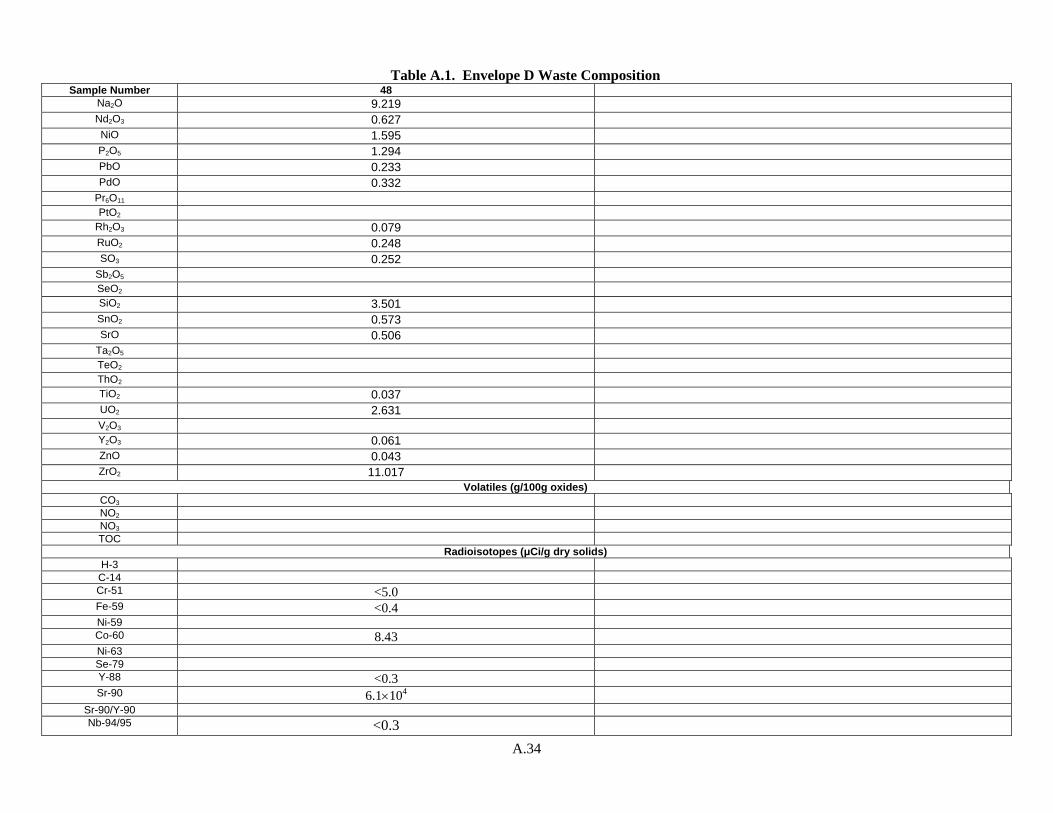
A.34
Table A.1. Envelope D Waste Composition Sample Number 48
Na2O 9.219 Nd2O3 0.627 NiO 1.595 P2O5 1.294 PbO 0.233 PdO 0.332
Pr6O11 PtO2
Rh2O3 0.079 RuO2 0.248 SO3 0.252
Sb2O5 SeO2 SiO2 3.501 SnO2 0.573 SrO 0.506
Ta2O5 TeO2 ThO2 TiO2 0.037 UO2 2.631 V2O3 Y2O3 0.061 ZnO 0.043 ZrO2 11.017
Volatiles (g/100g oxides) CO3 NO2 NO3 TOC
Radioisotopes (μCi/g dry solids) H-3
C-14 Cr-51 <5.0 Fe-59 <0.4 Ni-59 Co-60 8.43 Ni-63 Se-79 Y-88 <0.3 Sr-90 6.1×10⁴
Sr-90/Y-90 Nb-94/95 <0.3
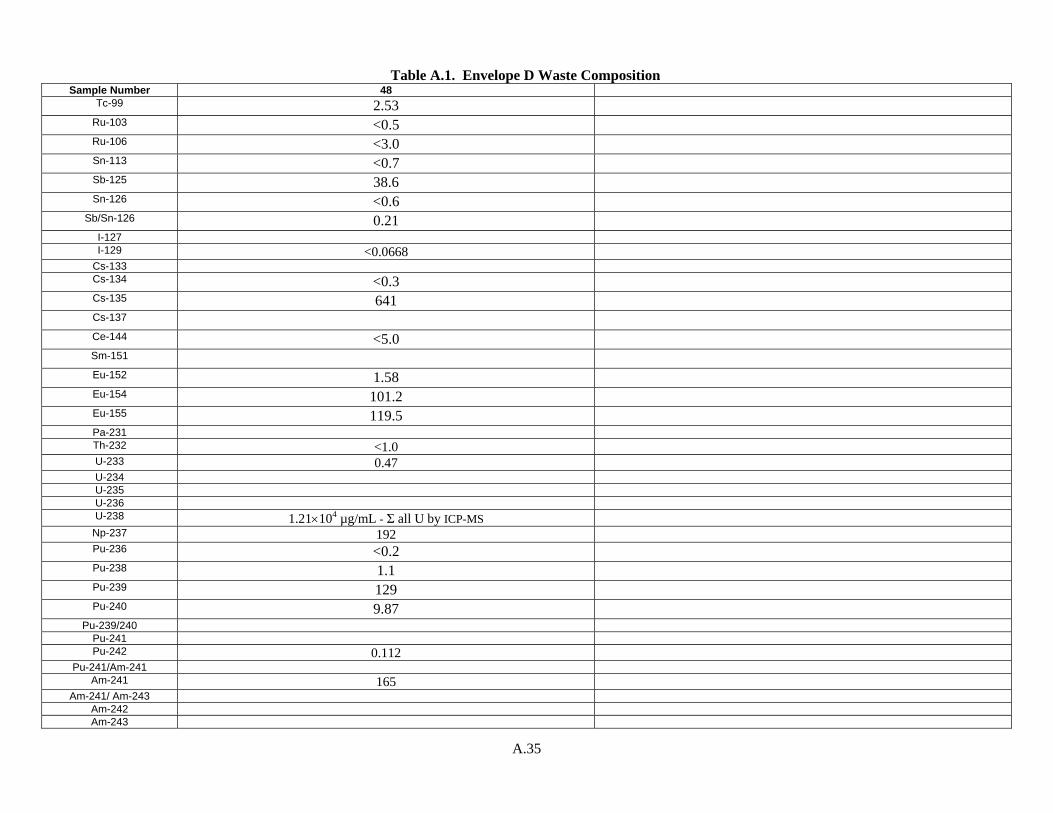
A.35
Table A.1. Envelope D Waste Composition Sample Number 48
Tc-99 2.53 Ru-103 <0.5 Ru-106 <3.0 Sn-113 <0.7 Sb-125 38.6 Sn-126 <0.6
Sb/Sn-126 0.21 I-127 I-129 <0.0668
Cs-133 Cs-134 <0.3 Cs-135 641 Cs-137 Ce-144 <5.0 Sm-151 Eu-152 1.58 Eu-154 101.2 Eu-155 119.5 Pa-231 Th-232 <1.0 U-233 0.47 U-234 U-235 U-236 U-238 1.21×10⁴ µg/mL - Σ all U by ICP-MS
Np-237 192 Pu-236 <0.2 Pu-238 1.1 Pu-239 129 Pu-240 9.87
Pu-239/240 Pu-241 Pu-242 0.112
Pu-241/Am-241 Am-241 165
Am-241/ Am-243 Am-242 Am-243
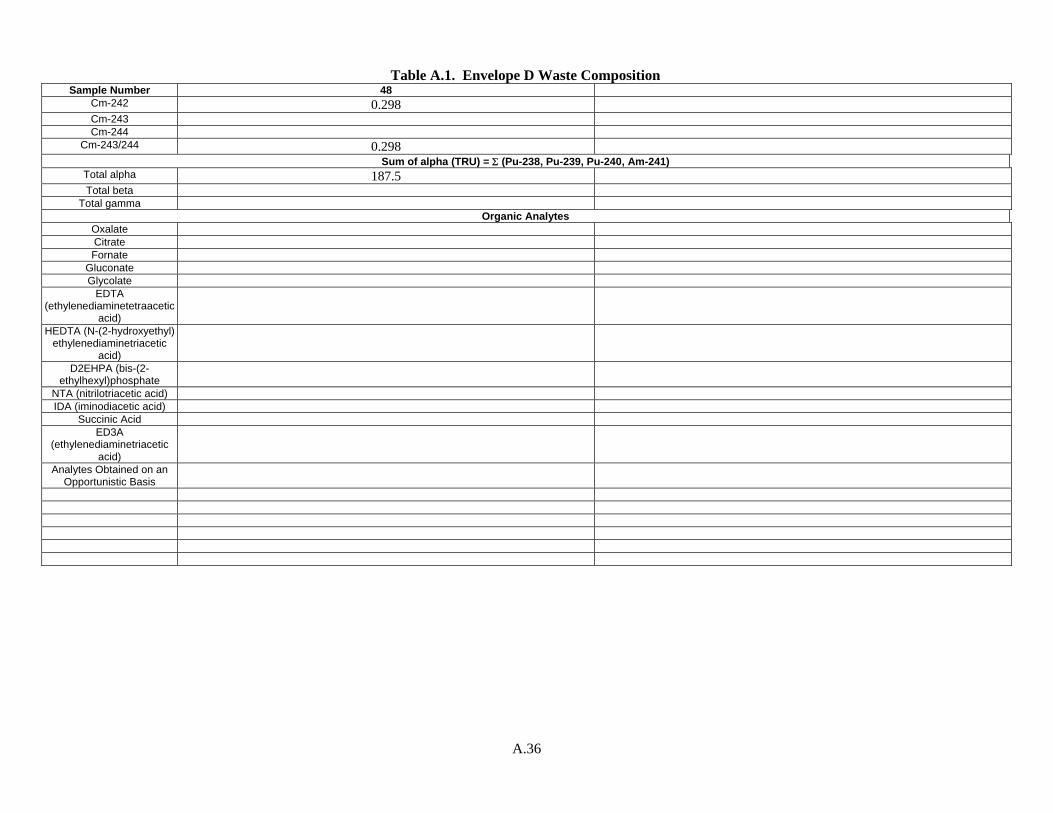
A.36
Table A.1. Envelope D Waste Composition Sample Number 48
Cm-242 0.298 Cm-243 Cm-244
Cm-243/244 0.298 Sum of alpha (TRU) = Σ (Pu-238, Pu-239, Pu-240, Am-241)
Total alpha 187.5 Total beta
Total gamma Organic Analytes
Oxalate Citrate Fornate
Gluconate Glycolate
EDTA (ethylenediaminetetraacetic
acid) HEDTA (N-(2-hydroxyethyl)
ethylenediaminetriacetic acid)
D2EHPA (bis-(2-ethylhexyl)phosphate
NTA (nitrilotriacetic acid) IDA (iminodiacetic acid)
Succinic Acid ED3A
(ethylenediaminetriacetic acid)
Analytes Obtained on an Opportunistic Basis
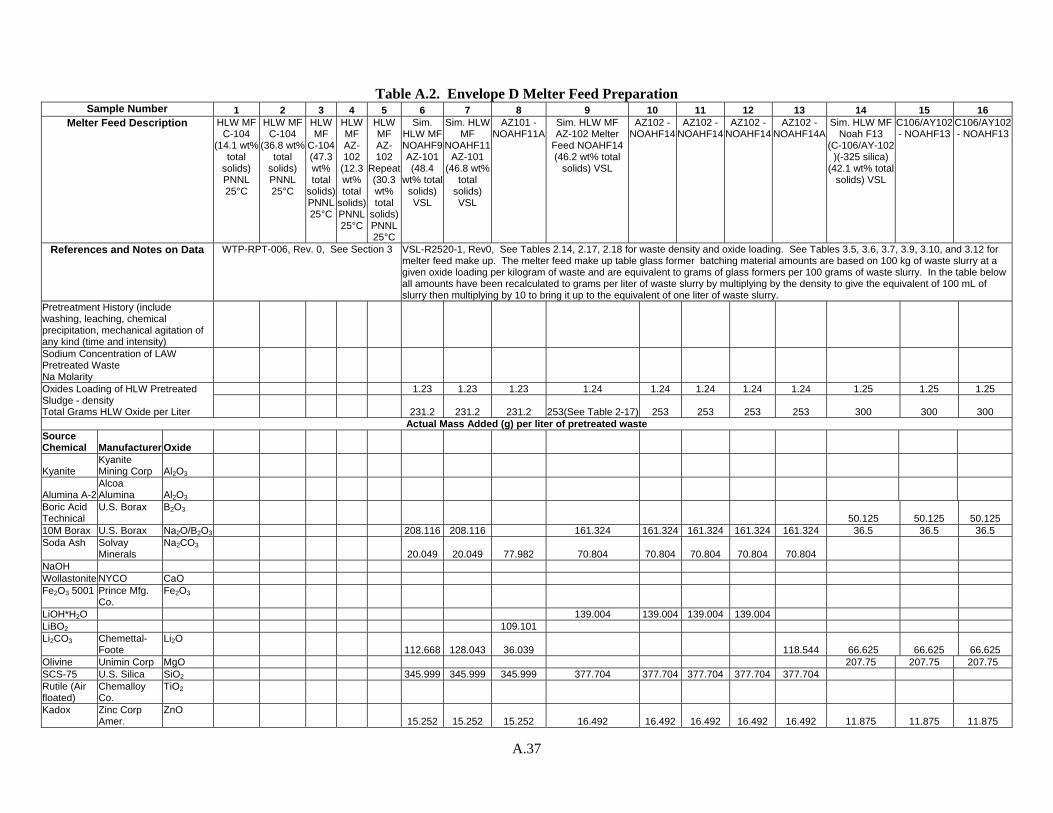
A.37
Table A.2. Envelope D Melter Feed Preparation
Sample Number 1 2 3 4 5 6 7 8 9 10 11 12 13 14 15 16 Melter Feed Description HLW MF
C-104 (14.1 wt%
total solids) PNNL 25°C
HLW MF C-104
(36.8 wt% total
solids) PNNL 25°C
HLW MF
C-104 (47.3 wt% total
solids) PNNL 25°C
HLW MF AZ-102
(12.3 wt% total
solids) PNNL 25°C
HLW MF AZ-102
Repeat (30.3 wt% total
solids) PNNL 25°C
Sim. HLW MF NOAHF9 AZ-101 (48.4
wt% total solids) VSL
Sim. HLW MF
NOAHF11 AZ-101
(46.8 wt% total
solids) VSL
AZ101 - NOAHF11A
Sim. HLW MF AZ-102 Melter
Feed NOAHF14 (46.2 wt% total
solids) VSL
AZ102 - NOAHF14
AZ102 - NOAHF14
AZ102 - NOAHF14
AZ102 - NOAHF14A
Sim. HLW MF Noah F13
(C-106/AY-102 )(-325 silica)
(42.1 wt% total solids) VSL
C106/AY102 - NOAHF13
C106/AY102 - NOAHF13
References and Notes on Data WTP-RPT-006, Rev. 0, See Section 3 VSL-R2520-1, Rev0, See Tables 2.14, 2.17, 2.18 for waste density and oxide loading. See Tables 3.5, 3.6, 3.7, 3.9, 3.10, and 3.12 for melter feed make up. The melter feed make up table glass former batching material amounts are based on 100 kg of waste slurry at a given oxide loading per kilogram of waste and are equivalent to grams of glass formers per 100 grams of waste slurry. In the table below all amounts have been recalculated to grams per liter of waste slurry by multiplying by the density to give the equivalent of 100 mL of slurry then multiplying by 10 to bring it up to the equivalent of one liter of waste slurry.
Pretreatment History (include washing, leaching, chemical precipitation, mechanical agitation of any kind (time and intensity) Sodium Concentration of LAW Pretreated Waste Na Molarity
1.23 1.23 1.23 1.24 1.24 1.24 1.24 1.24 1.25 1.25 1.25 Oxides Loading of HLW Pretreated Sludge - density Total Grams HLW Oxide per Liter 231.2 231.2 231.2 253(See Table 2-17) 253 253 253 253 300 300 300
Actual Mass Added (g) per liter of pretreated waste Source Chemical Manufacturer Oxide
Kyanite Kyanite Mining Corp Al2O3
Alumina A-2 Alcoa Alumina Al2O3
Boric Acid Technical
U.S. Borax B2O3 50.125 50.125 50.125
10M Borax U.S. Borax Na2O/B2O3 208.116 208.116 161.324 161.324 161.324 161.324 161.324 36.5 36.5 36.5 Soda Ash Solvay
Minerals Na2CO3
20.049 20.049 77.982 70.804 70.804 70.804 70.804 70.804 NaOH Wollastonite NYCO CaO Fe2O3 5001 Prince Mfg.
Co. Fe2O3
LiOH*H2O 139.004 139.004 139.004 139.004 LiBO2 109.101 Li2CO3 Chemettal-
Foote Li2O
112.668 128.043 36.039 118.544 66.625 66.625 66.625 Olivine Unimin Corp MgO 207.75 207.75 207.75 SCS-75 U.S. Silica SiO2 345.999 345.999 345.999 377.704 377.704 377.704 377.704 377.704 Rutile (Air floated)
Chemalloy Co.
TiO2
Kadox Zinc Corp Amer.
ZnO 15.252 15.252 15.252 16.492 16.492 16.492 16.492 16.492 11.875 11.875 11.875
A.38
Table A.2. Envelope D Melter Feed Preparation Sample Number 1 2 3 4 5 6 7 8 9 10 11 12 13 14 15 16
Zircon Amer. Milner. Inc.
ZrO2
Sucrose Amalgamated Sugar Co.
Sugar
Mixing Operation Data Processing Scale (lab/bench, pilot, or
full) Mixing Activity/Property
Order of Chemical Additions Mixing Time Impeller Speed Impeller Diameter Tank Diameter Number of Baffles Size of Baffles Depth of Impeller Comments
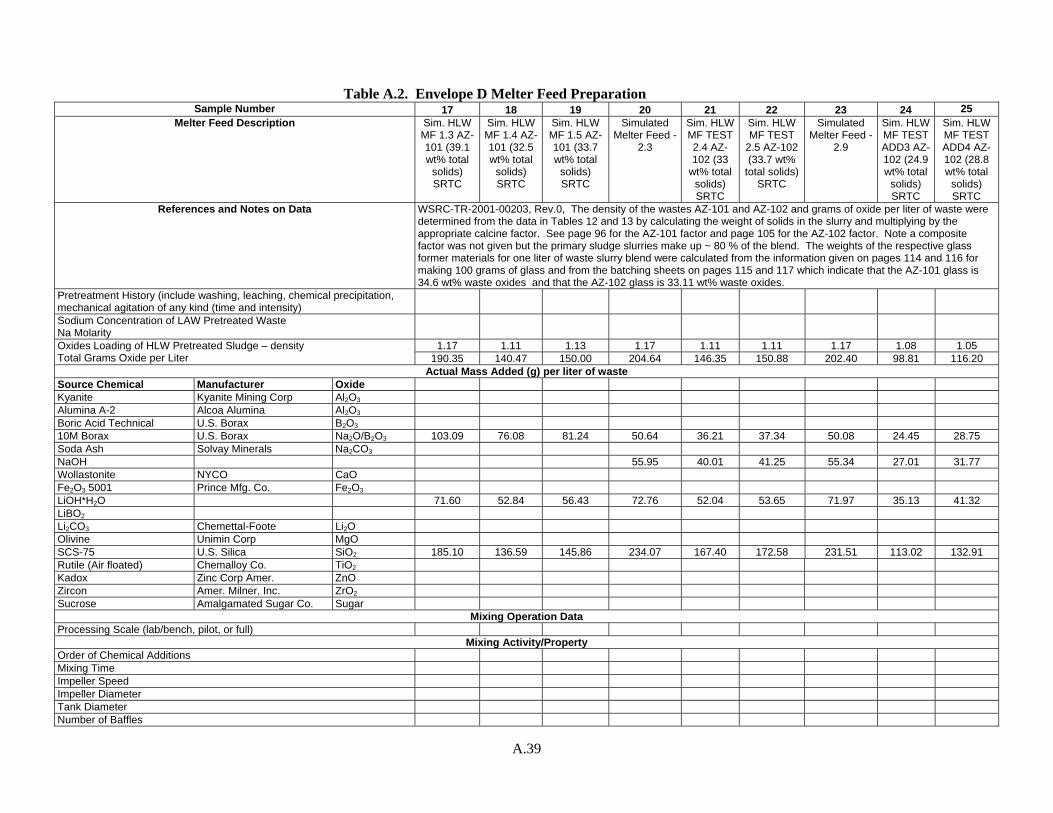
A.39
Table A.2. Envelope D Melter Feed Preparation
Sample Number 17 18 19 20 21 22 23 24 25 Melter Feed Description Sim. HLW
MF 1.3 AZ-101 (39.1 wt% total
solids) SRTC
Sim. HLW MF 1.4 AZ-101 (32.5 wt% total
solids) SRTC
Sim. HLW MF 1.5 AZ-101 (33.7 wt% total
solids) SRTC
Simulated Melter Feed -
2.3
Sim. HLW MF TEST 2.4 AZ-102 (33
wt% total solids) SRTC
Sim. HLW MF TEST
2.5 AZ-102 (33.7 wt%
total solids) SRTC
Simulated Melter Feed -
2.9
Sim. HLW MF TEST ADD3 AZ-102 (24.9 wt% total
solids) SRTC
Sim. HLW MF TEST ADD4 AZ-102 (28.8 wt% total
solids) SRTC
References and Notes on Data WSRC-TR-2001-00203, Rev.0, The density of the wastes AZ-101 and AZ-102 and grams of oxide per liter of waste were determined from the data in Tables 12 and 13 by calculating the weight of solids in the slurry and multiplying by the appropriate calcine factor. See page 96 for the AZ-101 factor and page 105 for the AZ-102 factor. Note a composite factor was not given but the primary sludge slurries make up ~ 80 % of the blend. The weights of the respective glass former materials for one liter of waste slurry blend were calculated from the information given on pages 114 and 116 for making 100 grams of glass and from the batching sheets on pages 115 and 117 which indicate that the AZ-101 glass is 34.6 wt% waste oxides and that the AZ-102 glass is 33.11 wt% waste oxides.
Pretreatment History (include washing, leaching, chemical precipitation, mechanical agitation of any kind (time and intensity)
Sodium Concentration of LAW Pretreated Waste Na Molarity
1.17 1.11 1.13 1.17 1.11 1.11 1.17 1.08 1.05 Oxides Loading of HLW Pretreated Sludge – density Total Grams Oxide per Liter 190.35 140.47 150.00 204.64 146.35 150.88 202.40 98.81 116.20
Actual Mass Added (g) per liter of waste Source Chemical Manufacturer Oxide Kyanite Kyanite Mining Corp Al2O3 Alumina A-2 Alcoa Alumina Al2O3 Boric Acid Technical U.S. Borax B2O3 10M Borax U.S. Borax Na2O/B2O3 103.09 76.08 81.24 50.64 36.21 37.34 50.08 24.45 28.75 Soda Ash Solvay Minerals Na2CO3 NaOH 55.95 40.01 41.25 55.34 27.01 31.77 Wollastonite NYCO CaO Fe2O3 5001 Prince Mfg. Co. Fe2O3 LiOH*H2O 71.60 52.84 56.43 72.76 52.04 53.65 71.97 35.13 41.32 LiBO2 Li2CO3 Chemettal-Foote Li2O Olivine Unimin Corp MgO SCS-75 U.S. Silica SiO2 185.10 136.59 145.86 234.07 167.40 172.58 231.51 113.02 132.91 Rutile (Air floated) Chemalloy Co. TiO2 Kadox Zinc Corp Amer. ZnO Zircon Amer. Milner. Inc. ZrO2 Sucrose Amalgamated Sugar Co. Sugar
Mixing Operation Data Processing Scale (lab/bench, pilot, or full)
Mixing Activity/Property Order of Chemical Additions Mixing Time Impeller Speed Impeller Diameter Tank Diameter Number of Baffles
A.40
Table A.2. Envelope D Melter Feed Preparation Sample Number 17 18 19 20 21 22 23 24 25
Size of Baffles Depth of Impeller Comments
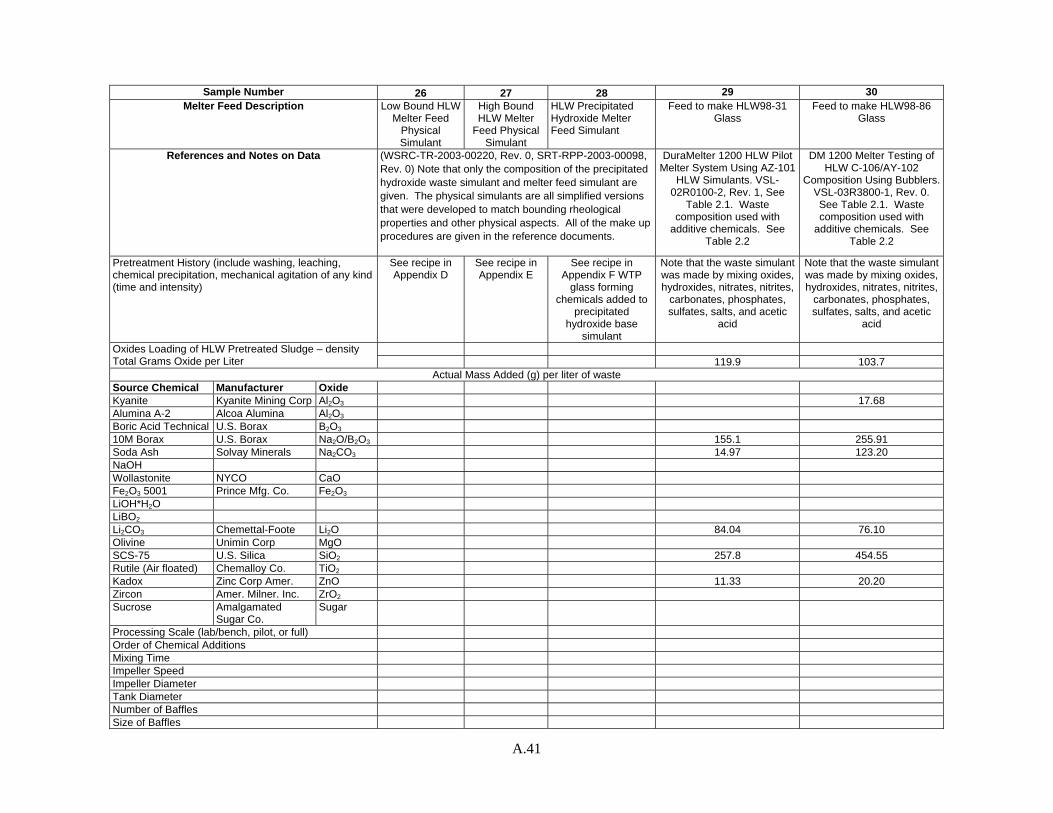
A.41
Sample Number 26 27 28 29 30
Melter Feed Description Low Bound HLW Melter Feed
Physical Simulant
High Bound HLW Melter
Feed Physical Simulant
HLW Precipitated Hydroxide Melter Feed Simulant
Feed to make HLW98-31 Glass
Feed to make HLW98-86 Glass
References and Notes on Data (WSRC-TR-2003-00220, Rev. 0, SRT-RPP-2003-00098, Rev. 0) Note that only the composition of the precipitated hydroxide waste simulant and melter feed simulant are given. The physical simulants are all simplified versions that were developed to match bounding rheological properties and other physical aspects. All of the make up procedures are given in the reference documents.
DuraMelter 1200 HLW Pilot Melter System Using AZ-101
HLW Simulants. VSL-02R0100-2, Rev. 1, See
Table 2.1. Waste composition used with
additive chemicals. See Table 2.2
DM 1200 Melter Testing of HLW C-106/AY-102
Composition Using Bubblers. VSL-03R3800-1, Rev. 0. See Table 2.1. Waste composition used with
additive chemicals. See Table 2.2
Pretreatment History (include washing, leaching, chemical precipitation, mechanical agitation of any kind (time and intensity)
See recipe in Appendix D
See recipe in Appendix E
See recipe in Appendix F WTP
glass forming chemicals added to
precipitated hydroxide base
simulant
Note that the waste simulant was made by mixing oxides, hydroxides, nitrates, nitrites,
carbonates, phosphates, sulfates, salts, and acetic
acid
Note that the waste simulant was made by mixing oxides, hydroxides, nitrates, nitrites,
carbonates, phosphates, sulfates, salts, and acetic
acid
Oxides Loading of HLW Pretreated Sludge – density Total Grams Oxide per Liter 119.9 103.7
Actual Mass Added (g) per liter of waste Source Chemical Manufacturer Oxide Kyanite Kyanite Mining Corp Al2O3 17.68 Alumina A-2 Alcoa Alumina Al2O3 Boric Acid Technical U.S. Borax B2O3 10M Borax U.S. Borax Na2O/B2O3 155.1 255.91 Soda Ash Solvay Minerals Na2CO3 14.97 123.20 NaOH Wollastonite NYCO CaO Fe2O3 5001 Prince Mfg. Co. Fe2O3 LiOH*H2O LiBO2 Li2CO3 Chemettal-Foote Li2O 84.04 76.10 Olivine Unimin Corp MgO SCS-75 U.S. Silica SiO2 257.8 454.55 Rutile (Air floated) Chemalloy Co. TiO2 Kadox Zinc Corp Amer. ZnO 11.33 20.20 Zircon Amer. Milner. Inc. ZrO2 Sucrose Amalgamated
Sugar Co. Sugar
Processing Scale (lab/bench, pilot, or full) Order of Chemical Additions Mixing Time Impeller Speed Impeller Diameter Tank Diameter Number of Baffles Size of Baffles
A.42
Sample Number 26 27 28 29 30 Depth of Impeller Comments
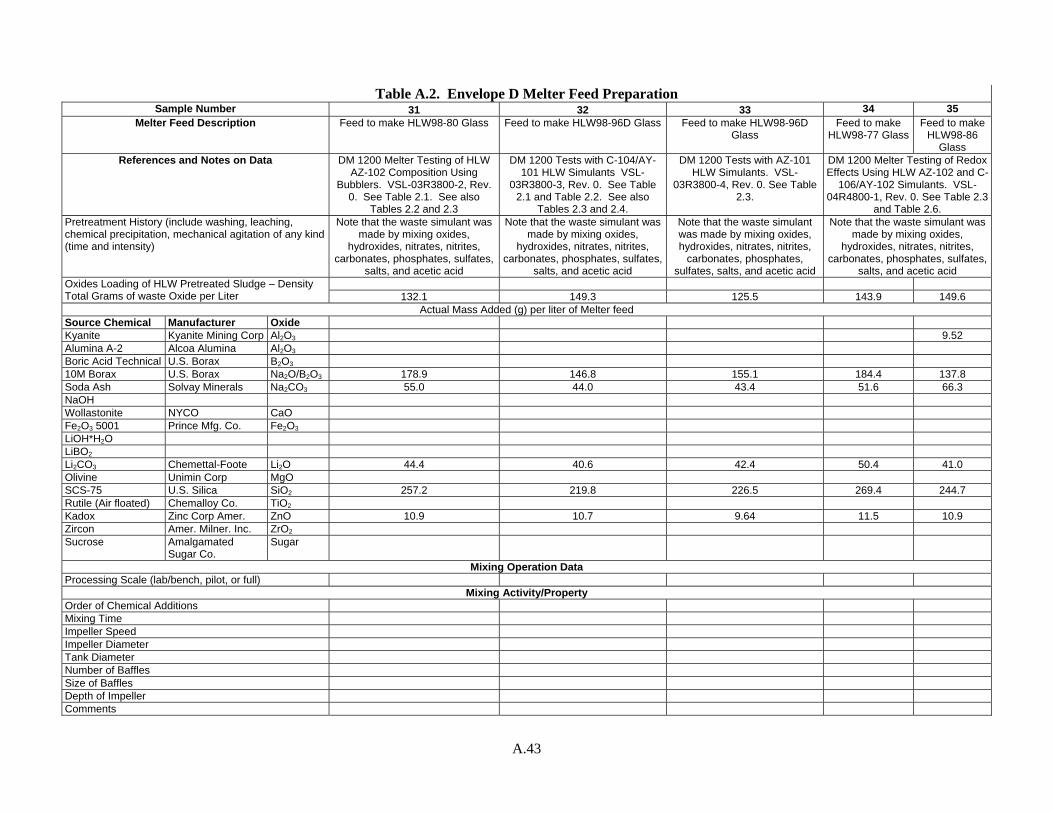
A.43
Table A.2. Envelope D Melter Feed Preparation
Sample Number 31 32 33 34 35 Melter Feed Description Feed to make HLW98-80 Glass Feed to make HLW98-96D Glass Feed to make HLW98-96D
Glass Feed to make
HLW98-77 GlassFeed to make
HLW98-86 Glass
References and Notes on Data DM 1200 Melter Testing of HLW AZ-102 Composition Using
Bubblers. VSL-03R3800-2, Rev. 0. See Table 2.1. See also
Tables 2.2 and 2.3
DM 1200 Tests with C-104/AY-101 HLW Simulants VSL-
03R3800-3, Rev. 0. See Table 2.1 and Table 2.2. See also
Tables 2.3 and 2.4.
DM 1200 Tests with AZ-101 HLW Simulants. VSL-
03R3800-4, Rev. 0. See Table 2.3.
DM 1200 Melter Testing of Redox Effects Using HLW AZ-102 and C-
106/AY-102 Simulants. VSL-04R4800-1, Rev. 0. See Table 2.3
and Table 2.6. Pretreatment History (include washing, leaching, chemical precipitation, mechanical agitation of any kind (time and intensity)
Note that the waste simulant was made by mixing oxides,
hydroxides, nitrates, nitrites, carbonates, phosphates, sulfates,
salts, and acetic acid
Note that the waste simulant was made by mixing oxides,
hydroxides, nitrates, nitrites, carbonates, phosphates, sulfates,
salts, and acetic acid
Note that the waste simulant was made by mixing oxides, hydroxides, nitrates, nitrites,
carbonates, phosphates, sulfates, salts, and acetic acid
Note that the waste simulant was made by mixing oxides,
hydroxides, nitrates, nitrites, carbonates, phosphates, sulfates,
salts, and acetic acid Oxides Loading of HLW Pretreated Sludge – Density
Total Grams of waste Oxide per Liter 132.1 149.3 125.5 143.9 149.6 Actual Mass Added (g) per liter of Melter feed
Source Chemical Manufacturer Oxide Kyanite Kyanite Mining Corp Al2O3 9.52 Alumina A-2 Alcoa Alumina Al2O3 Boric Acid Technical U.S. Borax B2O3 10M Borax U.S. Borax Na2O/B2O3 178.9 146.8 155.1 184.4 137.8 Soda Ash Solvay Minerals Na2CO3 55.0 44.0 43.4 51.6 66.3 NaOH Wollastonite NYCO CaO Fe2O3 5001 Prince Mfg. Co. Fe2O3 LiOH*H2O LiBO2 Li2CO3 Chemettal-Foote Li2O 44.4 40.6 42.4 50.4 41.0 Olivine Unimin Corp MgO SCS-75 U.S. Silica SiO2 257.2 219.8 226.5 269.4 244.7 Rutile (Air floated) Chemalloy Co. TiO2 Kadox Zinc Corp Amer. ZnO 10.9 10.7 9.64 11.5 10.9 Zircon Amer. Milner. Inc. ZrO2 Sucrose Amalgamated
Sugar Co. Sugar
Mixing Operation Data Processing Scale (lab/bench, pilot, or full)
Mixing Activity/Property Order of Chemical Additions Mixing Time Impeller Speed Impeller Diameter Tank Diameter Number of Baffles Size of Baffles Depth of Impeller Comments
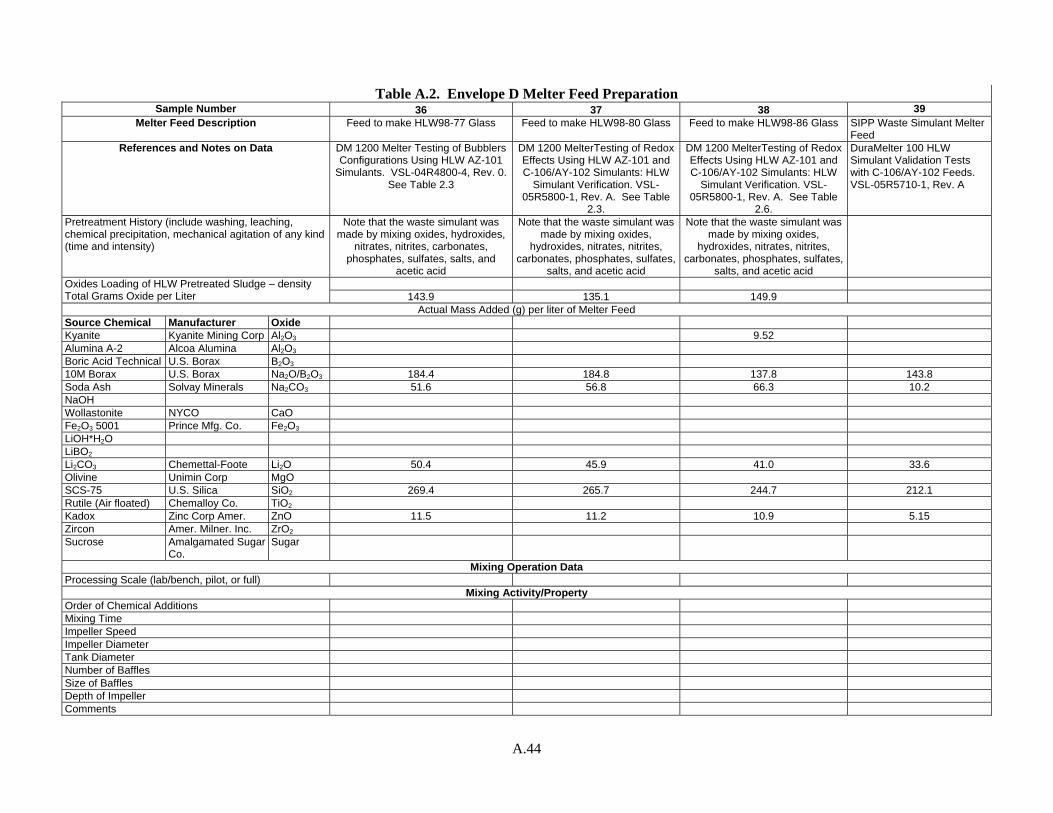
A.44
Table A.2. Envelope D Melter Feed Preparation
Sample Number 36 37 38 39 Melter Feed Description Feed to make HLW98-77 Glass Feed to make HLW98-80 Glass Feed to make HLW98-86 Glass SIPP Waste Simulant Melter
Feed References and Notes on Data DM 1200 Melter Testing of Bubblers
Configurations Using HLW AZ-101 Simulants. VSL-04R4800-4, Rev. 0.
See Table 2.3
DM 1200 MelterTesting of Redox Effects Using HLW AZ-101 and C-106/AY-102 Simulants: HLW
Simulant Verification. VSL-05R5800-1, Rev. A. See Table
2.3.
DM 1200 MelterTesting of Redox Effects Using HLW AZ-101 and C-106/AY-102 Simulants: HLW
Simulant Verification. VSL-05R5800-1, Rev. A. See Table
2.6.
DuraMelter 100 HLW Simulant Validation Tests with C-106/AY-102 Feeds. VSL-05R5710-1, Rev. A
Pretreatment History (include washing, leaching, chemical precipitation, mechanical agitation of any kind (time and intensity)
Note that the waste simulant was made by mixing oxides, hydroxides,
nitrates, nitrites, carbonates, phosphates, sulfates, salts, and
acetic acid
Note that the waste simulant was made by mixing oxides,
hydroxides, nitrates, nitrites, carbonates, phosphates, sulfates,
salts, and acetic acid
Note that the waste simulant was made by mixing oxides,
hydroxides, nitrates, nitrites, carbonates, phosphates, sulfates,
salts, and acetic acid
Oxides Loading of HLW Pretreated Sludge – density Total Grams Oxide per Liter 143.9 135.1 149.9
Actual Mass Added (g) per liter of Melter Feed Source Chemical Manufacturer Oxide Kyanite Kyanite Mining Corp Al2O3 9.52 Alumina A-2 Alcoa Alumina Al2O3 Boric Acid Technical U.S. Borax B2O3 10M Borax U.S. Borax Na2O/B2O3 184.4 184.8 137.8 143.8 Soda Ash Solvay Minerals Na2CO3 51.6 56.8 66.3 10.2 NaOH Wollastonite NYCO CaO Fe2O3 5001 Prince Mfg. Co. Fe2O3 LiOH*H2O LiBO2 Li2CO3 Chemettal-Foote Li2O 50.4 45.9 41.0 33.6 Olivine Unimin Corp MgO SCS-75 U.S. Silica SiO2 269.4 265.7 244.7 212.1 Rutile (Air floated) Chemalloy Co. TiO2 Kadox Zinc Corp Amer. ZnO 11.5 11.2 10.9 5.15 Zircon Amer. Milner. Inc. ZrO2 Sucrose Amalgamated Sugar
Co. Sugar
Mixing Operation Data Processing Scale (lab/bench, pilot, or full)
Mixing Activity/Property Order of Chemical Additions Mixing Time Impeller Speed Impeller Diameter Tank Diameter Number of Baffles Size of Baffles Depth of Impeller Comments
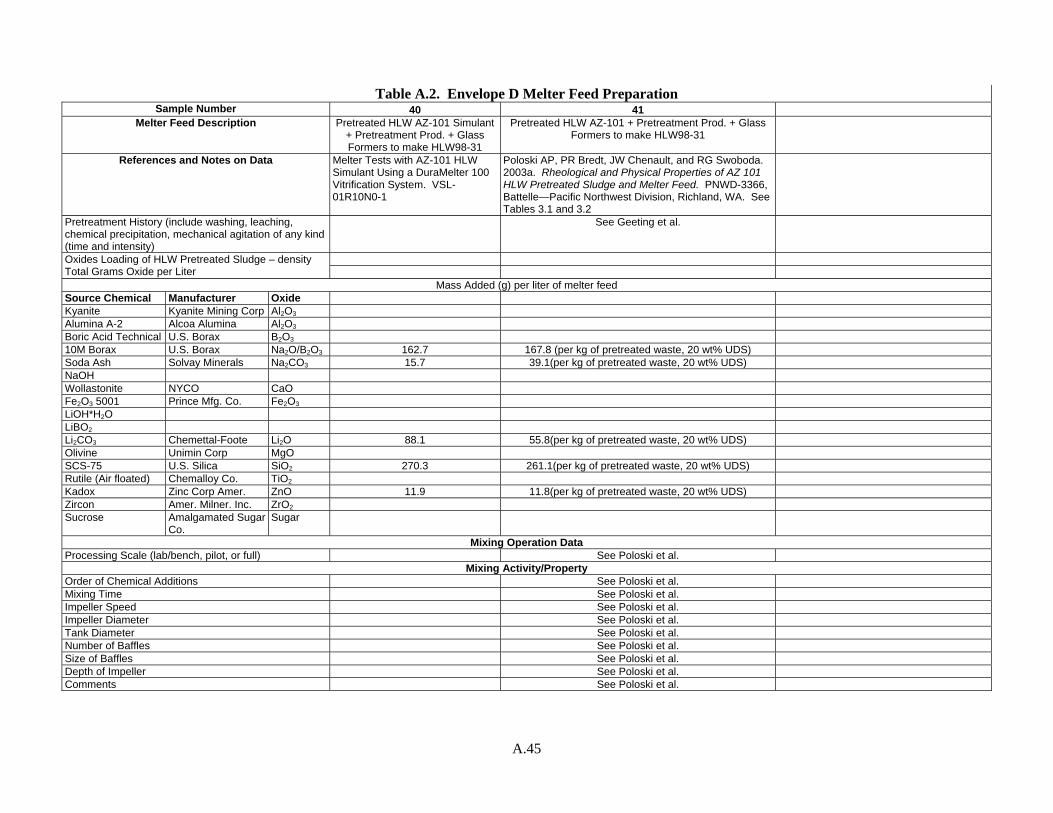
A.45
Table A.2. Envelope D Melter Feed Preparation
Sample Number 40 41 Melter Feed Description Pretreated HLW AZ-101 Simulant
+ Pretreatment Prod. + Glass Formers to make HLW98-31
Pretreated HLW AZ-101 + Pretreatment Prod. + Glass Formers to make HLW98-31
References and Notes on Data Melter Tests with AZ-101 HLW Simulant Using a DuraMelter 100 Vitrification System. VSL-01R10N0-1
Poloski AP, PR Bredt, JW Chenault, and RG Swoboda. 2003a. Rheological and Physical Properties of AZ 101 HLW Pretreated Sludge and Melter Feed. PNWD-3366, Battelle—Pacific Northwest Division, Richland, WA. See Tables 3.1 and 3.2
Pretreatment History (include washing, leaching, chemical precipitation, mechanical agitation of any kind (time and intensity)
See Geeting et al.
Oxides Loading of HLW Pretreated Sludge – density Total Grams Oxide per Liter
Mass Added (g) per liter of melter feed Source Chemical Manufacturer Oxide Kyanite Kyanite Mining Corp Al2O3 Alumina A-2 Alcoa Alumina Al2O3 Boric Acid Technical U.S. Borax B2O3 10M Borax U.S. Borax Na2O/B2O3 162.7 167.8 (per kg of pretreated waste, 20 wt% UDS) Soda Ash Solvay Minerals Na2CO3 15.7 39.1(per kg of pretreated waste, 20 wt% UDS) NaOH Wollastonite NYCO CaO Fe2O3 5001 Prince Mfg. Co. Fe2O3 LiOH*H2O LiBO2 Li2CO3 Chemettal-Foote Li2O 88.1 55.8(per kg of pretreated waste, 20 wt% UDS) Olivine Unimin Corp MgO SCS-75 U.S. Silica SiO2 270.3 261.1(per kg of pretreated waste, 20 wt% UDS) Rutile (Air floated) Chemalloy Co. TiO2 Kadox Zinc Corp Amer. ZnO 11.9 11.8(per kg of pretreated waste, 20 wt% UDS) Zircon Amer. Milner. Inc. ZrO2 Sucrose Amalgamated Sugar
Co. Sugar
Mixing Operation Data Processing Scale (lab/bench, pilot, or full) See Poloski et al.
Mixing Activity/Property Order of Chemical Additions See Poloski et al. Mixing Time See Poloski et al. Impeller Speed See Poloski et al. Impeller Diameter See Poloski et al. Tank Diameter See Poloski et al. Number of Baffles See Poloski et al. Size of Baffles See Poloski et al. Depth of Impeller See Poloski et al. Comments See Poloski et al.
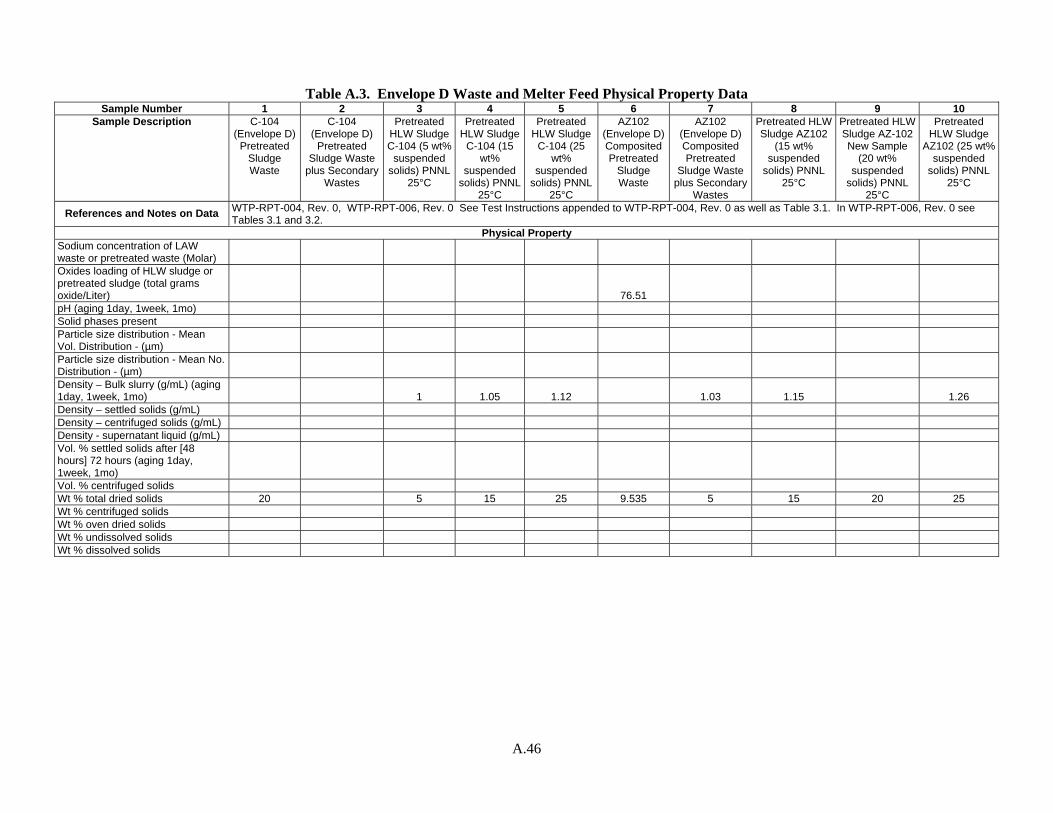
A.46
Table A.3. Envelope D Waste and Melter Feed Physical Property Data
Sample Number 1 2 3 4 5 6 7 8 9 10 Sample Description C-104
(Envelope D) Pretreated
Sludge Waste
C-104 (Envelope D)
Pretreated Sludge Waste
plus Secondary Wastes
Pretreated HLW Sludge C-104 (5 wt%
suspended solids) PNNL
25°C
Pretreated HLW Sludge
C-104 (15 wt%
suspended solids) PNNL
25°C
Pretreated HLW Sludge
C-104 (25 wt%
suspended solids) PNNL
25°C
AZ102 (Envelope D) Composited Pretreated
Sludge Waste
AZ102 (Envelope D) Composited Pretreated
Sludge Waste plus Secondary
Wastes
Pretreated HLW Sludge AZ102
(15 wt% suspended
solids) PNNL 25°C
Pretreated HLW Sludge AZ-102 New Sample
(20 wt% suspended
solids) PNNL 25°C
Pretreated HLW Sludge
AZ102 (25 wt% suspended
solids) PNNL 25°C
References and Notes on Data WTP-RPT-004, Rev. 0, WTP-RPT-006, Rev. 0 See Test Instructions appended to WTP-RPT-004, Rev. 0 as well as Table 3.1. In WTP-RPT-006, Rev. 0 see Tables 3.1 and 3.2.
Physical Property Sodium concentration of LAW waste or pretreated waste (Molar) Oxides loading of HLW sludge or pretreated sludge (total grams oxide/Liter) 76.51 pH (aging 1day, 1week, 1mo) Solid phases present Particle size distribution - Mean Vol. Distribution - (µm) Particle size distribution - Mean No. Distribution - (µm) Density – Bulk slurry (g/mL) (aging 1day, 1week, 1mo) 1 1.05 1.12 1.03 1.15 1.26 Density – settled solids (g/mL) Density – centrifuged solids (g/mL) Density - supernatant liquid (g/mL) Vol. % settled solids after [48 hours] 72 hours (aging 1day, 1week, 1mo) Vol. % centrifuged solids Wt % total dried solids 20 5 15 25 9.535 5 15 20 25 Wt % centrifuged solids Wt % oven dried solids Wt % undissolved solids Wt % dissolved solids
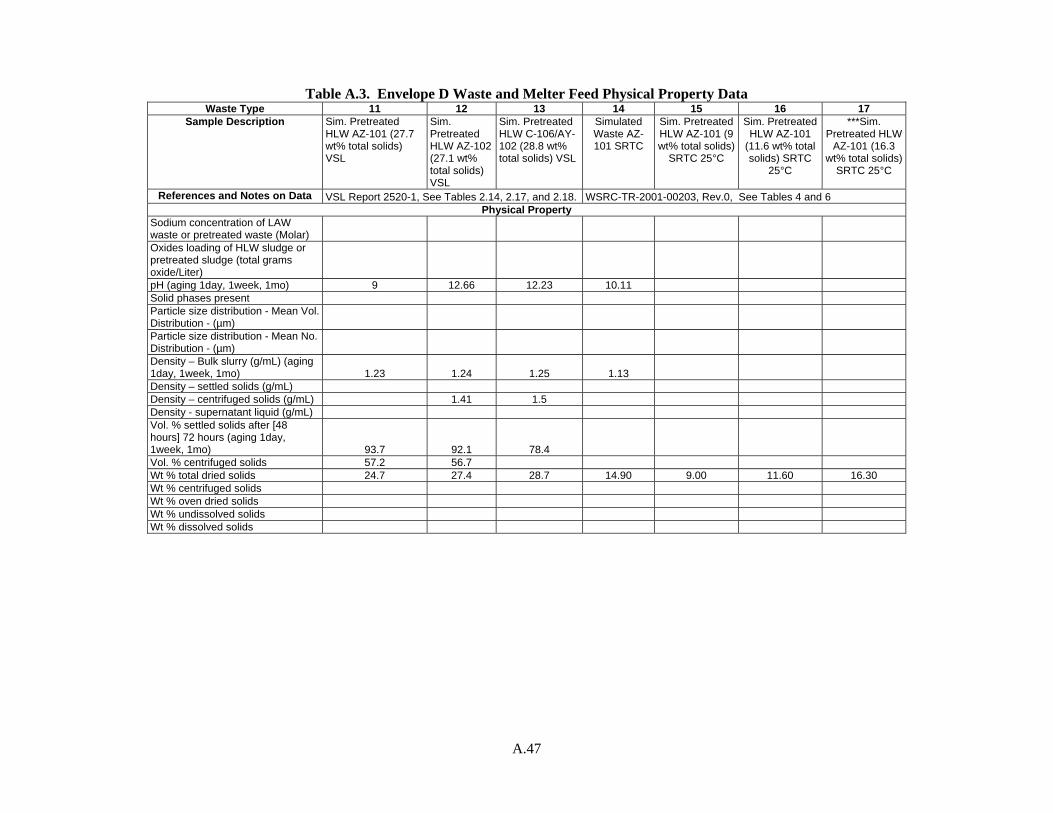
A.47
Table A.3. Envelope D Waste and Melter Feed Physical Property Data
Waste Type 11 12 13 14 15 16 17 Sample Description Sim. Pretreated
HLW AZ-101 (27.7 wt% total solids) VSL
Sim. Pretreated HLW AZ-102 (27.1 wt% total solids) VSL
Sim. Pretreated HLW C-106/AY-102 (28.8 wt% total solids) VSL
Simulated Waste AZ-101 SRTC
Sim. Pretreated HLW AZ-101 (9 wt% total solids)
SRTC 25°C
Sim. Pretreated HLW AZ-101
(11.6 wt% total solids) SRTC
25°C
***Sim. Pretreated HLW
AZ-101 (16.3 wt% total solids)
SRTC 25°C
References and Notes on Data VSL Report 2520-1, See Tables 2.14, 2.17, and 2.18. WSRC-TR-2001-00203, Rev.0, See Tables 4 and 6 Physical Property
Sodium concentration of LAW waste or pretreated waste (Molar) Oxides loading of HLW sludge or pretreated sludge (total grams oxide/Liter) pH (aging 1day, 1week, 1mo) 9 12.66 12.23 10.11 Solid phases present Particle size distribution - Mean Vol. Distribution - (µm) Particle size distribution - Mean No. Distribution - (µm) Density – Bulk slurry (g/mL) (aging 1day, 1week, 1mo) 1.23 1.24 1.25 1.13 Density – settled solids (g/mL) Density – centrifuged solids (g/mL) 1.41 1.5 Density - supernatant liquid (g/mL) Vol. % settled solids after [48 hours] 72 hours (aging 1day, 1week, 1mo) 93.7 92.1 78.4 Vol. % centrifuged solids 57.2 56.7 Wt % total dried solids 24.7 27.4 28.7 14.90 9.00 11.60 16.30 Wt % centrifuged solids Wt % oven dried solids Wt % undissolved solids Wt % dissolved solids
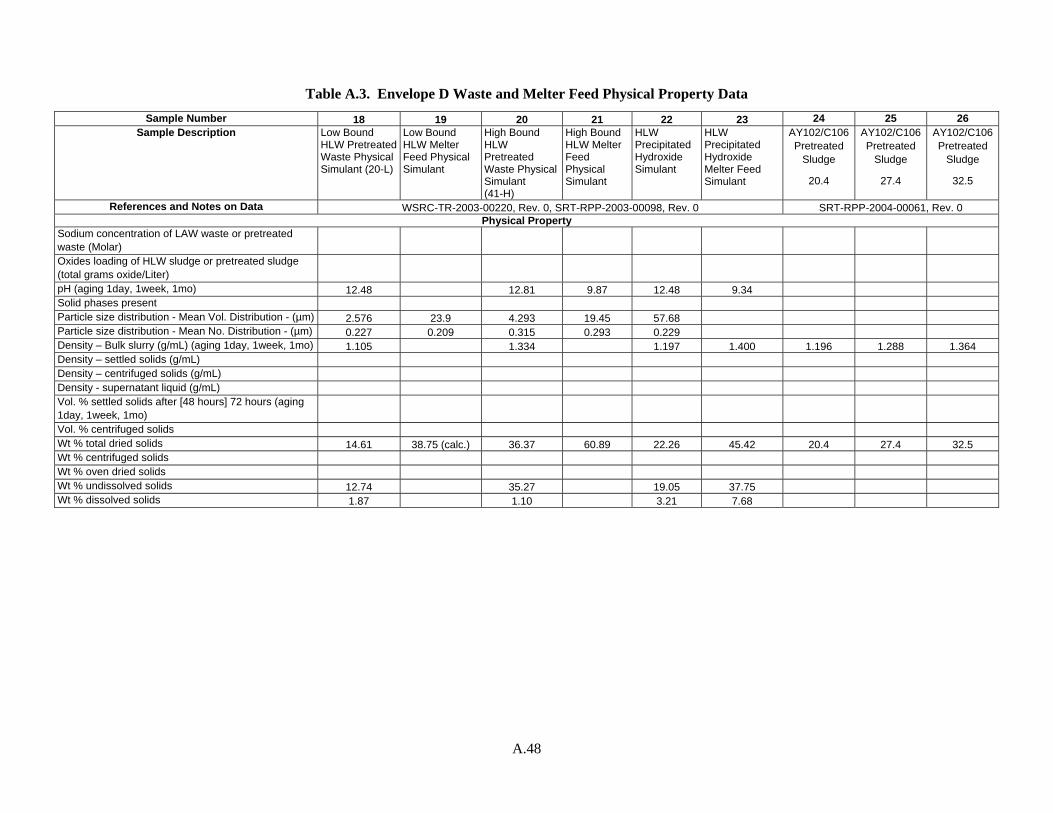
A.48
Table A.3. Envelope D Waste and Melter Feed Physical Property Data
Sample Number 18 19 20 21 22 23 24 25 26 Sample Description Low Bound
HLW Pretreated Waste Physical Simulant (20-L)
Low Bound HLW Melter Feed Physical Simulant
High Bound HLW Pretreated Waste Physical Simulant (41-H)
High Bound HLW Melter Feed Physical Simulant
HLW Precipitated Hydroxide Simulant
HLW Precipitated Hydroxide Melter Feed Simulant
AY102/C106 Pretreated
Sludge
20.4
AY102/C106 Pretreated
Sludge
27.4
AY102/C106 Pretreated
Sludge
32.5
References and Notes on Data WSRC-TR-2003-00220, Rev. 0, SRT-RPP-2003-00098, Rev. 0 SRT-RPP-2004-00061, Rev. 0 Physical Property
Sodium concentration of LAW waste or pretreated waste (Molar) Oxides loading of HLW sludge or pretreated sludge (total grams oxide/Liter) pH (aging 1day, 1week, 1mo) 12.48 12.81 9.87 12.48 9.34 Solid phases present Particle size distribution - Mean Vol. Distribution - (µm) 2.576 23.9 4.293 19.45 57.68 Particle size distribution - Mean No. Distribution - (µm) 0.227 0.209 0.315 0.293 0.229 Density – Bulk slurry (g/mL) (aging 1day, 1week, 1mo) 1.105 1.334 1.197 1.400 1.196 1.288 1.364 Density – settled solids (g/mL) Density – centrifuged solids (g/mL) Density - supernatant liquid (g/mL) Vol. % settled solids after [48 hours] 72 hours (aging 1day, 1week, 1mo) Vol. % centrifuged solids Wt % total dried solids 14.61 38.75 (calc.) 36.37 60.89 22.26 45.42 20.4 27.4 32.5 Wt % centrifuged solids Wt % oven dried solids Wt % undissolved solids 12.74 35.27 19.05 37.75 Wt % dissolved solids 1.87 1.10 3.21 7.68
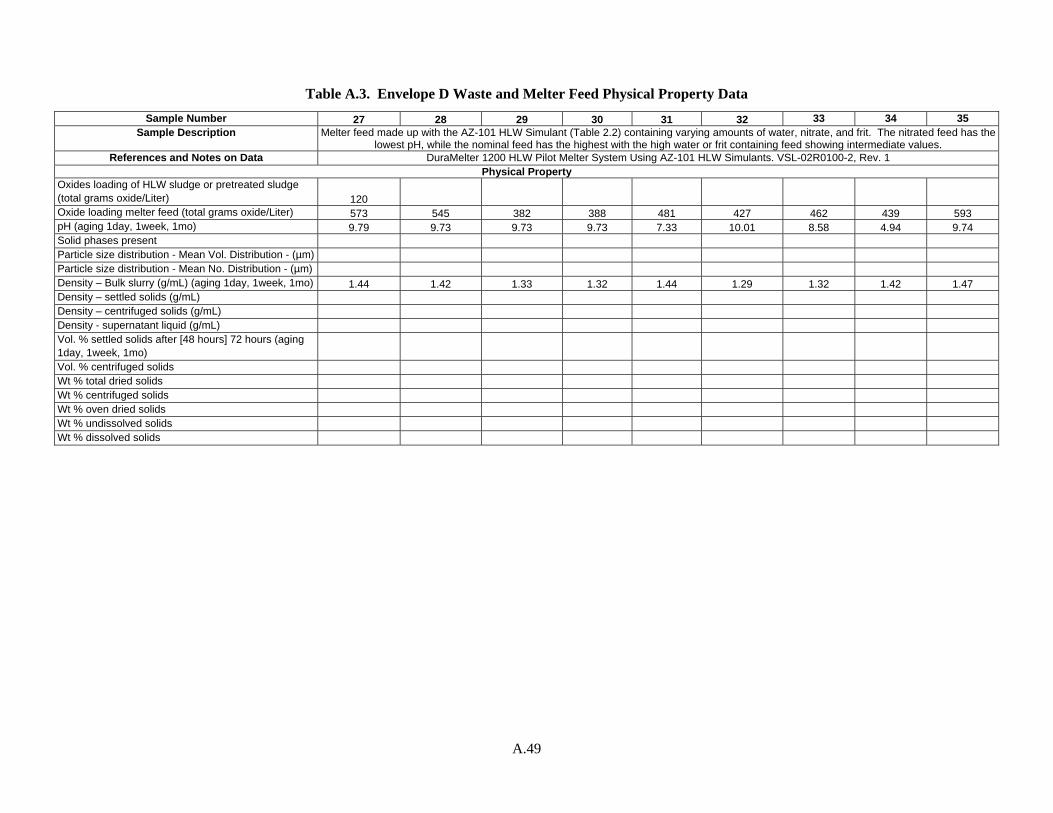
A.49
Table A.3. Envelope D Waste and Melter Feed Physical Property Data
Sample Number 27 28 29 30 31 32 33 34 35 Sample Description Melter feed made up with the AZ-101 HLW Simulant (Table 2.2) containing varying amounts of water, nitrate, and frit. The nitrated feed has the
lowest pH, while the nominal feed has the highest with the high water or frit containing feed showing intermediate values. References and Notes on Data DuraMelter 1200 HLW Pilot Melter System Using AZ-101 HLW Simulants. VSL-02R0100-2, Rev. 1
Physical Property Oxides loading of HLW sludge or pretreated sludge (total grams oxide/Liter) 120 Oxide loading melter feed (total grams oxide/Liter) 573 545 382 388 481 427 462 439 593 pH (aging 1day, 1week, 1mo) 9.79 9.73 9.73 9.73 7.33 10.01 8.58 4.94 9.74 Solid phases present Particle size distribution - Mean Vol. Distribution - (µm) Particle size distribution - Mean No. Distribution - (µm) Density – Bulk slurry (g/mL) (aging 1day, 1week, 1mo) 1.44 1.42 1.33 1.32 1.44 1.29 1.32 1.42 1.47 Density – settled solids (g/mL) Density – centrifuged solids (g/mL) Density - supernatant liquid (g/mL) Vol. % settled solids after [48 hours] 72 hours (aging 1day, 1week, 1mo) Vol. % centrifuged solids Wt % total dried solids Wt % centrifuged solids Wt % oven dried solids Wt % undissolved solids Wt % dissolved solids
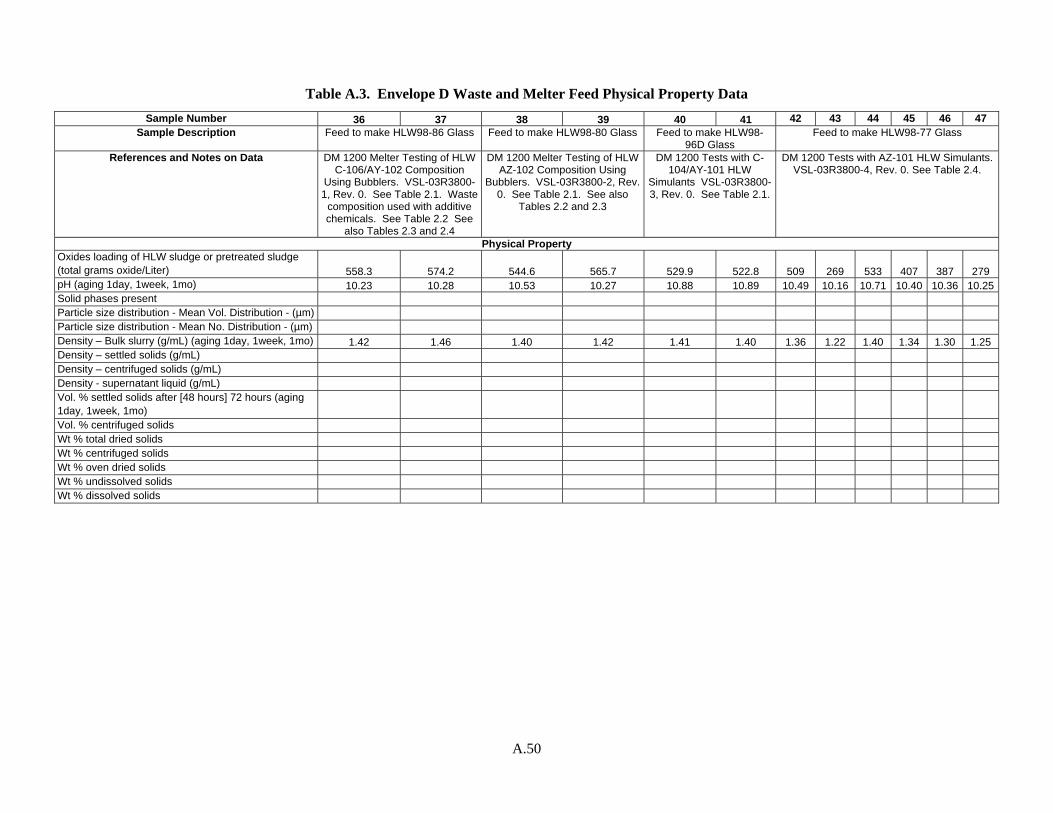
A.50
Table A.3. Envelope D Waste and Melter Feed Physical Property Data
Sample Number 36 37 38 39 40 41 42 43 44 45 46 47 Sample Description Feed to make HLW98-86 Glass Feed to make HLW98-80 Glass Feed to make HLW98-
96D Glass Feed to make HLW98-77 Glass
References and Notes on Data DM 1200 Melter Testing of HLW C-106/AY-102 Composition
Using Bubblers. VSL-03R3800-1, Rev. 0. See Table 2.1. Waste
composition used with additive chemicals. See Table 2.2 See
also Tables 2.3 and 2.4
DM 1200 Melter Testing of HLW AZ-102 Composition Using
Bubblers. VSL-03R3800-2, Rev. 0. See Table 2.1. See also
Tables 2.2 and 2.3
DM 1200 Tests with C-104/AY-101 HLW
Simulants VSL-03R3800-3, Rev. 0. See Table 2.1.
DM 1200 Tests with AZ-101 HLW Simulants. VSL-03R3800-4, Rev. 0. See Table 2.4.
Physical Property Oxides loading of HLW sludge or pretreated sludge (total grams oxide/Liter) 558.3 574.2 544.6 565.7 529.9 522.8 509 269 533 407 387 279 pH (aging 1day, 1week, 1mo) 10.23 10.28 10.53 10.27 10.88 10.89 10.49 10.16 10.71 10.40 10.36 10.25 Solid phases present Particle size distribution - Mean Vol. Distribution - (µm) Particle size distribution - Mean No. Distribution - (µm) Density – Bulk slurry (g/mL) (aging 1day, 1week, 1mo) 1.42 1.46 1.40 1.42 1.41 1.40 1.36 1.22 1.40 1.34 1.30 1.25 Density – settled solids (g/mL) Density – centrifuged solids (g/mL) Density - supernatant liquid (g/mL) Vol. % settled solids after [48 hours] 72 hours (aging 1day, 1week, 1mo) Vol. % centrifuged solids Wt % total dried solids Wt % centrifuged solids Wt % oven dried solids Wt % undissolved solids Wt % dissolved solids
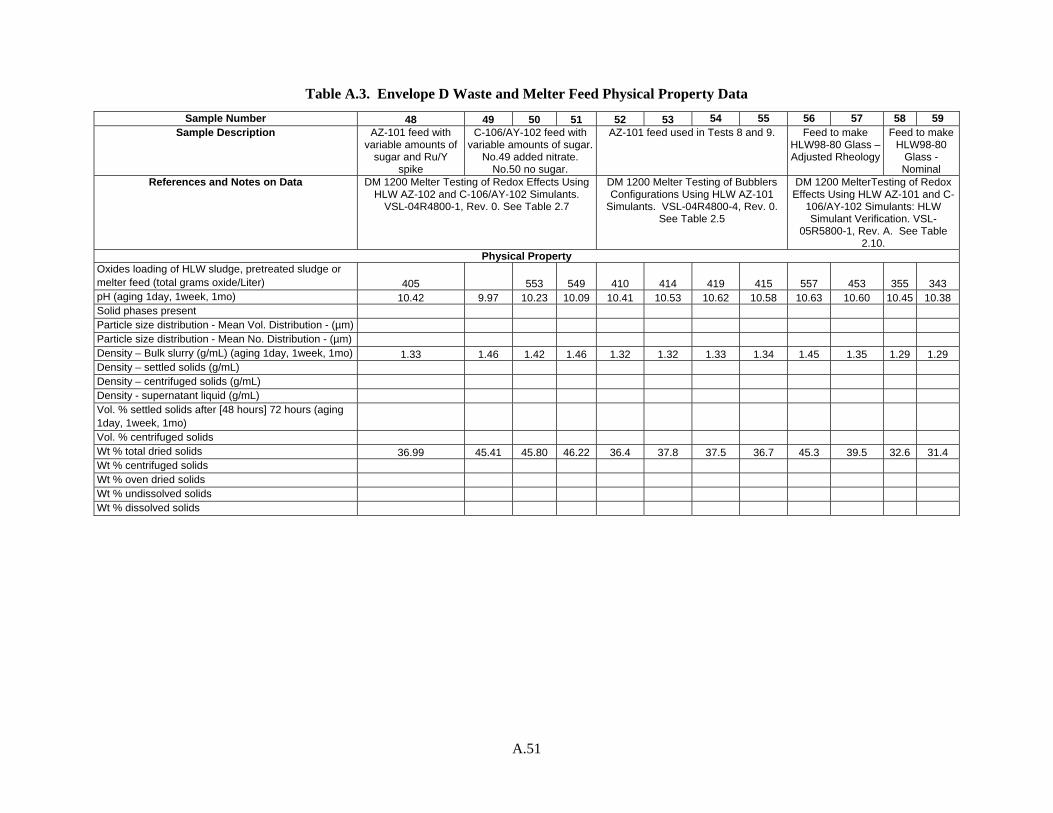
A.51
Table A.3. Envelope D Waste and Melter Feed Physical Property Data
Sample Number 48 49 50 51 52 53 54 55 56 57 58 59 Sample Description AZ-101 feed with
variable amounts of sugar and Ru/Y
spike
C-106/AY-102 feed with variable amounts of sugar.
No.49 added nitrate. No.50 no sugar.
AZ-101 feed used in Tests 8 and 9. Feed to make HLW98-80 Glass –Adjusted Rheology
Feed to make HLW98-80
Glass - Nominal
References and Notes on Data DM 1200 Melter Testing of Redox Effects Using HLW AZ-102 and C-106/AY-102 Simulants.
VSL-04R4800-1, Rev. 0. See Table 2.7
DM 1200 Melter Testing of Bubblers Configurations Using HLW AZ-101
Simulants. VSL-04R4800-4, Rev. 0. See Table 2.5
DM 1200 MelterTesting of Redox Effects Using HLW AZ-101 and C-
106/AY-102 Simulants: HLW Simulant Verification. VSL-
05R5800-1, Rev. A. See Table 2.10.
Physical Property Oxides loading of HLW sludge, pretreated sludge or melter feed (total grams oxide/Liter) 405 553 549 410 414 419 415 557 453 355 343 pH (aging 1day, 1week, 1mo) 10.42 9.97 10.23 10.09 10.41 10.53 10.62 10.58 10.63 10.60 10.45 10.38 Solid phases present Particle size distribution - Mean Vol. Distribution - (µm) Particle size distribution - Mean No. Distribution - (µm) Density – Bulk slurry (g/mL) (aging 1day, 1week, 1mo) 1.33 1.46 1.42 1.46 1.32 1.32 1.33 1.34 1.45 1.35 1.29 1.29 Density – settled solids (g/mL) Density – centrifuged solids (g/mL) Density - supernatant liquid (g/mL) Vol. % settled solids after [48 hours] 72 hours (aging 1day, 1week, 1mo) Vol. % centrifuged solids Wt % total dried solids 36.99 45.41 45.80 46.22 36.4 37.8 37.5 36.7 45.3 39.5 32.6 31.4 Wt % centrifuged solids Wt % oven dried solids Wt % undissolved solids Wt % dissolved solids
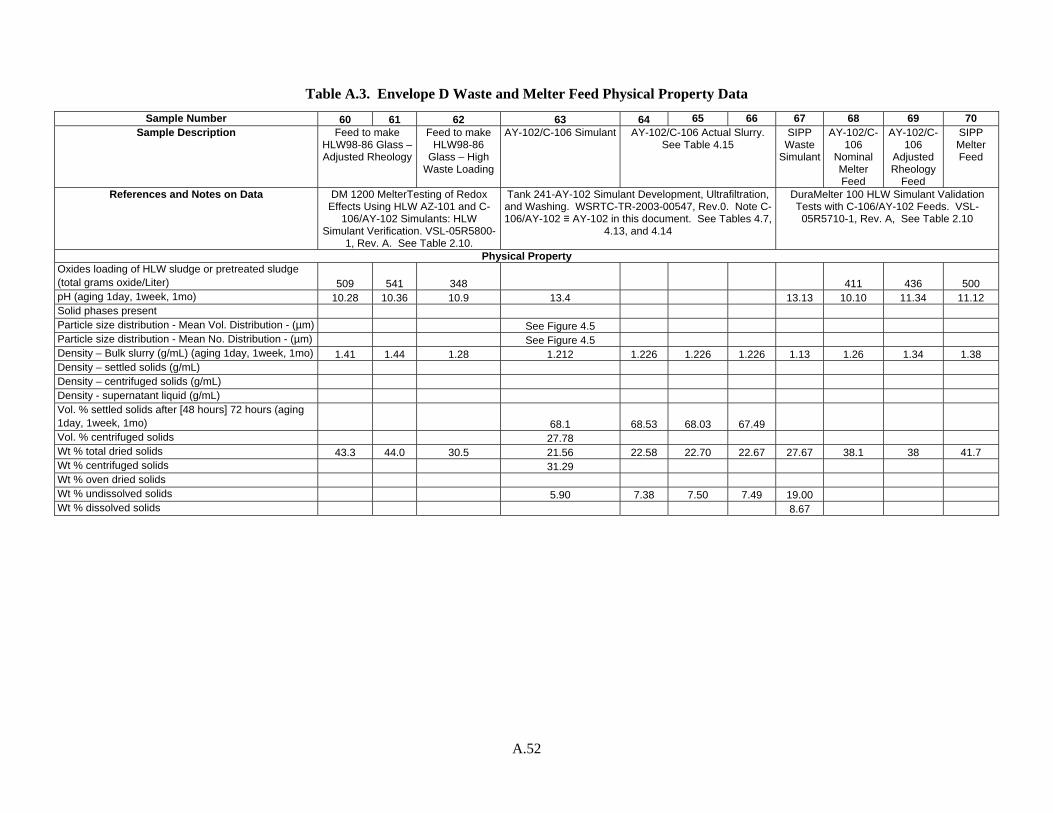
A.52
Table A.3. Envelope D Waste and Melter Feed Physical Property Data
Sample Number 60 61 62 63 64 65 66 67 68 69 70 Sample Description Feed to make
HLW98-86 Glass – Adjusted Rheology
Feed to make HLW98-86
Glass – High Waste Loading
AY-102/C-106 Simulant AY-102/C-106 Actual Slurry. See Table 4.15
SIPP Waste
Simulant
AY-102/C-106
Nominal Melter Feed
AY-102/C-106
Adjusted Rheology
Feed
SIPP Melter Feed
References and Notes on Data DM 1200 MelterTesting of Redox Effects Using HLW AZ-101 and C-
106/AY-102 Simulants: HLW Simulant Verification. VSL-05R5800-
1, Rev. A. See Table 2.10.
Tank 241-AY-102 Simulant Development, Ultrafiltration, and Washing. WSRTC-TR-2003-00547, Rev.0. Note C-106/AY-102 ≡ AY-102 in this document. See Tables 4.7,
4.13, and 4.14
DuraMelter 100 HLW Simulant Validation Tests with C-106/AY-102 Feeds. VSL-
05R5710-1, Rev. A, See Table 2.10
Physical Property Oxides loading of HLW sludge or pretreated sludge (total grams oxide/Liter) 509 541 348 411 436 500 pH (aging 1day, 1week, 1mo) 10.28 10.36 10.9 13.4 13.13 10.10 11.34 11.12 Solid phases present Particle size distribution - Mean Vol. Distribution - (µm) See Figure 4.5 Particle size distribution - Mean No. Distribution - (µm) See Figure 4.5 Density – Bulk slurry (g/mL) (aging 1day, 1week, 1mo) 1.41 1.44 1.28 1.212 1.226 1.226 1.226 1.13 1.26 1.34 1.38 Density – settled solids (g/mL) Density – centrifuged solids (g/mL) Density - supernatant liquid (g/mL) Vol. % settled solids after [48 hours] 72 hours (aging 1day, 1week, 1mo) 68.1 68.53 68.03 67.49 Vol. % centrifuged solids 27.78 Wt % total dried solids 43.3 44.0 30.5 21.56 22.58 22.70 22.67 27.67 38.1 38 41.7 Wt % centrifuged solids 31.29 Wt % oven dried solids Wt % undissolved solids 5.90 7.38 7.50 7.49 19.00 Wt % dissolved solids 8.67
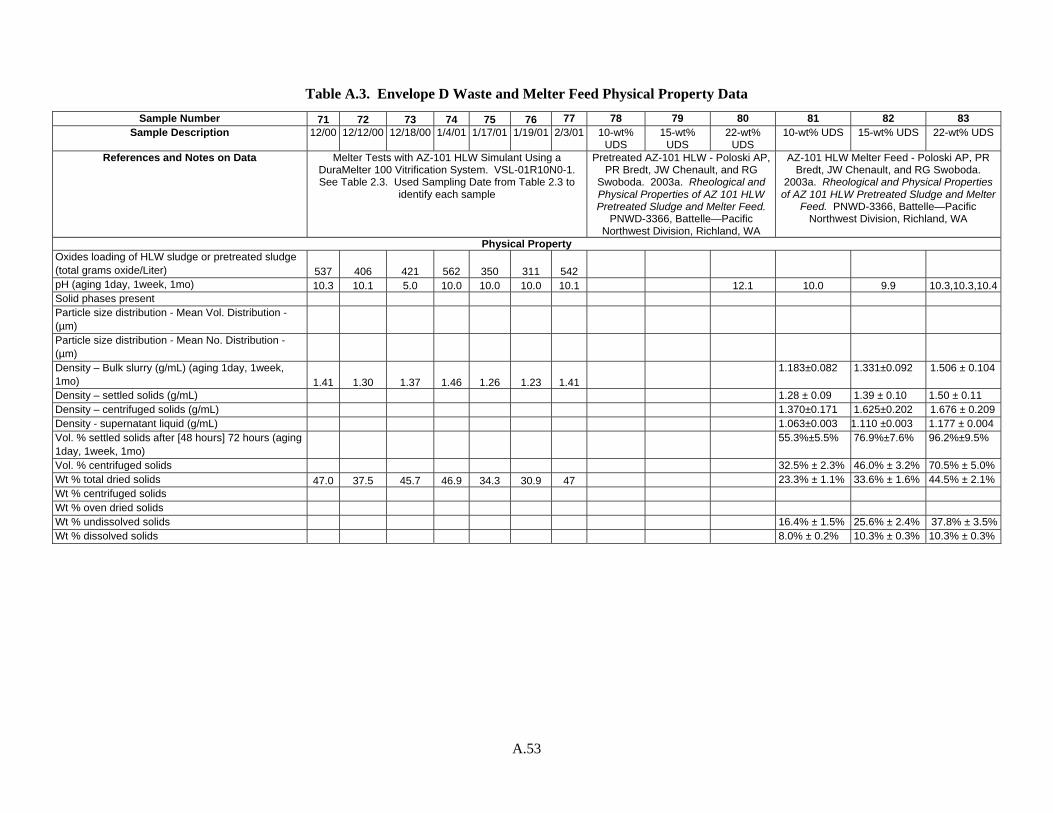
A.53
Table A.3. Envelope D Waste and Melter Feed Physical Property Data
Sample Number 71 72 73 74 75 76 77 78 79 80 81 82 83 Sample Description 12/00 12/12/00 12/18/00 1/4/01 1/17/01 1/19/01 2/3/01 10-wt%
UDS 15-wt%
UDS 22-wt%
UDS 10-wt% UDS 15-wt% UDS 22-wt% UDS
References and Notes on Data Melter Tests with AZ-101 HLW Simulant Using a DuraMelter 100 Vitrification System. VSL-01R10N0-1. See Table 2.3. Used Sampling Date from Table 2.3 to
identify each sample
Pretreated AZ-101 HLW - Poloski AP, PR Bredt, JW Chenault, and RG
Swoboda. 2003a. Rheological and Physical Properties of AZ 101 HLW Pretreated Sludge and Melter Feed.
PNWD-3366, Battelle—Pacific Northwest Division, Richland, WA
AZ-101 HLW Melter Feed - Poloski AP, PR Bredt, JW Chenault, and RG Swoboda.
2003a. Rheological and Physical Properties of AZ 101 HLW Pretreated Sludge and Melter
Feed. PNWD-3366, Battelle—Pacific Northwest Division, Richland, WA
Physical Property Oxides loading of HLW sludge or pretreated sludge (total grams oxide/Liter) 537 406 421 562 350 311 542 pH (aging 1day, 1week, 1mo) 10.3 10.1 5.0 10.0 10.0 10.0 10.1 12.1 10.0 9.9 10.3,10.3,10.4 Solid phases present Particle size distribution - Mean Vol. Distribution - (µm) Particle size distribution - Mean No. Distribution - (µm) Density – Bulk slurry (g/mL) (aging 1day, 1week, 1mo) 1.41 1.30 1.37 1.46 1.26 1.23 1.41
1.183±0.082 1.331±0.092 1.506 ± 0.104
Density – settled solids (g/mL) 1.28 ± 0.09 1.39 ± 0.10 1.50 ± 0.11 Density – centrifuged solids (g/mL) 1.370±0.171 1.625±0.202 1.676 ± 0.209 Density - supernatant liquid (g/mL) 1.063±0.003 1.110 ±0.003 1.177 ± 0.004 Vol. % settled solids after [48 hours] 72 hours (aging 1day, 1week, 1mo)
55.3%±5.5% 76.9%±7.6% 96.2%±9.5%
Vol. % centrifuged solids 32.5% ± 2.3% 46.0% ± 3.2% 70.5% ± 5.0% Wt % total dried solids 47.0 37.5 45.7 46.9 34.3 30.9 47 23.3% ± 1.1% 33.6% ± 1.6% 44.5% ± 2.1% Wt % centrifuged solids Wt % oven dried solids Wt % undissolved solids 16.4% ± 1.5% 25.6% ± 2.4% 37.8% ± 3.5% Wt % dissolved solids 8.0% ± 0.2% 10.3% ± 0.3% 10.3% ± 0.3%
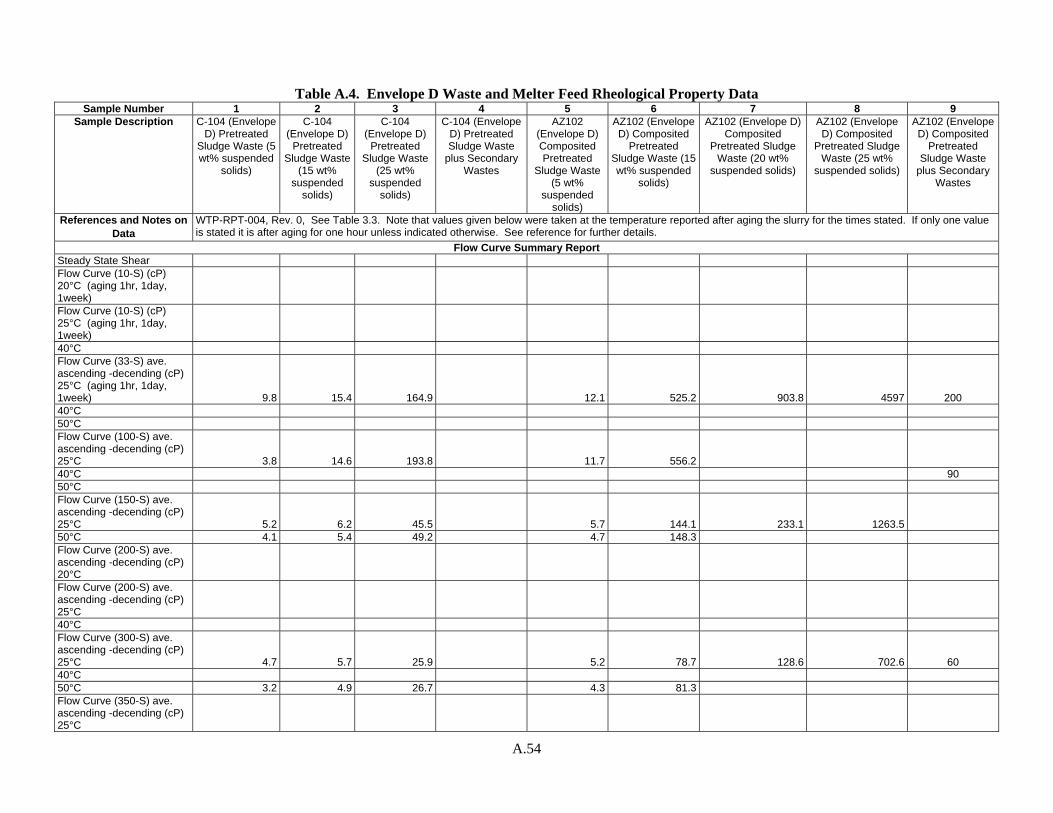
A.54
Table A.4. Envelope D Waste and Melter Feed Rheological Property Data
Sample Number 1 2 3 4 5 6 7 8 9 Sample Description C-104 (Envelope
D) Pretreated Sludge Waste (5 wt% suspended
solids)
C-104 (Envelope D)
Pretreated Sludge Waste
(15 wt% suspended
solids)
C-104 (Envelope D)
Pretreated Sludge Waste
(25 wt% suspended
solids)
C-104 (Envelope D) Pretreated Sludge Waste
plus Secondary Wastes
AZ102 (Envelope D) Composited Pretreated
Sludge Waste (5 wt%
suspended solids)
AZ102 (Envelope D) Composited
Pretreated Sludge Waste (15 wt% suspended
solids)
AZ102 (Envelope D) Composited
Pretreated Sludge Waste (20 wt%
suspended solids)
AZ102 (Envelope D) Composited
Pretreated Sludge Waste (25 wt%
suspended solids)
AZ102 (Envelope D) Composited
Pretreated Sludge Waste
plus Secondary Wastes
References and Notes on Data
WTP-RPT-004, Rev. 0, See Table 3.3. Note that values given below were taken at the temperature reported after aging the slurry for the times stated. If only one value is stated it is after aging for one hour unless indicated otherwise. See reference for further details.
Flow Curve Summary Report Steady State Shear Flow Curve (10-S) (cP) 20°C (aging 1hr, 1day, 1week) Flow Curve (10-S) (cP) 25°C (aging 1hr, 1day, 1week) 40°C Flow Curve (33-S) ave. ascending -decending (cP) 25°C (aging 1hr, 1day, 1week) 9.8 15.4 164.9 12.1 525.2 903.8 4597 200 40°C 50°C Flow Curve (100-S) ave. ascending -decending (cP) 25°C 3.8 14.6 193.8 11.7 556.2 40°C 90 50°C Flow Curve (150-S) ave. ascending -decending (cP) 25°C 5.2 6.2 45.5 5.7 144.1 233.1 1263.5 50°C 4.1 5.4 49.2 4.7 148.3 Flow Curve (200-S) ave. ascending -decending (cP) 20°C Flow Curve (200-S) ave. ascending -decending (cP) 25°C 40°C Flow Curve (300-S) ave. ascending -decending (cP) 25°C 4.7 5.7 25.9 5.2 78.7 128.6 702.6 60 40°C 50°C 3.2 4.9 26.7 4.3 81.3 Flow Curve (350-S) ave. ascending -decending (cP) 25°C
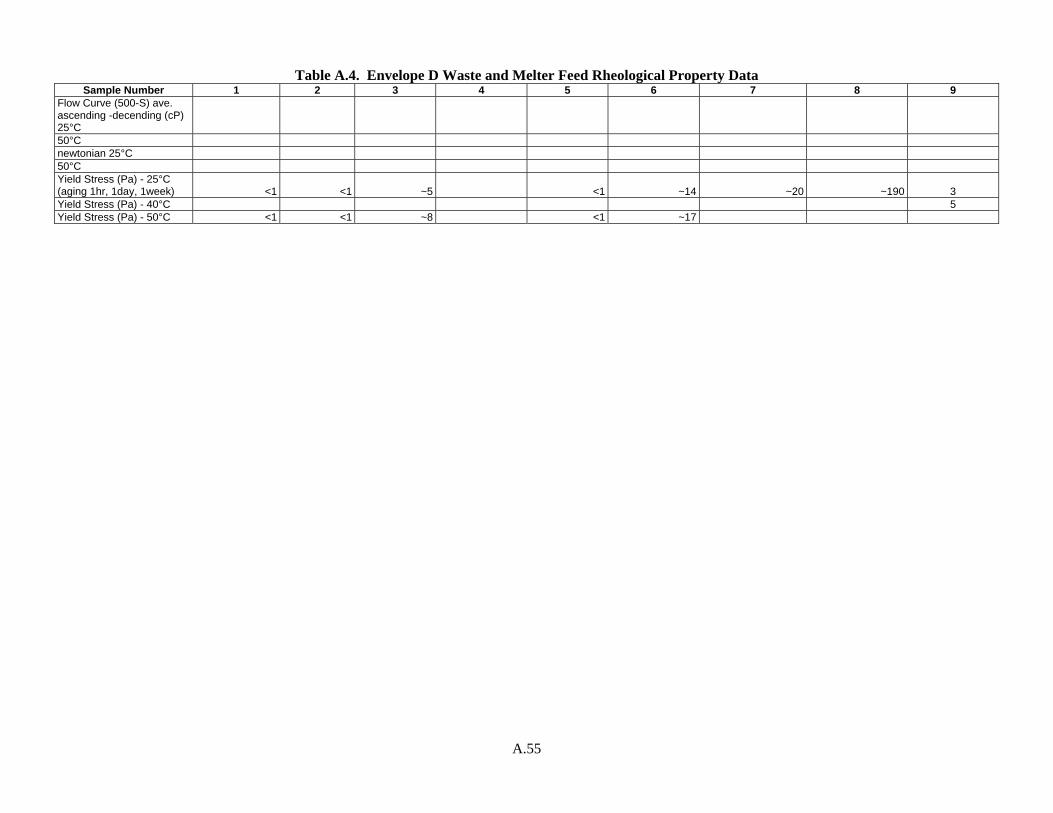
A.55
Table A.4. Envelope D Waste and Melter Feed Rheological Property Data Sample Number 1 2 3 4 5 6 7 8 9
Flow Curve (500-S) ave. ascending -decending (cP) 25°C 50°C newtonian 25°C 50°C Yield Stress (Pa) - 25°C (aging 1hr, 1day, 1week) <1 <1 ~5 <1 ~14 ~20 ~190 3 Yield Stress (Pa) - 40°C 5 Yield Stress (Pa) - 50°C <1 <1 ~8 <1 ~17
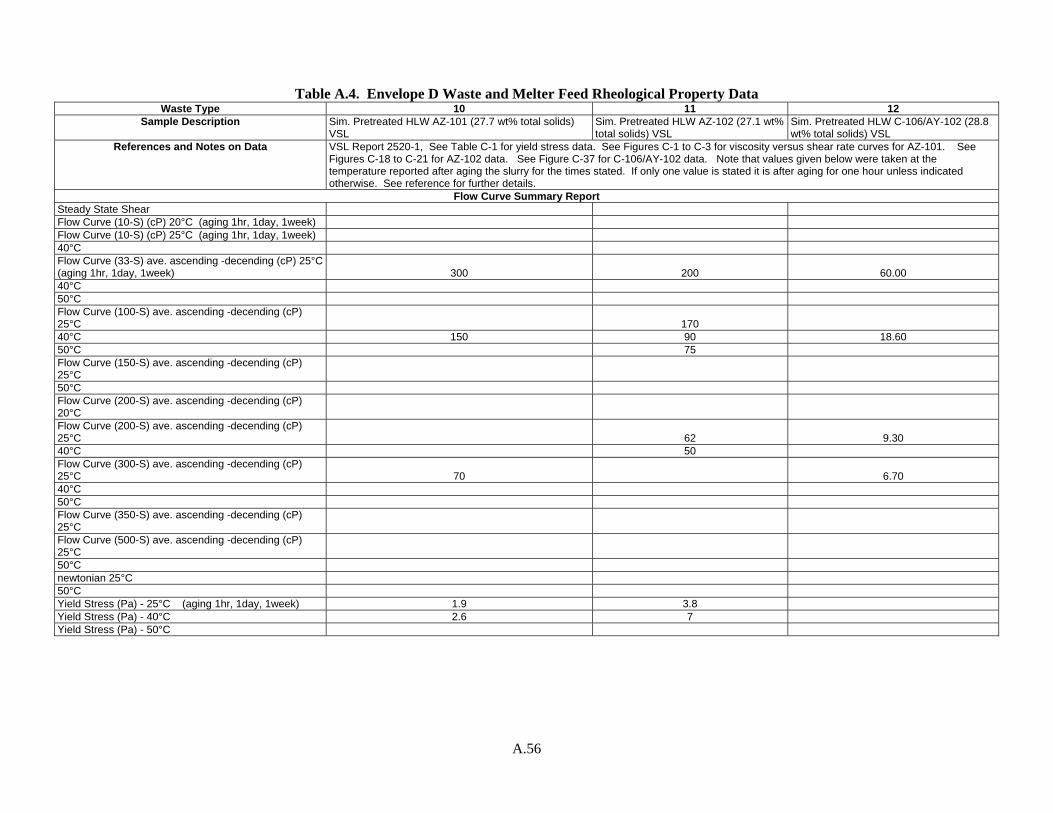
A.56
Table A.4. Envelope D Waste and Melter Feed Rheological Property Data
Waste Type 10 11 12 Sample Description Sim. Pretreated HLW AZ-101 (27.7 wt% total solids)
VSL Sim. Pretreated HLW AZ-102 (27.1 wt% total solids) VSL
Sim. Pretreated HLW C-106/AY-102 (28.8 wt% total solids) VSL
References and Notes on Data VSL Report 2520-1, See Table C-1 for yield stress data. See Figures C-1 to C-3 for viscosity versus shear rate curves for AZ-101. See Figures C-18 to C-21 for AZ-102 data. See Figure C-37 for C-106/AY-102 data. Note that values given below were taken at the temperature reported after aging the slurry for the times stated. If only one value is stated it is after aging for one hour unless indicated otherwise. See reference for further details.
Flow Curve Summary Report Steady State Shear Flow Curve (10-S) (cP) 20°C (aging 1hr, 1day, 1week) Flow Curve (10-S) (cP) 25°C (aging 1hr, 1day, 1week) 40°C Flow Curve (33-S) ave. ascending -decending (cP) 25°C (aging 1hr, 1day, 1week) 300 200 60.00 40°C 50°C Flow Curve (100-S) ave. ascending -decending (cP) 25°C 170 40°C 150 90 18.60 50°C 75 Flow Curve (150-S) ave. ascending -decending (cP) 25°C 50°C Flow Curve (200-S) ave. ascending -decending (cP) 20°C Flow Curve (200-S) ave. ascending -decending (cP) 25°C 62 9.30 40°C 50 Flow Curve (300-S) ave. ascending -decending (cP) 25°C 70 6.70 40°C 50°C Flow Curve (350-S) ave. ascending -decending (cP) 25°C Flow Curve (500-S) ave. ascending -decending (cP) 25°C 50°C newtonian 25°C 50°C Yield Stress (Pa) - 25°C (aging 1hr, 1day, 1week) 1.9 3.8 Yield Stress (Pa) - 40°C 2.6 7 Yield Stress (Pa) - 50°C
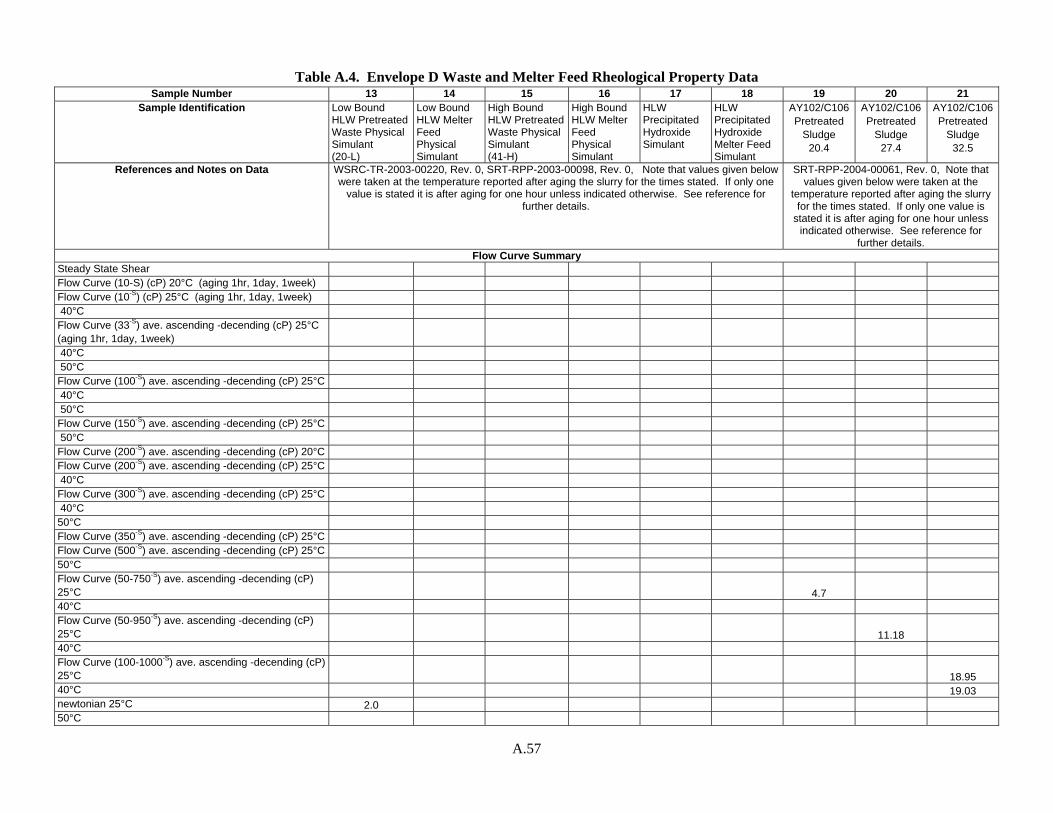
A.57
Table A.4. Envelope D Waste and Melter Feed Rheological Property Data Sample Number 13 14 15 16 17 18 19 20 21
Sample Identification Low Bound HLW Pretreated Waste Physical Simulant (20-L)
Low Bound HLW Melter Feed Physical Simulant
High Bound HLW Pretreated Waste Physical Simulant (41-H)
High Bound HLW Melter Feed Physical Simulant
HLW Precipitated Hydroxide Simulant
HLW Precipitated Hydroxide Melter Feed Simulant
AY102/C106 Pretreated
Sludge 20.4
AY102/C106 Pretreated
Sludge 27.4
AY102/C106 Pretreated
Sludge 32.5
References and Notes on Data WSRC-TR-2003-00220, Rev. 0, SRT-RPP-2003-00098, Rev. 0, Note that values given below were taken at the temperature reported after aging the slurry for the times stated. If only one
value is stated it is after aging for one hour unless indicated otherwise. See reference for further details.
SRT-RPP-2004-00061, Rev. 0, Note that values given below were taken at the
temperature reported after aging the slurry for the times stated. If only one value is
stated it is after aging for one hour unless indicated otherwise. See reference for
further details. Flow Curve Summary
Steady State Shear Flow Curve (10-S) (cP) 20°C (aging 1hr, 1day, 1week) Flow Curve (10-S) (cP) 25°C (aging 1hr, 1day, 1week) 40°C Flow Curve (33-S) ave. ascending -decending (cP) 25°C (aging 1hr, 1day, 1week) 40°C 50°C Flow Curve (100-S) ave. ascending -decending (cP) 25°C 40°C 50°C Flow Curve (150-S) ave. ascending -decending (cP) 25°C 50°C Flow Curve (200-S) ave. ascending -decending (cP) 20°C Flow Curve (200-S) ave. ascending -decending (cP) 25°C 40°C Flow Curve (300-S) ave. ascending -decending (cP) 25°C 40°C 50°C Flow Curve (350-S) ave. ascending -decending (cP) 25°C Flow Curve (500-S) ave. ascending -decending (cP) 25°C 50°C Flow Curve (50-750-S) ave. ascending -decending (cP) 25°C 4.7 40°C Flow Curve (50-950-S) ave. ascending -decending (cP) 25°C 11.18 40°C Flow Curve (100-1000-S) ave. ascending -decending (cP) 25°C 18.95 40°C 19.03 newtonian 25°C 2.0 50°C
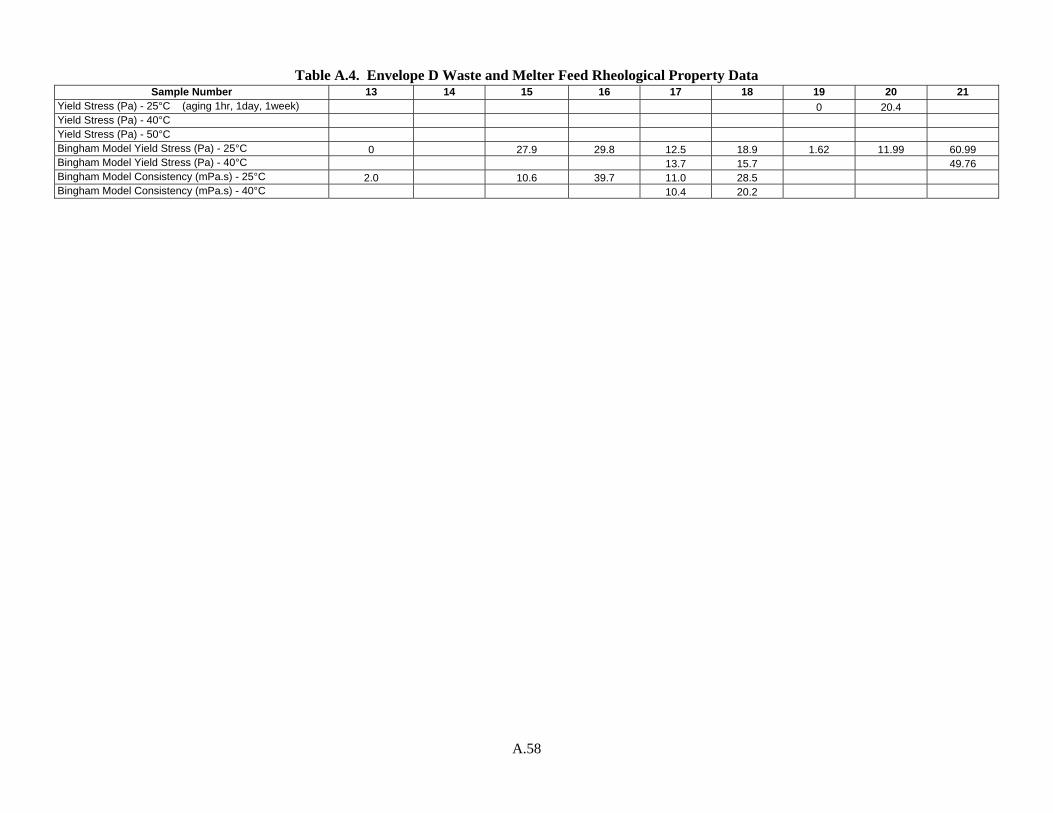
A.58
Table A.4. Envelope D Waste and Melter Feed Rheological Property Data Sample Number 13 14 15 16 17 18 19 20 21
Yield Stress (Pa) - 25°C (aging 1hr, 1day, 1week) 0 20.4 Yield Stress (Pa) - 40°C Yield Stress (Pa) - 50°C Bingham Model Yield Stress (Pa) - 25°C 0 27.9 29.8 12.5 18.9 1.62 11.99 60.99 Bingham Model Yield Stress (Pa) - 40°C 13.7 15.7 49.76 Bingham Model Consistency (mPa.s) - 25°C 2.0 10.6 39.7 11.0 28.5 Bingham Model Consistency (mPa.s) - 40°C 10.4 20.2
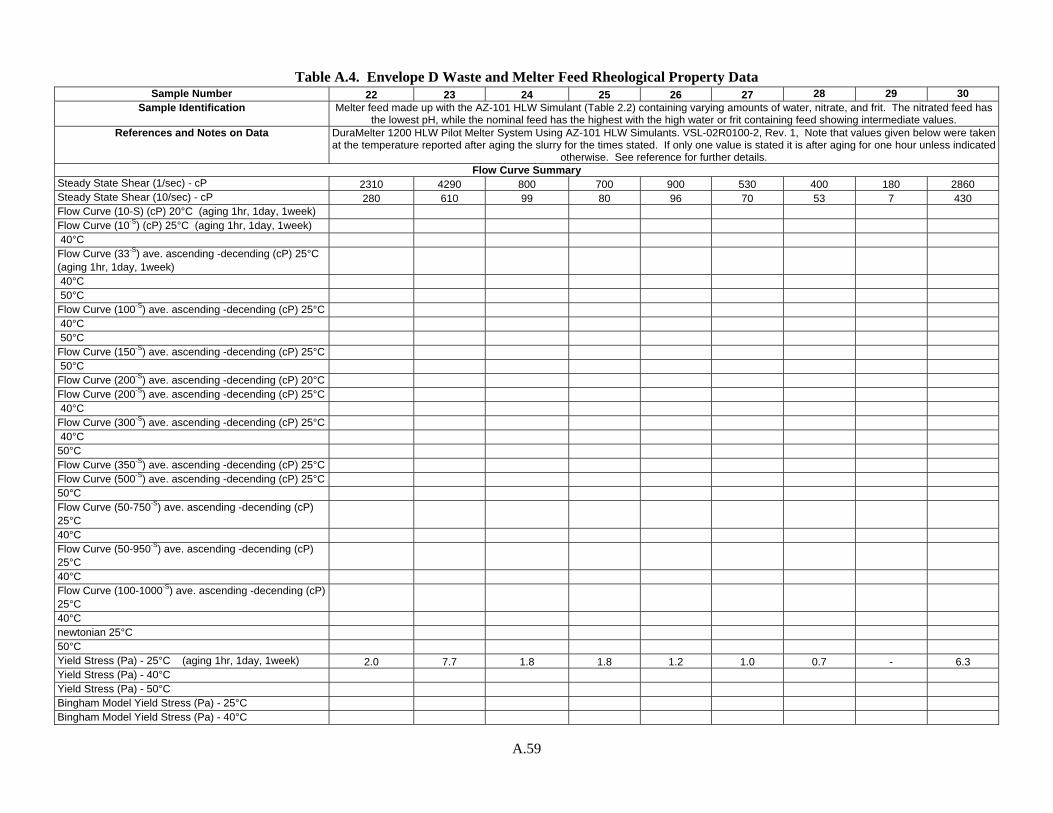
A.59
Table A.4. Envelope D Waste and Melter Feed Rheological Property Data Sample Number 22 23 24 25 26 27 28 29 30
Sample Identification Melter feed made up with the AZ-101 HLW Simulant (Table 2.2) containing varying amounts of water, nitrate, and frit. The nitrated feed has the lowest pH, while the nominal feed has the highest with the high water or frit containing feed showing intermediate values.
References and Notes on Data DuraMelter 1200 HLW Pilot Melter System Using AZ-101 HLW Simulants. VSL-02R0100-2, Rev. 1, Note that values given below were taken at the temperature reported after aging the slurry for the times stated. If only one value is stated it is after aging for one hour unless indicated
otherwise. See reference for further details. Flow Curve Summary
Steady State Shear (1/sec) - cP 2310 4290 800 700 900 530 400 180 2860 Steady State Shear (10/sec) - cP 280 610 99 80 96 70 53 7 430 Flow Curve (10-S) (cP) 20°C (aging 1hr, 1day, 1week) Flow Curve (10-S) (cP) 25°C (aging 1hr, 1day, 1week) 40°C Flow Curve (33-S) ave. ascending -decending (cP) 25°C (aging 1hr, 1day, 1week) 40°C 50°C Flow Curve (100-S) ave. ascending -decending (cP) 25°C 40°C 50°C Flow Curve (150-S) ave. ascending -decending (cP) 25°C 50°C Flow Curve (200-S) ave. ascending -decending (cP) 20°C Flow Curve (200-S) ave. ascending -decending (cP) 25°C 40°C Flow Curve (300-S) ave. ascending -decending (cP) 25°C 40°C 50°C Flow Curve (350-S) ave. ascending -decending (cP) 25°C Flow Curve (500-S) ave. ascending -decending (cP) 25°C 50°C Flow Curve (50-750-S) ave. ascending -decending (cP) 25°C 40°C Flow Curve (50-950-S) ave. ascending -decending (cP) 25°C 40°C Flow Curve (100-1000-S) ave. ascending -decending (cP) 25°C 40°C newtonian 25°C 50°C Yield Stress (Pa) - 25°C (aging 1hr, 1day, 1week) 2.0 7.7 1.8 1.8 1.2 1.0 0.7 - 6.3 Yield Stress (Pa) - 40°C Yield Stress (Pa) - 50°C Bingham Model Yield Stress (Pa) - 25°C Bingham Model Yield Stress (Pa) - 40°C
A.60
Table A.4. Envelope D Waste and Melter Feed Rheological Property Data Sample Number 22 23 24 25 26 27 28 29 30
Bingham Model Consistency (mPa.s) - 25°C Bingham Model Consistency (mPa.s) - 40°C
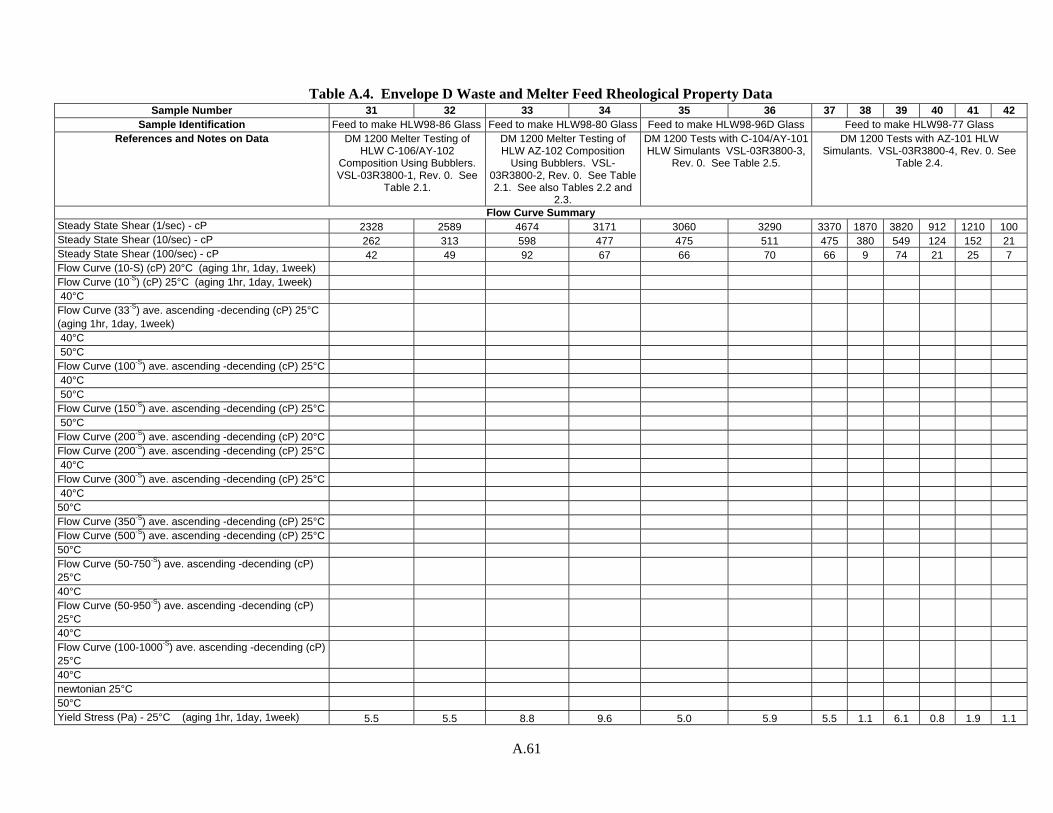
A.61
Table A.4. Envelope D Waste and Melter Feed Rheological Property Data
Sample Number 31 32 33 34 35 36 37 38 39 40 41 42 Sample Identification Feed to make HLW98-86 Glass Feed to make HLW98-80 Glass Feed to make HLW98-96D Glass Feed to make HLW98-77 Glass
References and Notes on Data DM 1200 Melter Testing of HLW C-106/AY-102
Composition Using Bubblers. VSL-03R3800-1, Rev. 0. See
Table 2.1.
DM 1200 Melter Testing of HLW AZ-102 Composition
Using Bubblers. VSL-03R3800-2, Rev. 0. See Table 2.1. See also Tables 2.2 and
2.3.
DM 1200 Tests with C-104/AY-101 HLW Simulants VSL-03R3800-3,
Rev. 0. See Table 2.5.
DM 1200 Tests with AZ-101 HLW Simulants. VSL-03R3800-4, Rev. 0. See
Table 2.4.
Flow Curve Summary Steady State Shear (1/sec) - cP 2328 2589 4674 3171 3060 3290 3370 1870 3820 912 1210 100 Steady State Shear (10/sec) - cP 262 313 598 477 475 511 475 380 549 124 152 21 Steady State Shear (100/sec) - cP 42 49 92 67 66 70 66 9 74 21 25 7 Flow Curve (10-S) (cP) 20°C (aging 1hr, 1day, 1week) Flow Curve (10-S) (cP) 25°C (aging 1hr, 1day, 1week) 40°C Flow Curve (33-S) ave. ascending -decending (cP) 25°C (aging 1hr, 1day, 1week) 40°C 50°C Flow Curve (100-S) ave. ascending -decending (cP) 25°C 40°C 50°C Flow Curve (150-S) ave. ascending -decending (cP) 25°C 50°C Flow Curve (200-S) ave. ascending -decending (cP) 20°C Flow Curve (200-S) ave. ascending -decending (cP) 25°C 40°C Flow Curve (300-S) ave. ascending -decending (cP) 25°C 40°C 50°C Flow Curve (350-S) ave. ascending -decending (cP) 25°C Flow Curve (500-S) ave. ascending -decending (cP) 25°C 50°C Flow Curve (50-750-S) ave. ascending -decending (cP) 25°C 40°C Flow Curve (50-950-S) ave. ascending -decending (cP) 25°C 40°C Flow Curve (100-1000-S) ave. ascending -decending (cP) 25°C 40°C newtonian 25°C 50°C Yield Stress (Pa) - 25°C (aging 1hr, 1day, 1week) 5.5 5.5 8.8 9.6 5.0 5.9 5.5 1.1 6.1 0.8 1.9 1.1
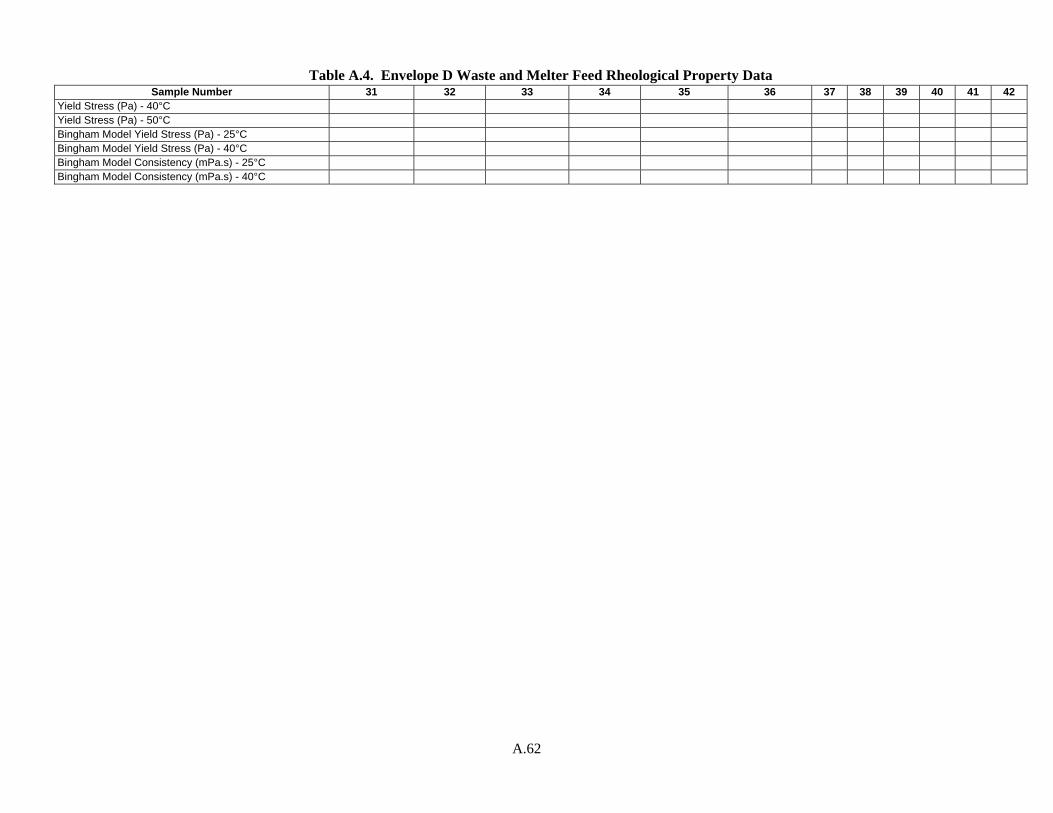
A.62
Table A.4. Envelope D Waste and Melter Feed Rheological Property Data Sample Number 31 32 33 34 35 36 37 38 39 40 41 42
Yield Stress (Pa) - 40°C Yield Stress (Pa) - 50°C Bingham Model Yield Stress (Pa) - 25°C Bingham Model Yield Stress (Pa) - 40°C Bingham Model Consistency (mPa.s) - 25°C Bingham Model Consistency (mPa.s) - 40°C
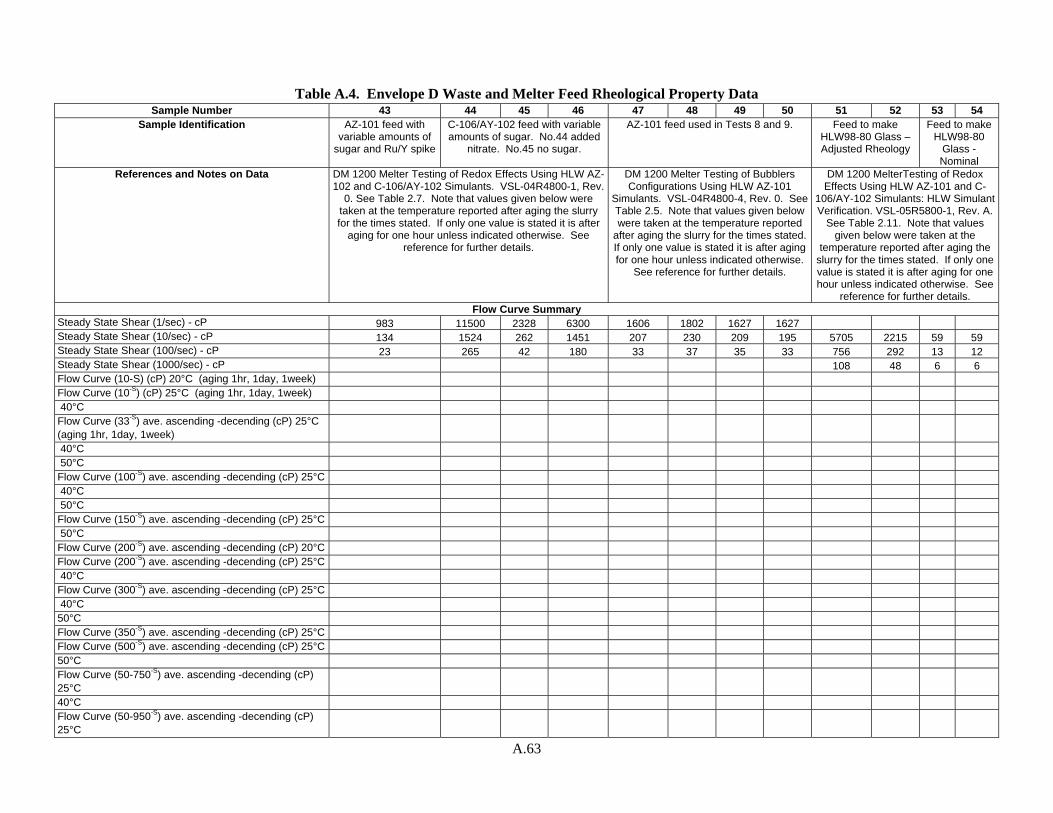
A.63
Table A.4. Envelope D Waste and Melter Feed Rheological Property Data
Sample Number 43 44 45 46 47 48 49 50 51 52 53 54 Sample Identification AZ-101 feed with
variable amounts of sugar and Ru/Y spike
C-106/AY-102 feed with variable amounts of sugar. No.44 added
nitrate. No.45 no sugar.
AZ-101 feed used in Tests 8 and 9. Feed to make HLW98-80 Glass – Adjusted Rheology
Feed to make HLW98-80
Glass - Nominal
References and Notes on Data DM 1200 Melter Testing of Redox Effects Using HLW AZ-102 and C-106/AY-102 Simulants. VSL-04R4800-1, Rev.
0. See Table 2.7. Note that values given below were taken at the temperature reported after aging the slurry for the times stated. If only one value is stated it is after
aging for one hour unless indicated otherwise. See reference for further details.
DM 1200 Melter Testing of Bubblers Configurations Using HLW AZ-101
Simulants. VSL-04R4800-4, Rev. 0. See Table 2.5. Note that values given below were taken at the temperature reported
after aging the slurry for the times stated. If only one value is stated it is after aging for one hour unless indicated otherwise.
See reference for further details.
DM 1200 MelterTesting of Redox Effects Using HLW AZ-101 and C-
106/AY-102 Simulants: HLW Simulant Verification. VSL-05R5800-1, Rev. A.
See Table 2.11. Note that values given below were taken at the
temperature reported after aging the slurry for the times stated. If only one value is stated it is after aging for one hour unless indicated otherwise. See
reference for further details. Flow Curve Summary
Steady State Shear (1/sec) - cP 983 11500 2328 6300 1606 1802 1627 1627 Steady State Shear (10/sec) - cP 134 1524 262 1451 207 230 209 195 5705 2215 59 59 Steady State Shear (100/sec) - cP 23 265 42 180 33 37 35 33 756 292 13 12 Steady State Shear (1000/sec) - cP 108 48 6 6 Flow Curve (10-S) (cP) 20°C (aging 1hr, 1day, 1week) Flow Curve (10-S) (cP) 25°C (aging 1hr, 1day, 1week) 40°C Flow Curve (33-S) ave. ascending -decending (cP) 25°C (aging 1hr, 1day, 1week) 40°C 50°C Flow Curve (100-S) ave. ascending -decending (cP) 25°C 40°C 50°C Flow Curve (150-S) ave. ascending -decending (cP) 25°C 50°C Flow Curve (200-S) ave. ascending -decending (cP) 20°C Flow Curve (200-S) ave. ascending -decending (cP) 25°C 40°C Flow Curve (300-S) ave. ascending -decending (cP) 25°C 40°C 50°C Flow Curve (350-S) ave. ascending -decending (cP) 25°C Flow Curve (500-S) ave. ascending -decending (cP) 25°C 50°C Flow Curve (50-750-S) ave. ascending -decending (cP) 25°C 40°C Flow Curve (50-950-S) ave. ascending -decending (cP) 25°C
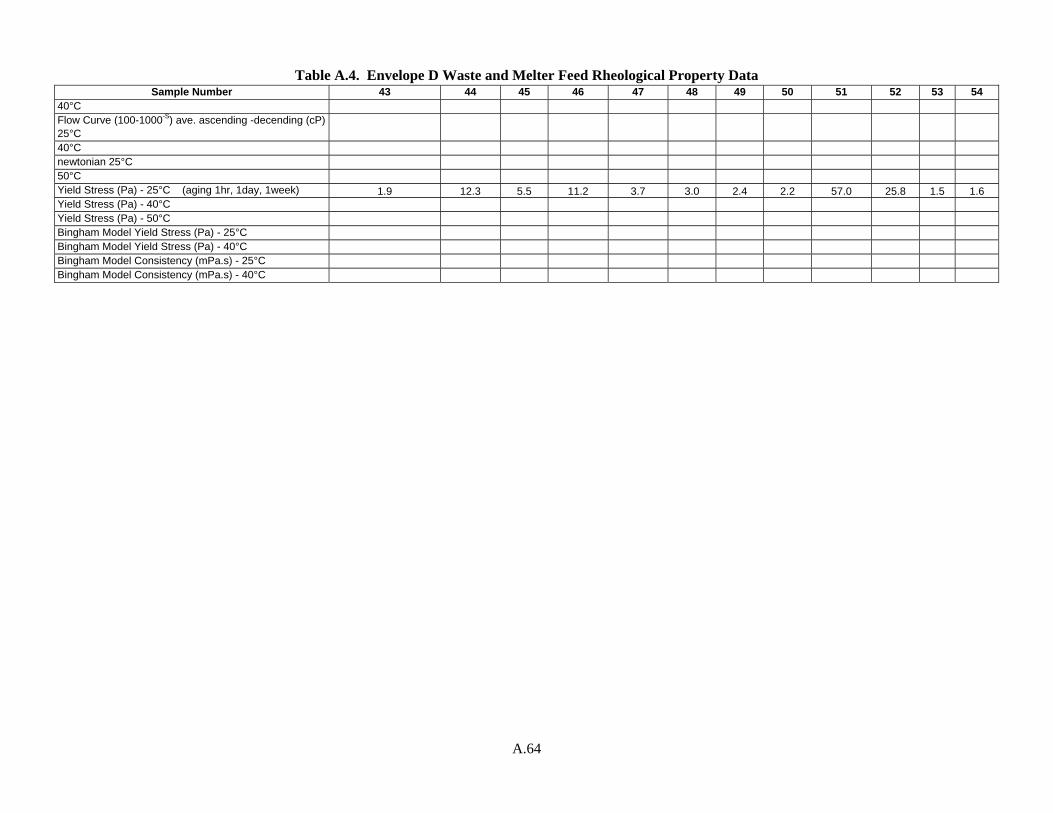
A.64
Table A.4. Envelope D Waste and Melter Feed Rheological Property Data Sample Number 43 44 45 46 47 48 49 50 51 52 53 54
40°C Flow Curve (100-1000-S) ave. ascending -decending (cP) 25°C 40°C newtonian 25°C 50°C Yield Stress (Pa) - 25°C (aging 1hr, 1day, 1week) 1.9 12.3 5.5 11.2 3.7 3.0 2.4 2.2 57.0 25.8 1.5 1.6 Yield Stress (Pa) - 40°C Yield Stress (Pa) - 50°C Bingham Model Yield Stress (Pa) - 25°C Bingham Model Yield Stress (Pa) - 40°C Bingham Model Consistency (mPa.s) - 25°C Bingham Model Consistency (mPa.s) - 40°C
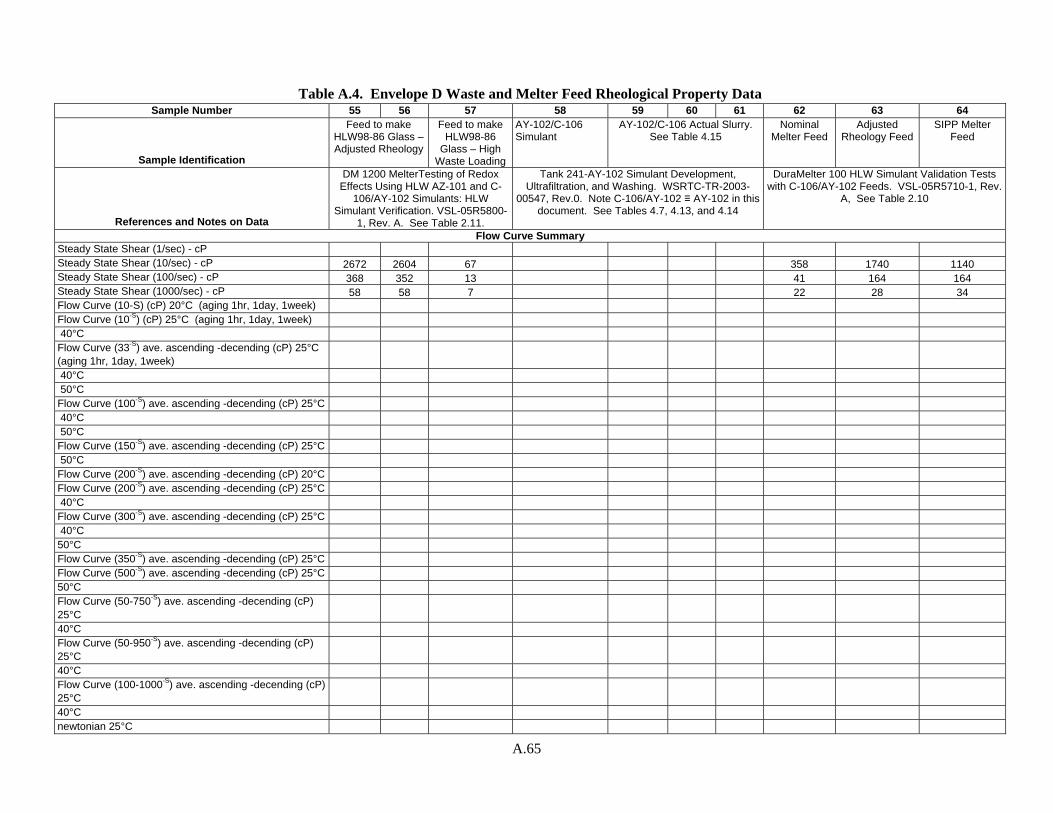
A.65
Table A.4. Envelope D Waste and Melter Feed Rheological Property Data
Sample Number 55 56 57 58 59 60 61 62 63 64
Sample Identification
Feed to make HLW98-86 Glass – Adjusted Rheology
Feed to make HLW98-86
Glass – High Waste Loading
AY-102/C-106 Simulant
AY-102/C-106 Actual Slurry. See Table 4.15
Nominal Melter Feed
Adjusted Rheology Feed
SIPP Melter Feed
References and Notes on Data
DM 1200 MelterTesting of Redox Effects Using HLW AZ-101 and C-
106/AY-102 Simulants: HLW Simulant Verification. VSL-05R5800-
1, Rev. A. See Table 2.11.
Tank 241-AY-102 Simulant Development, Ultrafiltration, and Washing. WSRTC-TR-2003-
00547, Rev.0. Note C-106/AY-102 ≡ AY-102 in this document. See Tables 4.7, 4.13, and 4.14
DuraMelter 100 HLW Simulant Validation Tests with C-106/AY-102 Feeds. VSL-05R5710-1, Rev.
A, See Table 2.10
Flow Curve Summary Steady State Shear (1/sec) - cP Steady State Shear (10/sec) - cP 2672 2604 67 358 1740 1140 Steady State Shear (100/sec) - cP 368 352 13 41 164 164 Steady State Shear (1000/sec) - cP 58 58 7 22 28 34 Flow Curve (10-S) (cP) 20°C (aging 1hr, 1day, 1week) Flow Curve (10-S) (cP) 25°C (aging 1hr, 1day, 1week) 40°C Flow Curve (33-S) ave. ascending -decending (cP) 25°C (aging 1hr, 1day, 1week) 40°C 50°C Flow Curve (100-S) ave. ascending -decending (cP) 25°C 40°C 50°C Flow Curve (150-S) ave. ascending -decending (cP) 25°C 50°C Flow Curve (200-S) ave. ascending -decending (cP) 20°C Flow Curve (200-S) ave. ascending -decending (cP) 25°C 40°C Flow Curve (300-S) ave. ascending -decending (cP) 25°C 40°C 50°C Flow Curve (350-S) ave. ascending -decending (cP) 25°C Flow Curve (500-S) ave. ascending -decending (cP) 25°C 50°C Flow Curve (50-750-S) ave. ascending -decending (cP) 25°C 40°C Flow Curve (50-950-S) ave. ascending -decending (cP) 25°C 40°C Flow Curve (100-1000-S) ave. ascending -decending (cP) 25°C 40°C newtonian 25°C
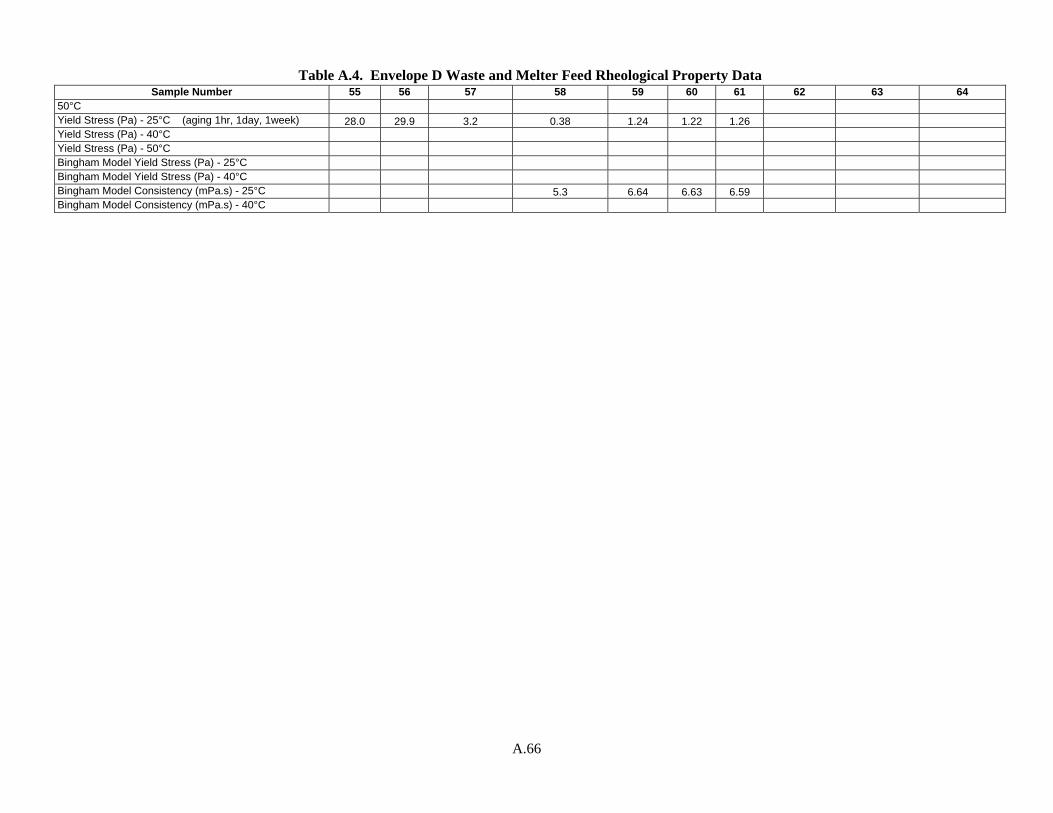
A.66
Table A.4. Envelope D Waste and Melter Feed Rheological Property Data Sample Number 55 56 57 58 59 60 61 62 63 64
50°C Yield Stress (Pa) - 25°C (aging 1hr, 1day, 1week) 28.0 29.9 3.2 0.38 1.24 1.22 1.26 Yield Stress (Pa) - 40°C Yield Stress (Pa) - 50°C Bingham Model Yield Stress (Pa) - 25°C Bingham Model Yield Stress (Pa) - 40°C Bingham Model Consistency (mPa.s) - 25°C 5.3 6.64 6.63 6.59 Bingham Model Consistency (mPa.s) - 40°C
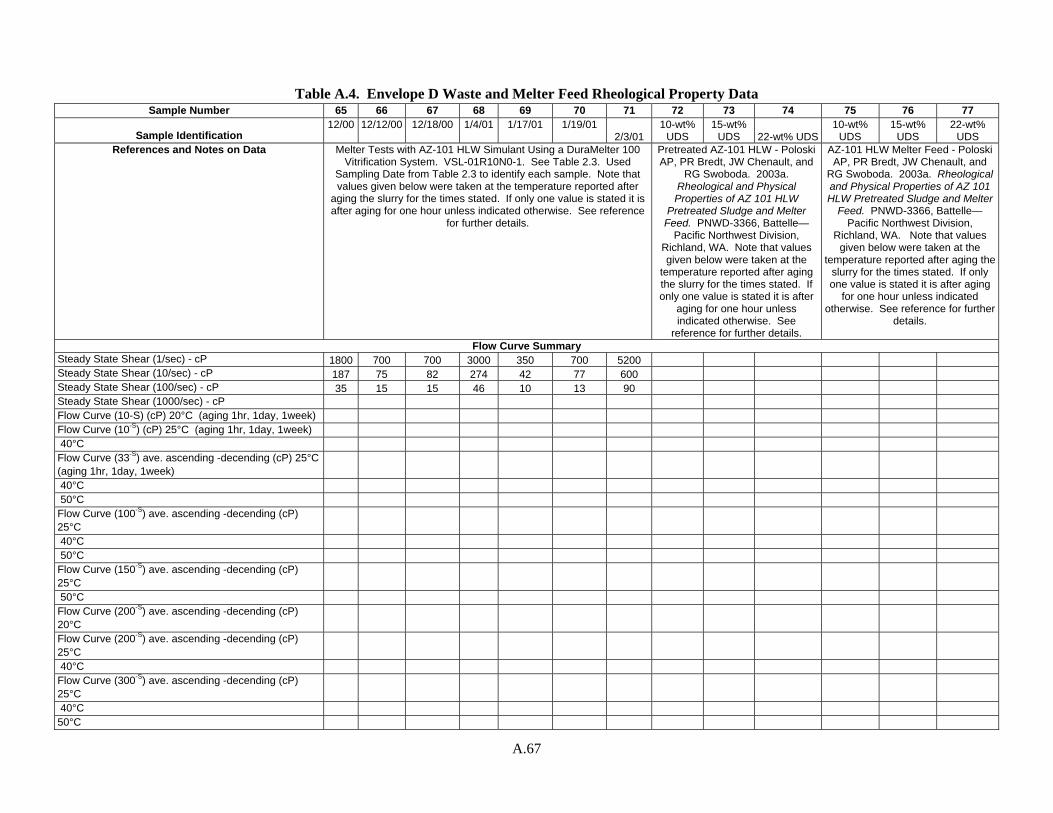
A.67
Table A.4. Envelope D Waste and Melter Feed Rheological Property Data
Sample Number 65 66 67 68 69 70 71 72 73 74 75 76 77
Sample Identification 12/00 12/12/00 12/18/00 1/4/01 1/17/01 1/19/01
2/3/01 10-wt%
UDS 15-wt%
UDS 22-wt% UDS10-wt%
UDS 15-wt%
UDS 22-wt%
UDS References and Notes on Data Melter Tests with AZ-101 HLW Simulant Using a DuraMelter 100
Vitrification System. VSL-01R10N0-1. See Table 2.3. Used Sampling Date from Table 2.3 to identify each sample. Note that values given below were taken at the temperature reported after
aging the slurry for the times stated. If only one value is stated it is after aging for one hour unless indicated otherwise. See reference
for further details.
Pretreated AZ-101 HLW - Poloski AP, PR Bredt, JW Chenault, and
RG Swoboda. 2003a. Rheological and Physical Properties of AZ 101 HLW
Pretreated Sludge and Melter Feed. PNWD-3366, Battelle—
Pacific Northwest Division, Richland, WA. Note that values given below were taken at the
temperature reported after aging the slurry for the times stated. If only one value is stated it is after
aging for one hour unless indicated otherwise. See
reference for further details.
AZ-101 HLW Melter Feed - Poloski AP, PR Bredt, JW Chenault, and
RG Swoboda. 2003a. Rheological and Physical Properties of AZ 101 HLW Pretreated Sludge and Melter
Feed. PNWD-3366, Battelle—Pacific Northwest Division,
Richland, WA. Note that values given below were taken at the
temperature reported after aging the slurry for the times stated. If only one value is stated it is after aging
for one hour unless indicated otherwise. See reference for further
details.
Flow Curve Summary Steady State Shear (1/sec) - cP 1800 700 700 3000 350 700 5200 Steady State Shear (10/sec) - cP 187 75 82 274 42 77 600 Steady State Shear (100/sec) - cP 35 15 15 46 10 13 90 Steady State Shear (1000/sec) - cP Flow Curve (10-S) (cP) 20°C (aging 1hr, 1day, 1week) Flow Curve (10-S) (cP) 25°C (aging 1hr, 1day, 1week) 40°C Flow Curve (33-S) ave. ascending -decending (cP) 25°C (aging 1hr, 1day, 1week) 40°C 50°C Flow Curve (100-S) ave. ascending -decending (cP) 25°C 40°C 50°C Flow Curve (150-S) ave. ascending -decending (cP) 25°C 50°C Flow Curve (200-S) ave. ascending -decending (cP) 20°C Flow Curve (200-S) ave. ascending -decending (cP) 25°C 40°C Flow Curve (300-S) ave. ascending -decending (cP) 25°C 40°C 50°C
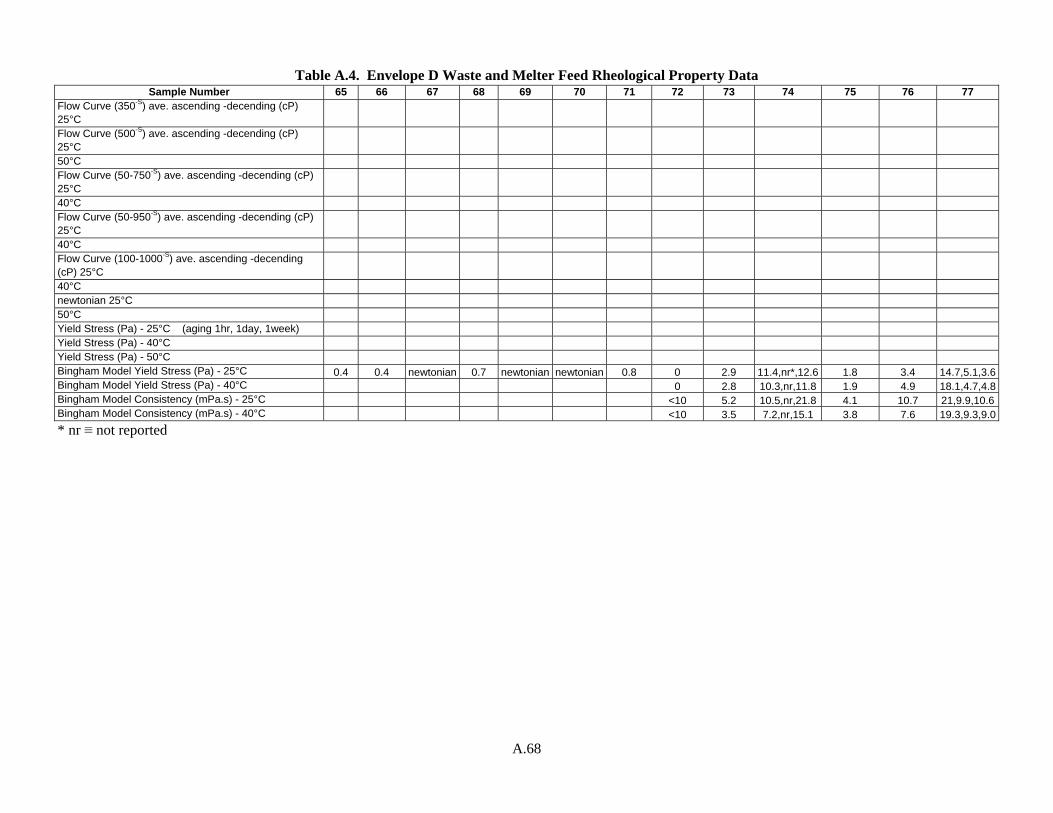
A.68
Table A.4. Envelope D Waste and Melter Feed Rheological Property Data Sample Number 65 66 67 68 69 70 71 72 73 74 75 76 77
Flow Curve (350-S) ave. ascending -decending (cP) 25°C Flow Curve (500-S) ave. ascending -decending (cP) 25°C 50°C Flow Curve (50-750-S) ave. ascending -decending (cP) 25°C 40°C Flow Curve (50-950-S) ave. ascending -decending (cP) 25°C 40°C Flow Curve (100-1000-S) ave. ascending -decending (cP) 25°C 40°C newtonian 25°C 50°C Yield Stress (Pa) - 25°C (aging 1hr, 1day, 1week) Yield Stress (Pa) - 40°C Yield Stress (Pa) - 50°C Bingham Model Yield Stress (Pa) - 25°C 0.4 0.4 newtonian 0.7 newtonian newtonian 0.8 0 2.9 11.4,nr*,12.6 1.8 3.4 14.7,5.1,3.6 Bingham Model Yield Stress (Pa) - 40°C 0 2.8 10.3,nr,11.8 1.9 4.9 18.1,4.7,4.8 Bingham Model Consistency (mPa.s) - 25°C <10 5.2 10.5,nr,21.8 4.1 10.7 21,9.9,10.6 Bingham Model Consistency (mPa.s) - 40°C <10 3.5 7.2,nr,15.1 3.8 7.6 19.3,9.3,9.0 * nr ≡ not reported
Appendix B
Physical-Property Correlations and Discussions
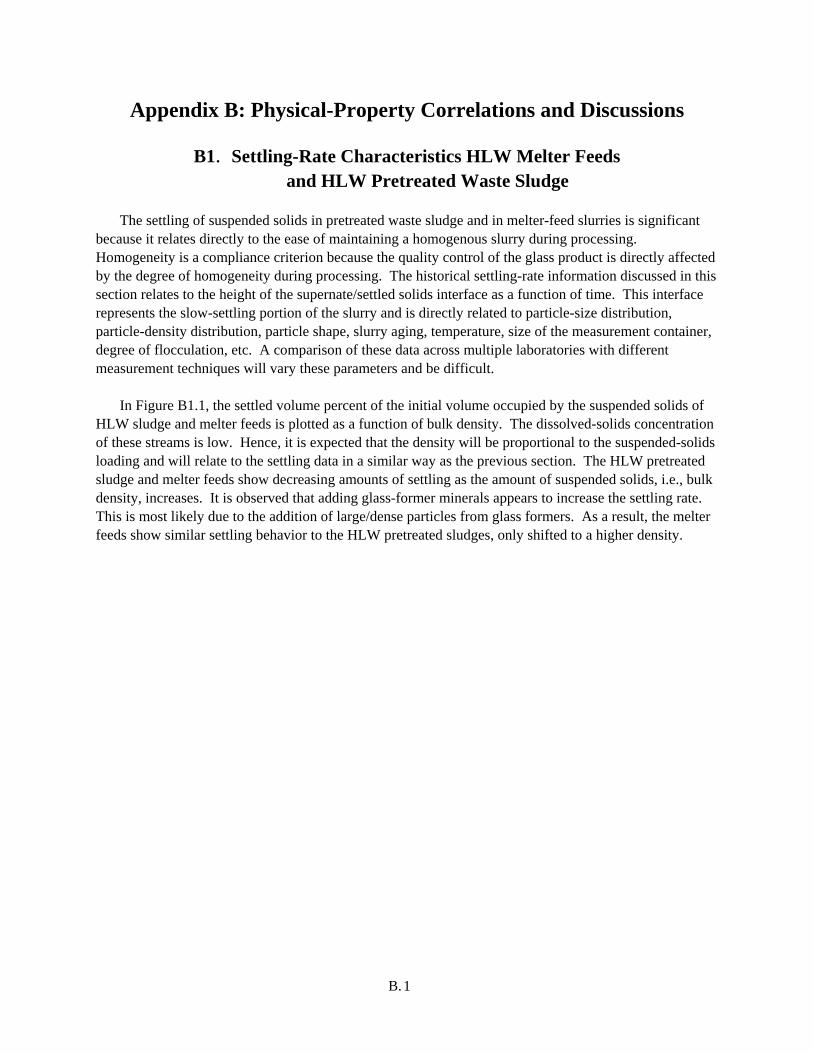
B. 1
Appendix B: Physical-Property Correlations and Discussions
B1. Settling-Rate Characteristics HLW Melter Feeds and HLW Pretreated Waste Sludge
The settling of suspended solids in pretreated waste sludge and in melter-feed slurries is significant
because it relates directly to the ease of maintaining a homogenous slurry during processing. Homogeneity is a compliance criterion because the quality control of the glass product is directly affected by the degree of homogeneity during processing. The historical settling-rate information discussed in this section relates to the height of the supernate/settled solids interface as a function of time. This interface represents the slow-settling portion of the slurry and is directly related to particle-size distribution, particle-density distribution, particle shape, slurry aging, temperature, size of the measurement container, degree of flocculation, etc. A comparison of these data across multiple laboratories with different measurement techniques will vary these parameters and be difficult.
In Figure B1.1, the settled volume percent of the initial volume occupied by the suspended solids of HLW sludge and melter feeds is plotted as a function of bulk density. The dissolved-solids concentration of these streams is low. Hence, it is expected that the density will be proportional to the suspended-solids loading and will relate to the settling data in a similar way as the previous section. The HLW pretreated sludge and melter feeds show decreasing amounts of settling as the amount of suspended solids, i.e., bulk density, increases. It is observed that adding glass-former minerals appears to increase the settling rate. This is most likely due to the addition of large/dense particles from glass formers. As a result, the melter feeds show similar settling behavior to the HLW pretreated sludges, only shifted to a higher density.
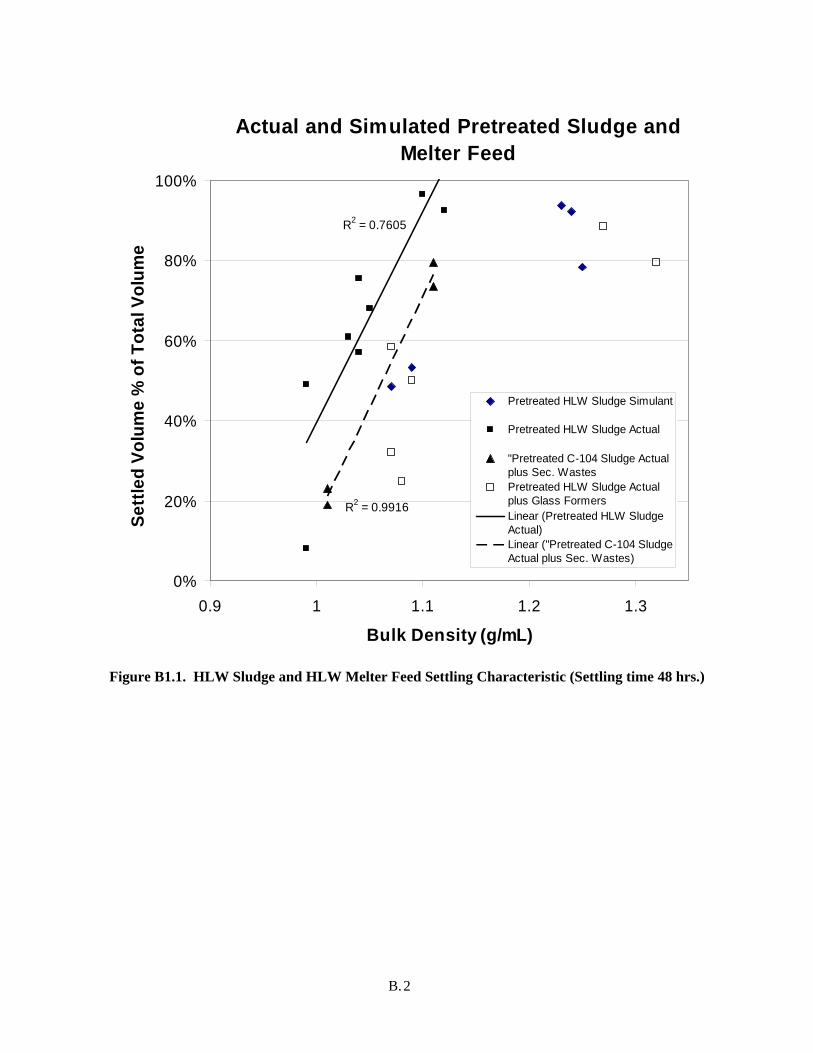
B. 2
Actual and Simulated Pretreated Sludge and Melter Feed
R2 = 0.7605
R2 = 0.9916
0%
20%
40%
60%
80%
100%
0.9 1 1.1 1.2 1.3
Bulk Density (g/mL)
Sett
led
Volu
me
% o
f Tot
al V
olum
e
Pretreated HLW Sludge Simulant
Pretreated HLW Sludge Actual
"Pretreated C-104 Sludge Actualplus Sec. WastesPretreated HLW Sludge Actualplus Glass FormersLinear (Pretreated HLW SludgeActual)Linear ("Pretreated C-104 SludgeActual plus Sec. Wastes)
Figure B1.1. HLW Sludge and HLW Melter Feed Settling Characteristic (Settling time 48 hrs.)
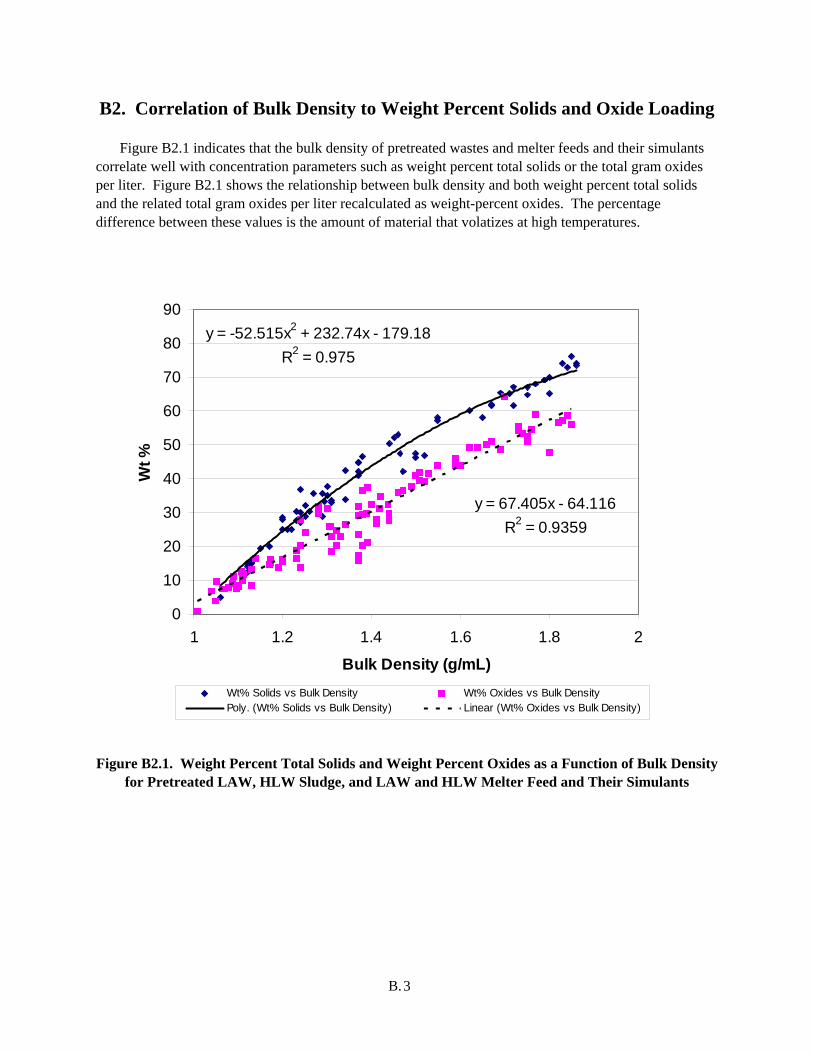
B. 3
B2. Correlation of Bulk Density to Weight Percent Solids and Oxide Loading
Figure B2.1 indicates that the bulk density of pretreated wastes and melter feeds and their simulants correlate well with concentration parameters such as weight percent total solids or the total gram oxides per liter. Figure B2.1 shows the relationship between bulk density and both weight percent total solids and the related total gram oxides per liter recalculated as weight-percent oxides. The percentage difference between these values is the amount of material that volatizes at high temperatures.
y = -52.515x2 + 232.74x - 179.18R2 = 0.975
y = 67.405x - 64.116R2 = 0.9359
0
10
20
30
40
50
60
70
80
90
1 1.2 1.4 1.6 1.8 2
Bulk Density (g/mL)
Wt %
Wt% Solids vs Bulk Density Wt% Oxides vs Bulk DensityPoly. (Wt% Solids vs Bulk Density) Linear (Wt% Oxides vs Bulk Density)
Figure B2.1. Weight Percent Total Solids and Weight Percent Oxides as a Function of Bulk Density
for Pretreated LAW, HLW Sludge, and LAW and HLW Melter Feed and Their Simulants
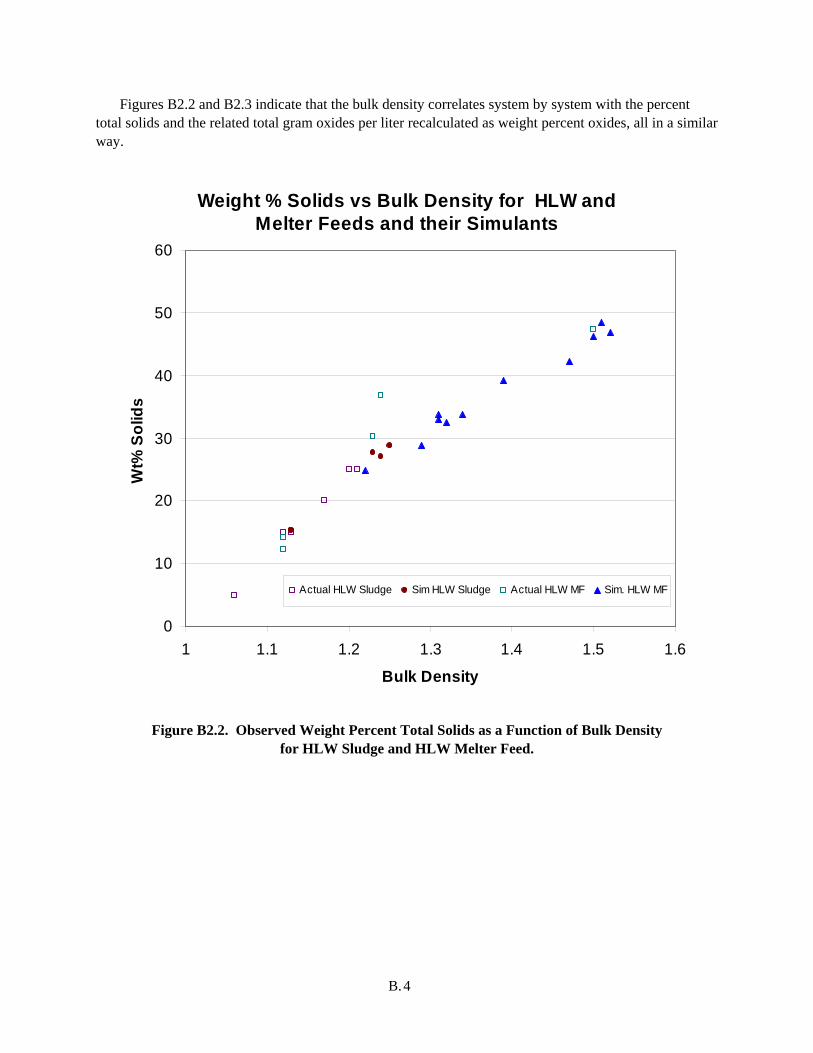
B. 4
Figures B2.2 and B2.3 indicate that the bulk density correlates system by system with the percent total solids and the related total gram oxides per liter recalculated as weight percent oxides, all in a similar way.
Weight % Solids vs Bulk Density for HLW and Melter Feeds and their Simulants
0
10
20
30
40
50
60
1 1.1 1.2 1.3 1.4 1.5 1.6
Bulk Density
Wt%
Sol
ids
Actual HLW Sludge Sim HLW Sludge Actual HLW MF Sim. HLW MF
Figure B2.2. Observed Weight Percent Total Solids as a Function of Bulk Density for HLW Sludge and HLW Melter Feed.
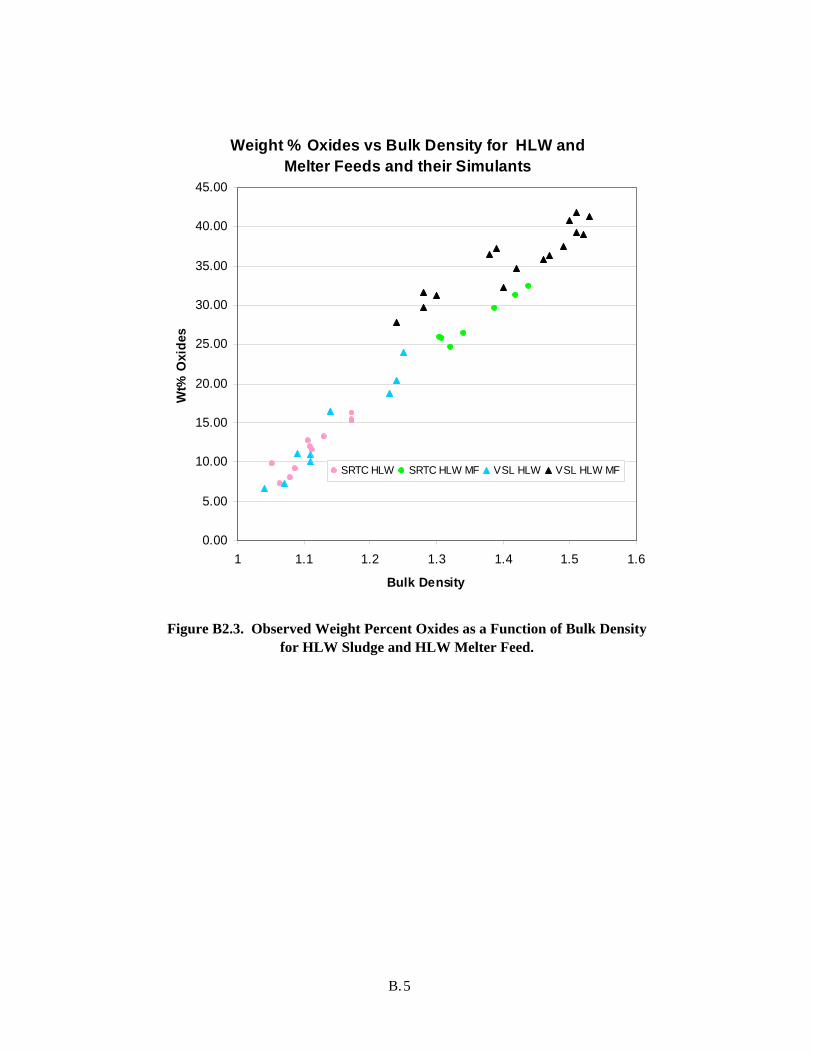
B. 5
Weight % Oxides vs Bulk Density for HLW and Melter Feeds and their Simulants
0.00
5.00
10.00
15.00
20.00
25.00
30.00
35.00
40.00
45.00
1 1.1 1.2 1.3 1.4 1.5 1.6
Bulk Density
Wt%
Oxi
des
SRTC HLW SRTC HLW MF VSL HLW VSL HLW MF
Figure B2.3. Observed Weight Percent Oxides as a Function of Bulk Density for HLW Sludge and HLW Melter Feed.
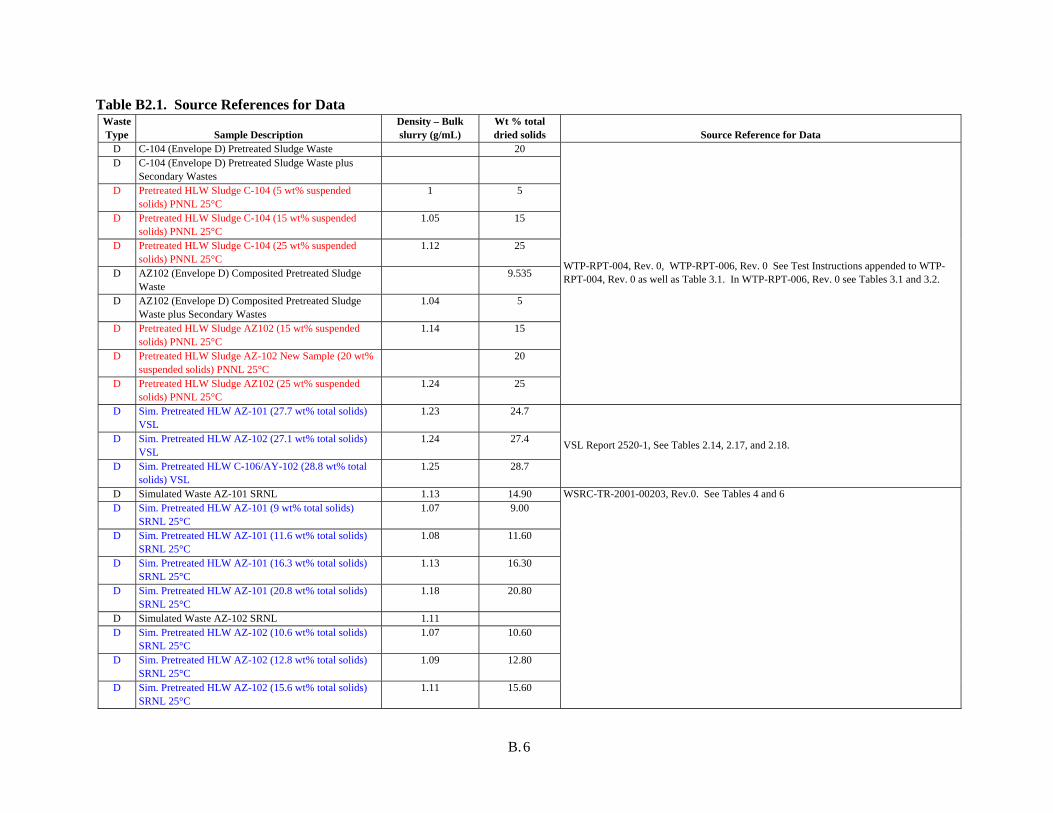
B. 6
Table B2.1. Source References for Data Waste Type Sample Description
Density – Bulk slurry (g/mL)
Wt % total dried solids Source Reference for Data
D C-104 (Envelope D) Pretreated Sludge Waste 20 D C-104 (Envelope D) Pretreated Sludge Waste plus
Secondary Wastes
D Pretreated HLW Sludge C-104 (5 wt% suspended solids) PNNL 25°C
1 5
D Pretreated HLW Sludge C-104 (15 wt% suspended solids) PNNL 25°C
1.05 15
D Pretreated HLW Sludge C-104 (25 wt% suspended solids) PNNL 25°C
1.12 25
D AZ102 (Envelope D) Composited Pretreated Sludge Waste
9.535
D AZ102 (Envelope D) Composited Pretreated Sludge Waste plus Secondary Wastes
1.04 5
D Pretreated HLW Sludge AZ102 (15 wt% suspended solids) PNNL 25°C
1.14 15
D Pretreated HLW Sludge AZ-102 New Sample (20 wt% suspended solids) PNNL 25°C
20
D Pretreated HLW Sludge AZ102 (25 wt% suspended solids) PNNL 25°C
1.24 25
WTP-RPT-004, Rev. 0, WTP-RPT-006, Rev. 0 See Test Instructions appended to WTP-RPT-004, Rev. 0 as well as Table 3.1. In WTP-RPT-006, Rev. 0 see Tables 3.1 and 3.2.
D Sim. Pretreated HLW AZ-101 (27.7 wt% total solids) VSL
1.23 24.7
D Sim. Pretreated HLW AZ-102 (27.1 wt% total solids) VSL
1.24 27.4
D Sim. Pretreated HLW C-106/AY-102 (28.8 wt% total solids) VSL
1.25 28.7
VSL Report 2520-1, See Tables 2.14, 2.17, and 2.18.
D Simulated Waste AZ-101 SRNL 1.13 14.90 D Sim. Pretreated HLW AZ-101 (9 wt% total solids)
SRNL 25°C 1.07 9.00
D Sim. Pretreated HLW AZ-101 (11.6 wt% total solids) SRNL 25°C
1.08 11.60
D Sim. Pretreated HLW AZ-101 (16.3 wt% total solids) SRNL 25°C
1.13 16.30
D Sim. Pretreated HLW AZ-101 (20.8 wt% total solids) SRNL 25°C
1.18 20.80
D Simulated Waste AZ-102 SRNL 1.11 D Sim. Pretreated HLW AZ-102 (10.6 wt% total solids)
SRNL 25°C 1.07 10.60
D Sim. Pretreated HLW AZ-102 (12.8 wt% total solids) SRNL 25°C
1.09 12.80
D Sim. Pretreated HLW AZ-102 (15.6 wt% total solids) SRNL 25°C
1.11 15.60
WSRC-TR-2001-00203, Rev.0. See Tables 4 and 6
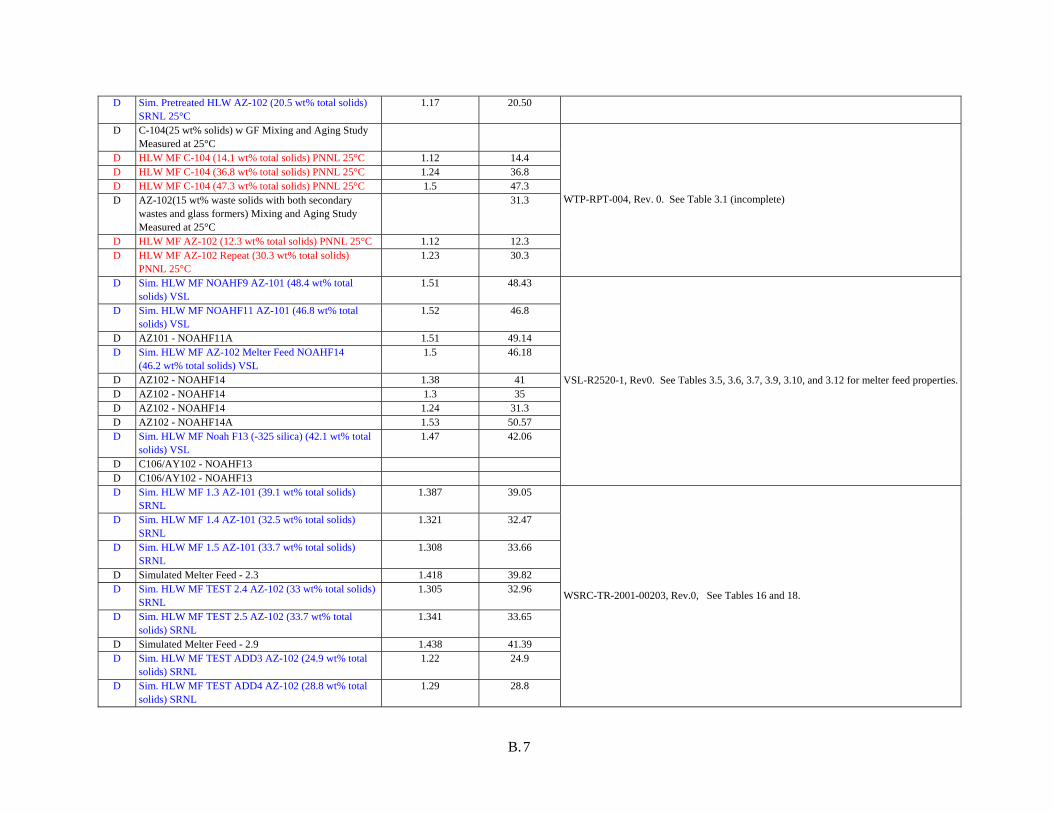
B. 7
D Sim. Pretreated HLW AZ-102 (20.5 wt% total solids) SRNL 25°C
1.17 20.50
D C-104(25 wt% solids) w GF Mixing and Aging Study Measured at 25°C
D HLW MF C-104 (14.1 wt% total solids) PNNL 25°C 1.12 14.4 D HLW MF C-104 (36.8 wt% total solids) PNNL 25°C 1.24 36.8 D HLW MF C-104 (47.3 wt% total solids) PNNL 25°C 1.5 47.3 D AZ-102(15 wt% waste solids with both secondary
wastes and glass formers) Mixing and Aging Study Measured at 25°C
31.3
D HLW MF AZ-102 (12.3 wt% total solids) PNNL 25°C 1.12 12.3 D HLW MF AZ-102 Repeat (30.3 wt% total solids)
PNNL 25°C 1.23 30.3
WTP-RPT-004, Rev. 0. See Table 3.1 (incomplete)
D Sim. HLW MF NOAHF9 AZ-101 (48.4 wt% total solids) VSL
1.51 48.43
D Sim. HLW MF NOAHF11 AZ-101 (46.8 wt% total solids) VSL
1.52 46.8
D AZ101 - NOAHF11A 1.51 49.14 D Sim. HLW MF AZ-102 Melter Feed NOAHF14
(46.2 wt% total solids) VSL 1.5 46.18
D AZ102 - NOAHF14 1.38 41 D AZ102 - NOAHF14 1.3 35 D AZ102 - NOAHF14 1.24 31.3 D AZ102 - NOAHF14A 1.53 50.57 D Sim. HLW MF Noah F13 (-325 silica) (42.1 wt% total
solids) VSL 1.47 42.06
D C106/AY102 - NOAHF13 D C106/AY102 - NOAHF13
VSL-R2520-1, Rev0. See Tables 3.5, 3.6, 3.7, 3.9, 3.10, and 3.12 for melter feed properties.
D Sim. HLW MF 1.3 AZ-101 (39.1 wt% total solids) SRNL
1.387 39.05
D Sim. HLW MF 1.4 AZ-101 (32.5 wt% total solids) SRNL
1.321 32.47
D Sim. HLW MF 1.5 AZ-101 (33.7 wt% total solids) SRNL
1.308 33.66
D Simulated Melter Feed - 2.3 1.418 39.82 D Sim. HLW MF TEST 2.4 AZ-102 (33 wt% total solids)
SRNL 1.305 32.96
D Sim. HLW MF TEST 2.5 AZ-102 (33.7 wt% total solids) SRNL
1.341 33.65
D Simulated Melter Feed - 2.9 1.438 41.39 D Sim. HLW MF TEST ADD3 AZ-102 (24.9 wt% total
solids) SRNL 1.22 24.9
D Sim. HLW MF TEST ADD4 AZ-102 (28.8 wt% total solids) SRNL
1.29 28.8
WSRC-TR-2001-00203, Rev.0, See Tables 16 and 18.
B.8
References
Bredt PR, LK Jagoda, and DE Rinehart. 2001. Rheological Studies on Pretreated Feed and Melter Feed from C-104 and AZ-102. PNNL-13359 (WTP-RPT-004), Pacific Northwest National Laboratory, Richland, WA.
Crawford, CL, DM Ferrara, RF Schumacher, and NE Bibler. 2001. Crucible-Scale Active Vitrification Testing Envelope C, Tank 241-AN-102 (U). WSRC-TR-2000-00371, SRT-RPP-2000-00022, Rev. 0. Westinghouse Savannah River Company, Savannah River Site, Aiken, SC.
Eibling RE, and C Nash. 2001. Hanford Waste Simulants Created to Support the Research and Development on the River Protection Project – Waste Treatment Plant. WSRC-TR-2000-00338, Westinghouse Savannah River Company, Aiken, SC.
Hansen EK, and RE Eibling. 2001. Status Report for Mixing Envelope D Sludge with LAW Intermediate Products with and without Glass Formers. SRT-RPP-2001-00008, Savannah River National Laboratory, Aiken, SC.
Hansen EK, RE Eibling, and TB Calloway, Jr. 2001. Mixing Envelope D Sludge with LAW Intermediate Products with and without Glass Formers. WSRC-TR-2001-00203, Rev. 0, Westinghouse Savannah River Company, Aiken, SC.
Hansen EK, and RF Schumacher. 2003. Characterization of HLW and LAW Glass Formers – Final Report. SRT-RPP-2002-00146, Rev. 1, Savannah River National Laboratory, Aiken, SC.
Hansen EK, and C Crawford. 2005. Hanford HLW AY102/C106 Pretreated Sludge Physical and Chemical Properties Prior to Melter Feed Processing (U). SRT-RPP-2004-00061, Rev. 0, Savannah River National Laboratory, Aiken, SC
Kot WK, H Gan, and IL Pegg. 2000. Physical and Rheological Properties of Waste Simulants and Melter Feeds for RPP-WTP HLW Vitrification. VSL-00R2520-1, Vitreous States Laboratory, The Catholic University of America, Washington D.C.
Matlack KS, WK Kot, and IL Pegg. 2000. Screening Tests on DuraMelter™ 10 with C-106/AY-102 Simulant in Support of DuraMelter™ 1000 Throughput Tests. VSL-00R2501-2, Rev. 0, Vitreous States Laboratory, The Catholic University of America, Washington DC.
Matlack KS, WK Kot, F Perez-Cardenas, and IL Pegg. 2000. Tests on DuraMelter™ 10 with AZ-101 Simulant in Support of DuraMelter™ 1000 Throughput Tests. VSL-00R2501-1, Rev. 0, Vitreous States Laboratory, The Catholic University of America, Washington D.C.
Rosencrance SW, WD King, and C Nash. 2000. Physical Characterization for Hanford Tank Waste Samples AN-102, AN-103, and AZ-102. WSRC-TR-2000-00352, Westinghouse Savannah River Company, Aiken, SC. (SCT-M0SRLE60-00-83-01A
B.9
B3. Rheological Comparison of HLW Pretreated Wastes and Associated Melter Feeds
Figure B3.1 compares the actual and simulants of the AZ-102 HLW sludge at an insoluble solids
loading range of 5 to 25 wt%. Note that the total solids in a pretreated HLW sludge are almost totally insoluble because the waste sludge is produced from the raw waste by a washing process that removes almost all of the soluble chemical compounds, so it can be said with reasonable confidence that a sludge with 15 wt% suspended solids is about 85 wt% water. The principle observation to be made is that the waste simulant made by the hydroxide precipitation method (SRNL) has rheological properties closer to the actual HLW AZ-102 than that made by just mixing the appropriate hydroxide chemicals (VSL). Note that this relationship between the actual and simulated waste materials was reported by Morrey et al. (1996). The melter feed made with the “hydroxide precipitation and wash method” simulant is slightly more concentrated than the feed made with actual HLW sludge (67 wt% water vs 69 wt% water). Again, the “mixing the appropriate hydroxide chemicals method” for producing a simulant resulted in a simulated melter-feed system with a significantly lower viscosity for the same water concentration.
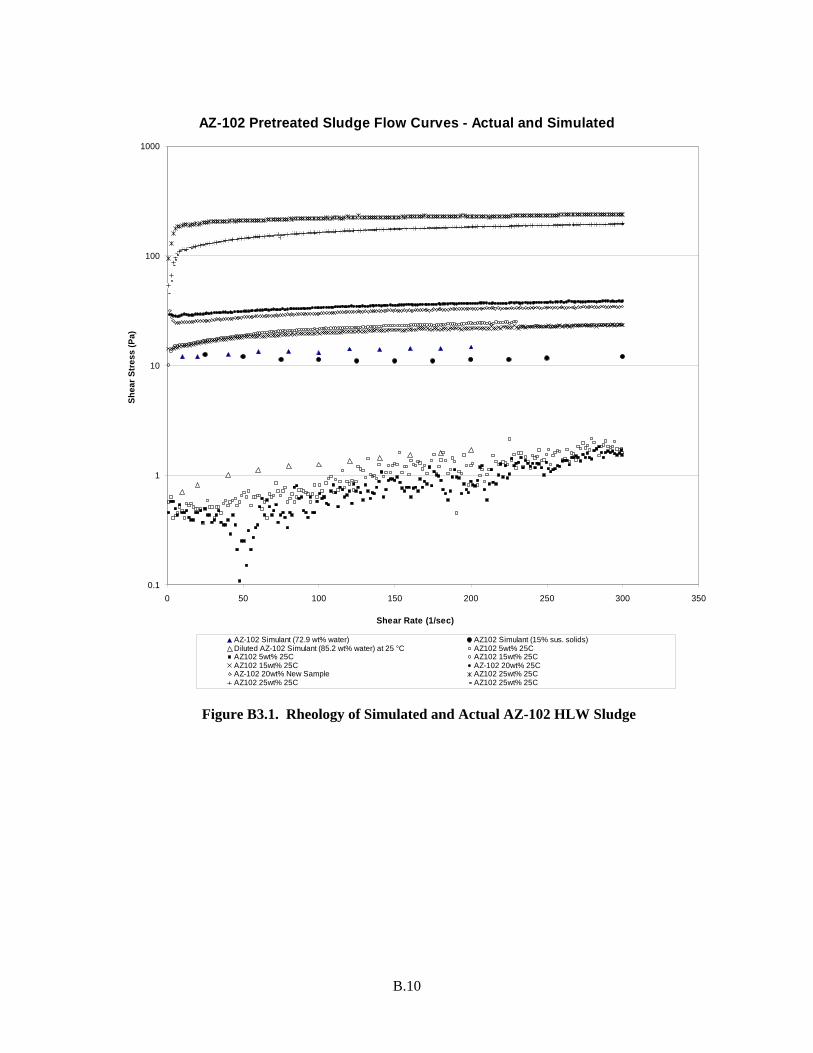
B.10
AZ-102 Pretreated Sludge Flow Curves - Actual and Simulated
0.1
1
10
100
1000
0 50 100 150 200 250 300 350
Shear Rate (1/sec)
Shea
r Str
ess
(Pa)
AZ-102 Simulant (72.9 wt% water) AZ102 Simulant (15% sus. solids)Diluted AZ-102 Simulant (85.2 wt% water) at 25 °C AZ102 5wt% 25CAZ102 5wt% 25C AZ102 15wt% 25CAZ102 15wt% 25C AZ-102 20wt% 25CAZ-102 20wt% New Sample AZ102 25wt% 25CAZ102 25wt% 25C AZ102 25wt% 25C
Figure B3.1. Rheology of Simulated and Actual AZ-102 HLW Sludge
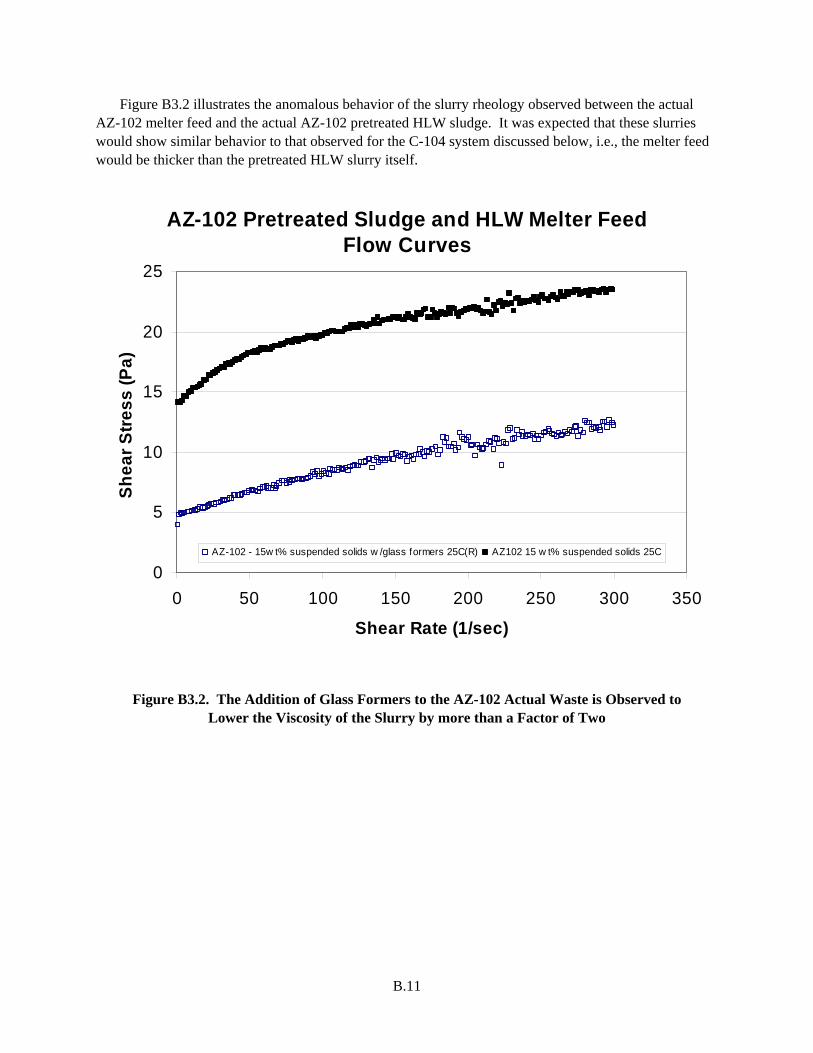
B.11
Figure B3.2 illustrates the anomalous behavior of the slurry rheology observed between the actual AZ-102 melter feed and the actual AZ-102 pretreated HLW sludge. It was expected that these slurries would show similar behavior to that observed for the C-104 system discussed below, i.e., the melter feed would be thicker than the pretreated HLW slurry itself.
AZ-102 Pretreated Sludge and HLW Melter Feed Flow Curves
0
5
10
15
20
25
0 50 100 150 200 250 300 350
Shear Rate (1/sec)
Shea
r Stre
ss (P
a)
AZ-102 - 15w t% suspended solids w /glass formers 25C(R) AZ102 15 w t% suspended solids 25C
Figure B3.2. The Addition of Glass Formers to the AZ-102 Actual Waste is Observed to Lower the Viscosity of the Slurry by more than a Factor of Two
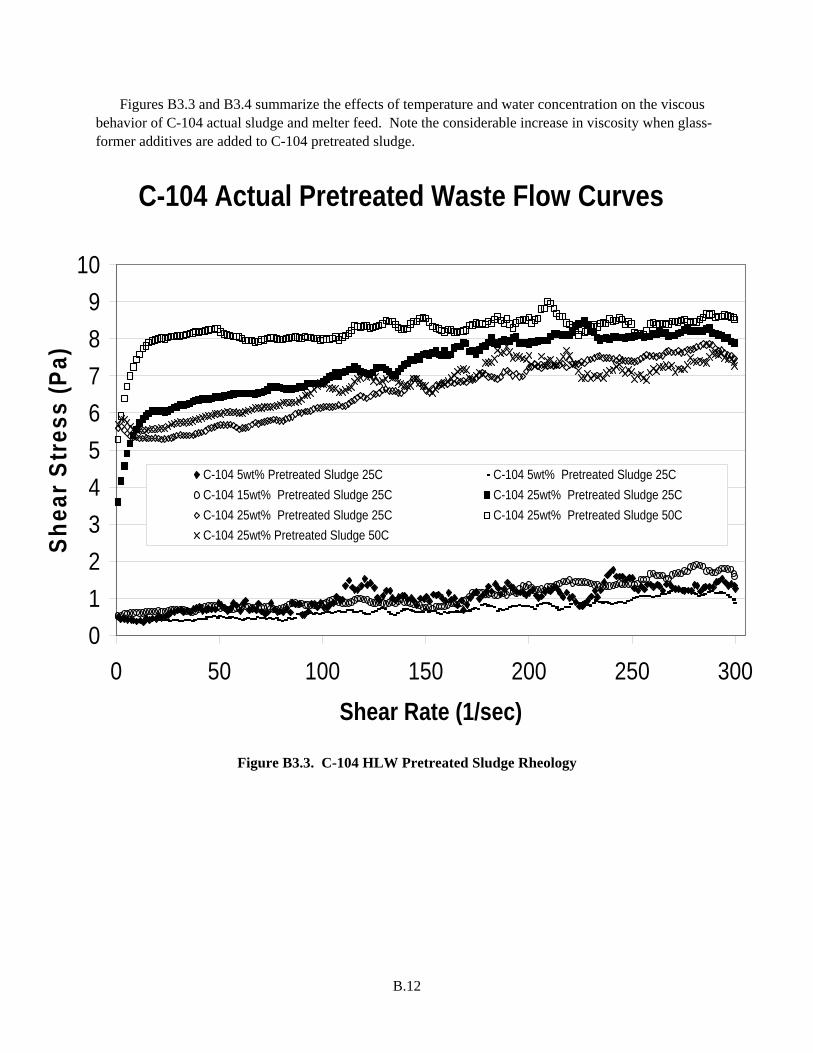
B.12
Figures B3.3 and B3.4 summarize the effects of temperature and water concentration on the viscous behavior of C-104 actual sludge and melter feed. Note the considerable increase in viscosity when glass-former additives are added to C-104 pretreated sludge.
C-104 Actual Pretreated Waste Flow Curves
0123456789
10
0 50 100 150 200 250 300Shear Rate (1/sec)
Shea
r Str
ess
(Pa)
C-104 5wt% Pretreated Sludge 25C C-104 5wt% Pretreated Sludge 25CC-104 15wt% Pretreated Sludge 25C C-104 25wt% Pretreated Sludge 25CC-104 25wt% Pretreated Sludge 25C C-104 25wt% Pretreated Sludge 50CC-104 25wt% Pretreated Sludge 50C
Figure B3.3. C-104 HLW Pretreated Sludge Rheology
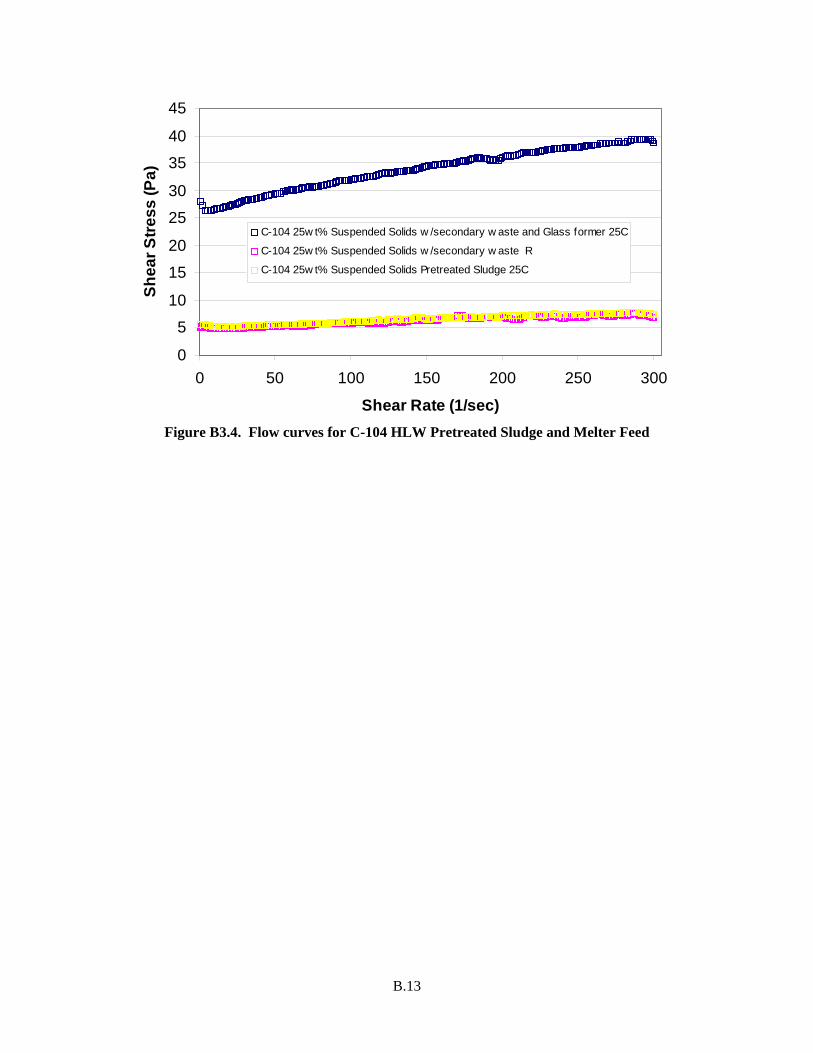
B.13
0
5
10
15
20
25
30
35
40
45
0 50 100 150 200 250 300
Shear Rate (1/sec)
Shea
r Stre
ss (P
a)
C-104 25w t% Suspended Solids w /secondary w aste and Glass former 25C
C-104 25w t% Suspended Solids w /secondary w aste R
C-104 25w t% Suspended Solids Pretreated Sludge 25C
Figure B3.4. Flow curves for C-104 HLW Pretreated Sludge and Melter Feed
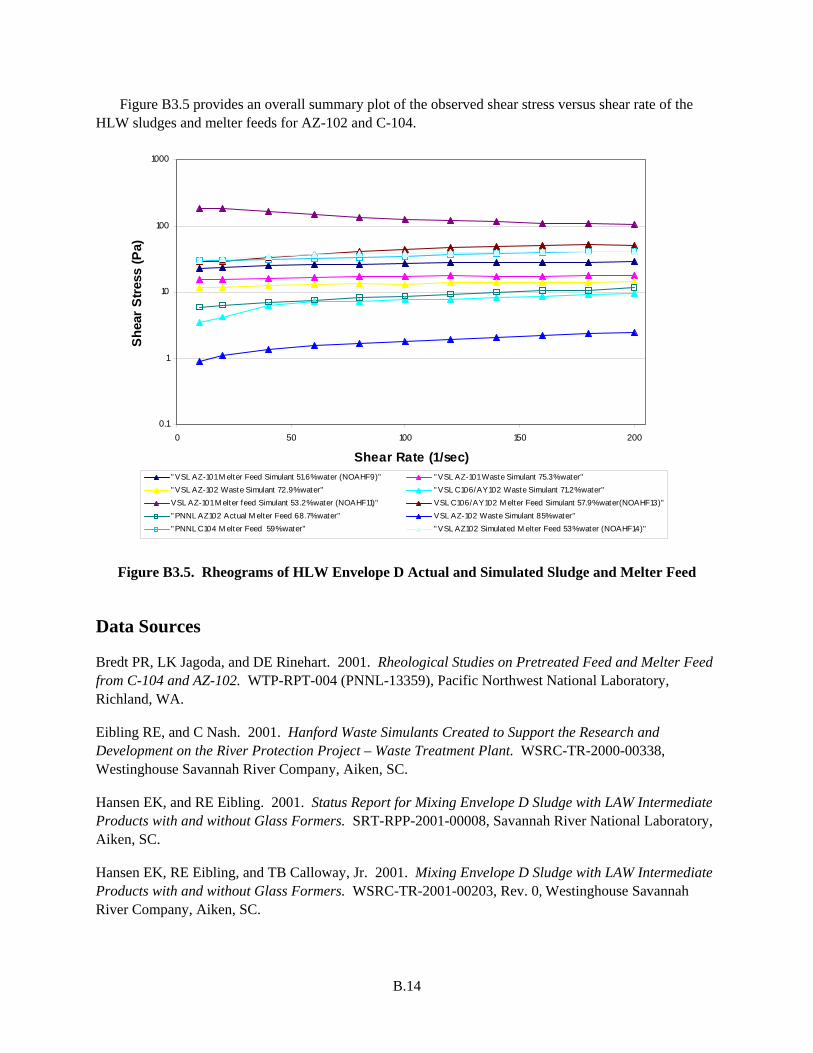
B.14
Figure B3.5 provides an overall summary plot of the observed shear stress versus shear rate of the HLW sludges and melter feeds for AZ-102 and C-104.
0.1
1
10
100
1000
0 50 100 150 200
Shear Rate (1/sec)
Shea
r St
ress
(Pa)
" VSL AZ-101 M elter Feed Simulant 51.6% water (NOAHF9)" " VSL AZ-101 Waste Simulant 75.3% water"" VSL AZ-102 Waste Simulant 72.9% water" " VSL C106/AY102 Waste Simulant 71.2% water"VSL AZ-101 M elter feed Simulant 53.2% water (NOAHF11)" VSL C106/AY102 M elter Feed Simulant 57.9% water(NOAHF13)"" PNNL AZ102 Actual M elter Feed 68.7% water" VSL AZ-102 Waste Simulant 85% water"" PNNL C104 M elter Feed 59% water" " VSL AZ102 Simulated M elter Feed 53% water (NOAHF14)"
Figure B3.5. Rheograms of HLW Envelope D Actual and Simulated Sludge and Melter Feed
Data Sources
Bredt PR, LK Jagoda, and DE Rinehart. 2001. Rheological Studies on Pretreated Feed and Melter Feed from C-104 and AZ-102. WTP-RPT-004 (PNNL-13359), Pacific Northwest National Laboratory, Richland, WA.
Eibling RE, and C Nash. 2001. Hanford Waste Simulants Created to Support the Research and Development on the River Protection Project – Waste Treatment Plant. WSRC-TR-2000-00338, Westinghouse Savannah River Company, Aiken, SC.
Hansen EK, and RE Eibling. 2001. Status Report for Mixing Envelope D Sludge with LAW Intermediate Products with and without Glass Formers. SRT-RPP-2001-00008, Savannah River National Laboratory, Aiken, SC.
Hansen EK, RE Eibling, and TB Calloway, Jr. 2001. Mixing Envelope D Sludge with LAW Intermediate Products with and without Glass Formers. WSRC-TR-2001-00203, Rev. 0, Westinghouse Savannah River Company, Aiken, SC.
B.15
Kot WK, H Gan, and IL Pegg. 2000. Physical and Rheological Properties of Waste Simulants and Melter Feeds for RPP-WTP HLW Vitrification. VSL-00R2520-1, Vitreous States Laboratory, The Catholic University of America, Washington DC.
Matlack KS, WK Kot, and IL Pegg. 2000. Screening Tests on DuraMelter™ 10 with C-106/AY-102 Simulant in Support of DuraMelter™ 1000 Throughput Tests. VSL-00R2501-2, Rev. 0, Vitreous States Laboratory, The Catholic University of America, Washington D.C.
Matlack KS, WK Kot, F Perez-Cardenas, and IL Pegg. 2000. Tests on DuraMelter™ 10 with AZ-101 Simulant in Support of DuraMelter™ 1000 Throughput Tests. VSL-00R2501-1, Rev. 0, Vitreous States Laboratory, The Catholic University of America, Washington D.C.
Morrey EV, JM Tingey, and ML Elliott. 1996. Comparison of Simulants to Actual Neutralized Current Acid Waste: Process and Product Testing of Three NCAW Core Samples from Tanks 101-AZ and 102-AZ. PNNL-11025, Pacific Northwest National Laboratory, Richland, WA.
Rosencrance SW, WD King, and C Nash. 2000. Physical Characterization for Hanford Tank Waste Samples AN-102, AN-103, and AZ-102. WSRC-TR-2000-00352, Westinghouse Savannah River Company, Aiken, SC. (SCT-M0SRLE60-00-83-01A)
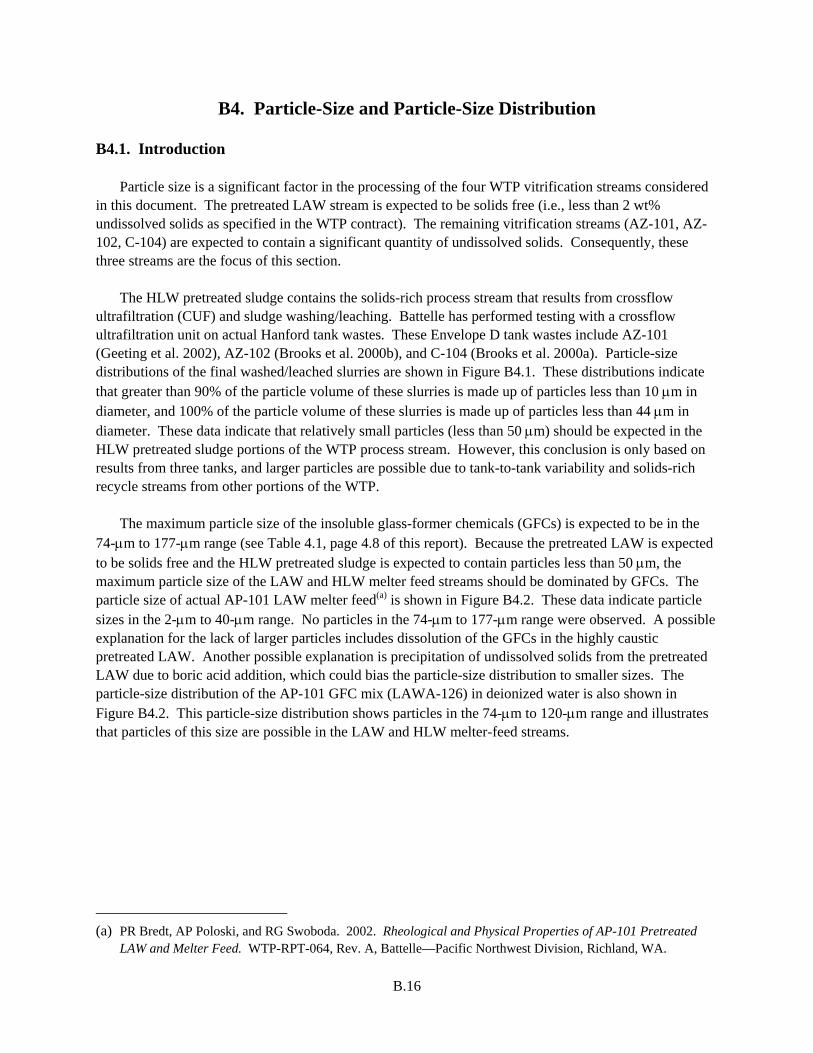
B.16
B4. Particle-Size and Particle-Size Distribution B4.1. Introduction
Particle size is a significant factor in the processing of the four WTP vitrification streams considered in this document. The pretreated LAW stream is expected to be solids free (i.e., less than 2 wt% undissolved solids as specified in the WTP contract). The remaining vitrification streams (AZ-101, AZ-102, C-104) are expected to contain a significant quantity of undissolved solids. Consequently, these three streams are the focus of this section.
The HLW pretreated sludge contains the solids-rich process stream that results from crossflow ultrafiltration (CUF) and sludge washing/leaching. Battelle has performed testing with a crossflow ultrafiltration unit on actual Hanford tank wastes. These Envelope D tank wastes include AZ-101 (Geeting et al. 2002), AZ-102 (Brooks et al. 2000b), and C-104 (Brooks et al. 2000a). Particle-size distributions of the final washed/leached slurries are shown in Figure B4.1. These distributions indicate that greater than 90% of the particle volume of these slurries is made up of particles less than 10 μm in diameter, and 100% of the particle volume of these slurries is made up of particles less than 44 μm in diameter. These data indicate that relatively small particles (less than 50 μm) should be expected in the HLW pretreated sludge portions of the WTP process stream. However, this conclusion is only based on results from three tanks, and larger particles are possible due to tank-to-tank variability and solids-rich recycle streams from other portions of the WTP.
The maximum particle size of the insoluble glass-former chemicals (GFCs) is expected to be in the 74-μm to 177-μm range (see Table 4.1, page 4.8 of this report). Because the pretreated LAW is expected to be solids free and the HLW pretreated sludge is expected to contain particles less than 50 μm, the maximum particle size of the LAW and HLW melter feed streams should be dominated by GFCs. The particle size of actual AP-101 LAW melter feed(a) is shown in Figure B4.2. These data indicate particle sizes in the 2-μm to 40-μm range. No particles in the 74-μm to 177-μm range were observed. A possible explanation for the lack of larger particles includes dissolution of the GFCs in the highly caustic pretreated LAW. Another possible explanation is precipitation of undissolved solids from the pretreated LAW due to boric acid addition, which could bias the particle-size distribution to smaller sizes. The particle-size distribution of the AP-101 GFC mix (LAWA-126) in deionized water is also shown in Figure B4.2. This particle-size distribution shows particles in the 74-μm to 120-μm range and illustrates that particles of this size are possible in the LAW and HLW melter-feed streams.
(a) PR Bredt, AP Poloski, and RG Swoboda. 2002. Rheological and Physical Properties of AP-101 Pretreated
LAW and Melter Feed. WTP-RPT-064, Rev. A, Battelle—Pacific Northwest Division, Richland, WA.
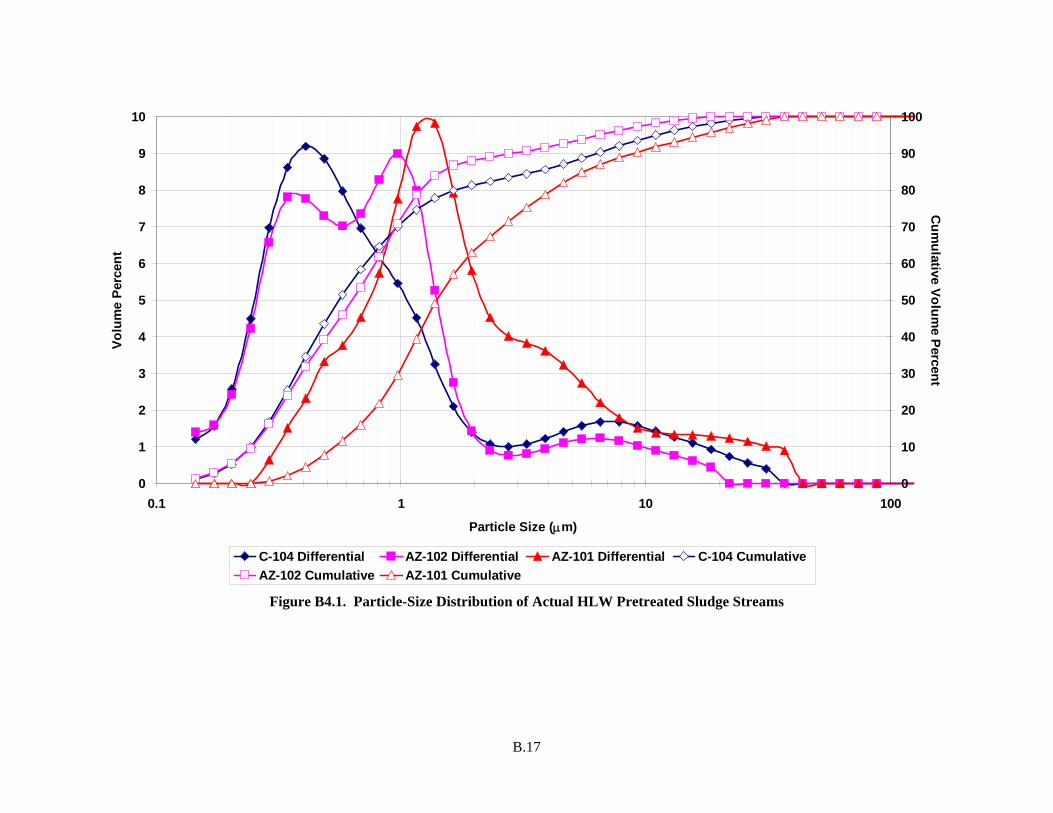
B.17
0
1
2
3
4
5
6
7
8
9
10
0.1 1 10 100
Particle Size (μm)
Volu
me
Perc
ent
0
10
20
30
40
50
60
70
80
90
100C
umulative Volum
e Percent
C-104 Differential AZ-102 Differential AZ-101 Differential C-104 CumulativeAZ-102 Cumulative AZ-101 Cumulative
Figure B4.1. Particle-Size Distribution of Actual HLW Pretreated Sludge Streams
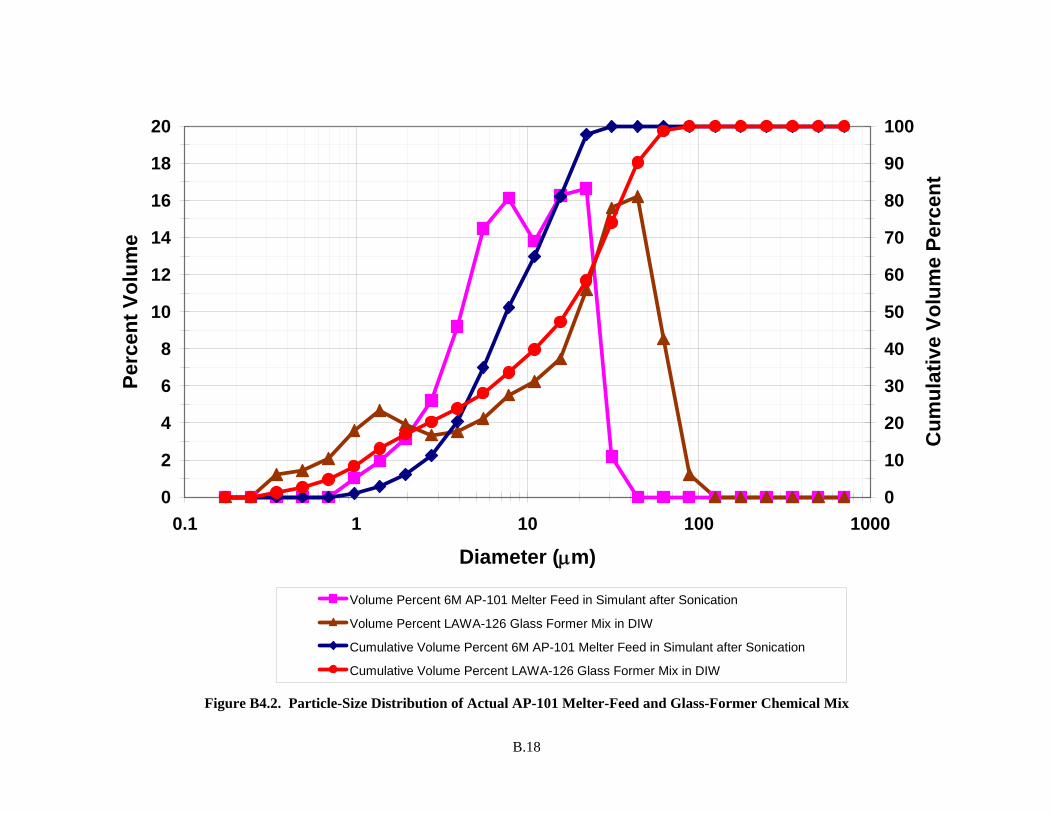
B.18
0
2
4
6
8
10
12
14
16
18
20
0.1 1 10 100 1000
Diameter (μm)
Perc
ent V
olum
e
0
10
20
30
40
50
60
70
80
90
100
Cum
ulat
ive
Volu
me
Perc
ent
Volume Percent 6M AP-101 Melter Feed in Simulant after Sonication
Volume Percent LAWA-126 Glass Former Mix in DIW
Cumulative Volume Percent 6M AP-101 Melter Feed in Simulant after Sonication
Cumulative Volume Percent LAWA-126 Glass Former Mix in DIW
Figure B4.2. Particle-Size Distribution of Actual AP-101 Melter-Feed and Glass-Former Chemical Mix
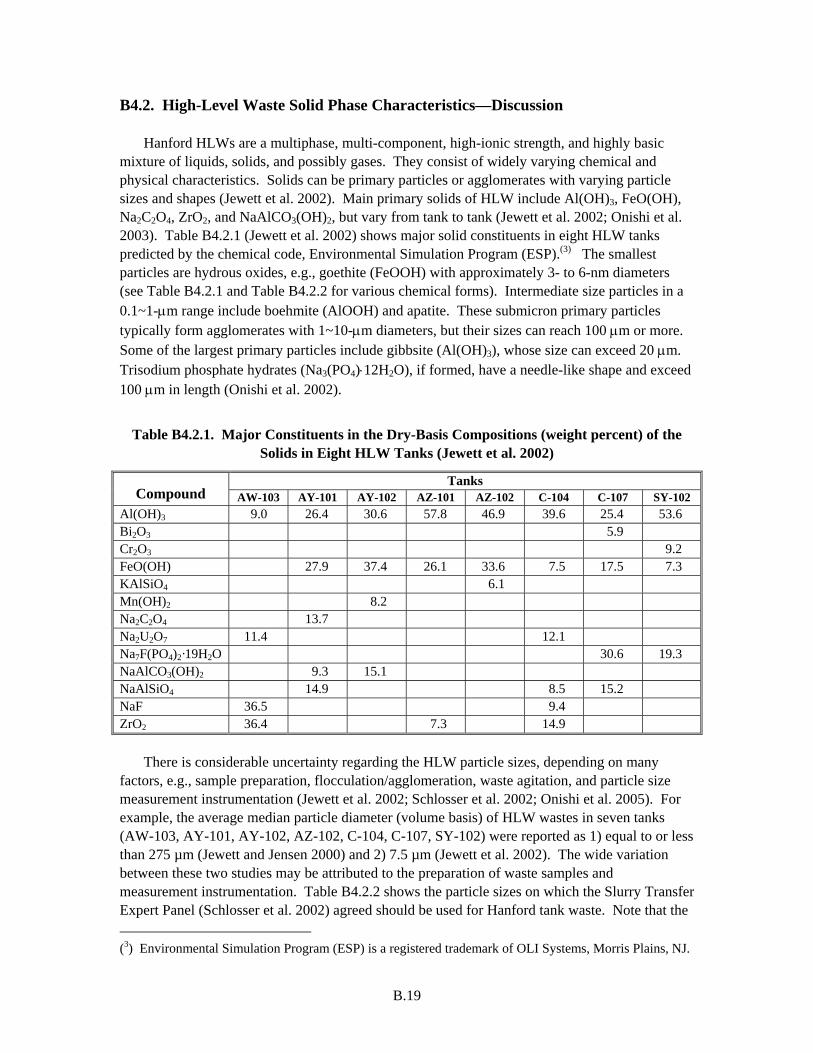
B.19
B4.2. High-Level Waste Solid Phase Characteristics—Discussion
Hanford HLWs are a multiphase, multi-component, high-ionic strength, and highly basic mixture of liquids, solids, and possibly gases. They consist of widely varying chemical and physical characteristics. Solids can be primary particles or agglomerates with varying particle sizes and shapes (Jewett et al. 2002). Main primary solids of HLW include Al(OH)3, FeO(OH), Na2C2O4, ZrO2, and NaAlCO3(OH)2, but vary from tank to tank (Jewett et al. 2002; Onishi et al. 2003). Table B4.2.1 (Jewett et al. 2002) shows major solid constituents in eight HLW tanks predicted by the chemical code, Environmental Simulation Program (ESP).(3) The smallest particles are hydrous oxides, e.g., goethite (FeOOH) with approximately 3- to 6-nm diameters (see Table B4.2.1 and Table B4.2.2 for various chemical forms). Intermediate size particles in a 0.1~1-μm range include boehmite (AlOOH) and apatite. These submicron primary particles typically form agglomerates with 1~10-μm diameters, but their sizes can reach 100 μm or more. Some of the largest primary particles include gibbsite (Al(OH)3), whose size can exceed 20 μm. Trisodium phosphate hydrates (Na3(PO4)⋅12H2O), if formed, have a needle-like shape and exceed 100 μm in length (Onishi et al. 2002).
Table B4.2.1. Major Constituents in the Dry-Basis Compositions (weight percent) of the Solids in Eight HLW Tanks (Jewett et al. 2002)
Tanks Compound AW-103 AY-101 AY-102 AZ-101 AZ-102 C-104 C-107 SY-102
Al(OH)3 9.0 26.4 30.6 57.8 46.9 39.6 25.4 53.6 Bi2O3 5.9 Cr2O3 9.2 FeO(OH) 27.9 37.4 26.1 33.6 7.5 17.5 7.3 KAlSiO4 6.1 Mn(OH)2 8.2 Na2C2O4 13.7 Na2U2O7 11.4 12.1 Na7F(PO4)2·19H2O 30.6 19.3 NaAlCO3(OH)2 9.3 15.1 NaAlSiO4 14.9 8.5 15.2 NaF 36.5 9.4 ZrO2 36.4 7.3 14.9
There is considerable uncertainty regarding the HLW particle sizes, depending on many factors, e.g., sample preparation, flocculation/agglomeration, waste agitation, and particle size measurement instrumentation (Jewett et al. 2002; Schlosser et al. 2002; Onishi et al. 2005). For example, the average median particle diameter (volume basis) of HLW wastes in seven tanks (AW-103, AY-101, AY-102, AZ-102, C-104, C-107, SY-102) were reported as 1) equal to or less than 275 µm (Jewett and Jensen 2000) and 2) 7.5 µm (Jewett et al. 2002). The wide variation between these two studies may be attributed to the preparation of waste samples and measurement instrumentation. Table B4.2.2 shows the particle sizes on which the Slurry Transfer Expert Panel (Schlosser et al. 2002) agreed should be used for Hanford tank waste. Note that the (3) Environmental Simulation Program (ESP) is a registered trademark of OLI Systems, Morris Plains, NJ.
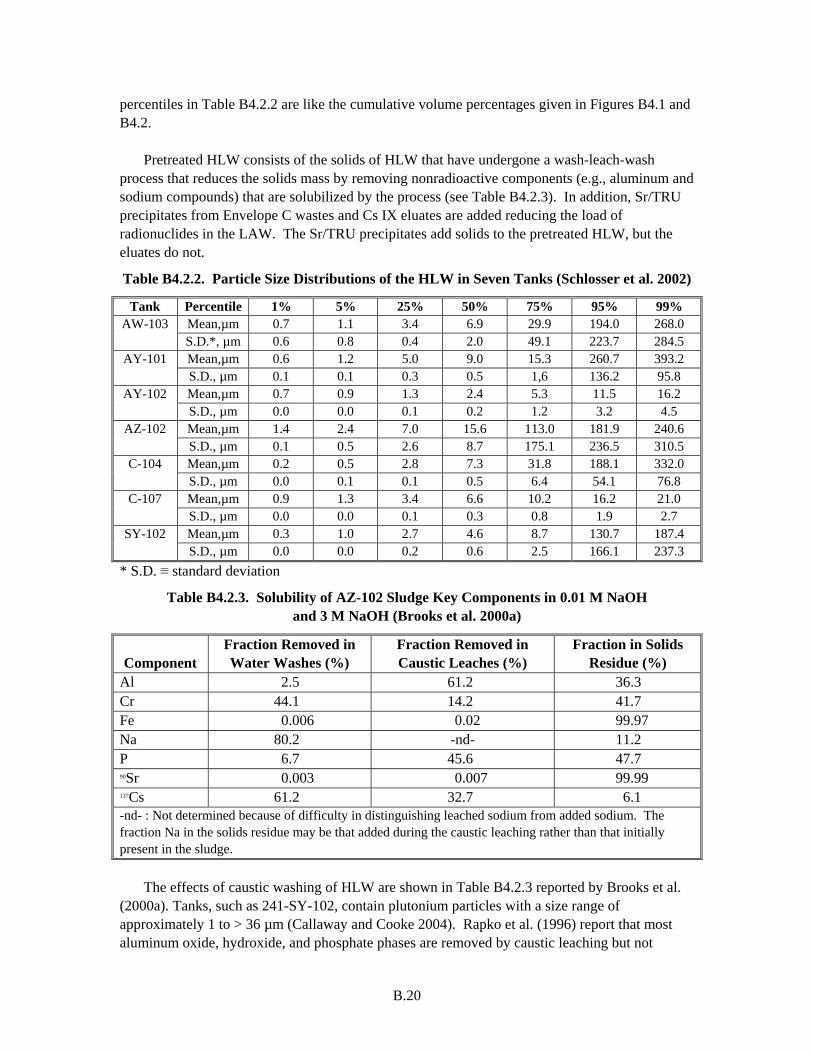
B.20
percentiles in Table B4.2.2 are like the cumulative volume percentages given in Figures B4.1 and B4.2.
Pretreated HLW consists of the solids of HLW that have undergone a wash-leach-wash process that reduces the solids mass by removing nonradioactive components (e.g., aluminum and sodium compounds) that are solubilized by the process (see Table B4.2.3). In addition, Sr/TRU precipitates from Envelope C wastes and Cs IX eluates are added reducing the load of radionuclides in the LAW. The Sr/TRU precipitates add solids to the pretreated HLW, but the eluates do not.
Table B4.2.2. Particle Size Distributions of the HLW in Seven Tanks (Schlosser et al. 2002)
Tank Percentile 1% 5% 25% 50% 75% 95% 99% Mean,µm 0.7 1.1 3.4 6.9 29.9 194.0 268.0 AW-103 S.D.*, µm 0.6 0.8 0.4 2.0 49.1 223.7 284.5 Mean,µm 0.6 1.2 5.0 9.0 15.3 260.7 393.2 AY-101 S.D., µm 0.1 0.1 0.3 0.5 1,6 136.2 95.8 Mean,µm 0.7 0.9 1.3 2.4 5.3 11.5 16.2 AY-102 S.D., µm 0.0 0.0 0.1 0.2 1.2 3.2 4.5 Mean,µm 1.4 2.4 7.0 15.6 113.0 181.9 240.6 AZ-102 S.D., µm 0.1 0.5 2.6 8.7 175.1 236.5 310.5 Mean,µm 0.2 0.5 2.8 7.3 31.8 188.1 332.0 C-104 S.D., µm 0.0 0.1 0.1 0.5 6.4 54.1 76.8 Mean,µm 0.9 1.3 3.4 6.6 10.2 16.2 21.0 C-107 S.D., µm 0.0 0.0 0.1 0.3 0.8 1.9 2.7 Mean,µm 0.3 1.0 2.7 4.6 8.7 130.7 187.4 SY-102 S.D., µm 0.0 0.0 0.2 0.6 2.5 166.1 237.3
* S.D. ≡ standard deviation
Table B4.2.3. Solubility of AZ-102 Sludge Key Components in 0.01 M NaOH and 3 M NaOH (Brooks et al. 2000a)
Component Fraction Removed in Water Washes (%)
Fraction Removed in Caustic Leaches (%)
Fraction in Solids Residue (%)
Al 2.5 61.2 36.3 Cr 44.1 14.2 41.7 Fe 0.006 0.02 99.97 Na 80.2 -nd- 11.2 P 6.7 45.6 47.7 90Sr 0.003 0.007 99.99 137Cs 61.2 32.7 6.1 -nd- : Not determined because of difficulty in distinguishing leached sodium from added sodium. The fraction Na in the solids residue may be that added during the caustic leaching rather than that initially present in the sludge.
The effects of caustic washing of HLW are shown in Table B4.2.3 reported by Brooks et al. (2000a). Tanks, such as 241-SY-102, contain plutonium particles with a size range of approximately 1 to > 36 µm (Callaway and Cooke 2004). Rapko et al. (1996) report that most aluminum oxide, hydroxide, and phosphate phases are removed by caustic leaching but not
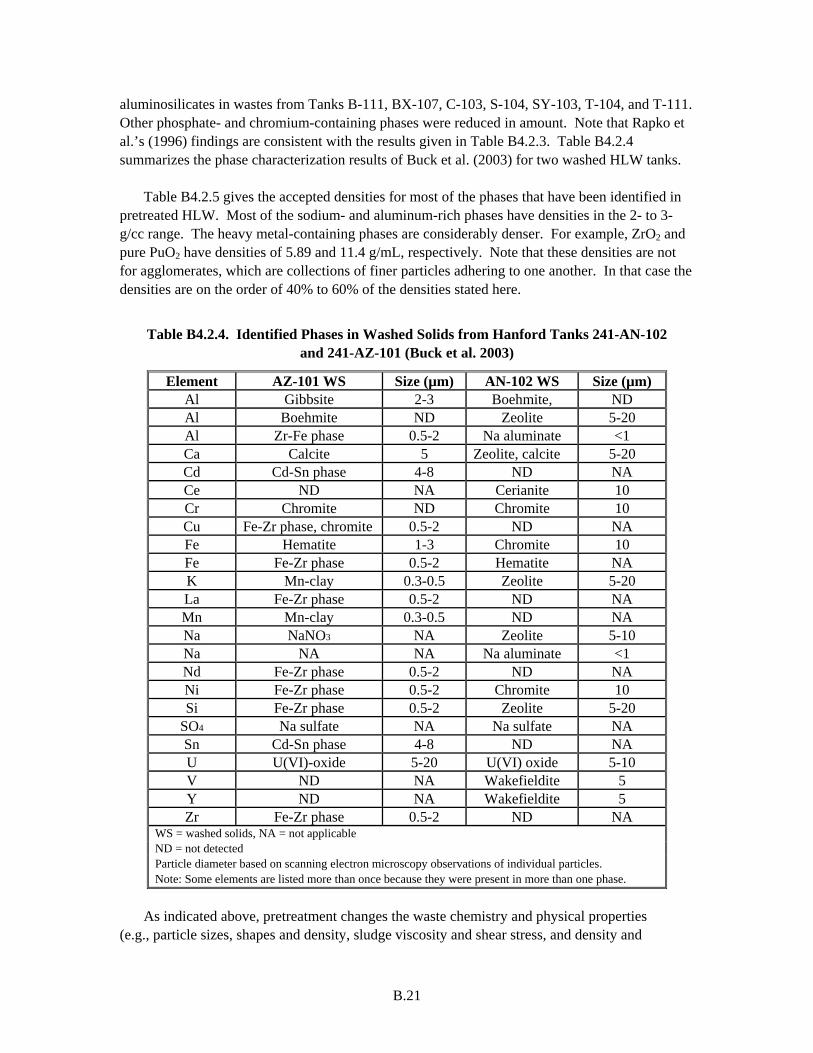
B.21
aluminosilicates in wastes from Tanks B-111, BX-107, C-103, S-104, SY-103, T-104, and T-111. Other phosphate- and chromium-containing phases were reduced in amount. Note that Rapko et al.’s (1996) findings are consistent with the results given in Table B4.2.3. Table B4.2.4 summarizes the phase characterization results of Buck et al. (2003) for two washed HLW tanks.
Table B4.2.5 gives the accepted densities for most of the phases that have been identified in pretreated HLW. Most of the sodium- and aluminum-rich phases have densities in the 2- to 3-g/cc range. The heavy metal-containing phases are considerably denser. For example, ZrO2 and pure PuO2 have densities of 5.89 and 11.4 g/mL, respectively. Note that these densities are not for agglomerates, which are collections of finer particles adhering to one another. In that case the densities are on the order of 40% to 60% of the densities stated here.
Table B4.2.4. Identified Phases in Washed Solids from Hanford Tanks 241-AN-102 and 241-AZ-101 (Buck et al. 2003)
Element AZ-101 WS Size (µm) AN-102 WS Size (µm) Al Gibbsite 2-3 Boehmite, ND Al Boehmite ND Zeolite 5-20 Al Zr-Fe phase 0.5-2 Na aluminate <1 Ca Calcite 5 Zeolite, calcite 5-20 Cd Cd-Sn phase 4-8 ND NA Ce ND NA Cerianite 10 Cr Chromite ND Chromite 10 Cu Fe-Zr phase, chromite 0.5-2 ND NA Fe Hematite 1-3 Chromite 10 Fe Fe-Zr phase 0.5-2 Hematite NA K Mn-clay 0.3-0.5 Zeolite 5-20 La Fe-Zr phase 0.5-2 ND NA Mn Mn-clay 0.3-0.5 ND NA Na NaNO3 NA Zeolite 5-10 Na NA NA Na aluminate <1 Nd Fe-Zr phase 0.5-2 ND NA Ni Fe-Zr phase 0.5-2 Chromite 10 Si Fe-Zr phase 0.5-2 Zeolite 5-20
SO4 Na sulfate NA Na sulfate NA Sn Cd-Sn phase 4-8 ND NA U U(VI)-oxide 5-20 U(VI) oxide 5-10 V ND NA Wakefieldite 5 Y ND NA Wakefieldite 5 Zr Fe-Zr phase 0.5-2 ND NA
WS = washed solids, NA = not applicable ND = not detected Particle diameter based on scanning electron microscopy observations of individual particles. Note: Some elements are listed more than once because they were present in more than one phase.
As indicated above, pretreatment changes the waste chemistry and physical properties
(e.g., particle sizes, shapes and density, sludge viscosity and shear stress, and density and
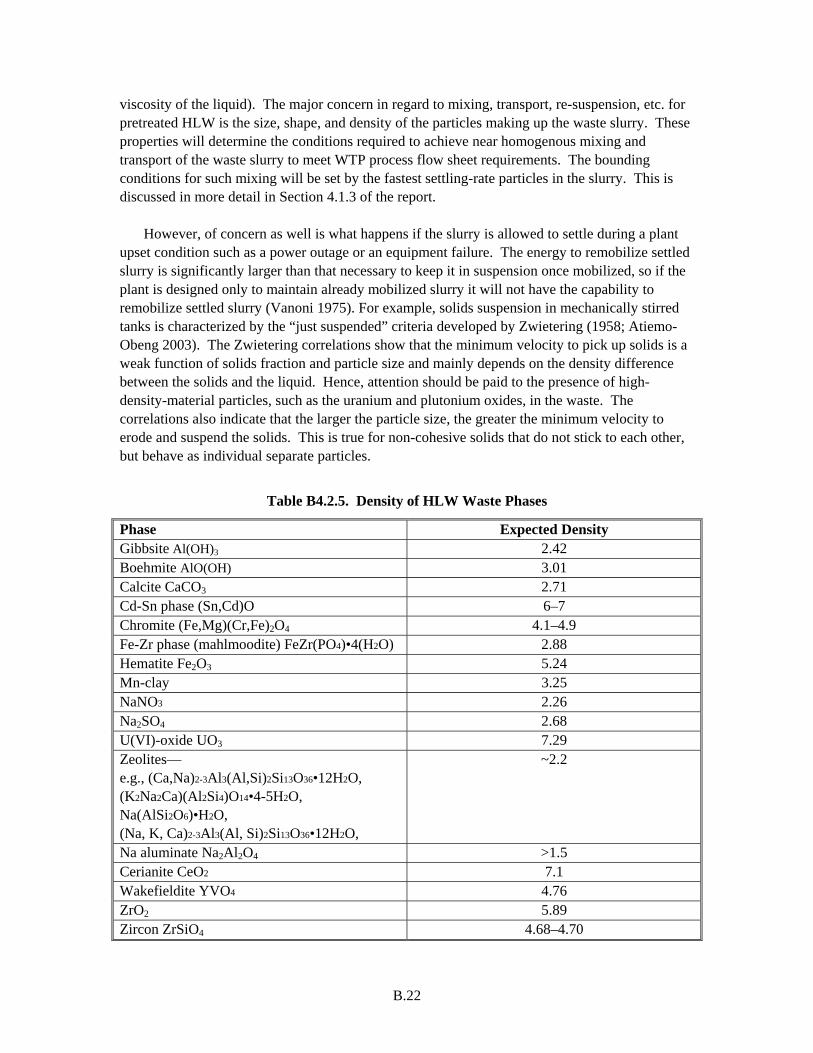
B.22
viscosity of the liquid). The major concern in regard to mixing, transport, re-suspension, etc. for pretreated HLW is the size, shape, and density of the particles making up the waste slurry. These properties will determine the conditions required to achieve near homogenous mixing and transport of the waste slurry to meet WTP process flow sheet requirements. The bounding conditions for such mixing will be set by the fastest settling-rate particles in the slurry. This is discussed in more detail in Section 4.1.3 of the report.
However, of concern as well is what happens if the slurry is allowed to settle during a plant
upset condition such as a power outage or an equipment failure. The energy to remobilize settled slurry is significantly larger than that necessary to keep it in suspension once mobilized, so if the plant is designed only to maintain already mobilized slurry it will not have the capability to remobilize settled slurry (Vanoni 1975). For example, solids suspension in mechanically stirred tanks is characterized by the “just suspended” criteria developed by Zwietering (1958; Atiemo-Obeng 2003). The Zwietering correlations show that the minimum velocity to pick up solids is a weak function of solids fraction and particle size and mainly depends on the density difference between the solids and the liquid. Hence, attention should be paid to the presence of high-density-material particles, such as the uranium and plutonium oxides, in the waste. The correlations also indicate that the larger the particle size, the greater the minimum velocity to erode and suspend the solids. This is true for non-cohesive solids that do not stick to each other, but behave as individual separate particles.
Table B4.2.5. Density of HLW Waste Phases
Phase Expected Density Gibbsite Al(OH)3 2.42 Boehmite AlO(OH) 3.01 Calcite CaCO3 2.71 Cd-Sn phase (Sn,Cd)O 6–7 Chromite (Fe,Mg)(Cr,Fe)2O4 4.1–4.9 Fe-Zr phase (mahlmoodite) FeZr(PO4)•4(H2O) 2.88 Hematite Fe2O3 5.24 Mn-clay 3.25 NaNO3 2.26 Na2SO4 2.68 U(VI)-oxide UO3 7.29 Zeolites— e.g., (Ca,Na)2-3Al3(Al,Si)2Si13O36•12H2O, (K2Na2Ca)(Al2Si4)O14•4-5H2O, Na(AlSi2O6)•H2O, (Na, K, Ca)2-3Al3(Al, Si)2Si13O36•12H2O,
~2.2
Na aluminate Na2Al2O4 >1.5 Cerianite CeO2 7.1 Wakefieldite YVO4 4.76 ZrO2 5.89 Zircon ZrSiO4 4.68–4.70
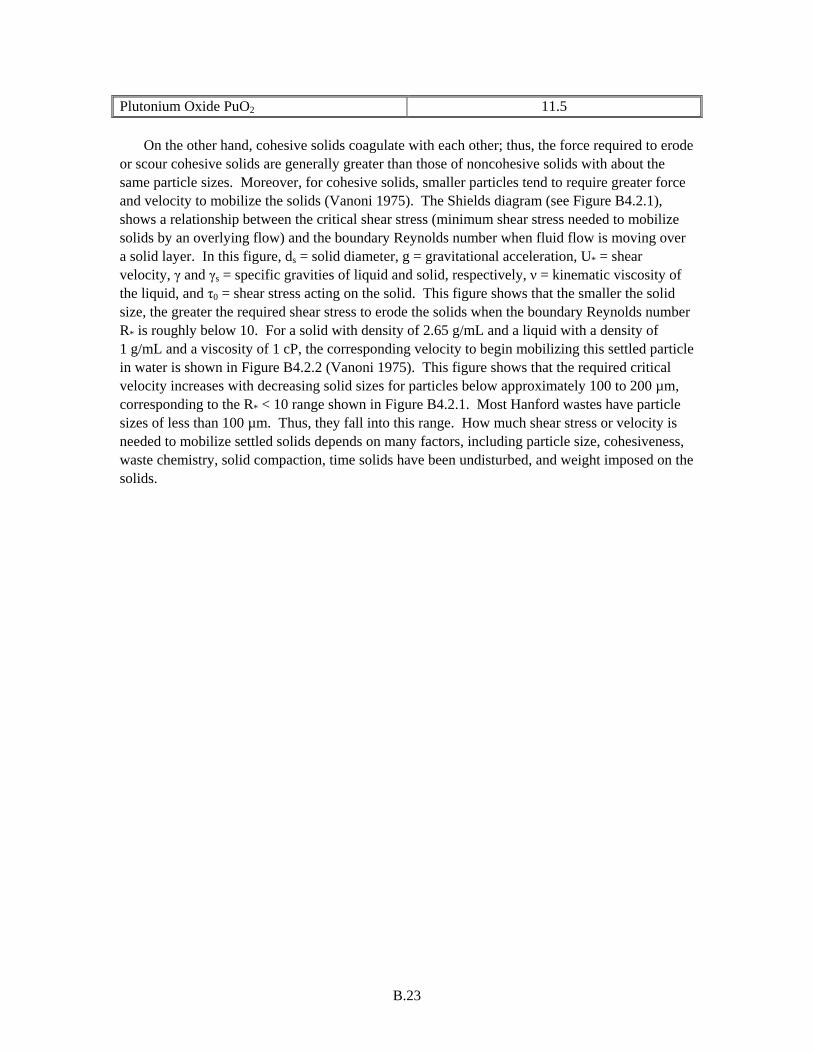
B.23
Plutonium Oxide PuO2 11.5
On the other hand, cohesive solids coagulate with each other; thus, the force required to erode or scour cohesive solids are generally greater than those of noncohesive solids with about the same particle sizes. Moreover, for cohesive solids, smaller particles tend to require greater force and velocity to mobilize the solids (Vanoni 1975). The Shields diagram (see Figure B4.2.1), shows a relationship between the critical shear stress (minimum shear stress needed to mobilize solids by an overlying flow) and the boundary Reynolds number when fluid flow is moving over a solid layer. In this figure, ds = solid diameter, g = gravitational acceleration, U* = shear velocity, γ and γs = specific gravities of liquid and solid, respectively, ν = kinematic viscosity of the liquid, and τ0 = shear stress acting on the solid. This figure shows that the smaller the solid size, the greater the required shear stress to erode the solids when the boundary Reynolds number R* is roughly below 10. For a solid with density of 2.65 g/mL and a liquid with a density of 1 g/mL and a viscosity of 1 cP, the corresponding velocity to begin mobilizing this settled particle in water is shown in Figure B4.2.2 (Vanoni 1975). This figure shows that the required critical velocity increases with decreasing solid sizes for particles below approximately 100 to 200 µm, corresponding to the R* < 10 range shown in Figure B4.2.1. Most Hanford wastes have particle sizes of less than 100 µm. Thus, they fall into this range. How much shear stress or velocity is needed to mobilize settled solids depends on many factors, including particle size, cohesiveness, waste chemistry, solid compaction, time solids have been undisturbed, and weight imposed on the solids.
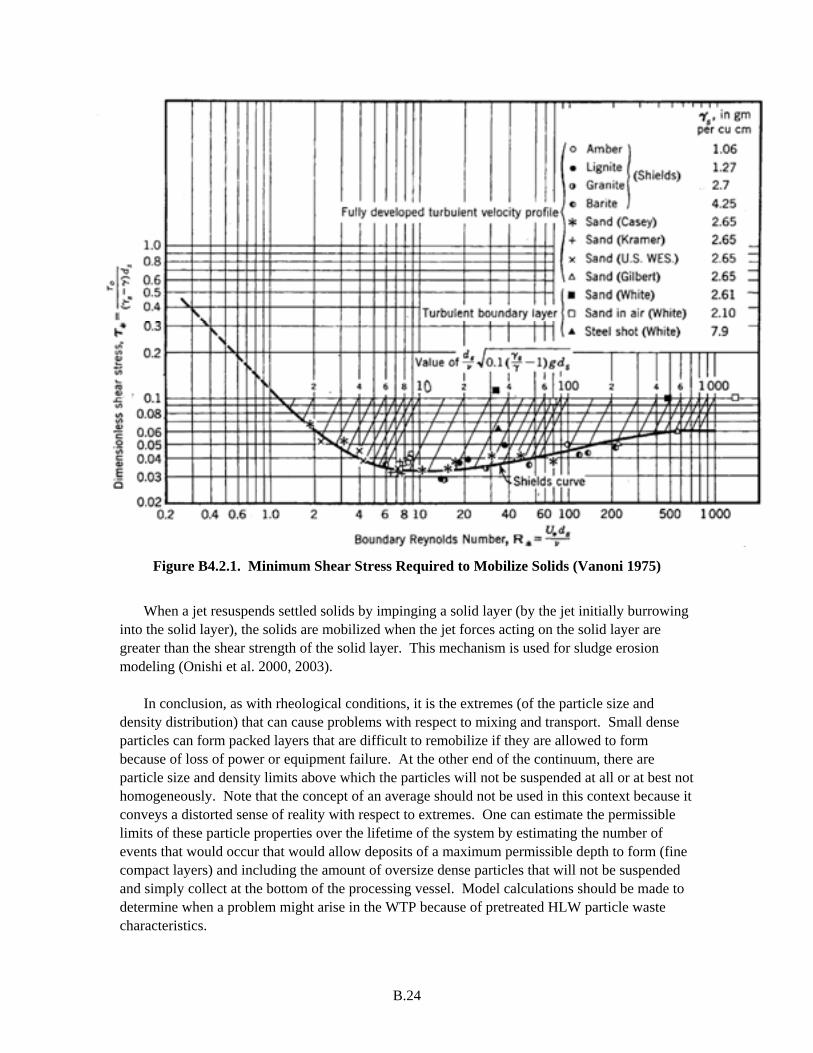
B.24
Figure B4.2.1. Minimum Shear Stress Required to Mobilize Solids (Vanoni 1975)
When a jet resuspends settled solids by impinging a solid layer (by the jet initially burrowing
into the solid layer), the solids are mobilized when the jet forces acting on the solid layer are greater than the shear strength of the solid layer. This mechanism is used for sludge erosion modeling (Onishi et al. 2000, 2003).
In conclusion, as with rheological conditions, it is the extremes (of the particle size and density distribution) that can cause problems with respect to mixing and transport. Small dense particles can form packed layers that are difficult to remobilize if they are allowed to form because of loss of power or equipment failure. At the other end of the continuum, there are particle size and density limits above which the particles will not be suspended at all or at best not homogeneously. Note that the concept of an average should not be used in this context because it conveys a distorted sense of reality with respect to extremes. One can estimate the permissible limits of these particle properties over the lifetime of the system by estimating the number of events that would occur that would allow deposits of a maximum permissible depth to form (fine compact layers) and including the amount of oversize dense particles that will not be suspended and simply collect at the bottom of the processing vessel. Model calculations should be made to determine when a problem might arise in the WTP because of pretreated HLW particle waste characteristics.
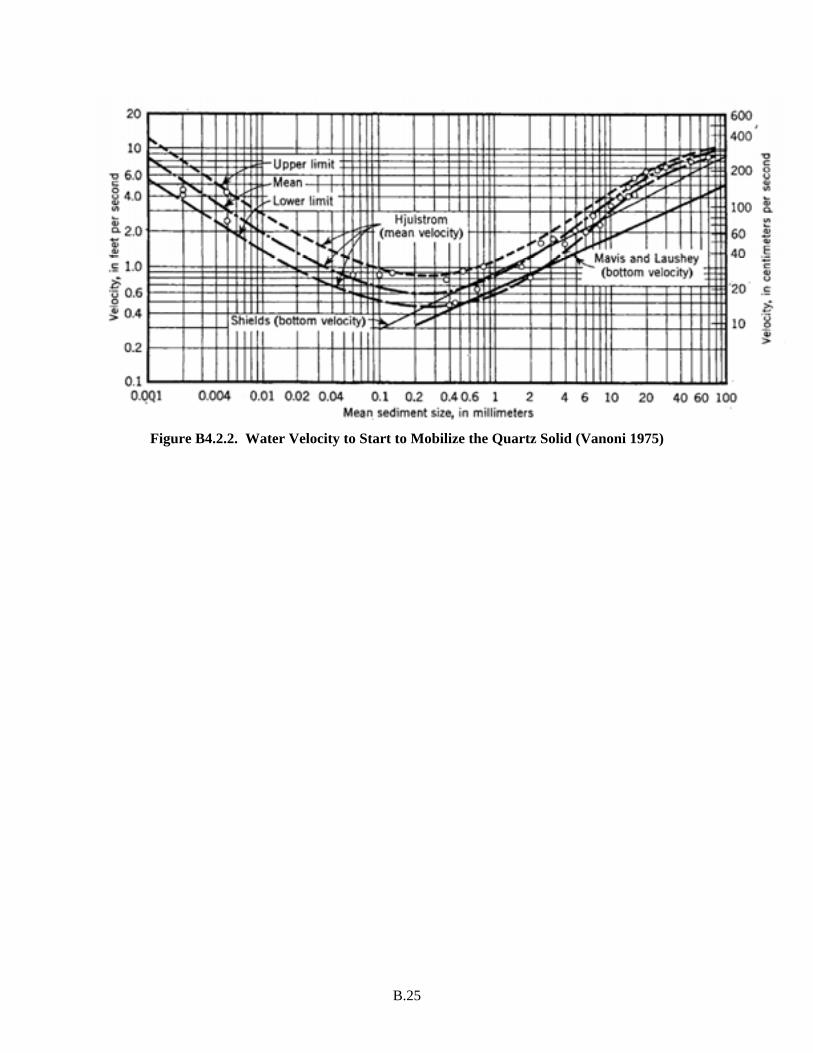
B.25
Figure B4.2.2. Water Velocity to Start to Mobilize the Quartz Solid (Vanoni 1975)
Appendix C
Expected HLW Behavior During Pretreatment
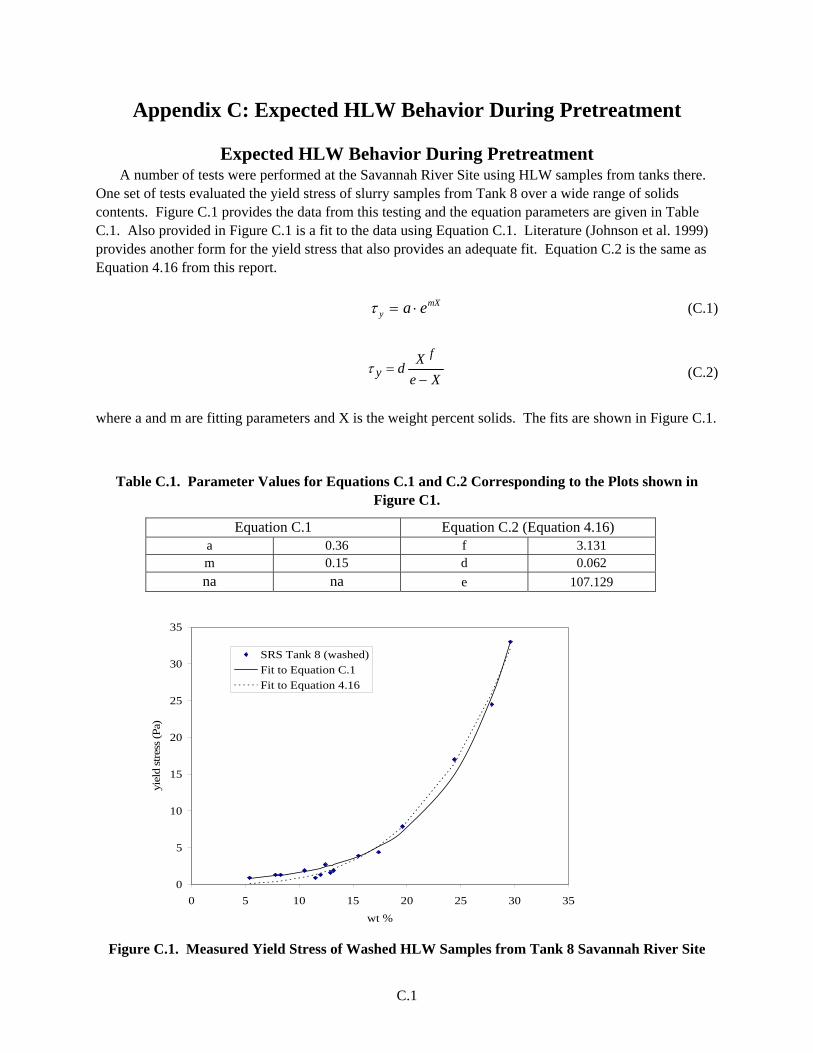
C.1
Appendix C: Expected HLW Behavior During Pretreatment
Expected HLW Behavior During Pretreatment A number of tests were performed at the Savannah River Site using HLW samples from tanks there.
One set of tests evaluated the yield stress of slurry samples from Tank 8 over a wide range of solids contents. Figure C.1 provides the data from this testing and the equation parameters are given in Table C.1. Also provided in Figure C.1 is a fit to the data using Equation C.1. Literature (Johnson et al. 1999) provides another form for the yield stress that also provides an adequate fit. Equation C.2 is the same as Equation 4.16 from this report. mX
y ea ⋅=τ (C.1)
XeXd
fy −
=τ
(C.2)
where a and m are fitting parameters and X is the weight percent solids. The fits are shown in Figure C.1.
Table C.1. Parameter Values for Equations C.1 and C.2 Corresponding to the Plots shown in Figure C1.
Equation C.1 Equation C.2 (Equation 4.16) a 0.36 f 3.131 m 0.15 d 0.062 na na e 107.129
0
5
10
15
20
25
30
35
0 5 10 15 20 25 30 35wt %
yiel
d st
ress
(Pa)
SRS Tank 8 (washed)Fit to Equation C.1Fit to Equation 4.16
Figure C.1. Measured Yield Stress of Washed HLW Samples from Tank 8 Savannah River Site
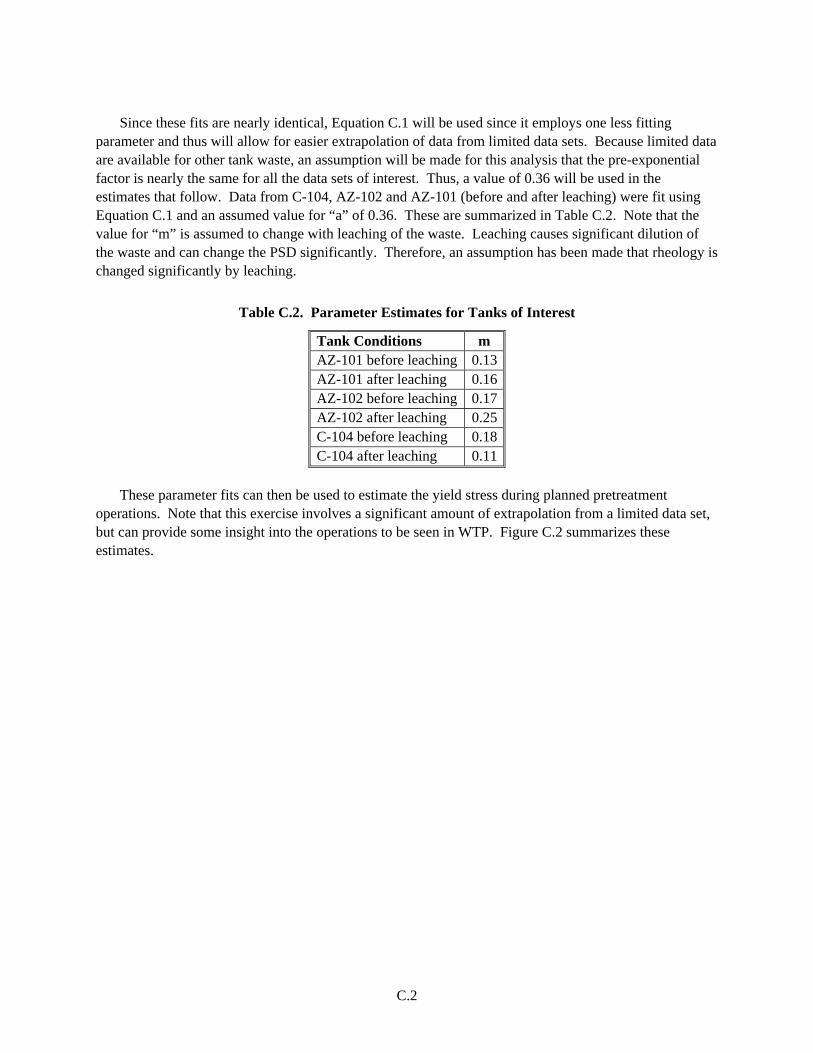
C.2
Since these fits are nearly identical, Equation C.1 will be used since it employs one less fitting
parameter and thus will allow for easier extrapolation of data from limited data sets. Because limited data are available for other tank waste, an assumption will be made for this analysis that the pre-exponential factor is nearly the same for all the data sets of interest. Thus, a value of 0.36 will be used in the estimates that follow. Data from C-104, AZ-102 and AZ-101 (before and after leaching) were fit using Equation C.1 and an assumed value for “a” of 0.36. These are summarized in Table C.2. Note that the value for “m” is assumed to change with leaching of the waste. Leaching causes significant dilution of the waste and can change the PSD significantly. Therefore, an assumption has been made that rheology is changed significantly by leaching.
Table C.2. Parameter Estimates for Tanks of Interest
Tank Conditions m AZ-101 before leaching 0.13AZ-101 after leaching 0.16AZ-102 before leaching 0.17AZ-102 after leaching 0.25C-104 before leaching 0.18C-104 after leaching 0.11
These parameter fits can then be used to estimate the yield stress during planned pretreatment
operations. Note that this exercise involves a significant amount of extrapolation from a limited data set, but can provide some insight into the operations to be seen in WTP. Figure C.2 summarizes these estimates.
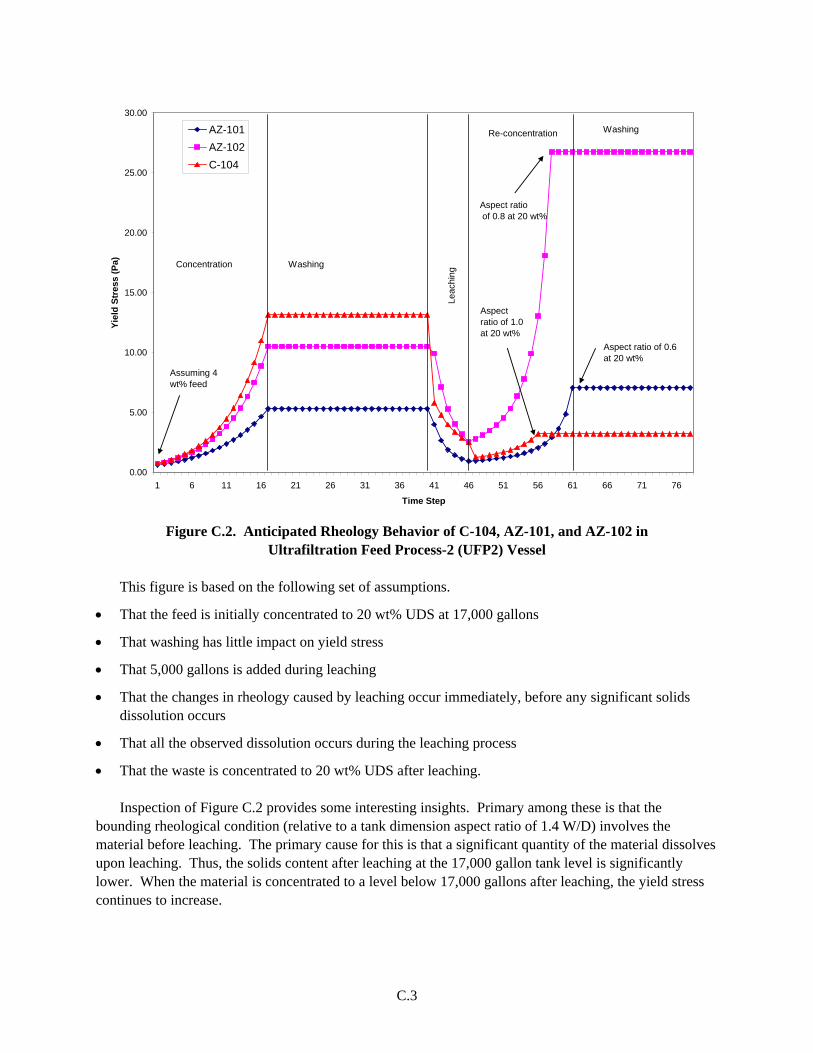
C.3
0.00
5.00
10.00
15.00
20.00
25.00
30.00
1 6 11 16 21 26 31 36 41 46 51 56 61 66 71 76
Time Step
Yiel
d St
ress
(Pa)
AZ-101AZ-102C-104
Aspect ratio of 0.8 at 20 wt%
Aspect ratio of 0.6at 20 wt%
Aspectratio of 1.0at 20 wt%
Concentration Washing
Leac
hing
Re-concentration Washing
Assuming 4 wt% feed
Figure C.2. Anticipated Rheology Behavior of C-104, AZ-101, and AZ-102 in
Ultrafiltration Feed Process-2 (UFP2) Vessel
This figure is based on the following set of assumptions.
• That the feed is initially concentrated to 20 wt% UDS at 17,000 gallons
• That washing has little impact on yield stress
• That 5,000 gallons is added during leaching
• That the changes in rheology caused by leaching occur immediately, before any significant solids dissolution occurs
• That all the observed dissolution occurs during the leaching process
• That the waste is concentrated to 20 wt% UDS after leaching.
Inspection of Figure C.2 provides some interesting insights. Primary among these is that the bounding rheological condition (relative to a tank dimension aspect ratio of 1.4 W/D) involves the material before leaching. The primary cause for this is that a significant quantity of the material dissolves upon leaching. Thus, the solids content after leaching at the 17,000 gallon tank level is significantly lower. When the material is concentrated to a level below 17,000 gallons after leaching, the yield stress continues to increase.
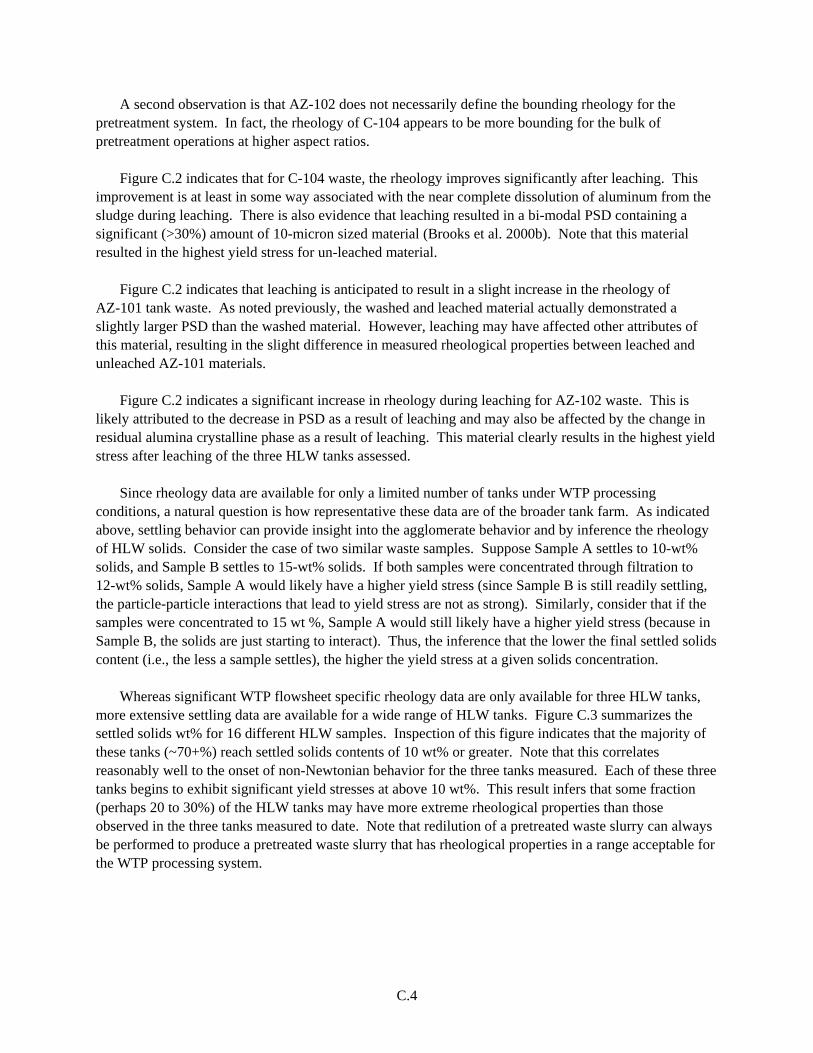
C.4
A second observation is that AZ-102 does not necessarily define the bounding rheology for the pretreatment system. In fact, the rheology of C-104 appears to be more bounding for the bulk of pretreatment operations at higher aspect ratios.
Figure C.2 indicates that for C-104 waste, the rheology improves significantly after leaching. This improvement is at least in some way associated with the near complete dissolution of aluminum from the sludge during leaching. There is also evidence that leaching resulted in a bi-modal PSD containing a significant (>30%) amount of 10-micron sized material (Brooks et al. 2000b). Note that this material resulted in the highest yield stress for un-leached material.
Figure C.2 indicates that leaching is anticipated to result in a slight increase in the rheology of AZ-101 tank waste. As noted previously, the washed and leached material actually demonstrated a slightly larger PSD than the washed material. However, leaching may have affected other attributes of this material, resulting in the slight difference in measured rheological properties between leached and unleached AZ-101 materials.
Figure C.2 indicates a significant increase in rheology during leaching for AZ-102 waste. This is likely attributed to the decrease in PSD as a result of leaching and may also be affected by the change in residual alumina crystalline phase as a result of leaching. This material clearly results in the highest yield stress after leaching of the three HLW tanks assessed.
Since rheology data are available for only a limited number of tanks under WTP processing conditions, a natural question is how representative these data are of the broader tank farm. As indicated above, settling behavior can provide insight into the agglomerate behavior and by inference the rheology of HLW solids. Consider the case of two similar waste samples. Suppose Sample A settles to 10-wt% solids, and Sample B settles to 15-wt% solids. If both samples were concentrated through filtration to 12-wt% solids, Sample A would likely have a higher yield stress (since Sample B is still readily settling, the particle-particle interactions that lead to yield stress are not as strong). Similarly, consider that if the samples were concentrated to 15 wt %, Sample A would still likely have a higher yield stress (because in Sample B, the solids are just starting to interact). Thus, the inference that the lower the final settled solids content (i.e., the less a sample settles), the higher the yield stress at a given solids concentration.
Whereas significant WTP flowsheet specific rheology data are only available for three HLW tanks, more extensive settling data are available for a wide range of HLW tanks. Figure C.3 summarizes the settled solids wt% for 16 different HLW samples. Inspection of this figure indicates that the majority of these tanks (~70+%) reach settled solids contents of 10 wt% or greater. Note that this correlates reasonably well to the onset of non-Newtonian behavior for the three tanks measured. Each of these three tanks begins to exhibit significant yield stresses at above 10 wt%. This result infers that some fraction (perhaps 20 to 30%) of the HLW tanks may have more extreme rheological properties than those observed in the three tanks measured to date. Note that redilution of a pretreated waste slurry can always be performed to produce a pretreated waste slurry that has rheological properties in a range acceptable for the WTP processing system.
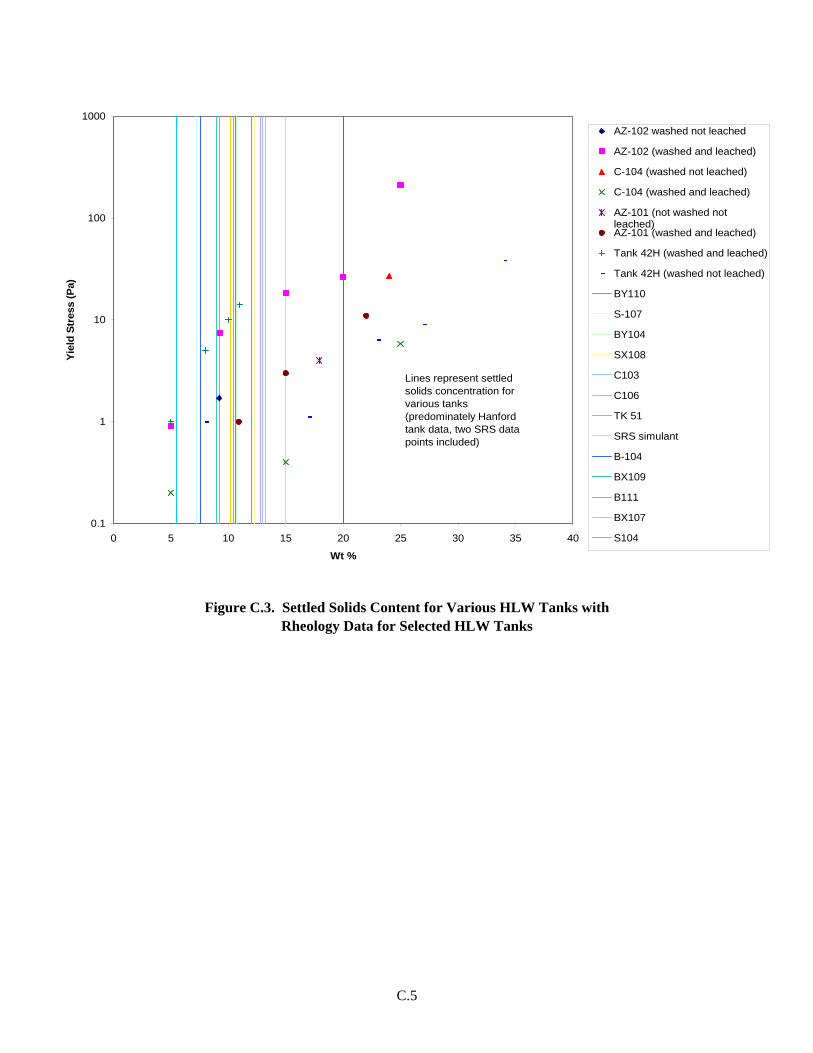
C.5
0.1
1
10
100
1000
0 5 10 15 20 25 30 35 40
Wt %
Yiel
d St
ress
(Pa)
AZ-102 washed not leached
AZ-102 (washed and leached)
C-104 (washed not leached)
C-104 (washed and leached)
AZ-101 (not washed notleached)AZ-101 (washed and leached)
Tank 42H (washed and leached)
Tank 42H (washed not leached)
BY110
S-107
BY104
SX108
C103
C106
TK 51
SRS simulant
B-104
BX109
B111
BX107
S104
Lines represent settled solids concentration for various tanks (predominately Hanford tank data, two SRS data points included)
Figure C.3. Settled Solids Content for Various HLW Tanks with Rheology Data for Selected HLW Tanks

Appendix D
Rheology Primer(a)
(a) Much of the information in this Appendix was derived from JF Steffe. 1996. Rheological Methods in Food
Process Engineering. 2nd Edition, Freeman Press. An online version of this book can be downloaded from http://www.egr.msu.edu/~steffe/freebook/offer.html.
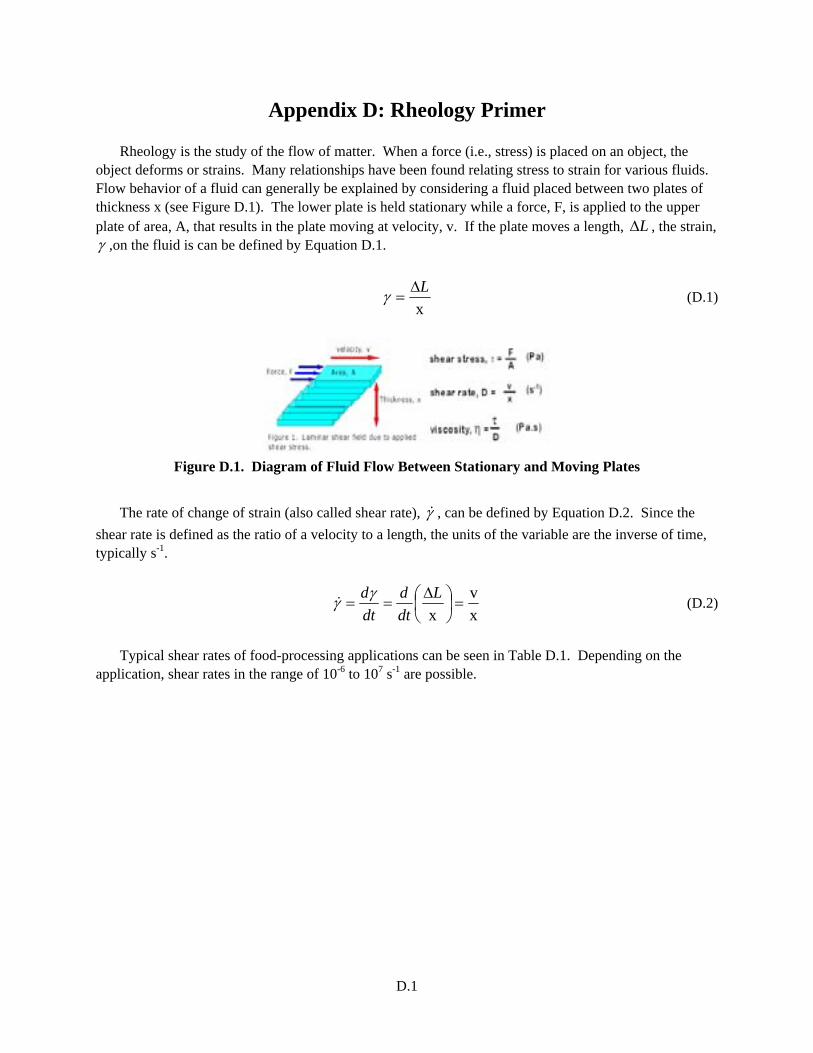
D.1
Appendix D: Rheology Primer
Rheology is the study of the flow of matter. When a force (i.e., stress) is placed on an object, the object deforms or strains. Many relationships have been found relating stress to strain for various fluids. Flow behavior of a fluid can generally be explained by considering a fluid placed between two plates of thickness x (see Figure D.1). The lower plate is held stationary while a force, F, is applied to the upper plate of area, A, that results in the plate moving at velocity, v. If the plate moves a length, LΔ , the strain, γ ,on the fluid is can be defined by Equation D.1.
xLΔ
=γ (D.1)
Figure D.1. Diagram of Fluid Flow Between Stationary and Moving Plates
The rate of change of strain (also called shear rate), γ& , can be defined by Equation D.2. Since the
shear rate is defined as the ratio of a velocity to a length, the units of the variable are the inverse of time, typically s-1.
xv
x=⎟
⎠⎞
⎜⎝⎛ Δ
==L
dtd
dtdγγ& (D.2)
Typical shear rates of food-processing applications can be seen in Table D.1. Depending on the
application, shear rates in the range of 10-6 to 107 s-1 are possible.
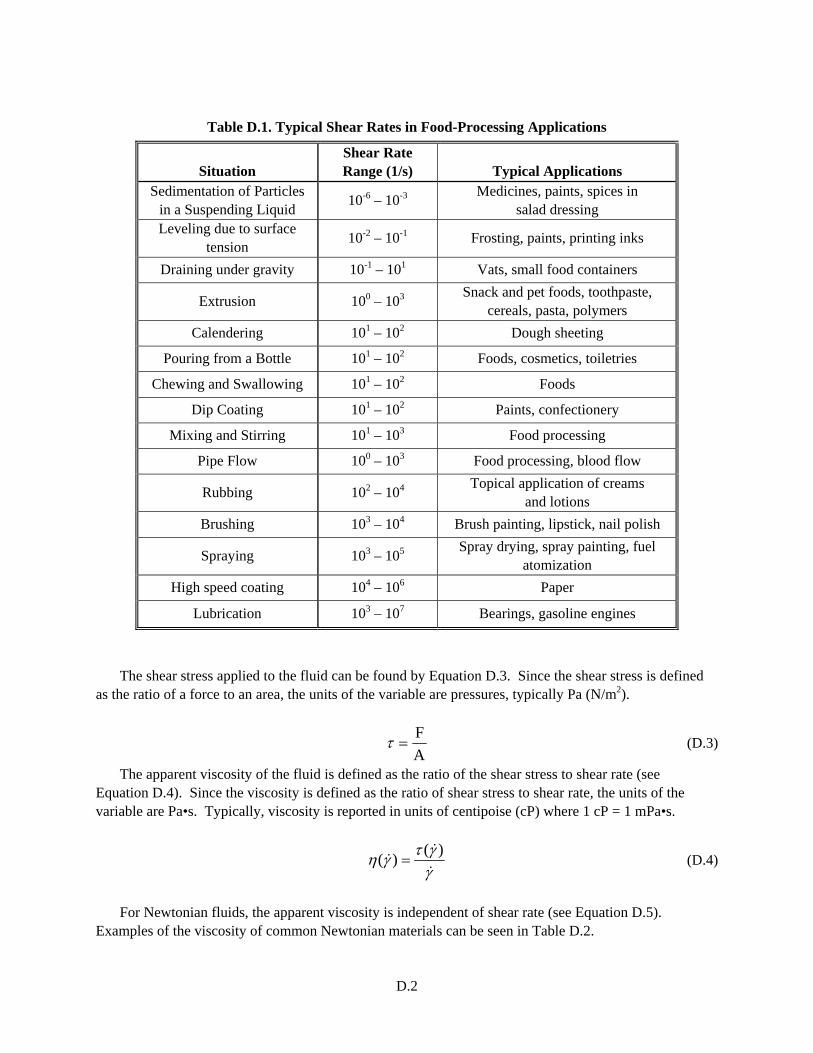
D.2
Table D.1. Typical Shear Rates in Food-Processing Applications
Situation Shear Rate Range (1/s) Typical Applications
Sedimentation of Particles in a Suspending Liquid 10-6 – 10-3 Medicines, paints, spices in
salad dressing Leveling due to surface
tension 10-2 – 10-1 Frosting, paints, printing inks
Draining under gravity 10-1 – 101 Vats, small food containers
Extrusion 100 – 103 Snack and pet foods, toothpaste, cereals, pasta, polymers
Calendering 101 – 102 Dough sheeting Pouring from a Bottle 101 – 102 Foods, cosmetics, toiletries
Chewing and Swallowing 101 – 102 Foods Dip Coating 101 – 102 Paints, confectionery
Mixing and Stirring 101 – 103 Food processing Pipe Flow 100 – 103 Food processing, blood flow
Rubbing 102 – 104 Topical application of creams and lotions
Brushing 103 – 104 Brush painting, lipstick, nail polish
Spraying 103 – 105 Spray drying, spray painting, fuel atomization
High speed coating 104 – 106 Paper Lubrication 103 – 107 Bearings, gasoline engines
The shear stress applied to the fluid can be found by Equation D.3. Since the shear stress is defined as the ratio of a force to an area, the units of the variable are pressures, typically Pa (N/m2).
AF
=τ (D.3)
The apparent viscosity of the fluid is defined as the ratio of the shear stress to shear rate (see Equation D.4). Since the viscosity is defined as the ratio of shear stress to shear rate, the units of the variable are Pa•s. Typically, viscosity is reported in units of centipoise (cP) where 1 cP = 1 mPa•s.
γγτγη&
&&
)()( = (D.4)
For Newtonian fluids, the apparent viscosity is independent of shear rate (see Equation D.5).
Examples of the viscosity of common Newtonian materials can be seen in Table D.2.
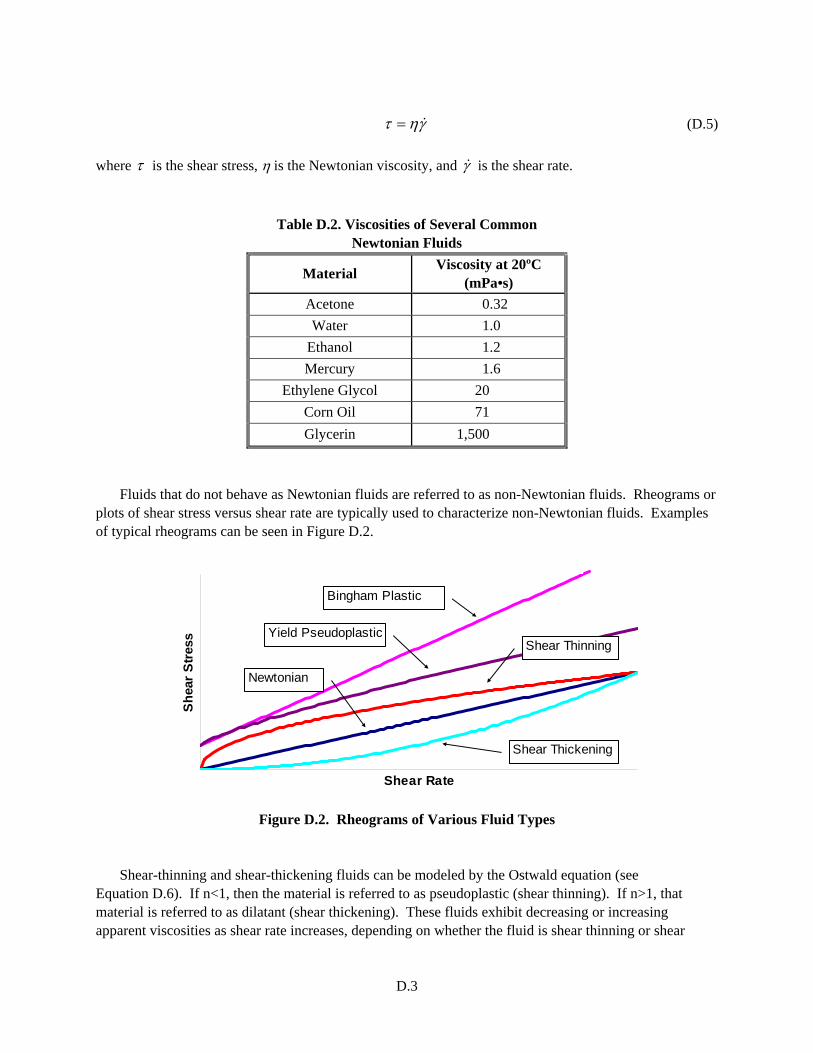
D.3
γητ &= (D.5) where τ is the shear stress, η is the Newtonian viscosity, and γ& is the shear rate.
Table D.2. Viscosities of Several Common Newtonian Fluids
Material Viscosity at 20ºC (mPa•s)
Acetone 0.32 Water 1.0
Ethanol 1.2 Mercury 1.6
Ethylene Glycol 20 Corn Oil 71 Glycerin 1,500
Fluids that do not behave as Newtonian fluids are referred to as non-Newtonian fluids. Rheograms or plots of shear stress versus shear rate are typically used to characterize non-Newtonian fluids. Examples of typical rheograms can be seen in Figure D.2.
Shear Rate
She
ar S
tres
s
Bingham Plastic
Yield Pseudoplastic
Newtonian
Shear Thinning
Shear Thickening
Figure D.2. Rheograms of Various Fluid Types
Shear-thinning and shear-thickening fluids can be modeled by the Ostwald equation (see Equation D.6). If n<1, then the material is referred to as pseudoplastic (shear thinning). If n>1, that material is referred to as dilatant (shear thickening). These fluids exhibit decreasing or increasing apparent viscosities as shear rate increases, depending on whether the fluid is shear thinning or shear
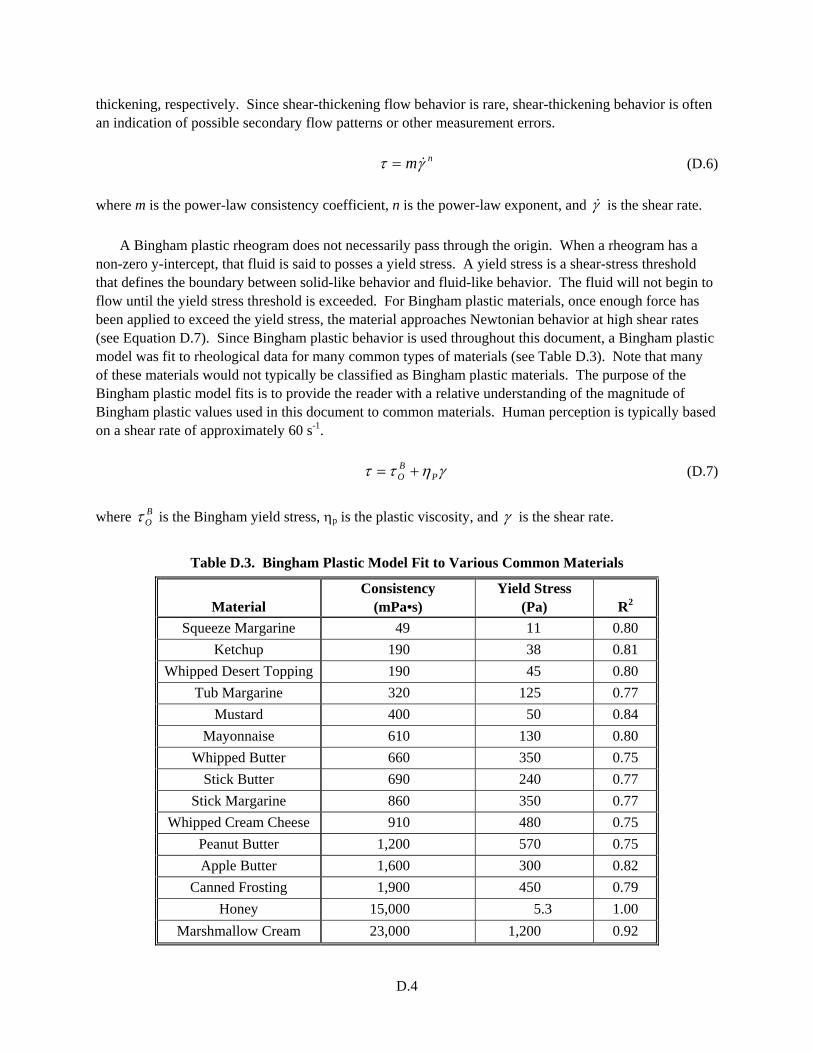
D.4
thickening, respectively. Since shear-thickening flow behavior is rare, shear-thickening behavior is often an indication of possible secondary flow patterns or other measurement errors. nmγτ &= (D.6) where m is the power-law consistency coefficient, n is the power-law exponent, and γ& is the shear rate.
A Bingham plastic rheogram does not necessarily pass through the origin. When a rheogram has a non-zero y-intercept, that fluid is said to posses a yield stress. A yield stress is a shear-stress threshold that defines the boundary between solid-like behavior and fluid-like behavior. The fluid will not begin to flow until the yield stress threshold is exceeded. For Bingham plastic materials, once enough force has been applied to exceed the yield stress, the material approaches Newtonian behavior at high shear rates (see Equation D.7). Since Bingham plastic behavior is used throughout this document, a Bingham plastic model was fit to rheological data for many common types of materials (see Table D.3). Note that many of these materials would not typically be classified as Bingham plastic materials. The purpose of the Bingham plastic model fits is to provide the reader with a relative understanding of the magnitude of Bingham plastic values used in this document to common materials. Human perception is typically based on a shear rate of approximately 60 s-1. γηττ P
BO += (D.7)
where B
Oτ is the Bingham yield stress, ηp is the plastic viscosity, and γ is the shear rate.
Table D.3. Bingham Plastic Model Fit to Various Common Materials
Material Consistency
(mPa•s) Yield Stress
(Pa) R2 Squeeze Margarine 49 11 0.80
Ketchup 190 38 0.81 Whipped Desert Topping 190 45 0.80
Tub Margarine 320 125 0.77 Mustard 400 50 0.84
Mayonnaise 610 130 0.80 Whipped Butter 660 350 0.75
Stick Butter 690 240 0.77 Stick Margarine 860 350 0.77
Whipped Cream Cheese 910 480 0.75 Peanut Butter 1,200 570 0.75 Apple Butter 1,600 300 0.82
Canned Frosting 1,900 450 0.79 Honey 15,000 5.3 1.00
Marshmallow Cream 23,000 1,200 0.92
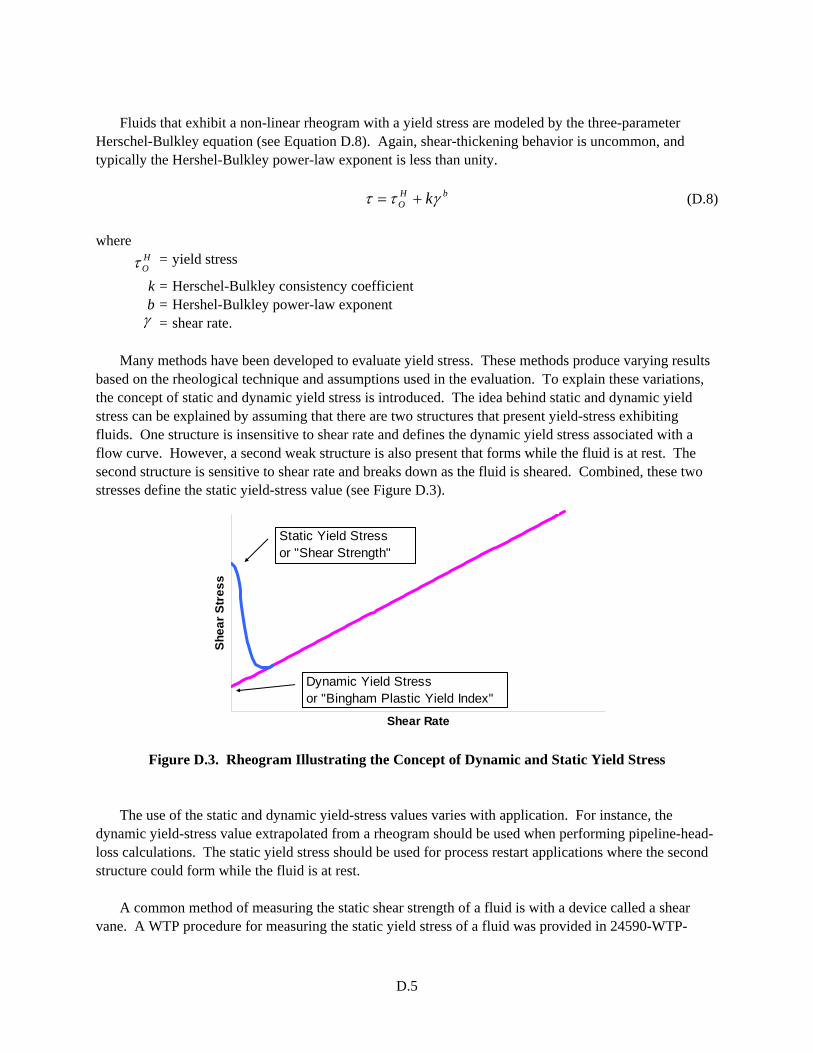
D.5
Fluids that exhibit a non-linear rheogram with a yield stress are modeled by the three-parameter
Herschel-Bulkley equation (see Equation D.8). Again, shear-thickening behavior is uncommon, and typically the Hershel-Bulkley power-law exponent is less than unity. bH
O kγττ += (D.8) where
HOτ = yield stress
k = Herschel-Bulkley consistency coefficient b = Hershel-Bulkley power-law exponent
γ = shear rate.
Many methods have been developed to evaluate yield stress. These methods produce varying results based on the rheological technique and assumptions used in the evaluation. To explain these variations, the concept of static and dynamic yield stress is introduced. The idea behind static and dynamic yield stress can be explained by assuming that there are two structures that present yield-stress exhibiting fluids. One structure is insensitive to shear rate and defines the dynamic yield stress associated with a flow curve. However, a second weak structure is also present that forms while the fluid is at rest. The second structure is sensitive to shear rate and breaks down as the fluid is sheared. Combined, these two stresses define the static yield-stress value (see Figure D.3).
Shear Rate
Shea
r Str
ess
Dynamic Yield Stressor "Bingham Plastic Yield Index"
Static Yield Stressor "Shear Strength"
Figure D.3. Rheogram Illustrating the Concept of Dynamic and Static Yield Stress
The use of the static and dynamic yield-stress values varies with application. For instance, the dynamic yield-stress value extrapolated from a rheogram should be used when performing pipeline-head-loss calculations. The static yield stress should be used for process restart applications where the second structure could form while the fluid is at rest.
A common method of measuring the static shear strength of a fluid is with a device called a shear
vane. A WTP procedure for measuring the static yield stress of a fluid was provided in 24590-WTP-
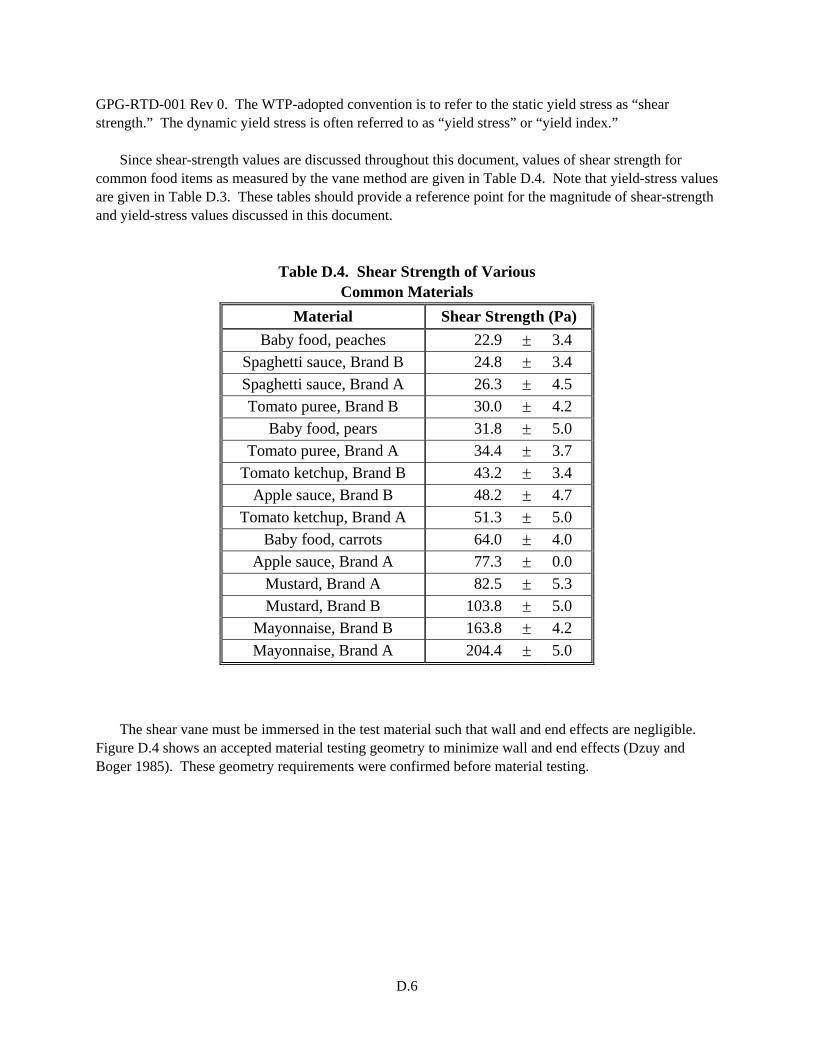
D.6
GPG-RTD-001 Rev 0. The WTP-adopted convention is to refer to the static yield stress as “shear strength.” The dynamic yield stress is often referred to as “yield stress” or “yield index.”
Since shear-strength values are discussed throughout this document, values of shear strength for
common food items as measured by the vane method are given in Table D.4. Note that yield-stress values are given in Table D.3. These tables should provide a reference point for the magnitude of shear-strength and yield-stress values discussed in this document.
Table D.4. Shear Strength of Various
Common Materials Material Shear Strength (Pa)
Baby food, peaches 22.9 ± 3.4 Spaghetti sauce, Brand B 24.8 ± 3.4 Spaghetti sauce, Brand A 26.3 ± 4.5 Tomato puree, Brand B 30.0 ± 4.2
Baby food, pears 31.8 ± 5.0 Tomato puree, Brand A 34.4 ± 3.7
Tomato ketchup, Brand B 43.2 ± 3.4 Apple sauce, Brand B 48.2 ± 4.7
Tomato ketchup, Brand A 51.3 ± 5.0 Baby food, carrots 64.0 ± 4.0
Apple sauce, Brand A 77.3 ± 0.0 Mustard, Brand A 82.5 ± 5.3 Mustard, Brand B 103.8 ± 5.0
Mayonnaise, Brand B 163.8 ± 4.2 Mayonnaise, Brand A 204.4 ± 5.0
The shear vane must be immersed in the test material such that wall and end effects are negligible. Figure D.4 shows an accepted material testing geometry to minimize wall and end effects (Dzuy and Boger 1985). These geometry requirements were confirmed before material testing.
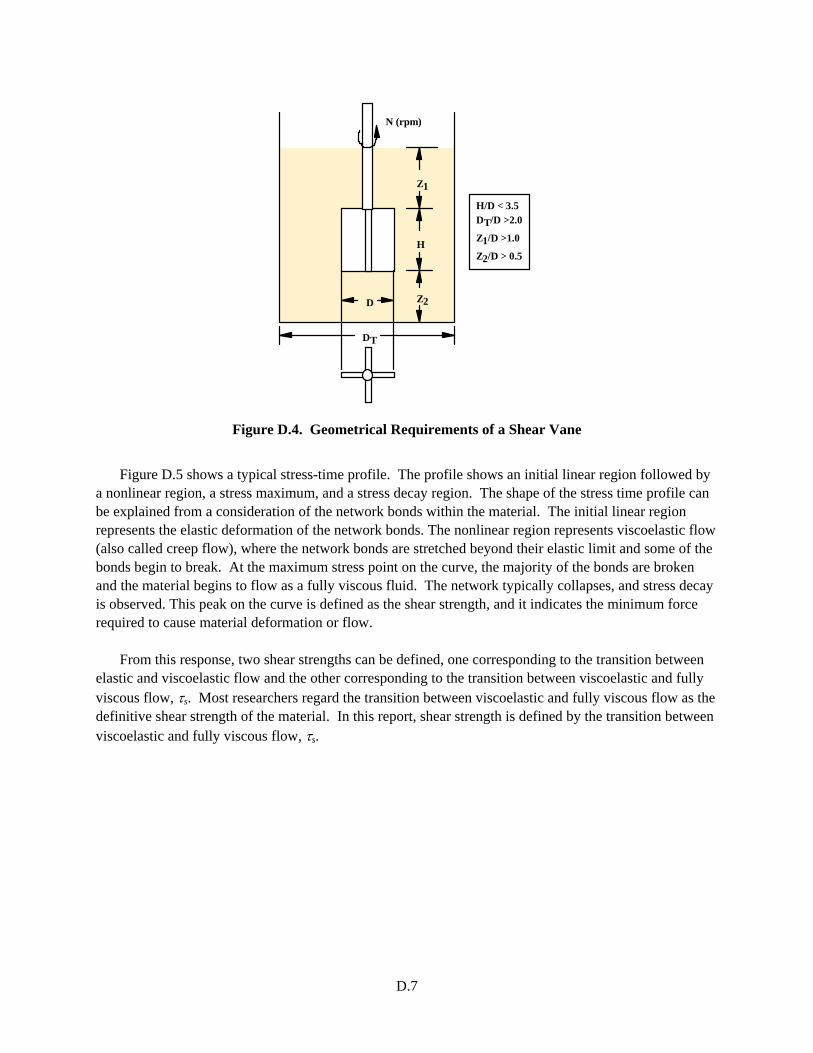
D.7
D
DT
Z1
Z2
H
N (rpm)
H/D < 3.5DT/D >2.0
Z1/D >1.0
Z2/D > 0.5
Figure D.4. Geometrical Requirements of a Shear Vane
Figure D.5 shows a typical stress-time profile. The profile shows an initial linear region followed by
a nonlinear region, a stress maximum, and a stress decay region. The shape of the stress time profile can be explained from a consideration of the network bonds within the material. The initial linear region represents the elastic deformation of the network bonds. The nonlinear region represents viscoelastic flow (also called creep flow), where the network bonds are stretched beyond their elastic limit and some of the bonds begin to break. At the maximum stress point on the curve, the majority of the bonds are broken and the material begins to flow as a fully viscous fluid. The network typically collapses, and stress decay is observed. This peak on the curve is defined as the shear strength, and it indicates the minimum force required to cause material deformation or flow.
From this response, two shear strengths can be defined, one corresponding to the transition between elastic and viscoelastic flow and the other corresponding to the transition between viscoelastic and fully viscous flow, τs. Most researchers regard the transition between viscoelastic and fully viscous flow as the definitive shear strength of the material. In this report, shear strength is defined by the transition between viscoelastic and fully viscous flow, τs.
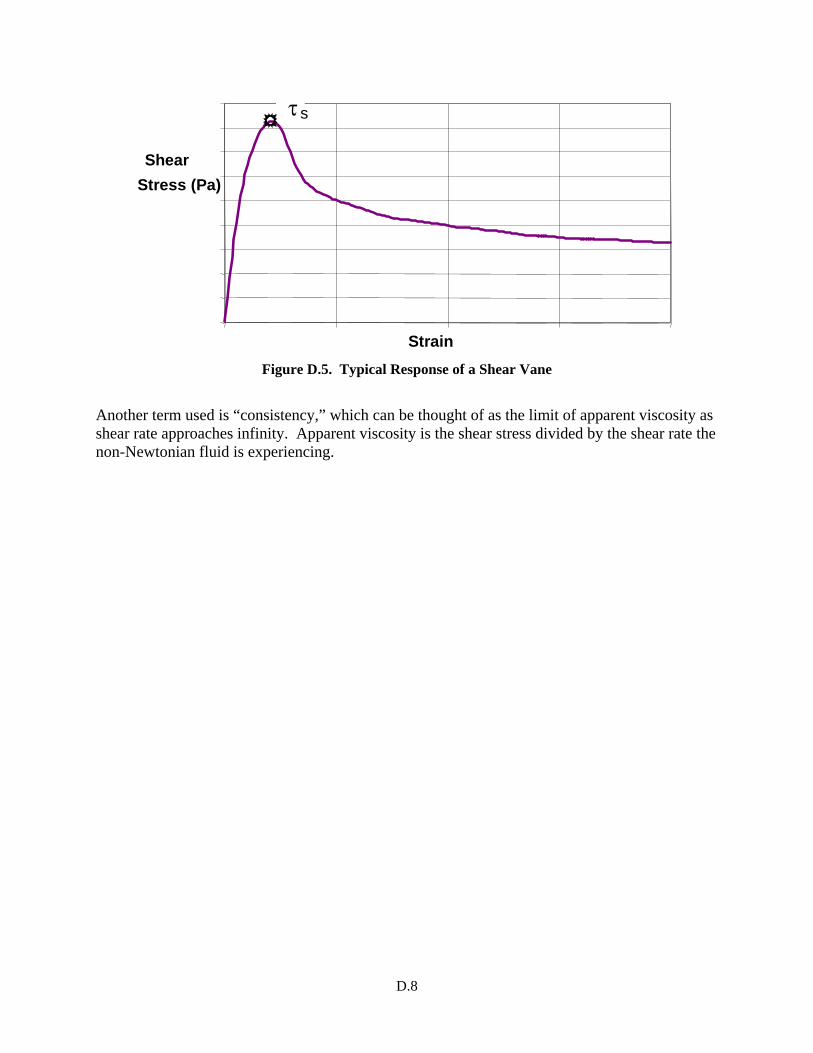
D.8
Strain
Shear Stress (Pa)
τ s
Figure D.5. Typical Response of a Shear Vane
Another term used is “consistency,” which can be thought of as the limit of apparent viscosity as shear rate approaches infinity. Apparent viscosity is the shear stress divided by the shear rate the non-Newtonian fluid is experiencing.
Appendix E
Quality Level Summary
E.1
Appendix E: Quality Level Summary This Section identifies the Quality Assurance levels applied to reviews and reports prepared for the
Waste Treatment Plant (WTP) based on completion of Research and Technology activities that were performed under British Nuclear Fuels Limited (BNFL), CH2M Hill Hanford Group (CHG) and Bechtel National, Inc. (BNI), Battelle (PNWD), Catholic University of America - Vitreous State Laboratory (VSL), and Savannah River National Laboratory (SRNL) since 2000.
The various Quality Assurance Program Plans had different requirements under the different
contractors. These differences should be programmatic in nature and should not impact data quality. However, an evaluation to determine the nature of these differences is outside the scope of this document.
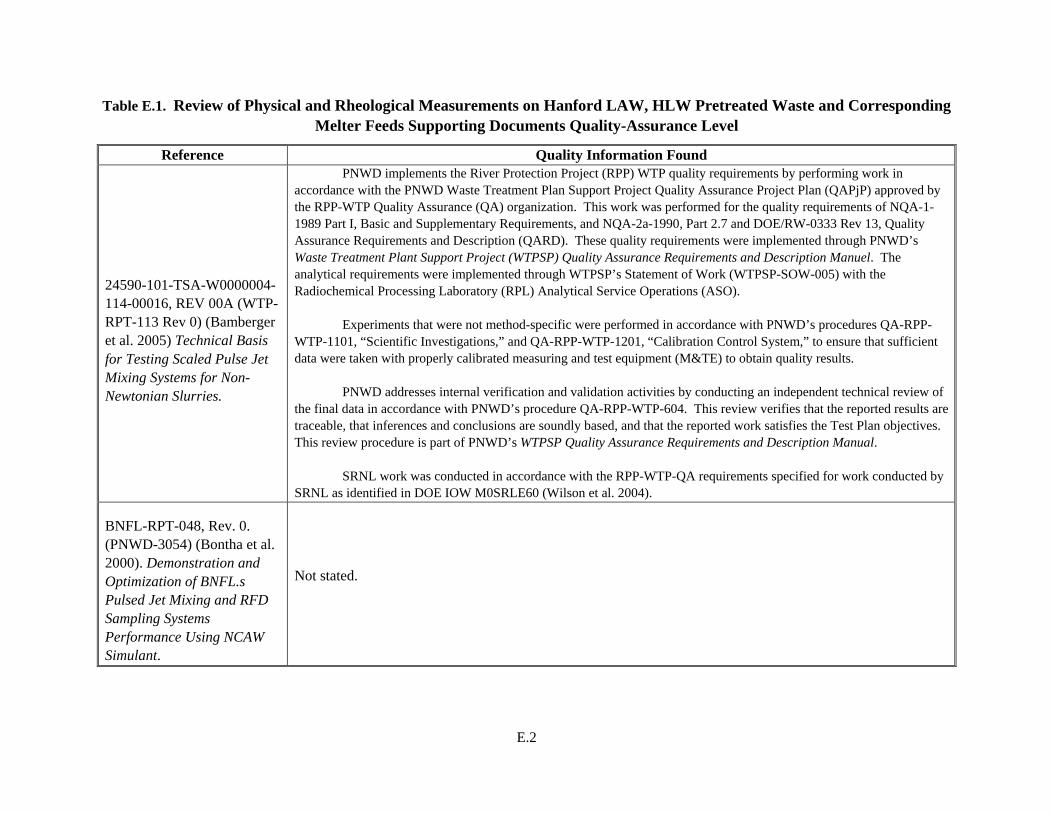
E.2
Table E.1. Review of Physical and Rheological Measurements on Hanford LAW, HLW Pretreated Waste and Corresponding Melter Feeds Supporting Documents Quality-Assurance Level
Reference Quality Information Found
24590-101-TSA-W0000004-114-00016, REV 00A (WTP-RPT-113 Rev 0) (Bamberger et al. 2005) Technical Basis for Testing Scaled Pulse Jet Mixing Systems for Non-Newtonian Slurries.
PNWD implements the River Protection Project (RPP) WTP quality requirements by performing work in accordance with the PNWD Waste Treatment Plan Support Project Quality Assurance Project Plan (QAPjP) approved by the RPP-WTP Quality Assurance (QA) organization. This work was performed for the quality requirements of NQA-1-1989 Part I, Basic and Supplementary Requirements, and NQA-2a-1990, Part 2.7 and DOE/RW-0333 Rev 13, Quality Assurance Requirements and Description (QARD). These quality requirements were implemented through PNWD’s Waste Treatment Plant Support Project (WTPSP) Quality Assurance Requirements and Description Manuel. The analytical requirements were implemented through WTPSP’s Statement of Work (WTPSP-SOW-005) with the Radiochemical Processing Laboratory (RPL) Analytical Service Operations (ASO).
Experiments that were not method-specific were performed in accordance with PNWD’s procedures QA-RPP-WTP-1101, “Scientific Investigations,” and QA-RPP-WTP-1201, “Calibration Control System,” to ensure that sufficient data were taken with properly calibrated measuring and test equipment (M&TE) to obtain quality results.
PNWD addresses internal verification and validation activities by conducting an independent technical review of the final data in accordance with PNWD’s procedure QA-RPP-WTP-604. This review verifies that the reported results are traceable, that inferences and conclusions are soundly based, and that the reported work satisfies the Test Plan objectives. This review procedure is part of PNWD’s WTPSP Quality Assurance Requirements and Description Manual.
SRNL work was conducted in accordance with the RPP-WTP-QA requirements specified for work conducted by
SRNL as identified in DOE IOW M0SRLE60 (Wilson et al. 2004).
BNFL-RPT-048, Rev. 0. (PNWD-3054) (Bontha et al. 2000). Demonstration and Optimization of BNFL.s Pulsed Jet Mixing and RFD Sampling Systems Performance Using NCAW Simulant.
Not stated.
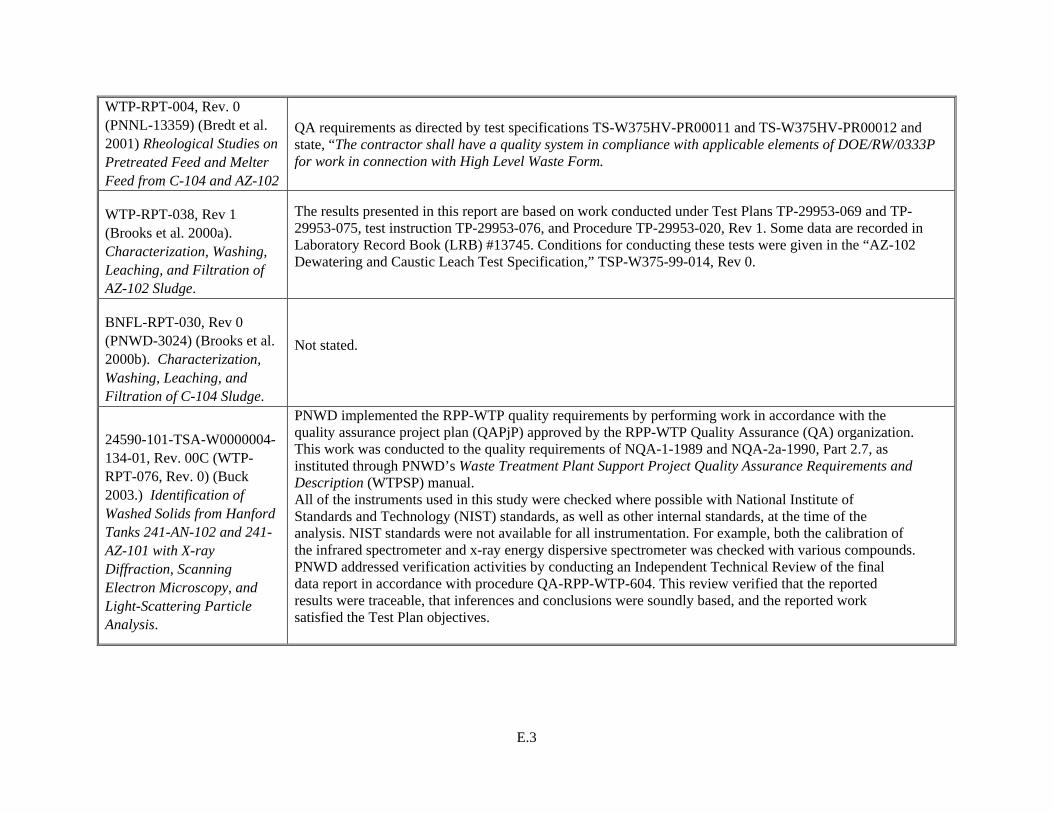
E.3
WTP-RPT-004, Rev. 0 (PNNL-13359) (Bredt et al. 2001) Rheological Studies on Pretreated Feed and Melter Feed from C-104 and AZ-102
QA requirements as directed by test specifications TS-W375HV-PR00011 and TS-W375HV-PR00012 and state, “The contractor shall have a quality system in compliance with applicable elements of DOE/RW/0333P for work in connection with High Level Waste Form.
WTP-RPT-038, Rev 1 (Brooks et al. 2000a). Characterization, Washing, Leaching, and Filtration of AZ-102 Sludge.
The results presented in this report are based on work conducted under Test Plans TP-29953-069 and TP-29953-075, test instruction TP-29953-076, and Procedure TP-29953-020, Rev 1. Some data are recorded in Laboratory Record Book (LRB) #13745. Conditions for conducting these tests were given in the “AZ-102 Dewatering and Caustic Leach Test Specification,” TSP-W375-99-014, Rev 0.
BNFL-RPT-030, Rev 0 (PNWD-3024) (Brooks et al. 2000b). Characterization, Washing, Leaching, and Filtration of C-104 Sludge.
Not stated.
24590-101-TSA-W0000004-134-01, Rev. 00C (WTP-RPT-076, Rev. 0) (Buck 2003.) Identification of Washed Solids from Hanford Tanks 241-AN-102 and 241-AZ-101 with X-ray Diffraction, Scanning Electron Microscopy, and Light-Scattering Particle Analysis.
PNWD implemented the RPP-WTP quality requirements by performing work in accordance with the quality assurance project plan (QAPjP) approved by the RPP-WTP Quality Assurance (QA) organization. This work was conducted to the quality requirements of NQA-1-1989 and NQA-2a-1990, Part 2.7, as instituted through PNWD’s Waste Treatment Plant Support Project Quality Assurance Requirements and Description (WTPSP) manual. All of the instruments used in this study were checked where possible with National Institute of Standards and Technology (NIST) standards, as well as other internal standards, at the time of the analysis. NIST standards were not available for all instrumentation. For example, both the calibration of the infrared spectrometer and x-ray energy dispersive spectrometer was checked with various compounds. PNWD addressed verification activities by conducting an Independent Technical Review of the final data report in accordance with procedure QA-RPP-WTP-604. This review verified that the reported results were traceable, that inferences and conclusions were soundly based, and the reported work satisfied the Test Plan objectives.
E.4
WSRC-TR-2000-00338, (SRT-RPP-2000-00017) (Eibling and Nash 2001). Hanford Waste Simulants Created to Support the Research and Development on the River Protection Project – Waste Treatment Plant.
This report documents the simulants developed to support the Savannah River Technology Center programs in support of the RPP-WTP. The research described in this report was conducted under task plan BNF-003-98-011, rev 0. Additional simulants described in this report were also developed under task plan BNF-003-98-0079A.
SCT-M0SRLE60-00-193-02, REV 00A (WSRC-TR 2003-00220, REV. 0) (Eibling et al. 2003). Development of Simulants to Support Mixing Tests for High Level Waste and Low Activity Waste.
This work was conducted in accordance with the RPP-WTP QA requirements specified for work conducted by SRTC as identified in DOE IWO M0SRLE60. SRTC has provided matrices to WTP demonstrating compliance of the SRTC QA program with the requirements specified by WTP. Specific information regarding the compliance of the SRTC QA program with RW-0333P, Revision 10, NQA-1 1989, Part 1, Basic and Supplementary Requirements and NQA-2a 1990, Part 2.7 is contained in these matrices. The simulant development program supports agitator design testing and mixing studies planned for LAW and HLW feeds. The task plan covering the simulant development is WSRC-TR-2002-00468, Task Technical and Quality Assurance Plan for Development of Simulants to Support Mixing tests for High Level Waste and Low Activity Waste.
24590-101-TSA-W0000004-72-08, Rev 00B (PNWD-3360) (WTP-RPT-078 Rev. 0). (Enderlin et al. 2003). Results of Small-Scale Particle Cloud Tests and Non-Newtonian Fluid Cavern Tests
PNWD implements the RPP-WTP quality requirements by performing work in accordance with the Waste Treatment Plant Support Project quality assurance project plan (QAPjP) approved by the RPP-WTP Quality Assurance (QA) organization. This QA manual is a web-based manual managed by the PNWD WTP QA engineer. This work was performed to the quality requirements of NQA-1-1989 Part I, “Basic and Supplementary Requirements,” and NQA-2a- 1990, Part 2.7. These quality requirements were implemented through PNWD's Waste Treatment Plant Support Project (WTPSP) Quality Assurance Requirements and Description Manual. The analytical requirements are implemented through PNWD’s Conducting Analytical Work in Support of Regulatory Programs. For calculating the cloud and cavern height dimensions, independent measurements were performed by two individuals. PNWD addressed verification activities by conducting an independent technical review of the final data report in accordance with procedure QA-RPPWTP-604. This review verified that the reported results were traceable, that inferences and conclusions were soundly based, and the reported work satisfied the test plan objectives. The review procedure is part of PNWD's WTPSP Manual.
E.5
24590-101-TSA-W0000004-87-09, Rev 00C (Geeting et al. 2003). (PNWD-3206, Rev 1.) (WTP-RPT-043, Rev 1) Filtration, Washing, and Caustic Leaching of Hanford Tank AZ-101 Sludge.
Quality control information can be found in Section 2.0 “Test Conditions” and in Appendices A through H.
SRT-RPP-2001-00008 (Hansen and Eibling 2001). Status Report for Mixing Envelope D Sludge with LAW Intermediate Products with and without Glass Formers.
The simulants/data will be reported as sectioned in the experimental section of the “Task Technical and Quality Assurance Plan for Mixing Envelope D Sludge with LAW Intermediate Products (Sr/TRU Precipitate and Cs/Tc Eluate) with and without Glass Formers” document. Listed below is the introduction and Task description as stated in the task plan. (Hansen, E. K., Eibling, R. E., and Calloway, T. B. “Task Technical and Quality Assurance Plan for Mixing Envelope D Sludge with LAW Intermediate Products (Sr/TRU Precipitate and Cs/Tc Eluate with and without Glass Formers”, WSRC-RP-2000-00731, October 3, 2000)
24590-TRPT- 01-00001, Rev. 0 (WSRC-TR-2001-00203, Rev. 0) (SRT-RPP-2001-00051, Rev. 0) (Hansen et al. 2001). Mixing Envelope D Sludge with LAW Intermediate Products with and without Glass Formers.
Not stated
E.6
WTP Project No. SCT-M0SRLE60-00-193-00004 REV 00A (WSRC-TR-2004-00394, Rev. 0) (SRT-RPP-2004-00061, Rev. 0) (Hansen and Crawford 2005). Hanford HLW AY102/C106 Pretreated Sludge Physical and Chemical Properties Prior to Melter Feed Processing (U).
This work was conducted in accordance with the RPP-WTP Quality Assurance (QA) requirements specified for work conducted by SRNL as identified in DOE IWO M0SRLE60. SRNL has provided matrices to WTP indicating application of the SRNL QA program with the requirements specified by WTP. The Task Technical and Quality Assurance Plan (Ref. 0) provided the quality requirements for this work. NQA Specific information regarding the compliance of the SRNL QA program with RW-0333P, Revision 13, NQA-1 1989, Part 1, Basic and Supplementary Requirements and NQA-2a 1990, Subpart 2.7 is contained in these matrices.
SCT-M0SRLE60-00-211-00001 REV 00A (WSRC-TR-2005-00035, Rev. 0) (SRNL-RPP-2005-00003, Rev. 0) (Hansen and Williams 2005). Physical Characterization of Vitreous State Laboratory AY102/C106 and AZ102 High Level Waste Melter Feed Simulants (u).
This work was conducted in accordance with the RPP-WTP QA requirements specified for work conducted by SRNL as identified in DOE IWO M0SRLE60. SRNL has provided matrices to WTP demonstrating compliance of the SRNL QA program with the requirements specified by WTP. Specific information regarding the compliance of the SRNL QA program with RW-0333P, Revision 13, NQA-1 1989, Part 1, Basic and Supplementary Requirements and NQA-2a 1990, Subpart 2.7 is contained in these matrices. The Task Technical and Quality Assurance Plan used to conduct this work are specified in Hansen, E. K., General Support: SRNL Physical and Chemical Measurements for WTP Simulants Task. WSRC-TR-2004-00388, Rev. 0 & SRT-RPP-2004-00057, Rev. 0, Westinghouse Savannah River Company, Aiken, South Carolina, August 2004.
SCT-M0SRLE60-00-199-00001, Rev. 00A (WSRC-TR-2004-00387) (Hassan et al. 2004.) Evaluation of Foaming / Antifoaming in WTP Tanks Equipped with Pulse Jet Mixers and Air Spargers.
This work was conducted in accordance with the RPP-WTP QA requirements specified for work conducted by SRTC as identified in DOE IWO M0SRLE60. SRTC has provided matrices to WTP demonstrating compliance of the SRTC QA program with the requirements specified by WTP. Specific information regarding the compliance of the SRTC QA program with RW-0333P, Revision 10, NQA-1 1989, Part 1, Basic and Supplementary Requirements and NQA-2a 1990, Subpart 2.7 is contained in these matrices.
E.7
24590-101-TSA-W0000004-150-00004, Rev. 00A. (WTP-RPT-116, Rev. 0) (PNWD-3499) (Hrma et al. 2004). Vitrification and Product Testing of AZ-101 Pretreated High-Level Waste Envelope D Glass.
PNWD implements the River Protection Project Waste Treatment Plant (RPP-WTP) quality requirements by performing work in accordance with the PNWD Waste Treatment Plant Support Project quality assurance project plan (QAPjP) approved by the RPP-WTP Quality Assurance (QA) organization. This work was performed to the quality requirements of NQA-1-1989 Part I, Basic and Supplementary Requirements, and NQA-2a-1990, Part 2.7. These quality requirements are implemented through PNWD’s Waste Treatment Plant Support Project (WTPSP) Quality Assurance Requirements and Description Manual. The analytical requirements are implemented through WTPSP’s Statement of Work (WTPSP-SOW-005) with the Radiochemical Processing Laboratory (RPL) Analytical Service Operations (ASO). A matrix that cross-references the NQA-1 and 2a requirements with the PNWD’s procedures for this work is given in test plan TP-RPP-WTP-190, Rev 0, Table 5. (Applicable Quality Assurance Procedures) It includes justification for those requirements not implemented. For activities with the HLW the additional quality requirements of DOE/RW-0333P, Rev 13, Quality Assurance Requirements and Descriptions shall be met. Conduct of Experimental and Analytical Work Experiments that were not method-specific were performed in accordance with PNWD’s procedures QA-RPP-WTP-1101 “Scientific Investigations” and QA-RPP-WTP-1201 “Calibration Control System,” ensuring that sufficient data were taken with properly calibrated measuring and test equipment (M&TE) to obtain quality results. The work was conducted as specified in Test Specification 24590-LAW-TSP-RT-02-009, Rev 0. BNI’s QAPjP, PL-24590-QA00001, Rev 0, is applicable to the TCLP activities since the work might be used in support of environmental/regulatory compliance. The applicable quality control (QC) parameters for chemical analysis are delineated in Test Plan TP-RPP-WTP-190, Rev 0, Table 3 and 7. TCLP Results for AZ-101 Envelope D Glass are summarized in Appendix D. Internal Data Verification and Validation PNWD addresses internal verification and validation activities by conducting an independent technical review of the final data report in accordance with PNWD’s procedure QA-RPP-WTP-604. This review verifies that the reported results are traceable, that inferences and conclusions are soundly based, and that the reported work satisfies the Test Plan objectives. This review procedure is part of PNWD’s WTPSP Quality Assurance Requirements and Description Manual.
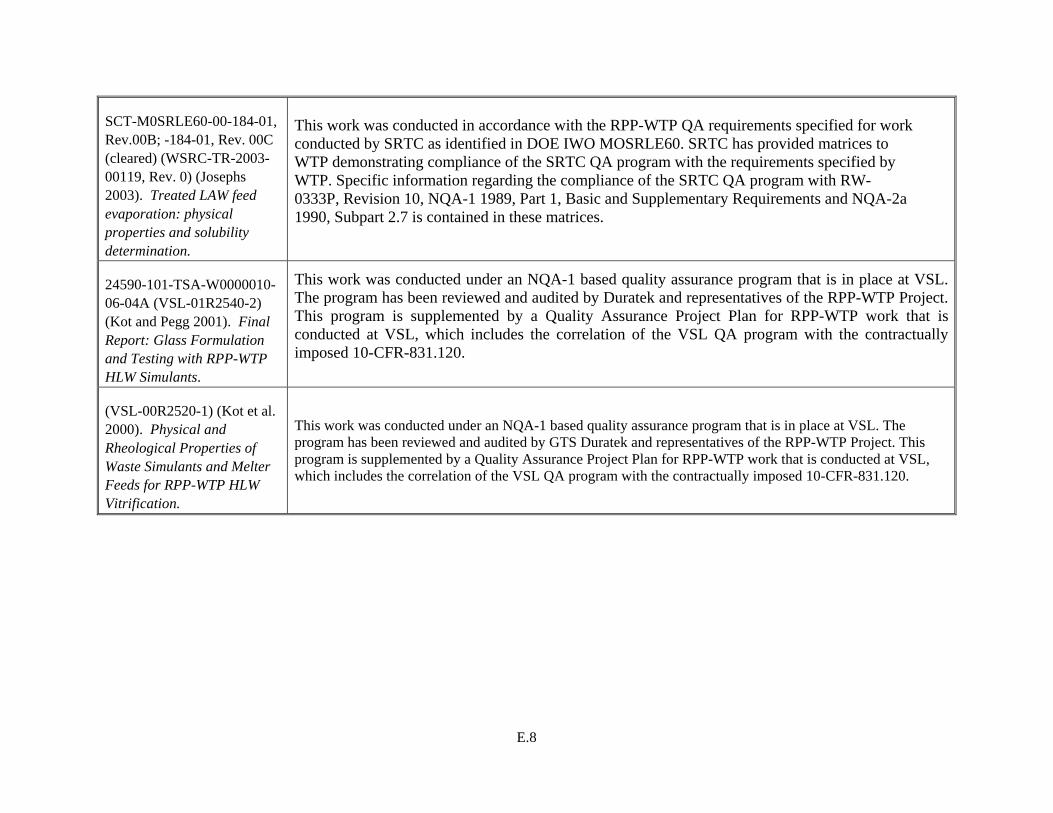
E.8
SCT-M0SRLE60-00-184-01, Rev.00B; -184-01, Rev. 00C (cleared) (WSRC-TR-2003-00119, Rev. 0) (Josephs 2003). Treated LAW feed evaporation: physical properties and solubility determination.
This work was conducted in accordance with the RPP-WTP QA requirements specified for work conducted by SRTC as identified in DOE IWO MOSRLE60. SRTC has provided matrices to WTP demonstrating compliance of the SRTC QA program with the requirements specified by WTP. Specific information regarding the compliance of the SRTC QA program with RW- 0333P, Revision 10, NQA-1 1989, Part 1, Basic and Supplementary Requirements and NQA-2a 1990, Subpart 2.7 is contained in these matrices.
24590-101-TSA-W0000010-06-04A (VSL-01R2540-2) (Kot and Pegg 2001). Final Report: Glass Formulation and Testing with RPP-WTP HLW Simulants.
This work was conducted under an NQA-1 based quality assurance program that is in place at VSL. The program has been reviewed and audited by Duratek and representatives of the RPP-WTP Project. This program is supplemented by a Quality Assurance Project Plan for RPP-WTP work that is conducted at VSL, which includes the correlation of the VSL QA program with the contractually imposed 10-CFR-831.120.
(VSL-00R2520-1) (Kot et al. 2000). Physical and Rheological Properties of Waste Simulants and Melter Feeds for RPP-WTP HLW Vitrification.
This work was conducted under an NQA-1 based quality assurance program that is in place at VSL. The program has been reviewed and audited by GTS Duratek and representatives of the RPP-WTP Project. This program is supplemented by a Quality Assurance Project Plan for RPP-WTP work that is conducted at VSL, which includes the correlation of the VSL QA program with the contractually imposed 10-CFR-831.120.
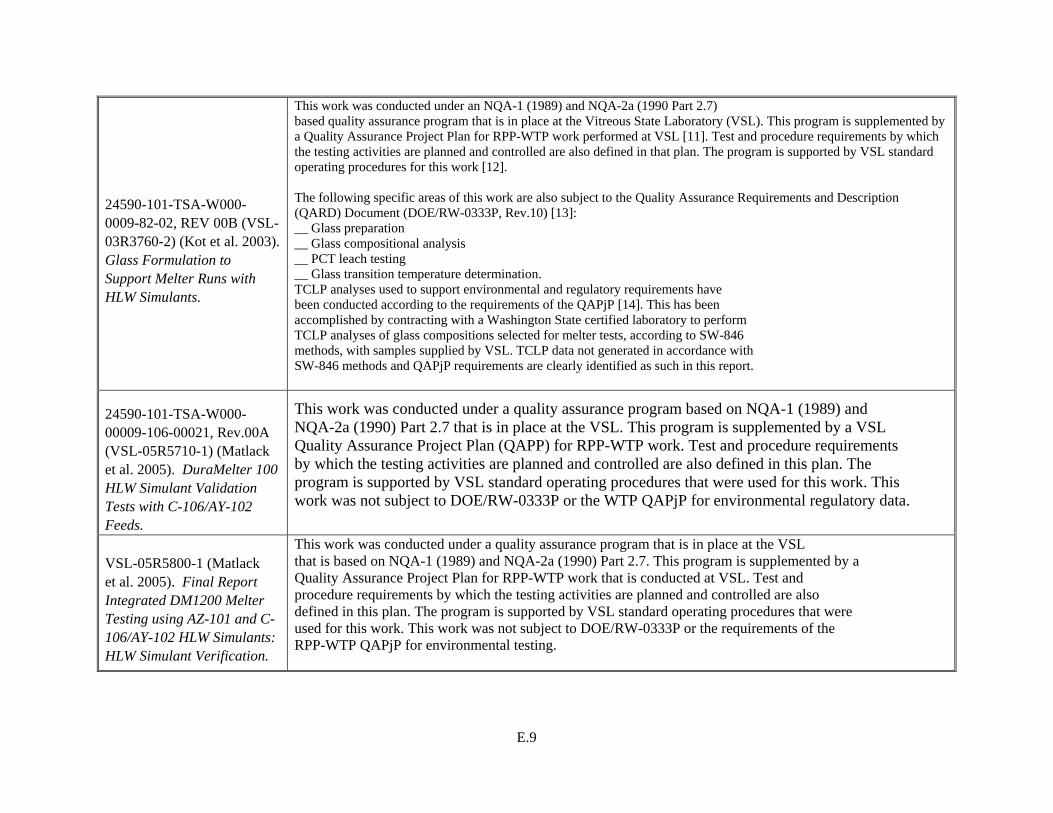
E.9
24590-101-TSA-W000-0009-82-02, REV 00B (VSL-03R3760-2) (Kot et al. 2003). Glass Formulation to Support Melter Runs with HLW Simulants.
This work was conducted under an NQA-1 (1989) and NQA-2a (1990 Part 2.7) based quality assurance program that is in place at the Vitreous State Laboratory (VSL). This program is supplemented by a Quality Assurance Project Plan for RPP-WTP work performed at VSL [11]. Test and procedure requirements by which the testing activities are planned and controlled are also defined in that plan. The program is supported by VSL standard operating procedures for this work [12]. The following specific areas of this work are also subject to the Quality Assurance Requirements and Description (QARD) Document (DOE/RW-0333P, Rev.10) [13]: __ Glass preparation __ Glass compositional analysis __ PCT leach testing __ Glass transition temperature determination. TCLP analyses used to support environmental and regulatory requirements have been conducted according to the requirements of the QAPjP [14]. This has been accomplished by contracting with a Washington State certified laboratory to perform TCLP analyses of glass compositions selected for melter tests, according to SW-846 methods, with samples supplied by VSL. TCLP data not generated in accordance with SW-846 methods and QAPjP requirements are clearly identified as such in this report.
24590-101-TSA-W000-00009-106-00021, Rev.00A (VSL-05R5710-1) (Matlack et al. 2005). DuraMelter 100 HLW Simulant Validation Tests with C-106/AY-102 Feeds.
This work was conducted under a quality assurance program based on NQA-1 (1989) and NQA-2a (1990) Part 2.7 that is in place at the VSL. This program is supplemented by a VSL Quality Assurance Project Plan (QAPP) for RPP-WTP work. Test and procedure requirements by which the testing activities are planned and controlled are also defined in this plan. The program is supported by VSL standard operating procedures that were used for this work. This work was not subject to DOE/RW-0333P or the WTP QAPjP for environmental regulatory data.
VSL-05R5800-1 (Matlack et al. 2005). Final Report Integrated DM1200 Melter Testing using AZ-101 and C-106/AY-102 HLW Simulants: HLW Simulant Verification.
This work was conducted under a quality assurance program that is in place at the VSL that is based on NQA-1 (1989) and NQA-2a (1990) Part 2.7. This program is supplemented by a Quality Assurance Project Plan for RPP-WTP work that is conducted at VSL. Test and procedure requirements by which the testing activities are planned and controlled are also defined in this plan. The program is supported by VSL standard operating procedures that were used for this work. This work was not subject to DOE/RW-0333P or the requirements of the RPP-WTP QAPjP for environmental testing.
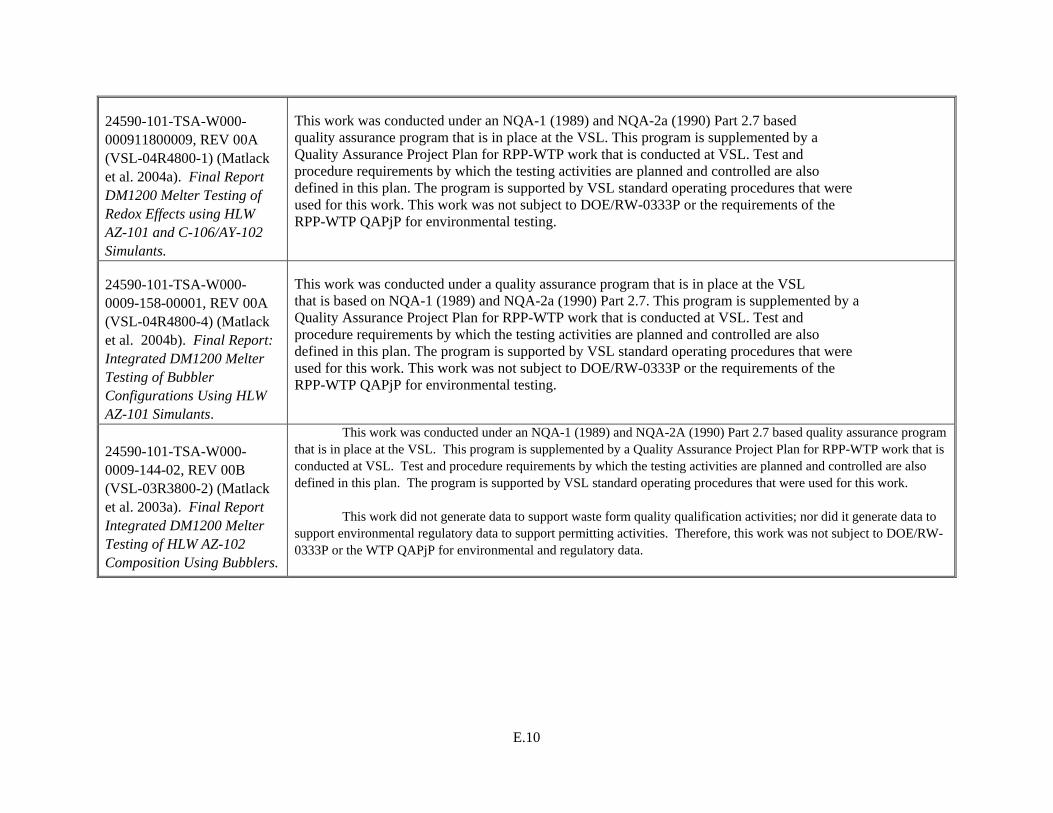
E.10
24590-101-TSA-W000-000911800009, REV 00A (VSL-04R4800-1) (Matlack et al. 2004a). Final Report DM1200 Melter Testing of Redox Effects using HLW AZ-101 and C-106/AY-102 Simulants.
This work was conducted under an NQA-1 (1989) and NQA-2a (1990) Part 2.7 based quality assurance program that is in place at the VSL. This program is supplemented by a Quality Assurance Project Plan for RPP-WTP work that is conducted at VSL. Test and procedure requirements by which the testing activities are planned and controlled are also defined in this plan. The program is supported by VSL standard operating procedures that were used for this work. This work was not subject to DOE/RW-0333P or the requirements of the RPP-WTP QAPjP for environmental testing.
24590-101-TSA-W000-0009-158-00001, REV 00A (VSL-04R4800-4) (Matlack et al. 2004b). Final Report: Integrated DM1200 Melter Testing of Bubbler Configurations Using HLW AZ-101 Simulants.
This work was conducted under a quality assurance program that is in place at the VSL that is based on NQA-1 (1989) and NQA-2a (1990) Part 2.7. This program is supplemented by a Quality Assurance Project Plan for RPP-WTP work that is conducted at VSL. Test and procedure requirements by which the testing activities are planned and controlled are also defined in this plan. The program is supported by VSL standard operating procedures that were used for this work. This work was not subject to DOE/RW-0333P or the requirements of the RPP-WTP QAPjP for environmental testing.
24590-101-TSA-W000-0009-144-02, REV 00B (VSL-03R3800-2) (Matlack et al. 2003a). Final Report Integrated DM1200 Melter Testing of HLW AZ-102 Composition Using Bubblers.
This work was conducted under an NQA-1 (1989) and NQA-2A (1990) Part 2.7 based quality assurance program that is in place at the VSL. This program is supplemented by a Quality Assurance Project Plan for RPP-WTP work that is conducted at VSL. Test and procedure requirements by which the testing activities are planned and controlled are also defined in this plan. The program is supported by VSL standard operating procedures that were used for this work.
This work did not generate data to support waste form quality qualification activities; nor did it generate data to
support environmental regulatory data to support permitting activities. Therefore, this work was not subject to DOE/RW-0333P or the WTP QAPjP for environmental and regulatory data.
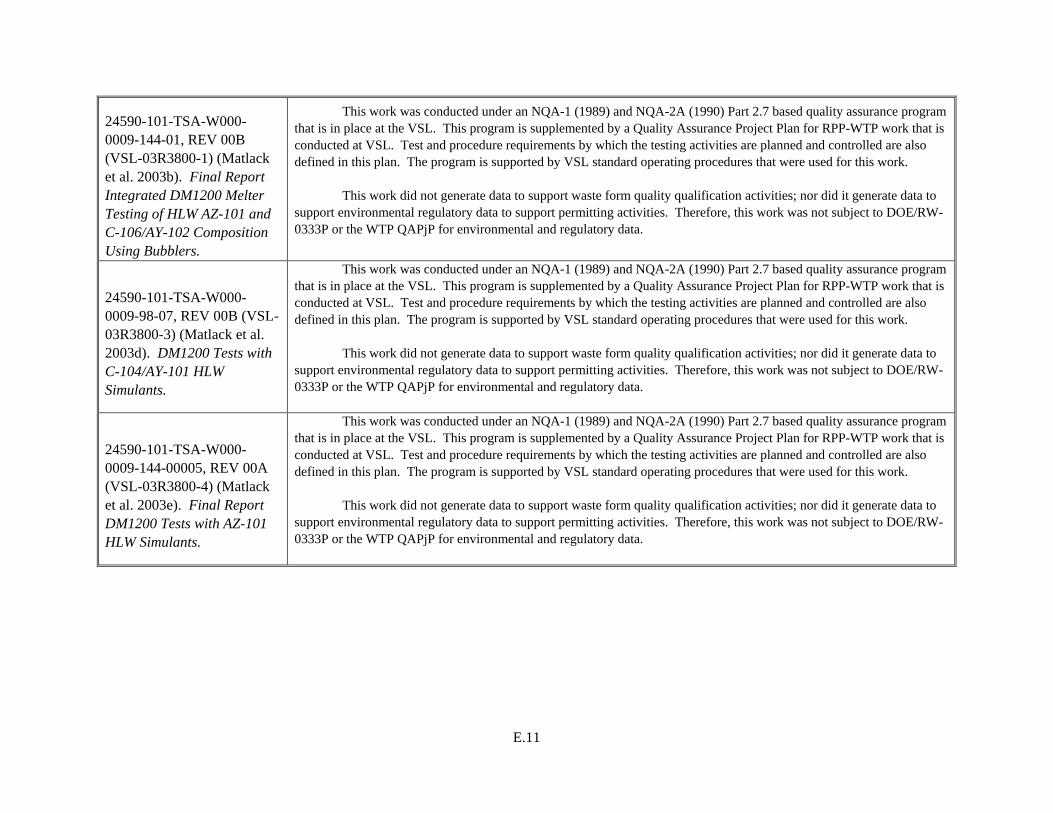
E.11
24590-101-TSA-W000-0009-144-01, REV 00B (VSL-03R3800-1) (Matlack et al. 2003b). Final Report Integrated DM1200 Melter Testing of HLW AZ-101 and C-106/AY-102 Composition Using Bubblers.
This work was conducted under an NQA-1 (1989) and NQA-2A (1990) Part 2.7 based quality assurance program that is in place at the VSL. This program is supplemented by a Quality Assurance Project Plan for RPP-WTP work that is conducted at VSL. Test and procedure requirements by which the testing activities are planned and controlled are also defined in this plan. The program is supported by VSL standard operating procedures that were used for this work.
This work did not generate data to support waste form quality qualification activities; nor did it generate data to
support environmental regulatory data to support permitting activities. Therefore, this work was not subject to DOE/RW-0333P or the WTP QAPjP for environmental and regulatory data.
24590-101-TSA-W000-0009-98-07, REV 00B (VSL-03R3800-3) (Matlack et al. 2003d). DM1200 Tests with C-104/AY-101 HLW Simulants.
This work was conducted under an NQA-1 (1989) and NQA-2A (1990) Part 2.7 based quality assurance program that is in place at the VSL. This program is supplemented by a Quality Assurance Project Plan for RPP-WTP work that is conducted at VSL. Test and procedure requirements by which the testing activities are planned and controlled are also defined in this plan. The program is supported by VSL standard operating procedures that were used for this work.
This work did not generate data to support waste form quality qualification activities; nor did it generate data to
support environmental regulatory data to support permitting activities. Therefore, this work was not subject to DOE/RW-0333P or the WTP QAPjP for environmental and regulatory data.
24590-101-TSA-W000-0009-144-00005, REV 00A (VSL-03R3800-4) (Matlack et al. 2003e). Final Report DM1200 Tests with AZ-101 HLW Simulants.
This work was conducted under an NQA-1 (1989) and NQA-2A (1990) Part 2.7 based quality assurance program that is in place at the VSL. This program is supplemented by a Quality Assurance Project Plan for RPP-WTP work that is conducted at VSL. Test and procedure requirements by which the testing activities are planned and controlled are also defined in this plan. The program is supported by VSL standard operating procedures that were used for this work.
This work did not generate data to support waste form quality qualification activities; nor did it generate data to
support environmental regulatory data to support permitting activities. Therefore, this work was not subject to DOE/RW-0333P or the WTP QAPjP for environmental and regulatory data.
E.12
24590-101-TSA-W000-0009-48-01, REV 00C (VSL-01R10NO-1, Rev.1) (Matlack et al. 2002b). Melter Tests with AZ-101 HLW Simulant Using a DuraMelter 100 Vitrification System.
This work was conducted under an NQA-1 based quality assurance program that is in place at VSL. This program is supplemented by a VSL Quality Assurance Project Plan (QAPP) for RPP-WTP work. Per RPP-WTP Project direction, the program was revised during the performance of this work. Accordingly, work performed before 8/1/01 was performed under an NQA-1 (1994) program and corresponding Quality Assurance Project Plan (QAPP) for RPP-WTP work [12], while work performed after that date was performed under an NQA-1 (1989) and NQA-2a (1990) Part 2.7 based quality assurance program and corresponding QAPP [13]. The program is supported by VSL standard operating procedures that were used for this work [14]. This work was not subject to DOE/RW-0333P.
VSL-00R2501-2, Rev. 0 (Matlack et al. 2000a). Screening Tests on DuraMelter™ 10 with C-106/AY-102 Simulant in Support of DuraMelter™ 1000 Throughput Tests.
This work was conducted under an NQA-1 based quality assurance program that is in place at VSL. The program has been frequently audited by representatives of GTS Duratek and various DOE sites and contractors over many years. This program is supplemented by a Quality Assurance Project Plan for RPP-WTP B1 work that is conducted at VSL, which includes the correlation of the VSL QA program with the contractually imposed 10-CFR-831.120.
VSL-00R2501-1, Rev. 0 (Matlack et al. 2000b). Tests on DuraMelter™ 10 with AZ-101 Simulant in Support of DuraMelter™ 1000 Throughput Tests.
This work was conducted under an NQA-1 based quality assurance program that is in place at VSL. The program has been frequently audited by representatives of GTS Duratek and various DOE sites and contractors over many years. This program is supplemented by a Quality Assurance Project Plan for RPP-WTP B1 work that is conducted at VSL, which includes the correlation of the VSL QA program with the contractually imposed 10-CFR-831.120.
VSL-00R2590-1, Rev. 0 (Matlack et al. 2000c). Determination of the Processing Rate of RPP-WTP Simulants Using a DuraMelter™ 1000 Vitrification System.
This work was conducted under an NQA-1 based quality assurance program that is in place at VSL. The program has been frequently audited by representatives of GTS Duratek and various DOE sites and contractors over many years and, most recently, by BNFL, Inc. This program is supplemented by a Quality Assurance Project Plan for RPP-WTP-B1 work that is conducted at VSL, which includes the correlation of the VSL QA program with the contractually imposed 10-CFR-831.120.
E.13
VSL-02R0100-2 Rev. 1 (Matlack et al. 2002a). Tests on the DuraMelter 1200 HLW Pilot Melter System Using AZ-101 HLW Simulants.
This work was conducted under an NQA-1 based quality assurance program that is in place at VSL. This program is supplemented by a VSL Quality Assurance Project Plan (QAPP) for RPP-WTP work. Per RPP-WTP Project direction, the program was revised during the performance of this work. Accordingly, work performed before 8/1/01 was performed under an NQA-1 (1994) program and corresponding Quality Assurance Project Plan (QAPP) for RPP-WTP work [12], while work performed after that date was performed under an NQA-1 (1989) and NQA-2a (1990) Part 2.7 based quality assurance program and corresponding QAPP [13]. The program is supported by VSL standard operating procedures that were used for this work [14]. This work was not subject to DOE/RW-0333P.
E.14
24590-101-TSA-W000-0004-144-01, REV 00B (WTP-RPT-096, Rev. 0) (Poloski et al. 2003a). Rheological and Physical Properties of AZ 101 HLW Pretreated Sludge and Melter Feed.
PNWD implements the RPP-WTP quality requirements by performing work in accordance with the PNWD Waste Treatment Plant Support Project quality assurance project plan (QAPjP) approved by the RPP-WTP Quality Assurance (QA) organization. This work was performed to the quality requirements of NQA-1-1989 Part I, Basic and Supplementary Requirements, and NQA-2a-1990, Subpart 2.7. These quality requirements are implemented through PNWD’s Waste Treatment Plant Support Project (WTPSP) Quality Assurance Requirements and Description Manual. The analytical requirements are implemented through PNWD’s Conducting Analytical Work in Support of Regulatory Programs. For activities with the HLW, the additional QA requirements of DOE/RW-0333P, Rev. 11, Quality Assurance Requirements and Description, were met. A listing of the procedures implementing the DOE/RW-0333P QA requirements is included in Test Plan, TP-RPP-WTP-188 Rev 0, AZ-101 (Envelope D) Melter Feed Rheology Testing. A matrix that cross references the NQA-1 and 2a requirements with PNWD’s procedures for this work is given in the Test Plan, TP-RPP-WTP-188 Rev 0, AZ-101 (Envelope D) Melter Feed Rheology Testing. It includes justification for those requirements not implemented. Experiments that are not method-specific were performed in accordance with PNWD’s procedures QA-RPP-WTP-1101 “Scientific Investigations” and QA-RPP-WTP-1201 “Calibration Control System,” assuring that sufficient data were taken with properly calibrated measuring and test equipment (M&TE) to obtain quality results. As specified in Test Specification, 24590-HLW-TSP-RT-02-009 Rev 0, Bechtel National Inc.’s (BNI’s) QAPjP, 24590-QA-0001, is not applicable since the work was not performed in support of environmental/regulatory testing, and the data will not be used as such. PNWD addresses internal verification and validation activities by conducting an Independent Technical Review of the final data report in accordance with PNWD’s procedure QA-RPP-WTP-604. This review verifies that 1) the reported results are traceable, 2) inferences and conclusions are soundly based, and 3) the reported work satisfies the Test Plan objectives. This review procedure is part of PNWD’s WTPSP Quality Assurance Requirements and Description Manual.
E.15
24590-101-TSA-W000-0004-99-09, Rev. 00D (WTP-RPT-100 Rev. 0) (Poloski et al. 2003b). Interim Report - Technical Basis for HLW Vitrification Stream Physical and Rheological Property Bounding Conditions.
Battelle—Pacific Northwest Division (PNWD) implements the River Protection Project (RPP)-WTP quality requirements by performing work in accordance with the PNWD Waste Treatment Plant Support Project quality assurance project plan (QAPjP) approved by the RPP-WTP Quality Assurance (QA) organization. This work was performed to the quality requirements of NQA-1-1989 Part I, Basic and Supplementary Requirements, and NQA-2a-1990, Part 2.7. These quality requirements are implemented through PNWD’s Waste Treatment Plant Support Project (WTPSP) Quality Assurance Requirements and Description Manual. The analytical requirements are implemented through PNWD’s Conducting Analytical Work in Support of Regulatory Programs.
For activities with the HLW, the additional quality assurance requirements of DOE/RW-0333P, Rev. 11, Quality Assurance Requirements and Description, were met. A listing of the procedures implementing the DOE/RW-0333P quality assurance requirements is included in Test Plan, TP-RPP-WTP-205, LAW and HLW Actual Waste and Simulant Coordination.
A matrix that cross-references the NQA-1 and 2a requirements with the PNWD’s procedures for this work is given in Test Plan, TP-RPP-WTP-205, LAW and HLW Actual Waste and Simulant Coordination. It includes justification for those requirements not implemented.
As specified in Test Specification, 24590-WTP-TSP-RT-01-007, Rev. 0, Bechtel National, Incorporated’s (BNI’s) QAPjP, PL-24590-QA00001, is not applicable since the work was not performed in support of environmental/regulatory testing, and the data will not be used as such.
PNWD addresses internal verification and validation activities by conducting an Independent Technical Review of the final data report in accordance with PNWD’s Procedure QA-RPP-WTP-604. This review verifies that the reported results are traceable, that inferences and conclusions are soundly based, and that the reported work satisfies the Test Plan objectives. This review procedure is part of PNWD’s WTPSP Quality Assurance Requirements and Description Manual.
E.16
24590-101-TSA-W000-0004-99-00010, REV00A; -99-00010, REV 00B (published) (PNWD-3495). (WTP-RPT-111 Rev 0) (Poloski et al. 2004). Non-Newtonian Slurry Simulant Development and Selection for Pulse Jet Mixer Testing
PNWD implemented the RPP-WTP quality requirements by performing work in accordance with the PNWD Waste Treatment Plant Support Project quality assurance project plan (QAPjP) approved by the RPP-WTP Quality Assurance (QA) organization. This work was performed to the quality requirements of NQA-1-1989 Part I, Basic and Supplementary Requirements, and NQA-2a-1990, Part 2.7. These quality requirements were implemented through PNWD's Waste Treatment Plant Support Project (WTPSP) Quality Assurance Requirements and Description Manual. The analytical requirements were implemented through WTPSP’s Statement of Work (WTPSP-SOW-005) with the Radiochemical Processing Laboratory (RPL) Analytical Service Operations (ASO). Experiments that were not method-specific were performed in accordance with PNWD’s procedures QA-RPP-WTP-1101, “Scientific Investigations,” and QA-RPP-WTP-1201, “Calibration Control System,” ensuring that sufficient data were taken with properly calibrated measuring and test equipment (M&TE) to obtain quality results. As specified in Test Specification 24590-WTP-TSP-RT-03-008 Rev. 0, “Development of Scaled Performance Data for PJM Mixers in the Ultrafiltration Feed and Lag Storage/Blend Tanks,” BNI’s QAPjP, PL-24590-QA00001, was not applicable because the work was not performed in support of environmental/regulatory testing, and the data will not be used as such. PNWD addressed internal verification and validation activities by conducting an Independent Technical Review of the final data report in accordance with PNWD’s procedure QA-RPP-WTP-604. This review verified that the reported results were traceable, that inferences and conclusions were soundly based, and the reported work satisfied the Test Plan objectives. This review procedure is part of PNWD's WTPSP Quality Assurance Requirements and Description Manual.
E.17
24590-101-TSA-W000-0004-160-00001 REV 00A (PNWD-3541). (WTP-RPT-129 Rev 0) (Poloski et al. 2005). Technical Basis for Scaling of Air Sparging Systems for Mixing in Non-Newtonian Slurries,
Battelle - Pacific Northwest Division (PNWD) implements the RPP-WTP quality requirements by performing work in accordance with the PNWD Waste Treatment Plant Support Project quality assurance project plan (QAPjP) approved by the RPP-WTP Quality Assurance (QA) organization. This work was performed to the quality requirements of NQA-1-1989 Part I, Basic and Supplementary Requirements, and NQA-2a-1990 Part 2.7. These quality requirements are implemented through PNWD’s Waste Treatment Plant Support Project (WTPSP) Quality Assurance Requirements and Description Manual.
Experiments that were not method-specific were performed in accordance with PNWD’s procedures QA-RPP-WTP-1101, “Scientific Investigations,” and QA-RPP-WTP-1201, “Calibration Control System,” ensuring that sufficient data were taken with properly calibrated measuring and test equipment (M&TE) to obtain quality results. As specified in Test Specification 24590-WTP-TSP-RT-03-010 Rev. 0, “Pulse Jet Mixer Gas Hold-Up and Release Testing,” BNI’s QAPjP, PL-24590-QA-00001, was not applicable because the work was not performed in support of environmental/regulatory testing, and the data will not be used as such. PNWD addresses internal verification and validation activities by conducting an Independent Technical Review of the final data in accordance with PNWD’s procedure QA-RPP-WTP-604. This review verifies that the reported results are traceable, that inferences and conclusions are soundly based, and the reported work satisfies the Test Plan objectives. This review procedure is part of PNWD’s WTPSP Quality Assurance Requirements and Description Manual.
SCT-M0SRLE60-00-83-01A (WSRC-TR-2000-00352) (Rosencrance et al. 2000). Physical Characterization for Hanford Tank Waste Samples AN-102, AN-103, and AZ-102.
This work was requested by the customer1 and the experimental details and Quality Assurance requirements were specified in a Task Plan.2
E.18
24590-101-TSA-W000-0004-153-00002 REV 00B (PNWD-3552). (WTP-RPT-114 Rev. 1) (Russell et al. 2005). Final Report: Gas Retention and Release in Hybrid Pulse Jet Mixed Tanks Containing Non-Newtonian Waste Simulants
Battelle - Pacific Northwest Division (PNWD) implements the RPP-WTP quality requirements by performing work in accordance with the PNWD Waste Treatment Plant Support Project quality assurance project plan (QAPjP) approved by the RPP-WTP Quality Assurance (QA) organization. This work was performed to the quality requirements of NQA-1-1989 Part I, Basic and Supplementary Requirements, and NQA-2a-1990 Part 2.7. These quality requirements are implemented through PNWD’s Waste Treatment Plant Support Project (WTPSP) Quality Assurance Requirements and Description Manual.
Experiments that were not method-specific were performed in accordance with PNWD’s procedures QA-RPP-WTP-1101, “Scientific Investigations,” and QA-RPP-WTP-1201, “Calibration Control System,” ensuring that sufficient data were taken with properly calibrated measuring and test equipment (M&TE) to obtain quality results. As specified in Test Specification 24590-WTP-TSP-RT-03-010 Rev. 0, “Pulse Jet Mixer Gas Hold-Up and Release Testing,” BNI’s QAPjP, PL-24590-QA-00001, was not applicable because the work was not performed in support of environmental/regulatory testing, and the data will not be used as such. PNWD addresses internal verification and validation activities by conducting an Independent Technical Review of the final data in accordance with PNWD’s procedure QA-RPP-WTP-604. This review verifies that the reported results are traceable, that inferences and conclusions are soundly based, and the reported work satisfies the Test Plan objectives. This review procedure is part of PNWD’s WTPSP Quality Assurance Requirements and Description Manual.
CCN 066843 (Sherwood 2003). Execution Strategy for Research & Technology Department Pretreatment Integration Program.
Not stated
WSRC-TR-2001-00252 (SRT-RPP-2001-00068) (Schumacher et al. 2002) Final Report for Crucible Scale Vitrification of Waste Envelope D (C-106).
The preparation of the individual HLW feed streams (cesium eluates and sludge powder) was documented in a previous status report document,(a) and all details concerning weights, compositions, and techniques were included. A basic review of these feed preparation steps will be presented in this report. The original data sheets and procedures can be found in WSRC Laboratory Notebooks.(b,c,d)
E.19
SCT-M0SRLE60-00-154-06, REV 00B; -154-06 REV 00C (cleared) (WSRC-TR-2003-00212, Rev. 0) (SRT-RPP-2003-0094, Rev. 0) (Stone et al. 2003). Waste Feed Evaporation: Physical Properties and Solubility Determination.
This work was conducted in accordance with the RPP_WTP Quality Assurance requirements specified for work conducted by SRTC as identified in DOE IWO MOSRLE60. Researchers followed the WSRC QA program, which has been approved by WTP, and the WSRC QA Management Plan (WSRC-RP-92-225). The program applied the appropriate QA requirements for this task, as indicated by the QA Plan Checklist in section IX of the Task Technical and Quality Assurance Plan. Analytical sample labeling and tracking complied with established procedures (WSRC Manual L1, Procedure 7.15). The SRTC Analytical Development Section (ADS) conducted all analyses using the routine level QA program. The Task Technical & QA Plan provided the quality requirements for this work. NQA-! 1989, part 1, Basic and Supplementary Requirements and NQA-2a 1990, Part 2.7 were applied as appropriate.
E.20
SCT-M0SRLE60-00-110-00023, REV 00A (WSRC-TR-2003-00547, Rev. 0) (SRT-RPP-2003-00240, Rev. 0) (Zamecnik et al. 2004). Tank 241-AY-102 Simulant Development, Ultrafiltration, and Washing.
1.4 QUALITY REQUIREMENTS The following quality assurance requirements were specified in the Task Plan.1 Researchers will follow the WSRC Quality Assurance Program, which has been approved by WTP, and the WSRC Quality Assurance Management Plan (WSRC-RP-92-225). Tests will be performed in accordance with the following quality assurance requirements established in NQA-1 (1989) and NQA-2a (1990) Subpart 2.7 as indicated by the QA Plan Checklist in Section VIII. This task will not generate data that will be used for environmental regulatory purposes. Therefore, per the "Quality Assurance Project Plan (QAPjP) for Testing Programs Generating Environmental Regulatory Data", PL-24590-QA00001, Rev. 0, the quality control (QC) for analytical data specified in the aforementioned QAPjP are not applicable. Thus, an exception to the QC specified in the Test Specifications (“AY-102/C-106 Simulant Ultrafiltration and Washing Test Specification”, 24590-PTF-TSP-RT-02-009, Rev 01 and “AY-102/C-106 Simulant Definition Test Specification”, 24590-WTP-TSP-RT-02-009, Rev 02) will be taken and the following analytical protocol will be followed for this task. The determination of the non-applicability of this work for environmental regulatory purposes and the approach to institute quality controls as specified below was agreed to by the RPPWTP customer (Washington Group International). SRTC personnel will conduct this filtration activity in accordance with this approved Task Technical and QA plan. The additional RW-0333P, rev. 10 QA requirements do not apply to this task. Measuring and test equipment used in the course of this task complied with the SRTC QA program as delineated in the Task Plan.1 A list of the M&TE used in the ultrafiltration section is in lab notebook WSRC-NB-2003-00190.2 Simulant development data was recorded in laboratory notebooks WSRC-NB-2003-00085, -00137, -00174, and -00229. 1.4.1 Analytical Quality Assurance Analyses will be provided by SRTC’s Analytical Development Section (ADS) on a "Routine" QA/QC level. Routine Level is for general R&D support. ADS maintains a written method or instrument procedure for all Routine Level analyses, and the results for most methods are recorded in LIMS. Quality Control (QC) is addressed through ADS’s Measurement Control Program (MCP) for analytical services. Quality Control data is routinely tracked and evaluated. The ADS Quality Control (QC) program tracks long term system performance of the Measurement Systems. These systems include instruments, standards and personnel (laboratory technicians and chemists). These records are available and auditable, but will not be submitted with sample analysis results evaluated. The ADS Quality Control (QC) program tracks long term system performance of the Measurement Systems. These systems include instruments, standards and personnel (laboratory technicians and chemists). These records are available and auditable, but will not be submitted with sample analysis results.
(a) R. F. Schumacher, C. L. Crawford, and N. E. Bibler, Status Report for Crucible Scale Vitrification of Waste Envelope D (C-106). SRT-RPP-2001-00003, January 2001.
(b) Laboratory Notebook WSRC-NB-2000-00159, BNFL Part B.1, D Envelope, Vol. 1. (c) Laboratory Notebook WSRC-NB-2000-00160, BNFL Part B.1, D Envelope, Vol. 2. (d) Laboratory Notebook WSRC-NB-2001-00106, RPP Part B.1, D Envelope, Vol. 3.
PNWD-3675 WTP-RPT-112, Rev. 0
Distr. 1
Distribution List No of Copies OFFSITE
No of Copies ONSITE
1 Savannah River National Laboratory Richard Edwards Savannah River National Laboratory Westinghouse SA Aiken, SC 29808-0001
10 Battelle—Pacific Northwest Division O. P. Bredt P7-25 D. E. Kurath P7-28 A. P. Poloski P7-25 G. L. Smith H4-02 H. D. Smith K6-24 J. D. Vienna K6-24 Project Office (2) P7-28 Information Release (2) K1-06
9 Bechtel National, Inc.
S. M. Barnes H4-02 C. Corriveau H4-02 A. Dada H4-02 J. F. Howell H4-02 D. E. Larson H4-02 I. Papp H4-02 J. Talbott (2) H4-02 T. Valentino H4-02
Related Documents