Tables Flood Duration Peak Flow Start # of emp freq emp freq emp freq Type Duration (days) Magnitude (cms) Season occur. 1 or more 2 or more 3 or more S1 short < 7 small to med < 100 All seasons 278 0.91 0.72 0.54 S2 short < 7 large 100-400 Fall to Early Spring 31 0.29 0.03 0.00 M1 medium 7-20 small to med < 100 Winter to Late Spring 42 0.33 0.09 0.01 M2 medium 7-20 large 100-400 Winter 44 0.36 0.07 0.02 M3 medium 7-20 very large > 400 Fall to Winter 5 0.05 0.00 0.00 L1 long 21-70 small to med < 100 Early Spring 20 0.18 0.02 0.00 L2 long 21-70 large 100-400 Winter to Early Spring 31 0.28 0.04 0.00 L3 long 21-70 very large > 400 Winter 12 0.11 0.01 0.00 V2 very long > 70 large 100-400 Winter to Early Spring 10 0.10 0.00 0.00 V3 very long > 70 very large > 400 Winter to Early Spring 6 0.06 0.00 0.00 2 or 3 large-very large > 100 139 0.66 0.47 0.22 3 very large > 400 23 0.21 0.02 0.00 L or V long- very long > 20 79 0.58 0.22 0.00 V very long >70 16 0.16 0.00 0.00 ALL 479 0.94 0.88 0.83 Table 1. Nine flood types of the Cosumnes River and each respective duration, magnitude, timing, and empirical frequency in any given year. Figs. Page 1 Draft MS submitted to San Francisco Estuary & Watershed Science

Welcome message from author
This document is posted to help you gain knowledge. Please leave a comment to let me know what you think about it! Share it to your friends and learn new things together.
Transcript
Tables
Flood Duration Peak Flow Start # of emp freq emp freq emp freq Type
Duration (days)
Magnitude (cms) Season occur. 1 or more 2 or more 3 or more
S1 short < 7 small to med < 100 All seasons 278 0.91 0.72 0.54
S2 short < 7 large 100-400 Fall to Early Spring 31 0.29 0.03 0.00
M1 medium 7-20 small to med < 100 Winter to Late
Spring 42 0.33 0.09 0.01
M2 medium 7-20 large 100-400 Winter 44 0.36 0.07 0.02
M3 medium 7-20 very large > 400 Fall to Winter 5 0.05 0.00 0.00
L1 long 21-70 small to med < 100 Early Spring 20 0.18 0.02 0.00
L2 long 21-70 large 100-400 Winter to Early Spring 31 0.28 0.04 0.00
L3 long 21-70 very large > 400 Winter 12 0.11 0.01 0.00
V2 very long > 70 large 100-400 Winter to Early Spring 10 0.10 0.00 0.00
V3 very long > 70 very large > 400 Winter to Early Spring 6 0.06 0.00 0.00
2 or 3 large-very large > 100 139 0.66 0.47 0.22
3 very large > 400 23 0.21 0.02 0.00
L or V long-very long > 20 79 0.58 0.22 0.00
V very long >70 16 0.16 0.00 0.00
ALL 479 0.94 0.88 0.83
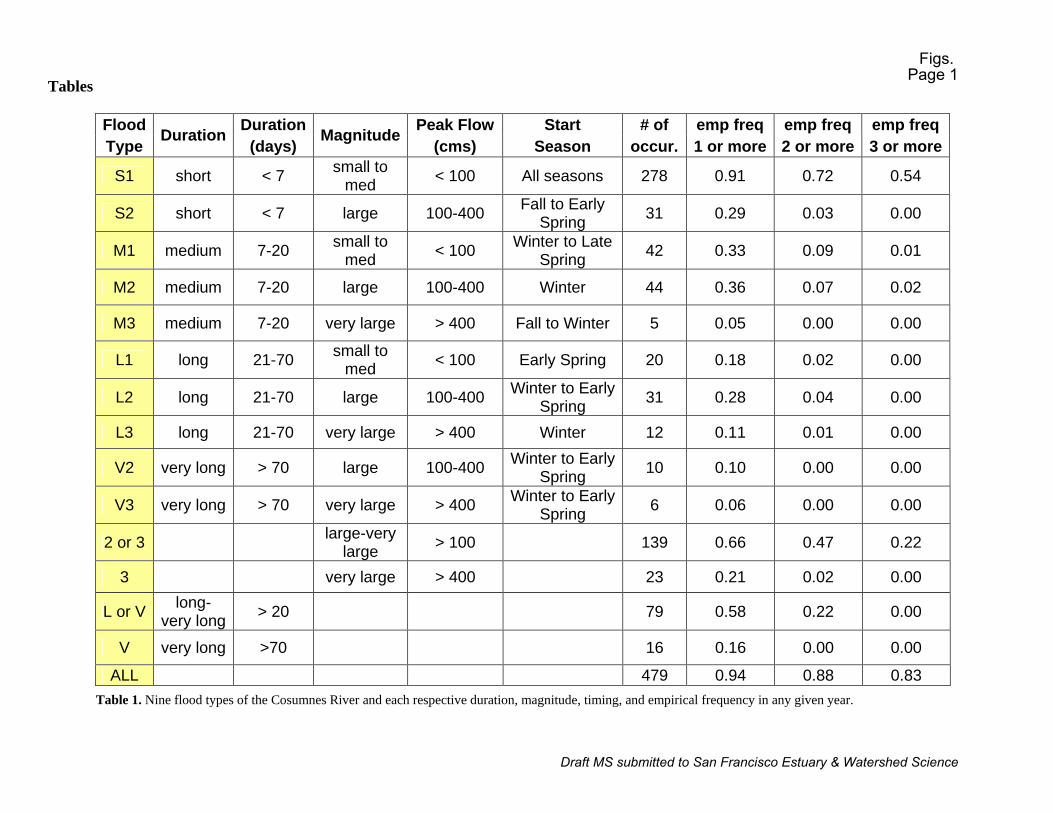
Table 1. Nine flood types of the Cosumnes River and each respective duration, magnitude, timing, and empirical frequency in any given year.
Figs. Page 1
Draft MS submitted to San Francisco Estuary & Watershed Science
Water Year Type
# of occurrences empirical frequency
WYT-1 32 0.33 WYT-2 15 0.15 WYT-3 10 0.10 WYT-4 20 0.20 WYT-5 7 0.07 WYT-6 5 0.05 WYT-7 4 0.04 WYT-8 5 0.05
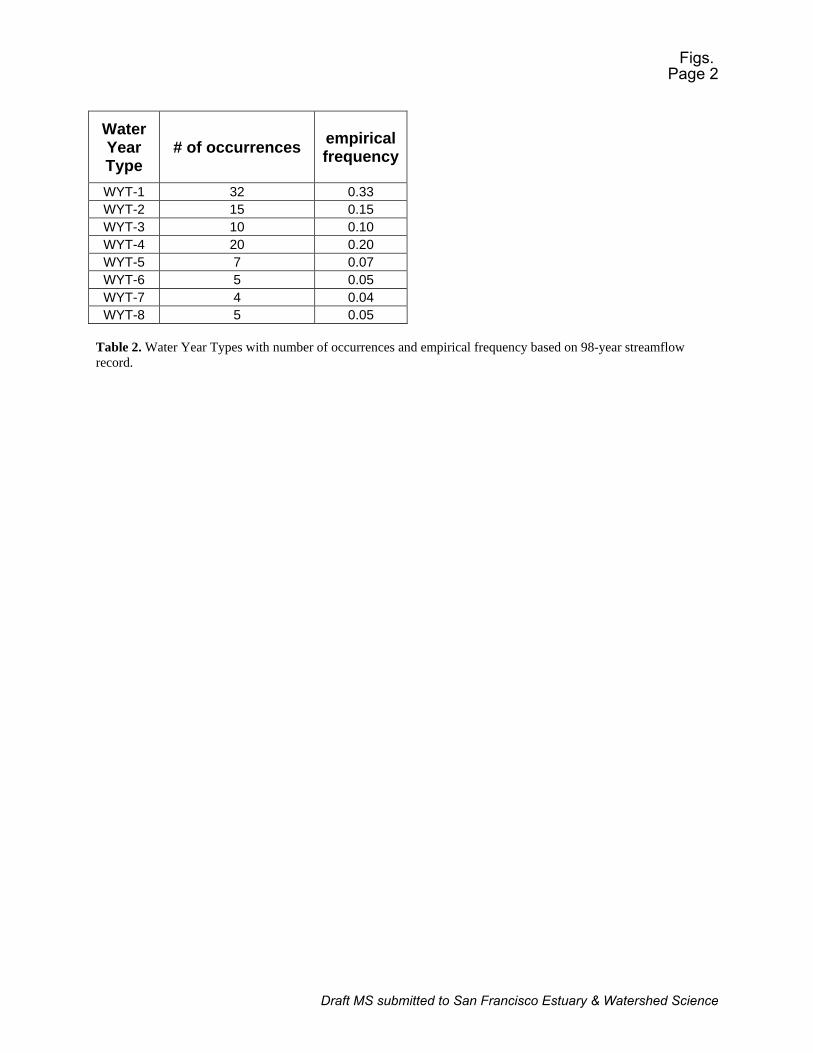
Table 2. Water Year Types with number of occurrences and empirical frequency based on 98-year streamflow record.
Figs. Page 2
Draft MS submitted to San Francisco Estuary & Watershed Science
Figures
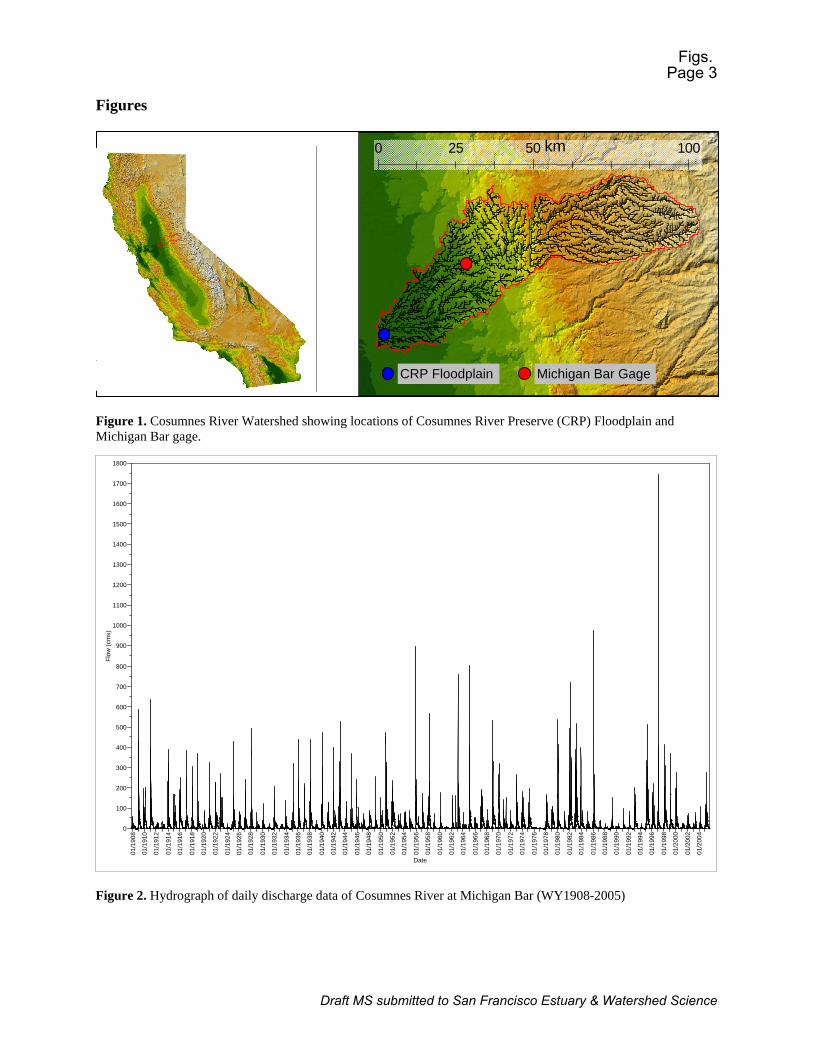
Figure 1. Cosumnes River Watershed showing locations of Cosumnes River Preserve (CRP) Floodplain and Michigan Bar gage.
0
100
200
300
400
500
600
700
800
900
1000
1100
1200
1300
1400
1500
1600
1700
1800
Flo
w (
cms)
01/1
908
01/1
910
01/1
912
01/1
914
01/1
916
01/1
918
01/1
920
01/1
922
01/1
924
01/1
926
01/1
928
01/1
930
01/1
932
01/1
934
01/1
936
01/1
938
01/1
940
01/1
942
01/1
944
01/1
946
01/1
948
01/1
950
01/1
952
01/1
954
01/1
956
01/1
958
01/1
960
01/1
962
01/1
964
01/1
966
01/1
968
01/1
970
01/1
972
01/1
974
01/1
976
01/1
978
01/1
980
01/1
982
01/1
984
01/1
986
01/1
988
01/1
990
01/1
992
01/1
994
01/1
996
01/1
998
01/2
000
01/2
002
01/2
004
Date
Figure 2. Hydrograph of daily discharge data of Cosumnes River at Michigan Bar (WY1908-2005)
Michigan Bar Gage CRP Floodplain
0 50 10025 km
Figs. Page 3
Draft MS submitted to San Francisco Estuary & Watershed Science
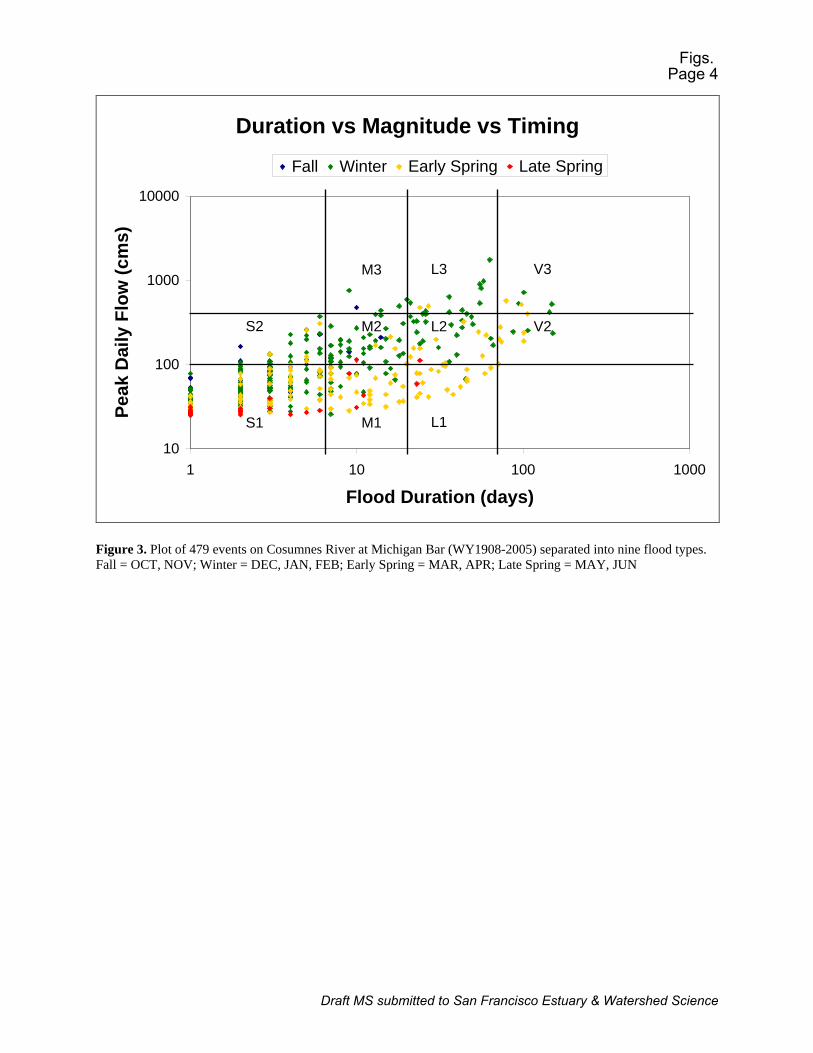
Duration vs Magnitude vs Timing
10
100
1000
10000
1 10 100 1000
Flood Duration (days)
Pea
k D
aily
Flo
w (
cms)
Fall Winter Early Spring Late Spring
S1
S2
M1
M2
M3
L1
L2
L3
V2
V3
Figure 3. Plot of 479 events on Cosumnes River at Michigan Bar (WY1908-2005) separated into nine flood types. Fall = OCT, NOV; Winter = DEC, JAN, FEB; Early Spring = MAR, APR; Late Spring = MAY, JUN
Figs. Page 4
Draft MS submitted to San Francisco Estuary & Watershed Science
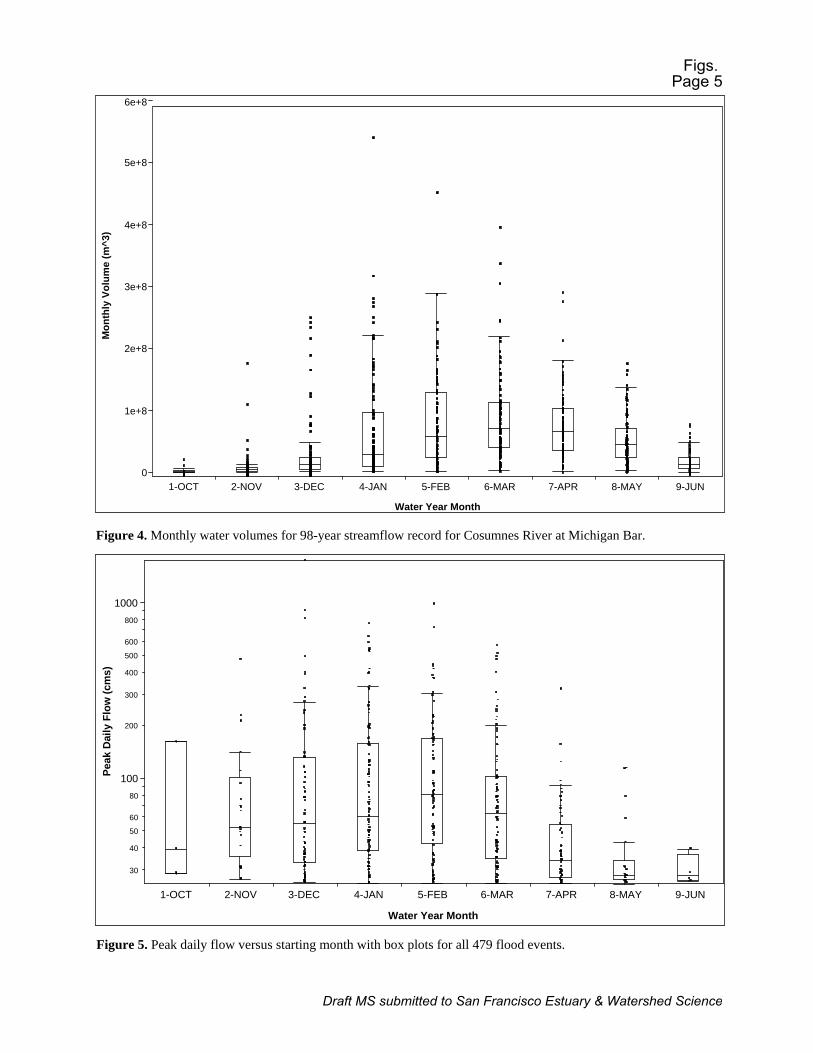
Mo
nth
ly V
olu
me
(m^3
)
0
1e+8
2e+8
3e+8
4e+8
5e+8
6e+8
1-OCT 2-NOV 3-DEC 4-JAN 5-FEB 6-MAR 7-APR 8-MAY 9-JUN
Water Year Month
Figure 4. Monthly water volumes for 98-year streamflow record for Cosumnes River at Michigan Bar.
Pea
k D
aily
Flo
w (
cms)
100
80
60
50
40
30
1000
800
600
500
400
300
200
1-OCT 2-NOV 3-DEC 4-JAN 5-FEB 6-MAR 7-APR 8-MAY 9-JUN
Water Year Month
Figure 5. Peak daily flow versus starting month with box plots for all 479 flood events.
Figs. Page 5
Draft MS submitted to San Francisco Estuary & Watershed Science
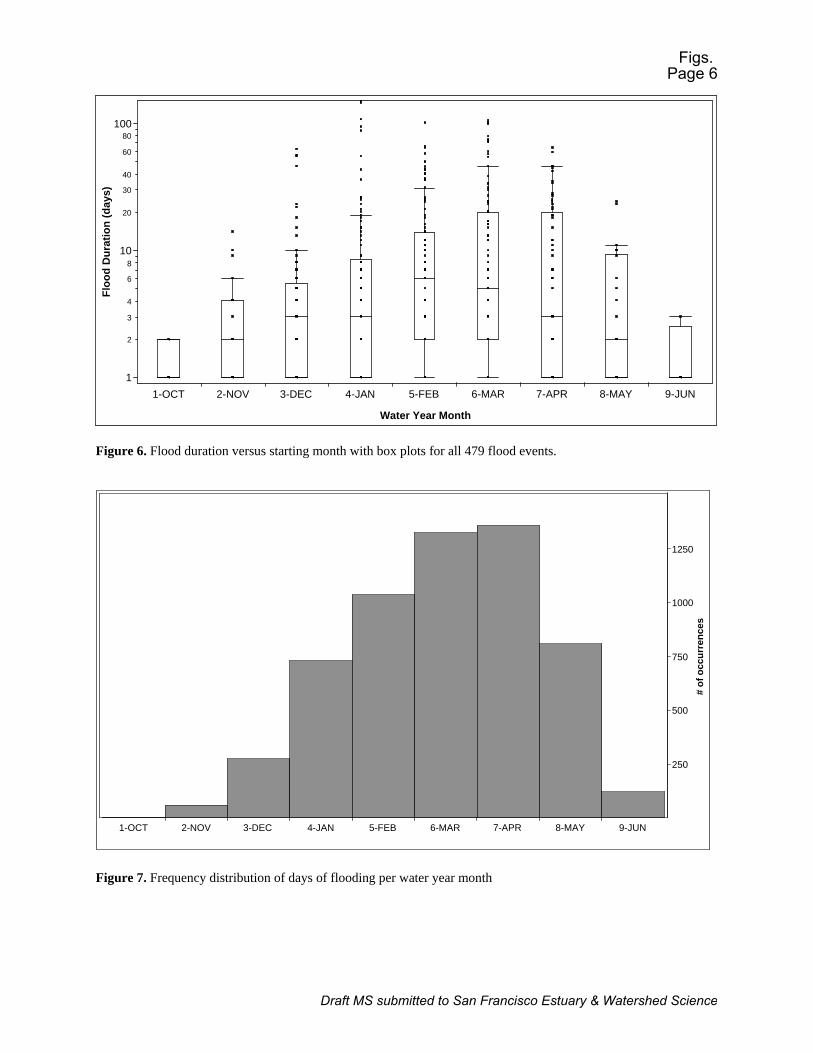
Flo
od
Du
rati
on
(d
ays)
1
108
6
4
3
2
10080
60
40
30
20
1-OCT 2-NOV 3-DEC 4-JAN 5-FEB 6-MAR 7-APR 8-MAY 9-JUN
Water Year Month
Figure 6. Flood duration versus starting month with box plots for all 479 flood events.
250
500
750
1000
1250
# o
f o
ccu
rren
ces
1-OCT 2-NOV 3-DEC 4-JAN 5-FEB 6-MAR 7-APR 8-MAY 9-JUN
Figure 7. Frequency distribution of days of flooding per water year month
Figs. Page 6
Draft MS submitted to San Francisco Estuary & Watershed Science
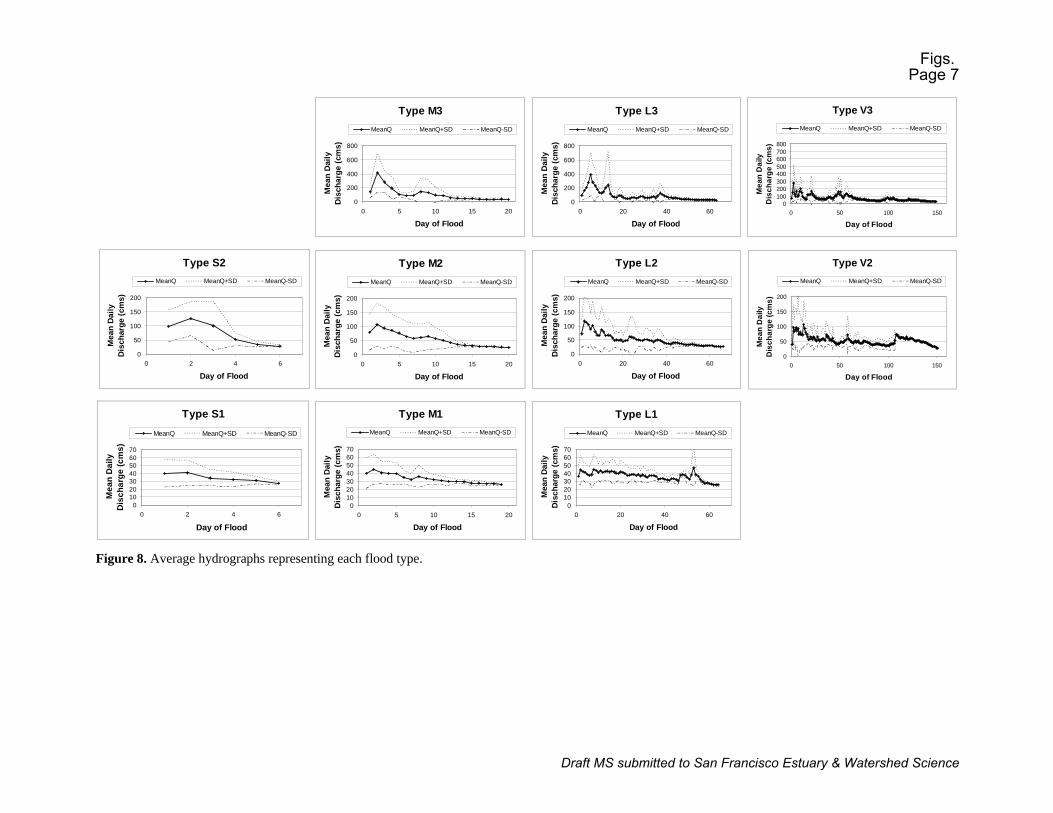
Figure 8. Average hydrographs representing each flood type.
Type S1
010203040506070
0 2 4 6
Day of Flood
Mea
n D
aily
D
isch
arg
e (c
ms)
MeanQ MeanQ+SD MeanQ-SD
Type S2
0
50
100
150
200
0 2 4 6
Day of Flood
Mea
n D
aily
D
isch
arge
(cm
s)
MeanQ MeanQ+SD MeanQ-SD
Type M1
010203040506070
0 5 10 15 20
Day of Flood
Mea
n D
aily
D
isch
arg
e (c
ms)
MeanQ MeanQ+SD MeanQ-SD
Type M2
0
50
100
150
200
0 5 10 15 20
Day of Flood
Mea
n D
aily
D
isch
arge
(cm
s)
MeanQ MeanQ+SD MeanQ-SD
Type M3
0
200
400
600
800
0 5 10 15 20
Day of Flood
Mea
n D
aily
D
isch
arg
e (c
ms)
MeanQ MeanQ+SD MeanQ-SD
Type L1
010203040506070
0 20 40 60
Day of Flood
Mea
n D
aily
D
isch
arg
e (c
ms)
MeanQ MeanQ+SD MeanQ-SD
Type L2
0
50
100
150
200
0 20 40 60
Day of Flood
Mea
n D
aily
D
isch
arg
e (c
ms)
MeanQ MeanQ+SD MeanQ-SD
Type L3
0
200
400
600
800
0 20 40 60
Day of Flood
Mea
n D
aily
D
isch
arg
e (c
ms)
MeanQ MeanQ+SD MeanQ-SD
Type V2
0
50
100
150
200
0 50 100 150
Day of Flood
Mea
n D
aily
D
isch
arg
e (c
ms)
MeanQ MeanQ+SD MeanQ-SD
Type V3
0100200300400500600700800
0 50 100 150
Day of Flood
Mea
n D
aily
D
isch
arg
e (c
ms)
MeanQ MeanQ+SD MeanQ-SD
Figs. Page 7
Draft MS submitted to San Francisco Estuary & Watershed Science
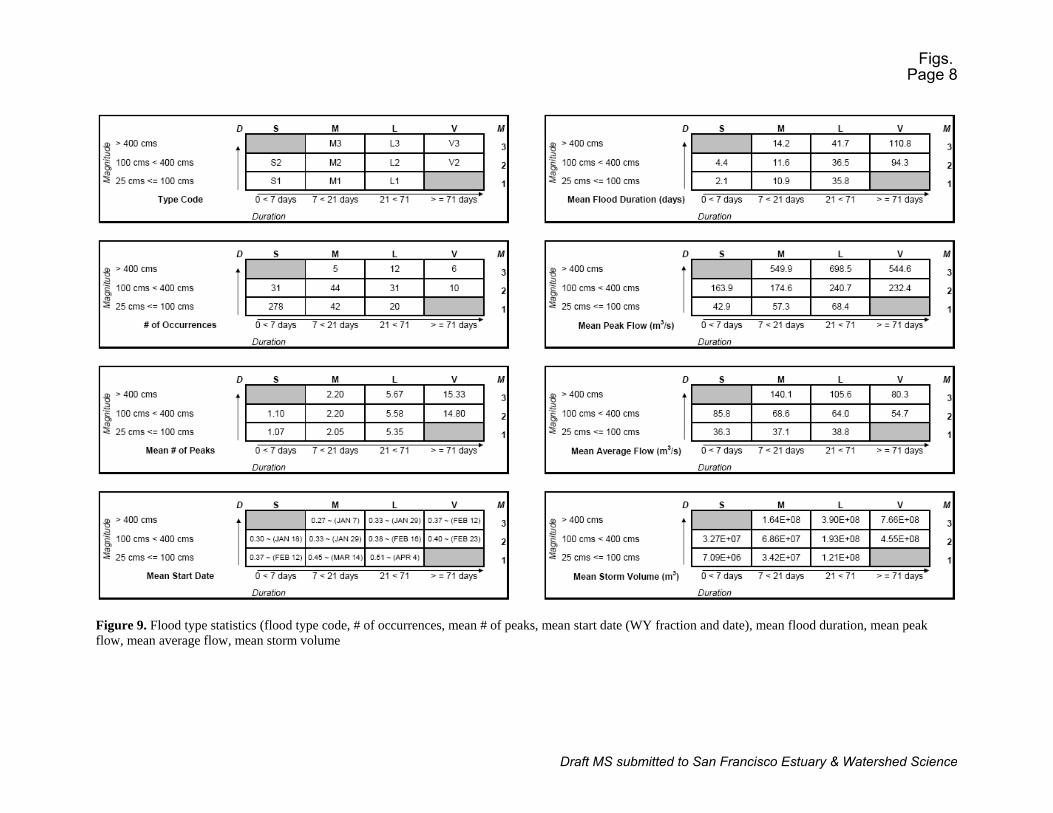
Figure 9. Flood type statistics (flood type code, # of occurrences, mean # of peaks, mean start date (WY fraction and date), mean flood duration, mean peak flow, mean average flow, mean storm volume
Figs. Page 8
Draft MS submitted to San Francisco Estuary & Watershed Science
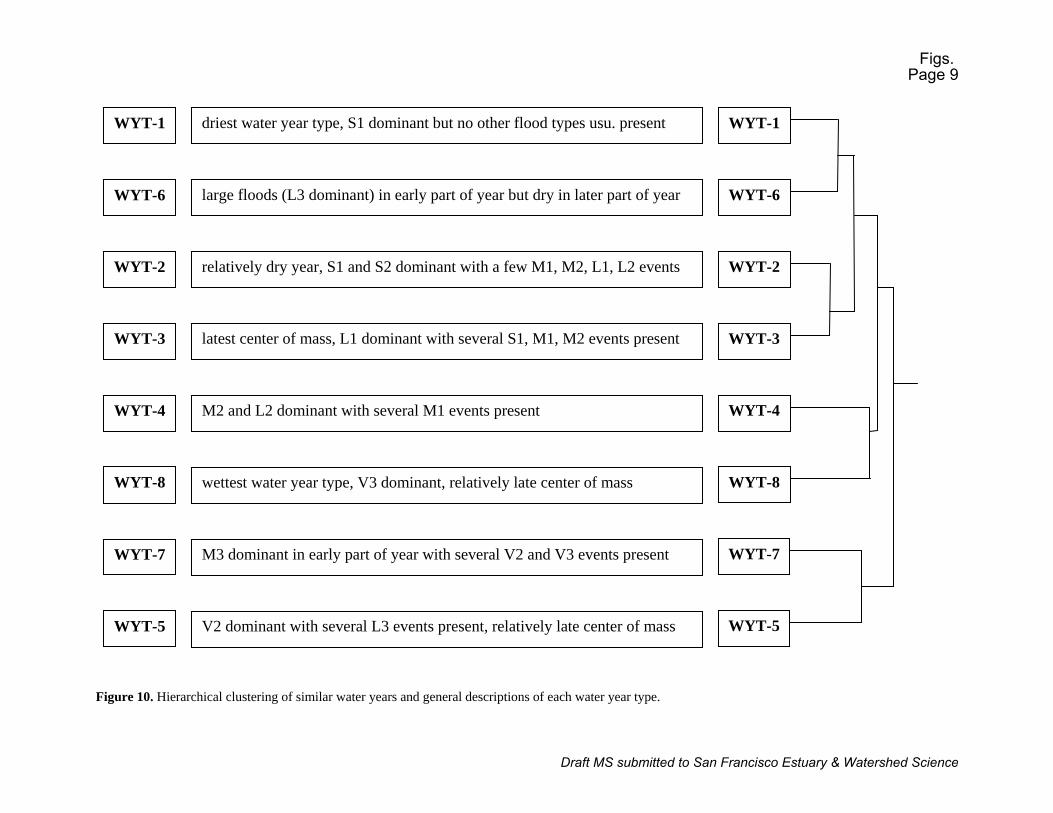
Figure 10. Hierarchical clustering of similar water years and general descriptions of each water year type.
WYT-5
WYT-7
WYT-3
WYT-4
WYT-8
WYT-2
WYT-6
WYT-1
WYT-2
WYT-6
WYT-1
WYT-3
WYT-4
WYT-8
WYT-5
WYT-7
driest water year type, S1 dominant but no other flood types usu. present
large floods (L3 dominant) in early part of year but dry in later part of year
relatively dry year, S1 and S2 dominant with a few M1, M2, L1, L2 events
latest center of mass, L1 dominant with several S1, M1, M2 events present
M2 and L2 dominant with several M1 events present
wettest water year type, V3 dominant, relatively late center of mass
M3 dominant in early part of year with several V2 and V3 events present
V2 dominant with several L3 events present, relatively late center of mass
Figs. Page 9
Draft MS submitted to San Francisco Estuary & Watershed Science
tota
l an
nu
al w
ater
vo
lum
e (k
m^3
)
0
0.2
0.4
0.6
0.8
1
1.2
1.4
1.6
WYT-1 WYT-2 WYT-3 WYT-4 WYT-5 WYT-6 WYT-7 WYT-8
Water Year Type
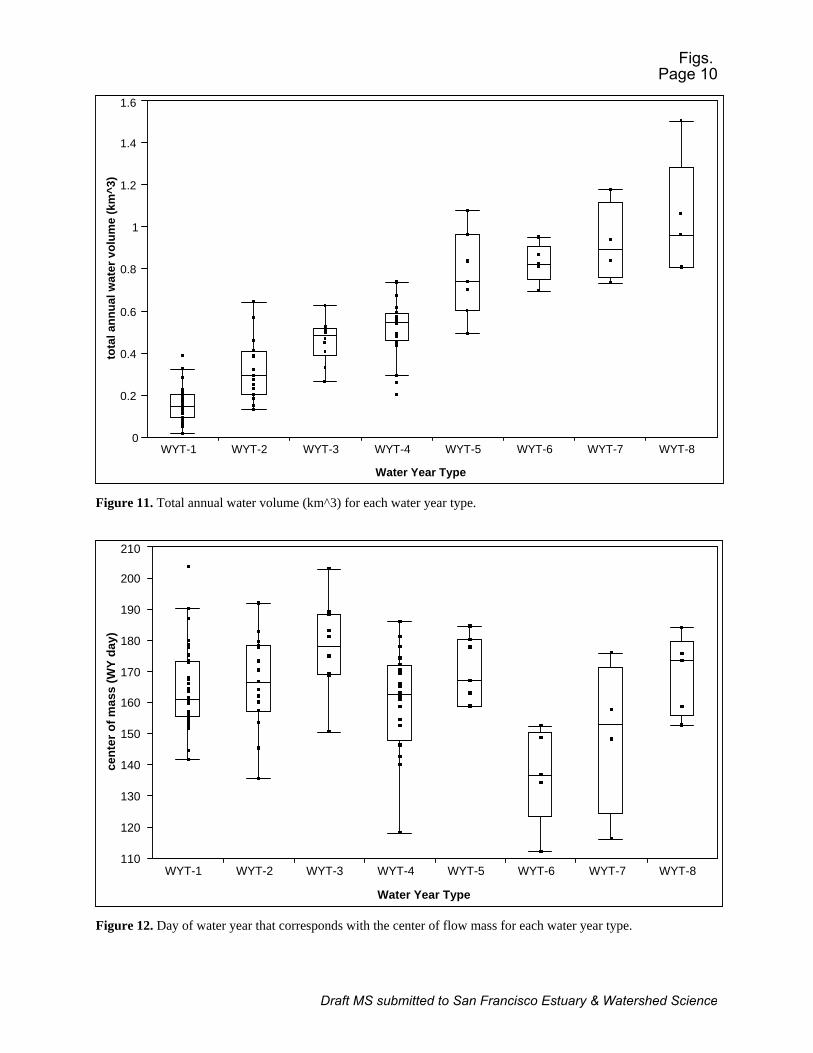
Figure 11. Total annual water volume (km^3) for each water year type.
cen
ter
of
mas
s (W
Y d
ay)
110
120
130
140
150
160
170
180
190
200
210
WYT-1 WYT-2 WYT-3 WYT-4 WYT-5 WYT-6 WYT-7 WYT-8
Water Year Type
Figure 12. Day of water year that corresponds with the center of flow mass for each water year type.
Figs. Page 10
Draft MS submitted to San Francisco Estuary & Watershed Science
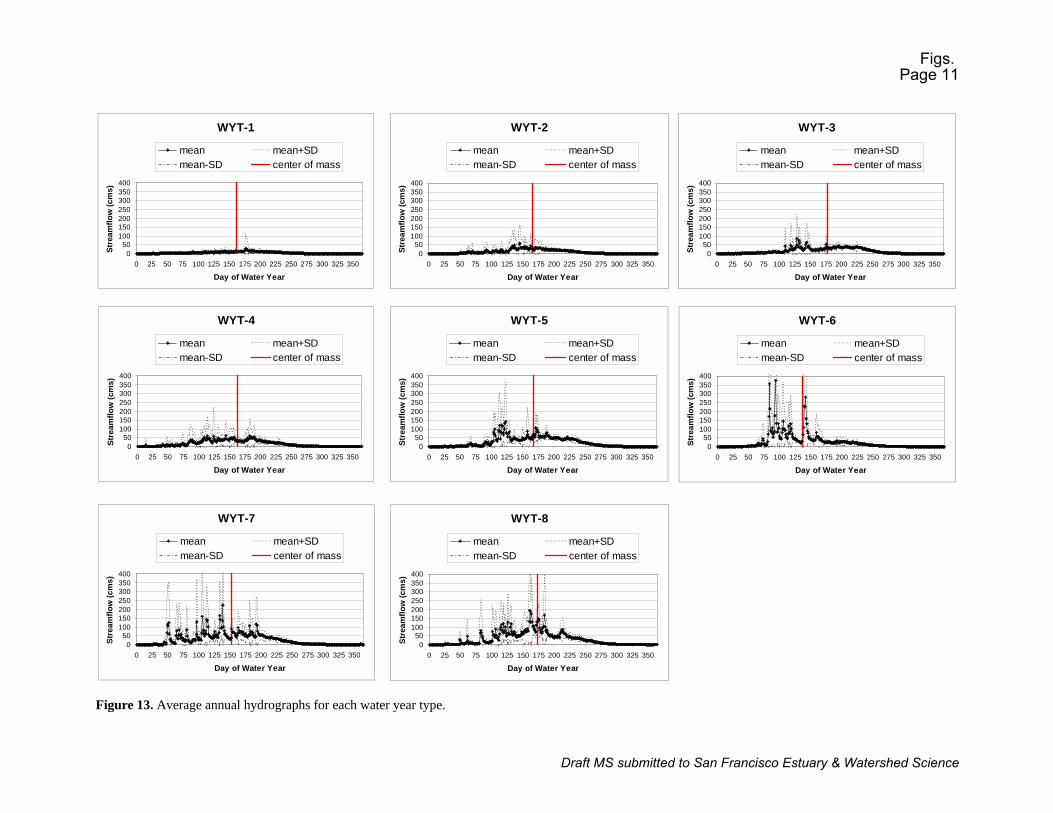
Figure 13. Average annual hydrographs for each water year type.
WYT-1
050
100150200250300350400
0 25 50 75 100 125 150 175 200 225 250 275 300 325 350
Day of Water Year
Str
eam
flo
w (
cms)
mean mean+SDmean-SD center of mass
WYT-2
050
100150200250300350400
0 25 50 75 100 125 150 175 200 225 250 275 300 325 350
Day of Water Year
Str
eam
flo
w (
cms)
mean mean+SDmean-SD center of mass
WYT-3
050
100150200250300350400
0 25 50 75 100 125 150 175 200 225 250 275 300 325 350
Day of Water Year
Str
eam
flo
w (
cms)
mean mean+SDmean-SD center of mass
WYT-4
050
100150200250300350400
0 25 50 75 100 125 150 175 200 225 250 275 300 325 350
Day of Water Year
Str
eam
flo
w (
cms)
mean mean+SDmean-SD center of mass
WYT-5
050
100150200250300350400
0 25 50 75 100 125 150 175 200 225 250 275 300 325 350
Day of Water Year
Str
eam
flo
w (
cms)
mean mean+SDmean-SD center of mass
WYT-6
050
100150200250300350400
0 25 50 75 100 125 150 175 200 225 250 275 300 325 350
Day of Water Year
Str
eam
flo
w (
cms)
mean mean+SDmean-SD center of mass
WYT-7
050
100150200250300350400
0 25 50 75 100 125 150 175 200 225 250 275 300 325 350
Day of Water Year
Str
eam
flo
w (
cms)
mean mean+SDmean-SD center of mass
WYT-8
050
100150200250300350400
0 25 50 75 100 125 150 175 200 225 250 275 300 325 350
Day of Water Year
Str
eam
flo
w (
cms)
mean mean+SDmean-SD center of mass
Figs. Page 11
Draft MS submitted to San Francisco Estuary & Watershed Science
Related Documents