p D0T-TSC-FRA-80-29 l FATIGUE CRACK GROWTH PROPERTIES OF RAIL STEELS D. Broek R. C . Rice BATTELLE Columbus Laboratories 505 King Avenue Columbus OH 43201 FINAL REPORT DOCUMENT IS AVAILABLE TO THE PUBLIC THROUGH THE NATIONAL TECHNICAL INFORMATION SERVICE, SPRINGFIELD, VIRGINIA 22161 Prepared for U.S, DEPARTMENT OF TRANSPORTATION FEDERAL RAILROAD ADMINISTRATION Office of Research and Development Washington DC 20590 01 -Track St Structures

Welcome message from author
This document is posted to help you gain knowledge. Please leave a comment to let me know what you think about it! Share it to your friends and learn new things together.
Transcript

pD0T-TSC-FRA-80-29
l
F A T I G U E C R A C K GRO W TH P R O P E R T I E S O F R A I L ST EELS
D. Broek R. C . Rice
BATTELLEColumbus Laboratories 505 King Avenue Columbus OH 43201
FINAL REPORT
D O C U M E N T IS A V A I L A B L E T O T H E P U B L IC T H R O U G H T H E N A T I O N A L T E C H N I C A L I N F O R M A T I O N S E R V IC E , S P R IN G F I E L D , V I R G I N I A 22161
Prepared forU.S, DEPARTMENT OF TRANSPORTATION FEDERAL RAILROAD ADMINISTRATION Office of Research and Development
Washington DC 20590
0 1 -T rack St Structures
NOTICE
This document is disseminated under the sponsorship of the Department of Transportation in the interest of information exchange. The United States Government assumes no liability for the contents or use thereof.
NOTICE
The United States Government does not endorse products or manufacturers. Trade of manufacturers' names appear herein solely because they are considered essential to the, object of this report.
#' . . -M:
T e c h n i c a l R e p o r t D o c u m e n t a t i o n P a g e
1 • R e p o r t N o .
D O T - T S C -FRA-80-29
2. G o v e r n m e n t A c c e s s i o n N o . 3 . R e c i p i e n t ' s C a t a l o g N o .
4 . T i t l e a n d S u b t i t l e
F A TIGUE C R A C K G R O W T H PROPERTIES OF RAIL STEELS
5 . R e p o r t D a t e
6 . P e r fo r m in g * O r g a n iz a t i o n C o d e
8 . P e r f o r m in g O r g a n iz a t i o n R e p o r t N o .
7. A u t h o r ( s )
D. Broek, R.C. Rice9 . P e r f o r m in g O r g a n iz a t i o n N a m e a n d A d d r e s s
B a t t e l e Columbus Laboratories 505 King A v e n u e Columbus, OH 43201
1 0. W ork U n i t N o . ( T R A I S )
RR119/R132211. C o n t r a c t o r G r a n t N o .
' D O T-TSC-1076T3. T y p e o f R e p o r t o n d P e r io d C o v e r e d
Final Report Jul y 75 - Ju l y 77
1 2. S p o n s o r i n g A g e n c y N o m e a n d A d d r e s s
D e partment of Transportation Federal Railroad Administration W a s h i n g t o n DC 20590 14. S p o n s o r in g A g e n c y C o d e
15. S u p p le m e n t a r y N o t e s
Under Contract to:Department of Transportation Transportation Systems Center Cambridge. M A 02142____________
1 6. A b s t r a c t
Fa t i g u e c r a c k propagation properties of rail steels w e r e d etermined experimentally. The investigation covered 66 rail steels. The effects of the following parameters were studies: stress ratio (ratio of m i n i m u m tom a x i m u m stress in a c y c l e ) , frequency, temperature and orientation. The results w e r e presented on the basis of the stress intensity factor. The threshold v a l u e of the stress intensity was determined. A n equation correlating the c r a c k g r o w t h ra t e and the stress intensity factor was established.
A limited, number of mixed m o d e crack gro w t h tests was conducted. Also the behavior of surface flaws was studied.
The results serve as a data bas e for a failure model p r e s e n t e d in D O T - T S C - F R A - 80-20
1 7 . K e y W o r d s
Rail, Cracks, Fatigue Crack Propagation Chemical Composition, Mechanical Properties, Mixed Mod e Loading, Surface Flaw's
1 9. S e c u r i t y C l o s s i f . ( o f t h i s re p o rt)
U n classified
18. D i s t r ib u t i o n S t a t e m e n t
D O C U M E N T I S A V A I L A B L E T O T H E P U B L I C
T H R O U G H T H E N A T I O N A L T E C H N I C A L I N F O R M A T I O N S E R V I C E , S P R I N G F I E L D ,
V I R G I N I A 2 2 1 6 1
2 0 . S e c u r i t y C l o s s i f . ( o f t h i s p a g e )
Unclassified21* N o . o f P a g e s 2 2 . P r i c e
Form D O T F 1700.7 (8-72) Reproduction of completed page authorized
PREFACE
This report presents the results of the second phase of a program on Rail Mate r i a l Failure Characterization. It has been prepared by Battelle's Columbus Laboratories (BCL) under Contract D0T-TSC-1076 for the Transportation Systems Center (TSC) of the Department of Transportation. The wo r k was conducted u nder the technical direction of Mr. Roger Steele of TSC.
The results of this phase of the program are the basis for the computational rail failure model described in part II of the final report. This model, in conjunction with the results of ongoing studies on Engineering Stress Analysis of Rails and on Wheel-Rail-Loads w h e n incorporated into a reliability analyses will enable establishment of safe inspection schedules.
The cooperation of the Amer i c a n Association of Railroads (AAR) and the various railroads (Boston & Maine Railroad Company, Chessie System, Denver and Rio Grande W estern Railroad Company, Penn Central Railroad Company, Southern Pacific Transportation Company, and Union Pacific Railroad Company) in acquiring rail samples is gratefully acknowledged. The cooperation and assistance of Mr. Roger Steele of TSC was of great value to the program.
METRIC CONVERSION FACTORS
Approximate Convetsionx to Metric Measures
jSymbol Whin You Know Multiply by To Find. Symbol — Z
at -iLENGTH -z
in inches *2.6 centimeters cmft feet 30 centimeters cm ■a —ryd yards 0.9 meters m -irr.i miles 1.6 kilometers km ■
• area — 1O* -in* square infihos 6.5 squaro centimeters cm1 -_7
ft2 square Icct 0.09 square meters m2va* square yards 0.6 square meter*' m2 -rri2 SC-ara miles 2.6 Square kilometers km2 -----acres 0.4 hectares ha
tn . ~MASS (weight) . -1
Ol ounces 28 grams 9 * —=lb pounds 0.45 kilogroms *9 1' _short tons 0.9 tonnes t ~(20C0 lb) *>
VOLUME ■
«P teaspoons 5 milliliters mltbsp tablespoons 15 milliliters ml -II Of fluid ounces 30 milliliters ml uc cups 0.24 liters 1 — ~zpi pints 0.47 liters 1 -Cl quarts 0.9S liters I —-cal gallons 3.5 tilers 1It2 cub*c Icct 0.03 ' cubic meters m2 -vC3 cubic yards 0.76 cubic meters m1 M
TEMPERATURE (exact) —z*r Fahrenheit 5/9 (alter Celsius *C — E
temperature subtracting temporatuvo _321 — -=
r,(4 tvoc'-v*. lii1 tif'd x'trfd io'"ro<s>y‘*s ,i,r<l <{<>!.1.||‘|| i.ib'vx, t.'jf K(tU Puiil. 22G. 5'Unix 1,1 6 ad V'.-nsv'i'V, P«ice 42.25. SO CJia: *1 Nl. 03.lu *’t»G. !T ■ ■ j.0 _
i— N Approximate Conversions from Metric Metsuress= N—— Symbol When Yon Know Multiply by To Find Symbol■5 N
LENGTH©04S mt> millimeters 0.04 inchesA cm centimeters ' ' 0.4* inches in=~ X m meters ■ 3.3 Icct ftH n m meters 1.1 yards ydkm kilometers 0.6 miles mi
t»n— ID AREA
Cff£ square contimeters 0.16 square inches In1U» m2 squsro meters 1.2 square yards yd’=== km2 square kilometers 0.4 squoremilos mi2ha hectares (10.000 m?) 2.5 acresO
MASS (weight)§i— r-r
0 grams 0.035 ounces othg kilograms 2.2 pounds lb— t tonnes (1000 kg) 1.1 shed Ions
VOLUMEo>ml milliliters 0.03 fluid ounces II 01rf= 00 1 liters 2.1 pints pt"* 1 liters i.oc quarts qt1 liters 0.26 gallons galir=-* m2 Cubic meters 35 cubic feet i.j-- m2 cubic meters 1.3 cubic yards Yd*40
p- TEMPERATURE (exact)T-k u* •c Celsius 9/5 (then Fohrenheit V
tomperature add-32) temperature-T=3]-—■ •F®F 32 98-6 212rri-- -40 0 140 60 120 160 200 1
Eo -40°Cr i , 1 —r -20 0 1 ! 1 20 l1
140 i 160 eo ioo #c

>
TABLE OF CONTENTS
1 I N T R O D U C T I O N ........................... 1
2 RAIL M A T E R I A L S . . ........... 2
3 E X PERIMENTAL D E T A I L S ............................. 3
3.1 Specimens..,........... 3
3.2 Testing P r o c e d u r e s ................................................... 13
4 D A T A P R O C E S S I N G AND D A T A P R E S E N T A T I O N ................................ 14
4.1 C r a c k Gro w t h R a t e s .............. 21
4.2 Stress Intensity F a c t o r s ........................... 24
5 TEST R E S U L T S ................................... 24
5.1 I n t r o d u c t i o n ........................................................... 24
5.2 E f fects of Stress R a t i o .......... 24
5.3 Specimen Orientation E f f e c t s ......... 28
5.4 T e m p erature E f f e c t s . ... ............................................. 31
5.5 . Frequency E f f e c t s ....................... 40
5.6 Threshold E x p e r i m e n t s .... ......................................... 40
5.7 Surface F l a w E x p e r i m e n t s ............................................ 40
6 MIXED M O D E ................................................ 52
6.1 Test R e s u l t s ..... ......... 56
6.2 The Principal Stress C r i t e r i o n ................................... 62
6.3 E n e r g y Related C r i t e r i a ................................. 68
6.4 A d e q u a c y o f C r i t e r i a .................. 70
7 THE CRACK GROWTH E Q U A T I O N . . ................................. 75
8 V A R I ABILITY IN C R A C K GROW T H B E H A V I O R ................................... 86
8.1 B asis for Statistical A n a l y s i s ................................... 86
Section Page
v

r ■>
TABLE OF CONTENTS (Continued)
8.2 Baseline Crack-Growth Data........ 87
8.3 Phase 2 Crack-Growth Data for R = 0.................... 91
8.4 Phase 2 Crack-Growth Data for R = 0.50....... 94
8.5 Correlation with Other Material Properties.............. 97
9 IMPLICATION FOR THE FAILURE MODEL........................... 105
10 REFERENCES..... ..... 108
APPENDIX A..................... A-l
APPENDIX B.............................................. B-l
APPENDIX C... .................... C-l
Section Page
LIST OF ILLUSTRATIONS
Figure P a g e
1. Compact T e n s i o n F a t i g u e C r a c k G r o w t h S p e c i m e n ...................... 5
2. S i n g l e-Edge N o t c h C r a c k G r o w t h S p e c i m e n .............................. 73.. S u r f a c e - F l a w C r a c k G r o w t h S p e c i m e n . ............................... 8
4. Mixed M o d e Specimen........................... 9
5. Mixed M o d e Test S e t u p ............................... 10
6. Orientation of S p e c i m e n s ..................... 11
7. C rack Pro p a g a t i o n G a u g e M o u n t e d o n CT S p e c i m e n . . . . ..... .......... 15
8. Three M odes of L o a d i n g ..................................... 16
9. Fatigue C r a c k P r o p a g a t i o n Rate Beha v i o r of 66 Rail Samples T e s t e d at R = 0. in the First P h a s e ofthe Present Program^ ’ ^ .................. . ............................. 19
10. Schematic Re p r e s e n t a t i o n of da/dN - K .................... 20
11. Bending Moment and Shear Force D i s t r i b u t i o nin M M S p e c i m e n s ......................... ........ ........ ................. 23
vi
* >'Xi_„ I
12. Crack G r o w t h Dat a at Room Temperature, LTDirection, R = 0, Different F r e q u e n c i e s .............................. 25
13. Crack G r o w t h Da t a at Room Temperature and R = -1,SEN S p e cimens in LT Direction,Frequency o f 4 - 40 H z . . . . . .............. ............................... 26
14. Crack G r o w t h Da t a at Room Temperature and R = 0.5,SEN Specimens in LT Direction,Frequency of 4 - 30 H z .......... ..................................... . .^ 27
15. B ands of D a t a V a r i a bility for LT OrientationRail Samples at Roo m T e m p e r a t u r e ...... ........................ ....... 29
16. B a n d s of Da t a Var i a b i l i t y for LT Orientation Rail Samples a t R o o m Temperature W h e n P l o t t e dVersus M a x i m u m Stress I n t e n s i t y ......................................... 30
17. C r a c k G r o w t h Dat a at Ro o m Temperature and R = 0,CT Specimens in TL Direction, Frequency of 40 H z ......... ......... 32
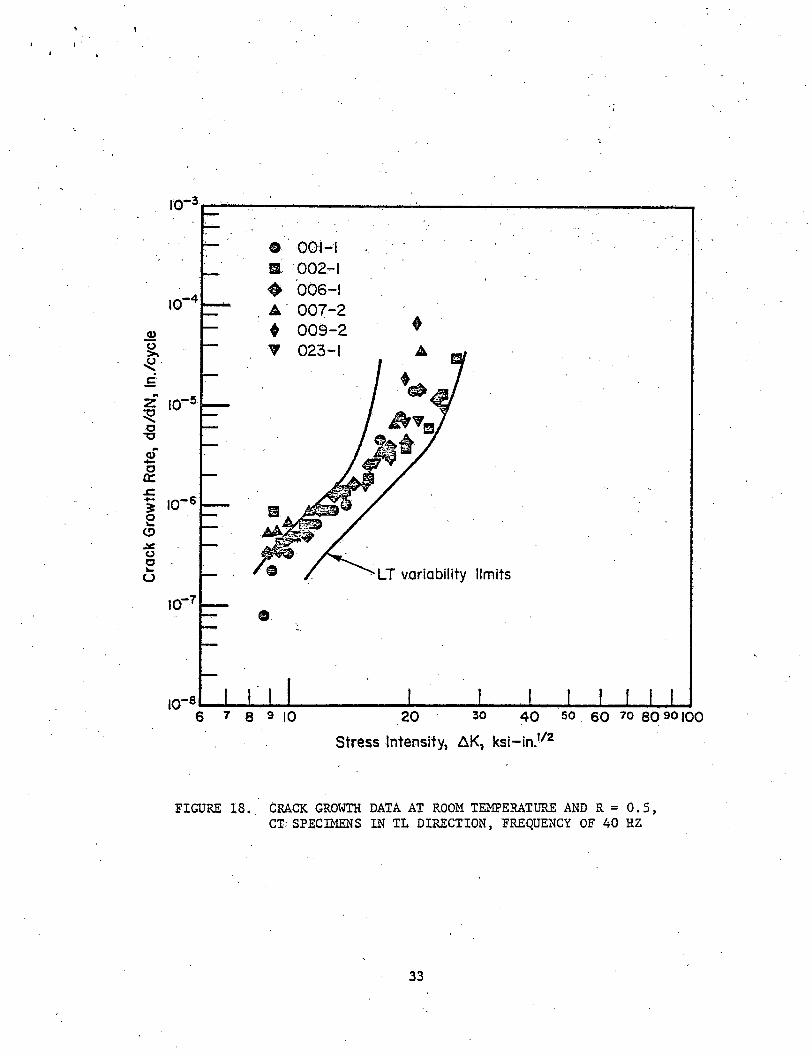
18. C rack Gro w t h Data at Ro o m Temperature and R = 0 . 5 ,CT Specimens in TL Direction, Frequency of 40 H z .................. 33
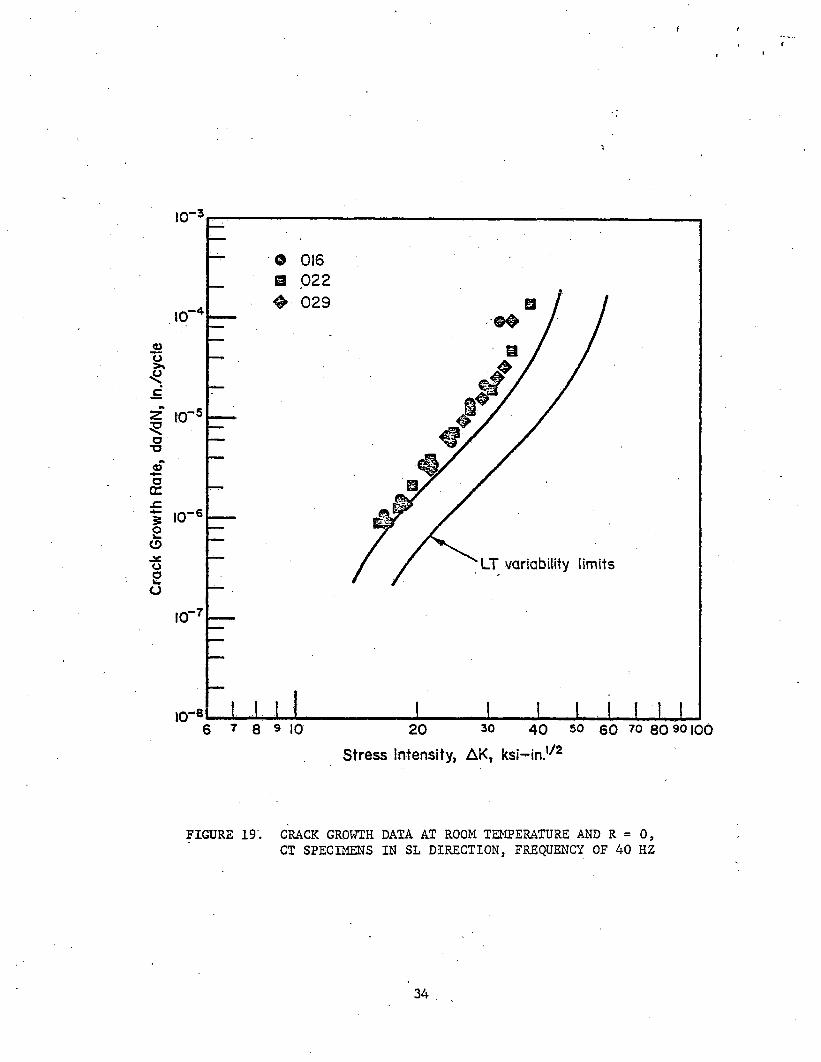
19. Crack G r o w t h Data at Room Temperature and R = o ,CT Specimens in SL Direction, Frequency of 40 H z ................. . 34
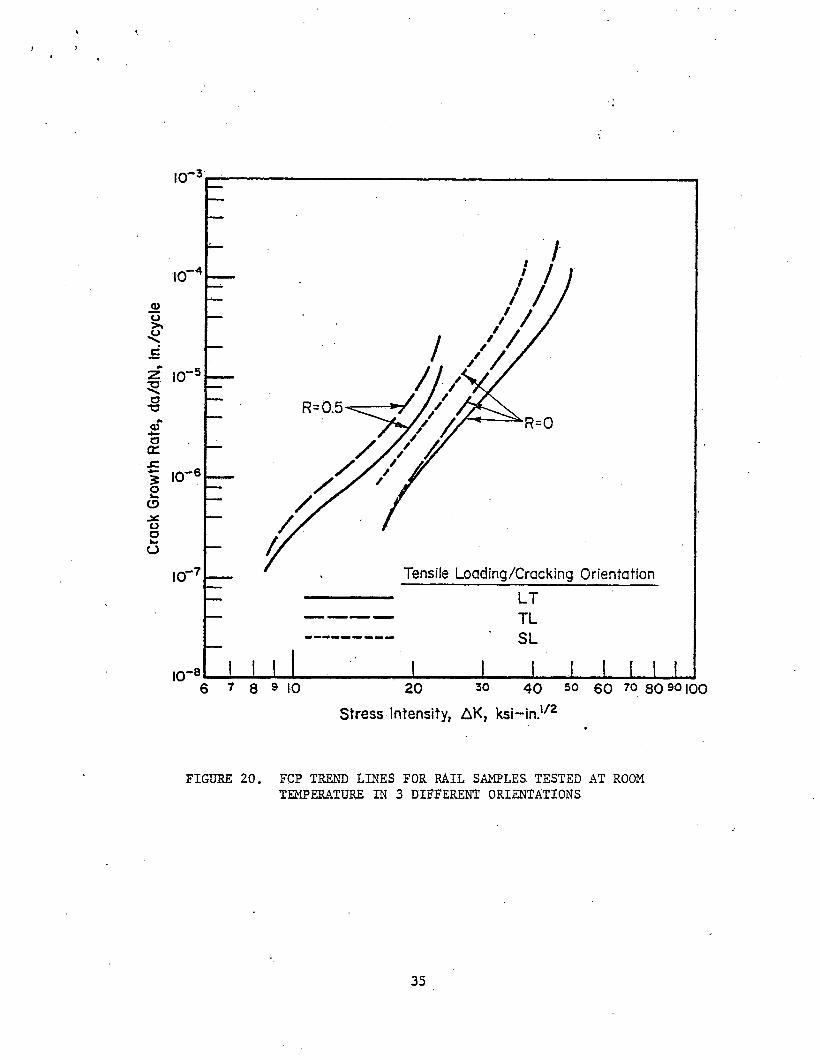
20. FCP Trend Lines for Rail Samples Tested at Ro o mTem p e r a t u r e in 3 Different O r i e n t a t i o n s .............................. 35
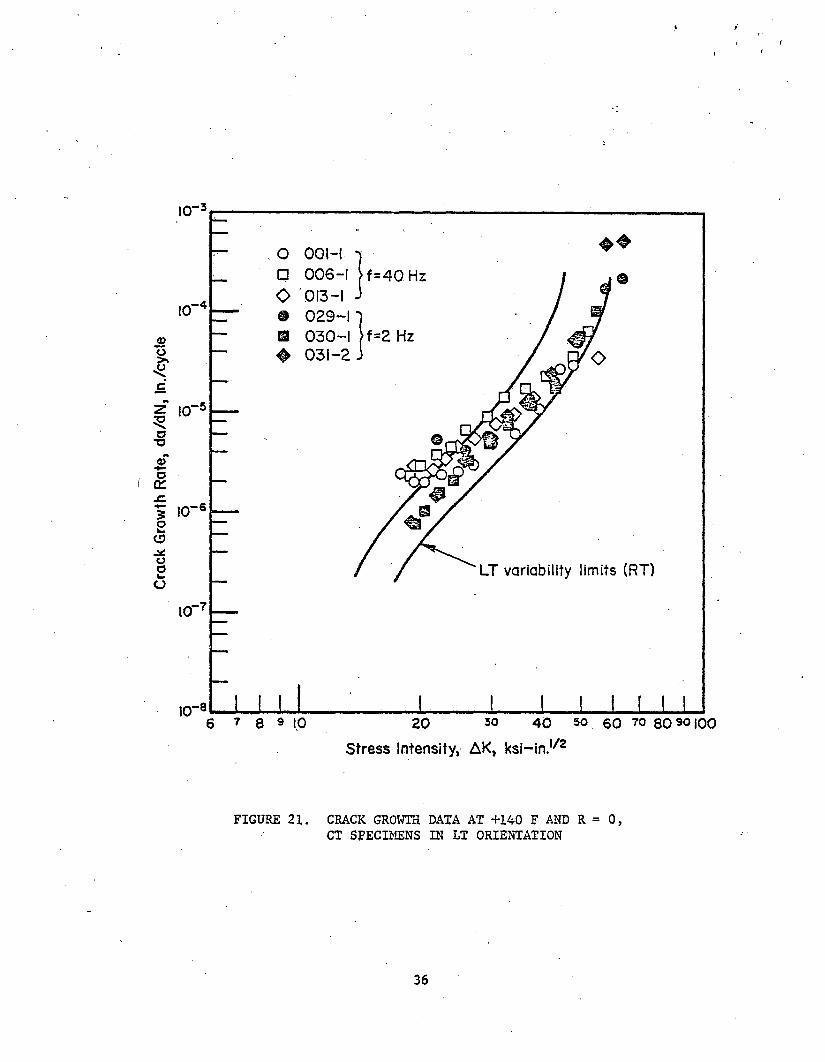
21. Crack G r o w t h Data at +140 F and R = o,CT S p e cimens in LT O r i e n t a t i o n .................................... . 36
22. Crack G r o w t h Dat a at +1 4 0 F and R = 0.5,CT Specimens in LT O r i e n t a t i o n ......................... '............. 37
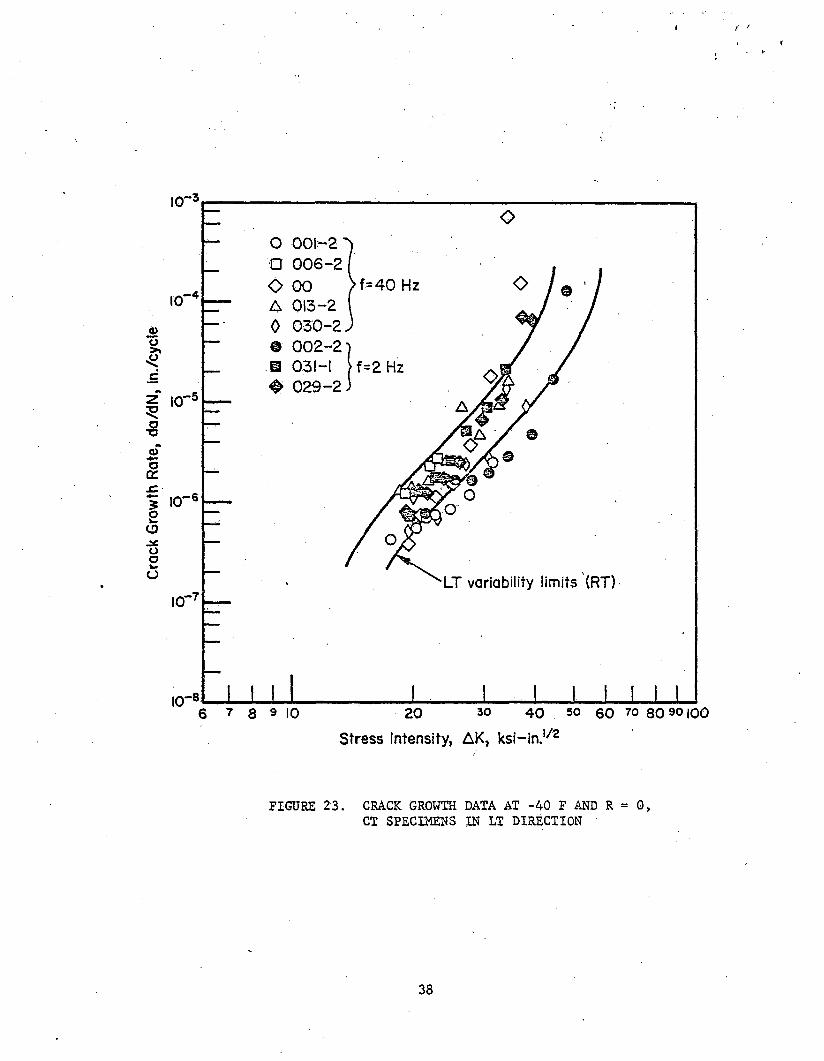
23. Crack G r o w t h Dat a at -40 F and R = 0,CT S p e cimens in LT D i r e c t i o n .................................. .......... 38
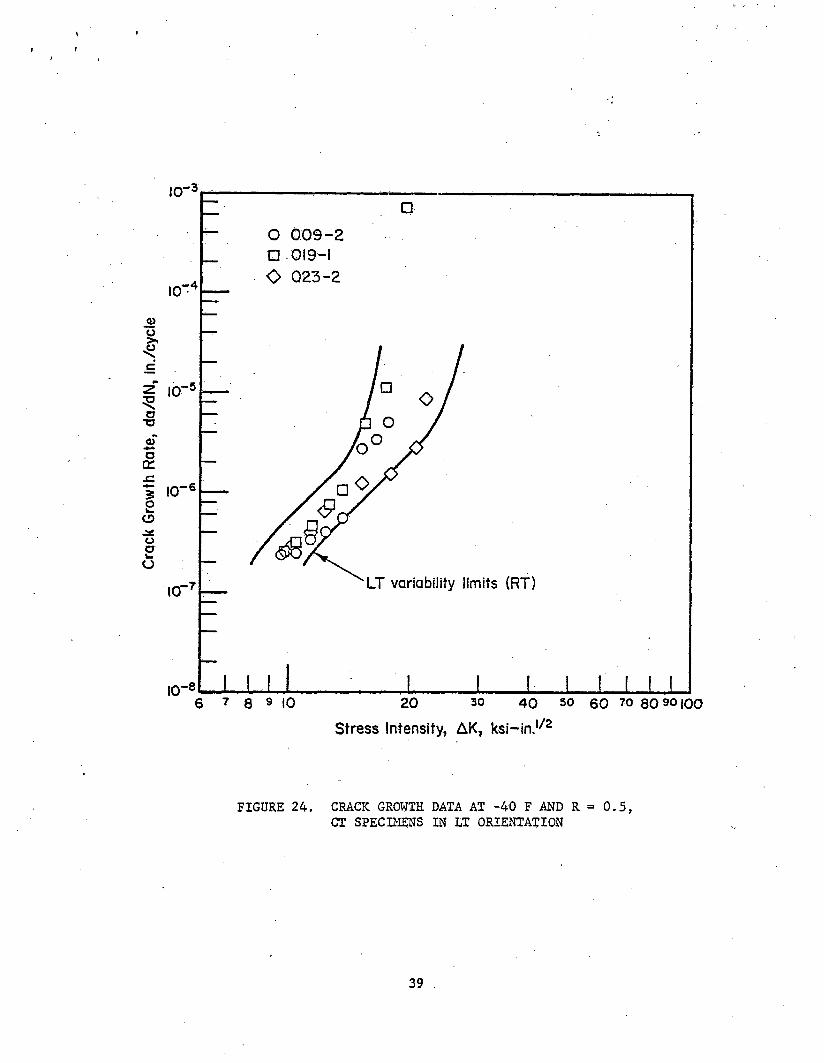
24. Crack G r o w t h Dat a at -40 F and R = 0.5,CT Specimens in LT O r i e n t a t i o n .......................................... 39
25. FCP Trend L ines for LT Orientation RailSamples at 3 Tempera tures and R R a t i o s ............................... 41
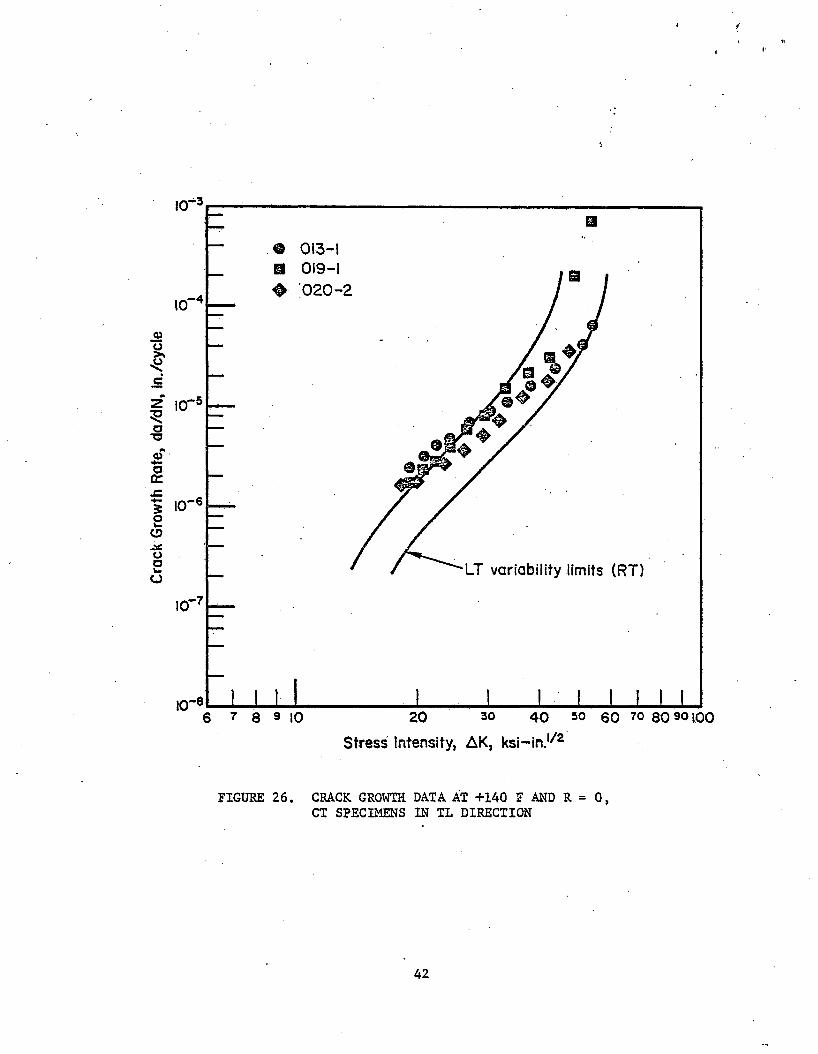
26. Crack Gro w t h Data at +140 F and R = 0,CT Specimens in T L D i r e c t i o n ............................................ 42
LIST OF ILLUSTRATIONS (Continued)
Figure ' Page
LIST OF ILLUSTRATIONS (Continued)
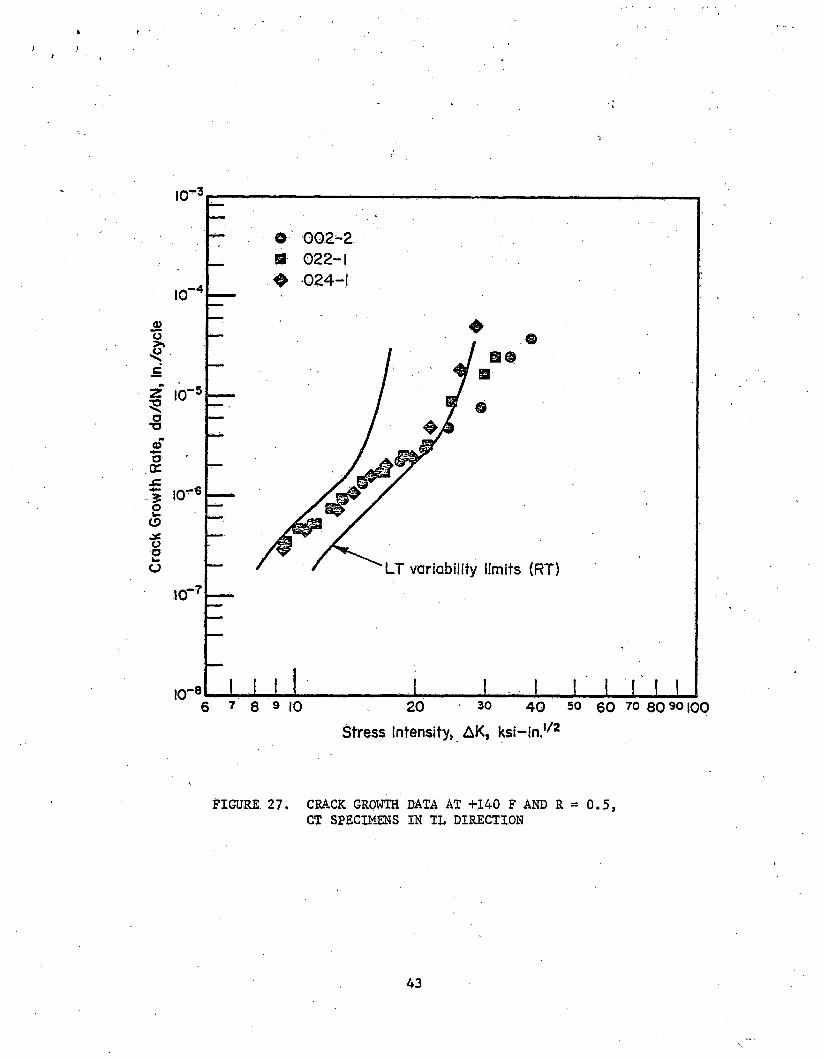
Figure Page27 Crack Growth Data at +140 F and R = 0.5,
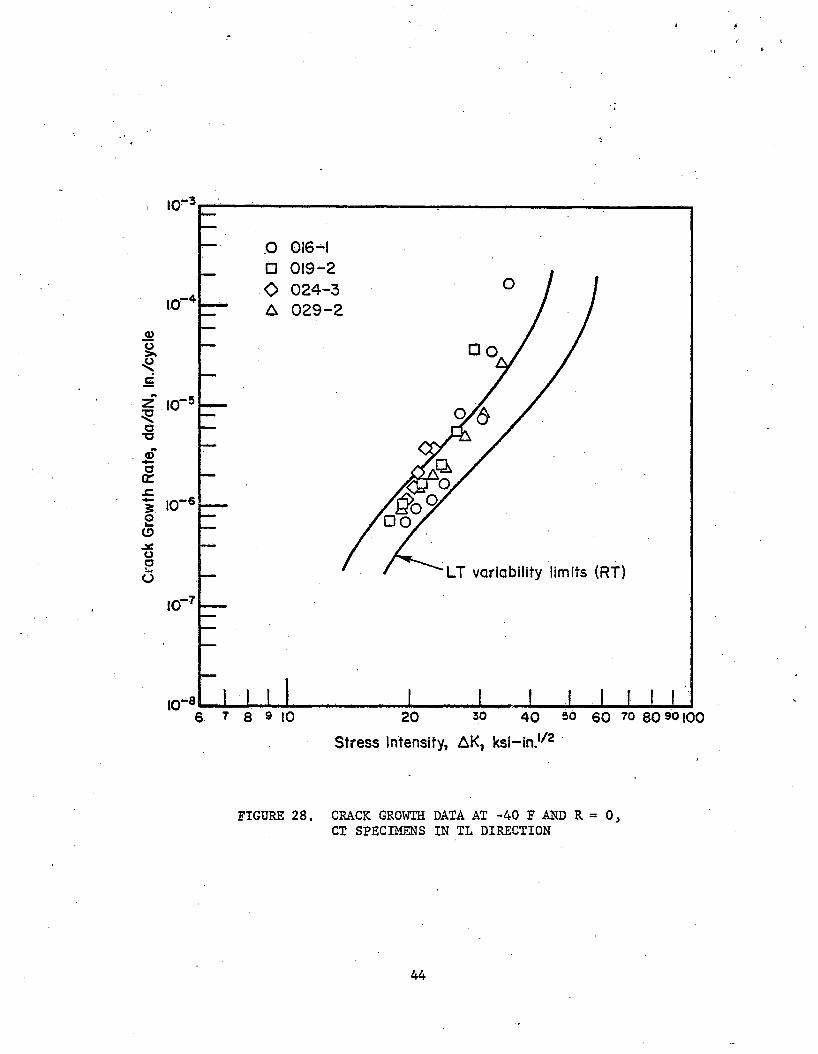
CT Specimens in TL Direction................................. 4328 Crack Growth Data at -40 F and R = 0,
CT Specimens in TL Direction................................. 44
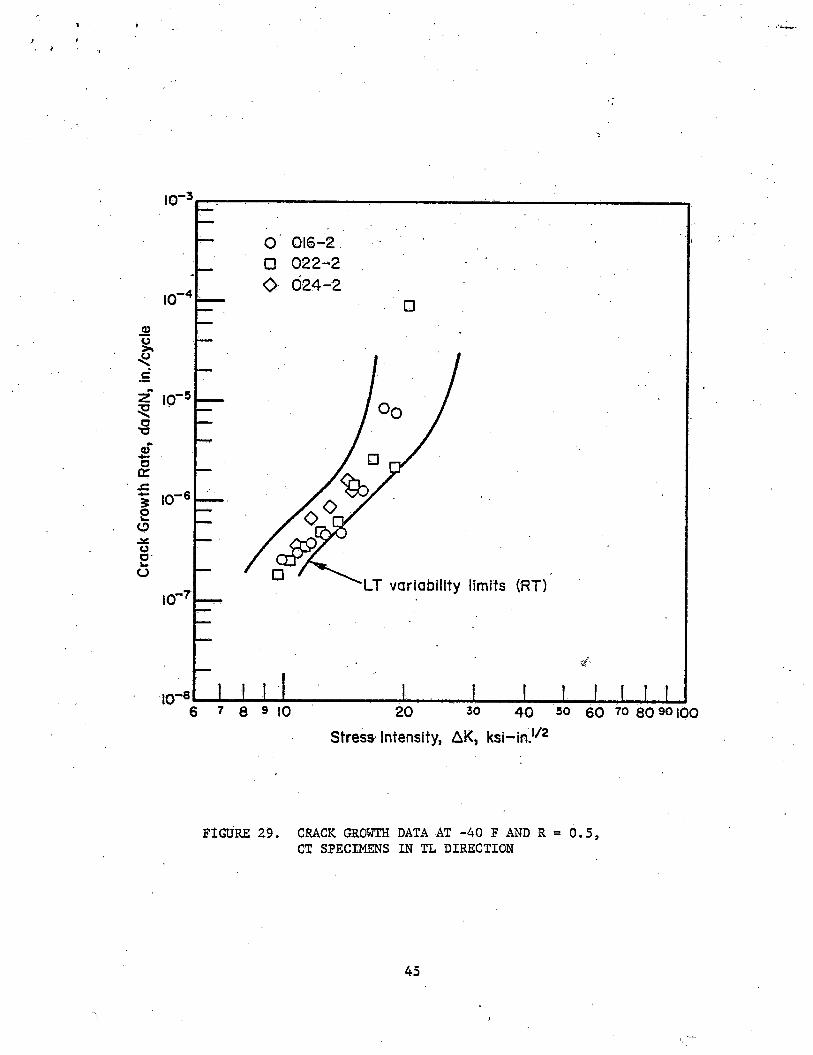
29 Crack Growth Data at -40 F and R = 0.5,CT Specimens in TL Direction................................. 45
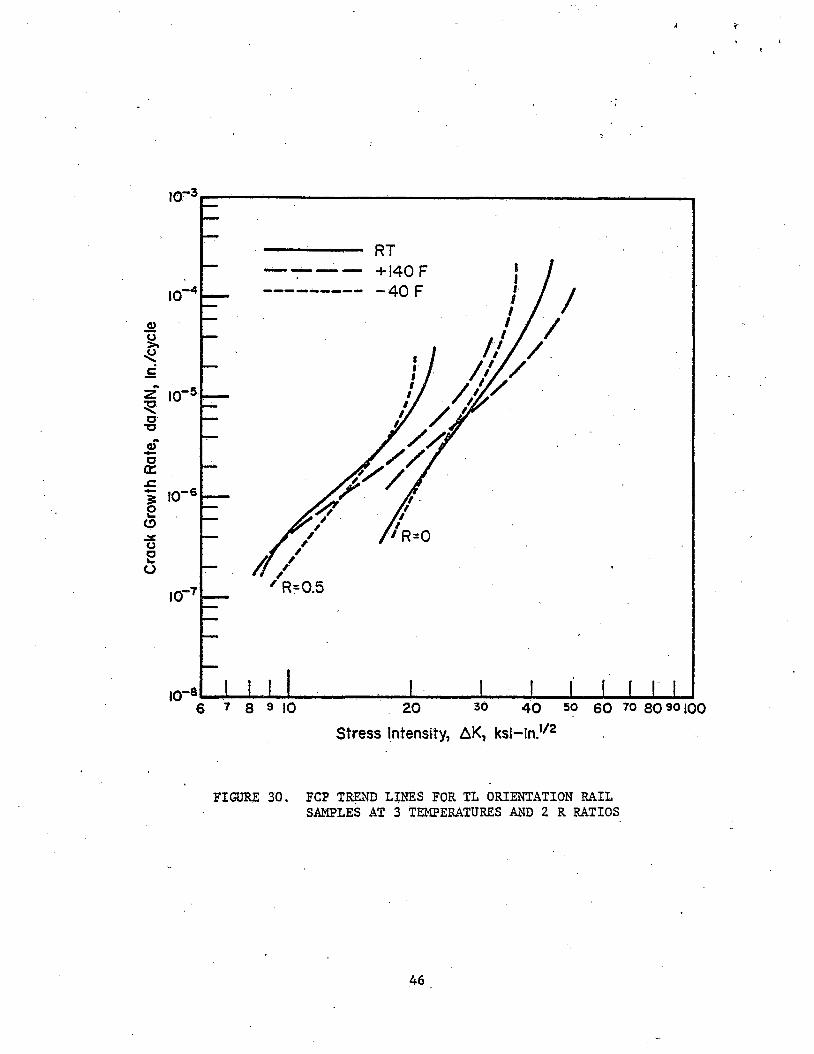
30. FCP Trend Lines for TL Orientation Rail Samplesat 3 Temperatures and 2 R Ratios........................... . ^6
31. Example of Threshold Data with Step-Down-Step-Up Procedure Indicated bv a Numerical Sequenceof Data Points............................. 48
32. Threshold Data at Room Temperature, R = 0and 0.5, LT Direction........................................ 49
33. Threshold Data at Room Temperature, R = 0and 0.5, TL Direction........................................ 50
34. Threshold Data at Room Temperature, R = -1,LT Direction................................................. 51
35. SF Data...................................................... 5436. Crack Path for Cases of Different Initial K /Ky
Ratios................................... ................... 5737. Kt and K for Actual Crack Cases (Specimen
of Unit Thickness)........................................... 58•00CO Mixed Mode Test Results; Rail Sample 018 (Category II)........ 59
39. Mixed Mode Test Results; Rail Sample 013 (Category I)......... 60
40. Mixed Mode Test Results; Various Samples..................... 6141. Crack Extension Angle for Mixed Mode Loading.................. 65.42. Equivalent Mode I Stress Intensity
for Mixed Mode Loading....................................... 6643. Mixed Mode Test Data on the Basis of A for
the Principal Stress Criterion............................... 6744. Locus of Constant K^e for Mixed Mode Loading
According to Various Criteria................................ 71
viii

>>
45. Mixed Mode Cyclic Histories............,......... ........... 7346. Inapplicability of Forman Equation,
Orientation LT, Room Temperature.............. .............. 7647. Crack Growth Equation Not Accounting for Threshold,
Orientation LT, Room Temperature............................ . 78.48. Applicability of Crack Growth Equations,
Orientation LT, Room Temperature................. ........... 8149. Applicability of Crack Growth Equations,
Orientation LT, Room Temperature.................. 7850. Applicability of Crack Growth Equation,
Orientation LT, -40 F...................... ................. 8251. Applicability of Crack Growth Equation,
Orientation LT, +140 F............................. 8352. Applicability of Crack GrOwht Equation,
Orientation TL, Room Temperature............. ....... ....... 8453. Applicability of Crack Growth Equation,
Orientation TL, +140 F........................... ..... ..... 8554. Distribution of Baseline FCP Lives for 64 Rail Samples....... 8855. Distribution of Computed Baseline FCP Lives for
64 Rail Samples Assuming Each Test was Startedat a Stress Intensity of 10 ksi /in................. .......... 90
56. Comparison of R = 0.0 FCP Data Generated at VariousTemperatures in Several Orientations............................ 93
57. Comparison of R = 0.50 FCP Data Generated atVarious Temperatures in Three Orientations..................... 96
58. Additional Baseline Data, Room Temperature atR = 0, CT Specimens in LT Direction.............. ............ 99
59. Additional Baseline Data, .Room Temperature atR - 0, CT Specimens in TL Direction......................... . 100
LIST OF ILLUSTRATIONS (Continued)
Figure Page
ix

<ty
LIST OF TABLES
1. Characteristics of Rail Samples Use d forPresent E x p e r i m e n t s .............................. . ........................... 4
2. Test M a t r i x (Specimen N u m b e r s ) ................................. ........... 12
3. C omparison of R = 0 FCP Data Generated at V arious Tempe r a t u r e s in Several Orient a t i o n s (Max. InitialStress Intensity = 20 ksi / i n ..... .................................. ..... 92
4. Comparison of R = 0.50 FCP Data Generated at Various Tempe r a t u r e s in Several O r ientations (Max. InitialStress I n t ensity = 20 k s i / i n . ............................................ 95
5. Overall FCP Statistics for the V a r i o u s Str e s s Ratios,Temperatures, Frequencies and Speci m e n O r i e n t a t i o n s ................. 98
6. A d ditional C rack G r o w t h Test R e s u l t s ................... ....... ........ 101
7. Ranking of E x p erimental Results ofAdditional Base l i n e T e s t s . ................................................ . 102
8 . V a r i ability of Rail P r o p e r t i e s . ............... ...... ..................... 104
9. V a r i ability in Stress ofr EquivalentVar i a b i l i t y in C rack Grow t h L i f e .................. ........... ........... 106
Table Page
x
K >I ^l . ,
EXECUTIVE SUMMARY
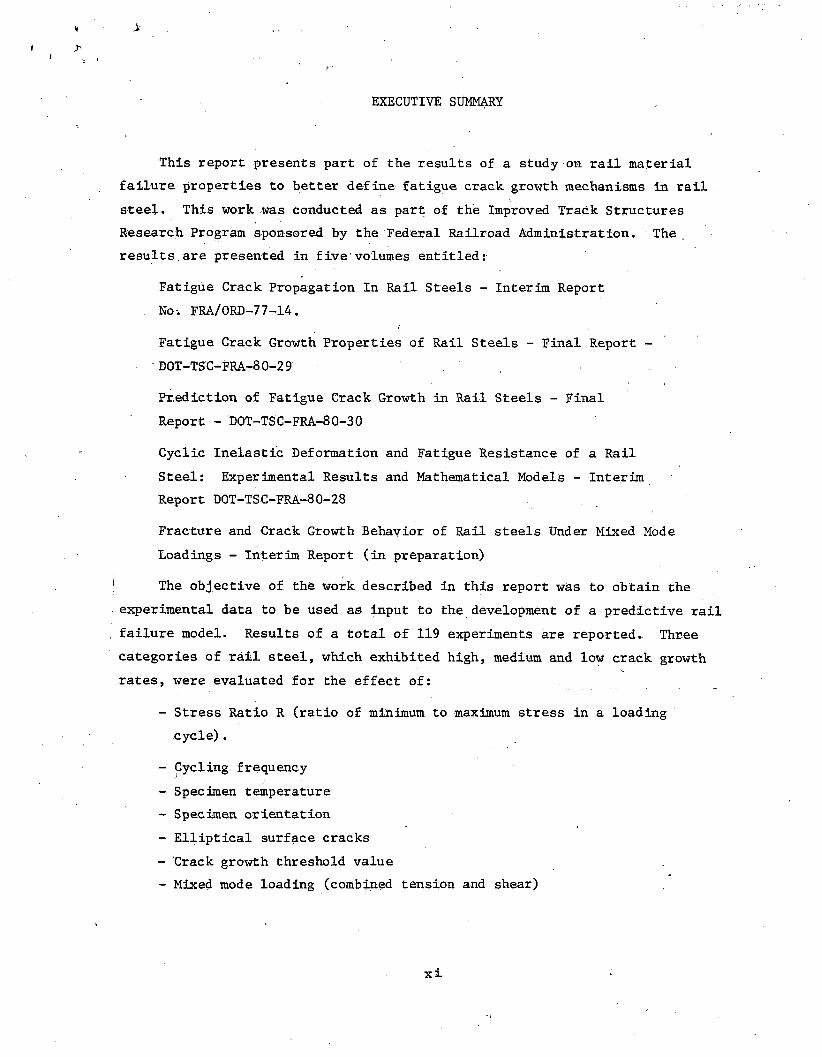
This report presents part of the results of a study on rail mate r i a l f a i l u r e prope r t i e s to better d e f i n e fatigue c r a c k g r o w t h m e c h a n i s m s in rail Steel. This w o r k was conducted as part of the Improved T r a c k Structures R e s e a r c h P r o g r a m sponsored by the Federal Railroad Administration. The r e s u l t s . a r e presented in five vo l u m e s entitled:
F a tigue C r a c k P r o p a gation In Rail Steels - Interim Report No. FRA/OED-77-14.
F a t i g u e C r a c k Gro w t h Pr ope r t i e s of Rail Steels - Final Report - DOT-TSC-FRA-8 0-2 9
P r e d i c t i o n of F a tigue C r a c k G r o w t h in Rail Steels - Final Report - D O T - T S C - F R A - 8 0-30
■ Cyclic Inelastic Def o r m a t i o n and Fatigue R esistance of a Rail
Steel: Experimental Results and Mathematical Mode l s - InterimReport D O T - T S C - F R A - 8 0-28
F r a c t u r e and C r a c k Growth Behavior of Rail steels Under M i x e d Mod e L o a d i n g s - I n terim Report (in preparation)
! The o b j ective of the w o r k described in this report w a s to obt a i n ther e x perimental data to b e used as input to the development of a p r e d i c t i v e rail , f a ilure model. Results of a total of 119 experiments are reported. Three c a tegories of rail steel, w h i c h exhibited high, m e d i u m and low c r a c k growth rates, w e r e evaluated for the effect of:
- Stress Ratio R (ratio of m i n i m u m to m a x i m u m stress in a loading cycle) .
- Cycling frequency- Specimen temperature- Speci m e n ori e n t a t i o n- Elliptical surface cracks- C r a c k g r o w t h threshold v a l u e- Mixed m o d e loading (combined tension and shear)
xi
V.
r
*
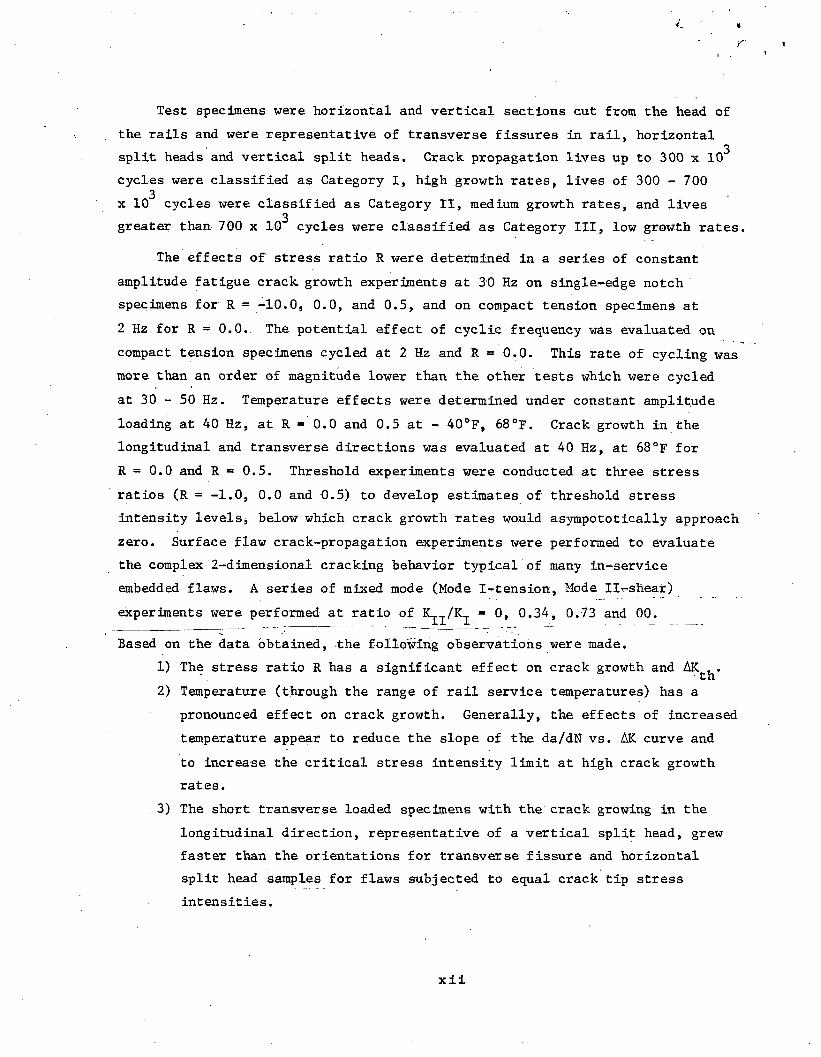
Test specimens were horizontal and vertical sections cut from the head of the rails and were representative of transverse fissures in rail, horizontal
3split heads and vertical split heads. Crack propagation lives up to 300 x 10cycles were classified as Category I, high growth rates, lives of 300 - 700 3x 10 cycles were classified as Category II, medium growth rates, and lives3greater than 700 x 10 cycles were classified as Category III, low growth rates.
The effects of stress ratio R were determined in a series of constant amplitude fatigue crack growth experiments at 30 Hz on single-edge notch specimens for R = -10.0, 0.0, and 0.5, and on compact tension specimens at 2 Hz for R = 0.0., The potential effect of cyclic frequency was evaluated on compact tension specimens cycled at 2 Hz and R = 0.0. This rate of cycling was more than an order of magnitude lower than the other tests which were cycled at 30 - 50 Hz. Temperature effects were determined under constant amplitude loading at 40 Hz, at R = 0.0 and 0.5 at - 40°F, 68°F. Crack growth in the longitudinal and transverse directions was evaluated at 40 Hz, at 68°F for R = 0.0 and R = 0.5. Threshold, experiments were conducted at three stress ratios (R = -1.0, 0.0 and 0.5) to develop estimates of threshold stress intensity levels, below which crack growth rates would asympototically approach zero. Surface flaw crack-propagation experiments were performed to evaluate the complex 2-dimensional cracking behavior typical of many in-service embedded flaws. A series of mixed mode (Mode I-tension, Mode Il-shear) experiments were performed at ratio of K /K . = 0, 0.34, 0.73 and 00.Based on the data obtained, the following observations were made.
1) The stress ratio R has a significant effect on crack growth and2) Temperature (through the range of rail service temperatures) has a
pronounced effect on crack growth. Generally, the effects of increased temperature appear to reduce the slope of the da/dN vs. AK curve andto increase the critical stress intensity limit at high crack growth rates.
3) The short transverse loaded specimens with the crack growing in the longitudinal direction, representative of a vertical split head, grew faster than the orientations for transverse fissure and horizontal split head samples for flaws subjected to equal crack tip stress intensities.
xii

k- >
4) The effect of frequency appeared to be insignificant in view of the large inherent scatter in crack-growth properties.
5) In the,surface flaw experiments, crack growth rates sidewise across the rail head through the width were higher than those through the thickness or down through the head toward the web.
6) The threshold asymptote, under the test conditions described in this report, was reached at crack growth rates of 10 in/cycle.
7) Mixed mode (I./IJ) crack growth could not be sustained under the experimental conditions used since the crack turned immediately to a plane of pure mode I. Analytical models for mixed mode loading are presented. These models show that the effect of model II loading is likely to be small for the mode I/II ratios expected during service-
These data were generated in view of a computational crack-growth prediction model for crack growth under rail service loading to be developed later in this program. The results of this effort provided the data base to develop the prediction model which is described in DOT-TSC-FRA-80-29 Prediction of Fatigue Crack Growth Properties In Rail Steels.
xiii
* ■> jr
1. INTRODUCTION
Prevention of failures of railroad rails relies on timely detection of fatigue cracks. In order to establish safe inspection intervals, information is required on the rate of growth of fatigue cracks in service. The growth of cracks under service circumstances can be obtained from a predictive model, which in turn has to be based on fatigue crack growth data obtained in the laboratory.
One portion of the Federal Railroad Administration's (FRA) Track Performance Improvement Program is the development of a predictive rail failure model that enables a determination of optimal inspection periods through a calculation of fatigue-crack-prbpagation behavior. The research reported here concerns the second phase of a program to develop the rail failure model.
The laboratory fatigue-crack-growth data used as an input to the predictive model should be obtained from a sufficiently large sample of rails in order to manifest the.statistical variability. In the first phase of the program, data,were generated for 66 rail samples of various ages, suppliers, and weights. The samples were taken from existing track from.all sections of the United States. Fatigue crack growth tests were performed under constant amplitude loading with zero minimum load (R=0); R is the ratio of minimum to maximum stress in a cycle). These results were reported in an Interim Report, Reference 1. A summary of the Phase L data is presented in Appendix B of this report and also in Reference 2.
Actual cracks in rails develop under more complex conditions than constant amplitude tension loading at R=0. They are subjected to stress histories with varying amplitudes of combined tension and shear (mixed mode), covering a wide range of R ratios. Cracks can initiate in different sections of the rail and have different orientations; they are Internal flaws of predominantly quasi-elliptical shape. Moreover, the rail experiences varying temperatures, which may affect the behavior of cracks. A predictive failure model should be cognizant of these complex circumstances. Therefore, data are required on the, influence of the various parameters on crack growth. Such data were generated during the second phase of the program, and they are compiled in the present report.
1
i. >
Since it was prohibitive to perform all the experimentation on all 66 rail materials of the first phase, three categories were selected for further characterization^, consisting of materials that exhibited high, medium and low growth rates in the intial baseline crack growth experiments. These three categories were evaluated for the effect of
- Stress ratio (R)- Cycling frequency- Temperature- Specimen orientation in the rail- Mixed mode loading- Low stress cycling in the regime of the threshold for crack
growth- Crack front curvature (elliptical cracks).Results of a total of 119 experiments are reported here.In the third phase of the program the predictive failure model will be
developed. For this purpose, experiments will be performed under service- simulation loading. On the basis of those experiments, a crack growth integration model will be established that accounts for the variability of crack growth as observed in the first and second phase of the program.
2. RAIL MATERIALS<
A detailed description of the sample sources is presented in Appendix B and Reference 1. The 66 samples were identified by numbers 001 through 066. A summary will be presented here of the information relevant to this phase of the program. The same rail sample identification as in Reference 1 will be used throughout this report, to facilitate access to the more detailed infor- mation in Reference 1.
All rail samples used for the present experiments are listed in
2
Table 1 in ascending order of crack propagation life- as determined in Phase 1.The crack propagation life is defined as the number of cycles required to extend a crack in a compact tension specimen from 1-inch to failure. The crack propagation life was the basis for the categorization of the samples: lives up to 300 x 10J cycles, were classified as Category I, (high growth rates), lives of 300 - 700 x 10 were classified as Category II (medium growth rates), and lives above 700 x 10 were classified as Category III (low growth rates).It should be noted that the selection of categories was arbitrary and that the classification was based on only one test result per sample.
The top three groups of samples in Table 1 for Categories I, II, and III were the samples used for the main body of experiments. The fourth group lists some samples of each category that were used for additional experiments in a further attempt to evaluate the effect of other properties on the variability of fatigue crack growth. The reasons for their selection is given in the column, "Remarks". The experiments performed on these materials were simply a duplication of Phase I experiments on these samples for two orientations of cracking.
Table 1 presents the most important details for all samples. First are given the weight and the year of production. Then follows the Carbon, Manganese, Sulfur and Oxygen content. Also, the primary processing variables are indicated, i.e., Control Cooled (CC) and Vacuum Degassed (Vac. Deg.).Finally, the most important mechanical properties are given, via Tensile Ultimate Strength (TUS), Tensile Yield Strength (TYS), and the elongation for a 1-inch, gage length.
3, EXPERIMENTAL DETAILS
3.1 Specimens
The majority of the specimens were of the Compact Tension (CT) type. Their dimensions are shown in Figure 1. The specimens were provided with a 1.650-inch deep chevron notch (0.900 inch from the load line). These specimens were precracked in a Krause fatigue machine until a crack of about 0.1 inch had formed. At this point the specimens contained a simulated fatigue crack of about 1 inch (as measured from the load line, see Figure 1).
3
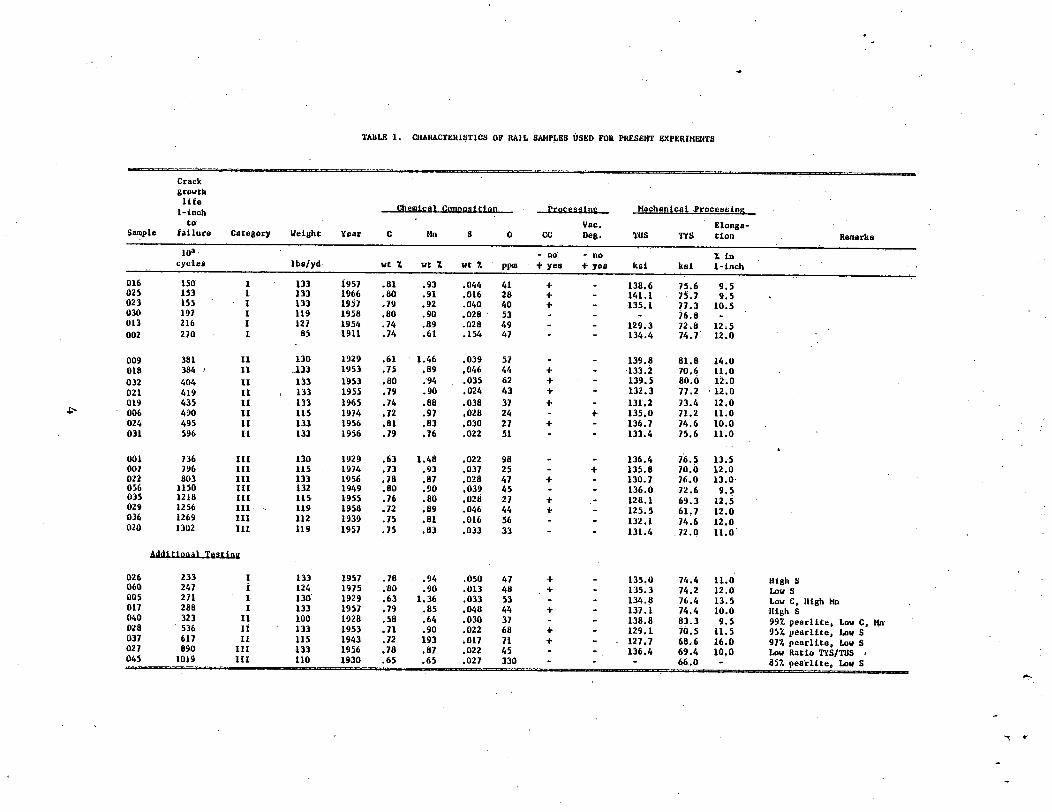
TABLE 1. CHARACTERISTICS OF RAIL SAMPLES USED FOR PRESENT EXPERIMENTS
Crackgrowth
Chemical Co!qpQql_tlQn,_ Processing . Mechanical Processing
Sampleto
failure Category Weight Year c Mn s 0 ccVac.Deg. XUS TYS
Elongation Remarks
10a - no - no X la•
cycles lba/yd vt l v t % wt % ppm + yea + yea ksl ksl i-inch
016 150 1 133 1957 .81 .93 .044 41 + 138.6 75.6 9.5025 153 i 133 1966 .80 .91 .016 28 + - 141.1 75.7 9.502] 155 i 133 1957 .79 .92 .040 40 + - 135.1 77.3 10.5030 197 i 119 1958 .60 .90 .028 53 - - _ 76.801] 216 i 127 1954 .74 .89 .028 49 - . 129.3 72.8 12.5002 270 i 85 1911 .74 .61 .154 47 - 134.4 74.7 12.0
009 381 ii 130 1929 .61 1.46 .039 57 _ _ 139.8 81.8 14.0018 384 ' ii .133 1953 .75 ,69 ,046 44 133.2 70.6 11.0032 404 ii 133 1953 .80 .94 .035 62 - 139.5 80.6 12.0021 419 ii 133 1955 .79 .90 .024 43 + - 132.3 77.2 12.0019 435 ii 133 1965 .74 .88 .038 37 + - 131.2 73.4 12.0006 490 ii 115 1974 .72 .97 .028 24 - + 135.0 71.2 11.0024 495 n 133 1956 .81 .83 .030 27 + - 136.7 74.6 10.0031 596 ii 133 1956 .79 .76 .022 51 - - 133.4 75.6 11.0
001 736 h i 130 1929 .63 1.48 .022 98 136.4 76.5t
13.5007 796 in 115 1974 .73 .93 .037 25 - + 135.8 70.6 12.0022 803 H I 133 1956 .78 .87 .028 47 _ 130.7 76.0 13.0056 1150 HI 132 1949 .80 .90 .039 45 - 1 _ 136.0 72.6 9.5033 1218 III 115 1955 .76 .80 .026 27 + . 128.1 69.3 12.5029 1256 III 119 1958 .72 .89 .046 44 + _ 125.5 61.7 12.0036 1269 III 112 1939 .75 .81 .016 56 _ _ 132.1 74.6 12.0020 1302 III 119 1957 .75 .83 .033 33 - - 131.4 72.0 11.0
026 233 1 133 1957 .78 .94 .050060 247 I 124 1975 .80 .90 .013005 271 - 1 130 1929 .63 1.36 .033017 288 I 133 1957 .79 .85 .048040 323 II 100 1928 .58 .64 .030028 536 II 133 1953 .71 .90 .022037 617 II 115 1943 .72 193 .017027 890 III 133 1956 .78 .87 .022045 1019 III 110 1930 .65 .65 .027
47 + - 135.0 74.4 11.0 High S48 + - 135.3 74.2 12.0 Low S53 - - 134.8 76.4 13.5 Low C, High Mn44 + - 137.1 74.4 10.0 High S37 - - 138.8 83.3 9.5 99% pearlite, Low C, Mn68 + - 129.1 70.5 11.5 95% pearlite, Low S71 + - 127.7 68.6 16.0 97% pearlite. Low S45 - - 136.4 69.4 10.0 Low Ratio TYS/TUS >330 - - - 66.0 - 35% pearlite, Low S
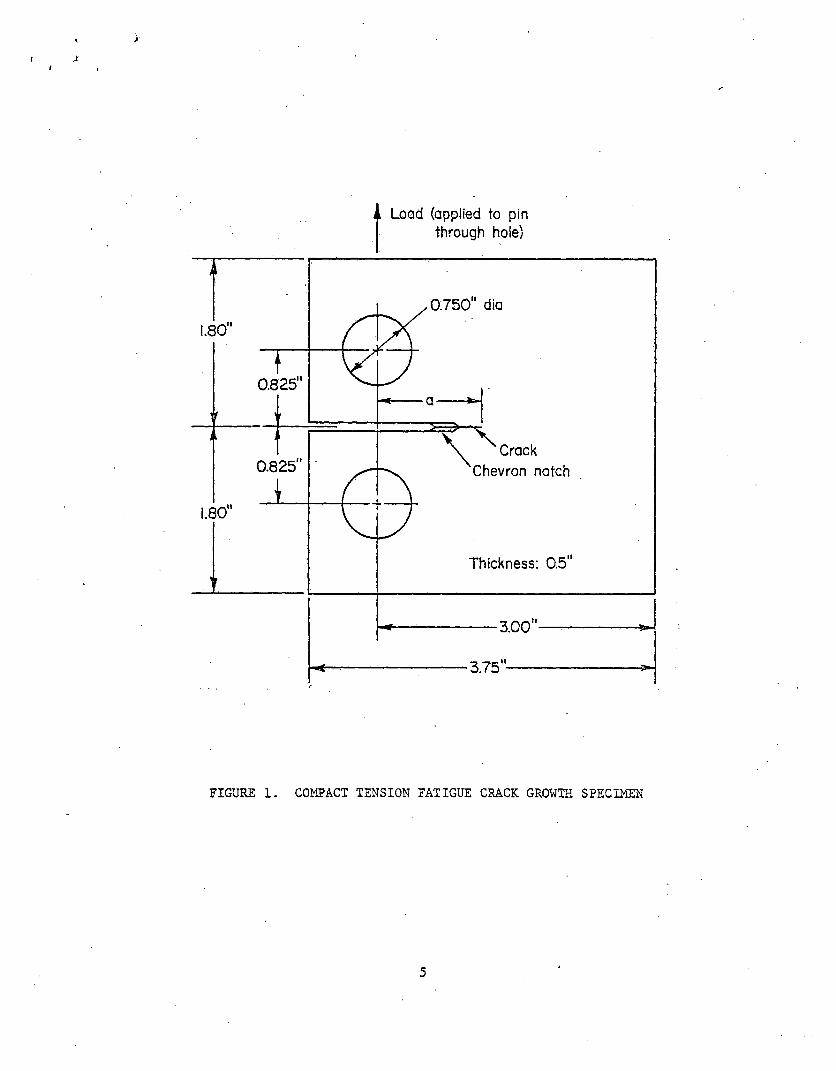
FIGURE I. COMPACT TENSION FATIGUE CRACK GROWTH SPECIMEN
5
( »r
l
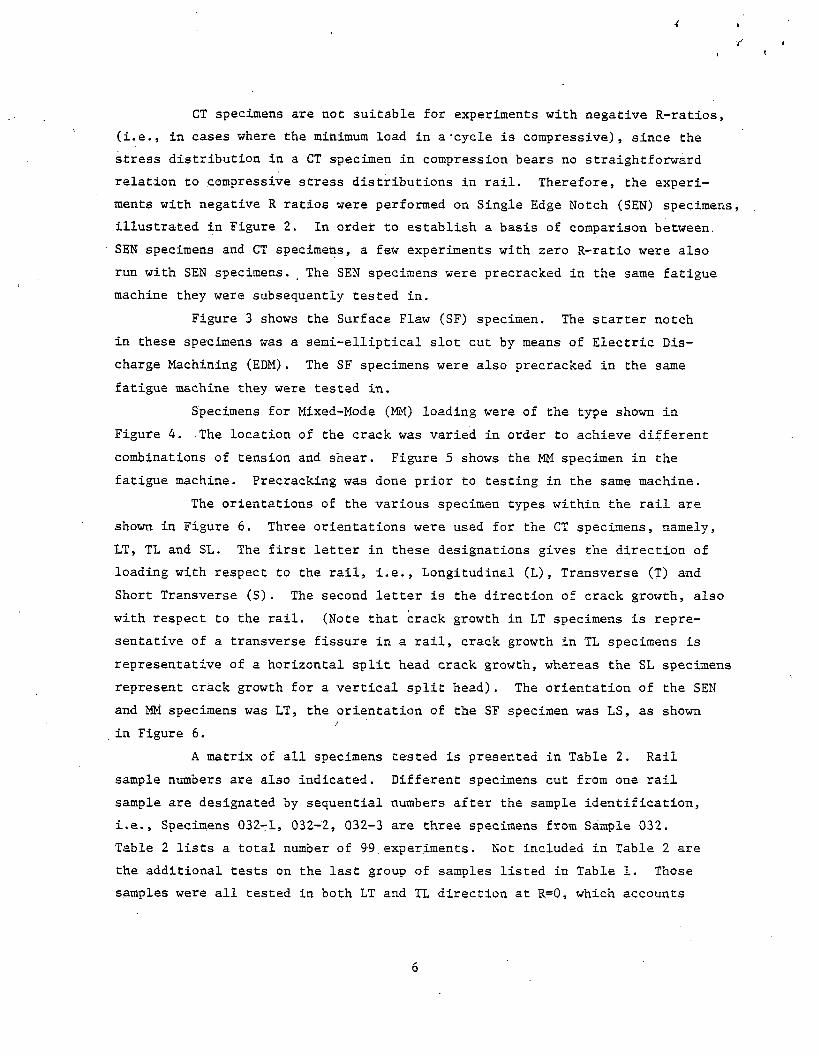
CT specimens are not suitable for experiments wit h negative R-ratios, (i.e., in cases where the m i nimum load in a "cycle is compressive), since the stress distribution in a CT specimen in compression bears no straightforward relation to compressive stress distributions in rail. Therefore, the experiments with negative R ratios we r e performed on Single Edge Notch (SEN) specimens, illustrated in Figure 2. In order to establish a basis of comparison between.SEN specimens and CT specimens, a few experiments wi t h zero R-ratio w e r e also run wi t h SEN specimens. The SEN specimens wer e precracked in the same fatigue machine they were subsequently tested in.
Figure 3 shows the Surface Flaw (SF) specimen. The starter notch in these specimens was a semi-elliptical slot cut by means of Electric Discharge Machining (EDM). The SF specimens wer e also precracked in the same fatigue machine they were tested in.
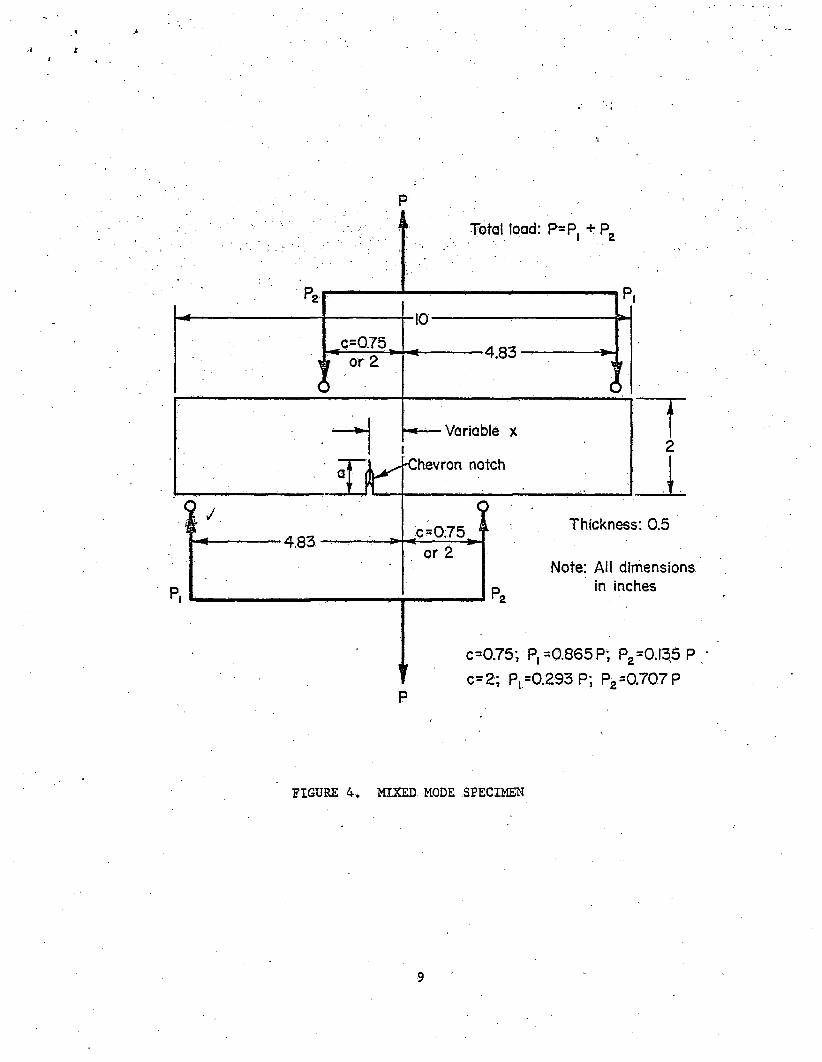
Specimens for Mixed-Mode (MM) loading were of the type shown in Figure 4. The location of the c rack was varied in order to achieve different combinations of tension and shear. Figure 5 shows the M M specimen in the fatigue machine. Precracking was done prior to testing in the same machine.
The orientations of the various specimen types w i t h i n the rail are shown in Figure 6. Three orientations wer e used for the CT specimens, namely,LT, TL and SL. The first letter in these designations gives the direction of loading with respect to the rail, i.e., Longitudinal (L), Transverse (T) and Short Transverse (S). The second letter is the direction of crack growth, also with respect to the rail. (Note that crack growth in LT specimens is representative of a transverse fissure in a rail, crack growth in TL specimens is representative of a horizontal split head crack growth, whereas the SL specimens represent crack growth for a vertical split h e a d ) . The orientation of the SEN and M M specimens was LT, the orientation of the SF specimen was LS, as shown in Figure 6.
A matrix of all specimens tested is presented in Table 2. Rail sample numbers are also indicated. Different specimens cut from one rail sample are designated by sequential numbers after the sample identification, i.e., Specimens 032-1, 032-2, 032-3 are three specimens from Sample 032.Table 2 lists a total number of 99.e x p e r i m e n t s . Not included in Table 2 are the additional tests on the last group of samples listed in Table 1. Those samples were all tested in both LT and TL direction at R=0, w hich accounts
6
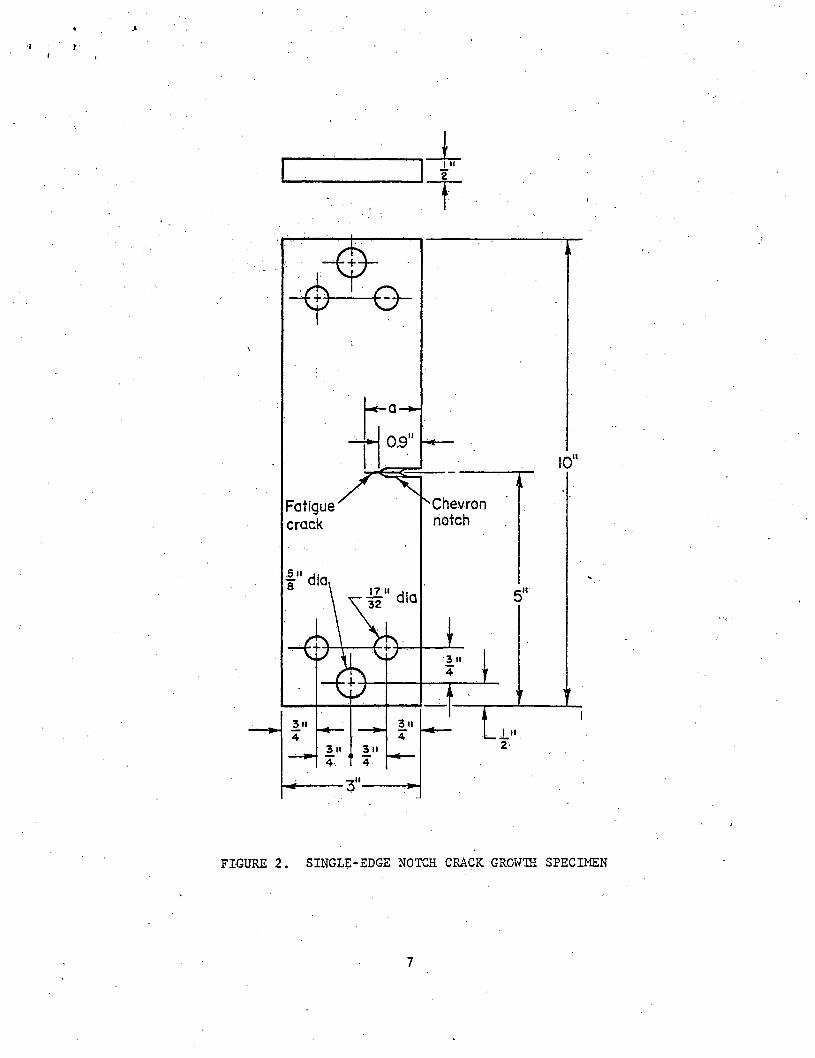
FIGURE 2. SINGLE-EDGE NOTCH CRACK GROWTH SPECIMEN
7
Initial flaw depth, a
Note: A and C are reference points for stress intensity calculations.
FIGURE 3. SURFACE-FLAW CRACK GROWTH SPECIMEN
•I t>
FIGURE 4, MIXED MODE SPECIMEN
9

FIGURE 5. MIXED MODE TEST SETUP
10

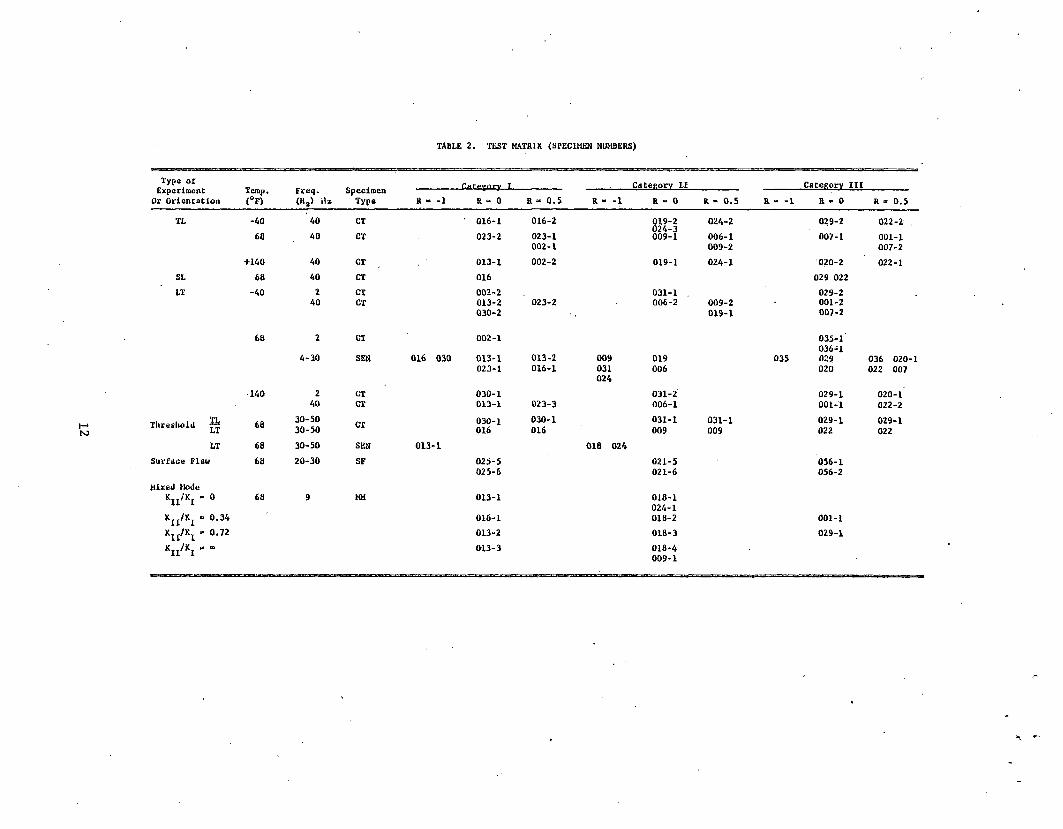
TABLE 2. TEST MATRIX (SPECIMEN NUMBERS)
Type o f Experiment Temp* Freq. Specimen
Category I I Category I I I
Or O rientation (°F) (H^) ilz Type R - -1 R - 0 R - 0.5 R - -1 R D 0 R - 0.5 a - -1 a - 0 R « 0.5
TL -40 '40 CT ' 016-1 016-2 019-2024-3
024-2 029-2 022-2 .
68 40 CT 023-2 023-1 009-1 006-1 007-1 001-1002-1 009-2 007-2
+140 40 CT 013-1 002-2 019-1 024-1 020-2 022-1
SL 68 40 CT 016 029 022
LT -40 2 CT 002-2 031-1 . 029-240 CT 013-2 023-2 006-2 009-2 001-2
030-2 019-1 007-2
68 2 CT 002-1 035- 1036- 1
4-30 SEN 016 030 013-1 013-2 009 019 035 029 036 020-;023-1 016-1 031 006 020 022 007
024
140 2 CT 030-1 031-2 029-1 020-140 CT 013-1 023-3 006-1 001-1 022-2
Threshold “ 6B30-5030-50 CT 030-1
016030-1016
031-1009
031-1009
029-1022
029-1022
LT 68 30-50 SEN 013-1 018 024
Surface Flaw 68 20-30 SF 025-5 021-5 056-1025-6 021-6 056-2
Mixed Mode
V Ki - 0 68 9 MM 013-1 018-1024-1
K rT/KT » 0.34 016-1 018-2 001-1
KTr/Kt - 0.72 013-2 018-3 029-1
Kn /Ki - . 013-3 018-4009-1
for 20 experiments. This brings the grand total of experiments in Phase II to 119 experiments.
. 3.2 Testing Procedures
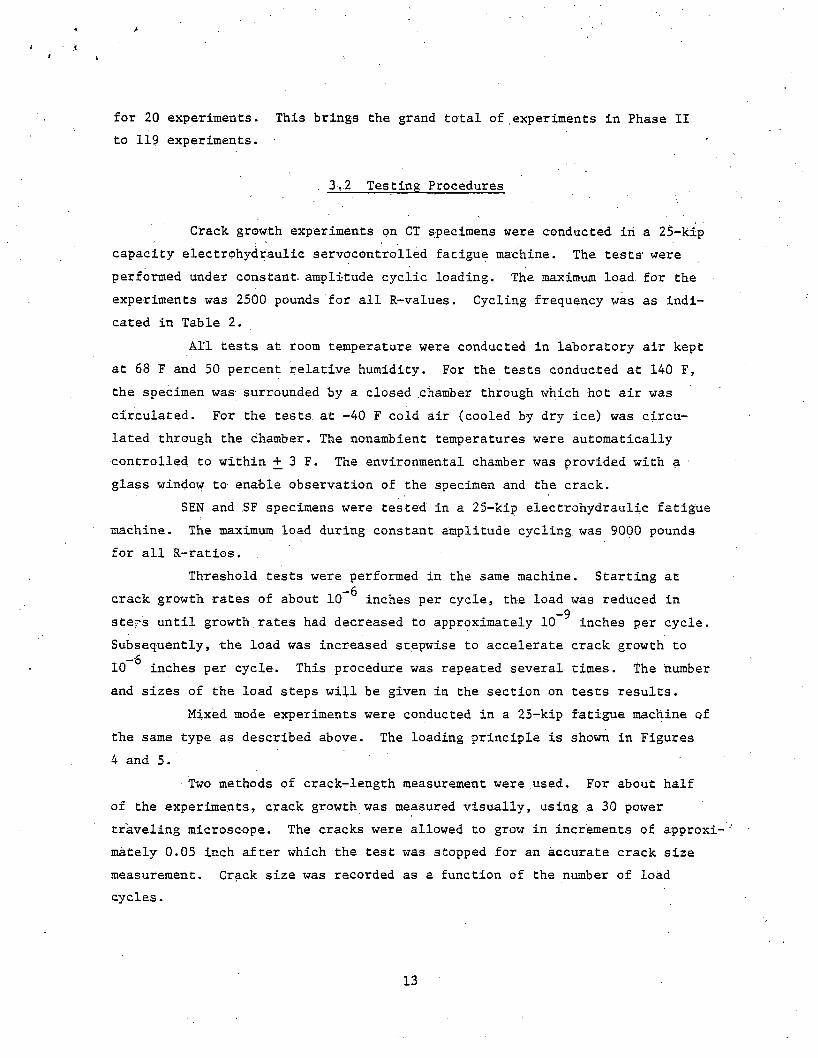
Crack growth experiments on CT specimens were conducted in a 25-kip capacity electrphydraulie servocontrolled fatigue machine. The tests' were performed under constant, amplitude cyclic loading. The maximum load for the experiments was 2500 pounds for all R-values. Cycling frequency was as indicated in Table 2.
All tests at room temperature were conducted in laboratory air kept at 68 F and 50 percent relative humidity. For the tests conducted at 140 F, the specimen was surrounded by a closed chamber through which hot air was circulated. For the tests, at -40 F cold air (cooled by dry ice) was circulated through the chamber. The nonambient temperatures were automatically controlled to within + 3 F. The environmental chamber was provided with a glass window to enable observation of the specimen and the crack.
SEN and SF specimens were tested in a 25-kip electrohydraulic fatigue machine. The maximum load during constant amplitude cycling was 9000 pounds for all R-ratios.-
Threshold tests were performed in the same machine. Starting at—6crack growth rates of about 10 inches per cycle, the load was reduced in
_9steps until growth rates had decreased to approximately 10 inches per cycle. Subsequently, the load was increased stepwise to accelerate crack growth to 10 inches per cycle. This procedure was repeated several times. The number and sizes of the load steps will be given in the section on tests results.
Mixed mode experiments were conducted in a 25-kip fatigue machine of the same type as described above. The loading principle is shown in Figures 4 and 5.
Two methods of crack-length measurement were used. For about half of the experiments, crack growth was measured visually, using a 30 power traveling microscope. The cracks were allowed to grow in increments of approximately 0.05 inch after which the test was stopped for an accurate crack size measurement. Crack size was recorded as a function of the number of load cycles.
13
I<
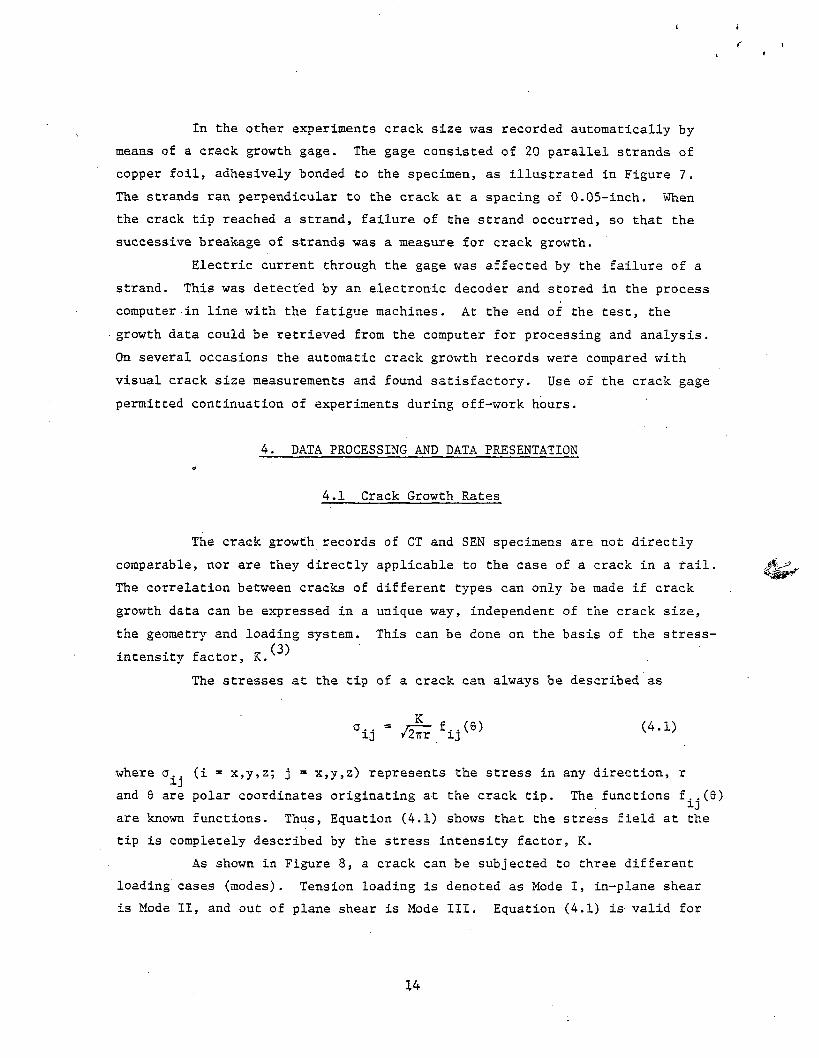
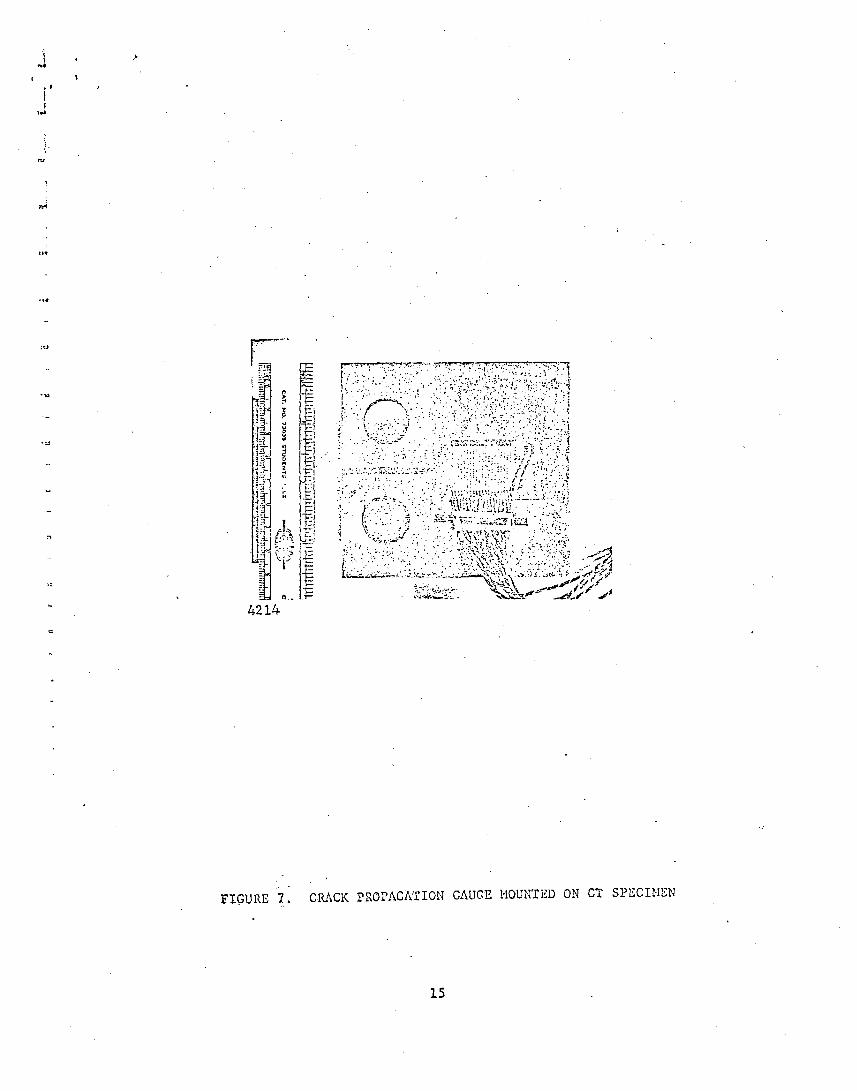
In the other experiments crack size was recorded automatically by means of a crack growth gage. The gage consisted of 20 parallel strands of copper foil, adhesively bonded to the specimen, as illustrated in Figure 7. The strands ran perpendicular to the crack at a spacing of 0.05-inch. When the crack tip reached a strand, failure of the strand occurred, so that the successive breakage of strands was a measure for crack growth.
Electric current through the gage was affected by the failure of a strand. This was detected by an electronic decoder and stored in the process computer in line with the fatigue machines. At the end of the test, the growth data could be retrieved from the computer for processing and analysis. On several occasions the automatic crack growth records were compared with visual crack size measurements and found satisfactory. Use of the crack gage permitted continuation of experiments during off-work hours.
4. DATA PROCESSING AND DATA PRESENTATION
4.1 Crack Growth Rates
The crack growth records of CT and SEN specimens are not directlycomparable, nor are they directly applicable to the case of a crack in a rail.The correlation between cracks of different types can only be made if crackgrowth data can be expressed in a unique way, independent of the crack size,the geometry and loading system. This can be done on the basis of the stress-
(3)intensity factor, K.The stresses at the tip of a crack can always be described as
K°ij /2irr V 0) (4.1)
where ck (i = x,y,z; j = x,y,z) represents the stress in any direction, r and 0 are polar coordinates originating at the crack tip. The functions f„(9) are known functions. Thus, Equation (4.1) shows that the stress field at the tip is completely described by the stress intensity factor, K.
As shown in Figure 8, a crack can be subjected to three different loading cases (modes). Tension loading is denoted as Mode I, in-plane shear is Mode II, and out of plane shear is Mode III. Equation (4.1) is valid for
14
>
II
4214
']
a ■?
*a:V '■■
11\
■.A
H iiO .
■ - V^t*ti£- ' S s k ' ' - ^ / S >'
FIGURE Y . CRACK PROPAGATION GAUGE MOUNTED ON CT SPECIMEN
1 5
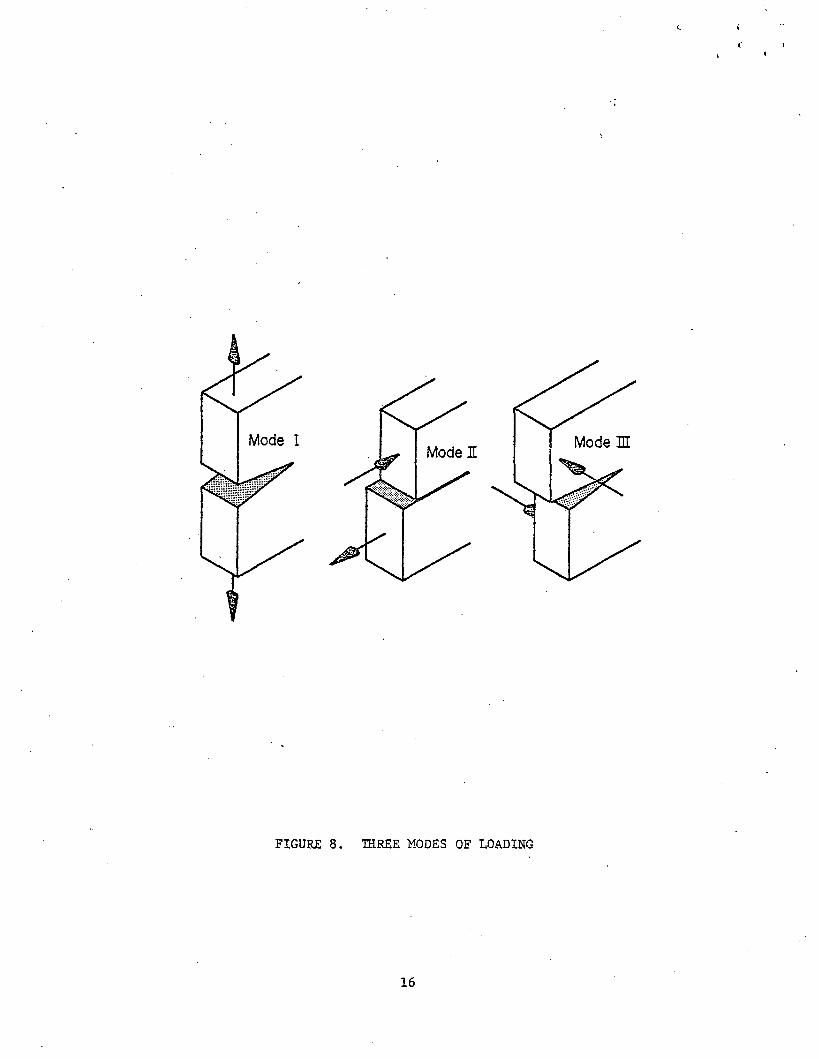
FIGURE 8. THREE MODES OF LOADING
16
>
all three modes, except that the functions f„(8) are different for each mode, but apart from that they are independent of geometry. Naturally, the stress intensity factors for the three modes are different, yielding
KL K.II/2irr ij 1 ^ ’ CTij /2irrij £i, n < 9>- %
Kt n ,/Zirr ij III(0) (4.2)
The general loading case is a combination of Modes I, II, and III; the stresses can simply be added. Mode I is technically the most important.For this reason the subscript I is usually omitted for, applications to fatigue crack propagation. Thus, K without subscript is always referring to Mode I loading.
Stress intensity factors can be calculated for various types of cracks The general form for the expression of K is
K = £a/jra (4.3)
where a is the crack size, a is the remote stress, and, £ is a geometry function.Since the stress intensity factor describes the whole stress field by
Equation (4.1), the stress distribution at the tips of two different cracks will be equal if the stress intensities have the same value. For example, for a case where £ = 1, two cracks differing by a factor of 4 in size would have the same stress intensity if the remote stress for the large crack was half the remote stress intensity of the small crack, and the two crack tips would carry equal stress fields. This suggests that the cracks would also behave in the same Way, i.e., show the same rate of growth. As a consequence fatigue crack growth rates associated with different geometries can be compared on the basis of the stress intensity factor; equal K means equal growth rates, within the range of varia^ bility of crack growth rates of a given material.
The rate of crack growth per cycle is denoted by the derivative da/dN, which is related to K by
§ = f ( A K ) . (4.4)
In this equation AK is the range of the stress intensity factor, obtained by substituting Aa in Equation (4.3). In turn, Aa is the range over which the
17
<
remote stress varies during a load cycle.If da/dN data are plotted as a function of AK on a double-logarithmic
graph paper the result is often a straight line. This suggests that
dadN C AKn (4.5)
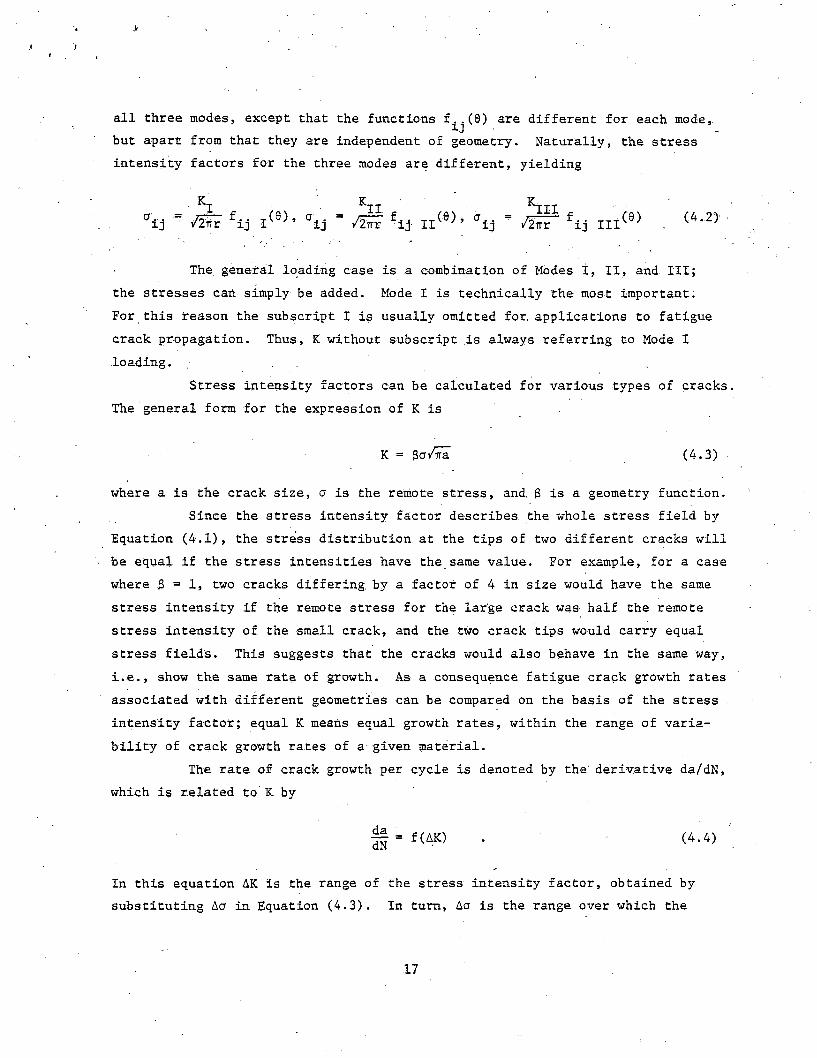
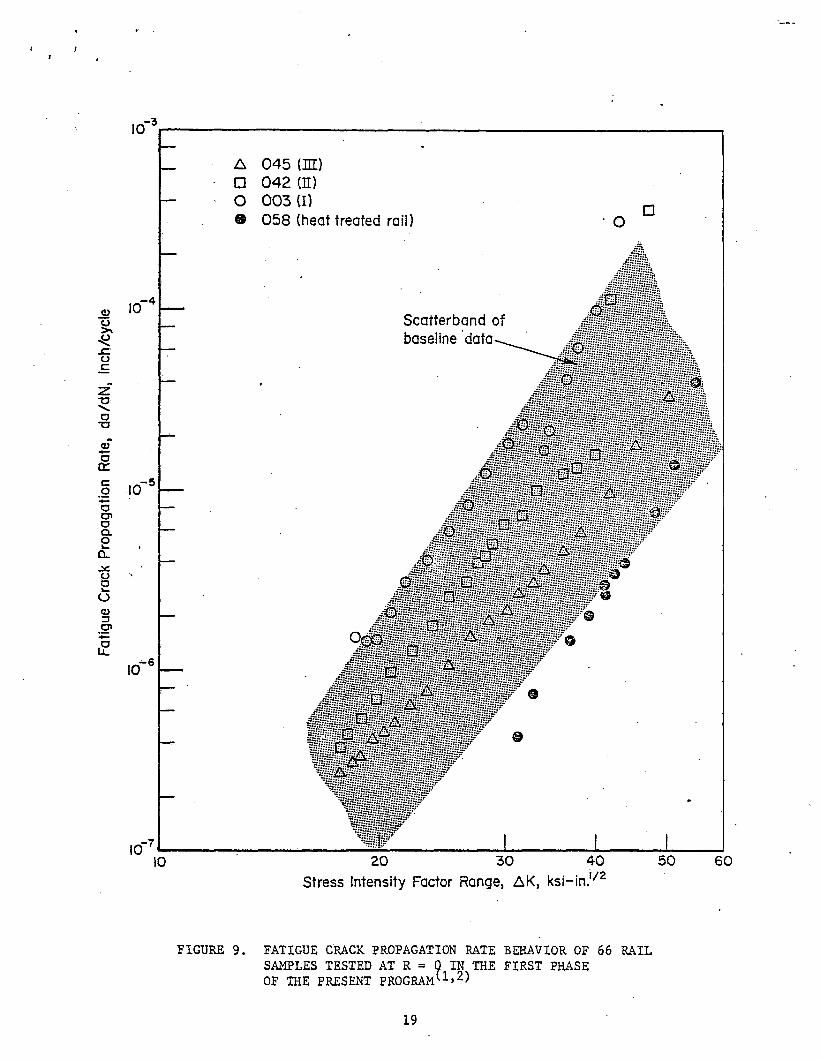
a commonly used expression in which C and n are constants. Figure 9 presentsan illustration of this .equation, using the data of 66 rail steel samples
(12)tested at R = 0 in the first phase of this programIt is generally recognized that da/dN is dependent not only on the
range of stress, but also on the maximum stress in a cycle or the stress ratio R (which is equivalent). Also, there is generally an upswing of the rate of crack growth towards the end of the test, because the failure conditions are approached. Failure occurs when the stress intensity factor approaches a critical value, K^. This is reflected in the following equation:
da _ AKn dN L (l-R)K -AK (4.6)
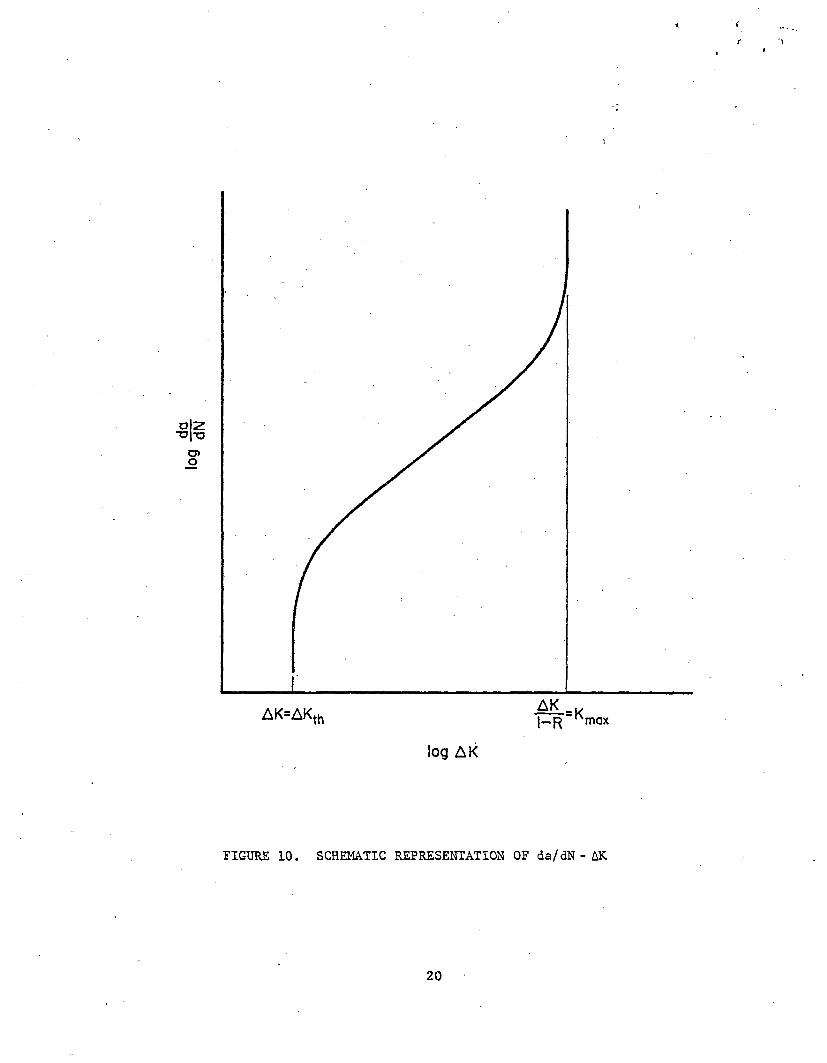
Equation (4.6) accounts for the effect of R-ratio, and it shows that da/dN becomes infinite when the stress intensity at maximum load becomes equalto K■— * Ic It does not yet reflect the fact that crack growth rates approach zerowhen the stress intensity is below a certain threshold level AKthat accounts for the threshold can be written(4)
th' An equationas:
dadN = C(AK -AK ) <{l+ (1-R)AK
(l-R)K.) AK ■ \ (4.7)
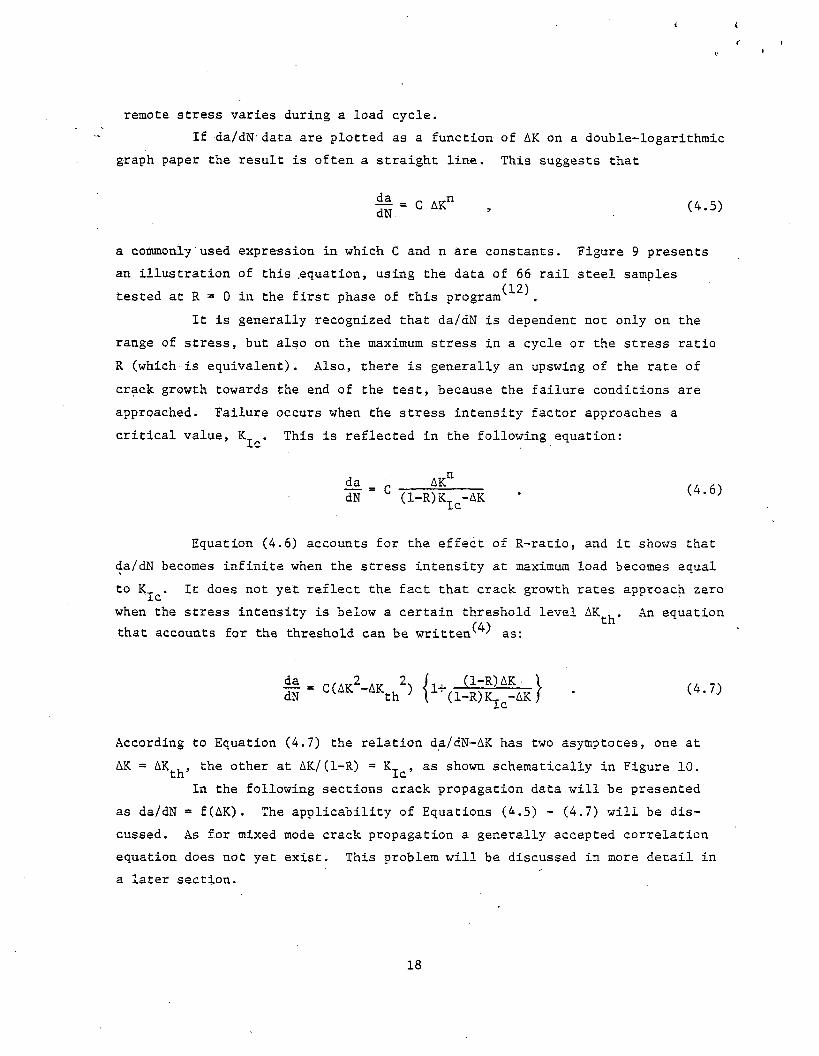
According to Equation (4.7) the relation da/dN-AK has two asymptotes, one at AK = AK ^ j the other at AK/(1-R) = K.^, as shown schematically in Figure 10.
In the following sections crack propagation data will be presented as da/dN = f(AK). The applicability of Equations (4.5) - (4.7) will be discussed. As for mixed mode crack propagation a generally accepted correlation equation does not yet exist. This problem will be discussed in more detail in a later section.
18
Fatigue Crack Propagation Rate, da/dN, inch/cycle
i
Stress Intensity Factor Range, AK, ksi-in.,/2
FIGURE 9. FATIGUE CRACK PROPAGATION RATE BEHAVIOR OF 66 RAIL SAMPLES TESTED AT R = Q IN THE FIRST PHASE OF THE PRESENT PROGRAM^1’2)
19
log AK
FIGURE 10. SCHEMATIC REPRESENTATION OF da/dN - AK
20
4.2 Stress Intensity Factors
The stress intensity factor for the C T specimen used in this investigation is given as:
_ 3
* • < 1 + t > (1 - 1>- 21 7-000 - 7*050 t + *•*» <t>2}. (4.8)
in which P is the applied load, and a, B and W are as defined in Figure 1.It is not immediately clear that E q u a t i o n . (4.8) has the character of
Equation (4.3). This is more evident in the stress intensity factor for the SEN specimen, which is given a s :
K - 5 ? * { ! • 99 - 0.41 77 + 18w ■7 - 38-48 + 53-85 <§> (4.9)
with a, B and W as defined in Figure 2. Obviously P/BW is the remote stress.The stress intensity factor for an elliptical surface flaw varies
along the crack front. If the semi-major axes of the ellipse is c, and the semi-minor axis is a (see Figure 3), the stress intensity factor for the SF specimen is:
Point A (Figure 3)
Point C (Figure 3)
with
E = 1.12 Sna<p BW
K = 1‘12 ^ W
2' 2 * -i c -a . 2 , 1- — — sin 'I'
cd4»
In these-equations ^ is a completely defined elliptical integral of the second kind, values for w h i c h can be found in mathematical tables, k is a factor
/e g.\depending upon a/B and a/c derived by Kobayashi et al. ’ and also to be
(3)found in textbooks . Since the stress intensity is higher at Point A than at Point C, the surface flaw will have a tendency to grow faster in depth than in length.
21

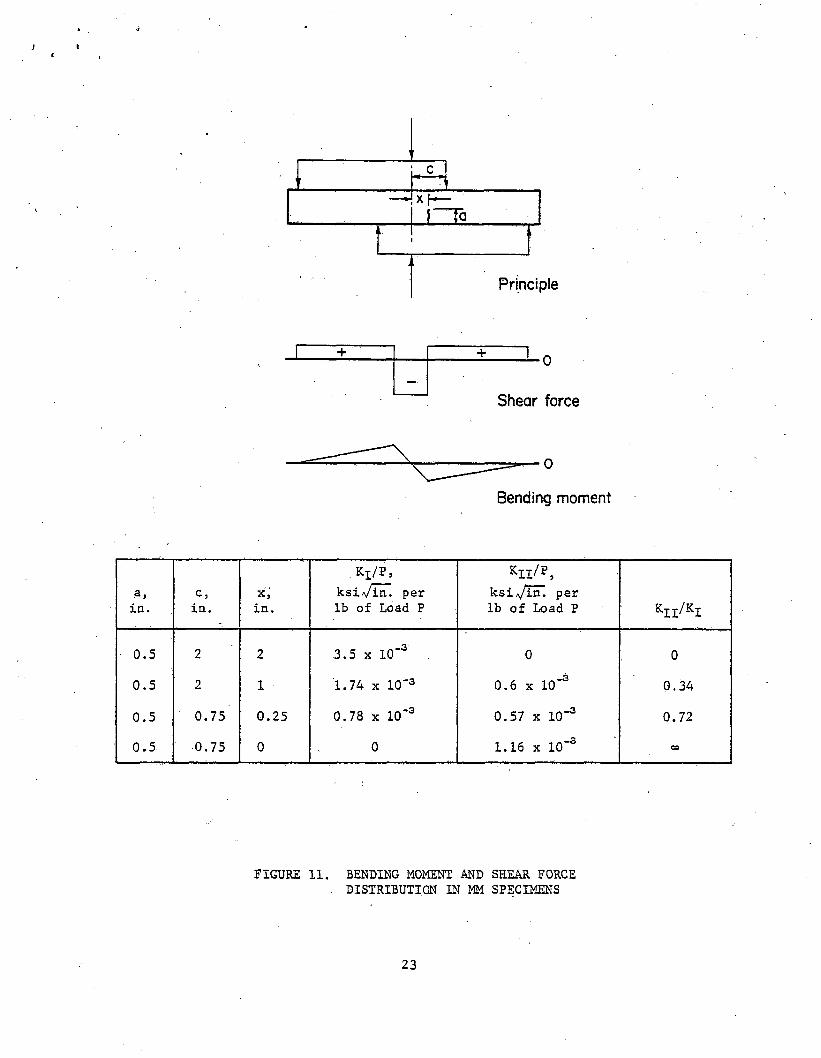
The bending moment and shear force distribution in the M M specimen are shown in Figure 11. The relative magnitude of bending moment and shear force depends upon the location. Thus, the ratio b e tween K^. (due to bending moment) and (due to shear) can be varied by varying the location of thecrack. Stress intensity solutions for this specimen did not exist. Therefore a finite element model was ma d e of the specimen wi t h a c rack and stress intensity factors were calculated numerically*. The specimen dimensions and crack locations were taken in "such a w a y that the ratio K ^ / K ^ covered the desired range. The stress intensity factors for the four cases considered are given in Figure 11. The change of the stress intensity factors as a function of crack size wil l be discussed later.
* This w o r k was done by E. F. Rybicki •
( c _
Xf—r T a
• '■
Principle
E Z Z ± ± z n o
Shear force
Bending moment
a ,
in.c ,
in.x ,
in.
Kx/P,ksiVin. per lb of Load P
Kll/5,ksiVIn"! per lb of Load P Kii/Ki
• 0.5 2 2 3.5 x 10"3 0 00.5 2 1 1.74 x 10'3 0.6 x 10"3 0.340.5 0.75 0.25 0.78 x 10'3 0.57 x 10"3 0.720.5 0.75 0 0 1.16 x 10"3 CO
i
FIGURE 11. BENDING MOMENT AND SHEAR FORCE . DISTRIBUTION IN MM SPECIMENS
23
5. TEST RESULTS
5.1 Introduction
The results of the fatigue-crack growth experiments to determine the effect of stress ratio, cycling frequency, test temperature, and specimen orientation are presented in this section. The threshold and.surface flaw results are also presented and discussed; however, the mixed-mode results will be presented in Section 6. Actual tabulated crack length-cycle readings for the various specimens are reported in Appendix A. The specific test conditions for each specimen are cited in Table 2. Experimental procedures were as discussed in Section 2.
5.2. Effects of Stress Ratio
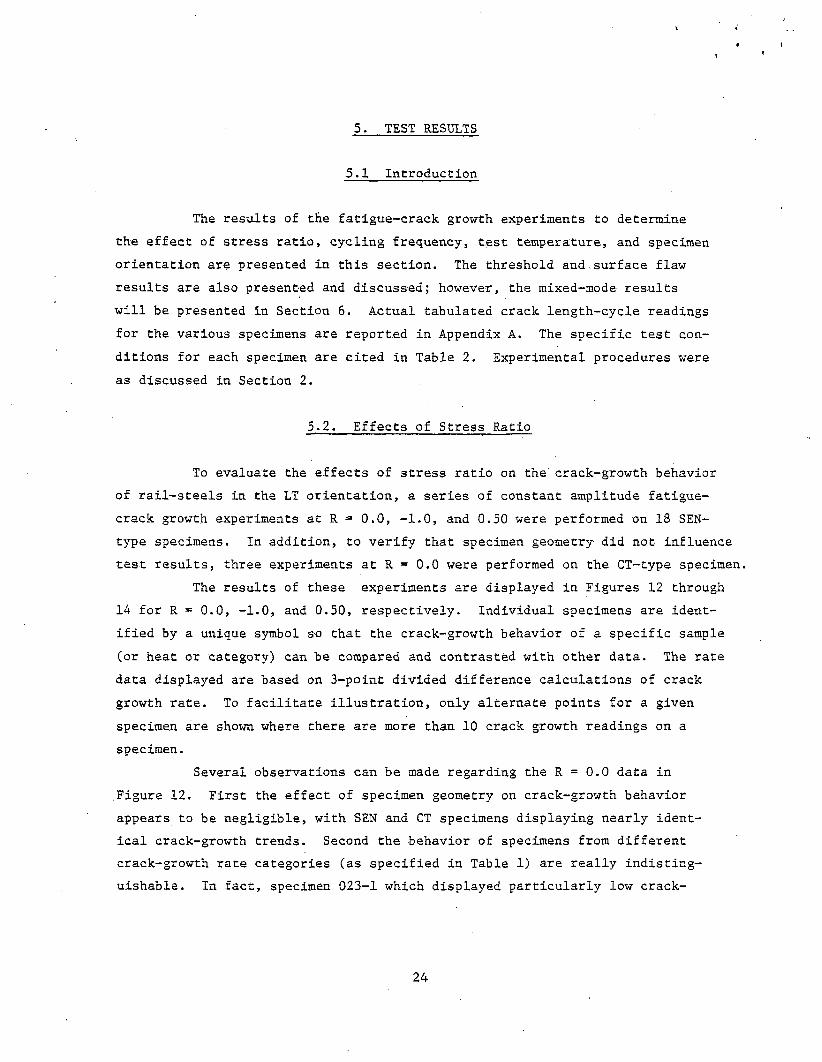
To evaluate the effects of stress ratio on the' crack-growth behavior of rail-steels in the LT orientation, a series of constant amplitude fatigue- crack growth experiments at R = 0.0, -1.0, and 0.50 were performed on 18 SEN- type specimens. In addition, to verify that specimen geometry did not influence test results, three experiments at R = 0.0 were performed on the CT-type specimen.
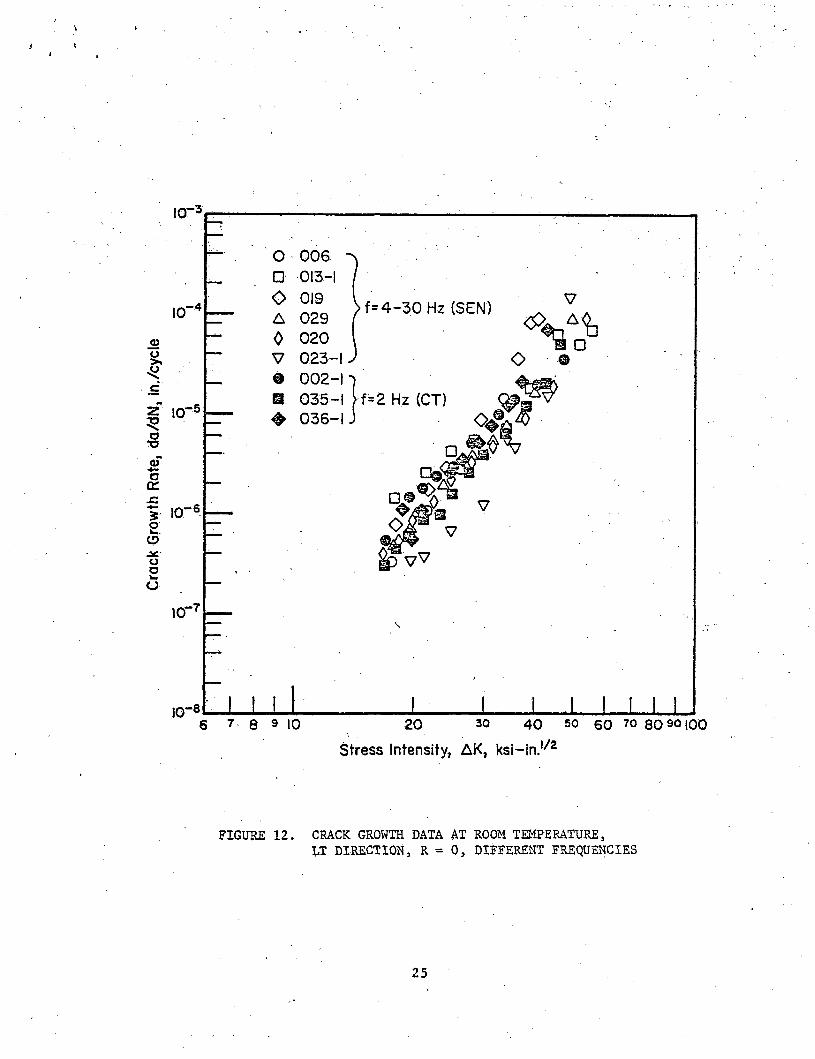
The results of these experiments are displayed in Figures 12 through 14 for R = 0.0, -1.0, and 0.50, respectively. Individual specimens are identified by a unique symbol so that the crack-growth behavior of a specific sample (or heat or category) can be compared and contrasted with other data. The rate data displayed are based on 3-point divided difference calculations of crack growth rate. To facilitate illustration, only alternate points for a given specimen are shown where there are more than 10 crack growth readings on a specimen.
Several observations can be made regarding the R = 0.0 data in Figure 12. First the effect of specimen geometry on crack-growth behavior appears to be negligible, with SEN and CT specimens displaying nearly identical crack-growth trends. Second the behavior of specimens from different crack-growth rate categories (as specified in Table 1) are really indistinguishable. In fact, specimen 023-1 which displayed particularly low crack-
24
Crac
k Gr
owth
Rat
e, d
a/dN
, in.
/cyc
le
i t
FIGURE 12. CRACK GROWTH DATA AT ROOM TEMPERATURE,LT DIRECTION, R = 0, DIFFERENT FREQUENCIES
25

Crac
k Gr
owth
Rat
e, d
a/dN
, in.
/cyc
le
( T
FIGURE 13. CRACK GROWTH DATA AT ROOM TEMPERATURE AND R = -1,SEN SPECIMENS IN LT DIRECTION, FREQUENCY OF 4-30 HZ
2 6
Crack G
rowth R
ate, d
a/dN, In./cycle
J i
FIGURE 14.. CRACK GROWTH DATA AT ROOM TEMPERATURE AND R = 0.5,SEN SPECIMENS IN LT DIRECTION, FREQUENCY OF 4 - 30 HZ
27
growth rates came from a rail that was identified as Category I (high r a t e ) .The reason for this disparity appears to be that the original rate categories were assigned on the basis of individual test results that could not be statistically analyzed for variability. Subsequent tests have shown that the crack-growth behavior of different test specimens from the same rail m a y vary nearly as much as specimens taken from totally different rails. This problem of data variability wil l be addressed in more detail in Section 8.
The R = -1.0 data shown in Figure 13 displayed a similar variability in rate behavior to the R = 0.0 experiments, while the R = 0.50 data shown in Figure 14 exhibited substantially greater scatter, especially at the highest crack-growth rates. The increased scatter for the latter case is not fully understood, but may be partially due to differences in fracture toughness of the rail samples.
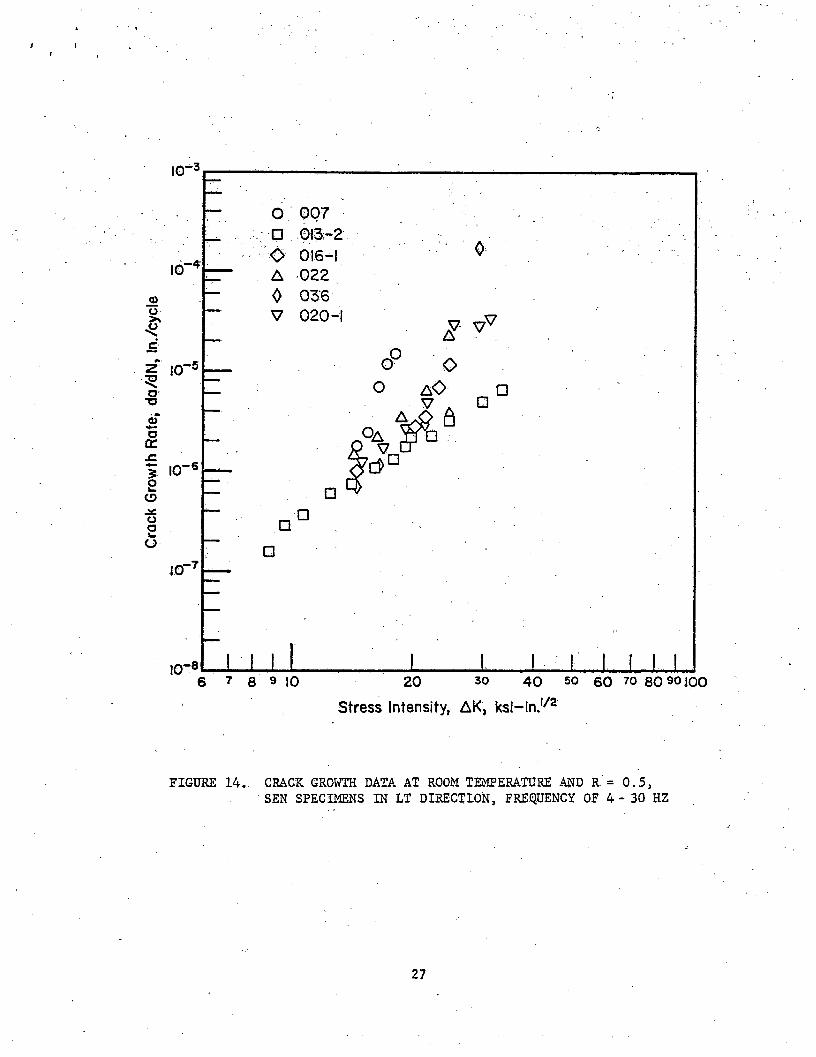
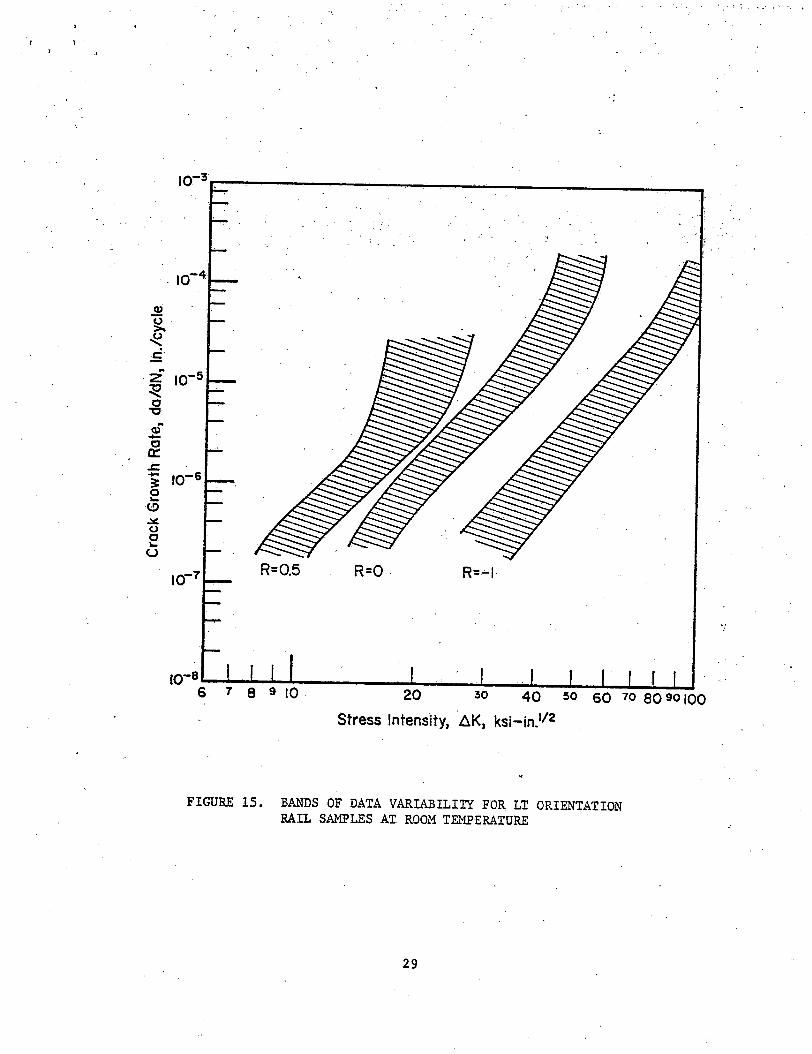
The overall data trends for the roo m temperature crack-growth experiments on LT orientation specimens are shown in Figure 15. Three distinct bands are formed for each stress ratio w h e n the data are plotted versus the stress intensity range, AK. Each ban d has an average slope of approximately 4 in the logarithmicaily-linear range of the data. This simply implies that atwo-fold increase in stress intensity w o u l d result in a new average crack
lgrowth rate 16 times (2 ) that of the initial rate.
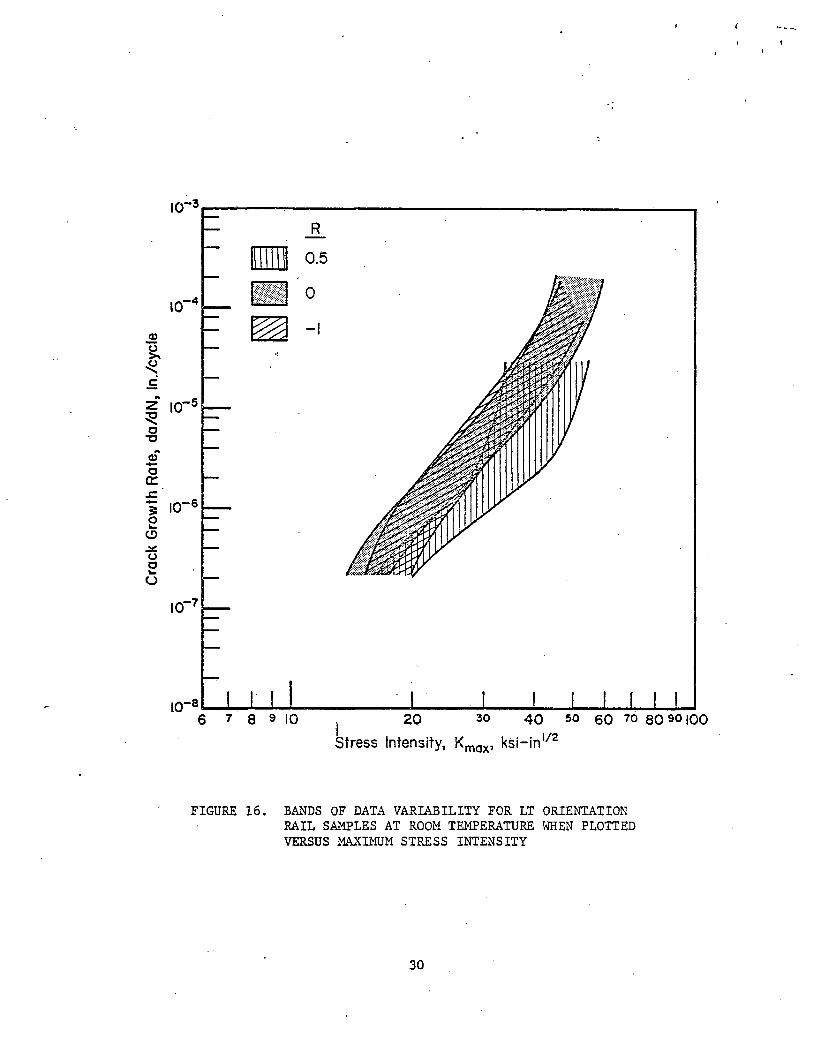
The effects of R-ratio displayed in Figure 15 are partially accountedfor by simply considering crack-growth rate as a function of m a x i m u m stressintensity, K .rather than AK. Figure 16 illustrates the result of that max °simple transformation. The R = 0.0 and -1.0 data bands nearly overlap for allvalues of Km g y , w hich effectively means that negative loads are insignificantfactors in the propagation of cracks in rail steels (at least for constantamplitude loading conditions). The R = 0.5 data band does not coincide withthe lower R ratio bands, which indicates that some combination of K and AKm a xis necessary to accurately represent the effects of positive R-ratios on crack-growth rates.
The analytical representation o f observed R-ratio effects is given in Section 7 of this report.
5.3 Specimen Orientation Effects
)28
/
Crac
k Gr
owth
Rat
e, d
a/dN
, In.
/cyc
le
t
6 * 8 9 10 20 30 40 50 6 0 ?o 8 0 so |00Stress Intensity, AK, ksi-in.,/2
FIG U R E 15. BANDS OF DAT A VARIABILITY F O R LT ORIENTATION RAIL SAMPLES A T RO O M TEMPERATURE
29
Crac
k Gr
owth
Rat
e, d
a/dN
, In.
/cyc
le
(t
6 7 8 9 10 J 20 3 0 4 0 5 0 60 7 0 80 90 100
Stress Intensity, Kmcjx, ksi-inl/2
FIGURE 16. BANDS OF D A T A VAR I A B I L I T Y F O R LT ORIENTATION RAIL SAMPLES AT R O O M T E M P ERATURE WHEN PLOTTED VERSUS M A X I M U M STRESS INTENSITY
30
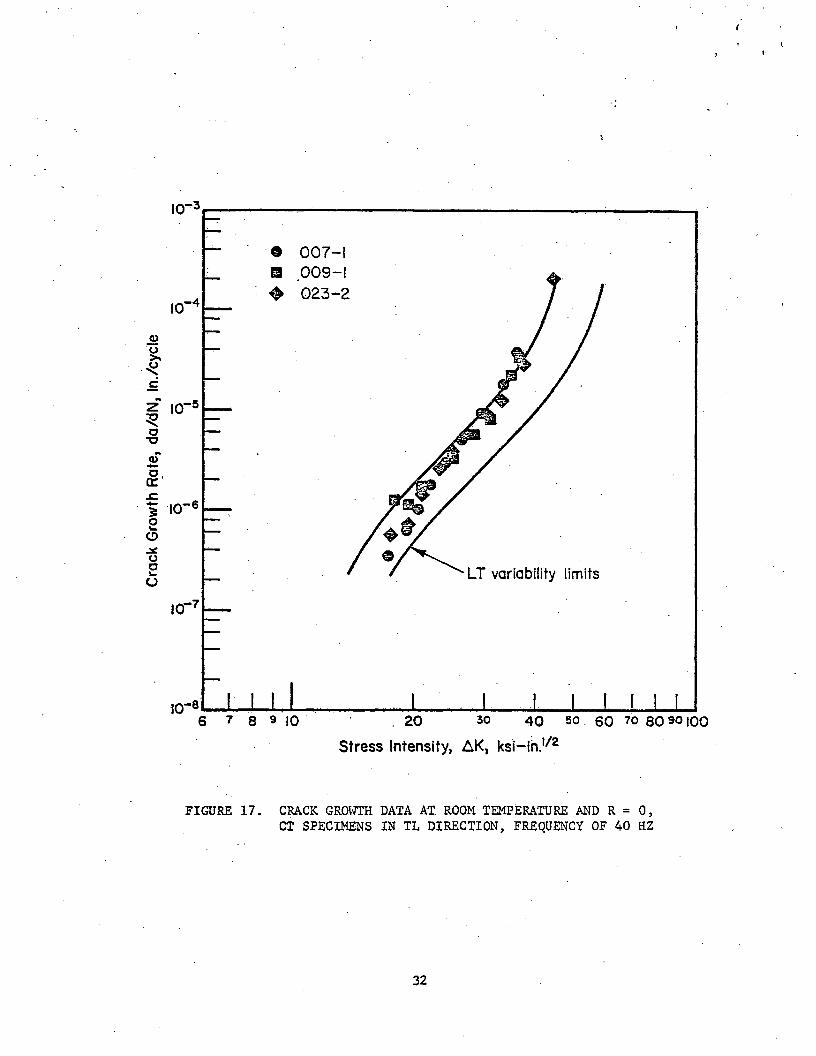
Twelve CT specimens were tested at room temperature to evaluate the effect of crack orientation on Mode I crack-growth rates. Nine specimens were TL orientation samples, and three were SL orientation. Half of the experiments were completed at R = 0.50 (all TL. orientation) and the other half were run at R = 0.0. The results of those experiments are shown in Figures 17 through 19 for the different R-ratio and orientations.
From Figures 17 and 18 it is evident that the crack-growth behavior of the TL orientation specimens was not grossly different from that of the LT orientation data shown in Figures 12 and 14. For purposes of comparison, the upper and lower limits of variability on the LT orientation specimens are shown with the basic TL orientation data. The TL data tend to fall to the high side of the LT data band, at high crack-growth rates for R = 0.0, and at low crack-growth rates for R = 0.5. The differences are sufficiently small, however, that the TL orientation data could be used to represent a conservative (high-growth rate) LT orientation sample.
The same conclusion cannot be made for the SL orientation crack-growth data shown in Figure 19. For all stress intensities, the SL data fall above the LT orientation data bands. The definite indication is that, SL-orientation flaws would grow faster than LT- or TL-orientation flaws subjected to equal crack tip stress.intensities.
The comparative crack-growth trend lines for the three specimen orientations are shown in Figure 20.
5.4 Temperature Effects
A rather extensive series of crack-growth experiments was completed at high and low extremes in expected rail service temperatures to.evaluate the effect of temperature on crack-growth rates. A'total of 20 LT and 13 TL orientation specimens were fatigue cycled under constant-amplitude loading conditions at R = 0.0 and 0.50 and at temperatures of +140 F and -40 F.
The LT orientation crack-growth results at +140 F are shown in Figures 21 and 22 for R-ratios of 0.0 and 0.50, respectively, while the comparable data generated at -40 F are shown in Figures 23 and 24. Generally, the effects of increased temperature on crack-growth rates appears to be to reduce the slope of the da/dN-AK function and to increase the critical stress intensity limit
31
Crac
k Gr
owth
Rat
e, d
a/dN
, in.
/cyc
le
f <
(
Stress Intensity, AK, ksi-ih.,/2
FIGURE 17. CRACK GROWTH DATA AT ROOM TEMPERATURE AND R = 0,CT SPECIMENS IN TL DIRECTION, FREQUENCY OF 40 HZ
32
Crac
k Gr
owth
Rat
e, d
a/dN
, in.
/cyc
le
1
FIGURE 18. CRACK GROWTH DATA AT ROOM TEMPERATURE AND R = 0.5,CT SPECIMENS IN TL DIRECTION, FREQUENCY OF 40 HZ
33
Crac
k Gr
owth
Rat
e, d
a/dN
, In.
/cyc
le
i
Stress Intensity, AK, ksMn.,/2
FIGURE 19'. CRACK GROWTH DATA AT ROOM TEMPERATURE AND R = 0,CT SPECIMENS IN SL DIRECTION, FREQUENCY OF 40 HZ
34
Crac
k Gr
owth
Rat
e, d
a/dN
, In.
/cyc
le
FIGURE 20. FCP TREND LINES FOR RAIL SAMPLES TESTED AT ROOM TEMPERATURE IN 3 DIFFERENT ORIENTATIONS
3 5
Crac
k Gr
owth
Rat
e, d
a/dN
, In.
/cyc
le
Stress Intensity, AK, ksi-in.,/z
FIGURE 21. CRACK GROWTH DATA AT +140 F AND R = 0,CT SPECIMENS IN LT ORIENTATION
36

Crac
k Gr
owth
Rat
e, d
a/dN
, (n.
/cyc
le
FIGURE 22. CRACK GROWTH DATA A T + 1 4 0 F AND R = 0.5, CT SPECIMENS IN LT ORIENTATION
37
Crac
k Gr
owth
Rat
e, d
a/dN
, in.
/cyc
le
l O'3
I O ' 4
I O ' 5
I O ' 6
I O " 7
IO'8
O
6 7 8 9 IO 20 30 40 50 60 ?o 8 0 90 |Q0Stress Intensity, AK, ksi-in.l/2
FIGURE 23. CRACK GROWTH DATA AT -40 F AND R = 0,CT SPECIMENS IN LT DIRECTION
38
Crac
k Gr
owth
Rat
e, d
a/dN
, in.
/cyc
le
f
*
FIGURE 24. CRACK GROWTH DATA AT -40 F AND R = 0.5,CT SPECIMENS IN LT ORIENTATION
39
at high crack-growth rates. This trend is especially evident in Figure 22 for the R = G.50 data. Conversely, the effects of decreased temperature on crack-growth rates appears to be to increase the slope of the da/dN-AK function and to decrease the critical stress intensity. These conclusions are most clearly illustrated in Figure 25 where the trend lines for LT orientation samples are shown for all test temperatures and stress ratios.
The same general effect of temperature on crack-growth rates was found for the TL orientation samples that were tested. These data are presented in Figures 26 and 27 for the +140 F experiments and in Figures 28 and 29 for the -40 F tests. The composite results of the TL orientation experiments are shown in Figure 30 for R = 0.0 and R = 0.50.
It is also important to note that the superior crack-growth characteristics of LT-orientation specimens are-maintained at both high and low temperature, regardless of stress ratio. This trend is best observed through comparison of composite Figures 25 and 30.
5.5 Frequency Effects
The potential effect of cyclic frequency on crack-growth rates was evaluated through completion of nine CT-type specimen tests on LT orientation samples cycled- at 2 cycles/second (Hz) and an R-ratio of zero.This rate of cycling was more than an order of magnitude slower than most of the tests completed under otherwise identical test conditions. Laboratory-air environmental conditions were maintained for these experiments, as they had been for all other crack-growth tests in this program.
The results of those experiments are included in Figures 12, 21, and 23 for test temperatures of +68 F, +140 F, and -40 F. As these plots illustrate, there was no discernable effect of the reduced cyclic frequency on crack-growth trends at any of the test temperatures.
5.6 Threshold Experiments
Experiments were completed at three stress ratios (R = -1.0, 0.0, and 0.50) to develop estimates of threshold stress intensity levels, below
40

Crac
k Gr
owth
Rat
e, d
a/dN
, in.
/cyc
le
FIGURE 25. FCP TREND LINES FOR LT ORIENTATION RAIL SAMPLES AT 3 TEMPERATURES AND R RATIOS
41
Crac
k Gr
owth
Rat
e, d
a/dN
, in.
/cyc
le
Stress Intensity, AK, ksMn.,/2
FIGURE 26. CRACK GROWTH DATA AT +140 F AND R = 0, CT SPECIMENS IN TL DIRECTION
42
Crac
k Gr
owth
Rat
e, d
a/dN
, in.
/cyc
le
FIGURE 27. CRACK GROWTH DATA AT +140 F AND R = 0.5, CT SPECIMENS IN TL DIRECTION
4 3
Crac
k Gr
owth
Rat
e, d
a/dN
, in.
/cyc
le
i
FIGURE 28. CRACK GROWTH DATA AT -40 F AND R = 0,CT SPECIMENS IN TL DIRECTION
44
Crac
k Gr
owth
Rat
e, d
a/dN
, in.
/cyc
le
FIGURE 29. CRACK GROWTH DATA AT -40 F AND R = 0.5,CT SPECIMENS IN TL DIRECTION
45
Crac
k Gr
owth
Rat
e, d
a/dN
, In.
/cyc
le
Stress Intensity, AK, ksi-in.,/z
FIGURE 30. FCP TREND LINES FOR TL ORIENTATION RAIL SAMPLES AT 3 TEMPERATURES AND 2 R RATIOS
4 6
which crack-growth rates would asymptotically approach zero. The R = 0.0and 0.50 stress ratios were evaluated usihg CT specimens; both LT and TLorientation samples wer e tested. The R = -1.0 stress ratio condition wasevaluated u sing an LT orientation, SEN specimen.
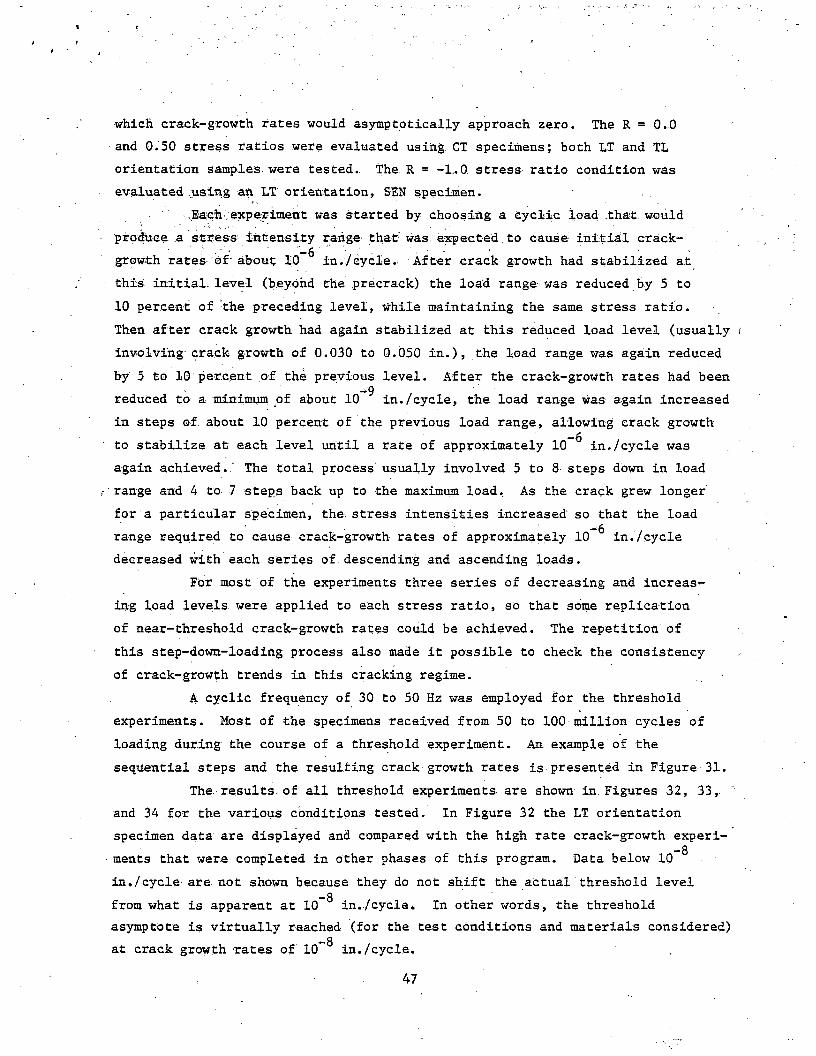
Each experiment was started by choosing a cyclic load .that wouldproduce a stress intensity range that was expected to cause initial crack-growth rates of about 10 in./cycle. After crack growth had stabilized atthis initial, level (beyond the precrack) the load range was reduced by 5 to10 percent of the preceding level, While maintaining the same stress ratio.Then after crack growth had again stabilized at this reduced load level (usuallyinvolving crack growth of 0.030 to O.05O in.), the load range was again reducedby 5 to 10 percent of the previous level. A fter the crack-growth rates had been
-9reduced to a m i n i m u m of about 10 in./cycle, the load range was again increasedin steps of about 10 percent of the previous load range, allowing crack growth
—6to stabilize at each level until a rate of approximately 10 in./cycle was again achieved.. The total process usually involved 5 to 8 steps down in load range and 4 to 7 steps back up to the maximum load. As the crack grew longer for a particular specimen, the. stress intensities increased so that the load range required to cause crack-growth rates of approximately 10 ^ in./cycle decreased with each series o f .descending and ascending loads.
For most of the experiments three series of decreasing and increas
ing load levels were applied to each stress ratio, so that some replication
of near-threshold crack-growth rates could be achieved. The repetition of
this step-down-loading process also made it possible to check the consistency
of crack-growth trends in this cracking regime.
A cyclic frequency of 30 to 50 Hz w a s employed for the threshold experiments. Most of the specimens received from 50 to 100 million cycles of loading during the course of a threshold experiment. An example of the sequential steps and the resulting crack growth rates is presented in Figure 31.
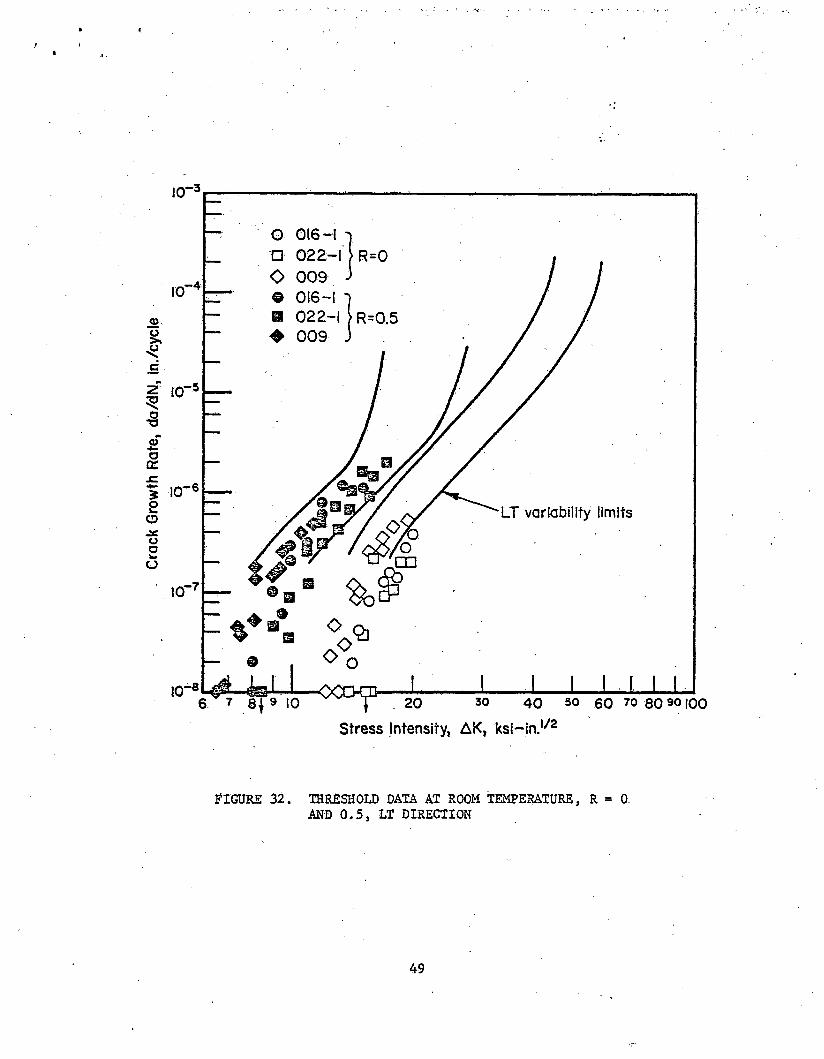
The results, of all threshold experiments are shown in Figures 32, 33, and 34 for the various conditions tested. In Figure 32 the LT orientationspecimen data a r e displayed and compared wit h the high rate crack-growth experi-
-“8ments that wer e completed in other phases of this program. Data below 10in./cycle are not shown because they do not shift the actual threshold level
—8from what is apparent at 10 in./cycle. In other words, the threshold asymptote is virtually reached (for the test conditions and materials considered)Oat crack growth rates of 10 in./cycle.
4 7
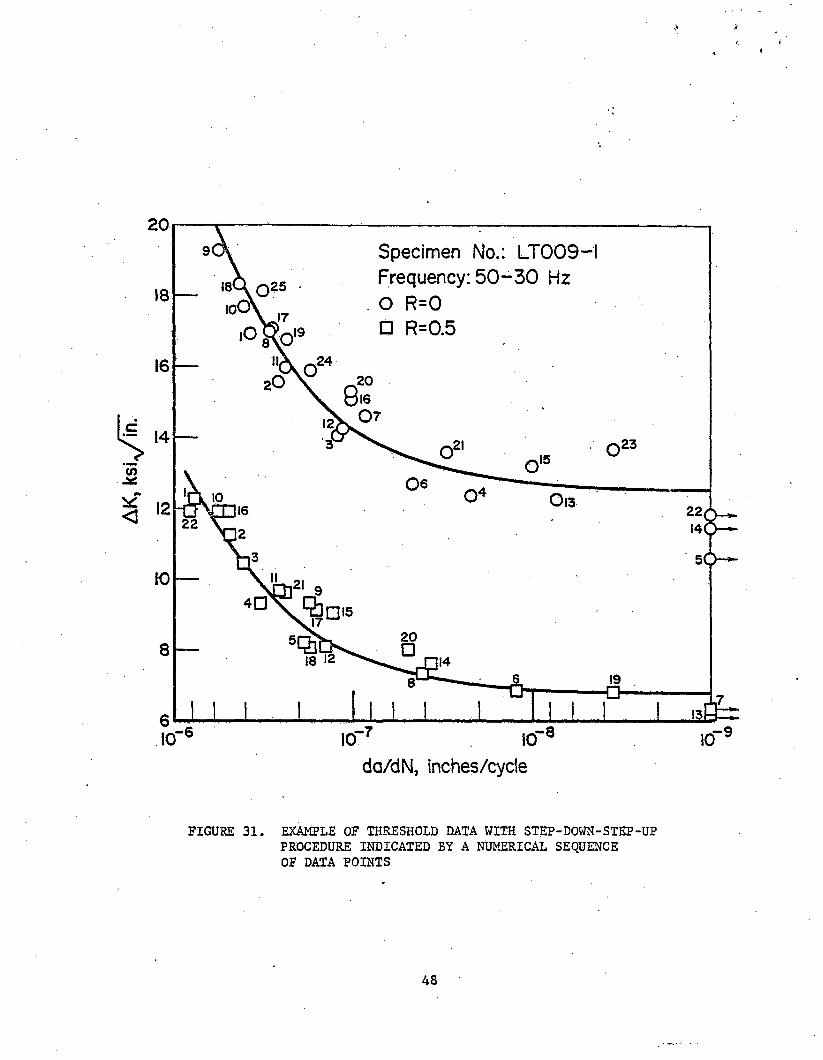
FIGURE 31. EXAMPLE OF T H R E S H O L D DATA W I T H S T E P-DOWN-STEP-UP PR O C E D U R E INDICATED BY A N U M ERICAL SEQUENCE OF DATA POINTS
48
Crack G
rowth R
ate, d
a/dN, i
n./cycle
/ 4k
FIGURE 32. THRESHOLD DATA AT ROOM TEMPERATURE, R = 0AND 0.5, LT DIRECTION
49

Crack G
rowth R
ate, d
a/dN, I
n./cycle
fv i< •
FIGURE 33. THRESHOLD DATA AT ROOM TEMPERATURE, R = 0AND 0.5, TL DIRECTION
50
Crac
k Gr
owth
Rat
e, d
a/dN
, in.
/cyc
le
i »i
FIGURE 34. THRESHOLD DATA AT ROOM TEMPERATURE, R = -1, LT DIRECTION
51

* ✓<
Figure 33 displays the threshold data for the TL orientation specimens. Comparing the TL and LT orientation threshold data, it is apparent that for similar stress ratios the TL orientation results in slightly higher crack-growth rates and lower threshold stress intensities. For the LT orientation samples tested, threshold stress intensity ranges varied from 6.5 to 9 and 12 to 15 for R =* 0.50 and 0.00, respectively; while the TL orientation samples exhibited threshold stress intensity ranges of 5 to 6 and 8 to 11 for the same stress ratios.
Figure 34 presents the threshold data generated on LT orientation, SEN-type specimens. These data do not correspond as well to the high-rate crack-growth experiments as might have been expected based on the LT orientation results presented in Figure 32 for R = 0.0 and 0.50. On the average, however, the data do match the high growth-rate side of the data-variability band generated earlier using SEN specimens tested at R = -1.00. Apparent threshold values for the R = -1.00 stress ratio condition vary from about 12 to 19.
5.7 Surface Flaw Experiments
In addition to the large number of SEN and CT type specimen tests performed in this program, six surface flaw crack-propagation experiments were also performed to evaluate the more complex 2-dimensional cracking behavior typical of many in-service embedded flaws.
The surface flaw specimens were machined from the rail head (Figure 6) so that a flaw machined in its side surface would propagate in a manner similar to a transverse fissure. The cracking orientation of this specimen is properly described as LT for through-the-thickness crack growth and LS for through-the-width crack extension. In reality, since the crack surface is curved, a combination of LT and LS material properties would be expected to control the surface flaw-cracking process.
An initial semicircular flaw, 0.50-in. long and approximately 0.010 in. wide was EDM machined in the side surface of each specimen as shown in Figure 3. This relatively large, 0.250-in. deep flaw was required to achieve initial stress intensities sufficiently high to reach specimen failure in 1 to 2 million cycles.
52
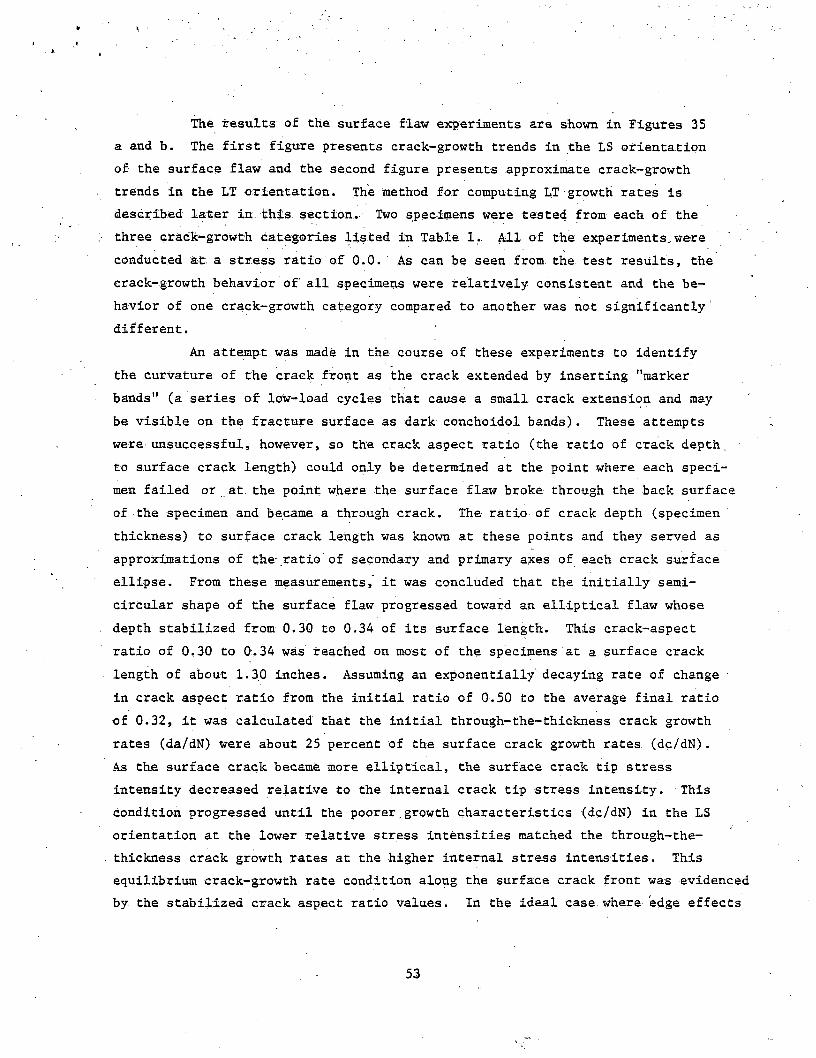
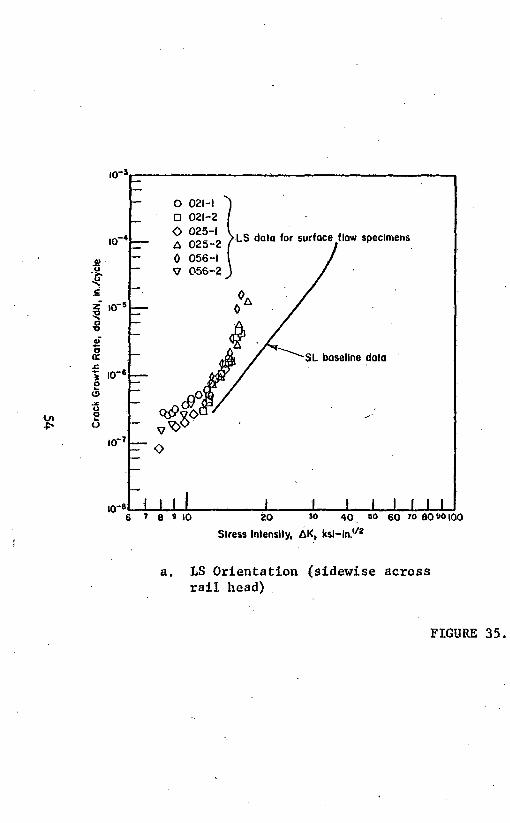
The results of the surface flaw experiments are shown in Figures 35 a and b. The first figure presents crack-growth trends in the LS orientation of the surface flaw and the second figure presents approximate crack-growth trends in the LT orientation. The method for computing LT growth rates is described later in this section. Two specimens were tested from each of the three crack-growth categories listed in Table 1. All of the experiments.were conducted at. a stress ratio of 0.0. As can be seen from the test results, the crack-growth behavior of all specimens were relatively consistent and the behavior of one crack-growth category compared to another was not significantly different.
An attempt was made in the course of these experiments to identify the curvature of the crack front as the crack extended by inserting "marker bands" (a series of low-load cycles that cause a small crack extension and may be visible on the fracture surface as dark conchoidol bands). These attempts were*unsuccessful, however, so the crack aspect ratio (the ratio of crack depth, to surface crack length) could oply be determined at the point where each specimen failed or at. the point where the surface flaw broke through the back surface of the specimen and became a through crack. The ratio of crack depth (specimen thickness) to surface crack length was known at these points and they served as approximations of the* ratio of secondary and primary axes of each crack surface ellipse. From these measurements, it was concluded that the initially semicircular shape of the surface flaw progressed toward an elliptical flaw whose depth stabilized from 0.30 to 0.34 of its surface length. This crack-aspect ratio of 0.30 to 0.34 was reached on most of the specimens at a surface crack length of about 1.30 inches. Assuming an exponentially decaying rate of change in crack aspect ratio from the initial ratio of 0.50 to the average final ratio of 0.32, it was calculated that the initial through-the-thickness crack growth rates (da/dN) were about 25 percent of the surface crack growth rates (dc/dN).As the surface crack became more elliptical, the surface crack tip stress intensity decreased relative to the internal crack tip stress intensity. This condition progressed until the poorer.growth characteristics (dc/dN) in the LS orientation at the lower relative stress intensities matched the through-the- thickness crack growth rates at the higher internal stress intensities. This equilibrium crack-growth rate condition along the surface crack front was evidenced by the stabilized crack aspect ratio values. In the ideal case where edge effects
53
Cro
ck
Gro
wth
Ra
te,
da
/dN
, in
./cy
de
a. LS Orientation (sidewise across rail head)
FIG U R E 35
Crack Gro
wth Rate, da/dN
, in./cycl
e
b. LT O r i e ntation (down through the rail h e a d toward web)
SF DATA
are negligible, Equation (4.10) predicts that an elliptical flaw w i t h a crack aspect ratio of 0.32 has a stress intensity 10 percent lower at its major axis tip than it does at the minor axis tip. In this actual case, results indicate that crack tip stress intensities in the LS orientation need be only 90 percent of those in the LT orientation to cause equal crack growth rates. From this observation, it became apparent that through-the-width crack-growth rates (LS, orientation) wer e higher than through-the-thickness crack-growth rates (LT o r i e n t a t i o n ) . This behavior was consistent with/ t h e previously observed effects of orientation on crack growth.
55
6. MIXED MODE
6.1 Test Results
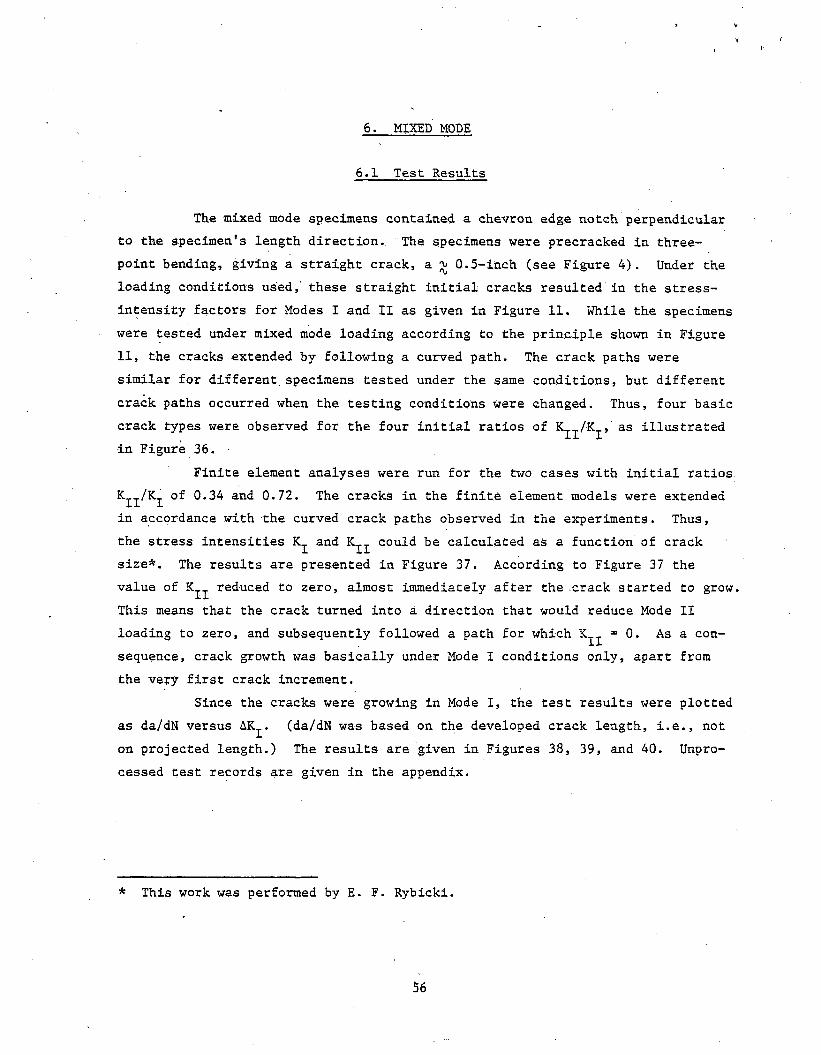
The mixed mode specimens contained a chevron edge notch perpendicular to the specimen's length direction. The specimens were precracked in three- point bending, giving a straight crack, a ^ 0.5-inch (see Figure 4). Under the loading conditions used," these straight initial cracks resulted in the stress- intensity factors for Modes I and II as given in Figure 11. While the specimens were tested under mixed mode loading according to the principle shown in Figure 11, the cracks extended by following a curved path. The crack paths were similar for different specimens tested under the same conditions, but different crack paths occurred when the testing conditions were changed. Thus, four basic crack types were observed for the four initial ratios of K^/Kj., as illustrated in Figure 36.
Finite element analyses were run for the two cases with initial ratios K^/K^ of 0.34 and 0.72. The cracks in the finite element models were extended in accordance with the curved crack paths observed in the experiments. Thus, the stress intensities and could be calculated as a function of crack size*. The results are presented in Figure 37. According to Figure 37 the value of K reduced to zero, almost immediately after the crack started to grow This means that the crack turned into a direction that would reduce Mode II loading to zero, and subsequently followed a path for which =0. As a consequence, crack growth was basically under Mode I conditions only, apart from the very first crack increment.
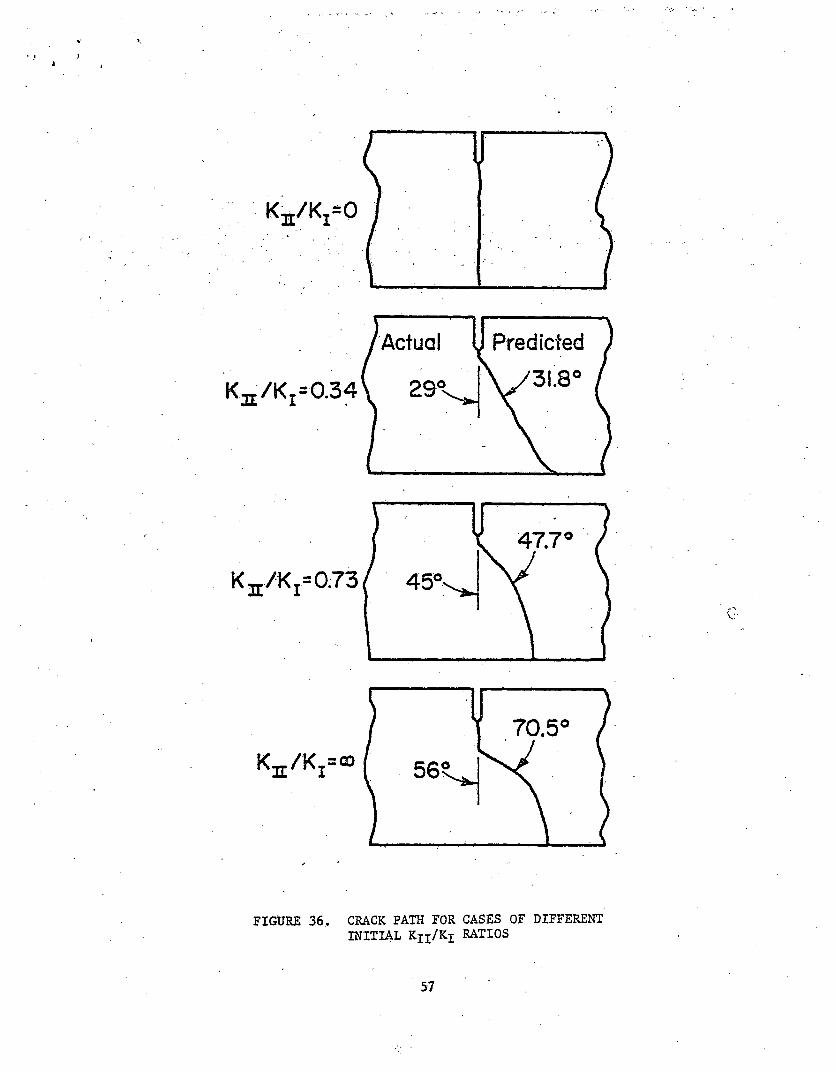
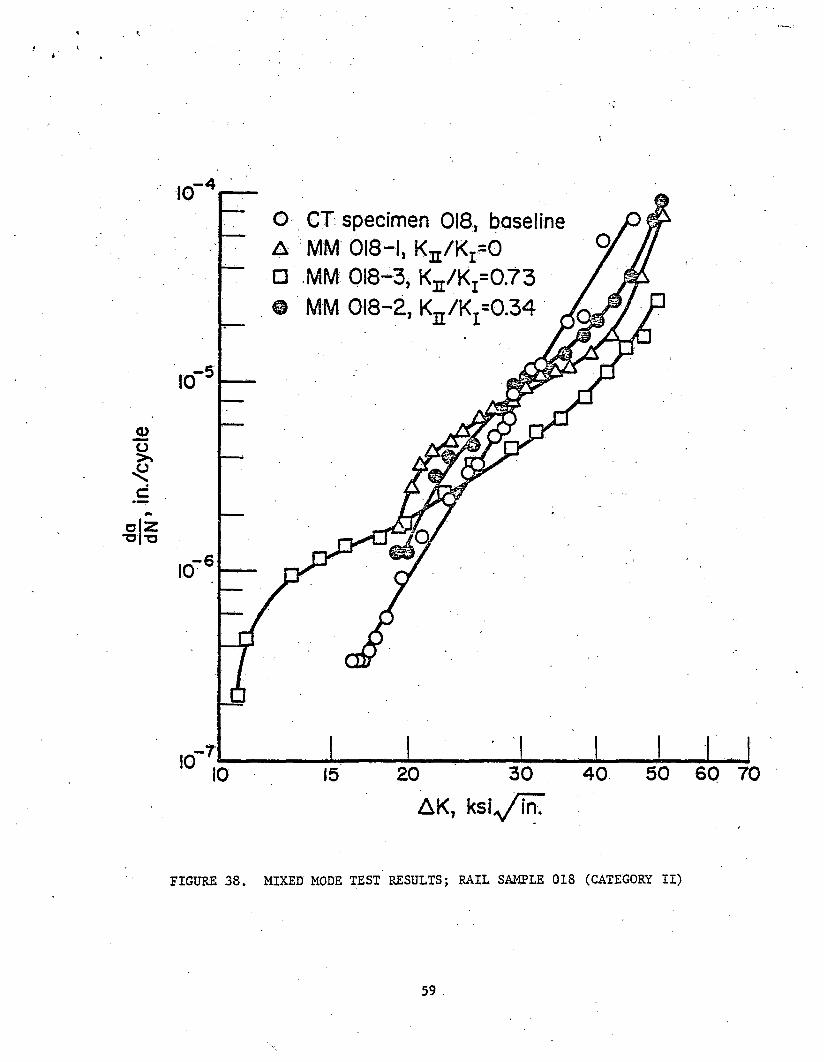
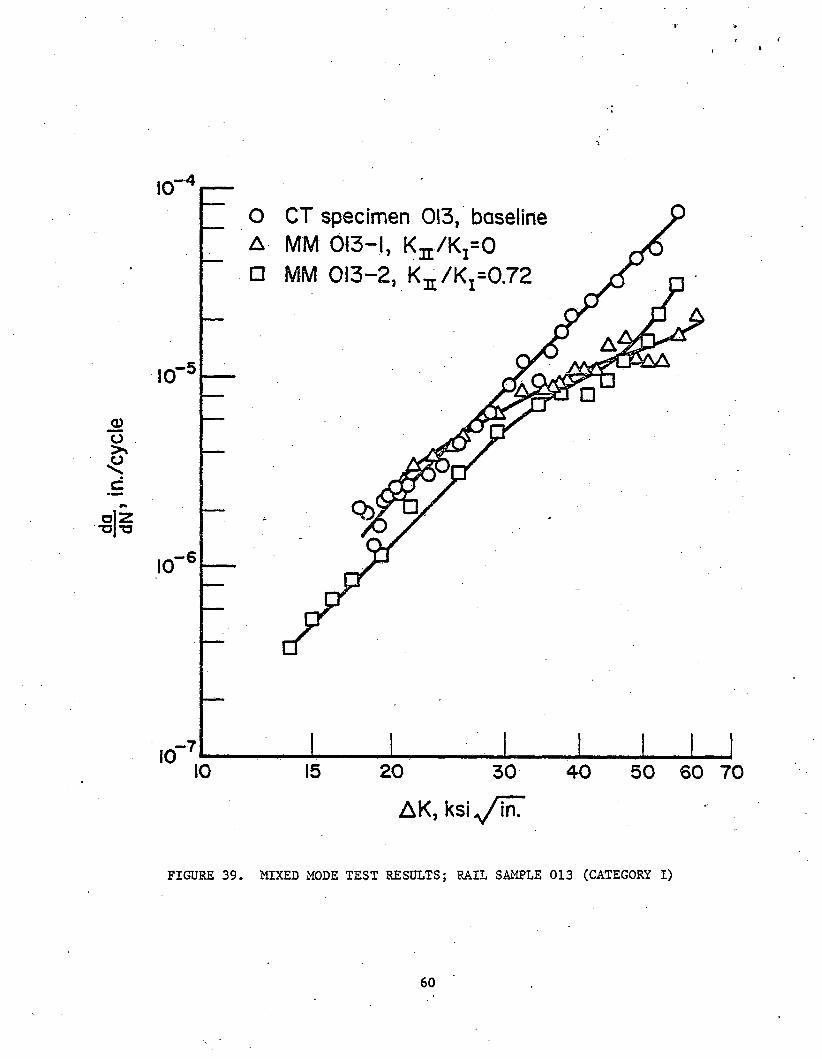
Since the cracks were growing in Mode I, the test results were plotted as da/dN versus AK .. (da/dN was based on the developed crack length, i.e., not on projected length.) The results are given in Figures 38, 39, and 40. Unprocessed test records are given in the appendix.
* This work was performed by E. F. Rybicki.
56
G
FIGURE 36. CRACK PATH FOR CASES OF DIFFERENT INITIAL Kxx/Kx RATIOS
57

ujj/'isd
FIGURE 37. Kj AND K n FOR ACTUAL CRACK CASES (SPECIMEN OF UNIT THICKNESS)
5 8
in./c
ycle
t- AtI.
FIGURE 38. MIXED MODE TEST RESULTS; RAIL SAMPLE 018 (CATEGORY II)
59
in./
cycl
e
o ZTJ T3
10,-4
10- 5
10- 6
10—7
10
O C T s p e c i m e n 013, baseline
A M M 01 3 - 1 , K jj. / K ^ O
□ M M 0 1 3 - 2 , K ^ / K ^ O . 7 2
15 2 0 3 0 4 0
A K , ksi^/TfT
5 0 6 0 7 0
FIGURE 39. MIXED MODE TEST RESULTS; RAIL SAMPLE 013 (CATEGORY I)
60
Crac
k Gr
owth
Rat
e, d
a/dN
, in
./cyc
le
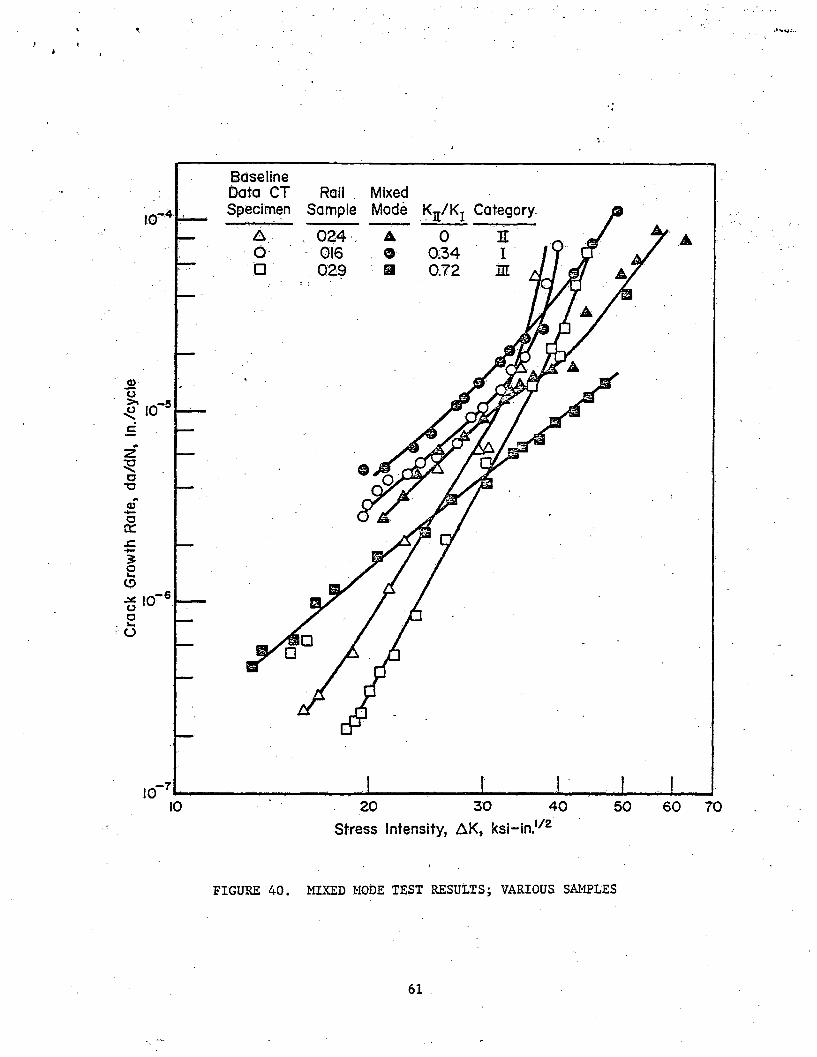
FIGURE 40. MIXED MODE TEST RESULTS; VARIOUS SAMPLES
61
*
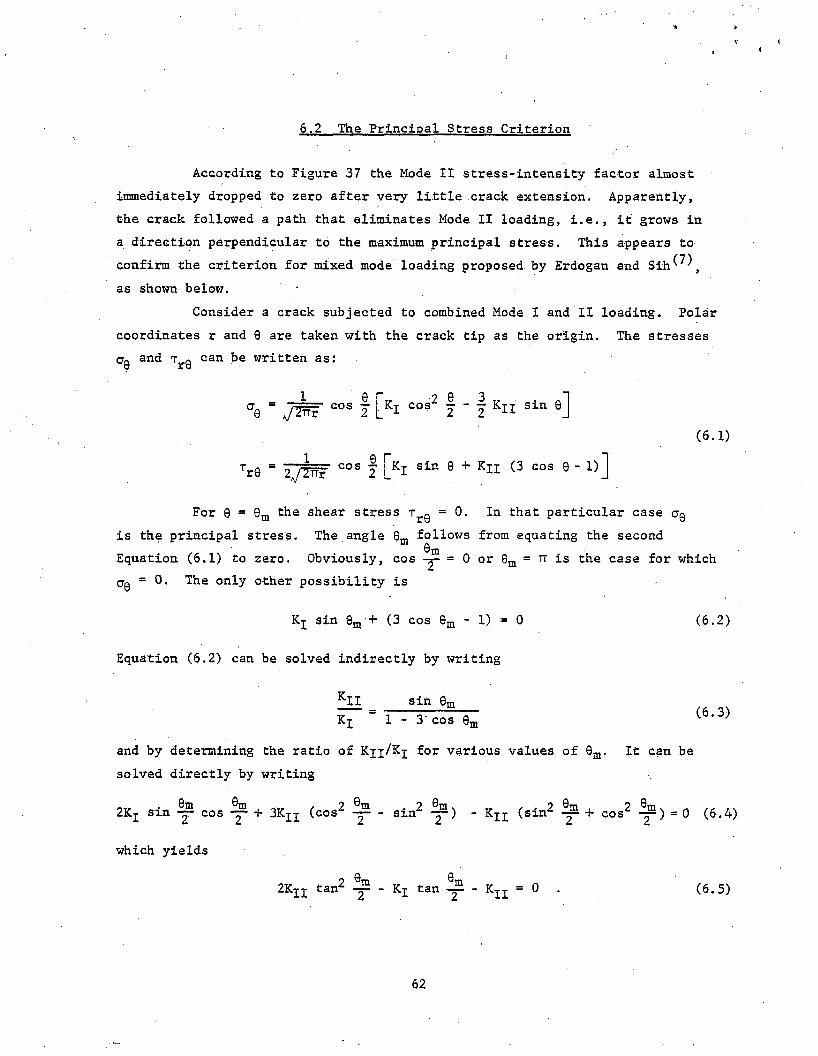
6.2 The Principal Stress Criterion
According to Figure 37 the Mode II stress-intensity factor almost immediately dropped to zero after very little crack extension. Apparently, the crack followed a path that eliminates Mode II loading, i.e., it grows in a direction perpendicular to the maximum principal stress. This appears to confirm the criterion for mixed mode loading proposed by Erdogan and Sih^, as shown below. •
Consider a crack subjected to combined Mode I and II loading. Polar coordinates r and 9 are taken with the crack tip as the origin. The stresses Oq and Trg can be written as:
CTe = J W T cos I [Ki cos2 I " I Kn sin e](6.1)
rr9 = 2 j 2 T f x G°S 2 i"KI sin 9 + KH (3 cos 9 - !)]
For 9 = 9m the shear stress Trg = 0. In that particular case egis the principal stress. The angle 9m follows from equating the second
6mEquation (6.1) to zero. Obviously, cos y = 0 or 0m = tt is the case for which CTq * 0. The only other possibility is
Kj sin 9m + (3 cos 9m - 1) = 0
Equation (6.2) can be solved indirectly by writing
(6.2)
K;K,II sin 8n
3' cos 9-n’‘I i . -
and by determining the ratio of Kxi/Kx various values of 9m . It can be solved directly by writing
(6.3)
6m 9,2Kj sin y cos y + 3Kjj (cos^ y - sin^ y ) - KXx (sin^ y + cos^ y ) = 0 (6.4)
which yields0 92KI]; tan2 y - Kr tan y - Kn = 0 . (6.5)
.2 9m 2 9m 1 —== ,. 2 9m .2 em
62
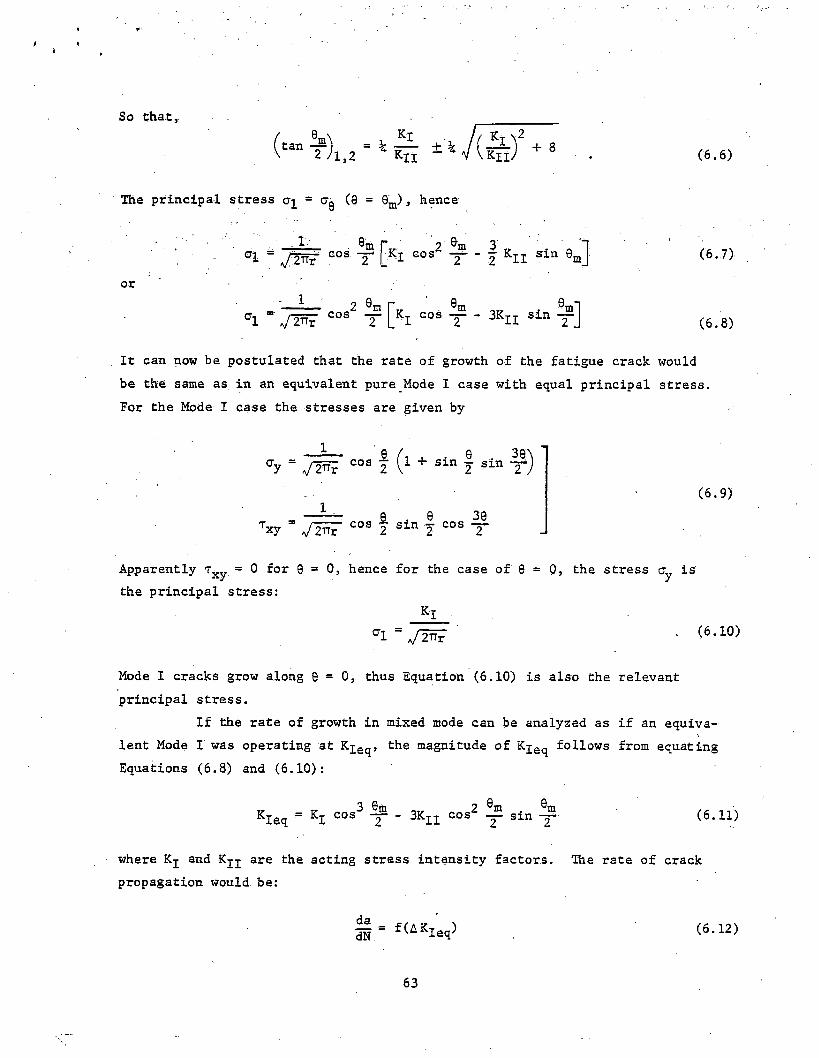
So Chat,
taa- ? h , 2 - k z k ± i J i m ) 2 + s
The principal stress a^ = 0q (9 = 9m), hence
— L • ®m T 2 ®m 3 . '■ n = / 2 % eos T l_KI cos — - 2 KII Sin 9m_
or
CT1 ~ ,72^ cos2 9? [ ■JmKj cos ~ - 3K]-]- sin. ®m*l
“ t j
(6.6)
(6.7)
(6.8)
It can now be postulated that the rate of growth of the fatigue crack would be the same as in an equivalent pure Mode I case with equal principal stress. For the Mode I case the stresses are given by
1 ' Q / q 3q\°y = /2TTr C0S 2 \1 + Sin 2 sin T V
Txy = C0S 2 sin 1 cos T
Apparently TX y = 0 for 9 = 0 , hence for the case of 9 = 0, the principal stress:
(6.9)
the stress ay is
%al = # k (6.10)
Mode I cracks grow along 9 = 0 , thus Equation (6.10) is also the relevant principal stress.
If the rate of growth in mixed mode can be analyzed as if an equivalent Mode I was operating at Kjeq, the magnitude of Kjeq follows from equating Equations (6.8) and (6.10):
KIeq = KI cos3 ^2 ~ 3KII cos2 T sin T (6-U)
where Kj and Kjj are the acting stress intensity factors. The rate of crack propagation would be:
dadN f(AKIeq) (6.12)
63
• \
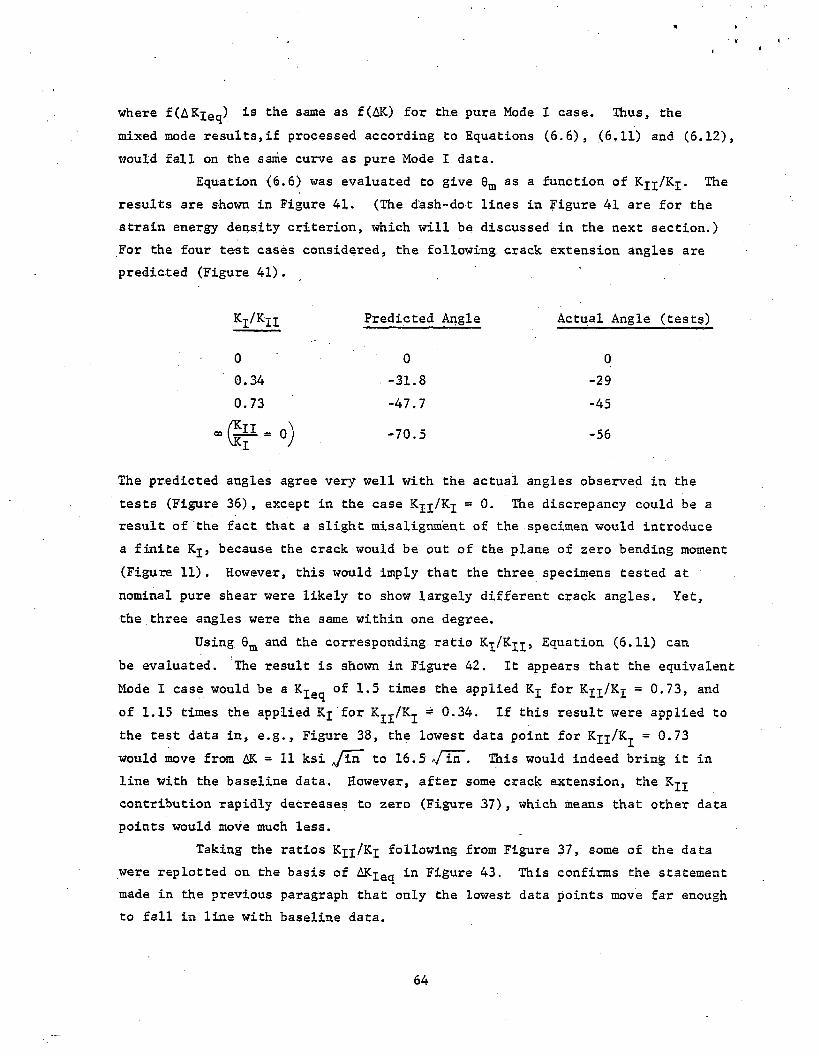
where f(AKjeg) is the same as f(AK) for the pure Mode I case. Thus, the mixed mode results,if processed according to Equations (6.6), (6.11) and (6.12), would fall on the same curve as pure Mode I data.
Equation (6.6) was evaluated to give 0m as a function of Kjj/Kj . The results are shown in Figure 41. (The dash-dot lines in Figure 41 are for the strain energy density criterion, which will be discussed in the next section.) For the four test cases considered, the following crack extension angles are predicted (Figure 41).
^I^II Predicted Angle Actual Angle (tests)
0 0 00.34 .-31.8 -290.73 -47.7 -45
S1- 0) -70.5 -56
The predicted angles agree very well with the actual angles observed in the tests (Figure 36), except in the case Kn/Kj ~ 0* The discrepancy could be a result of the fact that a slight misalignment of the specimen would introduce a finite Kj, because the crack would be out of the plane of zero bending moment (Figure 11). However, this would imply that the three specimens tested at nominal pure shear were likely to show largely different crack angles. Yet, the three angles were the same within one degree.
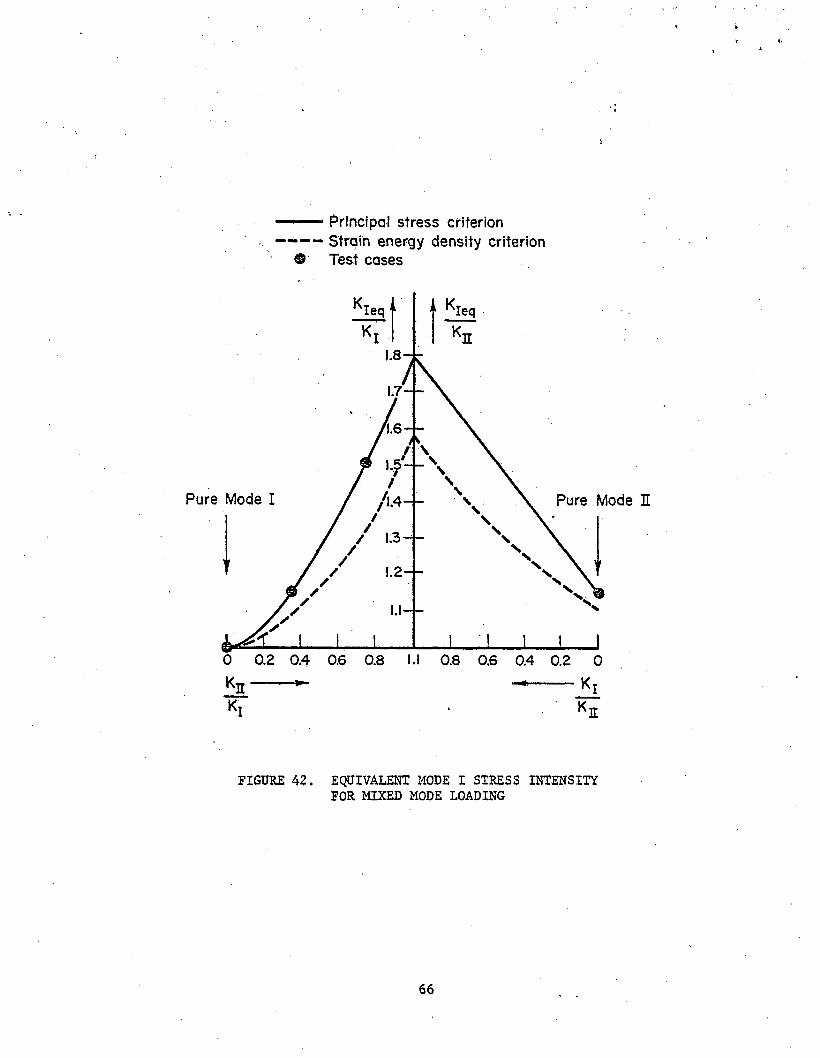
Using 9m and the corresponding ratio Equation (6.11) canbe evaluated. The result is shown in Figure 42. It appears that the equivalent Mode I case would be a K-j-e(j of 1.5 times the applied Kj for = 0.73, andof 1.15 times the applied Kj for = 0.34. If this result were applied tothe test data in, e.g., Figure 38, the lowest data point for = 0.73would move from AK = 11 ksi J in to 16.5 V in . This would indeed bring it in line with the baseline data. However, after some crack extension, the K-q contribution rapidly decreases to zero (Figure 37), which means that other data points would move much less.
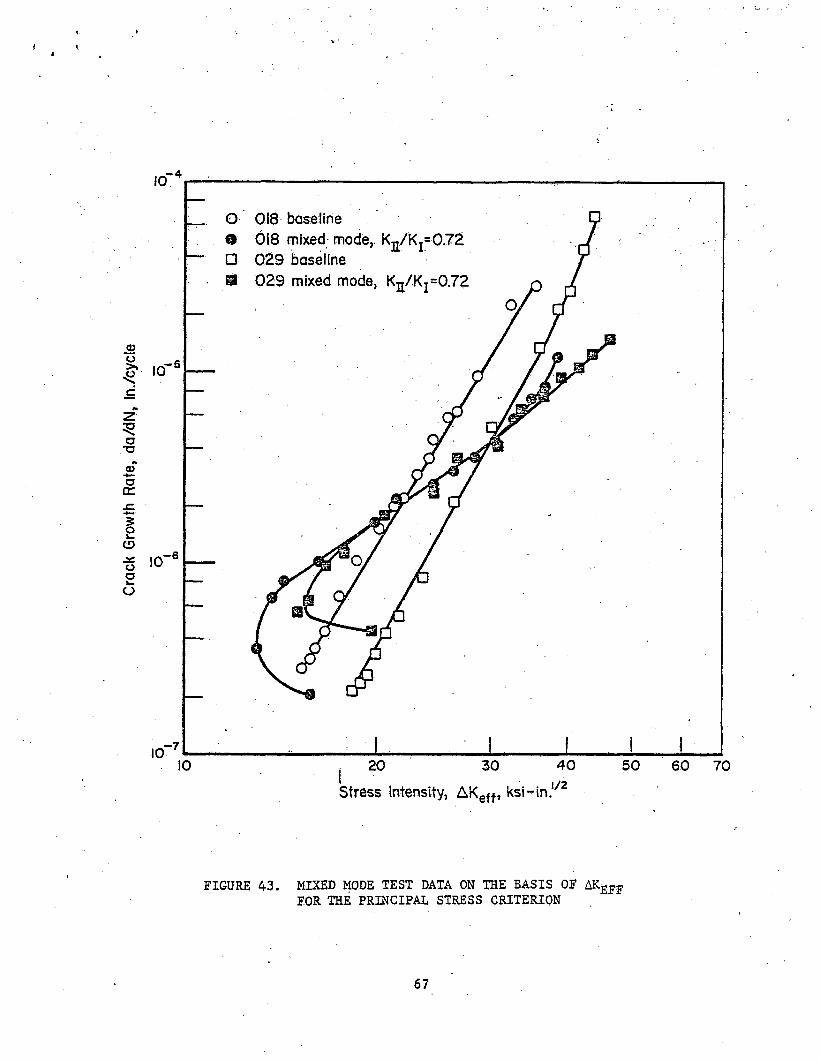
Taking the ratios following from Figure 37, some of the datawere replotted on the basis of AK^gq in Figure 43. This confirms the statement made in the previous paragraph that only the lowest data points move far enough to fall in line with baseline data.
64

.....Principal stress criterion— — Strain energy density criterion (v-j)
© Test cases
Qm , degrees
FIGURE 41. CRACK EXTENSION ANGLE FOR MIXED MODE LOADING
65
...........Principal stress criterion------ Strain energy density criterion
© Test cases
FIGURE 42. EQUIVALENT MODE I STRESS INTENSITY FOR MIXED MODE LOADING
6 6
Crac
k Gr
owth
Rat
e, d
a/dN
, In
./cyc
le
FIGURE 43. MIXED MODE TEST DATA ON THE BASIS OF AK£FF FOR THE PRINCIPAL STRESS CRITERION
67
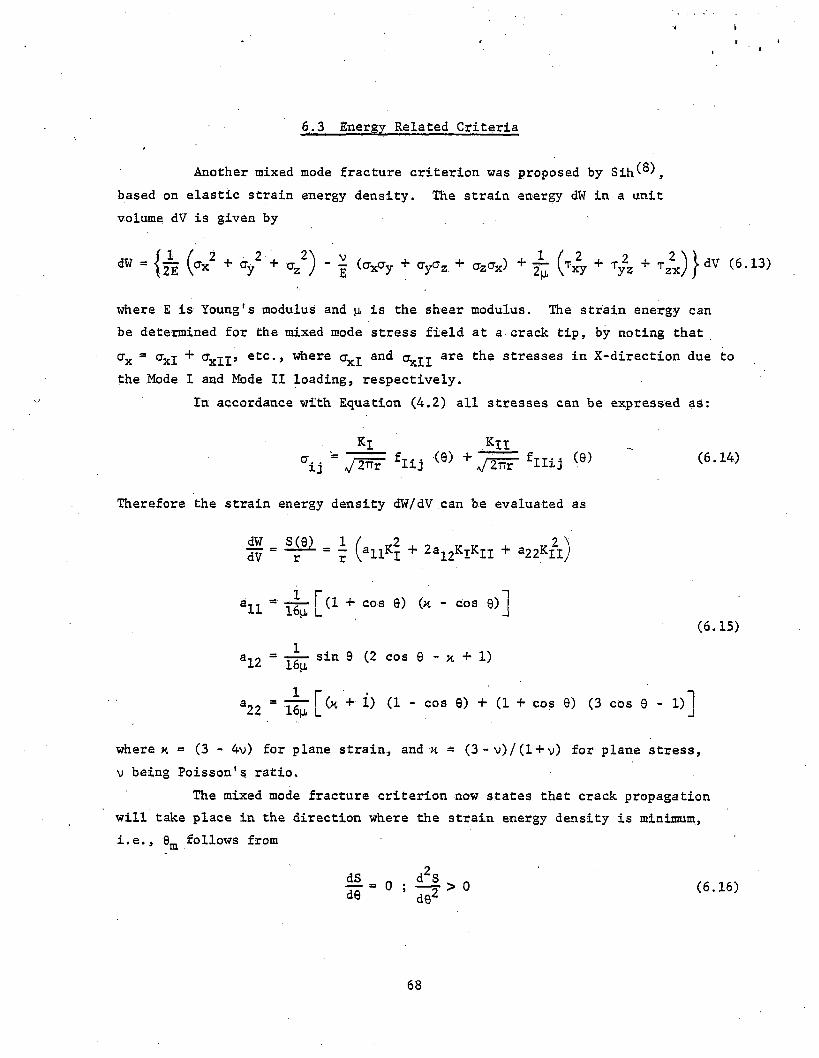
6.3 Energy Related Criteria
Another mixed mode fracture criterion was proposed by Sih*>®), based on elastic strain energy density. The strain energy dW in a unit volume dV is given by
(crxCTy ■+■ O'yG' "I” CTzCrx) T 2 + T 2 + j 2Txy T Tyz T T zx.)}dV (6.13)
where E is Young's modulus and p, is the shear modulus. The strain energy can be determined for the mixed mod e stress field at a crack tip, by noting that
gtx = ctx j + OxXi> etc -) where and o^xx are t*ie stresses in X - d i rection due tothe Mode I and Mode II loading, respectively.
In accordance wit h Equation (4.2) all stresses can be expressed as:
Kl K II°ij " / 2 ttF fIij (8) + J T n F fIIij (9)
Therefore the strain energy density d W / d V can be evaluated as
(6.14)
d W _ £ ( 9 ) . _ l / 2 . - „ _ . a _2d V ---r--- r \ U l + 2a12KIKH + a22KII
_ .1 r11 16p, £(1 + cos 0) (x - cos 0)J
(6.15)
a12 = 16(1 S'J‘n 8 2 cos 8 " K +
a22 = 16(1 + ^ (1 ~ cos 0) + (1 + cos 9) (3 cos 9 - 1)
w here x = (3 - 4v) for plane strain, and x = ( 3 - v ) / ( l + v) for plane stress, v being Poisson's ratio.
The mixed mode fracture criterion n o w states that crack propagation wil l take place in the direction w h e r e the strain energy density is minimum, i.e., 0m follows from
dSd9 = 0 ; d2 S
de2> 0 (6.16)
68

The value of (S . ) - at w hich the crack starts propagating is considered tom i n e -be a material property Sc r .
The crack propagation angle is a function of the ratio of K j i /K j .Values of 9m f o l l o w i n g .from Equations (6.15) and (6.16) were given already in Figure 41 for v = 1/3. Up to K j j /K j = 1 the angle is practically the same as for the principal stress criterion. For larger ratios the angle islarger than for the principal stress criterion. Thus, the observed crack angles agree equally well with the strain energy density criterion, although the discrepancy is somewhat larger for the pure Mo d e II case.
As in the case of the principal stress criterion an equivalent Mode I case can be defined that would cause the same rate of crack growth as the mixed m o d e loading. For Mode I loading
{■sI<e> f m i n = Sj (9 = 9m ) = a ^ . (6.17)
W i t h 9m for Mod e I loading equal to zero, Equation (6.17) reduces to
S I ( 9 = 0 ) = 2-fr . (6.18)16(i
Equal crack growth rates w ould occur if S^ (©ra) = S ^ (9 = 0). Thus, theequivalent M o d e I follows from equating Equation (6.18) to the first of Equations (6.15) wit h 9 = 9m -
K Ieq16jj,
2(k - 1) (allK I 12 i II a22Ki> (6.19)
This equivalent Mode I stress intensity factor was given in Figure 42 as a function of K j j /K^. It appears that K gq is lower for the strain energy density criterion than for the principal stress criterion. For the experimental case of = 0.73, the equivalent Mode I stress intensity is only 1.3 timesthe active K^, as compared to a factor of 1.5 for the principal stress criterion! As a result the data points in Figure 43 would not move as close to the baseline data as they do w h e n the principal stress criterion applies.
Other energy related .criteria have been proposed. The simplest criterion states that the strain energy release rate G for fracture (or for equal crack growth rates) is the same for all modes of loading, including
69
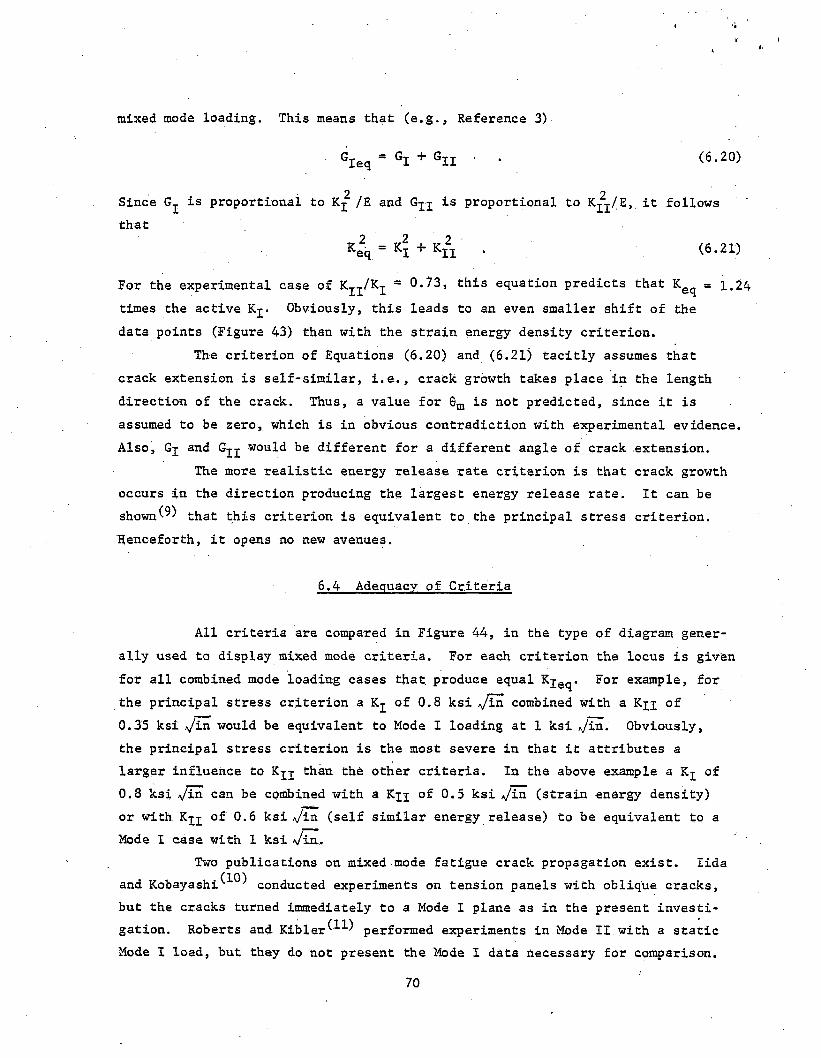
(6.20)
mixed mode loading. This means that (e.g., Reference 3)
GIeq " ®I + GII 1 *2 2Since is proportional to K-j- /E and Gjj is proportional to K^/E, it follows
thatKe2q = KI + KII • (6.21)
For the experimental case of K /K-,. = 0.73, this equation predicts that Kgq = 1.24 times the active Kj. Obviously, this leads to an even smaller shift of the data points (Figure 43) than with the strain energy density criterion.
The criterion of Equations (6.20) and (6.21) tacitly assumes that crack extension is self-similar, i.e., crack growth takes place in the length direction of the crack. Thus, a value for 8m is not predicted, since it is assumed to be zero, which is in obvious contradiction with experimental evidence. Also, Gj and G^j would be different for a different angle of crack extension.
The more realistic energy release rate criterion is that crack growth occurs in the direction producing the largest energy release rate. It can be shown (^ that this criterion is equivalent to the principal stress criterion. Henceforth, it opens no new avenues.
6.4 Adequacy of Criteria
All criteria are compared in Figure 44, in the type of diagram generally used to display mixed mode criteria. For each criterion the locus is given for all combined mode loading cases that, produce equal Kjeq. For example, for the principal stress criterion a Kj of 0.8 ksi combined With a Kjx of0.35 ksi J t n would be equivalent to Mode I loading at 1 ksi ,/in. Obviously, the principal stress criterion is the most severe in that it attributes a larger influence to Kjj than the other criteria. In the above example a Kj of 0.8 ksi Vin can be combined with a Kji of 0.5 ksi J ± a . (strain energy density) or with K^x of 0.6 ksi * J i n (self similar energy release) to be equivalent to a Mode I case with 1 ksi </in.
Two publications on mixed.mode fatigue crack propagation exist. Iida and Kobayashi^*^ conducted experiments on tension panels with oblique cracks, but the cracks turned immediately to a Mode I plane as in the present investigation. Roberts and Kibler^^ performed experiments in Mode II with a static Mode I load, but they do not present the Mode I data necessary for comparison.
70
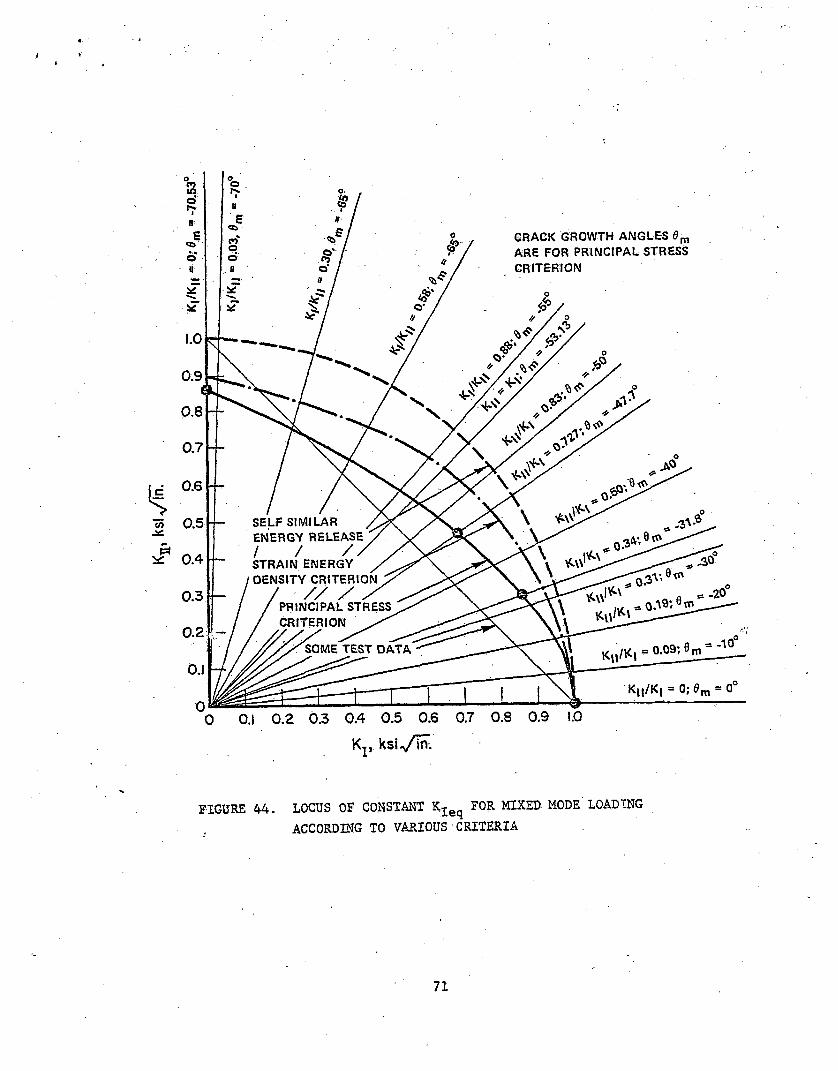
Kp ksi^in-
FIGURE 44. LOCUS OF CONSTANT % eq F0R MIXED MODE LOADINGACCORDING TO VARIOUS CRITERIA
71

Several investigators p u b lished data of mixed mode residual strength (toughness) tests (7,12,13,14,15), in m o s t cases the data are presented in a diagram like in Figure 44. The applied Kj is plotted along the abscissa, the applied along the ordinate. The data points then fall on a curve thatrepresents = K j c , w hich intersects the abscissa at K-j- = K j c . M o s t of thesedata fall somewhere in between the curves for the principal stress criterion and the strain energy density criterion. Some data are r e p o r t e d ( ^ ’^ ) that fall on the straight line also shown in Figure 44, representing
Kgq = % + K I]; or % + K n = K Ic (6.22)
and suggesting an even stronger influence of than predicted by the principal stress criterion. L i u ' s ^ ^ test data on shear panels with oblique cracks obey Equation (6.22). Therefore, Liu suggested that mixed mode results are not only dependent upo n the magnitudes o f K j and K j j , but also on loading conditions.
T h e present test data indicate that the crack extension angle is bestpredicted by the principal stress criterion. Also, the initial crack growthrates show the best agreement wit h the Mod e I data if K „ n is determined bye q
Equation (6.11) following from the principal stress criterion. Therefore, it is concluded for the time being that the principal stress criterion is the most appropriate for fatigue crack propagation.
The problem of mixed mode cracking can certainly not be dismissed because the experiments show that the cracks turn into a direction with pure Mod e I. Roberts and K i b l e r ^ ^ have shown already that Mod e II cracks can grow in a self-similar manner if the loading changes sign in every cycle. This happens also in service but the experiments did hot reproduce this condition.
Figure 45 shows various possibilities for mixed mode loading. The top part shows K j and as a function of time. Case a, at the left represents the situation of the present experiments and of those of Iida and K o b a y a s h i ^ ® ^ .Kj and K j j are in phase and K j j never reverses sign. The bottom left of Figure 45 shows an oversimplified version of wha t happens in a rail w hich is adequate for the present discussion. W h e n a w h e e l load P travels over the rail the bending moment (at a fixed Point A) changes w i t h time fr o m zero to a m a x i m u m and back to zero. The other force, however, changes sign w h e n P passes over A. Thus,K l I goes through a cycle of reversed loading w h e n K i rises from zero to a maximum and decreases to zero, which is shown in the top diagram (Case b) of Figure 45.
72
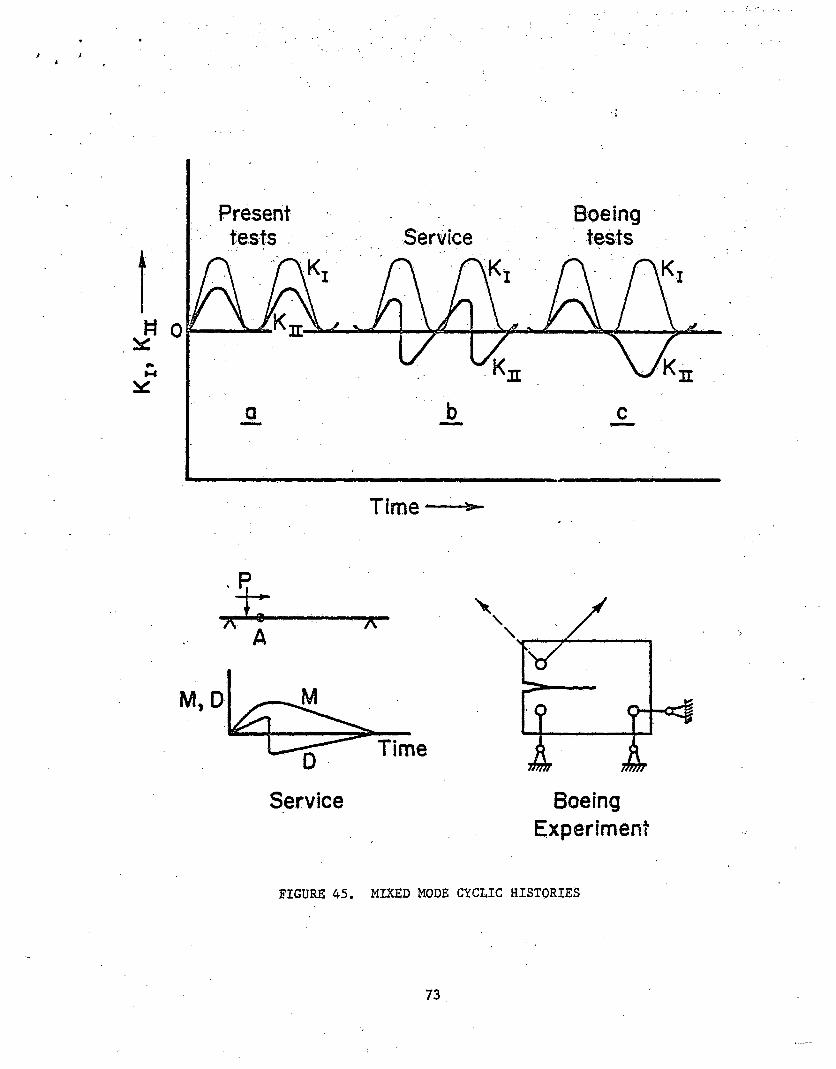
■ f -
BoeingExperiment
FIGURE 45. M I X E D MO D E CYCLIC HISTORIES
73
If the crack wants to turn into a direction of pure Mode I, it will try to turn one way during the positive K.^ applications, and the other way during the negative Kj-j applications. As a result, the crack will grow in a self-similar manner, so that the contribution is not eliminated.
It can easily be seen that Case b loading can be reproduced in an experiment only if two directions of loading are available. This will be accomplished in the present program under a subcontract to the Boeing Airplane Company. Experiments in this subcontract will be of the type shown at the bottom right of Figure 45. Compact tension specimens will be loaded in two directions, and the load will change direction after every application. This results in the loading shown at the top right of Figure 45 (Case c) . Since will be changing sign, the cracks are expected to grow straight.
74
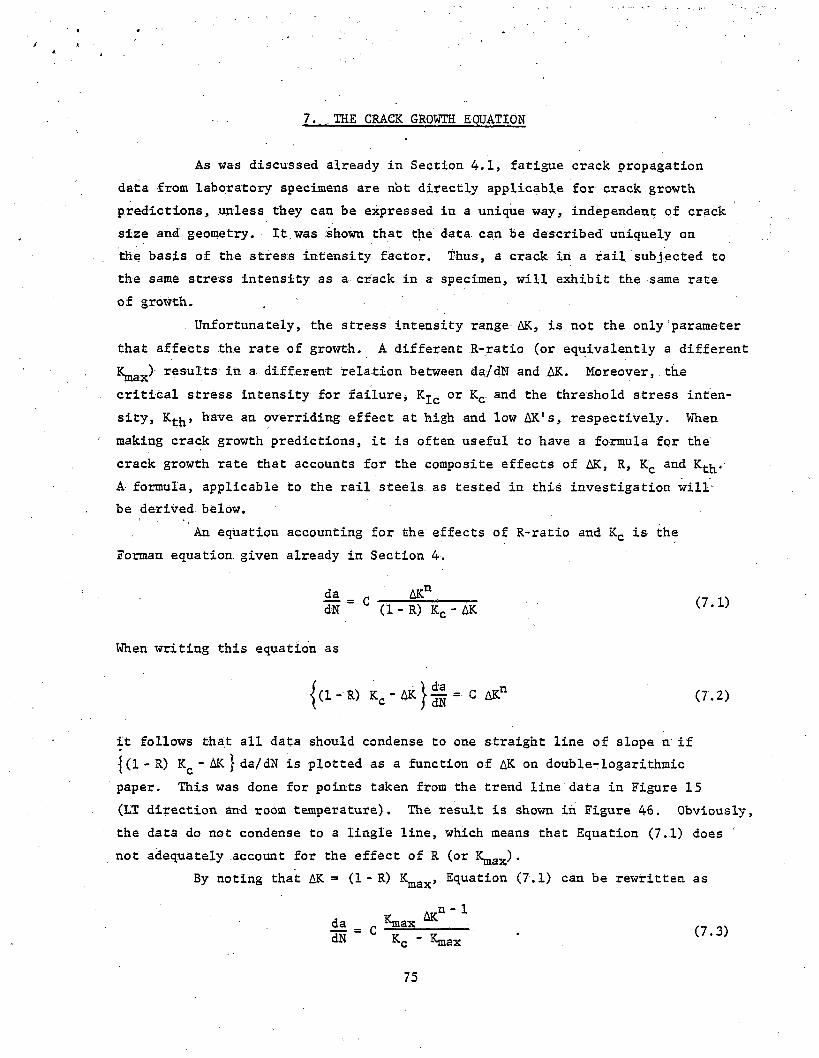
7. THE CRACK GROWTH EQUATION
As was discussed already in Section 4.1, fatigue crack propagation data from laboratory specimens are not directly applicable for crack growth predictions, unless they can be expressed in a unique way, independent of crack size and geometry. It was shown that the data can be described uniquely on the basis of the stress intensity factor. Thus, a crack in a rail subjected to the same stress intensity as a crack in a specimen, will exhibit the same rate of growth.
Unfortunately, the stress intensity range AK, is not the only parameter that affects the rate of growth. A different R-ratio (or equivalently a different K^y) results in a different relation between da/dN and AK. Moreover, . the critical stress intensity for failure, Kj^ or Kc and the threshold stress intensity, Ktjj, have an overriding effect at high and low AK's, respectively. When making crack growth predictions, it is often useful to have a formula for the crack growth rate that accounts for the composite effects of AK, R, K'c and Kt .A formula, applicable to the rail steels as tested in this investigation will be derived below.
An equation accounting for the effects of R-ratio and Kc is the Forman equation given already in Section 4.
da = AKndN (1 - R) Kc - AK (7.1)
When writing this equation as
{(1- R) K c -Ak } | § = C AKn (7.2)
it follows that all data should condense to one straight line of slope n if |(1-R) K£ - AK } da/dN is plotted as a function of AK on double-logarithmic paper. This was done for points taken from the trend line data in Figure 15 (LT direction and room temperature). The result is shown in Figure 46. Obviously, the data do not condense to a lingle line, which means that Equation (7.1) does not adequately account for the effect of R (or K^ y) .
By noting that AK = (1 - R) K^y, Equation (7.1) can be rewritten as
da _ c ^max ^ dN Kc - Kjnax (7.3)
75
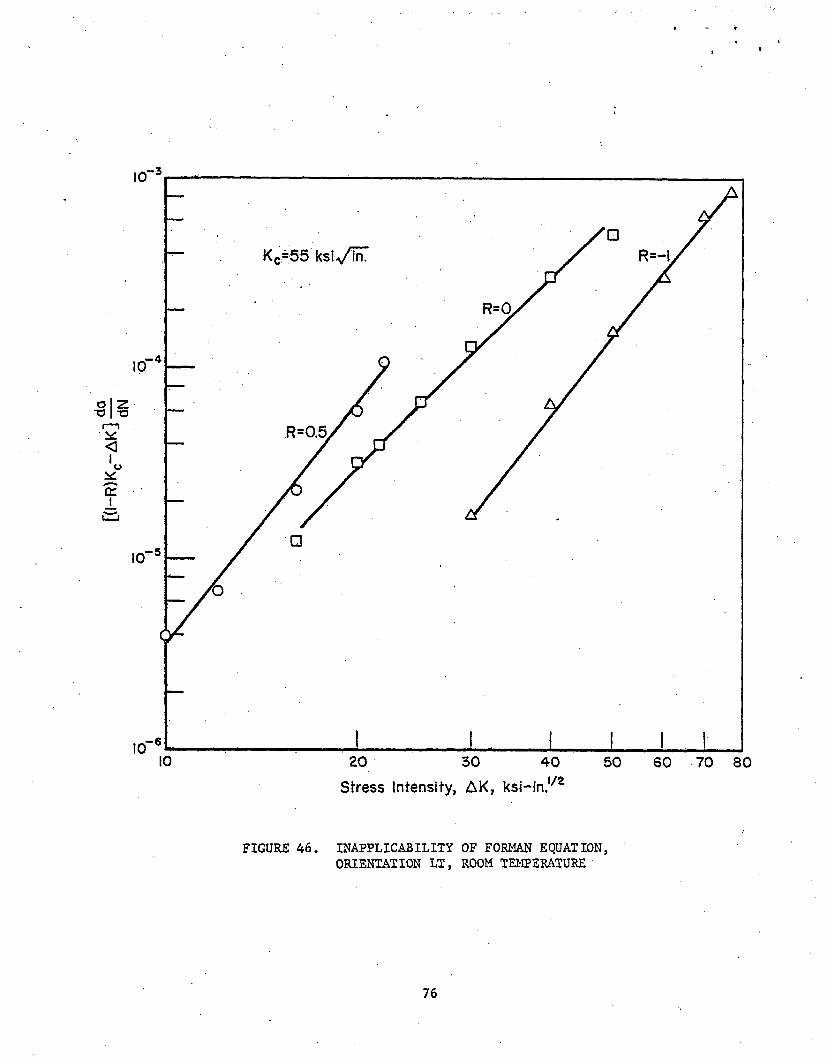
[(I-R
)KC-
AK
]
FIGURE 46. INAPPLICABILITY OF FORMAN EQUATION,ORIENTATION LT, ROOM TEMPERATURE
76
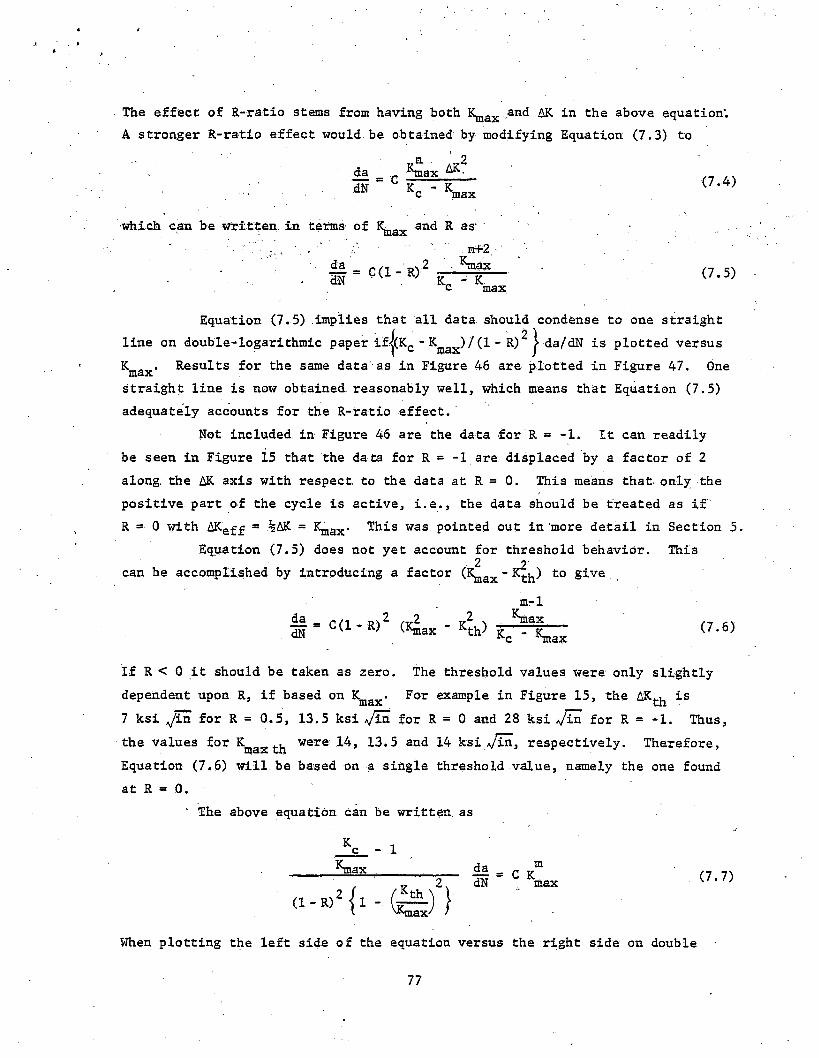
The effect of R-ratio steins from having both Km a x and AK A stronger R-ratio effect would.be obtained by modifying
da _ ^ m a x dN K - Kc max
in the above equation'. Equation (7.3) to
(7.4)
w h i c h can b e written, in terms of K^ ax and, R as. ' " ,n+2 - ’
dadN C(1 - R) 2 ^max
K„ - K c max(7.5)
Equation (7.5) implies that all data should condense to one straight line on double-logarithmic paper if<(K - K )/(l - R) f da/dN is plotted versus K m a x - Results for the same data as in Figure 46 are plotted in Figure 47. One straight line is n o w obtained, reasonably well, w hich means that Equation (7.5) adequately accounts for the R-ratio effect.
Not included in Figure 46 are the data for R = -1. It can readily be seen in Figure 15 that the data for R = -1 are. displaced by a factor of 2 along: the AK axis with respect, to the data at R = 0. This m eans t h a t only the positive part o f the cycle is active, i.e., the data should be treated as if R = 0 w i t h AKeff = %AK = K^^.. This was pointed out in more detail in Section 5.
Equation (7.5) does not yet account for threshold behavior. This2 ?can be accomplished by introducing a factor 0 ^ ^ - K ^ ) to give
m-1— = C ( 1 - R ) (K2 ^ - K th) Kc - (7*6)
If R < 0 it should be taken as zero. The threshold values w e r e only slightly dependent upon R, if based on Km a x . For example in Figure 15, the A K ^ is 7 ksi y i n for R = 0.5, 13.5 ksi V l n for R = 0 and 28 ksi for R = -1. Thus, the values for Km a v were 14, 13.5 and 14 ksi a/Lci, respectively. Therefore, Equation (7.6) will.be based on a single threshold value, namely the one found at R = 0.
' The above equation can be written as
(1 -R)
mC K m a x (7.7)
Whe n plotting the left side o f the equation versus the right side on double
77

FIGURE 47. CRACK GROWTH EQUATION NOT ACCOUNTING FOR THRESHOLD,ORIENTATION LT, ROOM TEMPERATURE
78

logarithmic paper a single straight line should result. Of course, h o w the data in the threshold region should be included (they were not in Figures 46 and 47). This plot is shown in Figure 48. It appears that Equation (7.7) is r e a s o n ably satisfied.
In order to show the adequacy of Equation (7.7) it was rewritten in terms of AK to give ■ . .
dadN C ( l - » 2 -“ |a k 2 - < l - W 2K2th} a _ w , . aK (7.8)
It should be noted n o w that R = R for R > 0, and R = 0 for R £ 0. The trend lines for the L T orientation and room temperature are replotted in Figure 49. Also p l otted are points predicted by Equation (7.8). Obviously, the effects of R, K c and are adequately accounted for. T h e generality of. Equation (7.8) is shown by similar plots for different cases in Figures 50 through 53.
Apparently, Equation (7.8) can be used generally to describe the crack growth behavior of the rail steels used in the present experiments. Since Equations (7.6) and (7.8) are equivalent, Equation (7.6) is recommended for use. Not only is Equation (7.6) much simpler, it also is more appropriate for service cracks in rails, since it is expressed in Km a x * The m a x i m u m stress intensity in rails is likely to be determined by the residual stress level. Cyclic stresses are most l y from the (tension) residual stress level down. Thus, all stress cycles at a given size of crack would have a common Therefore, it is moreuseful to have a crack growth equation expressed in Km a x .
79
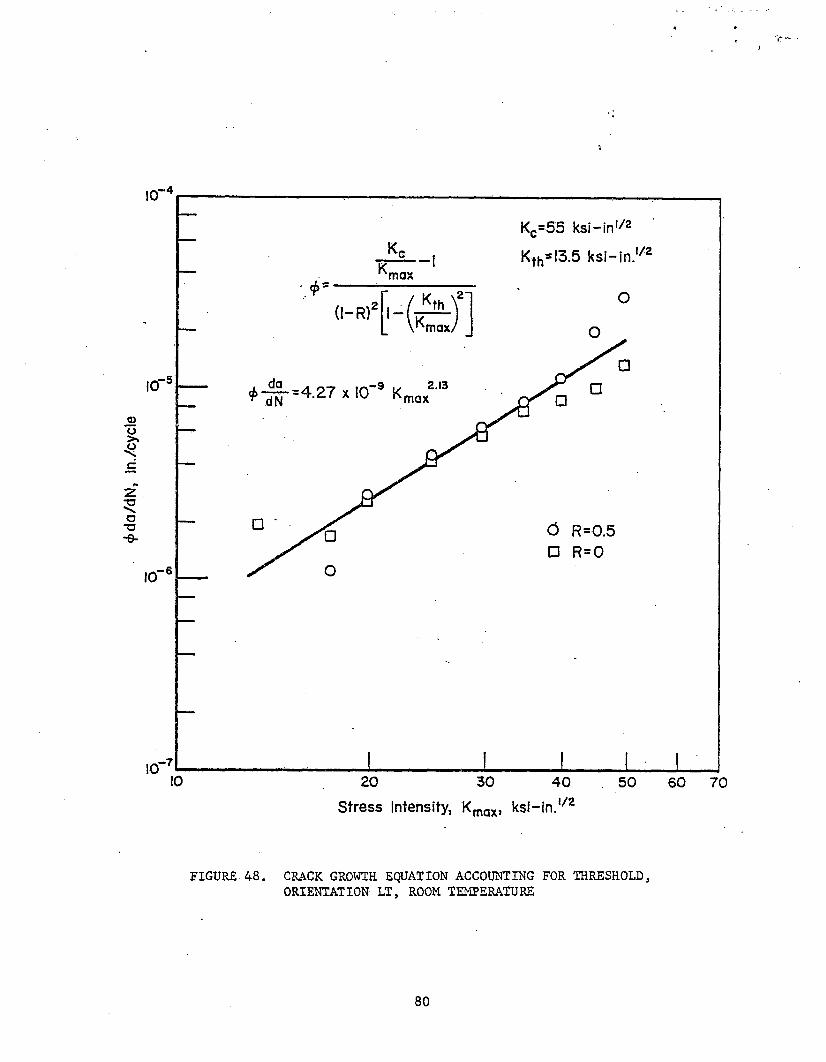
<£da/dN, in./cycle
FIGURE 48. CRACK GROWTH EQUATION ACCOUNTING FOR THRESHOLD,ORIENTATION LT, ROOM TEMPERATURE
80
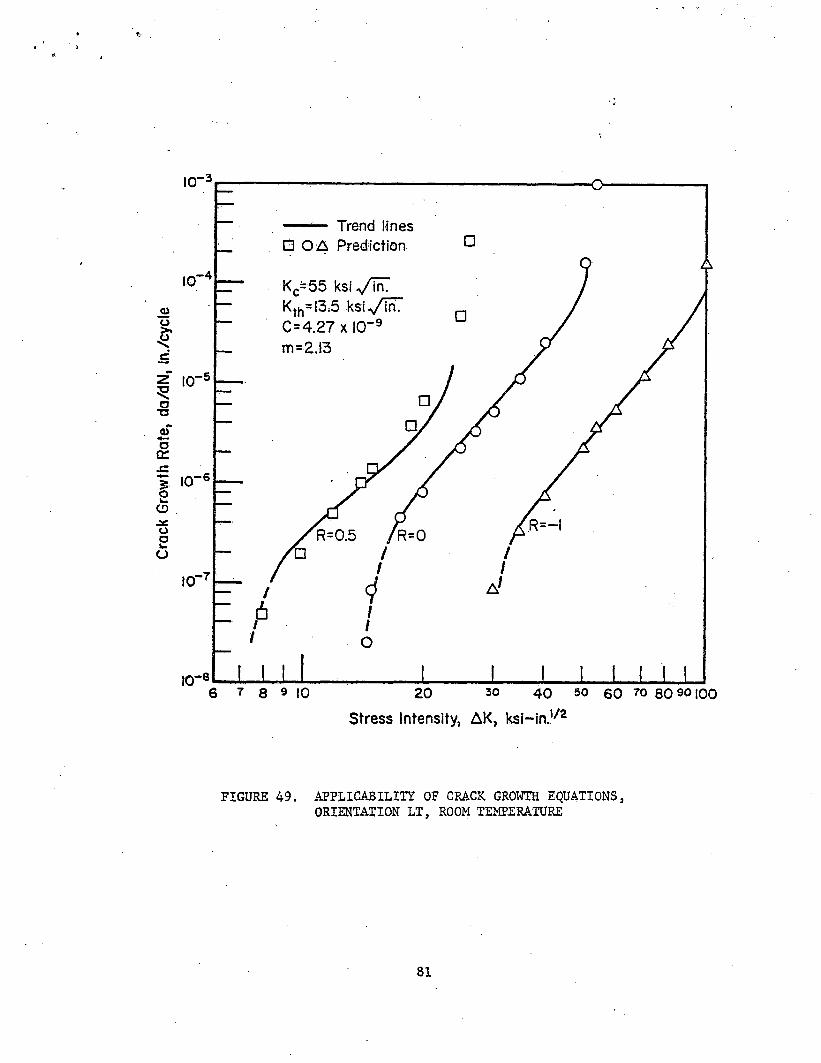
Crac
k Gr
owth
Rat
e, d
a/dN
, In.
/cyc
leO
FIGURE 49. APPLICABILITY OF CRACK GROWTH EQUATIONS,ORIENTATION LT, ROOM TEMPERATURE
81

Crac
k Gr
owth
Rat
e, d
a/dIM
, in.
/cyc
le
Stress Intensity, AK, ksi-in.,/2
FIGURE 50. APPLICABILITY OF CRACK GROWTH EQUATION,ORIENTATION LT, -40 F
82
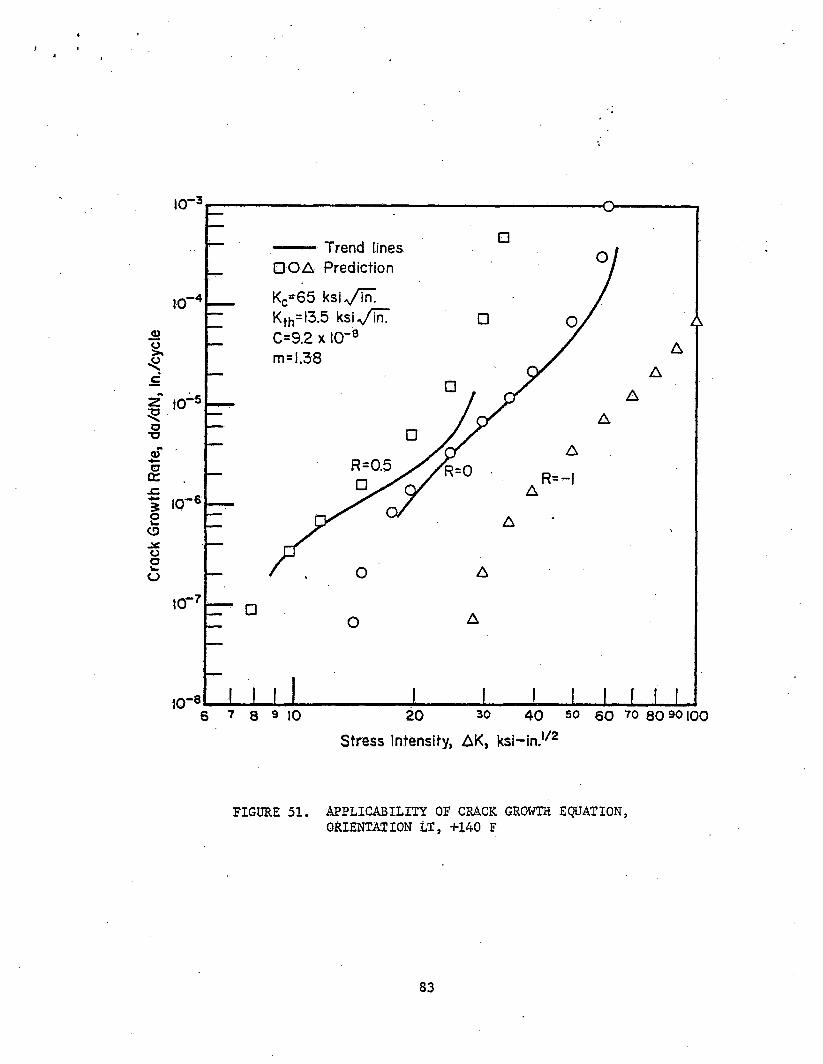
Crac
k Gr
owth
Rat
e, d
a/dN
, in.
/cyc
le
O10i - 3
10'>-4
10,-5
10i-€
10i“ 7
10,-8
A
A
J _ u i I I___ I I I I I6 7 8 9 1 0 2 0 3 0 4 0 5 0 6 0 7 0 8 0 9 0 1 0 0
Stress Intensity, AK, ksi-in.l/2
FIGURE 51. APPLICABILITY OF CRACK GROWTH EQUATION, O R I E N TATION LT, +140 F
83
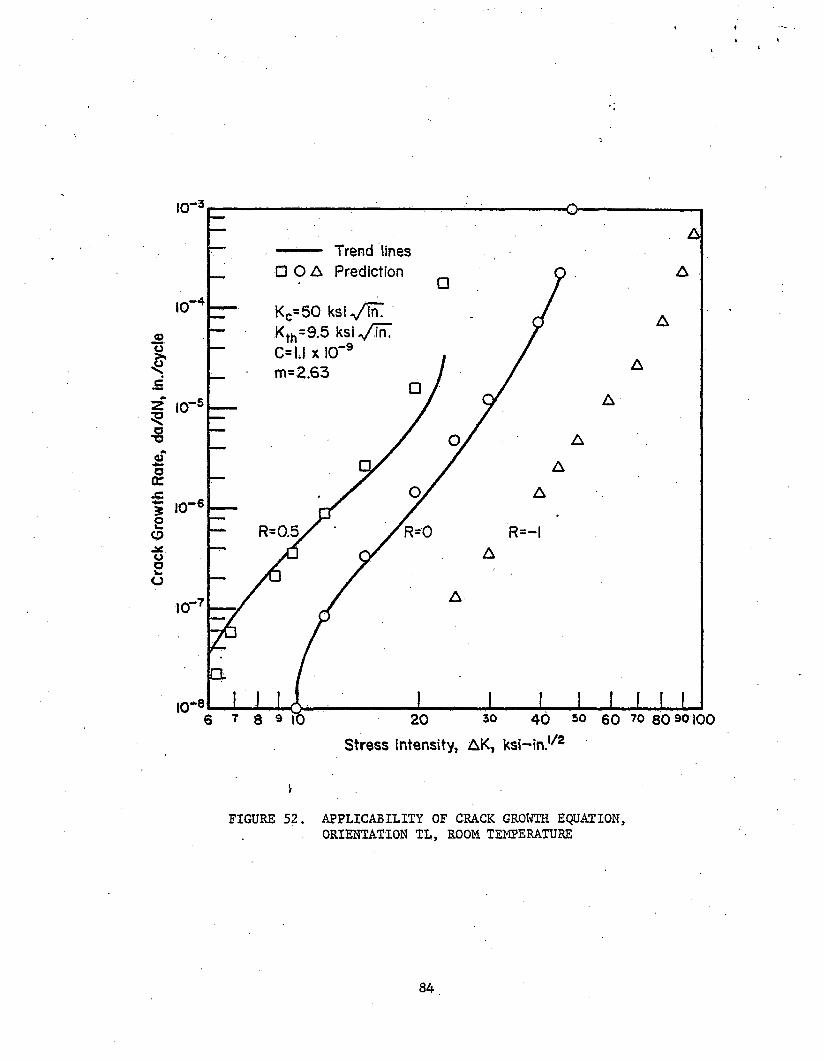
Crac
k Gr
owth
Rat
e, d
a/dN
, ln.
/cyc
!e
FIGURE 52. APPLICABILITY OF CRACK GROWTH EQUATION,ORIENTATION TL, ROOM TEMPERATURE
84
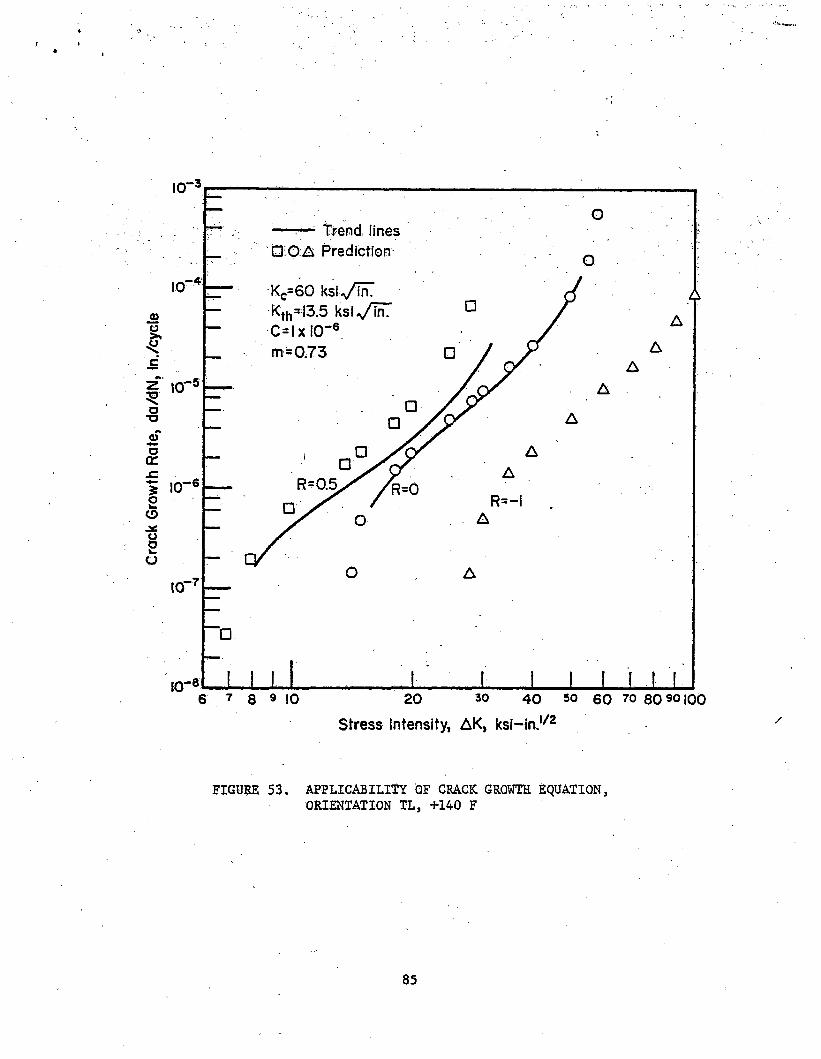
Crac
k Gr
owth
Rat
e, d
a/dN
, In.
/cyc
le
FIGURE 53. APPLICABILITY QF CRACK GROWTH EQUATION, ORIENTATION TL, +140 F
85
8. VARIABILITY IN CRACK-GROWTH BEHAVIOR
8.1 Basis for Statistical Analysis
Early in this experimental program it became apparent that the crack-growth behavior of the investigated rail steels was subject to substantial variability and that it would not be possible to exactly define the cracking characteristics of even, a single rail heat.
This observation was not really surprising though, since all material properties are subject to some degree of uncertainty and even the simplest physical characteristics of a material (e.g., hardness, tensile strength, and elastic modulus) display variability..
Because of this uncertainty or variability, a material property can often be best described by performing repetitive experiments and determining the mean property value along with a measure of the observed variability in property values. Many physical properties of materials display a statistical variability which is nearly normal or logarithmically normal. In these cases a single parameter the standard deviation - can be computed to quantify the variability in a collection of material property test results.
This approach was taken to evaluate the variability in crack-growth behavior of the various subgroups of rail tests. Before these data could be statistically analyzed, however, it was necessary to translate the overall crack- growth rate curves into single-valued quantities that would reflect the material's resistance to fatigue-cracking under constant amplitude cyclic load conditions.This was done by a numerical integration of the da/dN-AK curve for each specimen from a stress-intensity level of 20 ksi * / ± n to the apparent fracture toughness level for the material. The integration was performed on a ficticious compact-tension type specimen (W = 3.00 inches) so that crack lengths ranged from an initial value of about 1.00 inch to around 2.00 inches at specimen failure. The result of this integration was an analytical prediction of the number of cycles required to grow a crack in a CT type specimen (like the one used in this program) from a length of 1.00 inch to failure. By evaluating the various crack-growth curves in this manner, it was possible to quantitatively compare crack-growth resistance of all the different specimen geometries tested under a variety of loading conditions.
86
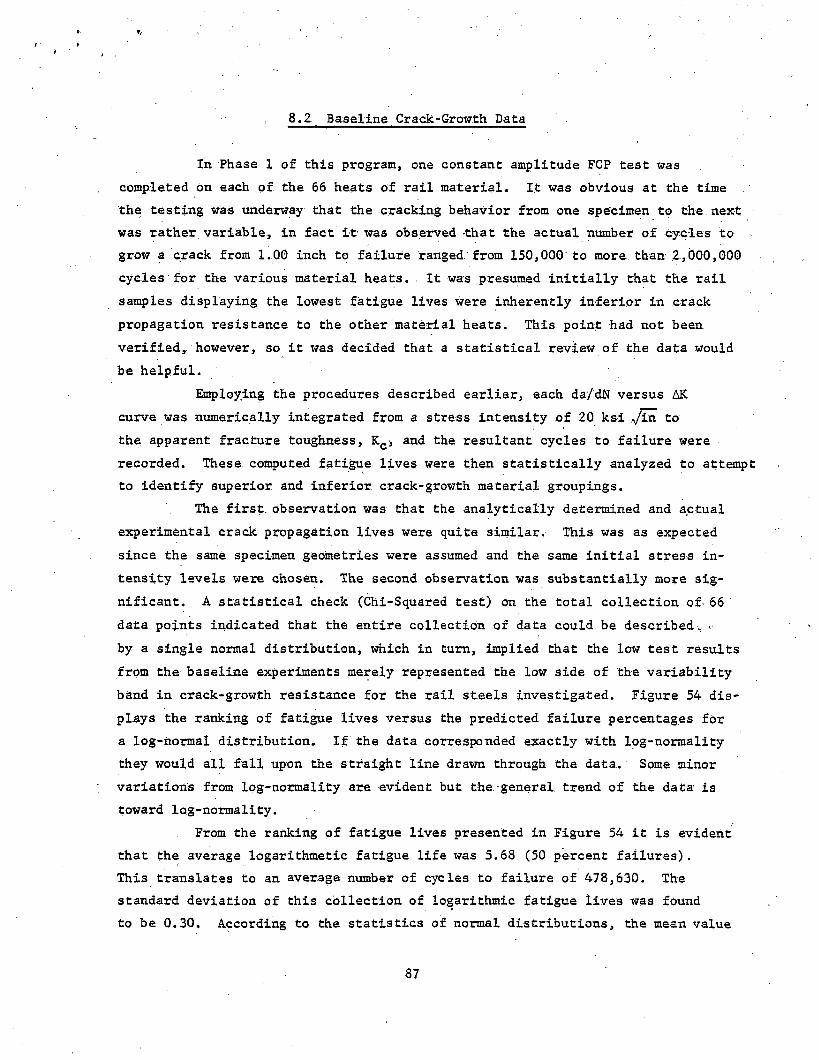
1/' Ii l
8.2 Baseline Crack-Growth Data
In Phase 1 of this program, one constant amplitude FCP test was completed on each of the 66 heats of rail material. It was obvious at the time the testing was underway that the cracking behavior from one specimen to the.next was rather variable, in fact it was observed that the actual number of cycles to grow a crack from 1.00 inch to failure ranged from 150,000 to more than2,000,000 cycles for the various material heats. It was presumed initially that the rail samples displaying the lowest fatigue lives were inherently inferior in crack propagation resistance to the other material heats. This point had not been verified, however, so it was decided that a statistical review of the data would be helpful.
Employing the procedures described earlier, each da/dN versus AK curve was numerically integrated from a stress intensity of 20 ksi /in to the apparent fracture toughness, Kc> and the resultant cycles to failure were recorded. These computed fatigue lives were then statistically analyzed to attempt to identify superior and inferior crack-growth material groupings.
The first, observation was that the analytically determined and actual experimental crack propagation lives were quite similar. This was as expected since the same specimen geometries were assumed and the same initial stress intensity levels were chosen. The second observation was substantially more significant. A statistical check (Chi-Squared test) on the total collection of 66 data points indicated that the entire collection of data could be described,,., by a single normal distribution, which in turn, implied that the low test results from the baseline experiments merely represented the low side of the variability band in crack-growth resistance for the rail steels investigated. Figure 54 displays the ranking of fatigue lives versus the predicted failure percentages for a log-normal distribution. If the data corresponded exactly with log-normality they would all fall upon the straight line drawn through the data. Some minor variations from log-normality are evident but the general trend of the data is toward log-normality.
From the ranking of fatigue lives presented in Figure 54 it is evident that the average logarithmetic fatigue life was 5.68 (50 percent failures).This translates to an average number of cycles to failure of 478,630. The standard deviation of this collection of logarithmic fatigue lives was found to be 0.30. According to the statistics of normal distributions, the mean value
87
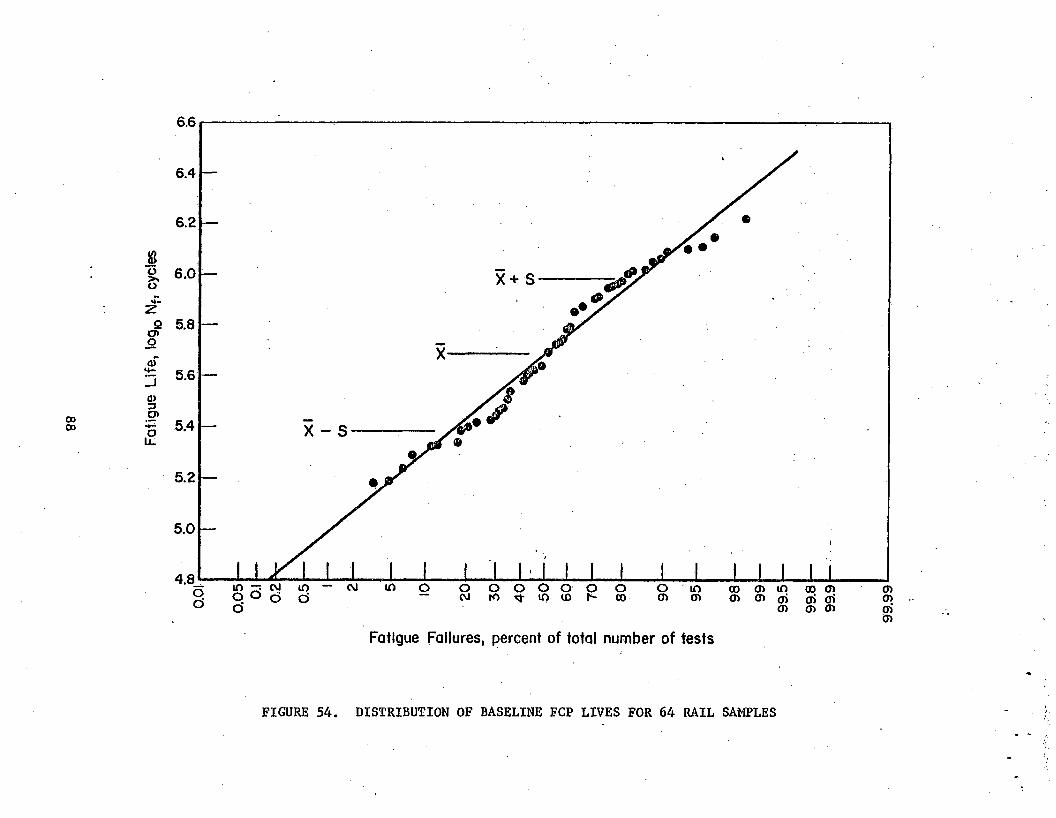
Fatig
ue L
ife, J
og10
N*, c
ycle
s
FIGURE 54. DISTRIBUTION OF BASELINE FCP LIVES FOR 64 RAIL SAMPLES
66*66
of a data population plus or minus 1 standard deviation, should contain approximately 58 percent of the total data population. In this case there were 66 total test results, which meant that 58 percent of 66 data points 0sa38) should lie between the logarithmic fatigue lives of 5.38 and 5.98 (239,880 and 954,990 cycles, respectively). In actuality 40 specimens out of 66 failed within those cycle limits, which represents 61 percent of. the total population. The comparison between the theoretical.statistics and actual statistics is good.
As. an additional comment on the variability in crack-propagation lives of the baseline experiments it is interesting to compare the ratio of the logarithmic standard deviation of the 66 data points to the logarithmic mean value of the population. That ratio (0.30/5.'68) is a value of about 0.053 (5.3 percent) This is commonly called the coefficient of variation in a collection of data, and the lower the ratio,, the lower the data variability. Simple tensile tests commonly display coefficients of variation of 3 percent or greater, while it is not uncommon for high-cycle fatigue data to show coefficients of variation from 5 to 10 percent. The main point to be made is that.the scatter in crack-propagation lives evident in the collection of 66 rail heats was not large compared' to other similar types of data.
The statistical analysis can be extended to other crack length and loading conditions as well. This is important because it allows prediction of constant amplitude crack-propagation lives for various initial crack sizes.For example, by using a power law relation between da/dN and AK, and assuming an initial AK level of 10 ksi */in a series of crack propagation lives were calculated for each rail heat. The distribution of computed crack-propagation cycles to failure is shown in Figure 55. It is readily apparent from this figure that the slope of the probability line (coefficient of variation) is nearly identical to that in Figure 54 even though the ranking of individual heat fatigue lives changed in numerous cases (due to crossing of da/dN - AK function lines).The computed logarithmic mean fatigue life for all of the rail heats was 6.787 (6,123,500 cycles). A standard deviation of 0.357 was found for the logarithmic fatigue lives. Chi squared check of the data indicated normality with 95 percent confidence. Other curves can easily be generated for other crack sizes, load levels and specimen geometries.
89
Fatig
ue L
ife,
log
Nf,
cycl
es
FIGURE 55. DISTRIBUTION OF COMPUTED BASELINE FCP LIVES FOR 64 RAIL SAMPLESASSUMING EACH TEST WAS STARTED AT A STRESS INTENSITY OF 10 KSI^nC
/
99.99
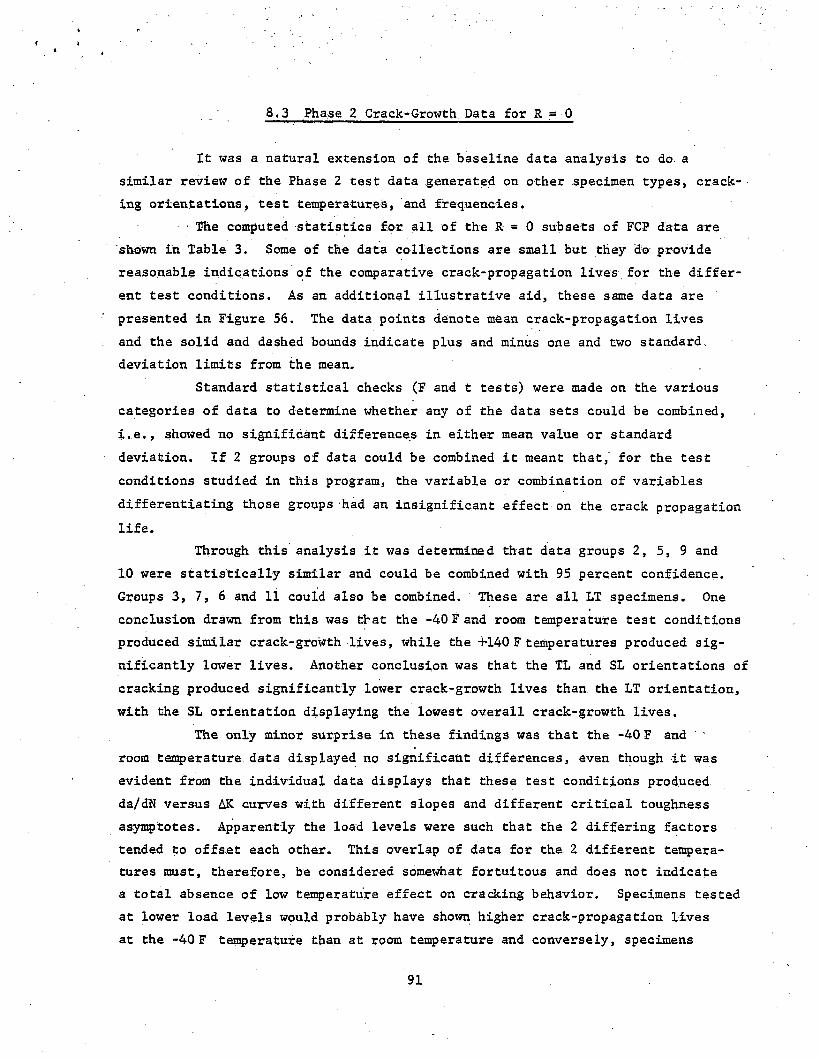
8.3 Phase 2 Crack-Growth Data for R = 0
It was a natural extension of the baseline data analysis to do a similar review of the Phase 2 test data generated on other specimen types, cracking orientations, test temperatures, and frequencies.
The computed statistics for all of the R = 0 subsets of FCP data are shown in Table 3. Some of the data collections are small but they do provide reasonable indications of the comparative crack-propagation lives for the different test conditions. As an additional illustrative aid, these same data are presented in Figure 56. The data points denote mean crack-propagation lives and the solid and dashed bounds indicate plus and minus one and two standard, deviation limits from the mean.
Standard statistical checks (F and t tests) were made on the various categories of data to determine whether any of the data sets could be combined, i.e., showed no significant differences in either mean value or standard deviation. If 2 groups of data could be combined it meant that, for the test conditions studied in this program, the variable or combination of variables differentiating those groups had an insignificant effect on the crack propagation life.
Through this analysis it was determined that data groups 2, 5, 9 and 10 were statistically similar and could be combined with 95 percent confidence. Groups 3, 7, 6 and 11 could also be combined. These are all LT specimens. One conclusion drawn from this was that the -40 F and room temperature test conditions produced similar crack-growth lives, while the +140 Ftemperatures produced significantly lower lives. Another conclusion was that the TL and SL orientations of cracking produced significantly lower crack-growth lives than the LT orientation, with the SL orientation displaying the lowest overall crack-growth lives.
The only minor surprise in these findings was that the -40 F and room temperature, data displayed no significant differences, even though it was evident from the individual data displays that these test conditions produced da/dN versus AK curves with different slopes and different critical toughness asymptotes. Apparently the load levels were such that the 2 differing factors tended to offset each other. This overlap of data for the 2 different temperatures must, therefore, be considered somewhat fortuitous and does not indicate a total absence of low temperature effect on cracking behavior. Specimens tested at lower load levels would probably have shown higher crack-propagation lives at the -40 F temperature than at room temperature and conversely, specimens
91
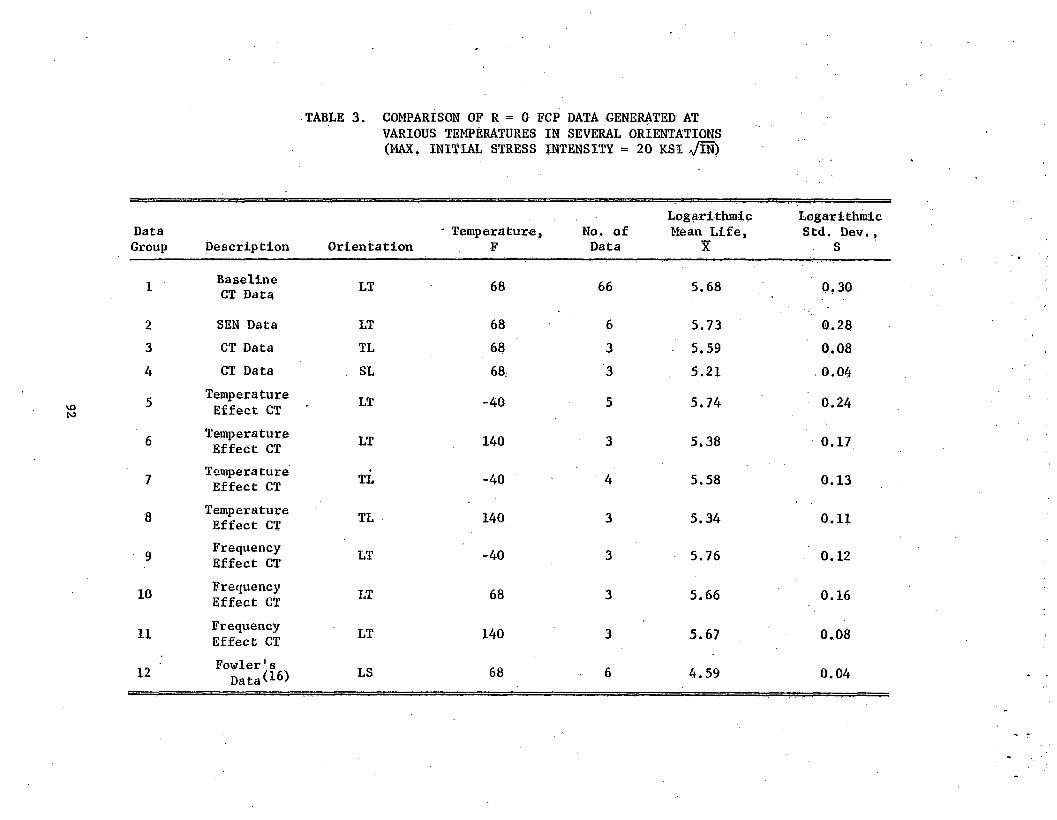
TABLE 3. COMPARISON OF R = 0 FCP DATA GENERATED ATVARIOUS TEMPERATURES IN SEVERAL ORIENTATIONS (MAX. INITIAL STRESS INTENSITY = 20 K S I * fm )
DataGroup Description Orientation
• Temperature, F
No. of Data
Logarithmic M e a n Life,
X
Logarithmic Std. D e v . ,
S
1 Baseline CT Data LT 68 66 5.68 P.30
2 SEN Data LT 68 6 5.73 0.283 CT Data TL 68 3 5.59 0.084 CT Data SL 68 3 5.21 0.04
5 Temperature Effect CT LT -40 5 5.74 0.24
6 Temperature Effect CT LT 140 3 5.38 0.17
7 Temperature Effect CT TL -40 4 5.58 0.13
8 Temperature Effect CT TL 140 3 5.34 0.11
9 Frequency Effect CT LT -40 3 5.76 0.12
10 Frequency Effect CT LT 68 3 5.66 0.16
11 Frequency Effect CT LT 140 3 5.67 0.08
12 Fowler'sData (I**) LS 68 6 4.59 0.04
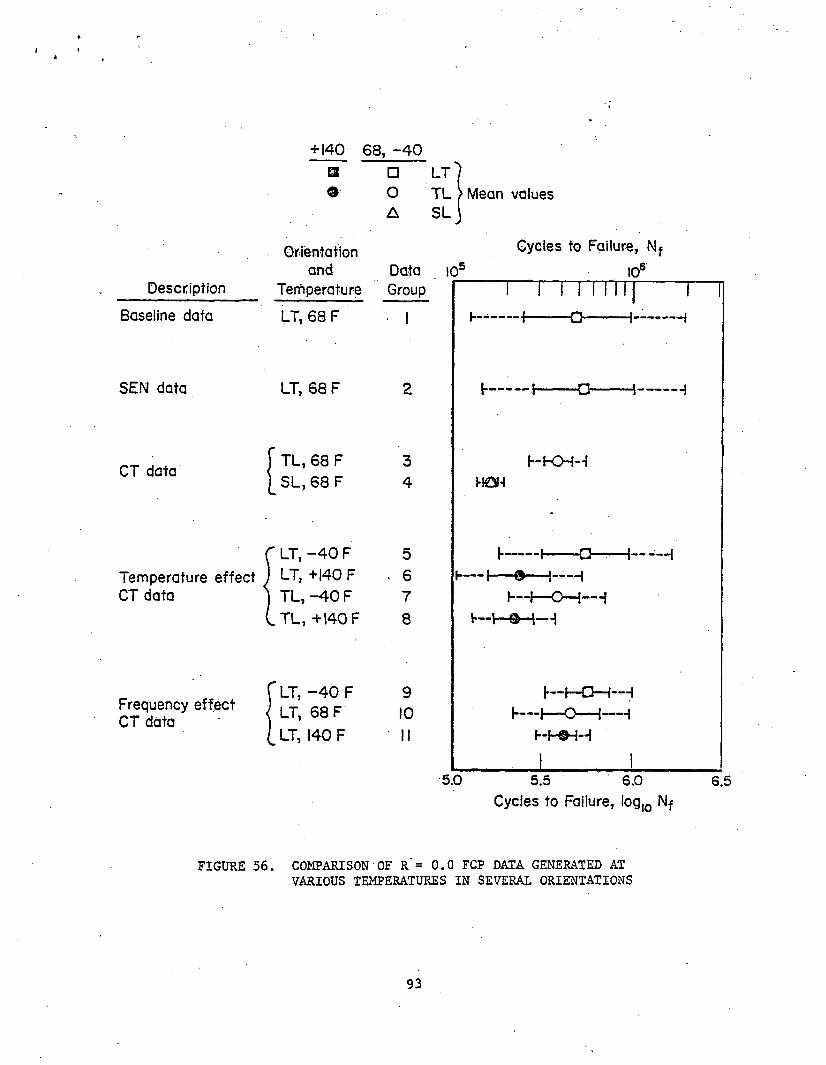
i *
+ 140 68, -4 0
Description
Baseline data
SEN data
CT data
Temperature effect CT data
Frequency effect CT data
E3
9
Orientationand
Temperature
LT, 68 F
LT, 68 F
TL, 68 F SL, 68 F
LT, —40 F LT, +140 F TL, - 4 0 F TL, +140 F
LT, - 4 0 F LT, 68 F LT, 140 F
□ L T ]O TL > Mean values A S L )
Data io: Group
Cycles to Failure, N
I06f
34
5678
910 II
Cycles to Failure, logIO Nf
F I G U R E 56. COMPARISON OF R' = 0.0 FCP DAT A GENERATED AT VARIOUS TEMPERATURES IN SEVERAL ORIENTATIONS
9 3
tested at higher loads would almost surely have displayed lower crack-propagation lives at the reduced temperature level.
Some limited crack growth data generated by Fowler is included as the last entry in Table 3. The mean log life of these data is substantially smaller than of the data of the present program. The most likely reason for the discrepancy is the different orientation. Fowler's data are for the LS orientation. LS and LT are growing in the same plane but in different directions It is somewhat - surprising though that Fowler's data have a lower mean log life than the present SL data (Table 3). However, indirectly the same results were obtained here with the surface flaw specimens. At the specimen surface, the surface flaws were growing in LS. According to Figure 35a, the growth in that direction was substantially faster than in the SL direction, by a factor of 3 on the average. The mean log life for SL was 5.21 (Table 3). Hence, the LS surface flaw results suggest a mean log life of .5.21 - log 3 = 4.74, which is much closer to Fowler's results.
In accordance with the higher growth rates, Fowler also found lower threshold values (AK 7 ^ 8 ksi Vin) . An extrapolation of the LS surface flaw data in Figure 35a to the threshold regime, suggests a threshold value on the Order of 7 ksi */in. Thus, the two data sets are in good agreement.
These observations emphasize the anisotropy of rails with regard to crack growth properties. In particular, the results indicate that a transverse fissure in a rail head will have a tendency to develop into an elliptical flaw with the major axis in horizontal direction and the minor axis in the vertical direction. This is in agreement with service experience. Naturally, the stress distribution in the rail head will have a strong influence on the flaw shape also. Therefore, the above conclusion is only of a qualitative nature.
8.4 Phase 2 Crack-Growth Data for R = 0.50
A somewhat more limited collection of data was generated at a stress ratio of 0.50, but there was sufficient data to observe the effects of temperature and orientation on crack-growth resistance. Table 4 provides a tabulation, of the statistically analyzed data subgroups generated at R = 0.50. Figure 57 displays those data for each category.
As with the R = 0 data, the -40F and room temperature data groups could be combined, but the +140 F data fell significantly below the other temperatures. Orientation was again found to be a significant factor on crack-growth life.
94
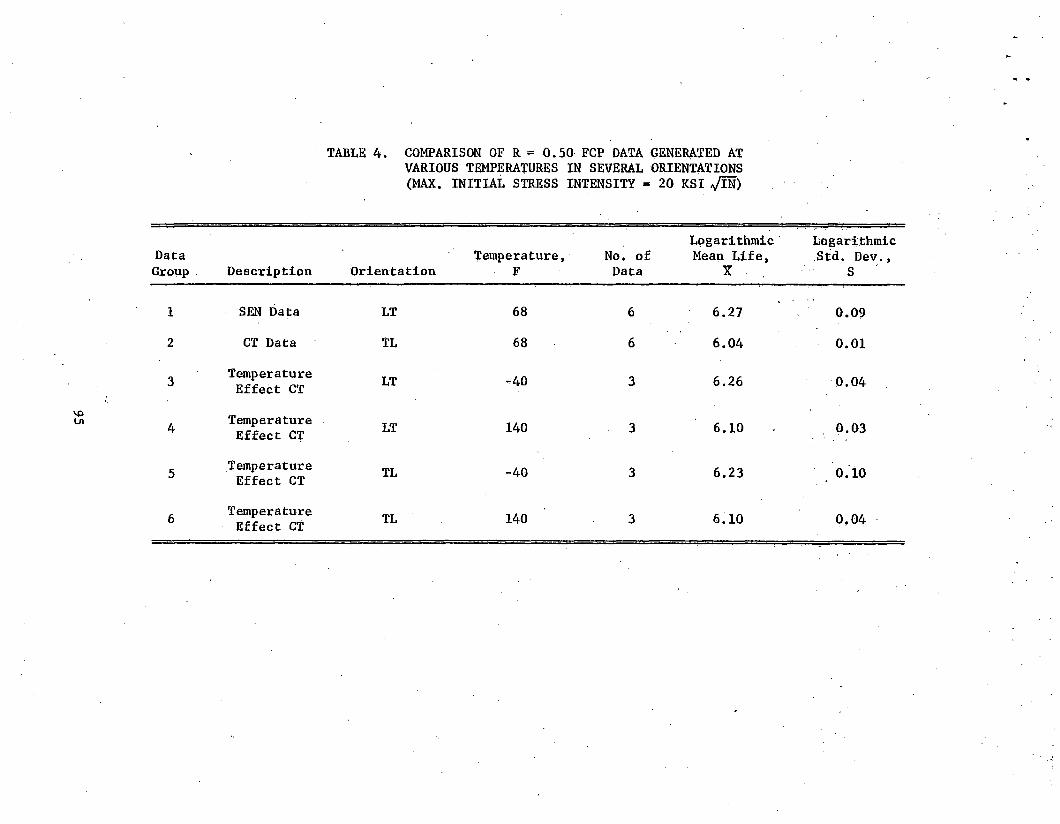
TABLE 4. COMPARISON OF R = 0.50 FCP DATA GENERATED AT VARIOUS TEMPERATURES IN SEVERAL ORIENTATIONS(MAX. INITIAL STRESS INTENSITY = 20 KSI //IN)
DataGroup Description Orientation
Temperature,F
No. of Data
Logarithmic Mean Life,
XLogarithmic Std. Dev.,
S
1 SEN Data LT 68 6 6.27 0.0?2 CT Data TL 68 6 6.04 0.01
3 Temperature Effect CT LT -40 3 6.26 0.04
4 Temperature , Effect CT LT 140 3 6.10 0.03
5 Temperature Effect CT TL -40 3 6.23 0.10
6 Temperature Effect CT TL 140 3 6.10 0,04
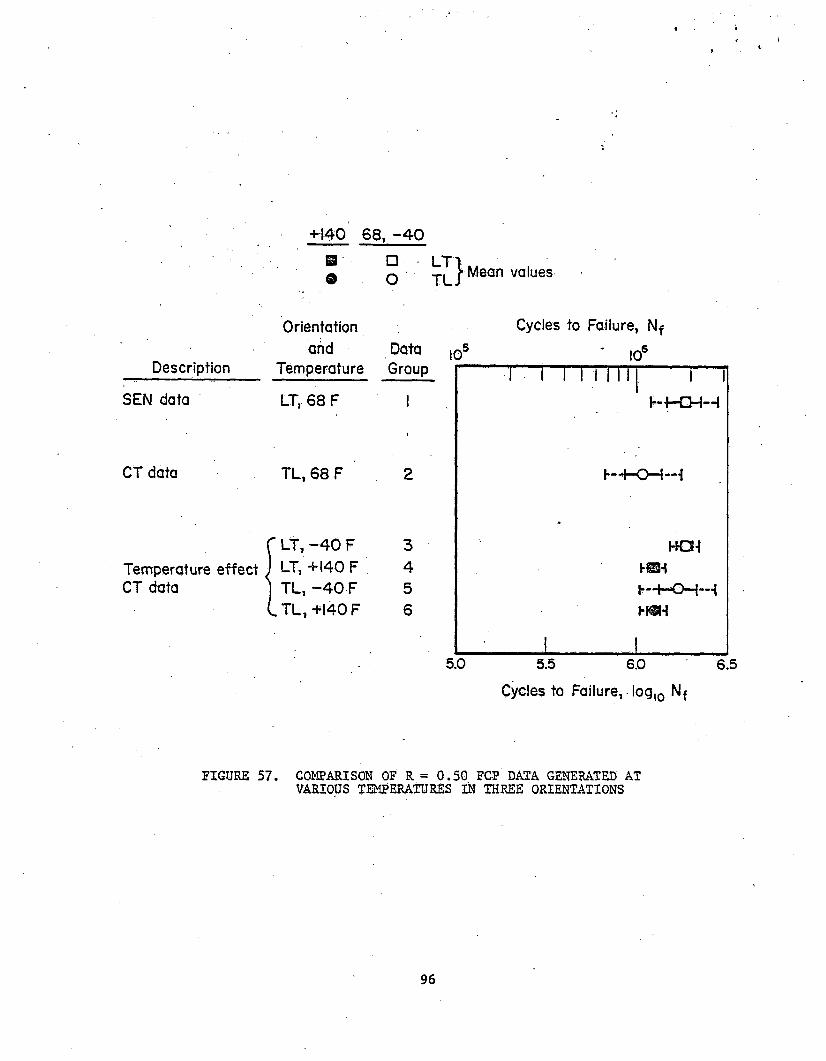
+140 68, - 4 0
B □© O Mean values
Orientation Cycles to Failure, Nfand Data |05 * |0s
Description Temperature Group T- T T T T T T T---------- !— f
SEN data LT, 68 F 1
CT data TL, 68 F 2 I - + - 0 —l-H
r LT, - 4 0 F 3*
WCHTemperature effect ) LT, +140 F 4CT data | TL, - 4 0 F 5 H - O - H
L T L , + I 4 0 F 6
___ ______ 1__________5.0 5.5 6.0 6.5
Cycles to Failure, log(0 Nf
F I G U R E 57. COMPARISON OF R = 0.50 FCP D A T A GENERATED A T VARIOUS TEMPER A T U R E S IN THREE ORIENTATIONS
96
On the basis of a statistical combination of the appropriate data subgroups a condensed tabulation of crack-growth resistance data was formed as . shown in Table 5. The effects of temperature, orientation, and stress, ratio are evident from this data display. It is also interesting to note that the coefficient of variation for these various groups is quite small — in many cases- it is less than 3 percent — which indicates excellent repeatability in the test data.
8.5 Correlation with Other Material Properties
In Phase I of this research program an attempt was m a d e ^ to correlate crack growth behavior with other mechanical properties, chemical composition and microstructural parameters. No correlations w e r e found, apart from a weak correlation with hardness. The statistical analysis in the previous subsections indicated that crack growth properties behave more or less as a random variable.
Yet 9 rail samples were selected for additional testing in this phase of the program to further examine the effect of various material parameters on crack growth. These samples were listed in Table 1. The test data are presented in Figure 58 for the LT direction and in Figure 59 for the TL direction. The ba n d of other data (Figure 15) is also shown in these figures.
The crack growth lives for these specimens are compared in Table 6 wi t h the crack growth lives of other specimens from the same rail samples tested in Phase I (LT results o n l y ) . It tuxms out that the results of the first and second test on the same sample are very close in some cases, but appreciably different in other cases. Me a n log lives and standard deviations are also compared, showing the same statistical sample properties.
The average data of the two specimens of each sample were taken for a comparison with other material parameters in Table 7. The results are listed in the order of increasing life. Chemical composition, mechanical properties and pearlite content are listed and valued by 0, + or — .- The parameter is given as zero if it was w i t h i n one standard deviation of the me a n of all 66 samples. If it was more than one standard deviation above the mean, a + is indicated, and if it was more than one standard deviation below the mean, a — is indicated. In the case of pearlite, a zero means 100 percent pearlite and a — means less than 100% pearlite. The mean log life of all 66 samples was5.68 wit h a standard deviation of 0.30. Thus, all 9 sample lives were within one standard deviation.of the mean (see Table 7).
97

<»
i
TABLE 5. OVERALL FCP STATISTICS FOR THE VARIOUS STRESS RATIOS, TEMPERATURES, FREQUENCIES AND SPECIMEN ORIENTATIONS
Logarithmic LogarithmicTemperature, Stress No. of Mean Life, Std. Dev.,
Orientation F Ratio Data X S
0.00 17 5.73 0.2368 and -40 0.50 9 6.27 0.08
LT -1.00 6 5.71 0.270.00 6 5.50 0.13
1401 0.50 3 6.10 0.03
( 0.00 7 5.58 , 0.1268 and -40
[ 0.50 9 6.10 0.10TL
( 0.00 3 5.34 0.12140 <
[ 0.50 3 6.10 0.04
SL 68 0.00 3 5.21 0.04
98
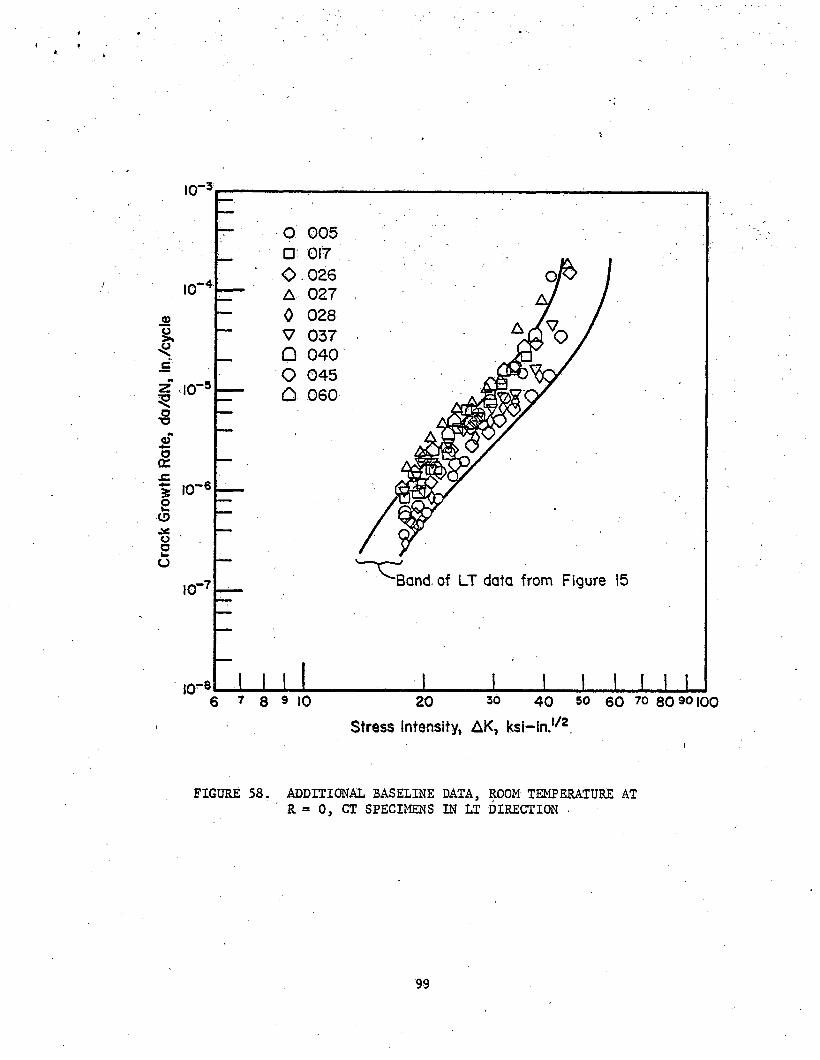
Crack G
rowth R
ate, d
a/dN, I
n./cycle
*
FIGURE 58. ADDITIONAL BASELINE DATA, ROOM TEMPERATURE AT R = 0, CT SPECIMENS IN LT DIRECTION
99
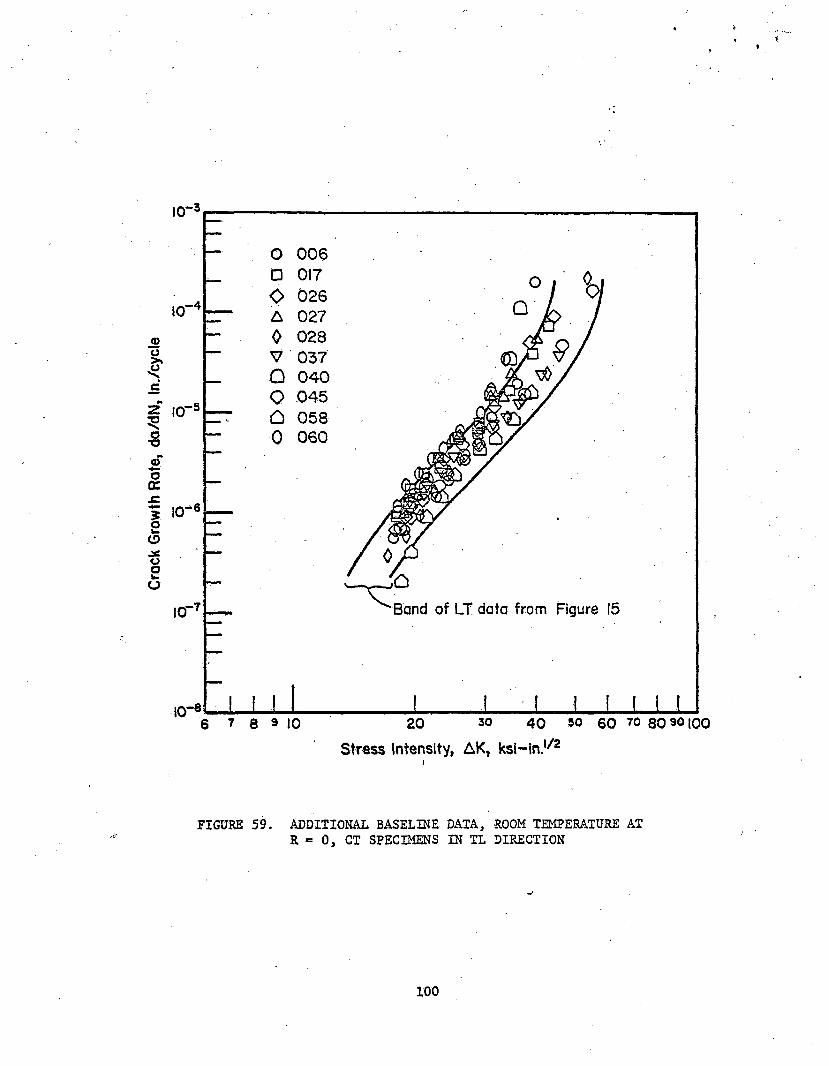
Crac
k Gr
owth
Rat
e, da
/dN,
In./c
ycle
10,-3
10',-4
10,-5
10-6
10r-7
10-8
O 0 0 6 □ 017 O 0 2 6 A 0 2 7 0 0 2 8 V 0 3 7 O 0 4 0 O 0 4 5
0 5 8 0 0 6 0
l . - - 1 -.- i 1 I I M6 7 8 9 1 0 2 0 3 0 4 0 s o 6 0 7 0 8 0 9 0 1 0 0
Stress Intensity, A K , ksi-in.,/2
FIGURE 59. A D D I T I O N A L BASELINE DATA, R O O M TEM P E R A T U R E AT R = 0, GT SPECIMENS IN T L D I R ECTION
1 0 0
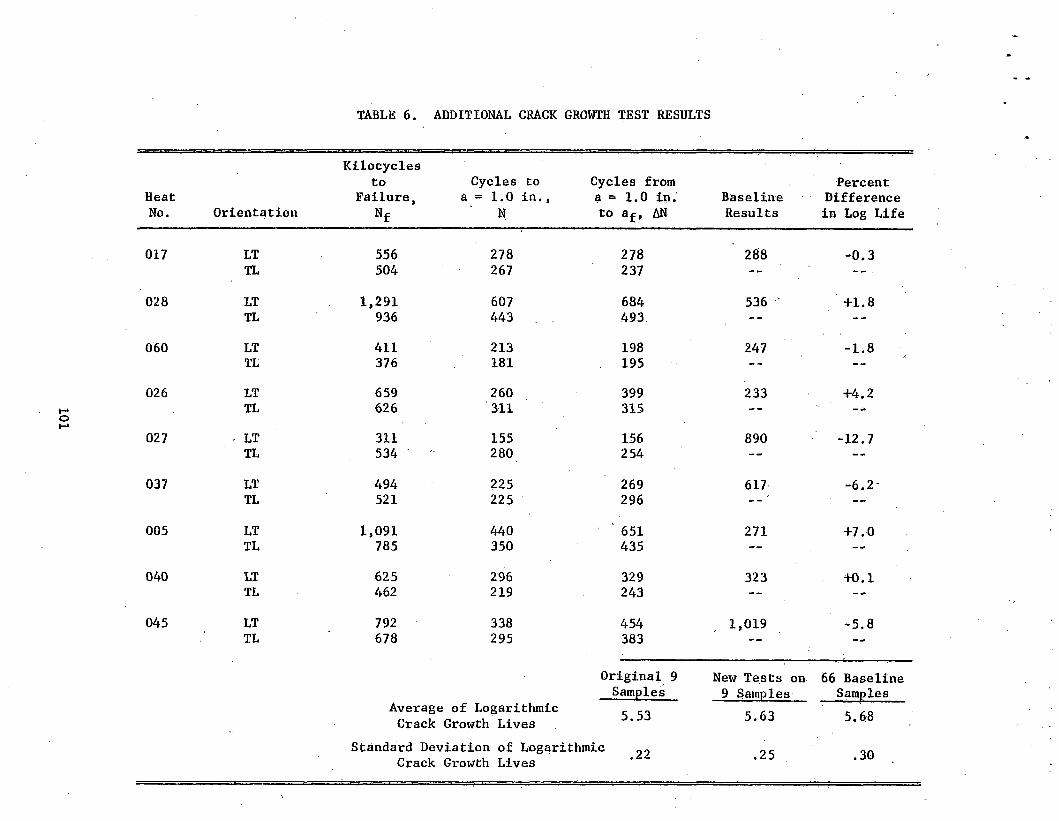
101
TABLE 6. ADDITIONAL CRACK GROWTH TEST RESULTS
Kilocycles - ‘
to Cycles to Cycles from PercentHeat Failure, a = 1.0 i n . , a = 1.0 in. Baseline DifferenceNo. Orientation N f N to a£, AN Results in Log Life
017 LT 556 278 278 288 -0.3TL 504 267 237 --
028 LT 1,291 607 684 536 1 +1.8TL 936 443 493 -- --
060 LT 411 213 198 247 -1.8TL 376 181 195 --
026 LT 659 260 399 233 +4.2TL 626 311 315 -- -*
027 LT 311 155 156 890 -12.7TL 534 280 254 — —
037 LT 494 225 269 617 -6.2TL 521 225 296 __
005 LT 1,091 440 ' 651 271 +7.0TL 785 350 435 — --
040 LT 625 296 329 323 +0.1TL 462 219 243 -- --
045 LT 792 338 454 1,019 -5.8TL 678 295 383 -- —
Original 9 N e w Tests on 66 BaselineSamples 9 Samples Samples
Average of Logarithmic Crack Growth Lives 5.53 5.63 5.68
Standard Deviation of Logarithmic ^ Crack Growth Lives .25 .30
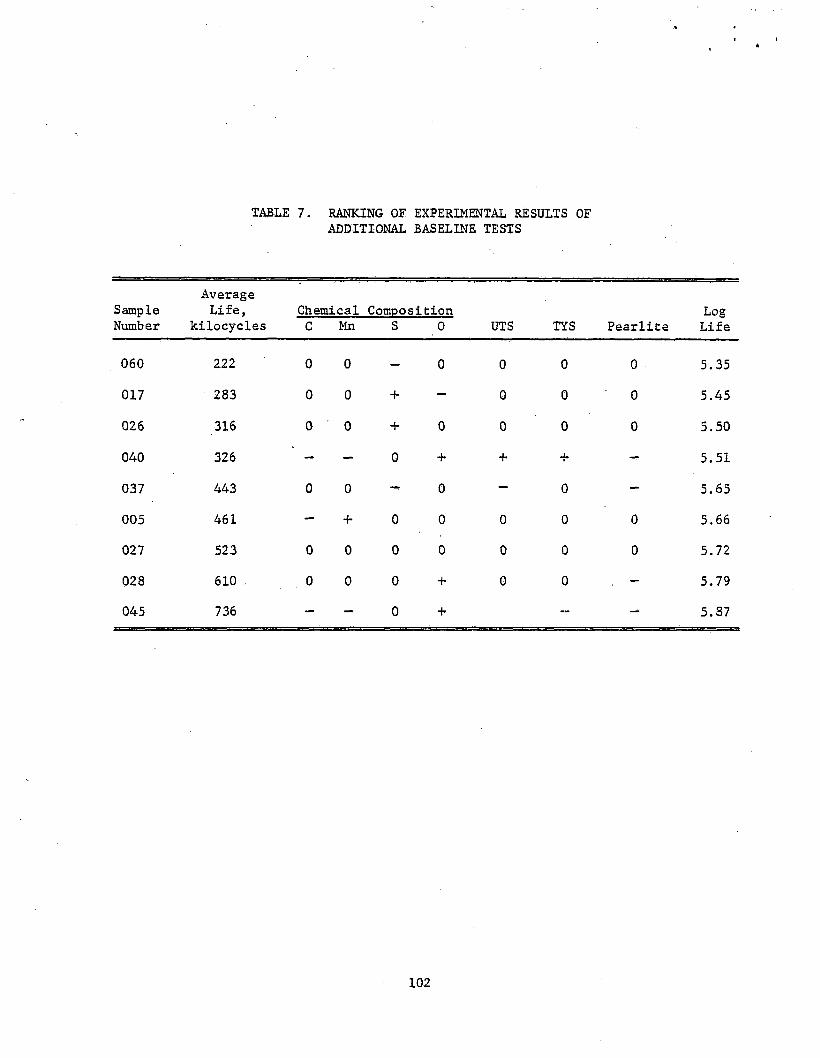
TABLE 7. RANKING OF EXPERIMENTAL RESULTS OF ADDITIONAL BASELINE TESTS
SampleNumber
AverageLife,
kilocyclesChemical Composition C Mn S 0 UTS TYS Pearlite
LogLife
060 222 0 0 — 0 0 0 0 5.35017 283 0 0 + — 0 0 0 5.45
026 316 0 0 + 0 0 0 0 5.50
040 326 — — 0 + + + — 5.51
037 443 0 0 — 0 — 0 — 5.65
005 461 — + 0 0 0 0 0 5.66
027 523 0 0 0 0 0 0 0 5.72
028 610 0 0 0 + 0 0 — . 5.79
045 736 — — 0 + — — 5.87
102
For Sample No. 027, all material parameters are zero, while this sample had a life of 523,000 cycles. Samples 040 and 045 have mostly nonzero entrees, and all deviations are to the same side, except the yield stress.Yet Sample No. 040 has a life of 326,000 cycles and Sample No. 045 has a life of 736,000 cycles, which spreads the results to both sides of Sample 027.
The fact that crack growth properties do not show obvious correlations with any other material .parameters may not be as surprising as it seems.. All parameters listed in Table 7 are bulk properties, i.e., they are an average for a large conglomerate of grains, pearlite colonies, and inclusions. However, fatigue crack propagation is not a bulk property but a very local property.Every cycle the crack propagates over a small distance varying from 10"^ to 10“^ inches. For every cycle, then, only an extremely small amount of material comes into play. Thus, the variability in crack growth is much more a function of the local variations in structural and chemical composition. Most of the crack propagation life is Spent when the crack is still very small. If in that part of. life material is encountered where the. local properties are poor, the crack will grow quickly through this region, thus causing a drastic reduction in total crack growth life. If in a later stage of crack growth, material is encountered with much better properties, some of the loss is made up for, but since crack growth rates are already high due to the high K, the total life still remains low.
Thus, crack growth is much more dependent upon local variations in the material than other material properties. As a consequence, any correlations with bulk material properties are not observed, obvious, or easily assessible. Another consequence is that variability of crack growth properties within a material can. be almost as large as the variability among materials of the same type (i.e., variability within one rail as opposed to variability among rails).Only if the bulk properties show very drastic changes can a general trend in crack growth properties be observed. This is the case if the effect of orientation is considered, where the SL direction has consistently worse properties than the. LT direction.
The variability of all parameters for 66 rail samples is given in Table8. Despite the large variations in chemical composition the bulk properties of tensile strength and yield stress do not vary much. The standard deviation as a percent of the mean for the chemical composition is on the order of 10 percent or more. This number is only a few percent for the mechanical properties, and more important, also for the log life. Apparently, the large variations in chemical and structural parameters are not reflected in the variability of the crack growth life. 103
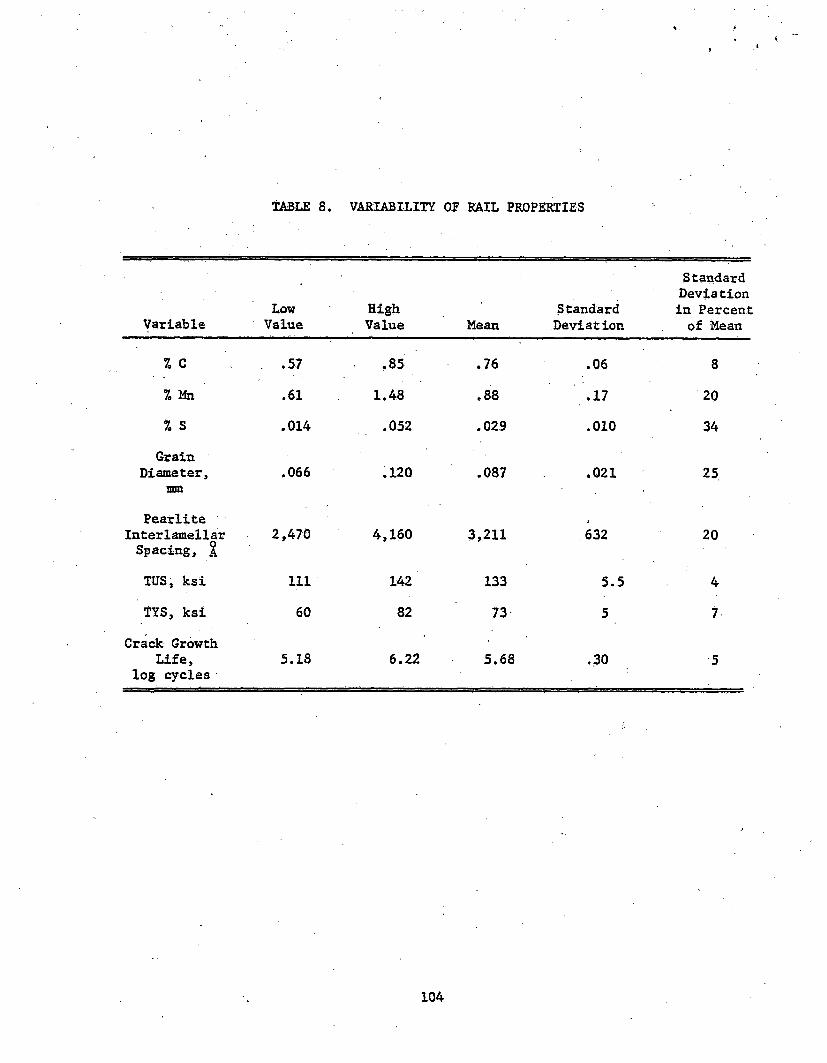
TABLE 8. VARIABILITY OF RAIL PROPERTIES
VariableLow
ValueHighValue Mean
StandardDeviation
Standard Deviation in Percent of Mean
% C .57 •* 00 Ul .76 .06 8
% Mn .61 1.48 .88 *17 20
% S .014 .052 .029 .010 34
GrainDiameter,
mm.066 .120 .087 .021 25
Pearlite Interlamellar Spacing, %
2,470 4,160 3,211 632 20
TUS, ksi 111 142 133 5.5 4
TYS, ksi 60 82 73 5 7
Crack Growth Life,
log cycles5.18 6.22 5.68 .30 5
104
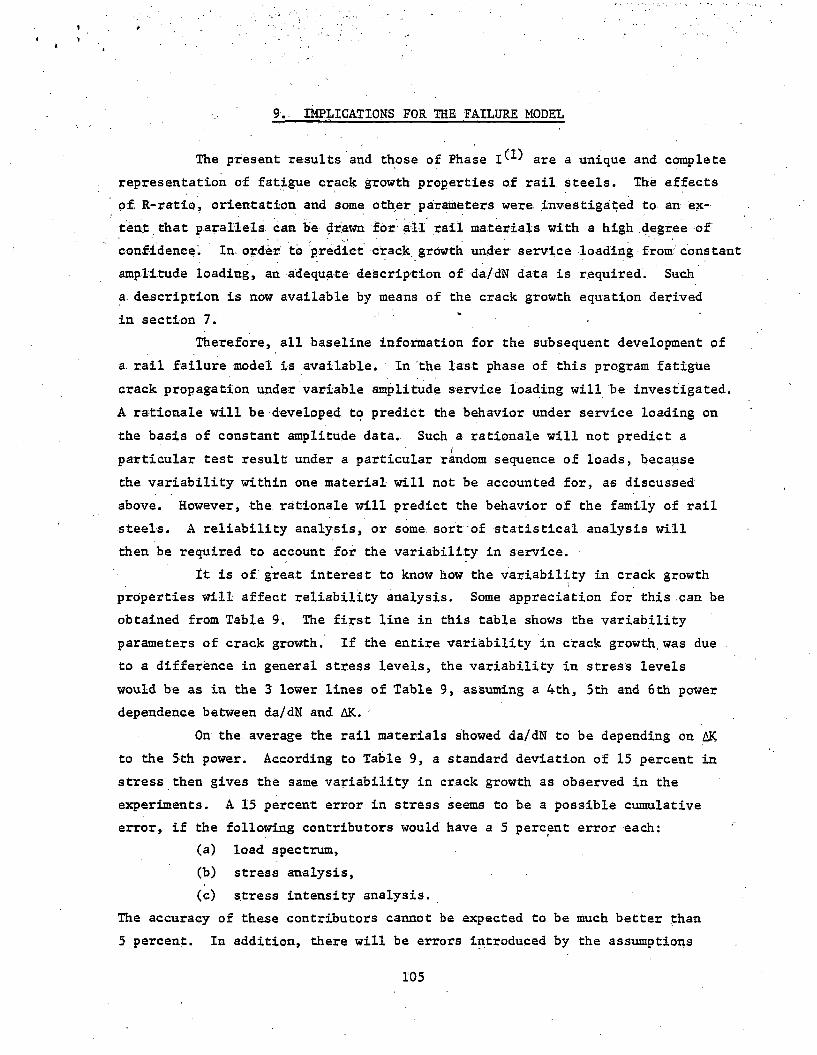
9.. IMPLICATIONS FOR THE FAILURE MODEL
The present results and those of Phase 1 ^ are a unique and complete
representation of fatigue crack growth properties of rail steels. The effects
of R-ratio, orientation and some other parameters were investigated to an ex
tent that parallels can be drawn for all rail materials with a high degree of
confidence. In order to prediet crack growth under service loading from constant
amplitude loading,, an adequate description of da/dN data is required. Such
a description is now available by means of the crack growth equation derived
in section 7.
Therefore, all baseline information for the subsequent development of a. rail failure model is available. In the last phase of this program fatigue
crack propagation under variable amplitude service loading will be investigated.
A rationale will be developed to predict the behavior under service loading on
the basis of constant amplitude data. Such a rationale will not predict a
particular test result under a particular random sequence of loads, because
the variability within one material will not be accounted for, as discussed
above. However, the rationale will predict the behavior of the family of rail
steels. A reliability analysis, or some sort of statistical analysis will
then be required to account for the variability in service.
It is of great interest to know how the variability in crack growth!properties will affect reliability analysis. Some appreciation for this can be
obtained from Table 9. The first line in this table shows the variability
parameters of crack growth. If the entire variability in crack growth was due
to a difference in general stress levels, the variability in stress levels
would be as in the 3 lower lines of Table 9, assuming a 4th, 5th and 6th power
dependence between da/dN and AK.
On the average the rail materials showed da/dN to be depending on AK
to the 5th power. According to Table 9, a standard deviation of 15 percent in
stress then gives the same variability in crack growth as observed in the
experiments. A 15 percent error in stress seems to be a possible cumulative
error, if the following contributors would have a 5 percent error each:
(a) load spectrum,
(b) stress analysis,
(c) stress intensity analysis.
The accuracy of these contributors cannot be expected to be much better than
5 percent. In addition, there will be errors introduced by the assumptions
105
TABLE 9. VARIABILITY IN STRESS F O R EQUIVALENT VARIABILITY IN C R A C K GROW T H LIFE
VariableLow
ValueHighValue M e a n
StandardDeviation
Standard Deviation in Percent of M e a n
Crack Growth Life,
log cycles5.18 6.22 5.68 .30 5
Equivalent Variability in Stress, ksi (4th Power)
.75 1.36 1 .19 19
Equivalent Variability in Stress, ksi (5th Power)
.79 1.28 1 .15 15
Equivalent Variability in Stress, ksi (6th Power)
.83 1.23 1 .12 12
1 0 6

on flaw location and flaw shape. Therefore, it is concluded that the variability in crack growth properties is of the order of magnitude of the variability (error) of predictions due to accuracy limitations.
REFERENCES
(1) Fedderson, C. E., Buchheit, R. D. and Broek, D., "Fatigue Crack Propagation in Rail Steels", DOT Report DOT-TSC-1076, July, 1976.
(2) Fedderson, C. E. and Broek, D., "Fatigue Crack Propagation in Rail Steels",To be published in an ASTM STP.
(3) Broek, D., "Elementary Engineering. Fracture Mechanics", Noordhoff Int.Publ., Leyden, Holland (1974).
(4) Rosenfield, A. R. and McEvily, A. J., "Some Recent Developments in Fatigue and Fracture", AGARD-R-610 (1973), pp. 23-54.
(5) Kobayashi, A. S., "Approximate Stress Intensity Factor for an Embedded Elliptical Crack Near to Parallel Free Surfaces", Int. J. Fracture Mechanics, 1 (1965), pp. 81-95.
(6) Shah, R. C. and Kobayashi, A. S., "Stress Intensity Factors for an Elliptical crack Approaching the Surface of a Semi-Infinite Solid, Int. J. Fracture, 9 (1973), pp. 133-146.
(7) Erdogan, F. and Sih, G. C., "On the Crack Extension in Plates Under Plane Loading and Transverse Shear", J. Basic Engrg., 85 (1963), pp. 519-527.
(8) Sih, G. C., "Strain-Energy-Density Factor Applied to Mixed Mode Crack Problems", Int. of Fracture, 10 (1974), pp. 305-322.
(9) Nuismer, R. J., "An Energy Release Rate Criterion for Mixed Mode Fracture", Int. J. Fracture, 11 (1975), pp. 245-250.
(10) Iida, 'S. and Kobayashi, A. S., "Crack Propagation Rate in 7075-T6 Plates Under Cyclic Tensile and Transverse Shear Loadings", J. Basic Engrg., 91 (1969), pp. 764-769.
(11) Roberts, R. and Kibler, J. J., "Mode II Fatigue Crack Propagation",J. Basic Engrg., 93 (1971), pp. 671-680.
(12) Pook, L. P., "The Effect of Crack Angle on Fracture Toughness", NEL Report 449 (1970).
(13) Hoskin, B. C., Groff, D. G. and Foden, P. J., "Fracture of Tension Panels With Oblique Cracks", Aer. Res. Lab, Melbourne, Rept. SM 305 (1965).
(14) Shah, R. C., "Fracture Under Combined Modes in 4340 Steel", ASTM STP 560 (1974), pp. 29-52.
(15) Liu, A. F., "Crack Growth and Failure of Aluminum Plate Under In-Plane Shear", AIAA Paper 73-253 (1973).
(16) Fowler, G. J., "Fatigue Crack Initiation and Propagation in Pearlitic Rail Steels", Ph.D. Dissertation, U. of California, Los Angeles.
108
APPENDIX A
BASIC CRACK LENGTH CYCLES DATA FOR PHASE II CONSTANT AMPLITUDE EXPERIMENTS
The following tabulations present the crack length measurements and associated cycle count for the experiments discussed in this report. The first measurement point- in each tabulation represents the precrack length on the specimen surface after crack initiation out of the chevron notch. The final crack length represents the last crack size that could be monitored before fracture.
Specimen coding is in accordance with the text and figures.
A-l
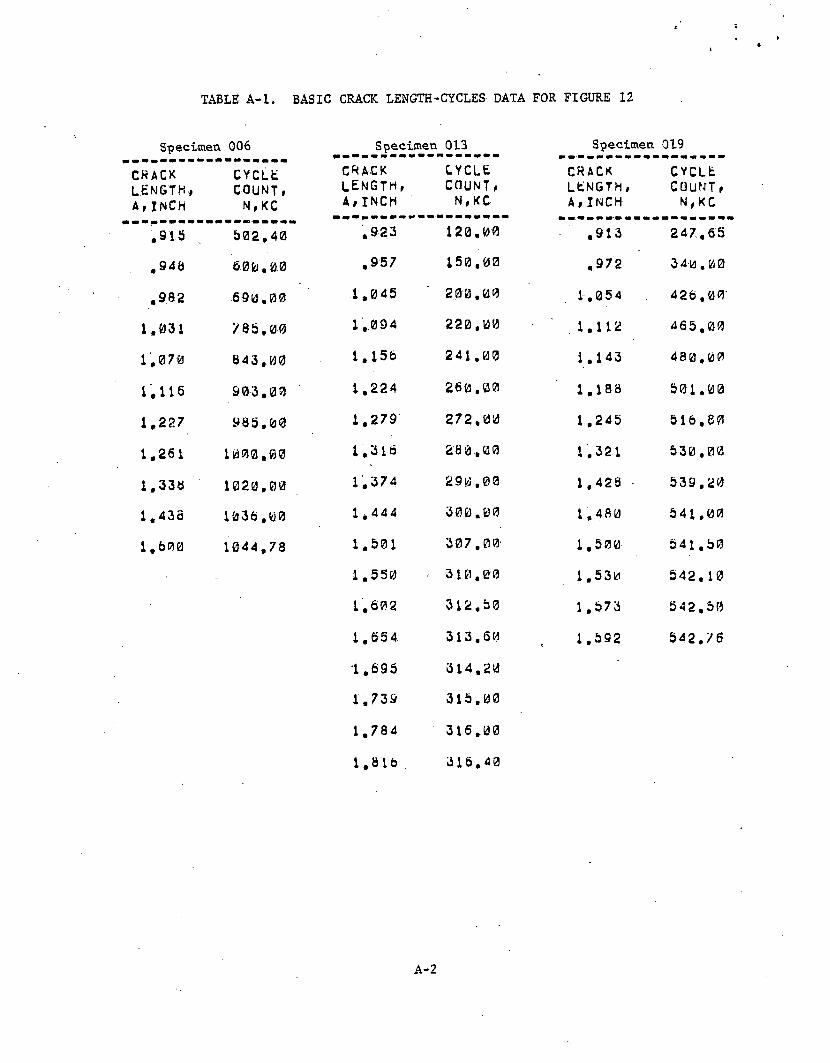
TABLE A-l. BASIC CRACK LENGTH-CYCLES DATA FOR FIGURE 12
Specimen 006 Specimen 013 Specimen 019CRACKlength,A,INCH
CYCLE COUNT, N, KC
CRACKlength, A,INCH
CYCLECOUNT,N,KC
CRACK LENGTH, A,INCH
CYCLE COUNT, N, K C
,91b 502,40 .923 120.00 .913 247.65,94b 600,00 .957 150.00 ,972 34|d.00.982 690.00 1.0 45 2,00.00 1.054 426,001.031 785,00 1,094 220.00 1,112 465.001,070 843,00 1.156 241,00 1.143 480.001,116 903.00 1.224 260.00 1.188 501.001,227 985,00 1,279 272,00 1.245 516.801,261 1000,00 1.316 280,00 1.321 530,001,33b 1020,00 1.374 290.00 1.428 539.201,438 1036,00 1.444 300.00 1.480 541,001,600 1044,78 1.501 307.00 1.500 541.50
■ 1,550 310,00 1.530 542.101.602 312,50 1.573 542.501,65 4 313,60 , 1.592 542.761,695 314,201.739 315.001.784 316.001.816 316.40
A-2
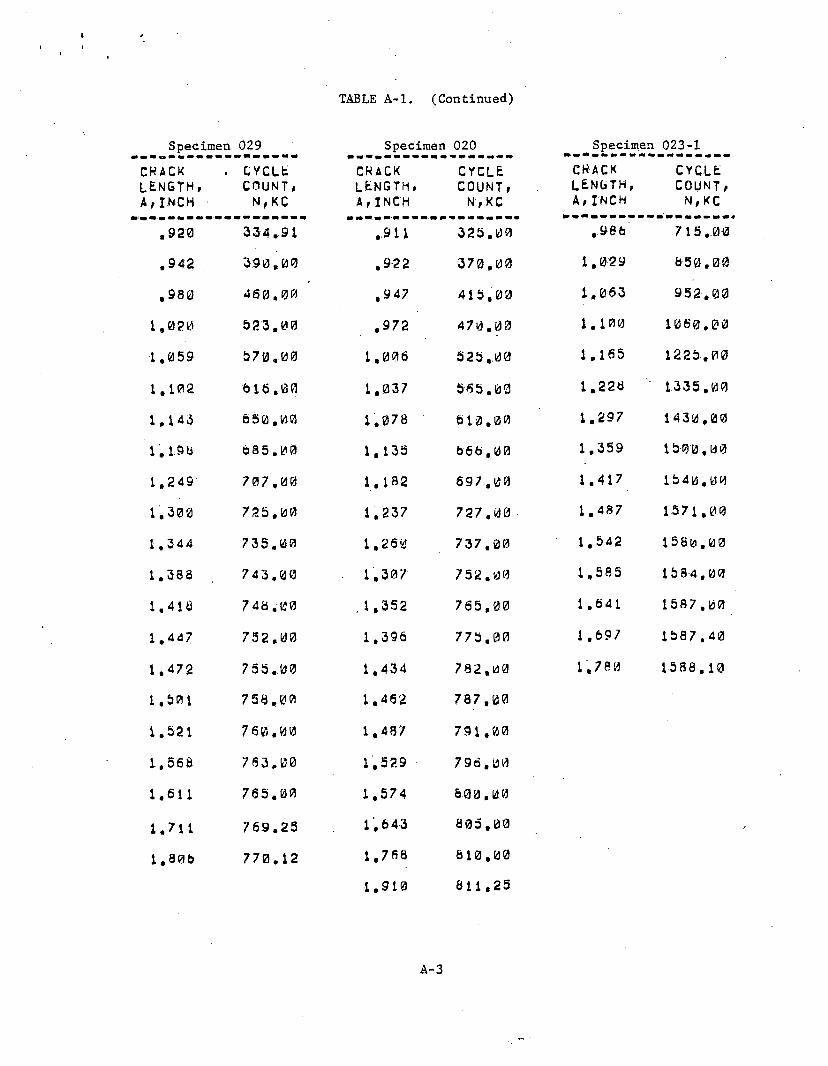
TABLE A-l. (Continued)
S p e c i m e n 0 2 9 S p e c i m e n 0 2 0 S p e c i m e n 0 2 3 - 1
C R A C K
l e n g t h ,
A , I N C H
. C Y C L E
C O U N T ,
N , K C
C R A C K
L E N G T H ,
A , I N C H
C Y C L E
C O U N T ,
N , K C
C R A C K
l e n g t h ,
A , I N C H
C Y C L E
C O U N T ,
N , K C
. 9 2 0 3 3 4 . 9 1 . 9 1 1 3 2 5 . 0 0 . 9 8 6 7 1 5 . 0 0
. , 9 4 2 3 9 0 , 0 0 . 9 2 2 3 7 0 , 0 0 1 . 0 2 9 6 5 0 . 0 0
. 9 8 0 4 6 0 . 0 0 , 9 4 7 4 1 5 , 0 0 1 . 0 6 3 9 5 2 . 0 0
1 . 0 2 0 5 2 3 . 0 0 . 9 7 2 4 7 3 . 0 0 1 . 1 0 0 1 0 6 0 , 0 0
1 . 0 5 9 5 7 0 , 0 0 1 . 0 0 6 5 2 5 , 0 0 1 . 1 6 5 1 2 2 5 . 0 0
1 . 1 0 2 5 1 6 . 0 0 1 . 0 3 7 5 6 5 . 0 0 1 . 2 2 8 1 3 3 5 . 0 0
1 . 1 4 3 6 5 0 , 0 0 1 . 0 7 8 6 1 0 . 0 0 1 . 2 9 7 1 4 3 0 , 0 0
1 . 1 . 9 a 6 8 5 . 0 0 1 , 1 3 5 6 6 6 , 0 0 1 . 3 5 9 1 5 0 0 , 0 0
1 . 2 4 9 7 0 7 , 0 0 1 . 1 8 2 6 9 7 , 0 0 1 . 4 1 7 1 5 4 0 . 0 0
1 . 3 0 0 7 2 5 , 0 0 1 . 2 3 7 7 2 7 . 0 0 1 . 4 8 7 1 5 7 1 , 0 0
1 . 3 4 4 7 3 5 . 0 0 1 , 2 6 0 7 3 7 . 0 0 1 . 5 4 2 1 5 8 0 , 0 0
1 . 3 8 8 7 4 3 . 0 0 1 . 3 0 7 7 5 2 . 0 0 1 , 5 8 5 1 5 8 4 , 0 0
1 , 4 1 8 7 4 8 . 0 0 , 1 . 3 5 2 7 6 5 , 0 0 1 . 6 4 1 1 5 8 7 . 0 0
1 . 4 4 7 7 5 2 . 0 0 1 . 3 9 6 7 7 5 , 0 0 1 . 6 9 7 1 5 8 7 . 4 0
1 , 4 7 2 7 5 5 . 0 0 1 . 4 3 4 7 8 2 , 0 0 1 . 7 8 0 1 5 8 8 , 1 0
1 . 5 0 1 7 5 8 , 0 0 1 . 4 6 2 7 8 7 . 0 0
1 . 5 2 1 7 6 8 . 0 0 1 . 4 8 7 7 9 1 . 0 0
1 . 5 6 8 7 6 3 . 0 0 1 , 5 2 9 7 9 6 , 0 0
1 . 6 1 1 7 6 5 . 0 0 1 . 5 7 4 6 0 0 . 0 0
1 . 7 1 1 7 6 9 . 2 5 1 . 6 4 3 8 0 5 . 0 0
1 . 8 0 b 7 7 0 . 1 2 1 . 7 6 8 8 1 0 , 0 0
1 . 9 1 3 8 1 1 , 2 5
A-3
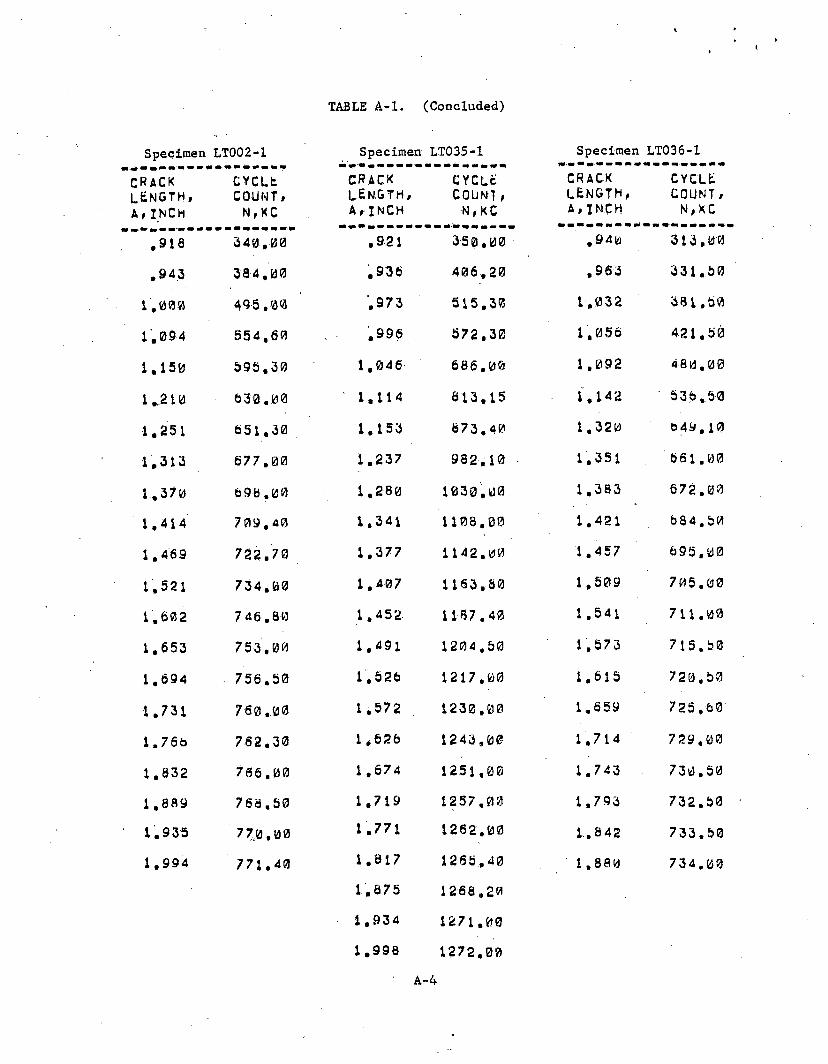
TABLE A-l. (Concluded)
Specimen LT002-1 Specimen LT035-1 Specimen LT036-1
c r a c kLENGTH, A ,INCH
CYCLE COUNT, N , K C
CRACKl e n g t h ,A ,INCH
c y c l eCOUNT , N,KC
CRACKl e n g t h ,A,INCH
CYCLE C O U N T , N , K C
.918 340,00 . 92 1 350.00 .940 313.00
,94 3 384,00 .936 406,20 .963 331.50
1.000 495.0® ‘,973 515.38 1.032 381,50
1.094 554,60 .996 572.30 1,056 421.50
1.150 595.30 1,046 686.08 1.092 480,00
1.210 630.00 ' 1.114 813.15 1.142 536,50
1.25 1 651,30 1.153 873.40 1,320 649,10
1.313 677.00 1,237 982,10 1.351 '661.00
1.370 698.00 1,280 1030.00 1.383 672.08
1.414 709.a0 1.341 1108,00 1.421 684.50
1.469 722.78 1.377 1142.00 1.457 695.00
1.521 734.00 1,407 1163.88 1,509 705.00
1.602 746.80 1.452 1167.40 1.541 711.00
1.653 753,00 1.491 1204.50 1.573 715.50
1.694 756.50 1,526 1217,00 1.615 720.50
1.731 76-0 ,00 1.572 1230,00 1.659 725,60
1.76b 762.30 1.626 1243,00 1.714 729.00
1.832 766.00 1,674 1251,00 1.7 43 730.50
1.889 768.50 1,719 1257,00 1,793 732.50
1.935 7 7 0 , 0 0 1.771 1262.00 1.8 42 733.50
1.994 771.40 1.817 1265,40 1.880 734.00
1.875 1268,20
1.934 1271.80
1.998 1272,00
A-4
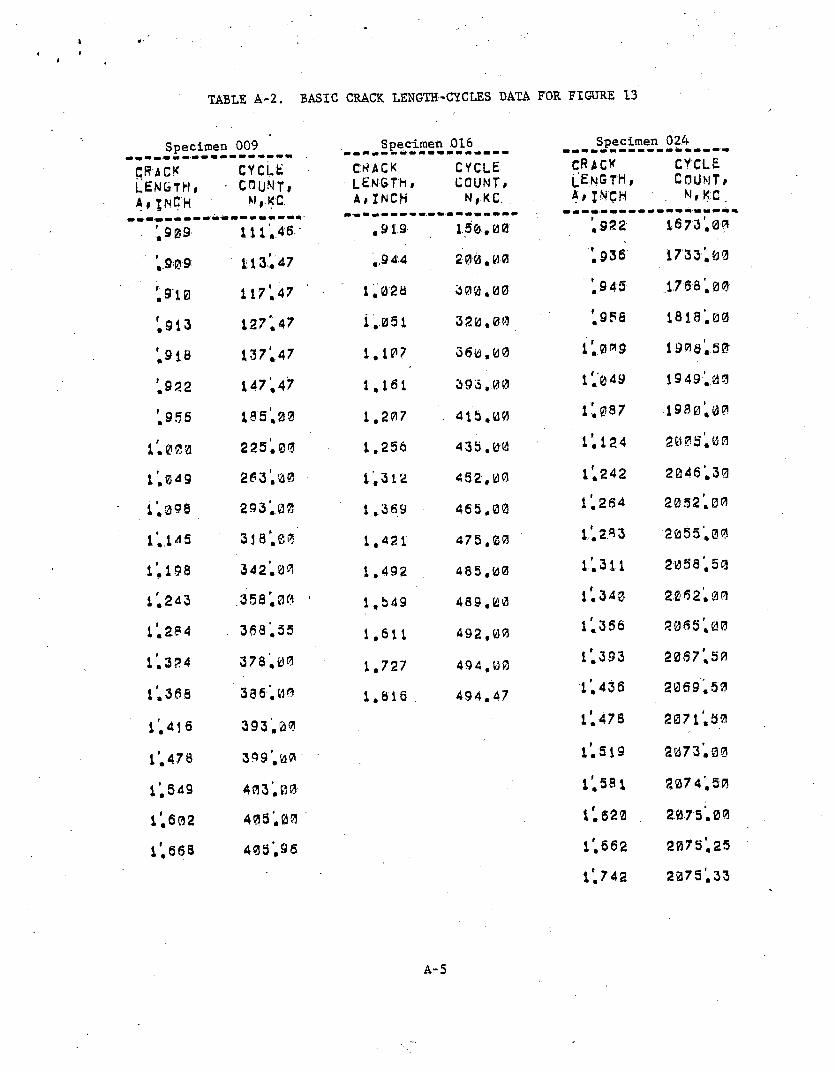
TABLE A-2. BASIC CRACK LENGTH-CYCLES DATA FOR FIGURE 13
Specimen 009 Specimen 016 Specimen 024
CRACKl e n g t h ,A i JNC'H
CYCLE COUNT, M ,KC
CHACKl e n g t h , A#INCH
CYCLECOUNT,N,KC
c r a c k LENGTH, A, I N C H
CYCLEc o u n t #
. n ,K C .
’.9 09 111.46 • . 91.9 1.50,00 ’,922 1673.00
90 9 113*. 47 ,94 4 200.00 ’.936 17 3 3 ’.00
'.910 117'.47 1.028 300.00 ’,945 1 7 6 8 ’, 00
'.913 127*. 47 1,051 320.00 '.956 18 18 ’. 8 0
'.918 137*47 1.107 368,00 l'.0ng 1908,50
'.922 1 4 7 ’.47 1,161 393,80 l'.04y 19 49 ’,00
'.956 18 5 0 3 1.207 415,00 1 0 8 7 19 8 0 0 0
1 . 0 0 a 225'. 80 1.256 435.00 r.124 2 8 0 5 ’,00
r.049 263'.00 1.312 452,00 1 2 4 2 2 0 4 6 ’. 30
l'.a98 2 9 3 ’.00 1,369 465.00 1 ’. 2 6 4 20 5 2 ’.00
1 »14 5 3 1 8 ’. SB 1.421 475.00 1.233 2055,00
1.198 342.30 1.492 485,00 1 ’. 311 2 0 5 8 5 9
r.243 3 5 8 ’.0fl ' 1.549 489.80 l'.340 20 62,00
l’.2.34 363,55 1.611 492,00 1 ’. 3 6 6 2 0 6 5 ’, 0 0
1.324 378,80 1.727 494,00 1 3 9 3 2 0 S 7 5 0
1,366 3 8 6 '.HO 1.816 494.47l’, 436 2869,50
1,416 393,00 1'. 4 7 8 2071',50
1 ’. 47 8 3 9 9 0 8 1'. 519 2073.90
r . 5 4 9 403'.B9 l’. 58 1 207 4',50
1'. 6 0 2 4 0 5 ’.00 r.620 2:07 5 ‘.00
1 6 6 8 485,96 l’.662 2075.25
l'.742 2075,33
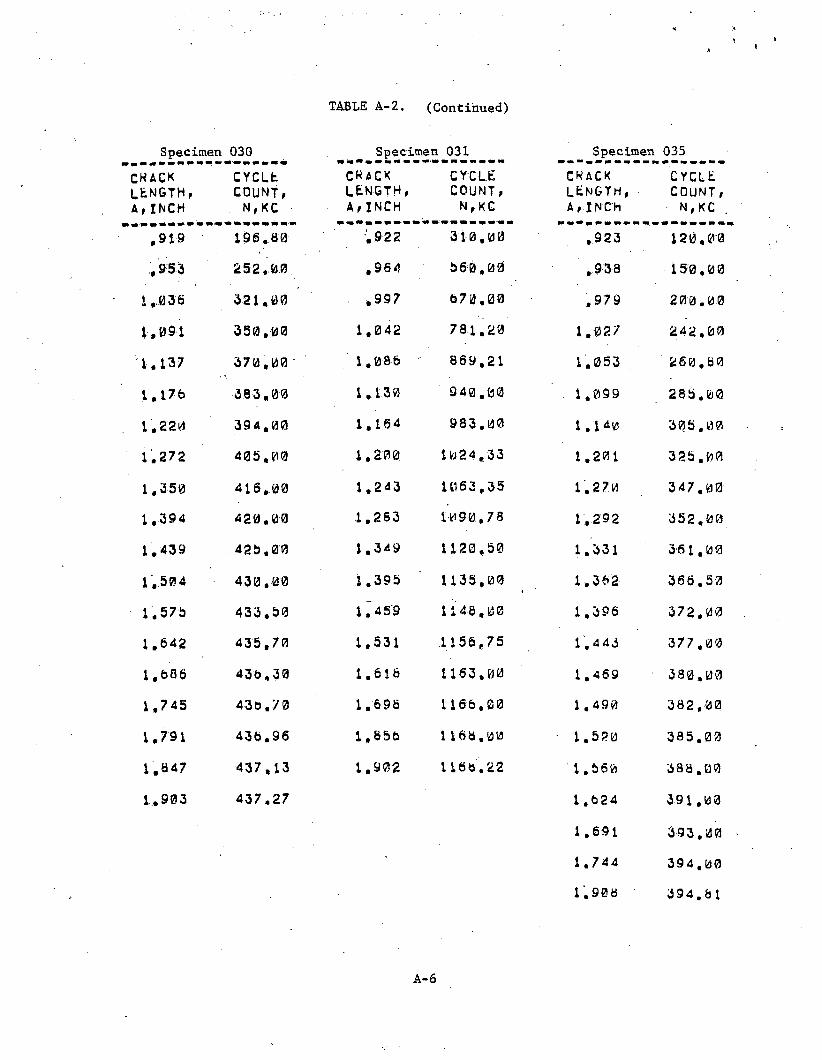
TABLE A-2. (Continued)
Specimen 030 S p e cimen 031 Specimen 035
C K A C Kl e n g t h ,A , I N C H
C Y C L EC O U N T ,N , K C
C K A C Kl e n g t h ,A , I N C H
C Y C L EC O U N T ,N , K C
C K A C Kl e n g t h ,A, I N C H
C Y C L EC O U N T ,N , K C
, 9 1 9 1 9 6 . 8 0 . 9 2 2 3 1 0 , 0 0 . 9 2 3 1 2 0 , 0 0
, 9 5 3 2 5 2 . 0 0 . 9 6 4 5 6 0 , 0 0 , 9 3 8 1 5 0 . 0 0
1 , 0 3 6 3 2 1 . 0 0 . 9 9 7 6 7 0 . 0 0 . 9 7 9 2 0 0 . 0 0
1 , 0 9 1 3 5 0 . 0 0 1.04-2 7 8 1 . 2 0 1 . 0 2 7 2 4 2 . 0 0
1 , 1 3 7 3 7 0 , 0 0 • 1 . 0 8 6 8 6 9 . 2 1 1 . 0 5 3 2 6 0 . 8 0
1 . 1 7 9 3 8 3 , 0 0 1 . 1 3 0 9 4 0 . 0 0 , 1 . 0 9 9 2 8 5 . 0 0
1 , 2 2 0 3 9 4 , 0 0 1 . 1 6 4 9 8 3 . 0 0 1 . 1 4 0 3 0 5 . 0 0
1 . 2 7 2 4 0 5 , 0 0 1 . 2 0 0 1 0 2 4 , 3 3 1 . 2 0 1 3 2 5 . 0 0
1 , 3 5 0 4 1 6 , 0 0 1 . 2 4 3 1 0 6 3 , 3 5 1 . 2 7 0 3 4 7 . 0 0
1 . 3 9 4 4 2 0 . 0 0 1 . 2 6 3 1 0 9 0 , 7 8 1 , 2 9 2 3 5 2 . 0 0
1 . 4 3 9 . 4 2 5 , 0 0 1 . 3 4 9 1 1 2 0 , 5 0 1 . 3 3 1 3 6 1 , 0 0
1 . 5 0 4 4 3 0 . 0 0 1 . 3 9 5 1 1 3 5 , 0 0 * 1 . 3 6 2 3 6 6 . 5 0
1 . 5 7 b 4 3 3 , 5 3 1 ~ 4 5 9 1 1 4 6 . 0 0 1 . 3 9 6 3 7 2 . 0 0
1 . 6 4 2 4 3 5 , 7 0 1 . 5 3 1 1 1 5 6 , 7 5 1 . 4 43 3 7 7 , 0 0
1 . 6 8 6 4 3 6 , 3 0 1 . 6 1 6 1 1 6 3 . 0 0 1 . 4 6 9 3 8 0 , 0 0
1 . 7 4 5 4 3 6 . 7 0 1 . 6 9 6 1 1 6 6 . 0 0 1 . 4 9 0 3 8 2 , 0 0
1 . 7 9 1 4 3 6 . 9 6 1 . 8 5 6 1 1 6 8 . 0 0 1 . 5 2 0 3 8 5 . 0 0
1 . 8 4 7 4 3 7 , 1 3 1 . 9 0 2 1 1 6 6 . 2 2 1 . 5 6 0 3 8 8 , 0 0
1 . 9 0 3 4 3 7 . 2 7 1 . 6 2 4 3 9 1 , 0 0
1 . 6 9 1 3 9 3 . 0 0
1 . 7 4 4 3 9 4 . 0 0
r .908 3 9 4 . 6 1
A-6
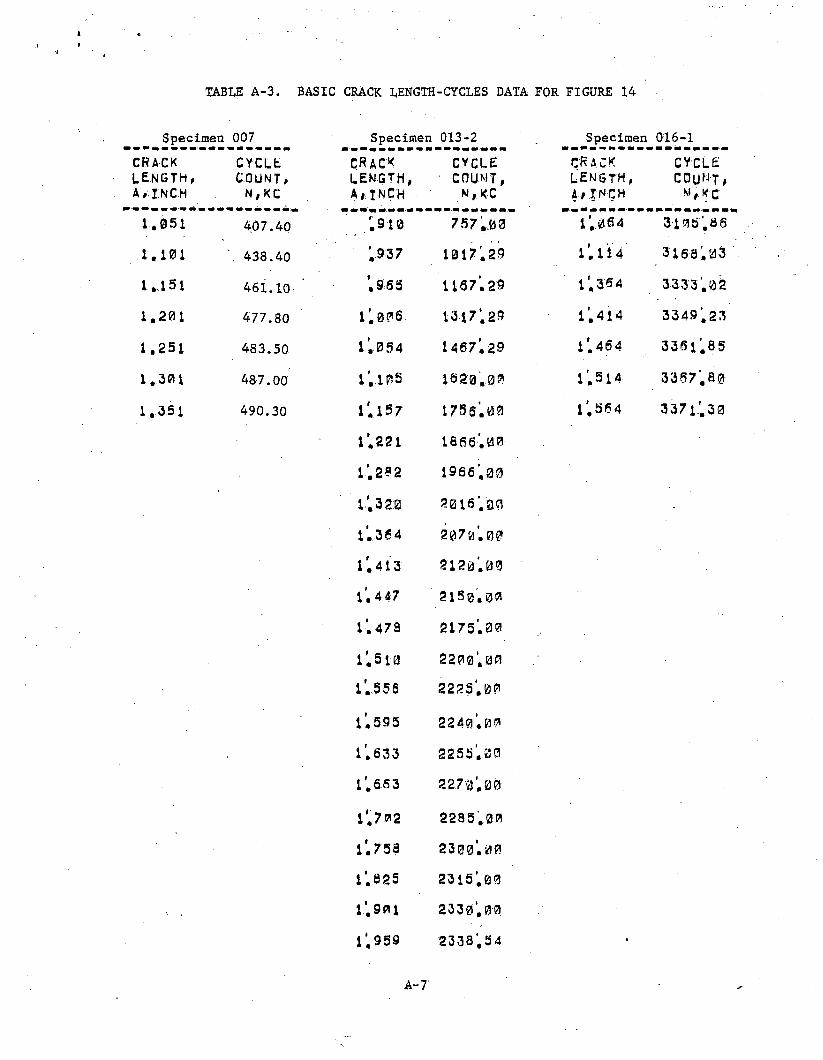
TABLE A-3. BASIC CRACK LENGTH -CYCLES DATA FOR FIGURE 14
Specimen 007 Specimen 013-2 Specimen 016-1C R A C K C Y C L E c r a c k C Y C L E C R A C K C Y C L El e n g t h , C O U N T , L E N G T H , C O U N T , l e n g t h , C O U N T ,A , I N C H N | K C A , I N C H N, K C A t I N C H w 1 K C
1 . 0 5 1 407.40 ’. 9 1 0 7 5 7 . 0 3 1 ’. 0 6 4 3105'.8 6
1 . 1 0 1 . 438.40 ’. 9 3 7 1 0 1 7 . 2 9 t i l l 4' 3 1 6 8 . 0 3
1 . 1 5 1 461.10 ' . 9 6 5 1167'. 29 1'. 3 ® 4 3 3 3 3 . 0 2
1 . 2 0 1 477.80 t ’. 0 ? 6 1 3 1 7 ‘. 2 9 1'. 41 4 3 3 4 9 . 2 3
1 . 2 5 1 483.50 l'.0 5 4 1 4 6 7 ’. 29 1 *. 4 6 4 3361'. 8 5
1 . 3 0 1 487.00 I'.IPS 1 6 2 0 . 0 0 1 . 5 1 4 3 3 6 7 . 8 0
1 . 3 5 1 490.30 r.157 175g'.00 1 ’. 5 6 4 3 3 7 1 ’. 3 0
1 . 2 2 1 1 6 6 6 , 0 0
l ’. 28 2 1 9 6 6 . 3 0
l ’. 3 2 0 2 0 1 6 , 3 0
1 . 3 6 4 207«'.00
1 ’. 41 3 2 1 2 3 . 0 0
1 . 4 4 7 2 1 5 0 . 0 0
l ’. 4 7 S 2175'. 3 0
1 '..510 2 2 3 0 ‘. 0 0
l'. 5 5 6 2 2 2 5 ’. 0 0
l!.595 2 2 4 0 ’. 0 0
1 . 6 3 3 2 2 5 5 ’, 3 0
i',653 2 2 7 a'. 00
l'.702 2 2 8 5 . 0 0
l'. 7 5 8 23ff0'.0fl
1 8 2 5 2 3 1 5 ’. 0(3
l',9Pil 2 3 3 0 0 0
1 ’, 9 5 9 2 3 3 8 5 4
A-7
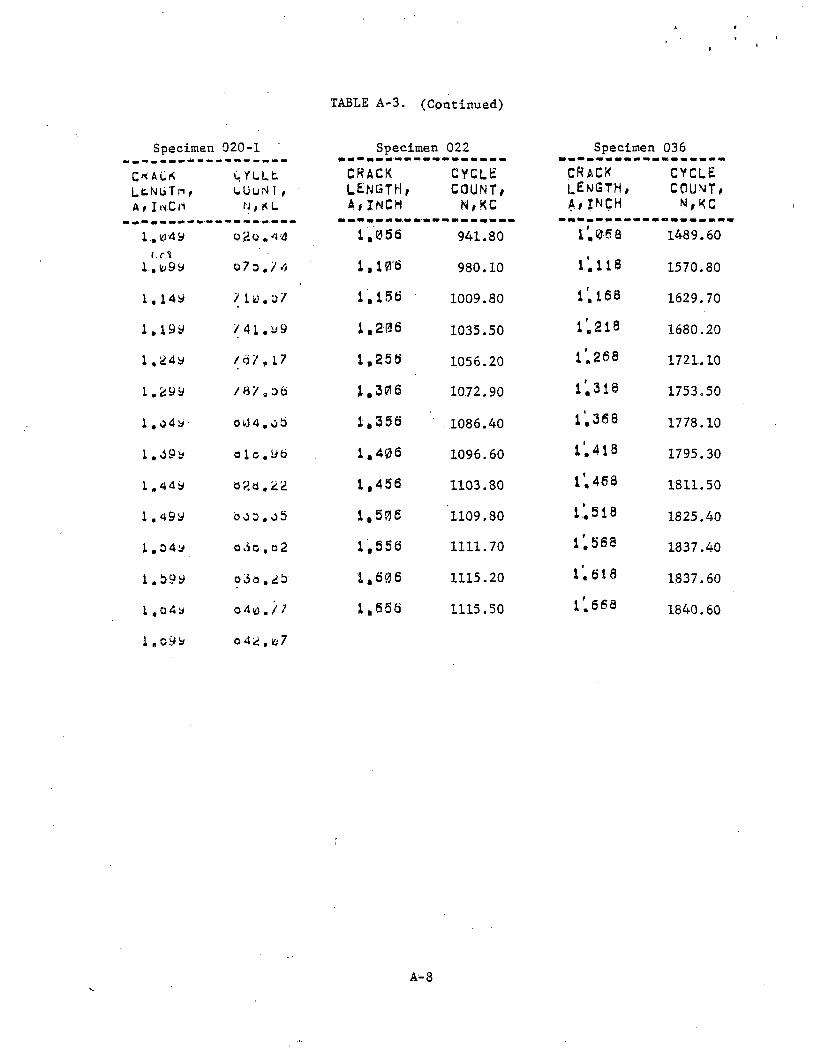
TABLE A-3. (Continued)
Specimen 920-1 Specimen 022 Specimen 036
C* A CK LfcNGTn t A f I IN C
erLLfc.L U U N 1 , ■ N, * L
C R A C K L & N G T H , A , I N C H
C Y C L E C O U N T , N , K C
C R A C Kl e n g t h ,A , I N C H
C Y C L E C O U N T , N , K C
1 ,to4y 0 2 4 . 4 '4 1 , 0 5 6 941.80 l > 6 8 1489.60[ , C \
i. t>9y e 7 a , 7 4 1 , 1 0 6 980.10 1 *. 1 is 1570.80
i . I 4 y / 1 Id . 0 7 1 , 1 5 6 1009.80 i ’, 1 6 8 1629.70
1 . 1 9 a 7 4 1 , 9 9 1 , 2 0 6 1035.50 1'.218 1680.20
1 . 2 4 * 7 6/ , 17 1 , 2 5 6 1056.20 i ’, 2 6 8 1721.10
1.299 7 8 7 , 0 6 1 , 3 0 6 1072.90 1 3 1 8 1753.50
1 , a 4 a o j 4. o a 1 , 3 5 6 1086.40 1 . 3 6 8 1778.10
1 . 4 9 * a 1 o .9 6 1 . 4 0 6 1096.60 1 4 1 8 1795.30
1 . 4 4 9 0 2 4 , 2 2 1 , 4 5 6 1103.80 1 , 4 6 8 1811.50
1 . 4 9 * b a a , 0 5 1 , 5 0 6 1109.80 t',518 1825.40
1 . 0 4 9 a d o , o2 1 , 5 5 6 1111.70 1 5 6 8 1837.40
1 . 5 9 9 o 3 a . 2 b 1 , 6 0 6 1115.20 1 6 1 8 1837.60
1 , o 4 y o 4 u . 7 7 1 , 6 5 6 1115.50 i'.668 1840.60
1 . o.9a o 42 , u7
A-8
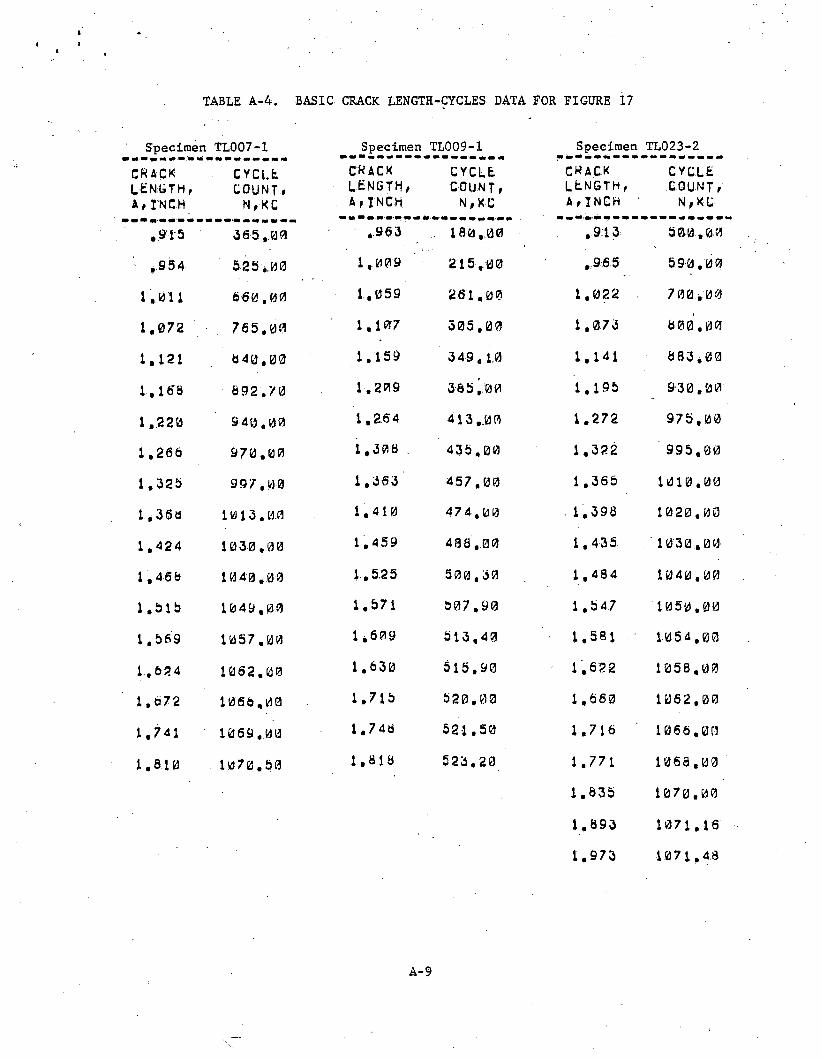
TABLE A-4. BASIC CRACK LENGTH-■CYCLES DATA FOR FIGURE 17
Specimen TL007-1 Specimen TL009-1 Specimen TL023-2CRACK LENGTH, A,INCH
CYC Lfc COUNT, N , KC
CK ACKl e n g t h ,A,INCH
CYCLE.COUNT,N,KC
CKACK LENGTH, A , INCH
c y c l eCOUNT , N,KC
,915 365.00 ,963 180. .00 .913 500.00
,954 525.00 1 ,009 215.00 ,965 590.00
1,011 660.00 1,059 261.00 1.022 700.00
1,072 765.00 1.107 305,00 1,073 600.00
1,121 840,00 1.159 349,1,0 1 . 141 883.00
1.168 692.70 1.209 385|00 1.195 930.00
1.220 940.00 1,264 413.00 1.272 975,00
1.266 970.00 1.306 . 435,00 1.322 995.00
1.325 997.00 1.363 457.00 1.365 1010.00
1,368 1013.0.0 1.410 474,00 .1.398 1020.00
1.424 1030,00 1.459 488,00 1.435 1030,00
1.46b 1040.00 1.525 500.30 1.484 1040,00
1.515 1049,00 1.571 507.90 1.547 1050,00
1,569 1057.00 1.609 513,40 1.581 1054,00
1.624 1062.00 1,630 515.90 1.622 1058,00
1,672 1066,00 1.715 520.00 1.660 1062.001.741 1069.00 1.748 521.50 1.716 1066.00
1,810 1070.50 1.618 523,20 1.771 1068,001.635 1070.00
1.893 1071,161.973 1071,48
A-9
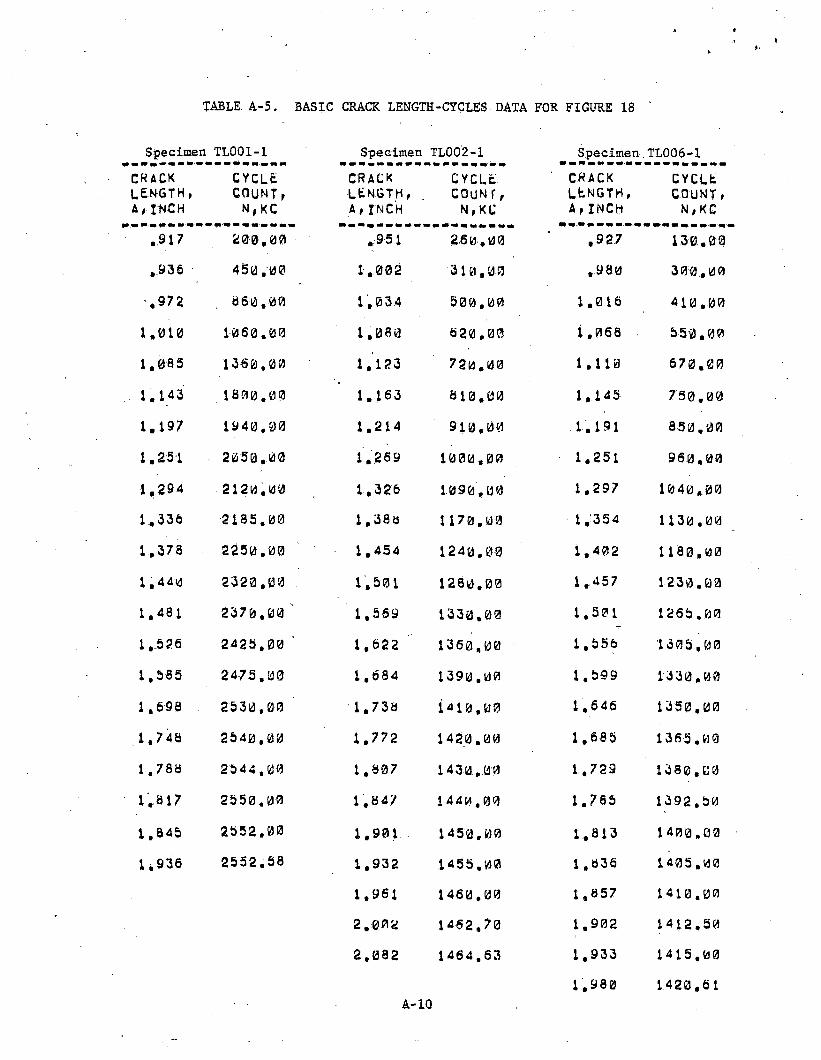
TABLE A-5. BASIC CRACK LENGTH-CYCLES ■ DATA FOR FIGURE 18
Specimen TL001-1 Specimen TL002-1 Specimen TL006-1CRACKl e n g t h ,A, INCH
CYCLECOUNT,N,KC
CRACKl e n g t h ,A,INCH
CYCLE C O U N T , N , K C
CRACKl e n g t h ,A,INCH
CYCLECOUNT,N,KC
.917 200,00 .951 260.00 .927 130.00
.936 450,00 1.002 310,00 ,980 300.00
.972 860,00 1.034 500.00 1.016 410,00
1.010 1060,00 1.080 620,00 1.068 550.00
1.085 1360,00 1.123 720.00 1.110 670.00
1.143 1800,00 1.163 810.00 1,145 750.00
1.197 1940,00 1.214 910,00 .1.191 850.00
1.251 • 2050,00 1.269 1000,00 1.251 960,00
1,294 2120.00 1,326 1090,00 1,297 1040,00
1.336 2185.00 1.388 1170,00 1.354 1130.00
1.378 2250.00 1,454 1240,00 1.402 1180,00
1,440 2320.00 1.501 1280,00 1.457 1230.00
1.481 2370,00 ' 1.569 1330,00 1.501 1265,00
1..586 2425.00 ' 1.622 1360,00 1.556 1505,00
1.585 2475.00 1,684 1390.00 1.599 1330,00
1,698 2530,00 1,738 1410,00 1.646 1350,00
1.748 2540,00 1.772 1420.00 1.685 1365,00
1.788 2544,00 1.807 1430,00 1,729 1380,00
1.817 2550,00 1.847 1440,00 1.785 1392.50
1.845 2552.00 1.901 . 1450,00 1.813 1400,00
1.936 2552.58 1.932 1455,00 1.836 1405.00
1.961 1460,00 1.857 1410.00
2.002 1462,70 1.902 1412.50
2.082 1464.63 1.933 1415,00
1.980 1420.61
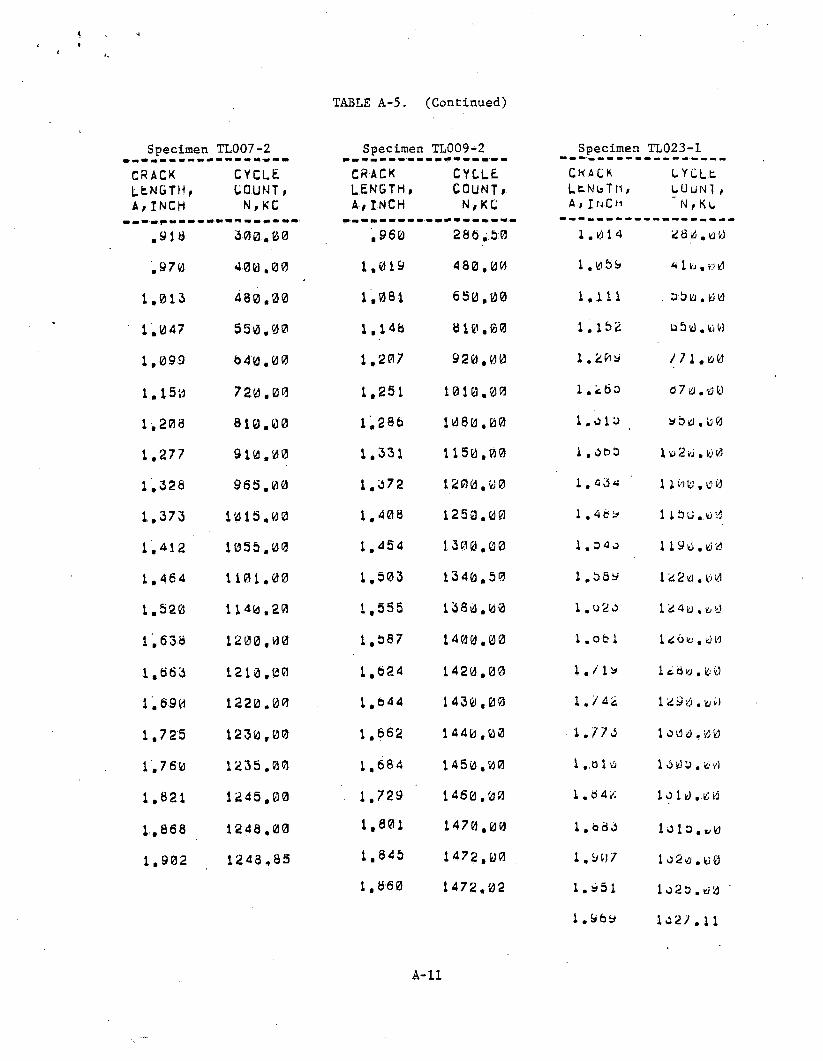
TABLE A-5. (Continued)
S p e c i m e n T L 0 0 7 - 2 S p e c i m e n T L 0 0 9 - 2 S p e c i m e n T L 0 2 3 - 1
C R A C K
L E N G T H ,
A , I N C H
C Y C L E
C O U N T ,
N , K C
C R A C K
L E N G T H ,
A , I N C H
C Y C L E
C O U N T , .
N , K C
C K A C K
L t N U T H ,
A , I u C m
C Y C L E
L U U N T ,
' N , K t
. 9 1 8 3 0 0 . 0 0 . 9 6 0 2 8 6 . 5 0 1 . 0 1 4 2 8 0 , 0 U
. 9 7 0 4 0 0 , 0 0 1 . 0 1 9 4 8 0 , 0 0 1 . 0 5 9 4 1 0 . V ) 0
1 , 0 1 3 4 8 0 , 0 0 1 . 0 8 1 6 5 0 , 0 0 1 . 1 1 1 . 0 5 0 . 0 0
1 . 0 4 7 5 5 0 . 0 0 1 , 1 4 8 8 1 0 . 0 0 1 . 1 5 2 0 5 0 . 0 0
1 , 0 9 9 6 4 0 , 0 0 1 . 2 0 7 9 2 0 . 0 0 1 , 2 0 9 7 7 1 . 0 0
1 , 1 5 m 7 2 0 . 0 0 1 . 2 5 1 1 0 1 0 . 0 0 1 . 2 6 0 3 7 0 . 0 0
1 . 2 0 3 8 1 0 . 0 0 1 . 2 8 6 1 0 8 0 . 0 0 1 . 0 1 0 y b 0 , 0 0
1 . 2 7 7 9 1 0 . 0 0 1 . 3 3 1 1 1 5 0 . 0 0 1 . 3 6 5 1 0 2 0 . 0 0
1 . 3 2 8 9 6 5 . 0 0 1 . 3 7 2 1 2 0 0 , 0 0 1 . 1 1 0 0 , 0 0
1 . 3 7 3 1 0 1 5 . 0 0 1 , 4 0 8 1 2 5 0 . 0 0 1 . 4 6 * 1 1 5 0 . 0 0
1 . 4 1 2 1 0 5 5 , 0 0 1 . 4 5 4 1 3 0 0 . 0 0 1 , 5 <3 0 1 1 9 3 . 0 0
1 . 4 6 4 1 1 0 1 . 0 0 1 . 5 0 3 1 3 4 0 , 5 0 1 , 3 8 9 1 2 2 0 . 0 M
1 . 5 2 0 1 1 4 0 , 2 0 1 , 5 5 5 1 3 8 0 . 0 0 1 . o 2 0 1 2 4 0 , 0 0
1 , 6 3 3 1 2 0 0 , 0 0 1 . 5 8 7 1 4 0 0 , 0 0 1 . o b 1 1 2 0 0 , 0 0
1 . 6 6 3 1 2 1 0 , 0 0 1 . 6 2 4 1 4 2 0 , 0 0 1 . / 1 9 1 2 3 0 . 0 0
1 . 6 9 0 1 2 2 0 , 0 0 1 . 6 4 4 1 4 3 0 , 0 0 1 . / 4 2 1 2 9 0 , 0 0
1 , 7 2 5 1 2 3 0 , 0 0 1 . 6 6 2 1 4 4 0 , 0 0 ■ 1 . 7 7 3 1 0 0 0 , 0 0
1 . 7 6 0 1 2 3 5 , 0 0 1 . 6 8 4 1 4 5 0 , 0 0 1 # , 0 1 ’w 1 3 0 0 , 0 0
1 . 8 2 1 1 2 4 5 . 0 0 1 . 7 2 9 1 4 6 0 , 0 0 1 . 6 4 0 1 3 1 0 , 0 0
1 . 8 6 8 1 2 4 8 . 0 0 1 . 8 0 1 1 4 7 0 , 0 0 1 . 3 8 3 1 3 1 0 . t i 0
1 , 9 0 2 1 2 4 8 , 8 5 1 . 8 4 5 1 4 7 2 , 0 0 1 . 9 0 7 1 0 2 0 , 0 0
1 , 8 6 0 1 4 7 2 . 0 2 1 . * 5 1 1 o 2 5 . 0 a
1 , 9 b y 1 3 2 7 . 1 1
A-11

TABLE A-6. BASIC CRACK LENGTH -CYCLES DATA FOR FIGURE 19
Specimen SL016 Specimen SL022 Specimen SL029CRACK LENGTH, A, INCH
CYCLE COUNT, N , KG
CRACK L E N G T H , A,INCH
CYCLE C O U N T , N , KC
CRACKl e n g t h ,A,INCH
c y c l eCOUNT, N , KC
,76b 180.00 .760 180.00 .775 201,00,627 245.00 .795 233.00 .830 270.00,888 300,00 ,8 42 275.00 .876 320,00,929 335.00 .894 330,00 ,924 361.00,974 360,00 .966 380,00 1.017 • 415,001,036 390,00 1.002 400.00 1.075 440,001,078 401.00 ' 1.052 421.00 1.167 460,001.107 410,00 1.092 435.00 1.194 465,001,145 420.00 1.162 450,00 1.215 468,001.191 430.00 1.196 455,00 1,238 471,001.221 435,00 1.229 460,03 1.272 474,001.274 440,00 1.275 465,00 1.316 477,001.30 2 442,00 1.310 467.50 1.349 ' 479,001.330 444,00 1,344 470,00 1.374 480,001.386 ' 446.00 1.395 472,00 1,400 ' 481,001.449 446.58 1.43d 473,53 1.438 482,00
1.493 474,50 1.525 482.671.501 474.56
A-12
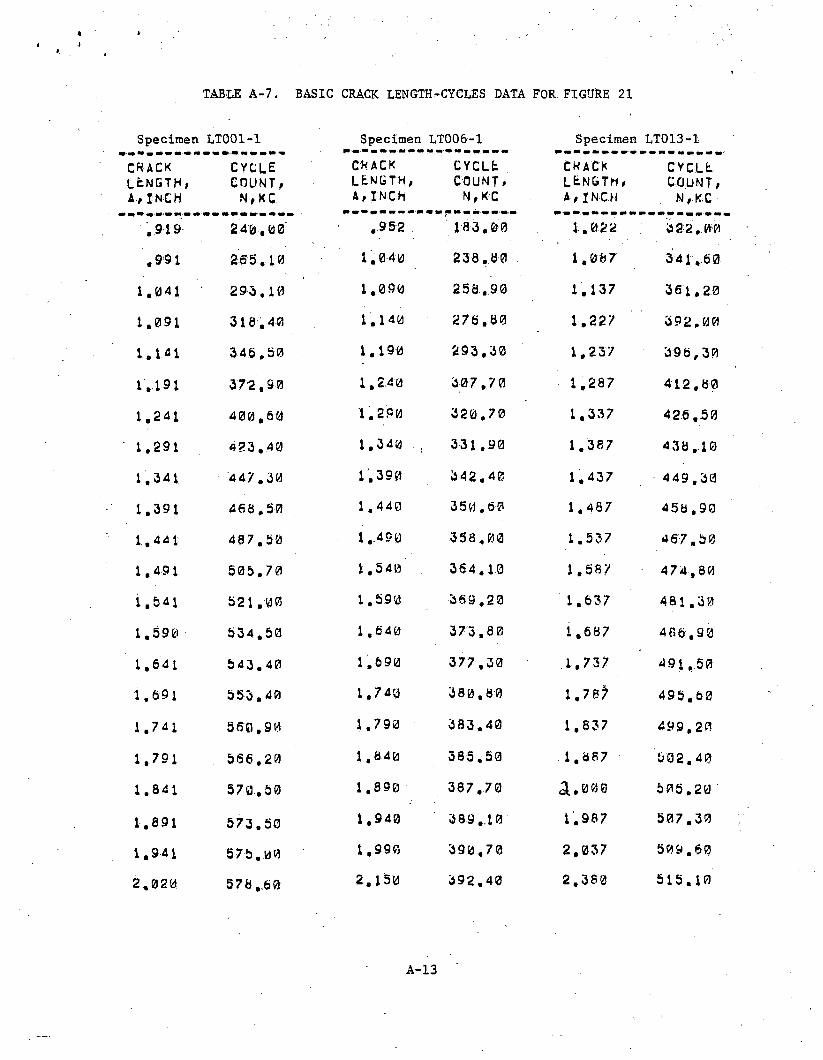
*
TABLE A-7. BASIC CRACK LENGTH'-CYCLES DATA FOR FIGURE 21
Specimen LT001-1 Specimen LT006-1 Specimen LT013-1CRACK LENGTH, A . , INCH
c y c l e
COUNT, N , K C
CHACK LENGTH, A , INCH
CYCLE COUNT# N , K C
CKACKl e n g t h ,
A ,INCHCYCLE COUNT# N ,K C
.919 240,00 .952 183.00 1.022 322,00
.991 255.10 1.0 40 238.50 1.087 341.60
1.041 295.10 1.090 255,90 1.137 361,20
1,091 318.40 1.140 276.80 1.227 392,00
1.141 346.50 1.190 293,30 1,237 396,30
1.191 372.90 1,240 307,70 1,287 412.80
1.241 400,60 1.290 320.70 1,337 426,50
1.291 423.40 1.340 ( 331,90 1.387 438.10
1.341 447.30 1.390 342.40. 1.437 449,301.391 468,50 1.440 350,60 1.487 458,90
1,441 487,50 1.490 358.00 1.537 467.501.491 505.70 1.540 , 364.10 1.587 474.801.541 521.00 1.590 369.20 1.637 481.30
1.590 534,50 1.640 373,80 1.687 486,90
1.641 543,40 1.690 377,30 1.737 491,501.691 553,40 1,740 380,80 1,78^ 495.601.741 550,90 1,790 383.40 1,837 499,20
1.791 566,20 1.840 385.50 1.887 502.40
1 . 8 4 1 570.50 1.990 387.70 £ . 0 0 0 505.20
1.891 573.50 1.940 389.10 1.987 507.30
1 . 9 4 1 575,00 1.990 390,70 2.037 509.60
2 , 0 2 0 578,50 2.150 392,40 2.380 515.10
A-13
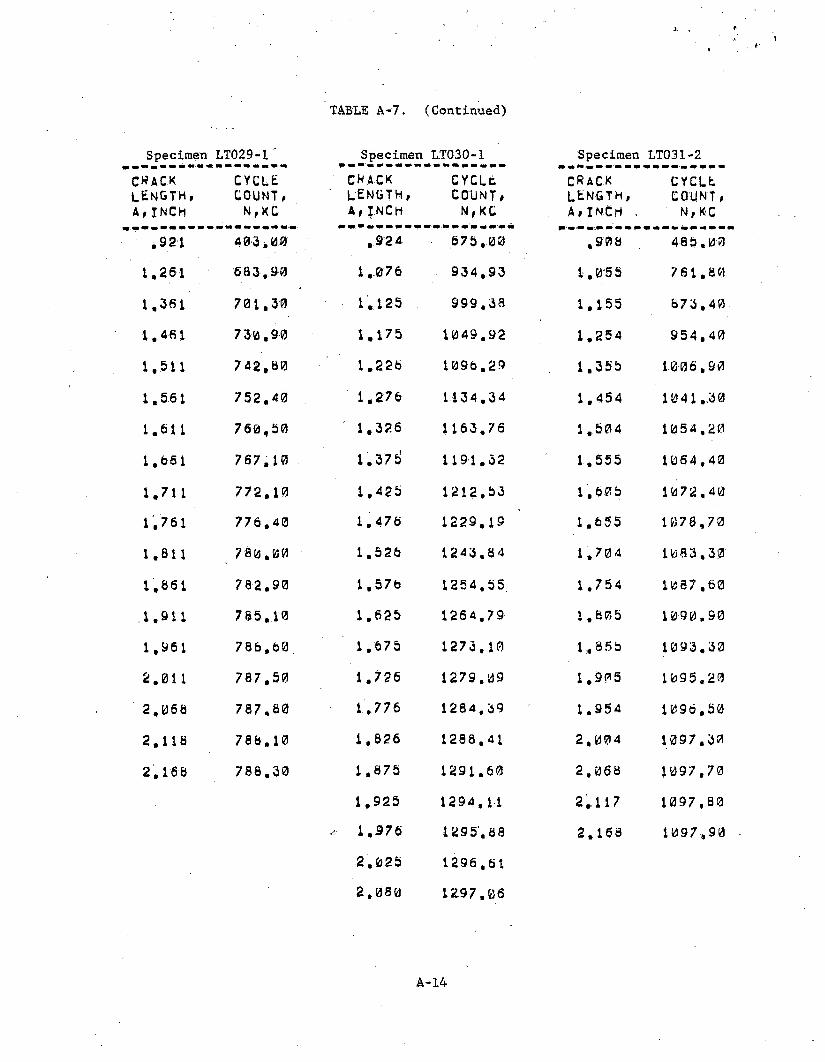
TABLE A-7. (Continued)
Specimen LT029-1 ' Specimen L.T030-1 Specimen LT031-2
CRACKl e n g t h ,A,INCH
CYCLE COUNT, N , KC
CRACKl e n g t h ,A, INCH
CYCLECOUNT,N,KC
CRACKl e n g t h , A,INCH ,
CYCLt COUNT, N , K C
. 9 2 1 4 0 3 . 0 0 . 9 2 4 6 7 5 . 0 0 . 9 0 8 4 8 5 . 0 3
1 . 2 6 1 6 8 3 . 9 0 1 . 0 7 6 9 3 4 . 9 3 1.0-55 7 6 1 , 8 0
1 . 3 6 1 7 0 1 , 3 0 1 . 1 2 5 9 9 9 , 3 8 1 . 1 5 5 8 7 3 . 4 0
1 . 4 6 1 7 3 0 . 9 0 1 . 1 7 5 1 0 4 9 . 9 2 1 . 2 5 4 9 5 4 . 4 0
1 . 5 1 1 7 4 2 , 8 0 1 . 2 2 6 1 0 9 6 . 2 9 1 . 3 5 5 1 0 0 6 . 9 0
1 . 5 6 1 7 5 2 . 4 0 1 . 2 7 6 1 1 3 4 , 3 4 1 . 4 5 4 1 0 4 1 .,30
1 . 6 1 1 7 6 0 , 5 0 1 . 3 2 6 1 1 6 3 , 7 6 1 . 5 0 4 1 0 5 4 , 2 0
1 . 6 6 1 7 6 7 . 1 0 1. 3 7 d 1 1 9 1 . 3 2 1 . 5 5 5 1 0 6 4 , 4 0
1 , 7 1 1 7 7 2 . 1 0 1 . 4 2 5 1 2 1 2 , 5 3 1 . 6 0 b 1 0 7 2 . 4 0
1 . 7 6 1 7 7 6 , 4 0 1 . 4 7 6 1 2 2 9 , 1 9 1 . 6 5 5 1 0 7 8 . 7 0
1 . 8 1 1 7 8 0 . 0 0 1 , 5 2 6 1 2 4 3 . 8 4 1 . 7 0 4 1 0 8 3 . 3 0
1 , 8 6 1 7 8 2 . 9 0 1 , 5 7 6 1 2 5 4 . 5 5 , 1 . 7 5 4 1 0 8 7 , 6 0
. 1 . 9 1 1 7 8 5 . 1 0 1 . 6 2 5 1 2 6 4 . 7 9 1 . 8 0 5 1 0 9 0 , 9 0
1 . 9 6 1 7 8 6 , 8 0 1 . 6 7 5 1 2 7 3 . 1 0 1 . 8 5 5 1 0 9 3 . 3 0
2.011 7 8 7 . 5 0 1 . 7 2 6 1 2 7 9 . 0 9 1 . 9 0 5 1 0 9 5 . 2 0
2 . 0 6 b 7 8 7 , 8 0 1 . 7 7 6 1 2 8 4 , 3 9 1 . 9 5 4 1 0 9 6 . 5 0
2 . 1 1 8 7 8 8 . 1 0 1 . 8 2 6 1 2 3 8 . 4 1 2 , 0 0 4 1 0 9 7 . 3 0
2 , 1 6 8 7 8 8 . 3 0 1 . 8 7 5 1 2 9 1 . 6 0 2 . 0 6 8 1 0 9 7 , 7 0
1 . 9 2 5 1 2 9 4 . M 2 . 1 1 7 1 0 9 7 , 8 0
1 . 9 7 6 1 2 9 5 . 8 8 2 . 1 6 8 1 0 9 7 , 9 0
2 . 0 2 5 1 2 9 6 , 6 1
2 , 0 8 0 1 2 9 7 . 0 6
A-14
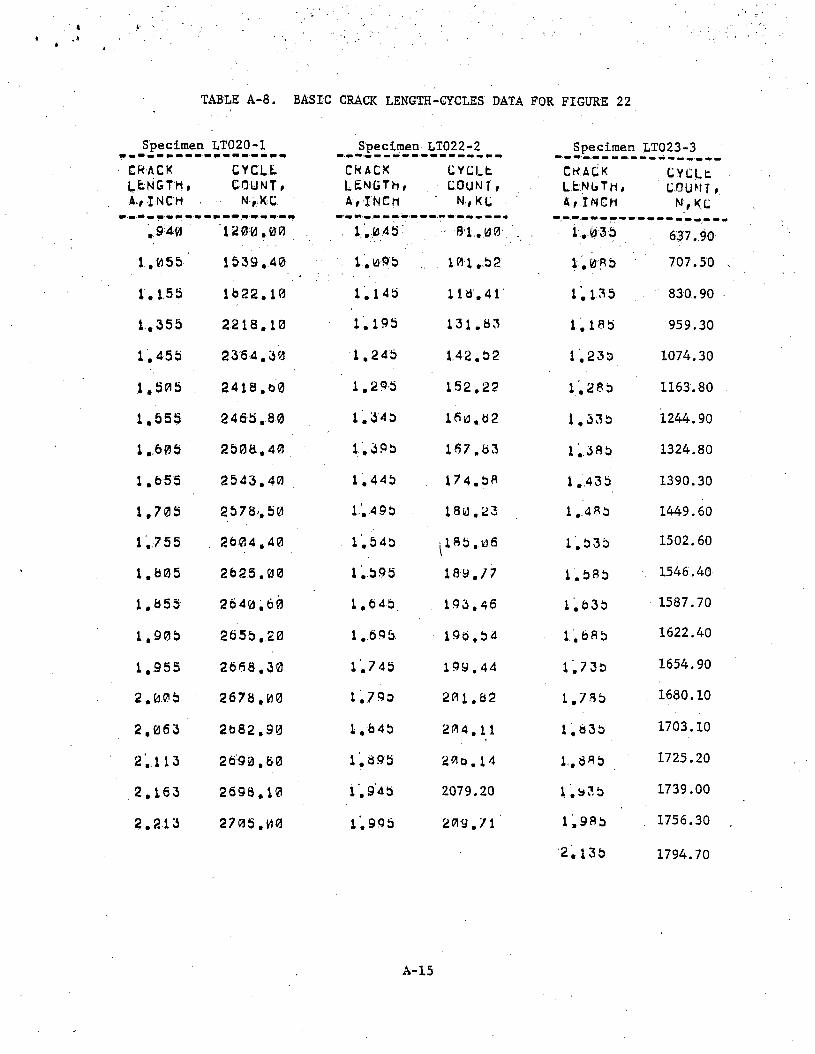
TABLE A-8. BASIC CRACK LENGTH--CYCLES DATA FOR FIGURE 22
Specimen LT020-1 Specimen LT022-2 Specimen LT023-3CRACK LENGTH, A,INCH
CYCLE- COUNT , N,KC
CRACKl e n g t h ,A,INCH
CYCLE COUNT, N , K C
CRACKl e n g t h ,ArlNCH
CYCLt COUNT, N , K C
.940 1200.00 1.045 81.00 1.335 637.901.05b 1539.40 1.095 101.52 1.085 707.50 .1.155 1622.10 1 . 1 4 5 116.41 1.135 830.901.355 2218.10 1.195 131.63 1.185 959.301.455 2364.30 1.2 45 1.42.52 1.235 1074.301,505 . 2418.00 1.295 152.22 1.285 1163.801.555 2465,80 1.345 160.62 19 <5 3 Id 1244.901.605 2508,40 1.39 5 167.63 1.38 5 1324.801.655 2543.40 1.445 174.5R 1.435 1390.301.705 2578',50 1'. 4 9 5 183.23 1.485 1449.601,755 . 2604,40 1.545 ^185.06 1.535 1502.60
1.605 2625.00 1.595 189.77 1.585 . 1546.40
1.655 2640.60 1.645 193.46 1.635 1587.70
1.905 2655.20 1.69 5 190.54 1.68 5 1622.40
1,955 2668.30 1.7 45 199.44 1.7 35 1654.90
2.0.0 5 2678.00 1.795 201.62 1.785 1680.10
2.063 2682.90 1.645 204.11 1,635 1703.10
2.113 2693.60 1.695 200.14 1.. 885 1725.20
2.163 2698.10 1.94 5 2079.20 1.9 3 5 1739.00
2.213 2705.30 1.995 209.71 1.98 5 1756.30
2.135 1794.70
A-15
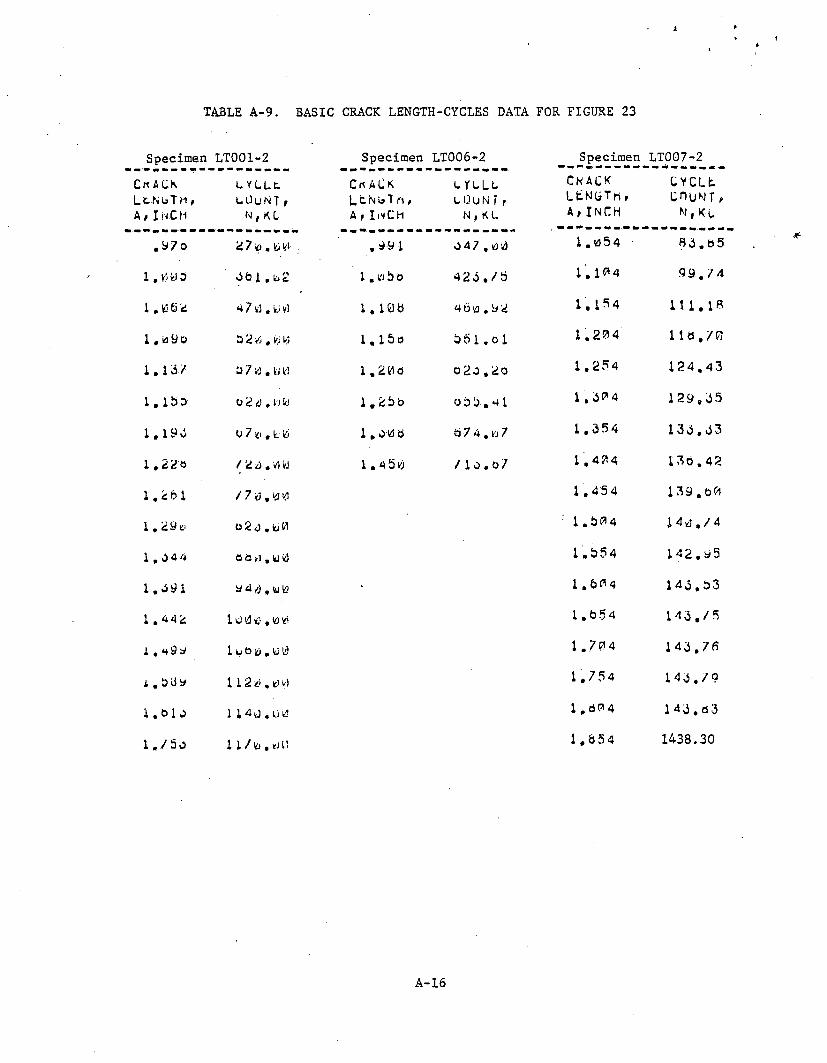
i
TABLE A - 9 . BASIC CRACK LENGTH-CYCLES DATA FOR FIGURE 23
Specimen LT001-2 Specimen LT006-2 Specimen LT007-2
CuALK Lt.NuTM, A t IN C H
L Y LLtU 0 u N T r N , K L
C* ACK L t N G 7 ri t A f IivCH
LYL L L t l.i U N I f N, KL
CN ACK LtNGTn, A t INCH
C Y C L t C O UNT t N,Ku
, 9 7 o 2 7 a . u v> .991 0 4 J , 0 0 1.05 4 B 3 . b 5
1 , ViW 3 Obi.bS l . w 5 o 4 2 0 . /b 1 . 104 9 9 . 7 4
1 .V2S2 4 7 0 . B Vi 1 . 1.0 b 4 6 a . 9 2 1.154 111.18
1 , b 9 o 3 2 vi, vj vi 1.15a 561 .ol 1.204' 116.70
1.1 37 3 7 b . t; t! 1.20d o 2 a . 2 b 1.254 124.43
1,15b 0 2 ti , l'j IrJ 1.25b obb.ol 1.304 129,05
1. 190 0 7 , t. Vi 1. o vs b 6 7 4 . a 7 1.354 130.03
1.2 Ha f 2 ti . /) id 1 . 45vj / 1 o .o7 1.404 136.42
1.261 /7id,BV) 1.454 139.00
1.29* a 2 <3, ti Vi : 1.504 14*}./4
1,04*4 ob»i. uO 1.554 142.95
1.091 y o /j, u vj > 1.604 140.53
1.442 1 U 0 £' . V) /' 1.654 140.75
1 , **99 1 Vbki. UV) 1.704 140,75
i . bay 1 1 2 # . v) 1.754 140,70
1.01 J 1 1 4 0 . UB 1.604 140.63
l./5o 1 1 / id . tl 11 1.654 1438.30
A-16
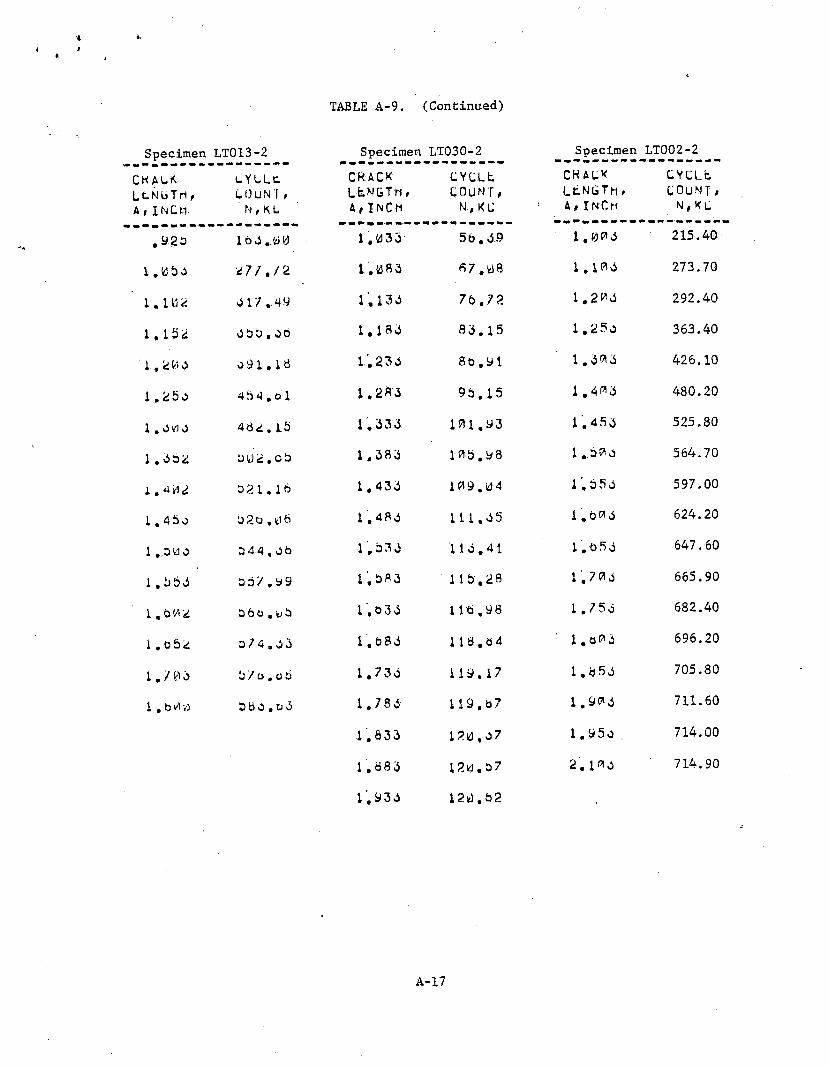
TABLE A-9. (Continued)
Specimen LT013-2 Specimen LT030-2 Specimen LT002-2
CK AUK L t. N G T h , A , INCH
cYLLc.C 0 u N 7 , N f K L
CRACKl e n g t h ,A,INCH
CYCLt COUNT, N, KC
CRACKL e n g t h , A, INCH-
CYCLfc. COUNT » N, KC
.920 160 „ (u 0 1.036 5b. 0.9 1.000 215.40
1.050 27/. 72 1 . 0 8 6 87.08 1.100 273.70
1.102 0 17.49 1.130 7 b . 72 1.200 292.40
1.152 06 6 . 0 6 1.180 80.15 1.250 363.40
1,2 W 0 091,16 1.230 8 b . 91 1.000 426.10
1 ,25b 4 6 4 . o 1 1.28 6 95,1 5 1.400 480.20
1.0 W 0 462.15 1.630 101.93 1.450 525.80
1 .052 0U2.O5 1.386 105.98 1.500 564.70
J... 402 62 1 . 1 6 1,430 109.04 1 ‘, 5 5 0 597.00
L . 45o 6 2 o , 0 6 1.480 111,05' 1,600 624.20
1 . , 5 0 0 6 4-4,0 6 1.530 110.41 1,650 647.60
1 .060 65 7 , 9 9 1.583 115.28 1.700 665.90
1 , O 2 O6o , t>5 1,630. 1.16,98 1.750 682.40
1.062 6/ 4 . 0 0 1.680 118.64 1.803 696.20
1.700 5 7 o . o 6 1.730 119.17 1.850 705.80
1 » b 0 v) atio .oO 1.780 119,87 1.900 711.60
1.833 120,07 1.950 714.00
1.883 120,57 2 .1O0 714.90
1.930 12 k) ,.6 2
A-17
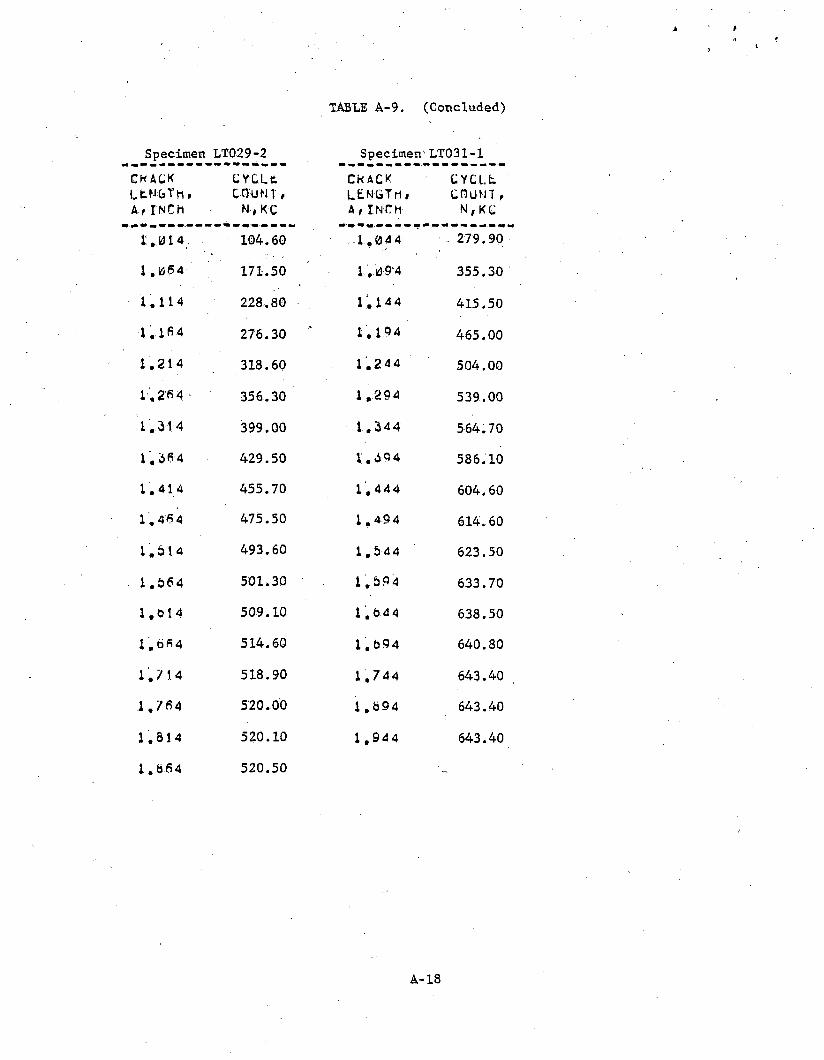
TABLE A-9. (Concluded)
Specimen LT029-2 Specimen'LT031-1
CKACK LtNLTh. A,INCh
CYCLt COUNT, N,,KC
CKACK LENCThi A,INCh
CYCL.t COUNT, N,KC
1.014 104.60 1.04 4 279.901.064 171.50 1.094 355.301.114 228.80 1.144 415.501.164 276.30 1.194 465.001.214 318.60 1.244 504.001.264 356.30 1.294 539.001.314 399.00 1.344 564.701.36 4 429.50 1.394 586.101.414 455.70 1.444 604.601.46 4 475.50 1.49 4 614.601.514 493.60 1.5 44 623.501.364 501.30 1.594 633.701.014 509.10 1.3 44 638.501.064 514.60 1.394 640.801.714 518.90 1.744 643.401.764 520.00 1.894 643.401.814 520.10 1,944 643.401.064 520.50
A-18
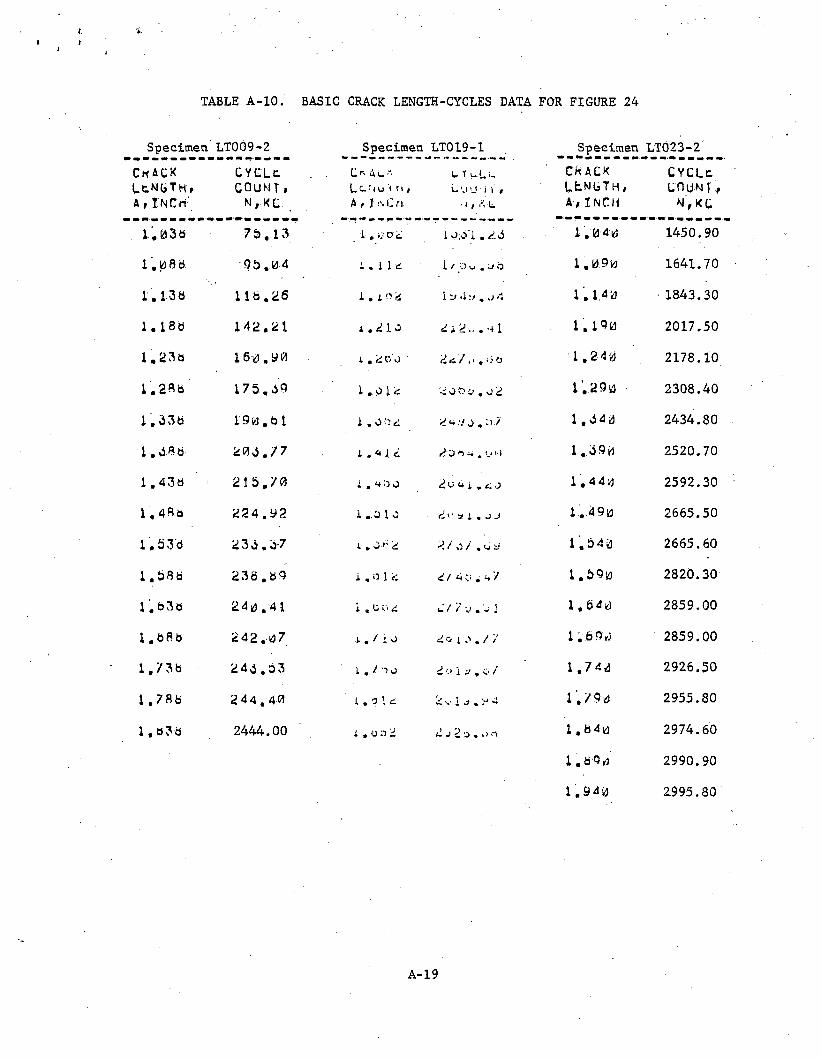
TABLE A -10. BASIC CRACK LENGTH-CYCLES D A T A FOR FIGURE 24
Specimen LT009-2 Specimen LT019-1 Specimen LT023-2
CkACKLe.ngth»A / iNCriCYCLE. COUNT, N,KC
C r' 4 L t- Lr-:iu'i fi » A , 1Cnl r u. i.L '.i u i i' ,
* ! r' uCKACK LtNbTH, A, INCH
CYCLE. CDUN T,n,kc
. 1 . 0 3 0 75.13 i . v o 2 i JO i . 2.5 1,13 4 a 1450.901 .088. 93. a 4 1 . i 1 4 i / Ou . :/ 0 1.090 1641.701.13a 110.26 1 . 1 0 2 1 y 4 . y 4. 1 . 1,40 1843.301.180 142.21 1.210 2 i 2... •■* 1 1.19a 2017.501.23a 16 2?. y « i « ti ‘0 0 2 «/<<.< i o 1.240 2178.101.28b 175,39 i..3l2 2 o t? o . o 2 l'..29a 2308.401.330 19a.bl 1 . a «<; 2*.73,:j-7 l.54a 2434.801.380 205.77 i . '* 1. 2 243 . Uli i..39a 2520.701.43d 215.70 i. *♦ o o 2 !J 4 i c. o 1.44a 2592.301.48b 224.92 i . 0 1 0 ■ 2>' » i . j J 1.49a 2665.501.530 23 5.37 l . Jf:2 2 /' o / . u y 1.540 2665.601.58 0 238.09 l.nl2 2/4 o . «* 7 1.59a 2820.301 . a 3 0 240.41 1.002 2/7 y . j 1 1.64a 2859.001.080 242.07 1 . 7 i o 2 o i o . / 7 1,69a 2859.00l,7 3 a 243.53 l.V’io 2 •> l.-,o / 1,74a 2926.501.78b 244.40 1.0 1 £ 2 v i j , / 4 l./9a 2955.801,030 2444.00 2 j 2 o ..»« 1.04a 2974.60
1,09a 2990.901.940 2995.80
A-19
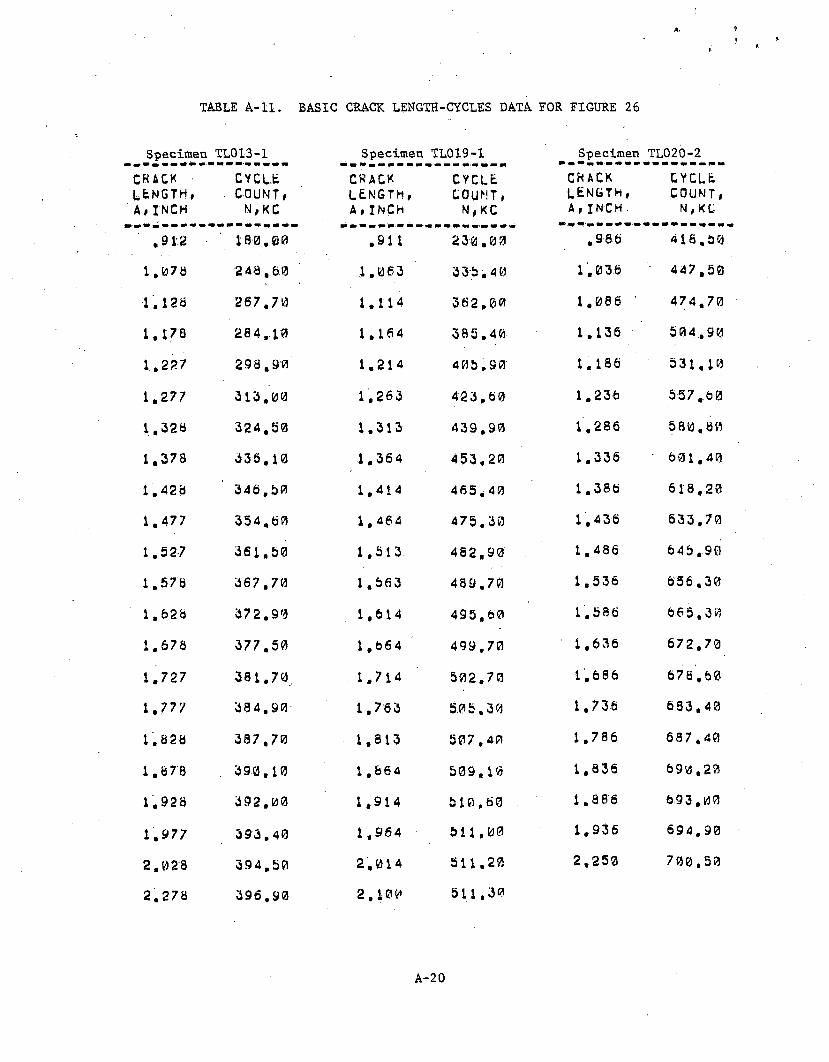
TABLE A-11. BASIC CRACK LENGTH--CYCLES DATA FOR FIGURE 26
Specimen TL013-1 Specimen TL019-1 Specimen TL020-2
CRACK LENGTH, A, INCH
CYCLE . COUNT,
N,KC
CRACKl e n g t h ,A ,INCH
CYCLECOUNT,N,KC
CRACK LENGTH, A , INCH
CYCLE COUNT, N , K C
. 912 180.00 .911 230.00 . 986 416,50
1 ,(97 8 24 8, 60 1.063 335.40 1.036 447.50
l.isa 267,70 1.114 362.00 1.086 ‘ 474,70
1.178 284,10 1.164 385.40 1.136 504,90
1.227 298,90 1.214 405,90 1.186 ' 531,10
1.277 313,00 1.263 423,60 1.236 557,60
1,32b 324,50 1.313 439.90 1.286 580,80
1.378 336,10 1.364 453.20 1.336 601,40
1,42b 346,50 1.414 465,40 1.386 618,20
1.477 354.60 1.464 475.30 1.436 633,70
1,527 361,50 1.513 482,90 1,486 645,90
1.57b 367,70 1,563 489.70 1,536 656,30
1.628 372.90 1.614 495,60 1.586 665,30
1.678 377.50 1,664 499.70 1,636 672.70
1.727 ■381.70, 1.714 502.70 1.686 678,60
1.777 384.90 1.763 5.05,30 1.736 683.40
1.828 387,70 1.813 5P7.40 1.786 687,40
1.878 390,10 l , 86d 509,10 1.836 690,20
1.928 392.00 1.914 510,60 1.886 593,00
1.977 393,40 1.964 511,00 1.936 694.90
2.028 394.50 2,014 511.20 2,250 700.50
2.278 396,90 2.100 511,30
A-20

*
TABLE A-12. BASIC CRACK LENGTH-CYCLES DATA FOR FIGURE 27
Specimen TL002-2 Specimen TL022-1 Specimen TL024-1
C.KACK LENGTH, A,INCH
CY CL E COUNT# N , KC
CHACK l e n g t h , A,INCH
CYCLE COUNT, N , K C
CKACKl e n g t h ,A,INCH .
CYG.Lt COUNT, N , K C
'.931 28 0 . 0 0 , .929 480.00 .910 30 0, 00
1.054 67 9. 40 1.059 8.6-9.80 1.0 41. . 908.20
1,1.54 94 2 . 3 0 1.109 1003.10 1,09-1 1065.00
1,254 1147.70 1.159 1125.60 1.191 1341.40
1,354. 1317,00 . 1.209 1232.30 1.291 1546,10
1,454' 1445.20 1.259 1324.50 1.391 1686,10
1.504 1496.10 1.309 1413,60 1.441 1755.10
1.554 1540.90 1,359 1486.70 1.491 1805.40
1.504 1579,90 . 1.409 1550,00 1.541 18 52.80
1.654 1614.00 1.459 1608,60 1.591 1892,40
1,704 1644,20 1.509 1655,70 1.641 1925.90
1.754 1669,10 1.559 1696,50 1.691 1951.90
1,8-04 1690.70 1 .,609 1734.70 1.741 1976.00
1.854 1709,10 1.659 1767,60 1.791 1996.20
1.904 1724.40 1,709 1795.73 1.841 2017 .8 0
1.954 1737.00 1.759 1618,70 1.691 2031 .3 0
2.004 1747.30 1.809 183 7.30 1.941 2040 ,0 0
2.061 17 57.20 1.859 1653.10 1.991 2048 .1 0
2.111 1762.90 ' 1.909 1868.40 2 . 0 5 0 2050 .7 0
2.161 1767.10 1.959 1873.80 2.060 2.050.90
2.211 1766 ,B0 2.009 1680.50
2.250 1768.90 2.066 1884.80
2.116 1887.50
2.166 1889.30
A-21
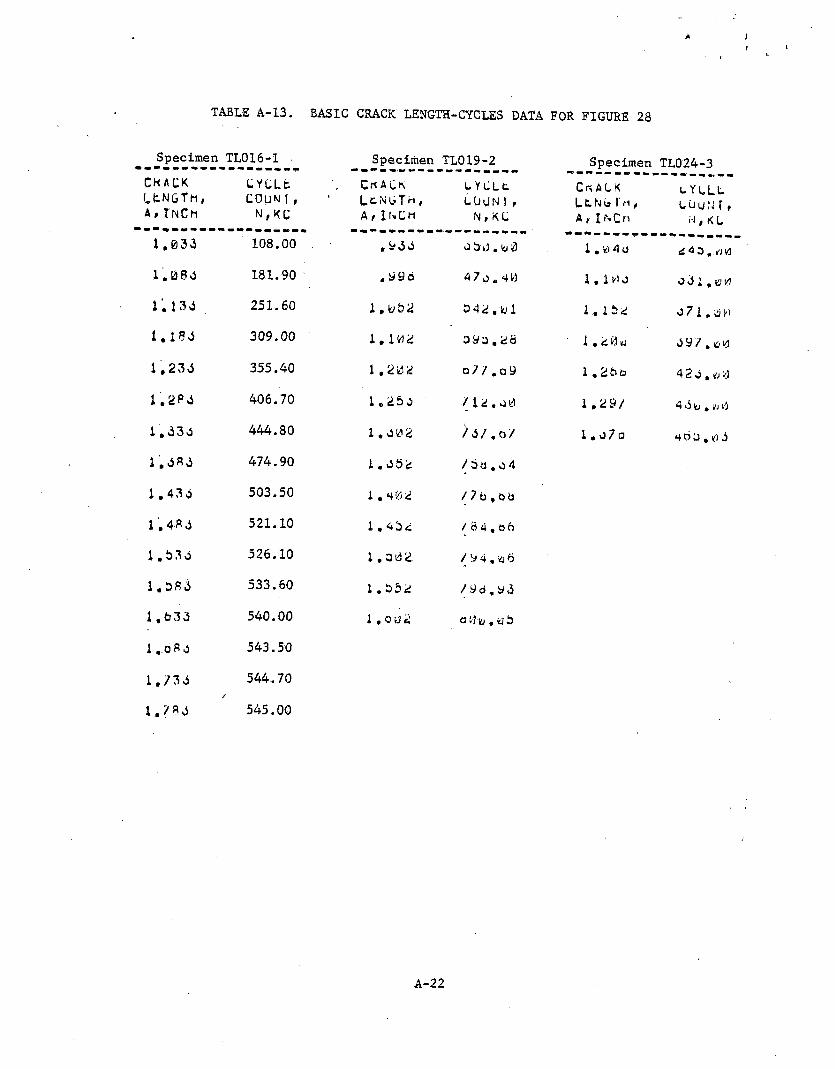
* J?
TABLE A-13. BASIC CRACK LENGTH-CYCLES DATA FOR FIGURE 28
Specimen TL016-I Specimen TL019-2 Specimen TL024-3CK A CK LfcNGTh, A,In Cm
LYCLfc. COLIN f, N,KC
Ck ACK L c. In G T H ,A , 1N C M
C YCLt LUUN'I, N, KC
Ch a l k L L N G 1 ri t Af Ir,Cn
c y l l lLUUN r, * # K L
1.033 108.00 .935 030.00 1. a 4 o 2 4 0 . a a1.085 181.90 .998 4 7 0,4 W 1 . 1 U 0 o 5 1 , a 01.133 251.60 1,052 342.01 1.152 071.001.183 309.00 1.102 390.26 1.20a 597.001.233 355.40 1.202 □ 77.09 1.258 425,001.283 406.70 1.25o 712.00 1.29/ 4 5a. a 31.333 444.80 1.002 757,0/ 1. o7o 403.051.383 474.90 1.352 / 5 a . o 41.433 503.50 1 . 4 '6 2 /7 6,081.483 521.10 1.452 /8 4.ah1,333 526.10 1.33 2 794,201.383 533.60 1.352 798,y31.633 540.00 1. o a 2 ai fio. a 31 . 0 8 3 543.50
1.733 544.70
1.783 545.00
A-22
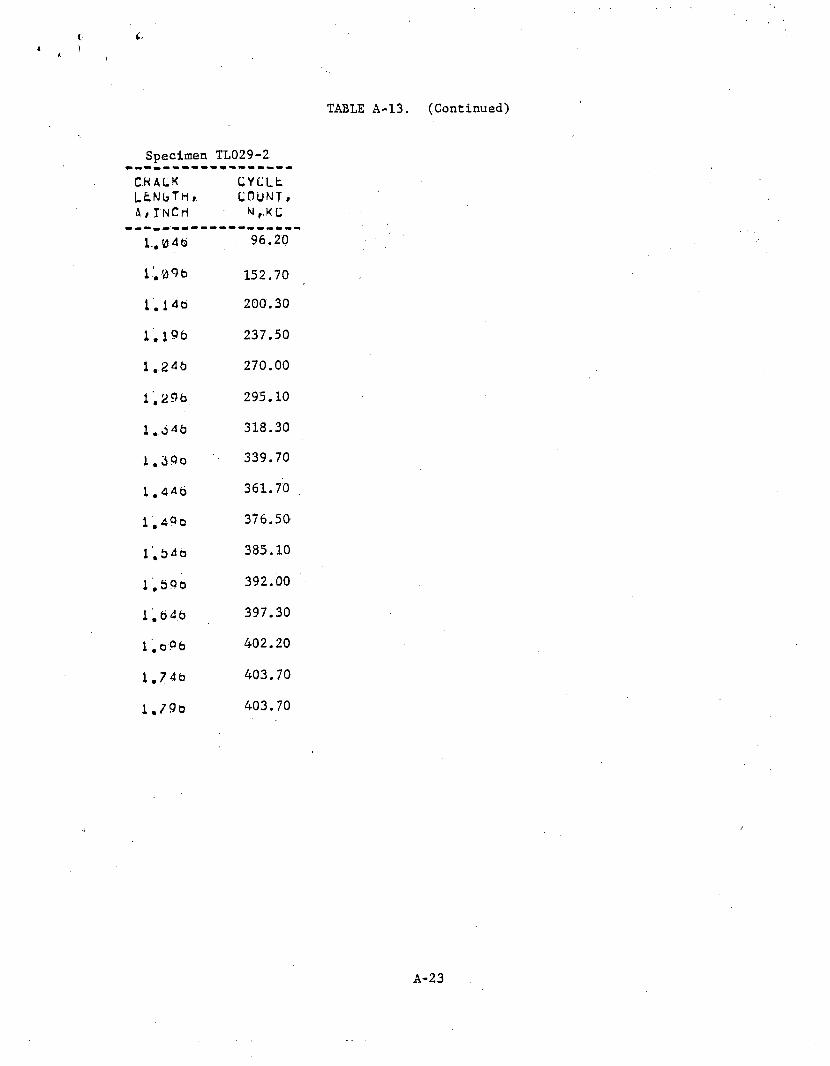
TABLE A-13.
Specimen TL029-2CHALK L t N 0 T H ». A,INCH
CYCltCOUNT.W f.KC
1.0 46 96.20
1.09b 152.70i . 1 40 200.30
1.190 237.501.24b 270.00
1,29b. 295.10
1.0 4 b 318.30
1.39o 339.70
1.44b 361.70 .
1,49b 376.50
1.046 385.10
1.59b 392.00
1.64b 397.30
l".b$b 402.20
1.74b 403.70
1.79b 403.70
(Continued)
A-23
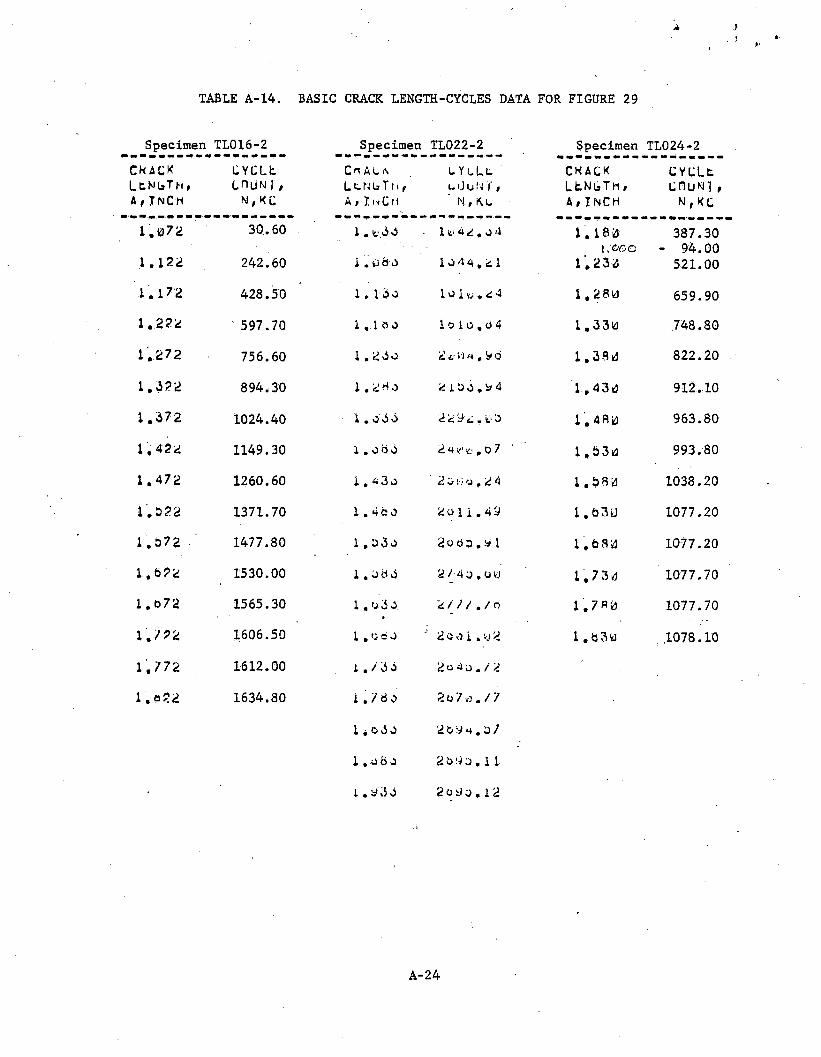
A'
TABLE A-14. BASIC CRACK LENGTH-CYCLES DATA FOR FIGURE 29
Specimen TL016-2 Specimen TL022-2 Specimen TL024-2C H A L K LtNiaTft, A , I N C H
L Y L L tC H U N J ,N , K L
C a A L a L c. N b T111 A , I uC rt
l Y l L l.l. ij u N i' , ' N , K u
C H A L KI t N u T M ,A , I n c h
L Y L L t LITuMl , N , K L
l.lfl-72 30.60 1. tf.33 1 A . o 4 1. 1 8 0 387.30I.CGO - 94.00
1.122 242.60 1 . t)8 0 1 0 4 * . is 1 1 . 2 3 0 521.00
1 . 17 2 428.50 1 . 1 0 0 1 o i <Q . tL 4 1.28k) 659.90
1.222 ‘ 597.70 i , 1 oo l o l o , o 4 l.33kl 748.80
1 . 2 7 2 756.60 l . 2 J o 2 c w , 9 b 1 . 3 8 0 822.20
1 . 3 2 2 894.30 1. 2 * 0 2 j. 6 0 . 9 4 1 . 4 3 0 912.10
• Ca '■nJ ro 1 024.40 l . o O o 2 2 y-<;, w> 0 1 .4 8 0 963.80
1 . 4 2 2 1149.30 1. o b o 2 4 v f , o 7 1 , 5 3 0 993.80
1 . 4 7 2 1260.60 i , 4 3 o 2 0 o , 2 4 1 . 5 8 0 1038.20
1 . 5 2 2 1371.70 1 . 4 b o 2 u 1 i .49 1 . 5 3 L) 1077.20
1 . 5 7 2 1477.80 1 , o 3 o 2o b a . b 1 1 . 6 8 0 1077.20
1 , 6 2 2 1530.00 1 . o b O 2 7-4 o ,oti 1 . 7 3 0 1077.70
1 . 0 7 2 1565.30 1. u 3 o 2 / 7 7 . / o 1 . 7 8k) 1077.70
1 . 7 2 2 1606.50 1 . u a 0 ■' 2 o o. i . k.i 2 1 . 6 3 0 ,1078.10
1 . 7 7 2 1612.00 i . / 3 o 2 o 4 o , /
1.022 1634.80 1 . 7 3 0 2 o 7 »3.77
1 * o O O 2 & y m . o 7
1 . o b o 2 b 9 0 . 1 1
1 • * 5 \) 2 o 9 y . 1 2
A-24
• u■1 (
APPENDIX B
Rail history, chemical composition, experimental details and summary of results of Phase I baseline crack-growth data are p r e s e n t e d in this a p pendix.
A complete description of the Phase I effort was pr e s e n t e d in an Interim Report, Reference 1 of this report.
B-l
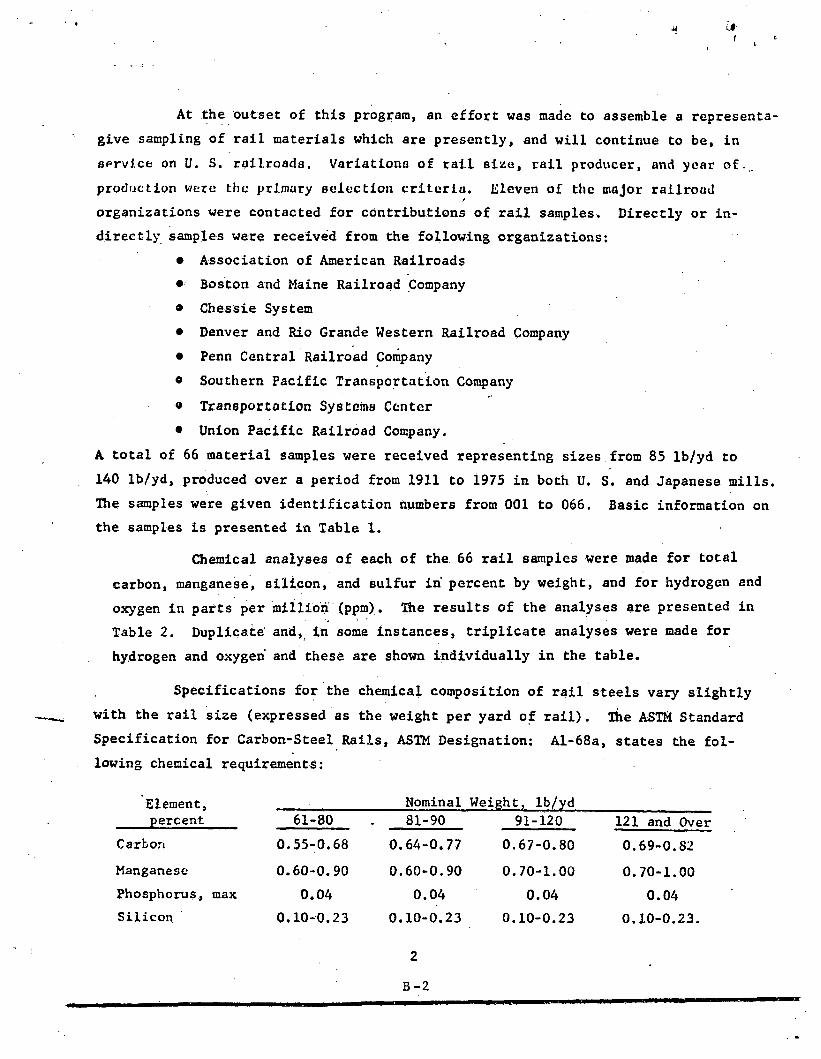
!■H
At the o u t s e t of this program, an e f f o r t w a s m a d e to a s s e m b l e a r e p r e senta- g i v e sampling of rail m a t e r i a l s w h i c h are p r e s e n t l y , a n d wi l l c o n t i n u e to be, in
se r v i c e on U. S. railroads. V a r i a t i o n s of rail size, rail producer, and y e a r of.,
p r o d u c t i o n we r e the p r i m a r y s e l e c t i o n criteria. E l e v e n of the m a j o r railroad
o r g a n i z a t i o n s w e r e c o n t a c t e d f or c o n t r i b u t i o n s o f rail samples. D i r e c t l y or i n d i r e c t l y s a mples w e r e r e c e i v e d f r o m the f o l l o w i n g o r g anizations:
• A s s o c i a t i o n of A m e r i c a n R a i l r o a d s• B o s t o n and M a i n e R a i l r o a d C o m p a n y® C h e s s i e S y s t e m• D e n v e r and Rio G r a n d e W e s t e r n R a i l r o a d C o m p a n y
• Pe n n C e n t r a l R a i l r o a d C o m p a n y
• S o u t h e r n Pacific T r a n s p o r t a t i o n C o m p a n y
® T r a n s p o r t a t i o n S y s t e m s C e n t e r
• U n i o n P a c i f i c R a i l r o a d Company.
A total of 66 m a t e r i a l samples w e r e r e c e i v e d r e p r e s e n t i n g sizes f r o m 85 lb/yd to
140 lb/yd, p r o d u c e d o v e r a p e r i o d from 1911 to 1975 in bo t h U. S. and J a p a n e s e mills. The samples w e r e g i v e n i d e n t i f i c a t i o n n u m b e r s f r o m 0 0 1 to 066. B a s i c i n f o r m a t i o n on the samples is p r e s e n t e d in T a b l e 1.
C h e m i c a l analyses of each o f the 66 rai l s a mples w e r e m a d e for total
carbon, manga n e s e , silicon, and sulfur in p e r c e n t by weight, and for h y d r o g e n and
o x y g e n in p a r t s p e r m i l l i o n ( p p m ) . The r e s u l t s of the anal y s e s are p r e s e n t e d in T a b l e 2. D u p l i c a t e and, in some instances, t r i p l i c a t e analyses w e r e m a d e for
h y d r o g e n and o x y g e n and these are s h o w n i n d i v i d u a l l y i n the table.
S p e c i f i c a t i o n s for the c h e m i c a l c o m p o s i t i o n of rail steels v a r y s l i g h t l y
w i t h the rail size ( expressed as the w e i g h t p e r y a r d o f r a i l ) . Ihe A S T M S t a n d a r d
S p e c i f i c a t i o n for C a r b o n - S t e e l Rails, A S T M D e s ignation: A l -68a, states the f o l l o w i n g chemical requirements:
Element, N o m i n a l W eight, lb/ydpercent 61-80 8 1-90 91-120 121 and Ov e r
C a r b o n 0. 5 5 - 0 . 6 8 0 . 6 4 - 0 . 7 7 0 . 6 7 - 0 . 8 0 0 . 6 9-0.82
M a n g a n e s e 0 . 6 0 - 0 . 9 0 0 . 6 0 - 0 . 9 0 0 . 7 0 - 1 . 0 0 0 . 7 0 - 1 . 0 0P h o s phorus, m a x 0.04 0 . 0 4 0.0 4 0.0 4S i l i c o n 0 . 1 0 - 0 . 2 3 0 . 1 0 - 0 . 2 3 0 . 1 0 - 0 . 2 3 0.10-0.23.
2
B-2
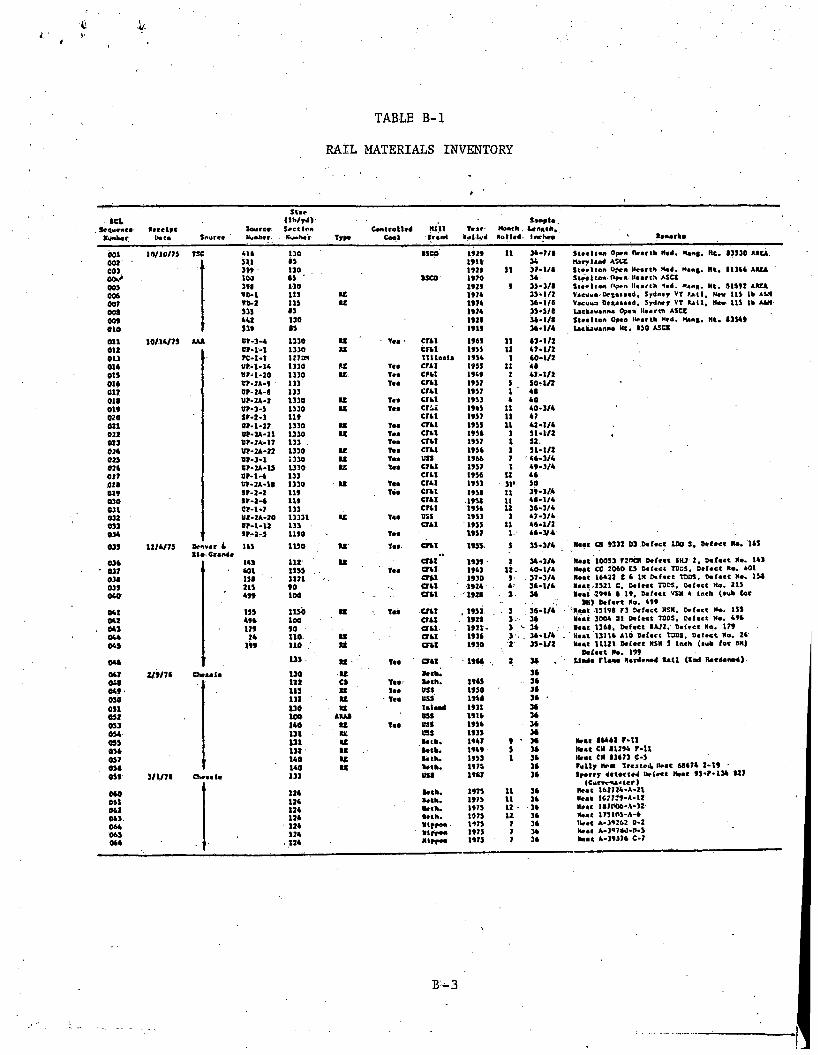
TABLE B-l
RAIL MATERIALS INVENTORY
ftCLSeqwence-Kuufcer
Receiptbeta Source
SourceHunber
Star(lh/rd) Sect lea Kuuhe'r Type
ControlledCoal
NU1'Brand
TearRolled
MoathRolled-
Sanptolength,iiwhea Ranarka
001 14/10/7) TSC 411 130 •SCO 1929 n 34-7/1 Steelten Opea IWarth Med* Hang, Ht. 63)30 AICA.002 321 6) 1911 34 Maryland ASCC00) 199 no 1929 n 37-1/6 Steelten Open Hearth Med. Neng. Ht* 11364 ARCAOOu* 109 9) ' •SCO 1920 34 Steelton Open Hearth ASCS00) 391 no 1929 9 33-3/1 Steelten open Hearth ted. Hang. Ht. 81692 ARCA006 90-1 u s U 1974 35-1/2 Vecuwe besottad* Sydney VT Rail, Heu 11) lh AC1007 96>2 i d u 1974 36-1/S Vacuo? Detailed, Sydney VT Rati, Hew ll) tb AM008 13) 6) 1924 3)-)/8 Lackawanna Oped Hearth ASCI009 442 130 1929 34-1/8 Steelton Opeo Hearth had. Hang* HR* 43)49CIO 139 1) 1919 » - i / * Uckawanna Ht. 430 ASCX
Oil 10/14/71 AAJ 07-3-4 1330 u Tea • C7A1 196S 11 *1-1/2012 07-1-1 1330 u c m 19)5 12 47-1/2OU TC-1-1 I27DN Illinois 19)4 1 40-1/2ou 07-1-14 1330 u Tea c m 19)3 U 46ots 97-t-JO 1330 u Tea C741 1949 2 47-1/2OU C7-2A-9 133 Taa c m 19)7 5 SO-1/2 *o n 07-24-8 133 c m 1937 1 48ou U7-2A-2 1330 u Tea c m 19)3 4 40019 07-1-1 1330 u Tea c m 194) n 40-3/4020 S7-2-) 119 crci 19)7 n 47021 07-1-27 1330 ts Taa c m 191) l i 42-t/4022 07-24-21 1330 u Tea c m 19)4 3 51-1/2 ,021 07-24-17 133 Tea c m 1937 i 52.024 07-2A-22 1330 RC Taa c m 1934 i SI-t/2021 07-3-1 1330 u Tea uss 1966 7 44-3/4026 07-24-11 1330 u Tea c m 1957 l 49-3/402? 07-1-6 133 cu t 1936 12 44028 07-24-16 1330 u Taa crfci 19)3 31' 50029 37-2-2 119 Tea c m 1936 It j» - i«030 S7-2-4 119 c m ■ 1938 11 44-1/4031 07-1-7 133 cu t 1936 12 36-3/4032 Uf-24-20 13331 IX Tea uss 1953 3 47-3/4011 07-1-12 133 c m 195) n 46-1/2014 sr-2- i 1190 Tea 19)7 l 46-3/4
01) 12/4/7) fie"var * 16) 1110 u Tea c m 19)1 5 35-3/4 *•« ex n i l oi »«r«ct iso s, oef.ct x*. its«•
016 141 m u c m 1939 2 34-3/4 x..t loon r:n« o *r« i ihj 2, Defect x«. t* i• 032 601 m i . Tea c m 194) 12. 40-1/4 Heat CC 2060 E) Detect TOSS, Defect Mo. *01
018 198 2221 crfci 1930 9 37-3/4 Raac 16422 £ 6 IX Dvf.cc TODS. Defect X*. 114019 21) 90 crfci 1924 4' 34-1/4 ■ ••t 2121 C. Defect TODS, Defect Ho. 211040 499 100 crfci 1921 3 36 Beat -2996 1 19, Defect VSM * Inch (euh (or
IN) Defcrt Mo. 499041 111 1134 RX Tail c m , 19)3 3 36-1/4 Out 1319S F3 Defect HSK. Defect He. 131042 496 100 crfci 1923 • 3 '• 36 Meat 1004 It Defect TODS, Defect X., 414041 179 90 crfci 1921 * 3 ' 36 ■ cat 116*. Defect 1422, Defect Ms. 171044 34 no IS afci 1936 3 36-1/4 Heat 11114 410 Deface TODS, Defect Ro. 2404) 199 n o ' tt crfci 1930 2 31-1/2 heat 11)21 Deface NStt ) Inch (tuh for 6H)
Defact No. 19904* 133 u Tea C74X 1964 2 34 Undo riaoe Hardened ta ll (Sad Hardened)
047 2/1/7* ChciaU 130 I t Beet. 34060 122 c» Tar Beth. 194) 34049 111 XX lea USS 19)0 34010 131 XX Tea USS 194* 34 •0)1 130 tt Intaad 1931 34012 100 ARAB OSS 1916 34Oil 140 RX Tea US t 19)6 34014 131 IX uss 193) 3401) 131 IX Belli* 1947 * ‘ 34 Hast *44*2 r -t l0)4 132 I t Beth. 19*9 5 34 Neat CM 81294 r -t l017 140 U Beth* 19)3 1 34 Heat CH 63673 C-)0)8 140 IX Beth* 1974 34 rully Heat Trcatrfc Heat 68674 2-19 •019 1/1/76 Cheatla 133 UBS 1967 34 Sparry detertrd Defeat Heat 9)-f-l34 627
(Cam aiMer)124 Seth* 197) 11 34 Heat 162724-A-21124 Beth. 197) 11 34 Neat 1677:9-4-12124 Beth* 197) 12 • 34 Heat 1*7006-4-12124 Beth* 197) 12 34 Heat 173105-A-4 .124 Ilf fW 197) 7 34 IWet A-39262 0-2124 Rlfpaa 197) 7 34 heat A-39740-0-)
064 124 mrpM 197) 7 36 Meat 4-1112* C-7
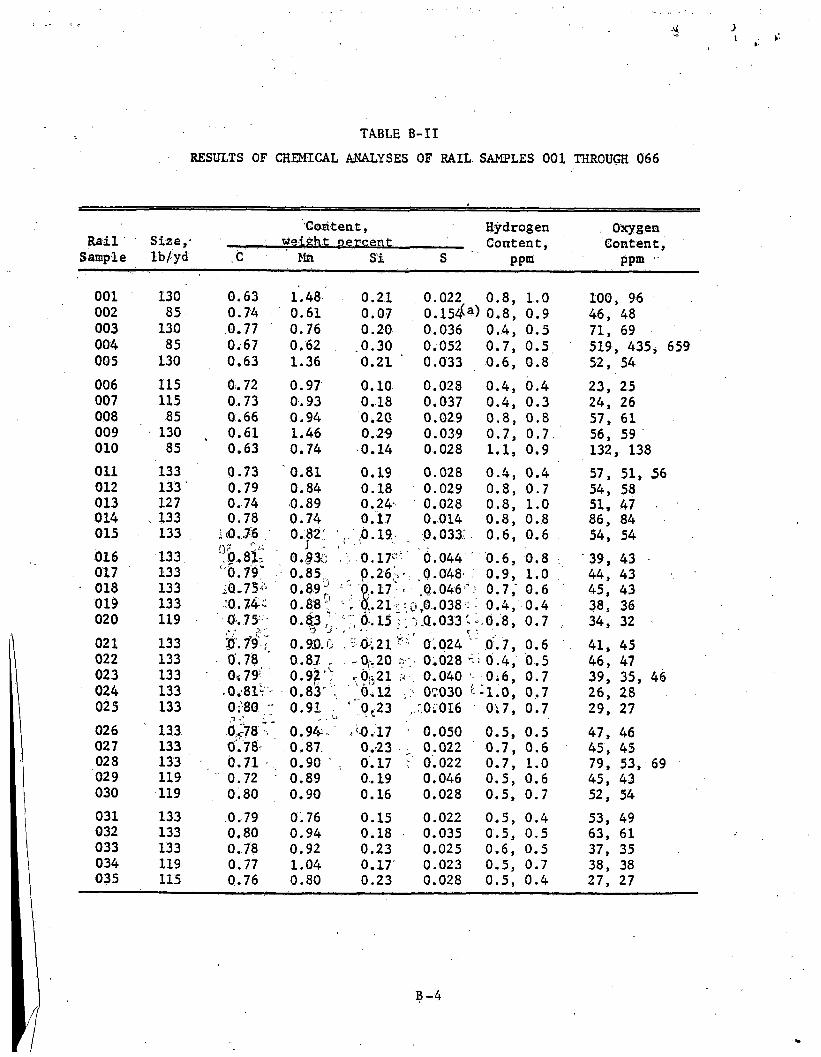
tH
RESULTS OF CHEM I C A L ANAL Y S E S OF RAIL SAMPLES 001 T H ROUGH 066TABLE B-II
Content, H y d r o g e n OxygenRail Size,- w e i g h t percent Content, Content,
Sample Ib/yd ,C M n Si S p p m p p m
001 130 0.63 1.48 0.21 0.022 0.8, 1.0 100,96002 85 0.74 0.61 0.07 o . m a) 0.8, 0.9 46, 48003 130 0.77 0.76 0.20 0.036 0.4, 0.5 71, 69004 85 0.67 0.62 .0.30 0.052 0.7, 0.5 519, 435, 659005 130 0.63 1.36 0.21 ' 0.033 0.6, 0.8 52, 54006 115 0.72 0.97 0.10 0.028 0.4, 0.4 23, 25007 115 0.73 0.93 0.18 0.037 0.4, 0.3 24, 26008 85 0.66 0.94 0.2G 0.029 0.8, 0.8 57, 61009 130 0.61 1.46 0.29 0.039 0.7, 0.7. 56, 59010 85 0.63 0.74 0.14 0.028 1.1, 0.9 132, 138Oil 133 0.73 0.81 0.19 0.028 0.4, 0.4 57, 51, 56012 133 0.79 0.84 0.18 0.029 0.8, 0.7 54, 58013 127 0.74 0.89 0.24- 0.028 0.8, 1.0 51, 47014 133 0.78 0.74 0.17 0.014 0.8, 0.8 86, 84015 133 icO.,76 0.82 ' 0.19 0.033 0.6, 0.6 . 54, 54016 133 1 I i*
0.81, 0.83c 0.17“' 6.044 0.6, 0.8 39, 43017 133 '0.7$‘ 0.85 0.26,. 0.048- 0.9, 1.0 44, 43018 133 ;Q .73 0.89: 1 ?U7‘ 0.046 \ 0.7, 0.6 45, 43019 133 :Q. 74“ 0.88 ; o,.2i • 0.0.038 : 0.4, 0.4 38, 36020 119 0.75 0.83 , .6,15 I 0 .Q. 033 0.8, 0.7 . 34, 32021 133 0.79 ; 0.933.0 *■ ’ 0.024 0.7, 0.6 41, 45022 133 0.78 0.87 .CV.20 n 0.028 » 0.4, 0.5 46, 47023 133 Os 79J 0.92•; r Or. 21 ?. 0.040 ■ 0; 6, 0.7 39, 35, 46024 133 .0.81“ 0.83 0.12 > 0i030 t-1.0, 0.7 26, 28025 133 0i'80 •; 0.91 ‘ ot23 ,700016 0.7, 0.7 29, 27026 133 0;<78" 0.94 «’0.17 0.050 0.5, 0.5 47, 46027 133 0.78 0.87. 0.23 0.022 0.7, 0.6 45, 45028 133 0.71 0.90 O'. 17 c 0.022 0.7, 1.0 79, 53, 69029 119 “ 0.72 0.89 0.19 0.046 0.5, 0.6 45, 43030 119 0.80 0.90 0.16 0.028 0.5, 0.7 52, 54031 133 0.79 0.76 0.15 0.022 0.5, 0.4 53, 49032 133 0.80 0.94 0.18 0.035 0.5, 0.5 63, 61033 133 0.78 0.92 0.23 0.025 0.6, 0.5 37, 35034 119 0.77 1.04 0.17 0.023 0.5, 0.7 38, 38035 115 0.76 0.80 0.23 0.028 0.5, 0.4 27, 27
B-4
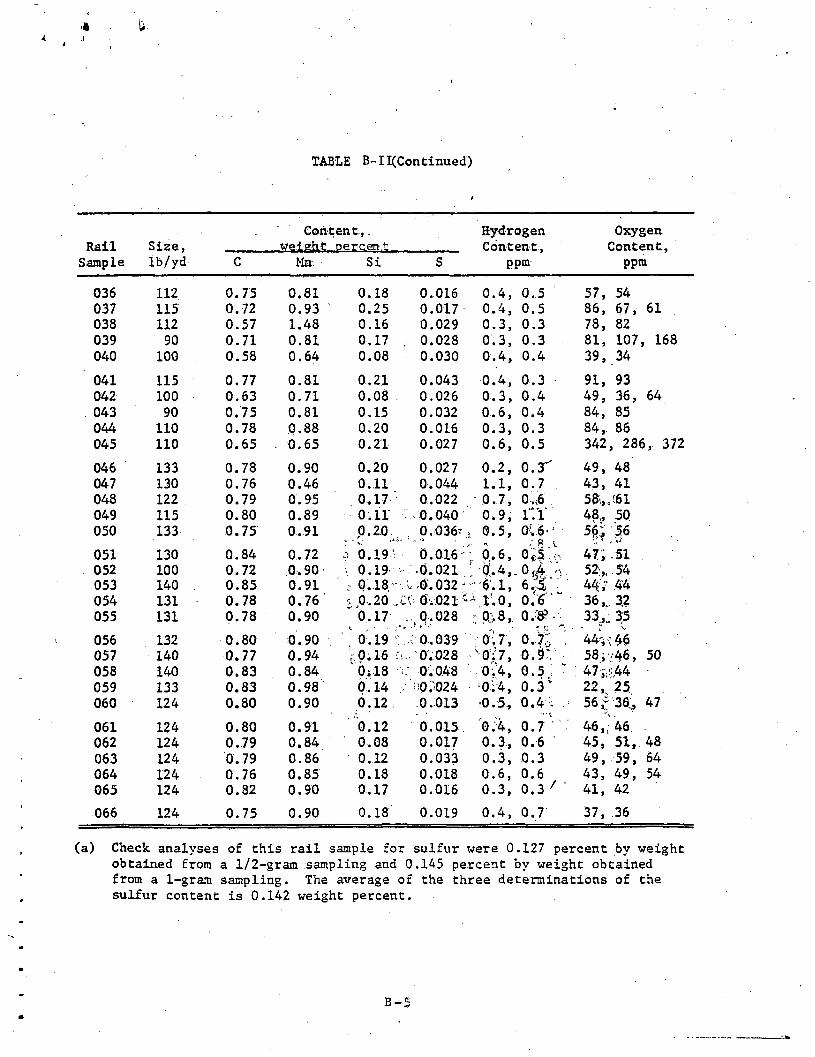
ft l** j
* .
TABLE B-II(Continued)
C o n t e n t , . H y d r o g e n OxygenRail Size, weieht oercen t Content, Content,
Sample lb/yd C M n Si S ppm ppm
036 112 0.75 0.81 0.18 0.016 0.4, 0.5 57, 54037 115 0.72 0.93 0.25 0.017 0.4, 0.5 86, 67, 61038 112 0.57 1.48 0.16 0.029 0.3, 0.3 78, 82039 90 0.71 0.81 0.17 , 0.028 0.3, 0.3 81, 107, 168040 100 0.58 0.64 0.08 0.030 0.4, 0.4 39, 34041 115 0.77 0.81 0.21 0.043 0.4, 0.3 91, 93042 100 0.63 0.71 0.08 0.026 0.3, 0.4 49, 36, 64043 90 0.75 0.81 0.15 0.032 0.6, 0.4 84, 85044 110 0.78 0.88 0.20 0.016 0.3, 0.3 84, 86045 110 0.65 0.65 0.21 0.027 0.6, 0.5 342, 286, 372046 133 0.78 0.90 0.20 0.027 0.2, 0.3 49, 48047 130 0.76 0.46 0.11 0.044 1.1, 0.7 43, 41048 122 0.79 O'. 95 0.17 0.022 0.7, 0.6 58,y:61049 115 0.80 0.89 0.11 0.040 0.9, lTl 48,, 50050 133 0.75 0.91 0.20 0.036r , 0.5, 0.6-*
B . (0.6, 0,5 :
5«. So051 130 0.84 0.72 o 0.19 0.016 ' 47, .51052 100 0.72 0.90 0.19 • 0.021 0.4,. 0.-.4
-6.1, 6.;i‘:52,. 54
053 140 . 0.85 0.91 0.18 1.0.032 44 ," ,44054 131 0.78 0.76 ; 0.20 .CO 0.021 " • 1.0, 0.6 “ 36, 32055 131 0.78 0.90 0.17 P-028 py8, 0 33,,.. 35056 132 0.80 0.90 1 0.19 0.039 0.7, 0.7* 44-,: 46057 140 0.77 0.94 0; 16 r 0.028 '0:7, 0.9' 58;-46 , 50058 140 0.83 0.84 6; 18 K 0.048 0.4, 0.5 ■ : 47 j;y44059 133 0.83 0.98' 0.14 y 0.024 0.4, 0.3v 22, 25060 124 0.80 0.90 0.12 0.013 0.5, Q . k . 56 36, 47061 124 0.80 0.91 0.12 0.015 0.4, 0.7 46,; 46,062 124 0.79 0.84 0.08 0.017 0.3, 0.6 45, 51, 48063 124 0.79 0.86 0.12 0.033 0.3, 0.3 49, 59, 64064 124 0.76 0.85 0.18 0.018 0.6, 0.6 43, 49, 54065 124 0.82 0.90 0.17 0.016 0.3, 0.3 / 41, 42066 124 0.75 0.90 0.18 0.019 0.4, 0.7 37, 36
(a) Check analyses of this rail sample for sulfur were 0.127 percent by weight obtained from a 1/2-gram sampling and 0.145 percent by weight obtained from a 1-gram sampling. The average of the three determinations of the sulfur content is 0.142 weight percent.
B-S

Mt *. *
EXPERIMENTAL DETAILS
Specimens
One tensile specimen and one fatigue-crack-growth specimen were machined
from each rail sample. The orientation of the specimens is shown in Figure B-l.
Charpy V specimens were taken from six rail samples — 023 and 030 which exhibited
a high rate of fatigue-crack growth, 019 and 031 with medium crack-growth rates,
and 001 and 036 with low growth rates. Forty-five Charpy specimens were made, 15
from each of the three growth-rate categories. From each category, five specimens
were taken in each of the three directions shown in Figure B-l. The specimens were
taken from the center of the rail head.
The tensile specimens were standard ASTM 0.25-inch-diameter specimens.
Charpy specimens were also of standard dimensions; i.e., 2.165-inch long, 0.394-
inch thick with a square cross section.
Fatigue-crack-growth specimens were of the compact tension (CT) type.
Their dimensions are shown in Figure B-2. The specimens were provided with a 1.650-
inch deep chevron .jnotch (0*.900sinch from, the load line). Details of the notch can
best be observed.-fn Figifre.il7 tfliich shows two specimens, one before and one after
testing.. ■ iSi \ ...
'■'N> ;■ ?: i\ Testing Procedures i. ^ ----: ---------
■! j ■ - ■ ■ 'Tensile and Charpy testa, were performed in accordance with standard pro-
i I ‘cedures. * f ■
To expedite the crack-growth tests, speciments were precracked in a
Krause fatigue machine. Crack-growth experiments were conducted in a 25-kip-
capacity electrohydraulic servocontrolled fatigue machine.
The tests were performed at constant
amplitude, the load cycling between 0 and 2500 pounds, resulting in a stress ratio
of R = 0. Cycling frequency was 40 Hz, but was reduced to 4 Hz toward the end of
a test to enable more accurate recording of the crack'size giving final failure.
The laboratory air was kept at 68 F and 50 percent relative humidity.
Crack growth was measured visually, using a 30 power traveling micro
scope. The cracks were allowed to grow in increments of 0.050 inch, after which
the test was stopped for an accurate crack size measurements. Crack size was
recorded as a function of the number of load cycles.
)/
B-6
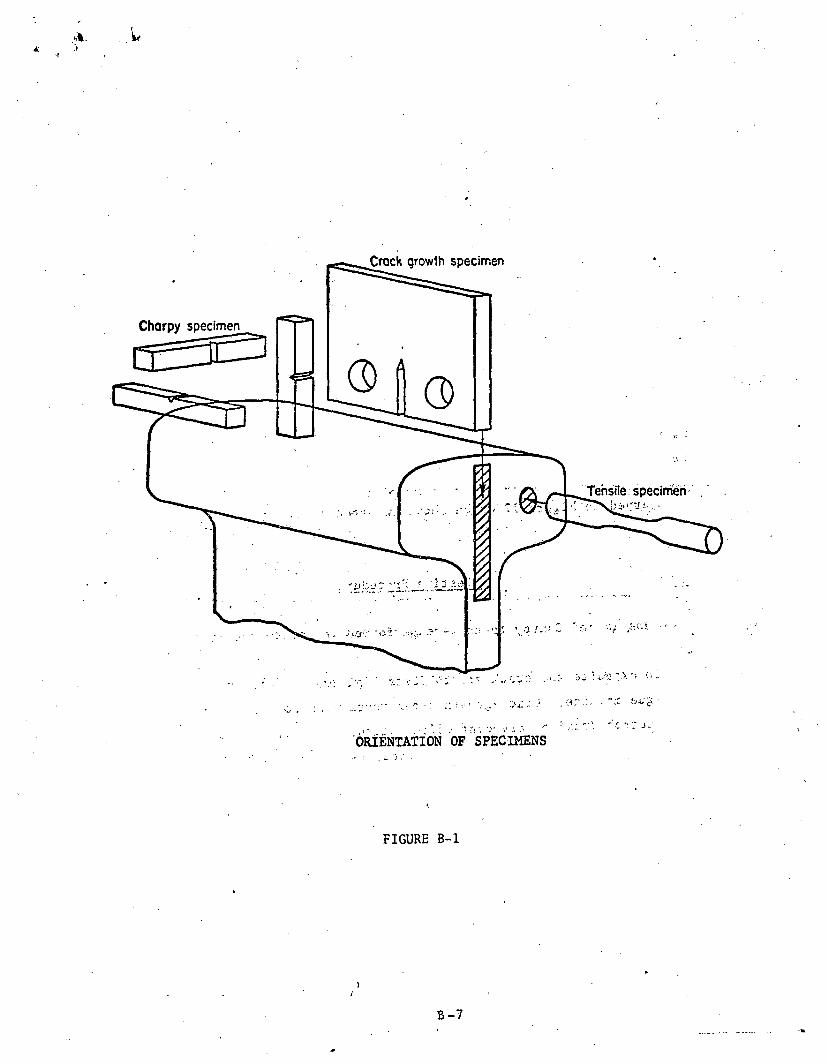
A.A.>*
Crack growth specimen
Chorpy specimen
ORIENTATION OF SPECIMENS
FIGURE B-l
)
B-7
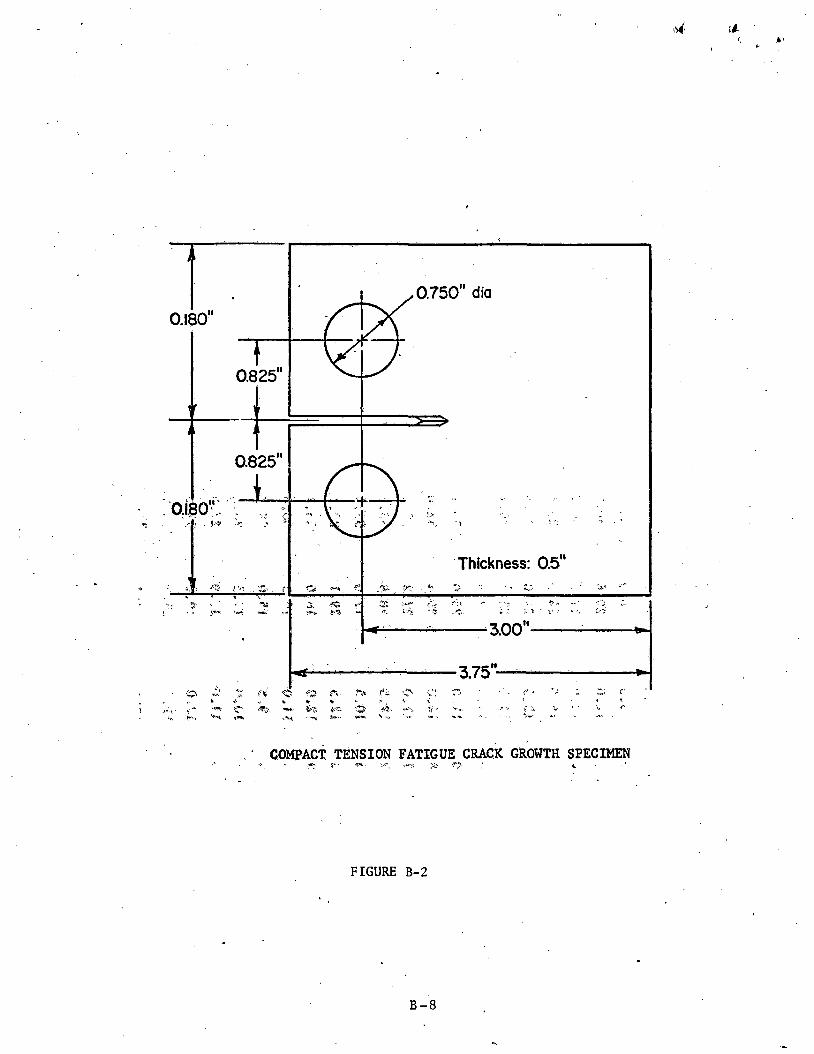
rft* V- ■?"*- ' i.
FIGURE B-2

TABLE B-IIITENSION TEST RESULTS FOR 66 RAIL SAMPLES
RailNumber
TUS,ksl
TYS,ksl
Elongation in 1 Inch, percent
Reduction in Area, percent
E,103 ksi
TrueFractureStress,
ksi
TrueFractureStrain,
e t
Ramberg-Osgood
Exponent,n
WorkHardeningExponent,
1 /n
001 136.4 76.5 13.5 * i 28,0 34.0 171.2 . 1266 7.8 .128
002 134.4 74.7 - 1 2 .0. ; I 2P f ^ 30.8. 159.4 .1133 7.7 .130
003 137.4 73.6 1 2 . 0 | • 17 r7 30.3 160.1 .1133 * 13.1 .076
004 116.0 59.9 15,. 0 , ! 24 V. 28,6 144.6 .1397 10.4 .096
005 134.8 76.4 13.5 j 26h - 31,8 154.9 ,1266 11.5 .081
006 135.0 71.2 1 1 . 0 1• j * •; 2 1 | 2 : 30.2: 161.9 .1043 11.5 .087
007 135.8 70.0 1 2 . 0' \ i 1 7 , 6 30,3, 156.9 .1133 12.5 .080
008 125.1 67.0 4 1 4 .0 / 5' ! 25|° 30.1 155.9 .1310 1 0 . 8 .093
009 139.8 81.8-: 14.0 J T 29,14 . 32,0 1 8 0 . 0 .1310 1 2 . 0 .083
0 10 111.5 58.7' 17.0 , 1 2H 2 s . 29 i 3 143.1 .1570 9.8 . 1 0 2
Oil 126.9 73.2’ ■ 12.,5rj * 2018 »<f\' - 33.8 ■ 144.3 .1177 10.3 .097
012 134.7 78.3, 10.5 1 -•‘*'“17^0:----- 4-32;;^ ir 153.1 .0998 8.4 . H 9
013 129.3 72.8'’ 1 2 .5 , l, . * 29,11 '■as.) > 160.8 .1177 7.9 .126
014 135.4 75.9- 12.0 1 1-18*0 ... 1518.7 .1133 7.5 .133015 131.6 7i. 5
f11 0—* {■ -30.6 150.0 1 .1043 6.0 .167
016 138.6 75.6* • 1 ; ( , 15fjQ , 00 ■* 154.4 1 .0907 6.3 .159
017 137.1 74.4 1 0 . 0 19/5-,, 28.2 . 163.6 .0953 6,4 .156
018 133.2 70.6 1 1 . 0 19.9 , 27.5 .1043
019• 131.2 73.4 12.0___ .... . 19.^:r-^ *34'3 ~ 152.8 .1133 8.5 .118
020 131.4 72.0 11.0 ! 18.4'; 30.4 , 152.6 .1043 6,5 .154
021 132.3 77.2 12.0 18.4 32.6 153.9 .1133 9.8 .102022 130.7 76.0 13.0 22.7 31.7 157.9 .1222 8.2 .122
• 023 135.1 77.3 10.5 17.9 32.2 155.7 ,0998 7.7 .130
r
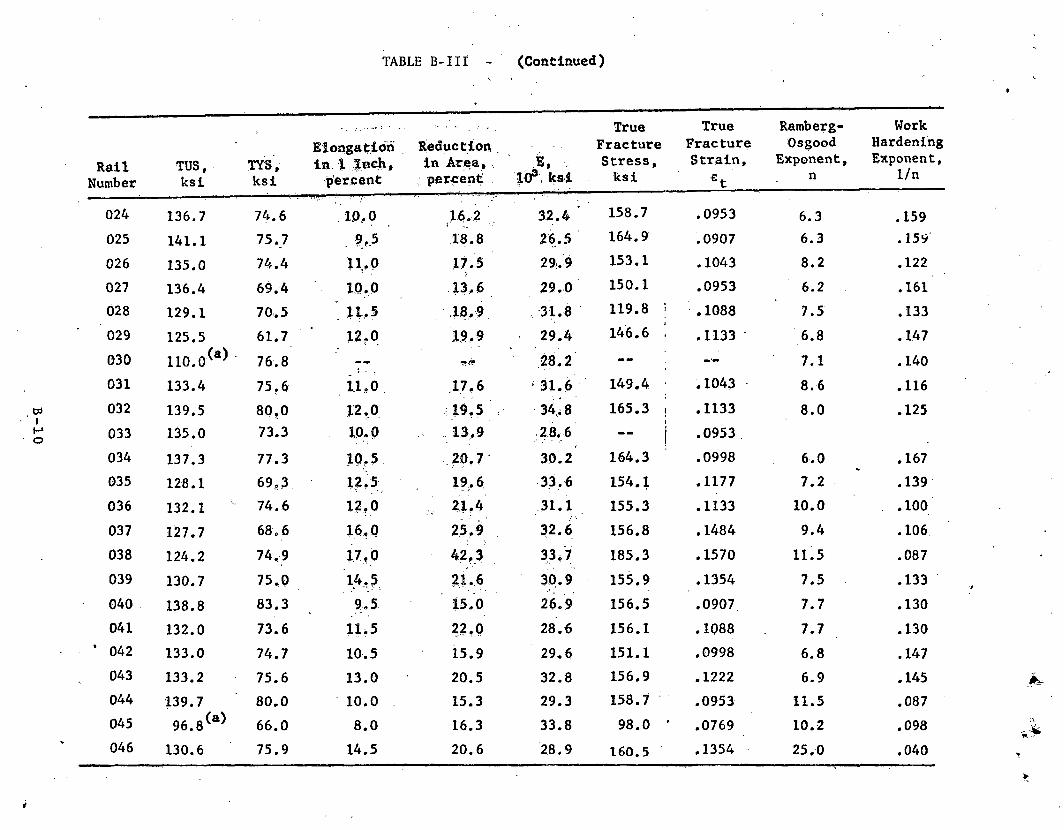
-10
TABLE B-III - (Continued)
True True Raraberg- Work
RailNumber
TUS,ksi
TYS,ksi
Elongation in 1 Inch, percent
Reduction in Area, ... percent
B, v 10® ksi
FractureStress,ksi
FractureStrain,
et
OsgoodExponent,
n
HardeningExponent,
1/n
024 136.7 74.6 10,0 16.2{’ t 32.4 158.7 .0953 6.3 .159
025 141.1 75.7 9,5 18.8 26.5 164.9 .0907 6.3 .159
026 135.0 74.4 11.0 17.5 29,9 153.1 .1043 8.2 .122
027 136.4 69.4 10.0 13.6 29,0 150.1 .0953 6.2 .161
028 129.1 70.5 ’ 11.5 .18.9 31.8 119.8 j .1088 7.5 .133
029 125.5 61.7 ' 12.0 19,9 29.4 146.6 .1133 6.8 .147
030 n o .o (a) 76.8 28,2 — — 7.1 .140
031 133.4 75.6 u . o 17,6 31.6 149.4 .1043 8.6 .116
032 139.5 80,0 12.0 19.5 34.i 8 165.3 | .1133 8.0 .125
033 135.0 73.3 10.0 13,9 28.6 I .0953
034 137.3 77.3 10.5 20,7 30.2 164.3 .0998 6.0 .167
035 128.1 69.3 12,5 19,6 33.6 154.1 .1177 7.2 . 139
036 132.1 * 74.6 12,0 21.4 31.1 155.3 .1133 10.0 .100
037 127.7 68.6 10,0 25,9 32.6 156.8 .1484 9.4 .106
038 124.2 74,9 17,0 42,3 33.7 185.3 .1570 11.5 .087
039 130.7 75,0 14.5 21.6 30.9 155.9 .1354 7.5 .133
040 138.8 83.3 9.5 15.0 26,9 156.5 .0907 7.7 .130
041 132.0 73.6 11.5 22,0 28.6 156.1 .1088 7.7 .130
* 042 133.0 74.7 10.5 15.9 29.6 151.1 .0998 6.8 .147
043 133.2 75.6 13.0 20.5 32.8 156.9 .1222 6.9 .145
044 139.7 80.0 10.0 15.3 29.3 158.7 .0953 11.5 .087
045 96.8(a) 66.0 8.0 16.3 33.8 98.0 ’ .0769 10.2 .098
046 130.6 75.9 14.5 20.6 28.9 160.5 .1354 25.0 .040
I V * v • « >.; ■
d * ? .!; .- •* < ■?■*?7 t ;•• p1 0 >■ ' ■) v •.] ,, ? •) •> c " d : - p
•
i t i f y yl 0" 1 30’ i l v >It f t) rr-d V f13 “ 0 i;r I T O ii" y j f' y
13*0s.-C-Wth :yf#fe1
J j r $ Uepori), '-'V ' ‘ /ir?I'y" 0 11v n
Fatigufe Crack Growth Properties of Rail Steels/Final Report), 1975-1977 D Broek, RC Rice
I ft ' 4
1 vt t a fttro fft 'ft 3ft" i
. .v.’v.v.v.vft. ... ..v........... «w. . v w ; : v
'■■ft: If . P:■/ f - p y c p; v' \ y j * IT.* * „ .....

P E W E ftflf m F R A& D E V E L O P M E N TW 1T1K®HE> A m-ar
Related Documents