UNCORRECTED PROOF /typeset1:/sco3/jobs1/ELSEVIER/nsm/week.06/Pnsm2984.00111 Tue Feb 27 16:22:01 2001 Page Tue Journal of Neuroscience Methods 00 (2000) 000 – 000 Failure in identification of overlapping spikes from multiple neuron activity causes artificial correlations Izhar Bar-Gad a, *, Ya’acov Ritov b , Eilon Vaadia a,c , Hagai Bergman a,c a Department of Physiology, Center for Neural Computation, The Hebrew Uni6ersity, Hadassah Medical School. P.O. Box 12272, 91120 Jerusalem, Israel b Department of Statistics, The Hebrew Uni6ersity, Jerusalem, Israel c Department of Physiology, The Hebrew Uni6ersity, Hadassah Medical School, Jerusalem, Israel Received 16 October 2000; received in revised form 26 January 2001; accepted 29 January 2001 Abstract Recording of multiple neurons from a single electrode is common practice during extra-cellular recordings. Separation and sorting of spikes originating from the different neurons can be performed either on-line or off-line using multiple methods for pattern matching. However, all spike sorting techniques fail either fully or partially in identifying spikes from multiple neurons when they overlap due to occurrence within a short time interval. This failure, that we termed the ‘shadowing effect’, causes the well-known phenomenon of decreased cross-correlation at zero offset. However, the shadowing effect also causes other artifacts in the auto and cross-correlation of the recorded neurons. These artifacts are significant mainly in brain areas with high firing rate or increased firing synchrony leading to a high probability of spike overlap. Cross correlation of cells recorded from the same electrodes tends to reflect the autocorrelation functions of the two cells, even when there are no functional interactions between the cells. Therefore, the cross-correlation function tends to have a short-term (about the length of the refractory period) peak. A long-term (hundreds of milliseconds to a few seconds) trough in the cross-correlation can be seen in cells with bursting and pausing activities recorded from the same electrode. Even the autocorrelation functions of the recorded neurons feature firing properties of other neurons recorded from the same electrode. Examples of these effects are given from our recordings in the globus pallidus of behaving primates and from the literature. Results of simulations of independent simple model neurons exhibit the same properties as the recorded neurons. The effect is analyzed and can be estimated to enable better evaluation of the underlying firing patterns and the actual synchronization of neighboring neurons recorded by a single electrode. © 2001 Elsevier Science B.V. All rights reserved. Keywords: Cross-correlation; Spike sorting; Synchronization; Autocorrelation www.elsevier.com/locate/jneumeth 1. Introduction Extracellular recording of neuronal activity is a ma- jor tool in neurophysiological studies of the brain. Microelectrodes are used for recording local currents deriving from both spiking activity and local field po- tentials. A single electrode can potentially pick up signals from multiple cells within a local area (Abeles, 1974; Asanuma, 1989). Many types of studies of the nervous system function demand a separation of the recorded signal into spikes originating from different cells. The spikes recorded from different neurons usu- ally differ in size and shape, thereby enabling their sorting into the different sources (Lewicki, 1998; Harris et al., 2000). Recording and separation of multiple neurons from a single electrode allows examination of the behavior of a population of neurons that are usu- ally much closer than multiple neurons recorded by different electrodes. Such studies are therefore manda- tory for understanding local neural networks (Egger- mont, 1990; Abeles, 1991). There are plenty of methods for decomposing the output of single electrodes into parallel spike trains (see review of spike sorting methods in Lewicki, 1998). The methods differ in the algorithms used for sorting (rang- ing from amplitude discrimination to principal and * Corresponding author. Tel.: +972-2-6757388; fax: +972-2- 6439736. E-mail address: [email protected] (I. Bar-Gad). 0165-0270/01/$ - see front matter © 2001 Elsevier Science B.V. All rights reserved. PII: S0165-0270(01)00339-9

Welcome message from author
This document is posted to help you gain knowledge. Please leave a comment to let me know what you think about it! Share it to your friends and learn new things together.
Transcript
UNCORRECTED PROOF
/typeset1:/sco3/jobs1/ELSEVIER/nsm/week.06/Pnsm2984.00111 Tue Feb 27 16:22:01 2001 Page Tue
Journal of Neuroscience Methods 00 (2000) 000–000
Failure in identification of overlapping spikes from multipleneuron activity causes artificial correlations
Izhar Bar-Gad a,*, Ya’acov Ritov b, Eilon Vaadia a,c, Hagai Bergman a,c
a Department of Physiology, Center for Neural Computation, The Hebrew Uni6ersity, Hadassah Medical School. P.O. Box 12272,91120 Jerusalem, Israel
b Department of Statistics, The Hebrew Uni6ersity, Jerusalem, Israelc Department of Physiology, The Hebrew Uni6ersity, Hadassah Medical School, Jerusalem, Israel
Received 16 October 2000; received in revised form 26 January 2001; accepted 29 January 2001
Abstract
Recording of multiple neurons from a single electrode is common practice during extra-cellular recordings. Separation andsorting of spikes originating from the different neurons can be performed either on-line or off-line using multiple methods forpattern matching. However, all spike sorting techniques fail either fully or partially in identifying spikes from multiple neuronswhen they overlap due to occurrence within a short time interval. This failure, that we termed the ‘shadowing effect’, causes thewell-known phenomenon of decreased cross-correlation at zero offset. However, the shadowing effect also causes other artifactsin the auto and cross-correlation of the recorded neurons. These artifacts are significant mainly in brain areas with high firing rateor increased firing synchrony leading to a high probability of spike overlap. Cross correlation of cells recorded from the sameelectrodes tends to reflect the autocorrelation functions of the two cells, even when there are no functional interactions betweenthe cells. Therefore, the cross-correlation function tends to have a short-term (about the length of the refractory period) peak. Along-term (hundreds of milliseconds to a few seconds) trough in the cross-correlation can be seen in cells with bursting andpausing activities recorded from the same electrode. Even the autocorrelation functions of the recorded neurons feature firingproperties of other neurons recorded from the same electrode. Examples of these effects are given from our recordings in theglobus pallidus of behaving primates and from the literature. Results of simulations of independent simple model neurons exhibitthe same properties as the recorded neurons. The effect is analyzed and can be estimated to enable better evaluation of theunderlying firing patterns and the actual synchronization of neighboring neurons recorded by a single electrode. © 2001 ElsevierScience B.V. All rights reserved.
Keywords: Cross-correlation; Spike sorting; Synchronization; Autocorrelation
www.elsevier.com/locate/jneumeth
1. Introduction
Extracellular recording of neuronal activity is a ma-jor tool in neurophysiological studies of the brain.Microelectrodes are used for recording local currentsderiving from both spiking activity and local field po-tentials. A single electrode can potentially pick upsignals from multiple cells within a local area (Abeles,1974; Asanuma, 1989). Many types of studies of thenervous system function demand a separation of therecorded signal into spikes originating from different
cells. The spikes recorded from different neurons usu-ally differ in size and shape, thereby enabling theirsorting into the different sources (Lewicki, 1998; Harriset al., 2000). Recording and separation of multipleneurons from a single electrode allows examination ofthe behavior of a population of neurons that are usu-ally much closer than multiple neurons recorded bydifferent electrodes. Such studies are therefore manda-tory for understanding local neural networks (Egger-mont, 1990; Abeles, 1991).
There are plenty of methods for decomposing theoutput of single electrodes into parallel spike trains (seereview of spike sorting methods in Lewicki, 1998). Themethods differ in the algorithms used for sorting (rang-ing from amplitude discrimination to principal and
* Corresponding author. Tel.: +972-2-6757388; fax: +972-2-6439736.
E-mail address: [email protected] (I. Bar-Gad).
0165-0270/01/$ - see front matter © 2001 Elsevier Science B.V. All rights reserved.PII: S0165-0270(01)00339-9
UNCORRECTED PROOF
/typeset1:/sco3/jobs1/ELSEVIER/nsm/week.06/Pnsm2984.00111 Tue Feb 27 16:22:01 2001 Page Tue
I. Bar-Gad et al. / Journal of Neuroscience Methods 000 (2001) 000–0002
independent component analysis of the spike shape),the working time frame (real time and offline methods)and the verification methods. In general, all methodssuffer from problems common in classical signal detec-tion methods, e.g. false positives (noise in the signal isclassified as real spikes) and false negatives (real spikesare rejected as noise). However, when using spike-sort-ing methods, additional errors may occur. These errorsinclude false match (a spike generated by one unit isclassified to a different unit) and double match (a singlewaveform is classified as belonging to more than oneclass). The number of such errors can be reduced bybetter signal to noise recording conditions, and by morecareful and elaborate sorting methods.
When the errors in either sorting or identification aresystematic, they might cause effects, which seem toderive from the properties of the neurons rather thanfrom the classification procedure (Quirk and Wilson,1999). Such a systematic classification error occurs dueto the spike overlap problem. All sorting methodsperform quite well when the spikes recorded from theelectrode are sufficiently separated in time. However,when multiple spikes appear closely, causing an overlapof their effects on the recorded signal, all sorting meth-ods perform significantly worse. This overlap may re-sult in several consequences: none of the spikes isidentified (complete false negative); only one of thespikes is identified (partial false negative); or the over-lapped signal is identified as another different spike(false match). The overlapping problem is usually nothandled, although some methods have been developedfor reducing the misidentification cause by the overlap(Lewicki, 1998). These methods include identificationby neural networks (Chandra and Optican, 1997) andoverlap decomposition (Atiya, 1992; Lewicki, 1994;Zouridakis and Tam, 1997). However, whichever meth-ods are used, overlapping spikes are identified signifi-cantly worse than well-separated spikes. In thismanuscript we show that the auto and cross-correlationfunctions of simultaneously recorded units (especially inbrain areas with high firing rates and synchronizeddischarge) are significantly affected by the sorting lim-its. Thus, short and long term synchronization mightappear in the cross-correlograms due to the sortingproblems in spite of the fact that the neurons fireindependently. Finally, we describe methods for esti-mating these artifacts, and thus enabling better under-standing of the firing patterns and synchronization ofneighboring neurons in the central nervous system.
2. Methods
2.1. Beha6ioral and recording methods
Real data was taken from electrophysiological
recordings of multiple spike trains from the globuspallidus of behaving monkeys. Details of the behaviorof the monkeys and animal care are described elsewhere(Bar-Gad et al., 2000). During the recording sessions,eight glass-coated tungsten microelectrodes confinedwithin a cylindrical guide (2.2 mm outer diameter) wereadvanced to the target. Neuronal activity from eachelectrode was amplified (*10 000), bandpass filtered(300–6000 Hz, four poles Butterworth filter, MCP 2.0Alpha-Omega Engineering, Nazareth, Israel), and con-tinuously sampled at 24 KHz/electrode (AlphaMap 4.8,Alpha-Omega Engineering). Detection and sorting ofneural activity was done using real time and offlinemethods (see below). Only well-isolated and stablespike trains (as judged by stable spike waveforms,stable firing rate and consistent responses to behavioralevents) were included in this study.
2.2. Real time spike sorting
The electrode output was sorted and classified in realtime by a template-matching algorithm (MSD 3.21,Alpha-Omega Engineering, Nazareth, Israel). The elec-trode signal was continuously sampled at 50 KHz,placed in a buffer containing the last 100 samples (2ms), and compared continuously with one to threetemplates. Each template was constructed of eightequally spaced points separated by 0.1 ms, and wasdefined by the user following a learning process ofthreshold crossing signals. The sum of squares of thedifferences between eight points in the buffer (starting0.4 ms from the beginning of the buffer and equallyspaced at 0.1 ms) and the templates was calculated.When this sum reached a minimum that was below auser-defined threshold, detection was hardware re-ported. In the cases that a buffer was double matched(e.g. a signal passed the criteria of more than onetemplate), an error signal was given to the user, but nohardware report was created. A dead time of 0.06 msfollowed detection. The timing of the hardware detec-tions (100 ms active low TTL pulses) were edge recordedat 12 KHz by a data logger (AlphaMap 4.8, Alpha-Omega) in parallel with the analog signals of the elec-trode output and of the behavioral events.
2.3. Offline spike sorting
The continuous (24 KHz) sampling of the electrodeoutput was subject to off-line spike sorting procedure(AlphaSort 3.8, Alpha-Omega Engineering, Nazareth,Israel). This algorithm is based on principal componentanalysis of the spike pattern (Abeles and Goldstein,1977). The algorithm assumes that most of the spike
UNCORRECTED PROOF
/typeset1:/sco3/jobs1/ELSEVIER/nsm/week.06/Pnsm2984.00111 Tue Feb 27 16:22:01 2001 Page Tue
I. Bar-Gad et al. / Journal of Neuroscience Methods 000 (2001) 000–000 3
waveform can be represented as a linear combination oftwo principal vectors, and that spikes generated by thesame neurons will create a cluster of points in a twodimensional space representing the correlation betweenthe spikes and the principal vectors. The principalvectors are calculated using existing libraries of extra-cellular recorded spikes in the relevant brain regions.
There are four steps in the off-line sorting procedure:extraction, projection, classification and, finally, verifi-cation. The first step is the extraction step, in which theprogram performs automatic detection of 2.7 ms seg-ments with suspected spikes, based on threshold cross-ing. The threshold is calculated from the variance of theelectrode output during the last 5.2 s. If more than onethreshold crossing is detected in less than 1 ms, thehigher one is selected. The candidate segments areextrapolated to 96 KHz, yielding 2.7 ms long segmentswith 256 sampling points. In the second step the sus-pected segments are projected on the two principalcomponents and the approximation error of the origi-nal signal by the linear combination of the two princi-pal vectors is calculated. To overcome the variabilityinduced by the properties of the signal and the extrac-tion step, the length of the principal vectors is 196points (�2 ms) and the approximation error is calcu-lated for all possible (60) offsets. The program finds theoffset with the minimum approximation error and usesit for the classification step. In the classification step,the user is provided with a two dimensional display ofall spikes with acceptable approximation error on theprincipal component space. The user classifies the neu-ron by drawing polygons around clusters of spike pro-jections, and can subsequently modify these clustersalong with the progression of the recording. Finally, thelast and most critical step is the verification of thesorting. The user can test the waveforms of the sortedspikes, evaluate the stability of their shape and rate,their similarity to other sorted spikes and test theirinter- and cross-spike interval histograms to be compat-ible with those of single neurons (Fee et al., 1996). Thetiming of the spikes is written at 12 KHz resolution,and all further analysis is performed using 1 ms bins.
The main advantages of the off-line sorting are thatthe user can make decisions with respect to the wholedata. Decisions are not based only on current andrecent past history. In addition, the user can re-evaluatethose decisions using additional measures and statisticaltests. Finally, off-line sorting reduces the sampling biastowards units with high firing rates, since a significantnumber of spikes can be accumulated over long record-ing even of cells with very low firing rates.
2.4. Simulation techniques
Simplistic models of the neurons were used for simu-lating the shadowing effect. The spike trains of n mod-
eled cells were created as independent processesX1,t … Xn,t. Each cell (m), had a refractory period oflength t ref
m featuring lowered firing probability p refm (t)
followed by constant firing probability (p constm ). These
cells are known as models of a Poisson process with arefractory period (MacGregor, 1987). The refractoryperiod was defined for simplicity as an exponent func-tion p ref
m (t)=k (trefm +1− t) p const
m , t5t refm , k51. In addi-
tion, some of the cells featured long-term correlationsin their firing rate. The long-term correlations werecreated by low probability (ppause
m ) pauses of lengthtpause
m in the cell’s firing simulating the pauses typical tothe external segment of the globus pallidus. The valuesfor the variables used throughout the simulations warein accordance with those seen in the electrophysiologi-cal recordings of the globus pallidus 4 ms 5tref510ms, 0.055pconst50.2, 500 ms5 lpause53000ms, 10−45ppause510−3 (DeLong, 1971).
Simulation of recording from a single electrode wasperformed for two different models: complete shadow-ing, removing all spikes of the two cells occurringwithin a single bin (Simple model) or partial shadow-ing, removal with different probabilities of spikes intemporally close occurrence (Complex model). The binsfor the simulation were of the same length as those usedfor the electrophysiological recordings (1 ms). Thelength of the simulated processes was in the same orderas the recorded data (106 bins=1000 s).
3. Results
3.1. Electrophysiological recordings
Neurons recorded in the globus pallidus display com-mon characteristics. The spontaneous firing rate of thecells is generally high compared to other brain areas(40–100 Hz), with a refractory period of several mil-liseconds (4–10 ms). The short time scale autocorrela-tion functions display a typical peak in theautocorrelation function following the refractory period(Fig. 1a,c). These peaks derive from the refractoryperiod of the cells and not from an increased firingprobability (Bar-Gad et al., 2000). The cross-correla-tion function between neurons recorded by differentelectrodes displays a flat correlogram in over 95% ofneuron pairs (Nini et al., 1995; Raz et al., 2000) (Fig.1d). However, the cross-correlation function of neuronsrecorded by the same electrode displays reduced proba-bility around zero offset, followed by a short-term(narrow) peak. The duration of the short-term peakequals the duration of the refractory periods of thecells, and the peak is surrounded by short troughs inthe correlation (Fig. 1b). Examples of cross-correlationfunctions of neurons recorded by the same electrode,featuring similar properties, appear in literature for

UNCORRECTED PROOF
/typeset1:/sco3/jobs1/ELSEVIER/nsm/week.06/Pnsm2984.00111 Tue Feb 27 16:22:01 2001 Page Tue
I. Bar-Gad et al. / Journal of Neuroscience Methods 000 (2001) 000–0004
various brain regions: frontal cortex (Vaadia et al.,1991, Fig. 9d), dorsal cochlear nucleus (Voigt andYoung, 1980, Fig. 9b), reticular formation region of themidbrain (MacGregor et al., 1975, Fig. 5b), medulla(Feldman et al., 1980, Fig. 7c), auditory cortex (Dick-son and Gerstein, 1974, Fig. 5b,6j; Eggermont, 1992,Fig. 1a), substantia nigra (Wilson et al., 1977) andmedial geniculate body (Heierli et al., 1987, Figs 1,2).
The neurons of the globus pallidus (especially thoseof the external segment) display pausing activity (De-Long, 1971). The pauses reflect a decrease in firing ratefrom the typical high rate to very low rates for pro-
longed periods (500–3000 ms). This firing-patterncauses long-term (hundreds of milliseconds up to a fewseconds) peaks in the autocorrelation functions (Fig.2a-upper plot, c) (DeLong, 1971). Other cells may notdisplay pausing activity, leading to a flat autocorrela-tion function (Fig. 2a-lower plot). The long-term cross-correlation between the neurons is flat when the cellsare recorded by different electrodes (Fig. 2d). However,when the neurons are recorded by the same electrode,and at least one of the cells displays a long-term (wide)peak in the autocorrelation, the cross-correlation func-tion reveals a typical long shallow trough of the same
Fig. 1. Examples of short-term cross-correlation functions between neurons recorded from the same electrode and from different electrodes in theglobus pallidus. (a) Autocorrelation functions of neurons recorded from a single electrode (990513/2/5 and 990513/2/6); (b) Cross-correlationfunction of the pair of neurons shown in (a), showing the typical short-term peak due to the shadowing effect; (c) Autocorrelation functions ofneurons recorded from different electrodes (990513/2/1 and 990513/2/29); (d) Cross-correlation function of the pair of neurons shown in (c),showing the typical flat cross-correlation in the pallidum.

UNCORRECTED PROOF
/typeset1:/sco3/jobs1/ELSEVIER/nsm/week.06/Pnsm2984.00111 Tue Feb 27 16:22:01 2001 Page Tue
I. Bar-Gad et al. / Journal of Neuroscience Methods 000 (2001) 000–000 5
Fig. 2. Examples of long-term cross-correlation functions between neurons recorded from the same electrode and from different electrodes in theglobus pallidus. (a) Autocorrelation functions of neurons recorded from a single electrode (990513/2/5 and 990513/2/6); (b) Cross-correlationfunction of the pair of neurons shown in (a), showing the typical long-term trough due to the shadowing effect; (c) Autocorrelation functions ofneurons recorded from different electrodes (990513/2/1 and 990513/2/29); (d) Cross-correlation function of the pair of neurons shown in (c),showing the typical flat cross-correlation in the pallidum. In (a–d) 100 bins are displayed, each bin consists of the average of 40 ms. The bin-zeroeffects are therefore smoothed by the neighboring values.
time-scale as the peak in the autocorrelation function(Fig. 2b).
In general, when multiple neurons are recorded fromthe same electrode, their autocorrelation characteristics:oscillations, peaks and troughs tend to reflect onto thecross-correlation function. Prior research has shownthat when cells are not independent i.e. have somefunctional connectivity, their cross-correlation functionreflects their autocorrelation functions in various exper-imental setups (Eggermont, 1990). However, indepen-dent cells recorded from different electrodes do not
display this feature. In such cases the autocorrelationreflection is unique to recordings from the same elec-trode and is caused by the shadowing effect.
3.2. Simulations
Neurons were simulated independently with firingcharacteristics typical to those of the globus pallidus ofprimates. The simulated neurons featured a refractoryperiod of decreased firing probability, followed by aperiod of constant firing probability. The combination
UNCORRECTED PROOF
/typeset1:/sco3/jobs1/ELSEVIER/nsm/week.06/Pnsm2984.00111 Tue Feb 27 16:22:01 2001 Page Tue
I. Bar-Gad et al. / Journal of Neuroscience Methods 000 (2001) 000–0006
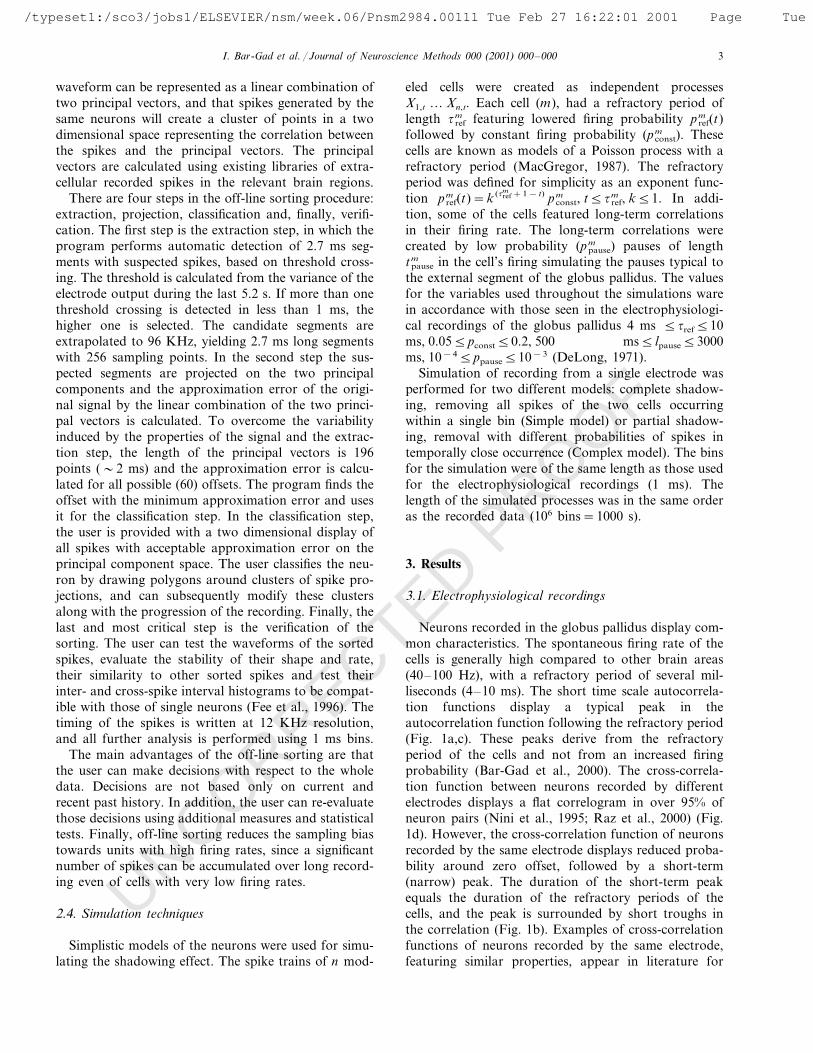
Fig. 3. Short-term cross-correlation: simulation results. (a–b) Autocorrelation of the two simulated independent cells before removal of commonspikes; (c) Spike trains of two cells without removal of spikes occurring at the same bin, simulating recording from different electrodes; (d) Crosscorrelation of cells (a–b) without removal of spikes reveals a flat cross correlograms; (e) Spike trains of two cells after removal of spikes occurringat the same bin, simulating recording from the same electrode (simple shadowing); (f) Cross correlation cells (a–b) after removal of spikesoccurring at the same bin reveals a small peak surrounding the zero valued central bin; (g) Spike trains of two cells after removal of spikesoccurring at multiple bins, simulating recording from the same electrode (complex shadowing). Notice that in some cases spikes from both spiketrains are removed, whereas at other times only one of the spike trains loses a spike; (h) Cross correlation of cells (a–b) after removal of spikesoccurring at the multiple bins Sm,n=Sn,m= [0.5 1 0.5], reveals a larger peak in the cross correlation function surrounding the three central bins.The parameters used in the figure are:
Dt=1 ms, t1=6 ms, p1=0.15, t2=8 ms, p2=0.12, pt=k (tr+1− t) p t5tr k=0.5.
UNCORRECTED PROOF
/typeset1:/sco3/jobs1/ELSEVIER/nsm/week.06/Pnsm2984.00111 Tue Feb 27 16:22:01 2001 Page Tue
I. Bar-Gad et al. / Journal of Neuroscience Methods 000 (2001) 000–000 7
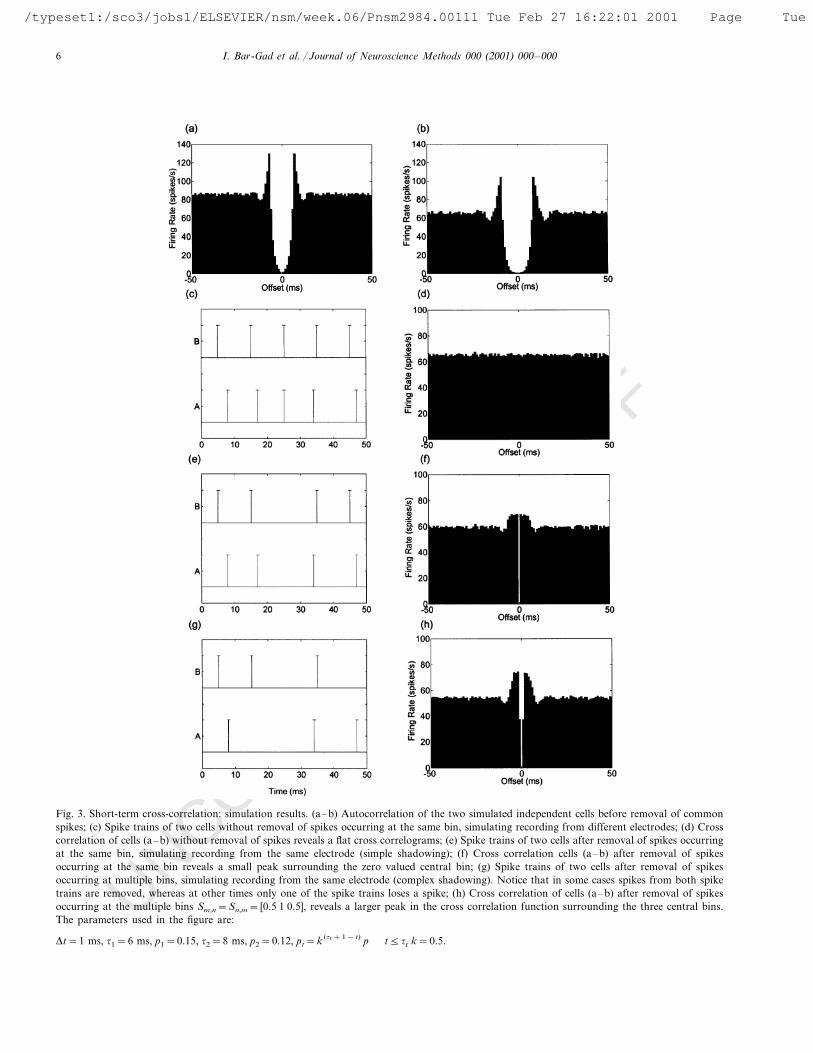
Fig. 4. Long-term cross correlation: simulation results. (a–b) Autocorrelation of the two cells before removal of common spikes; (c) Crosscorrelation of two simulated independent cells (a–b) without removal of spikes occurring at the same bin, simulating recording from differentelectrodes and demonstrating a flat correlograms; (d) Cross correlation of two simulated independent cells (a–b) after removal of spikes occurringat the same bin, simulating recording from the same electrode and demonstrating a small trough in the correlogram; (e) Cross correlation of twosimulated independent cells (a–b) after removal of spikes occurring at multiple bins Sm,n=Sn,m= [0.5 1 0.5] and demonstrating a large trough inthe correlogram. The parameters used in the figure are:
Dt=1 ms, t1=4 ms, p1=0.1, t2=6 ms, p2=0.08, pt=k (tr+1− t) p t5tr k=0.5. ppause=0.001 l( pause=500 ms Size of a bin is 40ms.
of high firing rate with the refractory period leads toautocorrelation functions with short peaks following therefractory period (Bar-Gad et al., 2000) (Fig. 3a,b). Ashort trace of spikes is shown for the two cells (Fig. 3c).Since the cells were created independently, the cross-cor-relation function is flat (Fig. 3d). However, a simplemodel simulating a recording of two cells by a singleelectrode can be obtained by removal of all spikesoccurring within a single bin (Fig. 3e). The cross-corre-lation function created from the new spike trains (Fig.3f) has the typical short-term peak seen in the experimen-tal results. Creation of a more complex shadowing period
by removing common spikes for multiple offsets (e.g. inthe range of 92 ms) with different probabilities (e.g.100% at 91 ms and 50% at 92 ms, Fig. 3g) enhancesthe size of the peak in the cross-correlation (Fig. 3h).
To test the long-term shadowing effects we simulatedindependent neurons featuring a tendency towards paus-ing in the firing in addition to the refractory periodproperties. This firing pattern leads to a long-term peakin the autocorrelation functions in addition to theshort-term phenomena (Fig. 4a,b). Since the cells areindependent, their cross-correlation function is flat (Fig.4c). However, the removal of spikes occurring in the
UNCORRECTED PROOF
/typeset1:/sco3/jobs1/ELSEVIER/nsm/week.06/Pnsm2984.00111 Tue Feb 27 16:22:01 2001 Page Tue
I. Bar-Gad et al. / Journal of Neuroscience Methods 000 (2001) 000–0008
same bin causes the cross-correlation function to fea-ture a wide trough (Fig. 4d) similar to the one seen inexperimental data (Fig. 2b). This trough is also affectedby the width of the shadowing effect and its shape,growing with the increase in the shadowing periodlength (Fig. 4e).
3.3. Analysis
For the analysis of the shadowing effect we shall firstuse the simple model of complete shadowing lasting fora single bin (removal of all common spikes within thecentral, zero offset, bin and no effect on spikes in anyother bin). Another assumption is that only two cellsare recorded from the same electrode. Both of theseassumptions will be removed in the analysis of thegeneral model. The details of the mathematical analysisare given in the Appendix A.
Assuming that p1 and p2 are the firing probabilities ofthe original cells, before removal of common spikes.The firing probabilities of the two cells after removal ofthe common spikes equal the probability that one ofthe cells fired and the other did not.
pn*=pn(1−pm), (1)
where, n, m=1, 2. Let: a1(t) and a2(t) be the autocorre-lation functions of the original cells and assume inde-pendence of the underlying cells. The cross correlationof the two cells (at offset different than zero) after theremoval of common spikes is given by,
cn,m* (t)= (1−an(t))(1−am(t))pn
1−pn
. (2)
The results of the analysis performed on the cells usedfor the simulation examples in the prior sections aresimilar to the computational (simulation) results.
The general model deals with a shadowing effect formultiple offset bins. The shadowing effect may not becomplete, such that in each bin during the shadowingperiod (−a to +a) the removal of spikes from cell moccurs with the probability Sn,m(t) where t is the offsetfrom the spikes of cell n,
05Sn,m(t)51 �t �5a.
Sn,m(t)=0 �t �\a (3)
The shadowing effect is not symmetric in time(Sn,m(t) is not necessarily equal to Sn,m(− t)) and notsymmetric between the neurons (Sn,m(t) is not necessar-ily equal to Sm,n(t) or Sm,n(− t)). The firing probabilityin this case, under the assumption that the shadowingperiod is shorter than the refractory period, is
pn*=pn
�1−pm %
a
u= −a
Sm,n(u)�
. (4)
The cross correlation of the two cells under the inde-pendence assumption is
cn,m* (t)=�
1− %a
u= −a
Sn,m(u) an(t+u)�
�
1− %a
u= −a
Sn,m(u) am(t−u)� pn
1−pn %u= −aa Sn,m(u)
.
(5)
The equations describing the general solution are equalto the equations of the simple solution for a=0, Sn,m(0)=Sm,n(0)=1.
The size of the changes in the cross-correlationcaused by the shadowing effect varies considerablyaccording to the cells’ characteristics such as firingprobability and the shape of the autocorrelation func-tion. The size of the change also varies according tofeatures of the experimental setup and the sortingmethod that are reflected in the length and shape of theshadowing period. Assuming that the shadowing periodis shorter than the absolute refractory period, the dif-ference between the short-term peak in the cross corre-lation and the steady state can be approximated by,
Dcn,m* :pn�
pn %a
u= −a
Sn,m(u)+pm %a
u= −a
Sm,n(u)�
. (6)
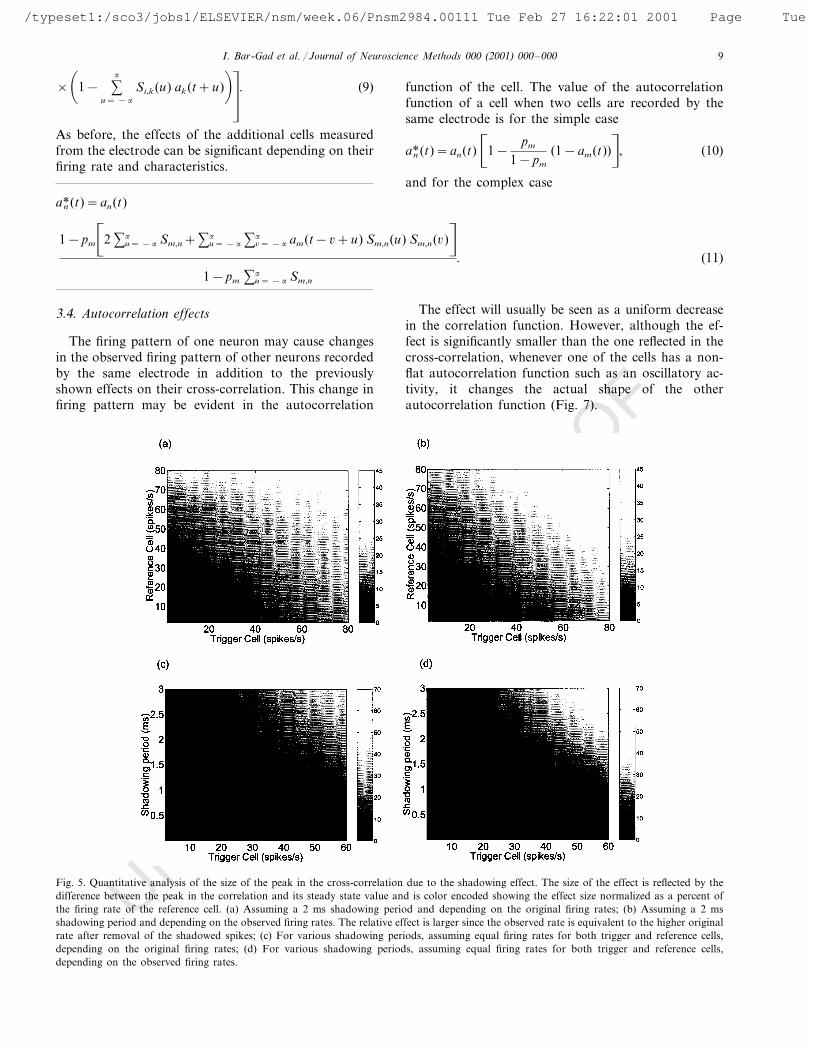
The size of the peak as a function of the firing rates,and of the shadowing period is shown (Fig. 5).
Assuming that the cells have a long-term peak intheir autocorrelation functions (Fig. 2a,c and Fig.4a,b), and that Dan and Dam are the maximum offsets ofthe peaks from steady state, the size of the trough in thecross correlation can be approximated by,
Dcn,m* :−pn�Dam %
a
u= −a
Sm,n(u)+Dan %a
u= −a
Sn,m(u)�
.
(7)
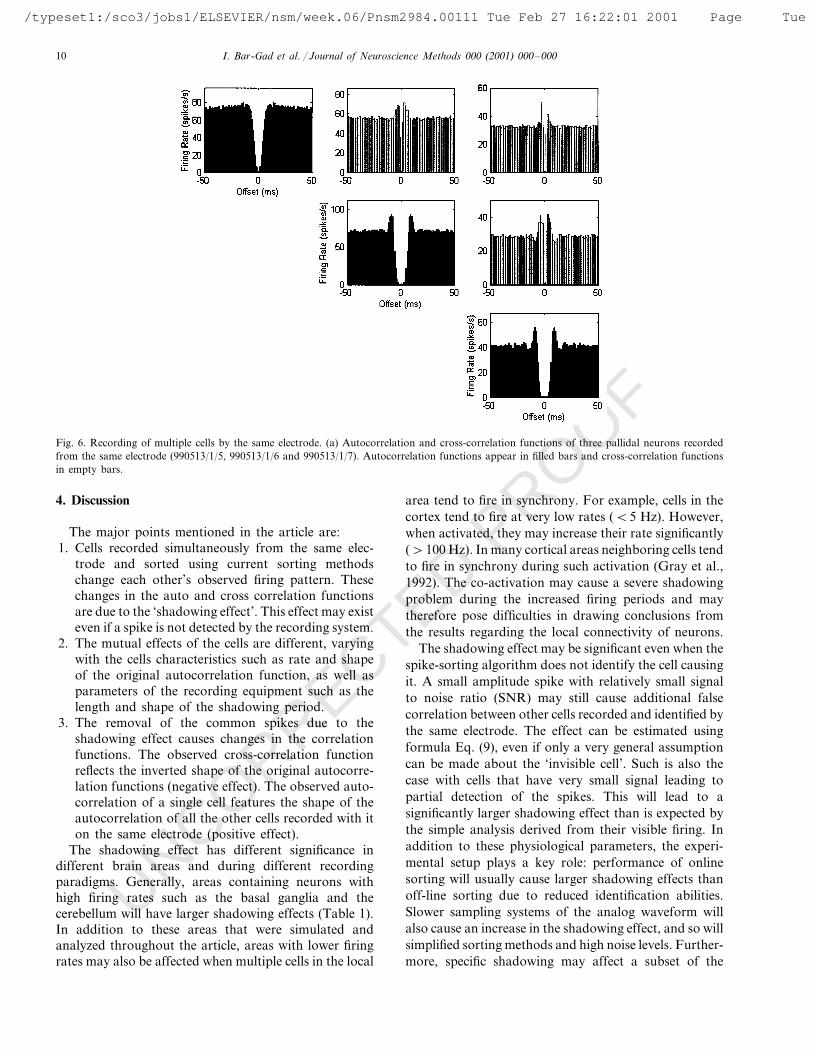
Recording from a single electrode is not limited totwo cells and may consist of multiple cells (Fig. 6). Theshadowing effect is enhanced in such cases and isevident even in areas with slower firing rates. Even ifsome of the cells are not detected by the sorting devices,they may still bare an effect on the observed firing ofthe identified cells. Assuming that n neurons arerecorded from the same electrode, the firing probabilityof any cell is affected by the other n−1 neurons
pi**=pi 5k" i
�1−pk %
a
u= −a
Si,k(u)�
. (8)
The cross correlation of any two cells is
c i, j* *(t)=c i, j* (t) 5k" i, j
<1−
pk
1−pk %u= −aa Si,k(u)
UNCORRECTED PROOF
/typeset1:/sco3/jobs1/ELSEVIER/nsm/week.06/Pnsm2984.00111 Tue Feb 27 16:22:01 2001 Page Tue
I. Bar-Gad et al. / Journal of Neuroscience Methods 000 (2001) 000–000 9
�
1− %a
u= −a
Si,k(u) ak(t+u)�=
. (9)
As before, the effects of the additional cells measuredfrom the electrode can be significant depending on theirfiring rate and characteristics.
3.4. Autocorrelation effects
The firing pattern of one neuron may cause changesin the observed firing pattern of other neurons recordedby the same electrode in addition to the previouslyshown effects on their cross-correlation. This change infiring pattern may be evident in the autocorrelation
function of the cell. The value of the autocorrelationfunction of a cell when two cells are recorded by thesame electrode is for the simple case
an*(t)=an(t)�
1−pm
1−pm
(1−am(t))n
, (10)
and for the complex case
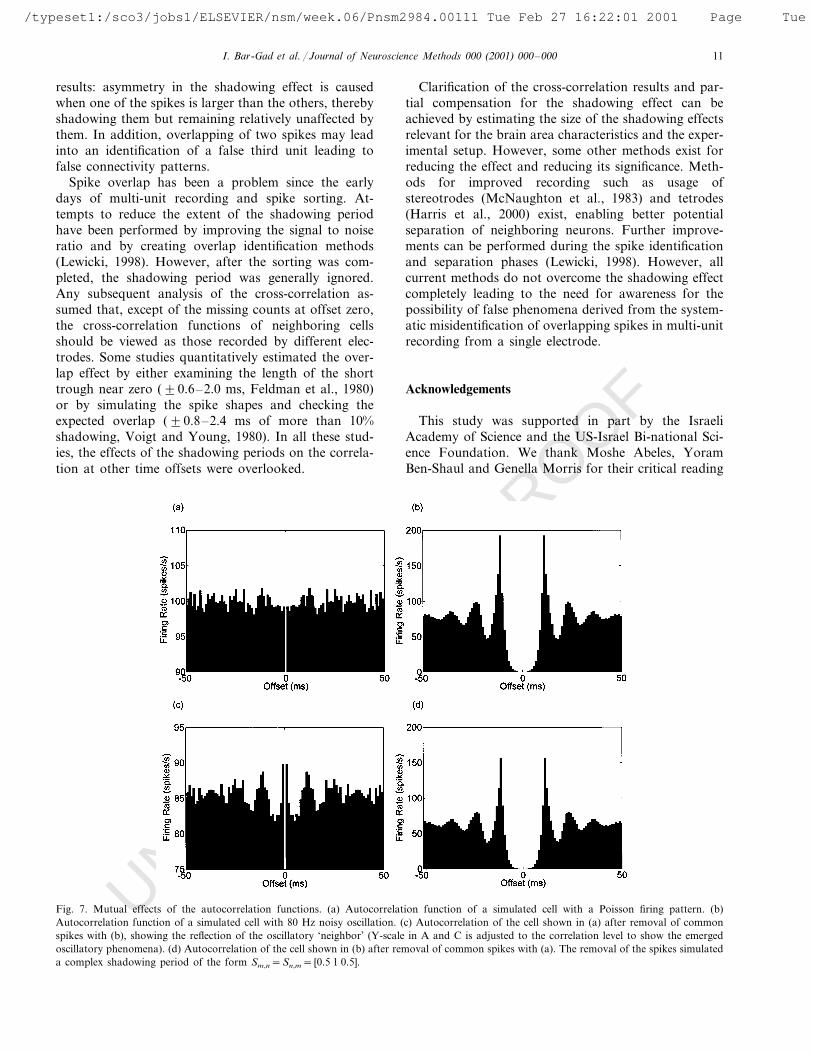
The effect will usually be seen as a uniform decreasein the correlation function. However, although the ef-fect is significantly smaller than the one reflected in thecross-correlation, whenever one of the cells has a non-flat autocorrelation function such as an oscillatory ac-tivity, it changes the actual shape of the otherautocorrelation function (Fig. 7).
an*(t)=an(t)
1−pm
�2 %u= −a
a Sm,n+%u= −aa %6= −a
a am(t−6+u) Sm,n(u) Sm,n(6)n
1−pm %u= −aa Sm,n
. (11)
Fig. 5. Quantitative analysis of the size of the peak in the cross-correlation due to the shadowing effect. The size of the effect is reflected by thedifference between the peak in the correlation and its steady state value and is color encoded showing the effect size normalized as a percent ofthe firing rate of the reference cell. (a) Assuming a 2 ms shadowing period and depending on the original firing rates; (b) Assuming a 2 msshadowing period and depending on the observed firing rates. The relative effect is larger since the observed rate is equivalent to the higher originalrate after removal of the shadowed spikes; (c) For various shadowing periods, assuming equal firing rates for both trigger and reference cells,depending on the original firing rates; (d) For various shadowing periods, assuming equal firing rates for both trigger and reference cells,depending on the observed firing rates.
UNCORRECTED PROOF
/typeset1:/sco3/jobs1/ELSEVIER/nsm/week.06/Pnsm2984.00111 Tue Feb 27 16:22:01 2001 Page Tue
I. Bar-Gad et al. / Journal of Neuroscience Methods 000 (2001) 000–00010
Fig. 6. Recording of multiple cells by the same electrode. (a) Autocorrelation and cross-correlation functions of three pallidal neurons recordedfrom the same electrode (990513/1/5, 990513/1/6 and 990513/1/7). Autocorrelation functions appear in filled bars and cross-correlation functionsin empty bars.
4. Discussion
The major points mentioned in the article are:1. Cells recorded simultaneously from the same elec-
trode and sorted using current sorting methodschange each other’s observed firing pattern. Thesechanges in the auto and cross correlation functionsare due to the ‘shadowing effect’. This effect may existeven if a spike is not detected by the recording system.
2. The mutual effects of the cells are different, varyingwith the cells characteristics such as rate and shapeof the original autocorrelation function, as well asparameters of the recording equipment such as thelength and shape of the shadowing period.
3. The removal of the common spikes due to theshadowing effect causes changes in the correlationfunctions. The observed cross-correlation functionreflects the inverted shape of the original autocorre-lation functions (negative effect). The observed auto-correlation of a single cell features the shape of theautocorrelation of all the other cells recorded with iton the same electrode (positive effect).
The shadowing effect has different significance indifferent brain areas and during different recordingparadigms. Generally, areas containing neurons withhigh firing rates such as the basal ganglia and thecerebellum will have larger shadowing effects (Table 1).In addition to these areas that were simulated andanalyzed throughout the article, areas with lower firingrates may also be affected when multiple cells in the local
area tend to fire in synchrony. For example, cells in thecortex tend to fire at very low rates (B5 Hz). However,when activated, they may increase their rate significantly(\100 Hz). In many cortical areas neighboring cells tendto fire in synchrony during such activation (Gray et al.,1992). The co-activation may cause a severe shadowingproblem during the increased firing periods and maytherefore pose difficulties in drawing conclusions fromthe results regarding the local connectivity of neurons.
The shadowing effect may be significant even when thespike-sorting algorithm does not identify the cell causingit. A small amplitude spike with relatively small signalto noise ratio (SNR) may still cause additional falsecorrelation between other cells recorded and identified bythe same electrode. The effect can be estimated usingformula Eq. (9), even if only a very general assumptioncan be made about the ‘invisible cell’. Such is also thecase with cells that have very small signal leading topartial detection of the spikes. This will lead to asignificantly larger shadowing effect than is expected bythe simple analysis derived from their visible firing. Inaddition to these physiological parameters, the experi-mental setup plays a key role: performance of onlinesorting will usually cause larger shadowing effects thanoff-line sorting due to reduced identification abilities.Slower sampling systems of the analog waveform willalso cause an increase in the shadowing effect, and so willsimplified sorting methods and high noise levels. Further-more, specific shadowing may affect a subset of the
UNCORRECTED PROOF
/typeset1:/sco3/jobs1/ELSEVIER/nsm/week.06/Pnsm2984.00111 Tue Feb 27 16:22:01 2001 Page Tue
I. Bar-Gad et al. / Journal of Neuroscience Methods 000 (2001) 000–000 11
results: asymmetry in the shadowing effect is causedwhen one of the spikes is larger than the others, therebyshadowing them but remaining relatively unaffected bythem. In addition, overlapping of two spikes may leadinto an identification of a false third unit leading tofalse connectivity patterns.
Spike overlap has been a problem since the earlydays of multi-unit recording and spike sorting. At-tempts to reduce the extent of the shadowing periodhave been performed by improving the signal to noiseratio and by creating overlap identification methods(Lewicki, 1998). However, after the sorting was com-pleted, the shadowing period was generally ignored.Any subsequent analysis of the cross-correlation as-sumed that, except of the missing counts at offset zero,the cross-correlation functions of neighboring cellsshould be viewed as those recorded by different elec-trodes. Some studies quantitatively estimated the over-lap effect by either examining the length of the shorttrough near zero (90.6–2.0 ms, Feldman et al., 1980)or by simulating the spike shapes and checking theexpected overlap (90.8–2.4 ms of more than 10%shadowing, Voigt and Young, 1980). In all these stud-ies, the effects of the shadowing periods on the correla-tion at other time offsets were overlooked.
Clarification of the cross-correlation results and par-tial compensation for the shadowing effect can beachieved by estimating the size of the shadowing effectsrelevant for the brain area characteristics and the exper-imental setup. However, some other methods exist forreducing the effect and reducing its significance. Meth-ods for improved recording such as usage ofstereotrodes (McNaughton et al., 1983) and tetrodes(Harris et al., 2000) exist, enabling better potentialseparation of neighboring neurons. Further improve-ments can be performed during the spike identificationand separation phases (Lewicki, 1998). However, allcurrent methods do not overcome the shadowing effectcompletely leading to the need for awareness for thepossibility of false phenomena derived from the system-atic misidentification of overlapping spikes in multi-unitrecording from a single electrode.
Acknowledgements
This study was supported in part by the IsraeliAcademy of Science and the US-Israel Bi-national Sci-ence Foundation. We thank Moshe Abeles, YoramBen-Shaul and Genella Morris for their critical reading
Fig. 7. Mutual effects of the autocorrelation functions. (a) Autocorrelation function of a simulated cell with a Poisson firing pattern. (b)Autocorrelation function of a simulated cell with 80 Hz noisy oscillation. (c) Autocorrelation of the cell shown in (a) after removal of commonspikes with (b), showing the reflection of the oscillatory ‘neighbor’ (Y-scale in A and C is adjusted to the correlation level to show the emergedoscillatory phenomena). (d) Autocorrelation of the cell shown in (b) after removal of common spikes with (a). The removal of the spikes simulateda complex shadowing period of the form Sm,n=Sn,m= [0.5 1 0.5].
UNCORRECTED PROOF
/typeset1:/sco3/jobs1/ELSEVIER/nsm/week.06/Pnsm2984.00111 Tue Feb 27 16:22:01 2001 Page Tue
I. Bar-Gad et al. / Journal of Neuroscience Methods 000 (2001) 000–00012
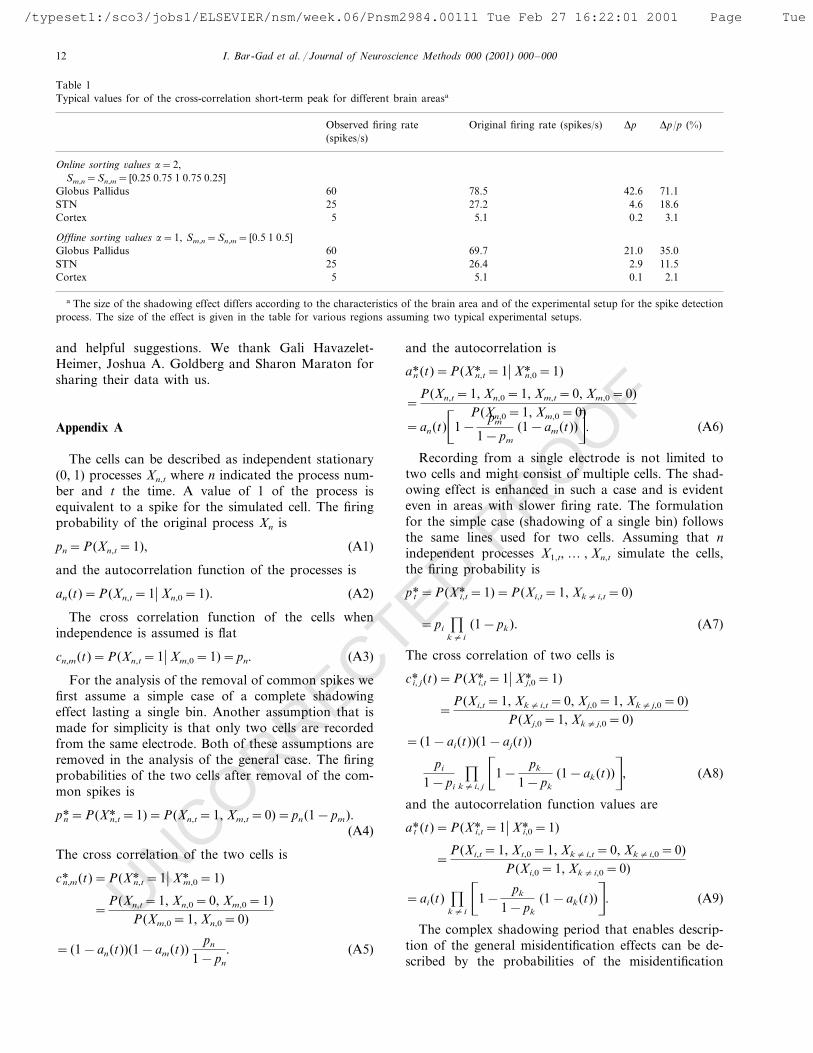
Table 1Typical values for of the cross-correlation short-term peak for different brain areasa
Observed firing rate Original firing rate (spikes/s) Dp Dp/p (%)(spikes/s)
Online sorting 6alues a=2,Sm,n=Sn,m= [0.25 0.75 1 0.75 0.25]
78.5Globus Pallidus 42.660 71.1STN 25 27.2 4.6 18.6
5.1 0.25 3.1Cortex
Offline sorting 6alues a=1, Sm,n=Sn,m= [0.5 1 0.5]Globus Pallidus 60 69.7 21.0 35.0
26.4 2.925 11.5STN5.1 0.1Cortex 2.15
a The size of the shadowing effect differs according to the characteristics of the brain area and of the experimental setup for the spike detectionprocess. The size of the effect is given in the table for various regions assuming two typical experimental setups.
and helpful suggestions. We thank Gali Havazelet-Heimer, Joshua A. Goldberg and Sharon Maraton forsharing their data with us.
Appendix A
The cells can be described as independent stationary(0, 1) processes Xn,t where n indicated the process num-ber and t the time. A value of 1 of the process isequivalent to a spike for the simulated cell. The firingprobability of the original process Xn is
pn=P(Xn,t=1), (A1)
and the autocorrelation function of the processes is
an(t)=P(Xn,t=1� Xn,0=1). (A2)
The cross correlation function of the cells whenindependence is assumed is flat
cn,m(t)=P(Xn,t=1� Xm,0=1)=pn. (A3)
For the analysis of the removal of common spikes wefirst assume a simple case of a complete shadowingeffect lasting a single bin. Another assumption that ismade for simplicity is that only two cells are recordedfrom the same electrode. Both of these assumptions areremoved in the analysis of the general case. The firingprobabilities of the two cells after removal of the com-mon spikes is
pn*=P(Xn,t* =1)=P(Xn,t=1, Xm,t=0)=pn(1−pm).(A4)
The cross correlation of the two cells is
cn,m* (t)=P(Xn,t* =1� Xm,0* =1)
=P(Xn,t=1, Xn,0=0, Xm,0=1)
P(Xm,0=1, Xn,0=0)
= (1−an(t))(1−am(t))pn
1−pn
. (A5)
and the autocorrelation is
an*(t)=P(Xn,t* =1� Xn,0* =1)
=P(Xn,t=1, Xn,0=1, Xm,t=0, Xm,0=0)
P(Xn,0=1, Xm,0=0)=an(t)
�1−
pm
1−pm
(1−am(t))n
. (A6)
Recording from a single electrode is not limited totwo cells and might consist of multiple cells. The shad-owing effect is enhanced in such a case and is evidenteven in areas with slower firing rate. The formulationfor the simple case (shadowing of a single bin) followsthe same lines used for two cells. Assuming that nindependent processes X1,t, … , Xn,t simulate the cells,the firing probability is
pt*=P(Xi,t* =1)=P(Xi,t=1, Xk" i,t=0)
=pi 5k" i
(1−pk). (A7)
The cross correlation of two cells is
c i, j* (t)=P(Xi,t* =1� Xj,0* =1)
=P(Xi,t=1, Xk" i,t=0, Xj,0=1, Xk" j,0=0)
P(Xj,0=1, Xk" j,0=0)
= (1−ai(t))(1−aj(t))
pi
1−pi
5k" i, j
�1−
pk
1−pk
(1−ak(t))n
, (A8)
and the autocorrelation function values are
at*(t)=P(Xi,t* =1� Xi,0* =1)
=P(Xi,t=1, Xt,0=1, Xk" i,t=0, Xk" i,0=0)
P(Xi,0=1, Xk" i,0=0)
=ai(t) 5k" i
�1−
pk
1−pk
(1−ak(t))n
. (A9)
The complex shadowing period that enables descrip-tion of the general misidentification effects can be de-scribed by the probabilities of the misidentification
UNCORRECTED PROOF
/typeset1:/sco3/jobs1/ELSEVIER/nsm/week.06/Pnsm2984.00111 Tue Feb 27 16:22:01 2001 Page Tue
I. Bar-Gad et al. / Journal of Neuroscience Methods 000 (2001) 000–000 13
Sn,m(t) of neuron m caused by neuron n at offset t. Anauxiliary variable that is important is the sum of theseeffects:
Tn,m=pn %a
u= −a
Sn,m(u). (A10)
The firing probability for the general case can be de-scribed as
pn*=P(Xn,0* =1)=P(Xn,0=1)−P(Xn,0=1, Xn,0* =0)
=pn−pn pm %a
u= −a
Sm,n=pn (1−Tm,n). (A11)
The cross-correlation of two neurons is
References
Abeles M. A journey into the brain. In: Inbar GF, editor. SignalAnalysis and Pattern Recognition in Biomedical Engineering.New-York: John Wiley & Sons, 1974:41–59.
Abeles M. Corticonics — Neural Circuits of the Cerebral Cortex.Cambridge: Cambridge University Press, 1991.
Abeles M, Goldstein MHJ. Multispike train analysis. IEEE TransBiomed Eng 1977;65:762–73.
Asanuma H. The Motor Cortex. New-York: Raven Press, 1989:1–189.Atiya AF. Recognition of multiunit neural signals. IEEE Trans Biomed
Eng 1992;39:723–9.Bar-Gad I, Ritov Y, Bergman H. The neuronal refractory period causes
a short-term peak in the autocorrelation function. J. Neurosci.Methods. 2000, In Press.
Chandra R, Optican LM. Detection, classification, and superpositionresolution of action potentials in multiunit single-channel record-ings by an on-line real-time neural network. IEEE Trans BiomedEng 1997;44:403–12.
DeLong MR. Activity of pallidal neurons during movement. J Neuro-physiol 1971;34:414–27.
Dickson JW, Gerstein GL. Interactions between neurons in auditorycortex of the cat. J Neurophysiol 1974;37:1239–61.
Eggermont JJ. The Correlative Brain. Theory and Experiment inNeuronal Interaction. Berlin: Springer-Verlag, 1990.
Eggermont JJ. Neural interaction in cat primary auditory cortex.Dependence on recording depth, electrode separation, and age. JNeurophysiol 1992;68:1216–28.
Fee MS, Mitra PP, Kleinfeld D. Variability of extracellular spikewaveforms of cortical neurons. J Neurophysiol 1996;76:3823–33.
Feldman JL, Sommer D, Cohen MI. Short time scale correlations
between discharges of medullary respiratory neurons. J Neurophys-iol 1980;43:1284–95.
Gray CM, Engel AK, Konig P, Singer W. Synchronization of oscilla-tory neuronal responses in cat striate cortex: temporal properties.Vis Neurosci 1992;8:337–47.
Harris KD, Henze DA, Csicsvari J, Hirase H, Buzsaki G. Accuracyof tetrode spike separation as determined by simultaneous intracel-lular and extracellular measurements. J Neurophysiol 2000;84:401–14.
Heierli P, de-Ribaupierre F, de-Ribaupierre Y. Functional propertiesand interactions of neuron pairs simultaneously recorded in themedial geniculate body of the cat. Hear Res 1987;25:209–25.
Lewicki MS. Bayesian modeling and classification of neural signals.Neural Comp 1994;6:1005–30.
Lewicki MS. A review of methods for spike sorting: the detection andclassification of neural action potentials. Network 1998;9:R53–78.
MacGregor RJ. Neural and Brain Modeling. San-Diego: AcademicPress Inc., 1987.
MacGregor RJ, Miller SW, Groves PM. Slow rhythms and correlationsin spike trains from midbrain neurons. Exp Neurol 1975;47:581–98.
McNaughton BL, O’Keefe J, Barnes CA. The stereotrode: a newtechnique for simultaneous isolation of several single units in thecentral nervous system from multiple unit records. J NeurosciMethods 1983;8:391–7.
Nini A, Feingold A, Slovin H, Bergman H. Neurons in the globuspallidus do not show correlated activity in the normal monkey, butphase-locked oscillations appear in the MPTP model of parkinson-ism. J Neurophysiol 1995;74:1800–5.
Quirk MC, Wilson MA. Interaction between spike waveform classifi-cation and temporal sequence detection. J Neurosci Methods1999;94:41–52.
Raz A, Vaadia E, Bergman H. Firing pattern and correlations ofspontaneous discharge of pallidal neurons in the normal and thetremulous MPTP vervet model of parkinsonism, J. Neurosci., 2000;In press.
Vaadia E, Ahissar E, Bergman H, Lavner Y. Correlated activity ofneurons: a neural code for higher brain functions? In: Kruger J,editor. Neuronal Cooperativity. Berlin: Springer-Verlag, 1991:249–79.
Voigt HF, Young ED. Evidence of inhibitory interactions betweenneurons in dorsal cochlear nucleus. J Neurophysiol 1980;44:76–96.
Wilson CJ, Young SJ, Groves PM. Statistical properties of neuronalspike trains in the substantia nigra: cell types and their interactions.Brain Res 1977;136:243–60.
Zouridakis G, Tam DC. Multi-unit spike discrimination using wavelettransforms. Comput Biol Med 1997;27:9–18.
cn,m(t)=P(Xn,t* =1� Xm,0* =1)
=P(Xn,t=1, Xm,0=1) P(Xn,t* =1� Xn,t=1, Xm,0=1) P(Xm,0* =1� Xn,t=1, Xm,0=1)
P(Xm,0=1)
=pm
1−Tm,n
�1− %
a
u= −a
am(t+u) Sm,n(u)� �
1− %a
u= −a
an(t−u) Sm,n(u)�
(A12)
The autocorrelation is,
an*(t)=P(Xn,t* =1� Xn,0* =1)
=P(Xn,t=1 Xn,0=1) P(Xn,t* =1, Xn,0* =1� Xn,t=1, Xn,0=1)
P(Xm,0=1)
=an(t)1−pm
�2 %u= −a
a Sm,n+%u= −aa %6= −a
a am(t−6+u) Sm,n(u) Sm,n(6)n
1−pm %u= −aa Sm,n
.
.
Related Documents