FACTSHEET 31 JULY 2016

Welcome message from author
This document is posted to help you gain knowledge. Please leave a comment to let me know what you think about it! Share it to your friends and learn new things together.
Transcript

FACTSHEET 31 JULY 2016

Commentary - Equity Outlook
Equity Markets Index % Change % Change P/EYTD MTD
Nifty 8,638.50 8.71% 4.23% 18.09
Sensex 28,051.86 7.41% 3.90% 17.64
Dow Jones 18,432.24 5.78% 2.80% 17.51
Shanghai 2,979.34 -15.82% 1.70% 13.94
Nikkei 16,569.27 -12.95% 6.38% 16.83
Hang Sang 21,891.37 -0.11% 5.28% 12.48
FTSE 6,724.43 7.72% 3.38% 17.51
MSCI E.M. (USD) 873.47 9.99% 4.72% 13.31
MSCI D.M.(USD) 1,721.79 3.55% 4.15% 17.46
MSCI India (INR) 1,055.91 7.08% 4.64% 19.02
Currency & Last Price % Change % Change Commodities YTD MTD
India Macro Analysis Latest
Equity Flows USD Mn
Source: Bloomberg, SEBI
31 July 2016
04
GDP 7.90
IIP 1.20
Inflation (WPI Monthly) 1.62
Inflation (CPI Monthly) 5.77
Commodity (CRB Index) 408.07
FII (USD min)
YTD 4,645.11
MTD 1,689.50
*DII (USD min)
YTD 1,415.17
MTD 34.98
USD / INR
Dollar Index
Gold
Crude OIL
WTI (Nymex)
Brent Crude
66.995 1.27% -0.78%
95.53 -3.14% -0.64%
1,351.00 27.28% 2.18%
41.60 12.31% -13.93%
42.46 13.89% -14.53%
Equity
India has been a beneficiary of improved global and local liquidity. Nifty has generated close to ~25% returns post the budget session. Total FII inflow from April-July 2016 stands at INR ~25,000 cr v/s outflow of INR ~14,000 cr last year. India clearly ranks high in the investment preference of Global fund houses. Most of this has been shift from China which continues to see FII outflows.
Fiscal and monetary policies across the world remain benign. Central Bankers and policy makers continue to remain cautious on growth. Japan's Prime Minister Shinzo Abe unveiled a surprisingly large $265 billion stimulus package to reflate the world's third-largest economy, therefore also adding pressure on the central bank of the country to match the measures with monetary stimulus. The Federal Reserve left interest rates unchanged however data there has started showing positive trends. The US data for housing and labour market came strong for the month of June 2016. Europe however still remains a cause of worry, there is a lot of uncertainty after the Brexit result and the effects of which are still unknown. On the local front, with the change in RBI governor market is expecting easier fiscal and monetary policy going forward. This can be seen in 10-Year bond yields which are near 3 years lows.
The government continues to push on its reform agenda in the monsoon session. The government has gained traction in GST bill and if cleared it will have huge positive contribution to sentiments. Although it will have near term challenges in implementation it will contribute positively to GDP growth in long run.
Companies started reporting their Q1FY17 numbers. The results have been a mixed bag. Indian IT companies, which are always the first to declare numbers, have reported slowdown in growth. Most of the slowdown can be attributed to uncertain global environment. The execution cycles are getting elongated as there is lack of visibility among clients and decision making is getting delayed. Auto numbers sawuptick after a lull of several quarters especially on the two-wheeler front. Two-wheeler as an industry grew by 7% volume in the current quarter. Consumer staples however have been impacted again this quarter by slowdown in rural portfolio. This trend is expected to reverse in second half with
thgood monsoon, increased government spending and 7 pay commission pay-outs. Rainfall has picked up this month and deficit which was -11% at the end of last month now stands at ~1% surplus. The geographical distribution of the rainfall has also been normal.
Going Forward
Markets have been on an upswing post the budget and Nifty is up ~25% in last five months. There is lot of catch up that has happened in valuation multiples. On P/E multiple we are already over 1SD (standard deviation) above the historical averages and on P/B we are close to historical averages.
For these levels to sustain and markets to generate sustainable positive returns, companies should start delivering good profit growth. The good thing is that balance sheets are no more expanding at the pace they were before. Companies are focussing lot more on generating cash flows and de-leveraging stressed balance sheets. We are closely monitoring the results going forward and our endeavour is to align ourselves with the companies that have good visibility of growth, lesser valuation risks and strong balance sheets.

Commentary - Debt Outlook
05
Debt
All stars aligned for the Indian bond market which experienced its best month in the last 3 years with the 10 yr benchmark rallying by 29bps to its 3yr low at 7.17%. This was
primarily on the back of market speculation that the next RBI governor could follow a more accommodative stance than outgoing governor Raghuram Rajan even at the same
data points. Positive liquidity in the system also supported the markets as RBI FX forwards matured & currency leakage seen in April-June quarter came back into the system.
From an average deficit of INR 78,000 crs in April – June quarter, July saw a surplus of INR 12,000 crs in systemic liquidity.
Contrary to market expectations, global risk environment turned benign after Brexit on expectations of easing/stimulus from G4 central banks. July saw the highest monthly
inflow of INR 6,845crs in this CY, after witnessing outflows of INR 8820crs FYTD.
On the inflation front, CPI continued to remain high at 5.77% in June'16 compared to 5.70% in May. The increase in inflation was on account of increase in food prices especially
vegetables, sugar, egg and pulses. Food prices rose by 7.4% compared to 7.2% in May. Headline WPI too rose sharply to 1.6% in June'16 compared to 0.8% in May'16 owing to
increase in commodity and food prices.
According to IMD, monsoon covered the whole country as of July 13 – two days ahead of normal schedule. Rainfall trend remains normal with cumulative rainfall tracking long
period average (i.e. 0% deficit/surplus). Kharif acreage has improved, with sowing as on July 29 being 6.3% higher than the same period last year led largely by pulses acreage
which has surged by 41%YoY. Water storage levels, while still lower than a year ago ((-)16.1%yoy), have been improving with the live storage in 91 important reservoirs in India at
38% of total live storage capacity of these reservoirs for theweek ending 28 July compared to 15% on 30 June.
Going Forward
The recent rally in bond yields has been largely driven on hope rather than any meaningful change in macro-economic framework. Among theweb of hopes that the market has
weaved itself into, there is a hope of a dovish RBI governor who will cut rates for the same inflation data/modify the CPI inflation targeting to combine WPI or change the target
itself. What investors need to keep in mind is that the government has largely been maintaining an anti inflationary bias and actions of the government point in that direction
whether it's rural wage or MSP price setting and its actions on fiscal consolidation. The 4+/-2% target has been given by the government itself. Moreover, we are likely to see
formation of MPC which will decide the future course of monetary policy. The hope rally which we have witnessed in the last couple of months could at least partly dissipate if
market's expectations are not met. Our underlying view is that the scope of incremental downward pressures on inflation are no longer sustaining and hence does not build a
case for any sharp rate cuts; although a more dovish Governor may find some 'room' while hitherto there was none. We continue to recommend products which are likely to
benefit from the liquidity framework of the RBI rather than rate cut expectations. However, the current environment calls for a more tactical positioning to take advantage of the
market dynamics as the “opportunity cost” of staying out of the market is significant. We have also participated in the current rally via tactically elongating maturities in our bond
and gilt portfolios. However, we are not permanently aligned to this hope trade & will look to book profits when we believe that the market has become overstretched. From a
portfolio standpoint, we continue to favour the 5-9 year segment of the G Sec yield curve, which currently offers the best risk-reward potential. This is especially true post the bull
flattening experienced in the most recent bond move.
31 July 2016

IDFC Dynamic Equity Fund
31 July 2016
06
FUND FEATURES
Nature: Equity
Monthly Avg AUM: 611.75 Crores
Inception Date: 10 October 2014
Fund Manager: Equity Portion: Ms. Meenakshi Dawar (w.e.f. 7th
September 2015) Debt Portion: Mr. Arvind Subramanian (w.e.f. 09th
November 2015)
About the Fund: IDFC Dynamic Equity Fund is an equity fund which
aims to dynamically manage the equity and debt exposure based
on the month-end weighted average PE ratio and 200 Day Moving
Average (DMA) of Nifty 50.
Other Parameter:
Standard Deviation (Annualized) 6.69%
Portfolio Turnover
Equity 0.38
Aggregate^ 4.86
Benchmark : Nifty 50 and CRISIL Balanced Fund – Aggressive Index
Asset Allocation: The weighted average PE of Nifty 50 (standalone)
as on 31st July 2016 was 23.62 and the 200DMA was 7845.71 (< spot
Nifty). The allocation for the month of August will be around these
levels:
`
Money Market Instruments
35%
Gross Equity 65% - Equity Futures 17.5%(Net Equity: 47.5%)
*The portfolio shall be rebalanced on the first business day of every month
* Risk-free rate assumed to be FBIL OVERNIGHT MIBOR as on 29th July 2016 is 6.59%. Ratios calculated on the basis of monthly data Since Inception. ̂ Portfolio Turnover ratio is calculated as Lower of purchase or sale during the period / Average AUM for the last one year (includes Fixed Income securities and Equity derivatives). The portfolio shall be rebalanced on the first business day of every month.
Prudent investing demands the exact opposite in terms of behavior i.e. moving out of equity, as markets get expensive and moving into
equity when markets get cheap. IDFC Dynamic Equity fund helps the investor “Do The Opposite”.
If Nifty 50 weighted average PE isEquity Component of the portfolio
Below 13.7 100% 65-83%
13.7-15.7 83-100% 48-65%
15.7-18.4 65-83% 30-48%
18.4-21.3 48-65% 30%
Above 21.3 30-48% 30%
If 200DMA <Spot index If 200DMA >Spot index
Ÿ When the model indicates:
Bullish pattern 100% Equity
Expensive Valuation Restrict the equity exposure to 65% and if necessary will hedge this equity exposure by shorting the index
(futures) up to the extent of 35%
Ÿ Equity exposure will be in proportion to the Nifty 50 stocks
Ÿ Balance will be invested predominantly in money market instruments
Ÿ Portfolio shall be rebalanced monthly
Investment Strategy: The portfolio is guided by an underlying quantitative model based on the month-end weighted average PE ratio and 200 Day Moving Average (DMA) of the Nifty 50. The equity exposure of the fund is determined as follows:
Buying Low and Selling High consistently is easier said than done!
Historically, most investors have got attracted to investing in the markets at times when the markets have been in the expensive zone (high PE).
Source: Daily Sensex P/E (price from BSE, trailing 12 months earnings from Bloomberg) for the period 1st October ‘99 to 31st March ‘16. Net Inflow data from AMFI
Y = 19%G = 1% R = 80%
8

IDFC Dynamic Equity Fund
31 July 2016
07
PeriodScheme
Returns ^Benchmark Returns #
Alternate Benchmark Returns ##
Current Value (`) of Standard Investment of `10,000
Benchmark# Alternate Benchmark##
Scheme^NAV per Unit (`)
Oct 10, 2014 (Since Inception) 10.0000 6.45% 5.97% 3.12% 11,137 11,051 10,544
Jun 30, 2015 To Jun 30, 2016 10.8462 2.68% 4.82% -0.96% NA
PeriodScheme
Returns ^Benchmark Returns #
Alternate Benchmark Returns ##
Current Value (`) of Standard Investment of `10,000
Benchmark# Alternate Benchmark##
Scheme^NAV per Unit (`)
Oct 10, 2014 (Since Inception) 10.0000 4.99% 5.97% 3.12% 10,876 11,051 10,544
Jun 30, 2015 To Jun 30, 2016 10.7410 1.26% 4.82% -0.96% NA
Direct Plan Growth Option (NAV as on ` per Unit)June 30, 2016 11.1370Regular Plan NAV as on June , 2016 Growth Option ( ` per Unit) 30 10.8762
Fund Performance
Greater than 1 year returns are Compounded Annualised Returns. ̂ Past performance may or may not be sustained in future # , ## CRISIL Balanced Fund – Aggressive Index Performance of the funds managed by the fund manager are given on page No. 42Nifty 50.
Industry Allocation:
Banks 15.80%
Software 9.62%
Auto 7.29%
Consumer Non Durables 6.86%
Finance 4.52%
Pharmaceuticals 4.51%
Petroleum Products 4.14%
Construction Project 2.66%
Cement 2.24%
Power 1.89%
Telecom - Services 1.24%
Minerals/Mining 0.86%
Oil 0.82%
Media & Entertainment 0.57%
Ferrous Metals 0.50%
Auto Ancillaries 0.48%
Transportation 0.44%
Telecom - Equipment & Accessories 0.44%
Gas 0.37%
Non - Ferrous Metals 0.36%
Industrial Capital Goods 0.28%
(IDFC - DEF) An Open Ended Equity FundTop 10 Holdings:SIP Performance:
HDFC Bank Banks 5.19
HDFC Finance 4.52
Infosys Software 4.47
ITC Consumer Non Durables 4.44
Reliance Industries Petroleum Products 3.49
ICICI Bank Banks 3.18
Tata Consultancy Services Software 2.90
Larsen & Toubro Construction Project 2.66
Tata Motors Auto 2.03
Axis Bank Banks 1.90
Top 10 Equity 34.80
Other Equity 31.09
Corporate Bond 5.09
Commercial Paper 18.91
Margin Fixed Deposit 3.34
Certificate of Deposit 3.16
Call 0.12
Net Current Asset 3.50
Grand Total 100.00
Equity Futures Total -18.30
“For complete list of holdings please visit our website www.idfcmf.com”
Name Industries % of NAV
NAV (`) : (as on 29th July 2016)
Regular Plan Growth 11.1176Regular Plan Dividend 10.6315Direct Plan Growth 11.3961Direct Plan Dividend 10.8835
IDFC Dynamic Equity Fund
Investors understand that their principal will be at Moderately High risk
This product is suitable for investors who are seeking*:
To create wealth over a long period of timeInvestment in equity &equity related instruments and for defensive purposes in the equity derivatives. The scheme may also invest in Debt & Money market instruments.
Ÿ
Ÿ
*Investors should consult their financial advisers if in doubt about whether the product is suitable for them.
Riskometer
1,20,000 NA NA 2,10,000 1,23,550 NA NA 2,16,248 5.55% NA NA 3.25%1,25,965 NA NA 2,19,195
9.37% NA NA 4.78%
1,25,632 NA NA 2,13,9248.84% NA NA 2.05%
Total Amount Invested (`)Total Value as on June 30, 2016 (`)Fund ReturnsTotal Value of CRISIL Balanced Fund – Aggressive IndexCRISIL Balanced Fund – Aggressive Index ReturnsTotal Value of Nifty 50Nifty 50 Returns
1 Year 3 Years
Monthly SIP of ` 10000 in IDFC Dynamic Equity - Regular Plan - Growth
5 Years
Since Inception
Oct 10, 2014
Past performance may or may not be sustained in future. Returns greater than 1 year period are compounded annualized. Dividends are assumed to be reinvested and bonus is adjusted. Load is not taken into consideration. For SIP returns, monthly investment of equal amounts invested on the 1st day of every month has been considered. Data as on June 30, 2016.

Lumpsum InvestmentLumpsum Investment
PeriodScheme
Returns ^Benchmark Returns #
Alternate Benchmark Returns ##
Current Value (`) of Standard Investment of `10,000
Benchmark#
Alternate Benchmark##
Scheme^
NAV per
Unit (`)
Aug 09, 2005 (Since Inception) 10.0000 11.52% 12.35% 12.40% 32,823 35,582 35,743Jun 30, 2015 To Jun 30, 2016 31.7022 3.53% 0.41% -0.96%Jun 30, 2014 To Jun 30, 2015 27.2731 16.24% 12.01% 9.95% NAJun 28, 2013 To Jun 30, 2014 20.8720 30.48% 34.23% 30.09%
PeriodSchemeReturns^
Benchmark Returns #
Alternate Benchmark Returns ##
Current Value (`) of Standard Investment of `10,000
Benchmark#
Alternate Benchmark##
Scheme^
NAV per
Unit (`)
Jan 01, 2013 (Since Inception) 22.8039 12.15% 10.91% 9.94% 14,929 14,364 13,927Jun 30, 2015 To Jun 30, 2016 32.2554 5.55% 0.41% -0.96%Jun 30, 2014 To Jun 30, 2015 27.5037 17.28% 12.01% 9.95% NAJun 28, 2013 To Jun 30, 2014 20.9376 31.17% 34.23% 30.09%
FUND FEATURES
Nature: Equity
Monthly Avg AUM: ̀ 232.78 Crores
Inception Date: 9 August 2005
Fund Manager: Mr. Anoop Bhaskar (w.e.f. 30th April 2016)
About the Fund: IDFC Classic Equity fund invests in both large cap and mid cap companies. The focus of the fund is to build a portfolio of Quality companies while being cognizant of the relative valuation.
Other Parameter:Beta 0.90
R Square 0.88
Standard Deviation (Annualized) 14.79%
Sharpe* 0.78
Portfolio TurnoverEquity 1.02
Aggregate^ 1.34
Benchmark : S&P BSE 200
IDFC Classic Equity Fund
08
Industry Allocation:
Banks 18.12%Petroleum Products 7.19%Auto 7.00%Software 6.92%Cement 6.77%Pharmaceuticals 6.74%Consumer Non Durables 6.60%Power 3.83%Consumer Durables 3.38%Services 3.02%Miscellaneous 2.84%Construction Project 2.72%Hotels, Resorts And Other Recreational Activities 2.62%Oil 1.94%Auto Ancillaries 1.60%Media & Entertainment 1.58%Industrial Capital Goods 1.12%Chemicals 0.94%Construction 0.56%
(IDFC - CEF) An Open Ended Equity Fund
Top 10 Holdings:
HDFC Bank Banks 6.85
Infosys Software 4.21
IndusInd Bank Banks 3.16
ICICI Bank Banks 3.15
Aditya Birla Nuvo Services 3.02
ITC Consumer Non Durables 2.98
Axis Bank Banks 2.91
Sun Pharmaceuticals Industries Pharmaceuticals 2.37
Deccan Cements Cement 2.32
Tata Motors Auto 2.14
“For complete list of holdings please visit our website www.idfcmf.com”
Name Industries % of NAV
NAV (`) : (as on 29th July 2016)
31 July 2016
Regular Plan Growth 34.4698
Regular Plan Dividend 13.8553
Direct Plan Growth 35.7968
Direct Plan Dividend 15.0885
* Risk-free rate assumed to be 6.59% (FBIL OVERNIGHT MIBOR as on , 2016).
Portfolio Turnover ratio is calculated as Lower of purchase or sale during the period / Average AUM for the last one year (includes Fixed Income securities and Equity derivatives).
29th July Ratios calculated on the basis of 3 years history of monthly data. ^
Greater than 1 year returns are Compounded Annualised Returns. ̂ Past performance may or may not be sustained in future # S&P BSE 200, ## Nifty 50. Performance of the funds managed by the fund manager are given on page No. 40
Direct Plan Growth Option (NAV as on ` per Unit)June 30, 2016 34.0448Regular Plan NAV as on Growth Option ( ` per Unit)June 30, 2016 32.8225Fund Performance
IDFC Classic Equity Fund
Riskometer
Investors understand that their principal will be at Moderately High risk
This product is suitable for investors who are seeking*:
Create wealth over a long period of time.
Investment predominantly in equity and equity related instruments across market capitalisation.
Ÿ
Ÿ
*Investors should consult their financial advisers if in doubt about whether the product is suitable for them.
1 Year 3 YearsMonthly SIP of ̀ 10000 in IDFC Classic Equity Fund - Regular Plan - Growth
5 Years 7 Years 10 YearsSince
InceptionAug 09, 2005
SIP Performance
Total Amount Invested (`)Total Value as on June 30, 2016 (`)Fund ReturnsTotal Value of S&P BSE 200S&P BSE 200 ReturnsTotal Value of Nifty 50 IndexNifty 50 Index Returns
1,20,000 3,60,000 6,00,000 8,40,000 12,00,000 13,10,000 1,29,539 4,35,390 8,37,705 12,33,041 19,93,193 22,94,540 15.11% 12.76% 13.32% 10.79% 9.80% 9.86%1,26,111 4,20,345 8,05,027 11,88,017 19,81,614 23,08,879 9.60% 10.34% 11.71% 9.74% 9.69% 9.96%1,25,632 4,06,397 7,75,087 11,52,292 19,12,086 22,37,2358.84% 8.04% 10.19% 8.89% 9.01% 9.42%
Past performance may or may not be sustained in future. Returns greater than 1 year period are compounded annualized. Dividends are assumed to be reinvested and bonus is adjusted. Load is not taken into consideration. For SIP returns, monthly investment of equal amounts invested on the 1st day of every month has been considered. Data as on June 30, 2016.

FUND FEATURESNature: EquityMonthly Avg AUM: ̀ 1325.21 Crores
Inception Date: 7 March 2008Fund Manager: Mr. Anoop Bhaskar (w.e.f. 30th April 2016) About the Fund: IDFC Sterling Equity Fund is a mid cap fund that focuses on active stock selection strategy.Other Parameter:Beta 0.94R Square 0.85Standard Deviation (Annualized) 17.88%Sharpe* 1.12Portfolio TurnoverEquity 0.61Aggregate^ 0.71Benchmark : Nifty Free Float Midcap 100
IDFC Sterling Equity Fund
09
(IDFC - SEF) An Open Ended Equity Fund
Top 10 Holdings:
Name Industries % of NAV
The Ramco Cements Cement 6.11
Bharti Retail Miscellaneous 3.77
IndusInd Bank Banks 3.54
KEI Industries Industrial Products 3.45
KEC International Construction Project 3.42
VRL Logistics Transportation 3.14
Zee Entertainment Enterprises Media & Entertainment 3.11
Bajaj Finance Finance 3.03
Engineers India Construction Project 2.95
PVR Media & Entertainment 2.82
“For complete list of holdings please visit our website www.idfcmf.com”
Industry Allocation:
Construction Project 11.21%Cement 8.05%Banks 6.97%Media & Entertainment 6.88%Industrial Capital Goods 6.73%Pharmaceuticals 6.28%Auto Ancillaries 5.67%Consumer Non Durables 5.36%Transportation 4.60%Consumer Durables 4.49%Industrial Products 4.46%Finance 4.30%Miscellaneous 3.77%Petroleum Products 3.40%Retailing 3.22%Software 3.17%Chemicals 2.66%Hotels, Resorts And Other Recreational Activities 2.54%Gas 1.19%Textile Products 0.70%
31 July 2016
NAV (`) : (as on 29th July 2016)Regular Plan Growth 38.1466Regular Plan Dividend 17.0650Direct Plan Growth 39.2492Direct Plan Dividend 17.6735
Past performance may or may not be sustained in future. Returns greater than 1 year period are compounded annualized. Dividends are assumed to be reinvested and bonus is adjusted. Load is not taken into consideration. For SIP returns, monthly investment of equal amounts invested on the 1st day of every month has been considered. Data as on June 30, 2016.
* Risk-free rate assumed to be 6.59% (FBIL OVERNIGHT MIBOR as on 29th July, 2016).
Portfolio Turnover ratio is calculated as Lower of purchase or sale during the period / Average AUM for the last one year (includes Fixed Income securities and Equity derivatives).
Ratios calculated on the basis of 3 years history of monthly data. ^
Greater than 1 year returns are Compounded Annualised Returns. ̂ Past performance may or may not be sustained in future. # Nifty Free Float Midcap 100, ## Nifty 50. Performance of the funds managed by the fund manager are given on page No. 40
Direct Plan Growth Option (NAV as on per Unit)June 30, 2016 ` 36.9497Regular Plan NAV as on Growth Option ( ` per Unit)June 30, 2016 35.9325Fund Performance
IDFC Sterling Equity Fund
Riskometer
Investors understand that their principal will be at Moderately High risk
This product is suitable for investors who are seeking*:
Create wealth over a long period of time.Investment predominantly in equity and equity related instruments in the mid cap segment
Ÿ
Ÿ
*Investors should consult their financial advisers if in doubt about whether the product is suitable for them.
Lumpsum InvestmentLumpsum Investment
PeriodScheme
Returns ^Benchmark Returns #
Alternate Benchmark Returns ##
Current Value (`) of Standard Investment of `10,000
Benchmark#
Alternate Benchmark##
Scheme^
NAV per
Unit (`)
Mar 07, 2008 (Since Inception) 10.0000 16.62% 9.48% 6.86% 35,933 21,252 17,369Jun 30, 2015 To Jun 30, 2016 36.1433 -0.58% 6.20% -0.96%Jun 30, 2014 To Jun 30, 2015 28.9452 24.87% 17.24% 9.95% NAJun 28, 2013 To Jun 30, 2014 19.4061 48.83% 50.79% 30.09%
PeriodSchemeReturns^
Benchmark Returns #
Alternate Benchmark Returns ##
Current Value (`) of Standard Investment of `10,000
Benchmark#
Alternate Benchmark##
Scheme^
NAV per
Unit (`)
Jan 01, 2013 (Since Inception) 21.8912 16.15% 14.51% 9.94% 16,879 16,061 13,927Jun 30, 2015 To Jun 30, 2016 36.8921 0.16% 6.20% -0.96%Jun 30, 2014 To Jun 30, 2015 29.3017 25.90% 17.24% 9.95% NAJun 28, 2013 To Jun 30, 2014 19.4722 50.14% 50.79% 30.09%
1 Year 3 YearsMonthly SIP of 10000 in IDFC SterlingEquity Fund -Regular Plan - Growth 5 Years 7 Years
Since Inception
Mar 07, 2008
SIP Performance
Total Amount Invested (`)Total Value as on June 30, 2016 (`)Fund ReturnsTotal Value of Nifty Free Float Midcap 100Nifty Free Float Midcap 100 ReturnsTotal Value of Nifty 50 IndexNifty 50 Index Returns
1,20,000 3,60,000 6,00,000 8,40,000 10,00,000 1,25,635 4,55,916 9,15,741 14,50,219 21,34,641 8.84% 15.98% 16.95% 15.33% 17.64%1,27,202 4,76,332 9,19,332 13,56,497 18,46,799 11.34% 19.08% 17.11% 13.46% 14.31%1,25,632 4,06,397 7,75,087 11,52,388 15,14,7178.84% 8.04% 10.19% 8.89% 9.73%
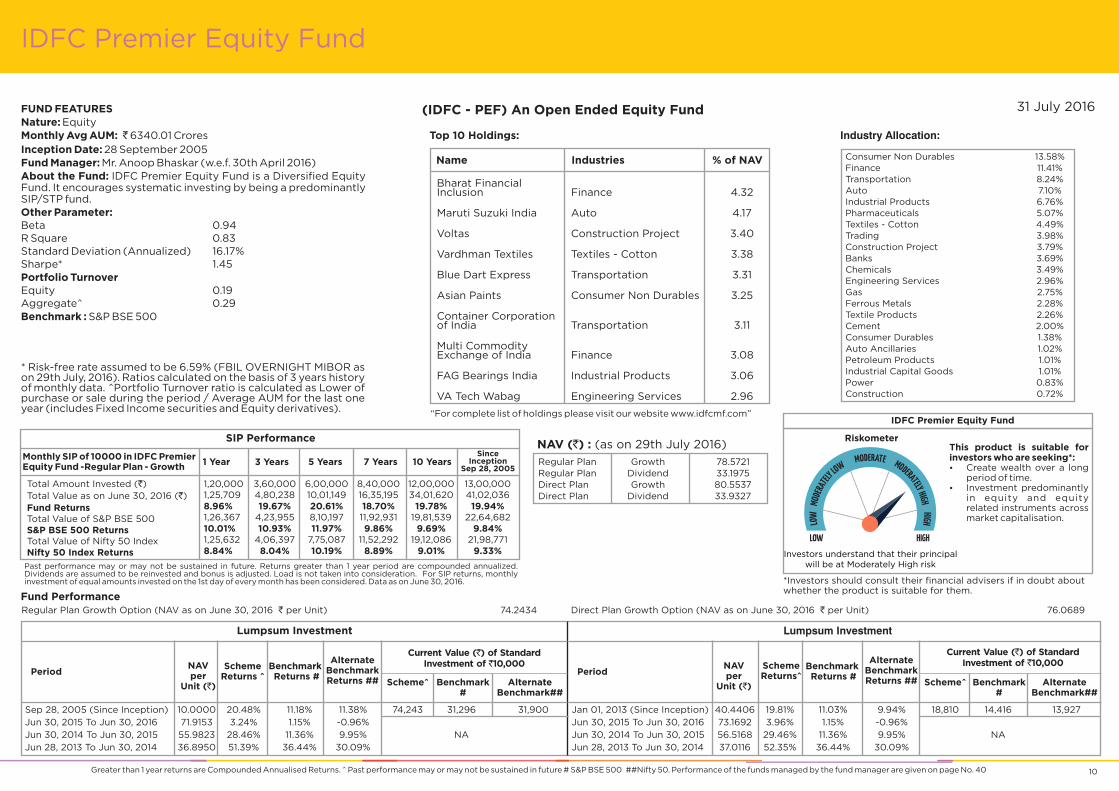
FUND FEATURESNature: EquityMonthly Avg AUM: ̀ 6340.01 Crores Inception Date: 28 September 2005Fund Manager: Mr. Anoop Bhaskar (w.e.f. 30th April 2016)About the Fund: IDFC Premier Equity Fund is a Diversified Equity Fund. It encourages systematic investing by being a predominantly SIP/STP fund.Other Parameter:Beta 0.94R Square 0.83Standard Deviation (Annualized) 16.17%Sharpe* 1.45Portfolio TurnoverEquity 0.19Aggregate^ 0.29Benchmark : S&P BSE 500
IDFC Premier Equity Fund
10
(IDFC - PEF) An Open Ended Equity Fund
Top 10 Holdings:
Name Industries % of NAV
Bharat Financial Inclusion Finance 4.32
Maruti Suzuki India Auto 4.17
Voltas Construction Project 3.40
Vardhman Textiles Textiles - Cotton 3.38
Blue Dart Express Transportation 3.31
Asian Paints Consumer Non Durables 3.25
Container Corporation of India Transportation 3.11
Multi Commodity Exchange of India Finance 3.08
FAG Bearings India Industrial Products 3.06
VA Tech Wabag Engineering Services 2.96
Industry Allocation:
Consumer Non Durables 13.58%Finance 11.41%Transportation 8.24%Auto 7.10%Industrial Products 6.76%Pharmaceuticals 5.07%Textiles - Cotton 4.49%Trading 3.98%Construction Project 3.79%Banks 3.69%Chemicals 3.49%Engineering Services 2.96%Gas 2.75%Ferrous Metals 2.28%Textile Products 2.26%Cement 2.00%Consumer Durables 1.38%Auto Ancillaries 1.02%Petroleum Products 1.01%Industrial Capital Goods 1.01%Power 0.83%Construction 0.72%
NAV (`) : (as on 29th July 2016)
31 July 2016
Regular Plan Growth 78.5721Regular Plan Dividend 33.1975Direct Plan Growth 80.5537Direct Plan Dividend 33.9327
* Risk-free rate assumed to be 6.59% (FBIL OVERNIGHT MIBOR as on 29th July, 2016).
Portfolio Turnover ratio is calculated as Lower of purchase or sale during the period / Average AUM for the last one year (includes Fixed Income securities and Equity derivatives).
Ratios calculated on the basis of 3 years history of monthly data. ^
Greater than 1 year returns are Compounded Annualised Returns. ̂ Past performance may or may not be sustained in future # S&P BSE 500 ##Nifty 50. Performance of the funds managed by the fund manager are given on page No. 40
Direct Plan Growth Option (NAV as on per Unit)June 30, 2016 ` 76.0689Regular Plan NAV as on Growth Option ( ` per Unit)June 30, 2016 74.2434
Fund Performance
IDFC Premier Equity Fund
Riskometer
Investors understand that their principal will be at Moderately High risk
This product is suitable for investors who are seeking*:
Create wealth over a long period of time.Investment predominantly in equity and equity related instruments across market capitalisation.
Ÿ
Ÿ
*Investors should consult their financial advisers if in doubt about whether the product is suitable for them.
Lumpsum InvestmentLumpsum Investment
PeriodScheme
Returns ^Benchmark Returns #
Alternate Benchmark Returns ##
Current Value (`) of Standard Investment of `10,000
Benchmark#
Alternate Benchmark##
Scheme^
NAV per
Unit (`)
Sep 28, 2005 (Since Inception) 10.0000 20.48% 11.18% 11.38% 74,243 31,296 31,900Jun 30, 2015 To Jun 30, 2016 71.9153 3.24% 1.15% -0.96%Jun 30, 2014 To Jun 30, 2015 55.9823 28.46% 11.36% 9.95% NAJun 28, 2013 To Jun 30, 2014 36.8950 51.39% 36.44% 30.09%
PeriodSchemeReturns^
Benchmark Returns #
Alternate Benchmark Returns ##
Current Value (`) of Standard Investment of `10,000
Benchmark#
Alternate Benchmark##
Scheme^
NAV per
Unit (`)
Jan 01, 2013 (Since Inception) 40.4406 19.81% 11.03% 9.94% 18,810 14,416 13,927Jun 30, 2015 To Jun 30, 2016 73.1692 3.96% 1.15% -0.96%Jun 30, 2014 To Jun 30, 2015 56.5168 29.46% 11.36% 9.95% NAJun 28, 2013 To Jun 30, 2014 37.0116 52.35% 36.44% 30.09%
1 Year 3 YearsMonthly SIP of 10000 in IDFC PremierEquity Fund -Regular Plan - Growth 5 Years 7 Years 10 Years
Since Inception
Sep 28, 2005
SIP Performance
Total Amount Invested (`)Total Value as on June 30, 2016 (`)Fund ReturnsTotal Value of S&P BSE 500S&P BSE 500 ReturnsTotal Value of Nifty 50 IndexNifty 50 Index Returns
1,20,000 3,60,000 6,00,000 8,40,000 12,00,000 13,00,000 1,25,709 4,80,238 10,01,149 16,35,195 34,01,620 41,02,036 8.96% 19.67% 20.61% 18.70% 19.78% 19.94%1,26,367 4,23,955 8,10,197 11,92,931 19,81,539 22,64,682 10.01% 10.93% 11.97% 9.86% 9.69% 9.84%1,25,632 4,06,397 7,75,087 11,52,292 19,12,086 21,98,7718.84% 8.04% 10.19% 8.89% 9.01% 9.33%
Past performance may or may not be sustained in future. Returns greater than 1 year period are compounded annualized. Dividends are assumed to be reinvested and bonus is adjusted. Load is not taken into consideration. For SIP returns, monthly investment of equal amounts invested on the 1st day of every month has been considered. Data as on June 30, 2016.
“For complete list of holdings please visit our website www.idfcmf.com”

1 Year 3 YearsMonthly SIP of ` 10000 in IDFC Imperial Equity Fund - Regular Plan - Growth 5 Years 7 Years 10 Years
Since Inception
Mar 16, 2006
SIP Performance
Total Amount Invested (`)Total Value as on June 30, 2016 (`)Fund ReturnsTotal Value of Nifty 50 IndexNifty 50 Index ReturnsTotal Value of S&P BSE SENSEXS&P BSE SENSEX Returns
1,20,000 3,60,000 6,00,000 8,40,000 12,00,000 12,40,000 1,23,110 3,95,313 7,35,828 10,78,049 18,29,231 19,29,008 4.85% 6.18% 8.10% 7.02% 8.17% 8.27%1,25,632 4,06,397 7,75,087 11,52,292 19,12,086 20,12,598 8.84% 8.04% 10.19% 8.89% 9.01% 9.05%1,24,459 3,97,910 7,60,999 11,28,427 18,64,043 19,61,1146.98% 6.62% 9.45% 8.30% 8.53% 8.58%
FUND FEATURES
Nature: Equity
Monthly Avg AUM: ̀ 109.88 Crores
Inception Date: 16 March 2006
Fund Manager: Mr. Ankur Arora (w.e.f. 27th June 2013) & Ms. Meenakshi Dawar (w.e.f. 7th September 2015)
About the Fund: A large cap fund with focus on active stock as well as sector selection.
Other Parameter:
Beta 0.93
R Square 0.95
Standard Deviation (Annualized) 14.54%
Sharpe* 0.50
Portfolio Turnover
Equity 0.53
Aggregate^ 0.55
Benchmark : Nifty 50
IDFC Imperial Equity Fund
11
(IDFC - IEF) An Open Ended Equity Fund
Top 10 Holdings:
Name Industries % of NAV
HDFC Bank Banks 9.99
Infosys Software 7.65
ICICI Bank Banks 5.85
Maruti Suzuki India Auto 5.08
Tata Motors Auto 4.48
Sun Pharmaceuticals Industries Pharmaceuticals 4.44
Zee Entertainment Enterprises Media & Entertainment 4.43
Axis Bank Banks 4.38
UltraTech Cement Cement 3.64
State Bank of India Banks 3.47
“For complete list of holdings please visit our website www.idfcmf.com”
Industry Allocation:
Banks 29.19%
Auto 11.28%
Software 10.67%
Consumer Non Durables 10.66%
Media & Entertainment 7.68%
Pharmaceuticals 6.45%
Petroleum Products 6.08%
Cement 3.64%
Construction Project 2.50%
Industrial Products 2.33%
Consumer Durables 2.24%
Miscellaneous 0.89%
NAV (`) : (as on 29th July 2016)Regular Plan Growth 27.4729
Regular Plan Dividend 12.1676
Direct Plan Growth 28.5200
Direct Plan Dividend 14.5877
31 July 2016
Past performance may or may not be sustained in future. Returns greater than 1 year period are compounded annualized. Dividends are assumed to be reinvested and bonus is adjusted. Load is not taken into consideration. For SIP returns, monthly investment of equal amounts invested on the 1st day of every month has been considered. Data as on June 30, 2016.
* Risk-free rate assumed to be 6.59% (FBIL OVERNIGHT MIBOR as on 29th July, 2016).
Portfolio Turnover ratio is calculated as Lower of purchase or sale during the period / Average AUM for the last one year (includes Fixed Income securities and Equity derivatives).
Ratios calculated on the basis of 3 years history of monthly data. ^
Greater than 1 year returns are Compounded Annualised Returns. ̂ Past performance may or may not be sustained in future # Nifty 50, ## S&P BSE Sensex. Performance of the funds managed by the fund manager are given on page No. 41
Direct Plan Growth Option (NAV as on ` per Unit)June 30, 2016 27.0476Regular Plan NAV as on Growth Option ( per Unit)June 30, 2016 ` 26.0910Fund Performance
IDFC Imperial Equity Fund
Riskometer
Investors understand that their principal will be at Moderately High risk
This product is suitable for investors who are seeking*:
Create wealth over a long period of time.Investment predominantly in equity and equity related instruments in the large cap segment.
Ÿ
Ÿ
*Investors should consult their financial advisers if in doubt about whether the product is suitable for them.
Lumpsum InvestmentLumpsum Investment
PeriodScheme
Returns ^Benchmark Returns #
Alternate Benchmark Returns ##
Current Value (`) of Standard Investment of `10,000
Benchmark#
Alternate Benchmark##
Scheme^
NAV per
Unit (`)
Mar 16, 2006 (Since Inception) 10.0000 9.76% 9.59% 9.23% 26,091 25,686 24,819Jun 30, 2015 To Jun 30, 2016 27.5134 -5.17% -0.96% -2.81%Jun 30, 2014 To Jun 30, 2015 24.5001 12.30% 9.95% 9.31% NAJun 28, 2013 To Jun 30, 2014 18.7777 30.29% 30.09% 30.83%
PeriodSchemeReturns^
Benchmark Returns #
Alternate Benchmark Returns ##
Current Value (`) of Standard Investment of `10,000
Benchmark#
Alternate Benchmark##
Scheme^
NAV per
Unit (`)
Jan 01, 2013 (Since Inception) 19.9808 9.05% 9.94% 9.63% 13,537 13,927 13,789Jun 30, 2015 To Jun 30, 2016 28.0064 -3.42% -0.96% -2.81%Jun 30, 2014 To Jun 30, 2015 24.7064 13.36% 9.95% 9.31% NAJun 28, 2013 To Jun 30, 2014 18.8353 30.98% 30.09% 30.83%

FUND FEATURESNature: EquityMonthly Avg AUM: ̀ 259.35 Crores Inception Date: 9 June 2006Fund Manager: Ms. Meenakshi Dawar & Mr. Ankur Arora (w.e.f. 7th September 2015)About the Fund: Positioned to mirror the broad sector weightages of the Nifty 50 and within those sectors there is active stock selection by the fund manager (within top 100 companies). Further, it will also invest in companies seeking growth capital through IPOs/secondary market issuances.Other Parameter:Beta (Nifty 50) 0.97R Square (Nifty 50) 0.98Standard Deviation (Annualized) 14.82%Sharpe* 0.48Portfolio TurnoverEquity 0.44Aggregate^ 0.52Benchmark : Nifty 50
(IDFC - EF) An Open Ended Equity Fund
IDFC Equity Fund
12
Top 10 Holdings:
Name Industries % of NAV
HDFC Bank Banks 8.27
Infosys Software 5.70
Tata Consultancy Services Software 4.86
Axis Bank Banks 4.14
Larsen & Toubro Construction Project 4.02
ICICI Bank Banks 4.01
Tata Motors Auto 3.97
Hero MotoCorp Auto 3.88
Reliance Industries Petroleum Products 3.69
State Bank of India Banks 3.48
“For complete list of holdings please visit our website www.idfcmf.com”
Industry Allocation:
Banks 30.09%
Software 12.87%
Auto 11.77%
Consumer Non Durables 9.18%
Petroleum Products 8.24%
Pharmaceuticals 5.32%
Cement 4.96%
Construction Project 4.02%
Media & Entertainment 2.87%
Oil 2.34%
Minerals/Mining 1.80%
Telecom - Services 1.39%
Ferrous Metals 1.35%
Transportation 0.97%
Miscellaneous 0.95%
Commercial Services 0.27%
* Risk-free rate assumed to be 6.59% (FBIL OVERNIGHT MIBOR as on 29th July, 2016).
Portfolio Turnover ratio is calculated as Lower of purchase or sale during the period / Average AUM for the last one year (includes Fixed Income securities and Equity derivatives).
Ratios calculated on the basis of 3 years history of monthly data. ^
Greater than 1 year returns are Compounded Annualised Returns. ̂ Past performance may or may not be sustained in future # Nifty 50, ## S&P BSE Sensex. Performance of the funds managed by the fund manager are given on page No. 41
Direct Plan Growth Option (NAV as on ` per Unit)June 30, 2016 24.6904Regular Plan NAV as on Growth Option ( per Unit)June 30, 2016 ` 23.8270Fund Performance
IDFC Equity Fund
Riskometer
Investors understand that their principal will be at Moderately High risk
This product is suitable for investors who are seeking*:
Create wealth over a long period of time.Investment predominantly in equity and equity related instruments.
Ÿ
Ÿ
*Investors should consult their financial advisers if in doubt about whether the product is suitable for them.
31 July 2016
Lumpsum InvestmentLumpsum Investment
PeriodScheme
Returns ^Benchmark Returns #
Alternate Benchmark Returns ##
Current Value (`) of Standard Investment of `10,000
Benchmark#
Alternate Benchmark##
Scheme^
NAV per
Unit (`)
Jun 09, 2006 (Since Inception) 10.0000 9.01% 11.12% 10.58% 23,827 28,914 27,521Jun 30, 2015 To Jun 30, 2016 24.3459 -2.13% -0.96% -2.81%Jun 30, 2014 To Jun 30, 2015 22.1498 9.91% 9.95% 9.31% NAJun 28, 2013 To Jun 30, 2014 17.2432 28.28% 30.09% 30.83%
PeriodSchemeReturns^
Benchmark Returns #
Alternate Benchmark Returns ##
Current Value (`) of Standard Investment of `10,000
Benchmark#
Alternate Benchmark##
Scheme^
NAV per
Unit (`)
Jan 01, 2013 (Since Inception) 17.2052 10.88% 9.94% 9.63% 14,351 13,927 13,789Jun 30, 2015 To Jun 30, 2016 24.7368 -0.19% -0.96% -2.81%Jun 30, 2014 To Jun 30, 2015 22.3160 10.85% 9.95% 9.31% NAJun 28, 2013 To Jun 30, 2014 17.2819 28.95% 30.09% 30.83%
NAV (`) : (as on 29th July 2016)
Regular Plan Growth 24.9455
Regular Plan Dividend 13.2189
Direct Plan Growth 25.8862
Direct Plan Dividend 15.7689
1 Year 3 YearsMonthly SIP of ̀ 10000 in IDFC Equity Fund - Regular Plan - Growth
5 Years 7 Years 10 YearsSince
InceptionJun 09, 2006
SIP Performance
Total Amount Invested (`)Total Value as on June 30, 2016 (`)Fund ReturnsTotal Value of Nifty 50 IndexNifty 50 Index ReturnsTotal Value of S&P BSE SENSEXS&P BSE SENSEX Returns
1,20,000 3,60,000 6,00,000 8,40,000 12,00,000 12,10,000 1,25,819 4,01,494 7,67,862 11,49,058 18,94,570 19,18,397 9.14% 7.22% 9.81% 8.81% 8.84% 8.85%1,25,632 4,06,397 7,75,087 11,52,292 19,11,140 19,40,054 8.84% 8.04% 10.19% 8.89% 9.01% 9.06%1,24,459 3,97,910 7,60,999 11,28,427 18,62,911 18,90,4326.98% 6.62% 9.45% 8.30% 8.52% 8.57%
Past performance may or may not be sustained in future. Returns greater than 1 year period are compounded annualized. Dividends are assumed to be reinvested and bonus is adjusted. Load is not taken into consideration. For SIP returns, monthly investment of equal amounts invested on the 1st day of every month has been considered. Data as on June 30, 2016.
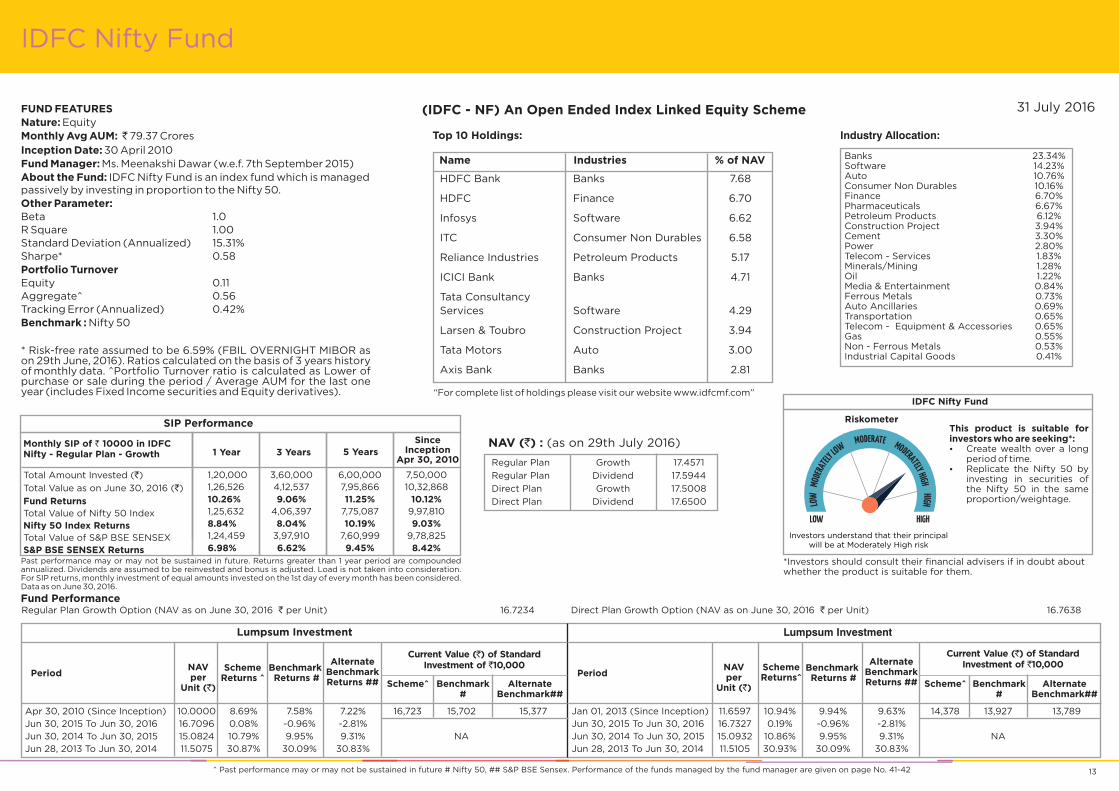
FUND FEATURESNature: EquityMonthly Avg AUM: ̀ 79.37 Crores Inception Date: 30 April 2010Fund Manager: Ms. Meenakshi Dawar (w.e.f. 7th September 2015)About the Fund: IDFC Nifty Fund is an index fund which is managed passively by investing in proportion to the Nifty 50.Other Parameter:Beta 1.0R Square 1.00Standard Deviation (Annualized) 15.31%Sharpe* 0.58Portfolio TurnoverEquity 0.11Aggregate^ 0.56Tracking Error (Annualized) 0.42%Benchmark : Nifty 50
IDFC Nifty Fund
13
(IDFC - NF) An Open Ended Index Linked Equity Scheme
Top 10 Holdings:
Name Industries % of NAV
HDFC Bank Banks 7.68
HDFC Finance 6.70
Infosys Software 6.62
ITC Consumer Non Durables 6.58
Reliance Industries Petroleum Products 5.17
ICICI Bank Banks 4.71
Tata Consultancy Services Software 4.29
Larsen & Toubro Construction Project 3.94
Tata Motors Auto 3.00
Axis Bank Banks 2.81
“For complete list of holdings please visit our website www.idfcmf.com”
Industry Allocation:
Banks 23.34%Software 14.23%Auto 10.76%Consumer Non Durables 10.16%Finance 6.70%Pharmaceuticals 6.67%Petroleum Products 6.12%Construction Project 3.94%Cement 3.30%Power 2.80%Telecom - Services 1.83%Minerals/Mining 1.28%Oil 1.22%Media & Entertainment 0.84%Ferrous Metals 0.73%Auto Ancillaries 0.69%Transportation 0.65%Telecom - Equipment & Accessories 0.65%Gas 0.55%Non - Ferrous Metals 0.53%Industrial Capital Goods 0.41%
NAV (`) : (as on 29th July 2016)
31 July 2016
Regular Plan Growth 17.4571
Regular Plan Dividend 17.5944
Direct Plan Growth 17.5008
Direct Plan Dividend 17.6500
Past performance may or may not be sustained in future. Returns greater than 1 year period are compounded annualized. Dividends are assumed to be reinvested and bonus is adjusted. Load is not taken into consideration. For SIP returns, monthly investment of equal amounts invested on the 1st day of every month has been considered. Data as on June 30, 2016.
* Risk-free rate assumed to be 6.59 (FBIL OVERNIGHT MIBOR as on .
%29th June, 2016)
Portfolio Turnover ratio is calculated as Lower of purchase or sale during the period / Average AUM for the last one year (includes Fixed Income securities and Equity derivatives).
Ratios calculated on the basis of 3 years history of monthly data. ^
^ Past performance may or may not be sustained in future # Nifty 50, ## S&P BSE Sensex. Performance of the funds managed by the fund manager are given on page No. 41-42
Direct Plan Growth Option (NAV as on ` per Unit)June 30, 2016 16.7638Regular Plan NAV as on Growth Option ( per Unit)June 30, 2016 ` 16.7234Fund Performance
IDFC Nifty Fund
Riskometer
Investors understand that their principal will be at Moderately High risk
This product is suitable for investors who are seeking*:
Create wealth over a long period of time.Replicate the Nifty 50 by investing in securities of the Nifty 50 in the same proportion/weightage.
Ÿ
Ÿ
*Investors should consult their financial advisers if in doubt about whether the product is suitable for them.
Lumpsum InvestmentLumpsum Investment
PeriodScheme
Returns ^Benchmark Returns #
Alternate Benchmark Returns ##
Current Value (`) of Standard Investment of `10,000
Benchmark#
Alternate Benchmark##
Scheme^
NAV per
Unit (`)
Apr 30, 2010 (Since Inception) 10.0000 8.69% 7.58% 7.22% 16,723 15,702 15,377Jun 30, 2015 To Jun 30, 2016 16.7096 0.08% -0.96% -2.81%Jun 30, 2014 To Jun 30, 2015 15.0824 10.79% 9.95% 9.31% NAJun 28, 2013 To Jun 30, 2014 11.5075 30.87% 30.09% 30.83%
PeriodSchemeReturns^
Benchmark Returns #
Alternate Benchmark Returns ##
Current Value (`) of Standard Investment of `10,000
Benchmark#
Alternate Benchmark##
Scheme^
NAV per
Unit (`)
Jan 01, 2013 (Since Inception) 11.6597 10.94% 9.94% 9.63% 14,378 13,927 13,789Jun 30, 2015 To Jun 30, 2016 16.7327 0.19% -0.96% -2.81%Jun 30, 2014 To Jun 30, 2015 15.0932 10.86% 9.95% 9.31% NAJun 28, 2013 To Jun 30, 2014 11.5105 30.93% 30.09% 30.83%
SIP Performance
1 Year 3 YearsMonthly SIP of 10000 in IDFC Nifty - Regular Plan - Growth
`5 Years
Since Inception
Apr 30, 2010
Total Amount Invested (`)
Total Value as on June 30, 2016 (`)
Fund ReturnsTotal Value of Nifty 50 IndexNifty 50 Index ReturnsTotal Value of S&P BSE SENSEXS&P BSE SENSEX Returns
1,20,000 3,60,000 6,00,000 7,50,000 1,26,526 4,12,537 7,95,866 10,32,868 10.26% 9.06% 11.25% 10.12%1,25,632 4,06,397 7,75,087 9,97,810 8.84% 8.04% 10.19% 9.03%1,24,459 3,97,910 7,60,999 9,78,8256.98% 6.62% 9.45% 8.42%

Name Industries % of NAV
Indraprastha Gas Gas 7.22
Engineers India Construction Project 6.04
NBCC (India) Construction 5.95
J.Kumar Infraprojects Construction 4.85
Ahluwalia Contracts (India) Construction 4.76
UltraTech Cement Cement 4.41
Cairn India Oil 3.98
Vedanta Non - Ferrous Metals 3.90
Techno Electric &
Engineering Company Construction Project 3.70
Larsen & Toubro Construction Project 3.47
“For complete list of holdings please visit our website www.idfcmf.com”
IDFC Infrastructure Fund
14
FUND FEATURESNature: EquityMonthly Avg AUM: ̀ 137.70 Crores Inception Date: 8 March 2011Fund Manager: Mr. Rajendra Kumar Mishra (w.e.f. 27th June 2013) About the Fund: A dedicated Infrastructure fund, that invests across the infrastructure value chain with exclusions like Banking, Autos, IT, Pharma and FMCG. It is a diversified portfolio of companies that are participating in and benefitting from the Indian Infrastructure and Infrastructure related activities.Other Parameter:Beta 0.74R Square 0.81Standard Deviation (Annualized) 20.89%Sharpe* 0.57Portfolio TurnoverEquity 0.75Aggregate^ 0.75Benchmark : Nifty Infrastructure
(IDFC - IF) An Open Ended Equity Scheme Fund
Top 10 Holdings: Industry Allocation:
Construction 19.86%
Construction Project 13.21%
Power 10.65%
Gas 7.31%
Non - Ferrous Metals 6.32%
Transportation 5.63%
Industrial Capital Goods 5.09%
Ferrous Metals 4.69%
Cement 4.50%
Oil 3.98%
Finance 2.60%
Industrial Products 2.48%
Engineering Services 2.37%
Consumer Durables 1.96%
Telecom - Services 1.95%
Petroleum Products 0.23%
NAV (`) : (as on 29th July 2016)
31 July 2016
Regular Plan Growth 11.8569
Regular Plan Dividend 11.8619
Direct Plan Growth 12.3532
Direct Plan Dividend 12.3488
* Risk-free rate assumed to be .
6.59% (FBIL OVERNIGHT MIBOR as on 29th July, 2016)
Portfolio Turnover ratio is calculated as Lower of purchase or sale during the period / Average AUM for the last one year (includes Fixed Income securities and Equity derivatives).
Ratios calculated on the basis of 3 years history of monthly data. ^
^ Past performance may or may not be sustained in future # Nifty Infra, ## Nifty 50. Performance of the funds managed by the fund manager are given on page No. 42
Direct Plan Growth Option (NAV as on ` per Unit)June 30, 2016 11.5153Regular Plan NAV as on Growth Option ( per Unit)June 30, 2016 ` 11.0671Fund Performance
IDFC Infrastructure Fund
Riskometer
Investors understand that their principal will be at High risk
This product is suitable for investors who are seeking*:
Create wealth over a long period of time. Investment predominantly in equity and equity related instruments of co m p a n i e s t h a t a re par t ic ipat ing in and benefiting from growth in Indian infrastructure and infrastructural related activities.
Ÿ
Ÿ
*Investors should consult their financial advisers if in doubt about whether the product is suitable for them.
Lumpsum InvestmentLumpsum Investment
PeriodScheme
Returns ^Benchmark Returns #
Alternate Benchmark Returns ##
Current Value (`) of Standard Investment of `10,000
Benchmark#
Alternate Benchmark##
Scheme^
NAV per
Unit (`)
Mar 08, 2011 (Since Inception) 10.0000 1.92% -0.31% 7.94% 11,067 9,834 15,012Jun 30, 2015 To Jun 30, 2016 11.9075 -7.06% -12.56% -0.96%Jun 30, 2014 To Jun 30, 2015 10.3758 14.76% -3.51% 9.95% NAJun 28, 2013 To Jun 30, 2014 7.5287 37.58% 49.23% 30.09%
PeriodSchemeReturns^
Benchmark Returns #
Alternate Benchmark Returns ##
Current Value (`) of Standard Investment of `10,000
Benchmark#
Alternate Benchmark##
Scheme^
NAV per
Unit (`)
Jan 01, 2013 (Since Inception) 8.8847 7.70% 2.44% 9.94% 12,961 10,880 13,927Jun 30, 2015 To Jun 30, 2016 12.2407 -5.93% -12.56% -0.96%Jun 30, 2014 To Jun 30, 2015 10.4686 16.93% -3.51% 9.95% NAJun 28, 2013 To Jun 30, 2014 7.5471 38.46% 49.23% 30.09%
Past performance may or may not be sustained in future. Returns greater than 1 year period are compounded annualized. Dividends are assumed to be reinvested and bonus is adjusted. Load is not taken into consideration. For SIP returns, monthly investment of equal amounts invested on the 1st day of every month has been considered. Data as on June 30, 2016.
SIP Performance
1 Year 3 YearsMonthly SIP of ` 10000 in IDFC Infra - Regular Plan - Growth 5 Years
Since Inception
Mar 08, 2011
Total Amount Invested (`)Total Value as on June 30, 2016 (`)
Fund ReturnsTotal Values of Nifty InfrastructureNifty Infrastructure ReturnsTotal Value of Nifty 50 IndexNifty 50 Index returns
1,20,000 3,60,000 6,00,000 6,40,000 1,20,689 4,13,240 7,19,231 7,62,938 1.07% 9.18% 7.19% 6.52%1,23,827 3,73,580 6,48,403 6,86,202 5.98% 2.42% 3.06% 2.58%1,25,632 4,06,397 7,75,087 8,33,6828.84% 8.04% 10.19% 9.84%
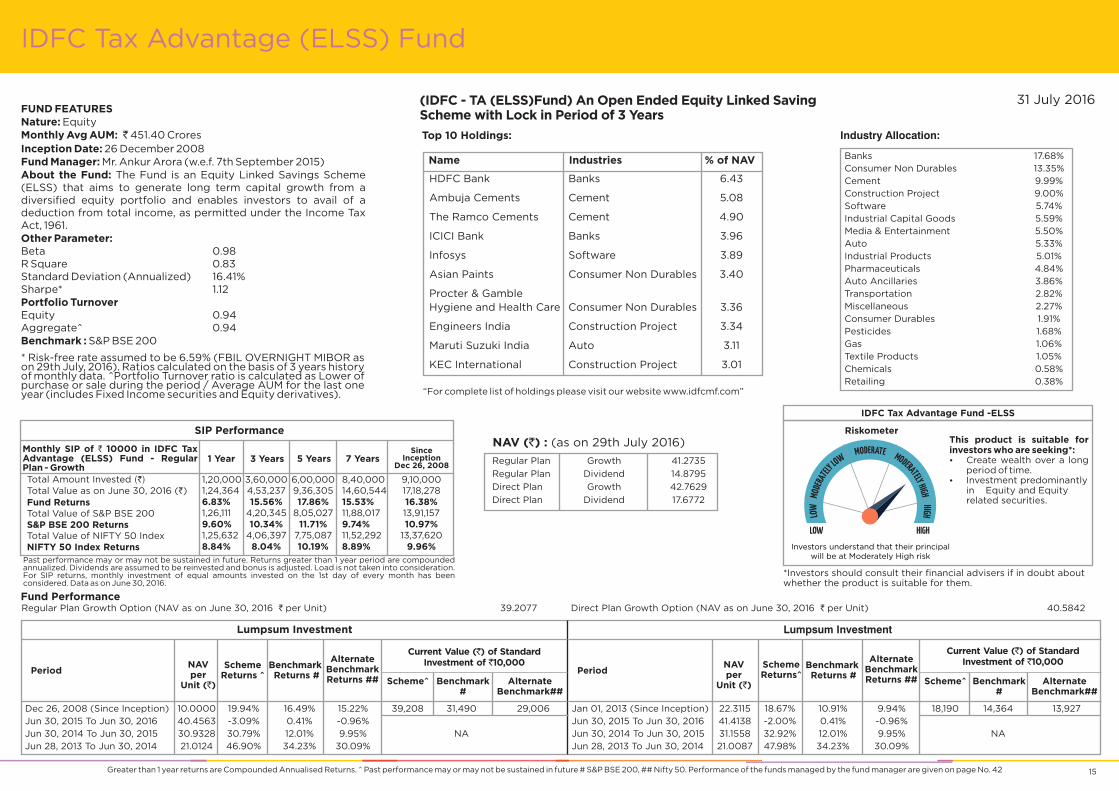
FUND FEATURESNature: EquityMonthly Avg AUM: ̀ 451.40 Crores Inception Date: 26 December 2008Fund Manager: Mr. Ankur Arora (w.e.f. 7th September 2015)About the Fund: The Fund is an Equity Linked Savings Scheme (ELSS) that aims to generate long term capital growth from a diversified equity portfolio and enables investors to avail of a deduction from total income, as permitted under the Income Tax Act, 1961.Other Parameter:Beta 0.98R Square 0.83Standard Deviation (Annualized) 16.41%Sharpe* 1.12Portfolio TurnoverEquity 0.94Aggregate^ 0.94Benchmark : S&P BSE 200
(IDFC - TA (ELSS)Fund) An Open Ended Equity Linked Saving Scheme with Lock in Period of 3 Years
IDFC Tax Advantage (ELSS) Fund
15
Top 10 Holdings:
Name Industries % of NAV
HDFC Bank Banks 6.43
Ambuja Cements Cement 5.08
The Ramco Cements Cement 4.90
ICICI Bank Banks 3.96
Infosys Software 3.89
Asian Paints Consumer Non Durables 3.40
Procter & Gamble Hygiene and Health Care Consumer Non Durables 3.36
Engineers India Construction Project 3.34
Maruti Suzuki India Auto 3.11
KEC International Construction Project 3.01
“For complete list of holdings please visit our website www.idfcmf.com”
Industry Allocation:
Banks 17.68%Consumer Non Durables 13.35%Cement 9.99%Construction Project 9.00%Software 5.74%Industrial Capital Goods 5.59%Media & Entertainment 5.50%Auto 5.33%Industrial Products 5.01%Pharmaceuticals 4.84%Auto Ancillaries 3.86%Transportation 2.82%Miscellaneous 2.27%Consumer Durables 1.91%Pesticides 1.68%Gas 1.06%Textile Products 1.05%Chemicals 0.58%Retailing 0.38%
NAV (`) : (as on 29th July 2016)
31 July 2016
Regular Plan Growth 41.2735
Regular Plan Dividend 14.8795
Direct Plan Growth 42.7629
Direct Plan Dividend 17.6772
* Risk-free rate assumed to be 6.59% (FBIL OVERNIGHT MIBOR as on 29th July, 2016).
Portfolio Turnover ratio is calculated as Lower of purchase or sale during the period / Average AUM for the last one year (includes Fixed Income securities and Equity derivatives).
Ratios calculated on the basis of 3 years history of monthly data. ^
Greater than 1 year returns are Compounded Annualised Returns. ̂ Past performance may or may not be sustained in future # S&P BSE 200, ## Nifty 50. Performance of the funds managed by the fund manager are given on page No. 42
Direct Plan Growth Option (NAV as on ` per Unit)June 30, 2016 40.5842Regular Plan NAV as on Growth Option ( ` per Unit)June 30, 2016 39.2077Fund Performance
IDFC Tax Advantage Fund -ELSS
Riskometer
Investors understand that their principal will be at Moderately High risk
This product is suitable for investors who are seeking*:
Create wealth over a long period of time.Investment predominantly in Equity and Equity related securities.
Ÿ
Ÿ
*Investors should consult their financial advisers if in doubt about whether the product is suitable for them.
Lumpsum InvestmentLumpsum Investment
PeriodScheme
Returns ^Benchmark Returns #
Alternate Benchmark Returns ##
Current Value (`) of Standard Investment of `10,000
Benchmark#
Alternate Benchmark##
Scheme^
NAV per
Unit (`)
Dec 26, 2008 (Since Inception) 10.0000 19.94% 16.49% 15.22% 39,208 31,490 29,006Jun 30, 2015 To Jun 30, 2016 40.4563 -3.09% 0.41% -0.96%Jun 30, 2014 To Jun 30, 2015 30.9328 30.79% 12.01% 9.95% NAJun 28, 2013 To Jun 30, 2014 21.0124 46.90% 34.23% 30.09%
PeriodSchemeReturns^
Benchmark Returns #
Alternate Benchmark Returns ##
Current Value (`) of Standard Investment of `10,000
Benchmark#
Alternate Benchmark##
Scheme^
NAV per
Unit (`)
Jan 01, 2013 (Since Inception) 22.3115 18.67% 10.91% 9.94% 18,190 14,364 13,927Jun 30, 2015 To Jun 30, 2016 41.4138 -2.00% 0.41% -0.96%Jun 30, 2014 To Jun 30, 2015 31.1558 32.92% 12.01% 9.95% NAJun 28, 2013 To Jun 30, 2014 21.0087 47.98% 34.23% 30.09%
Past performance may or may not be sustained in future. Returns greater than 1 year period are compounded annualized. Dividends are assumed to be reinvested and bonus is adjusted. Load is not taken into consideration. For SIP returns, monthly investment of equal amounts invested on the 1st day of every month has been considered. Data as on June 30, 2016.
1 Year 3 YearsMonthly SIP of ` 10000 in IDFC Tax Advantage (ELSS) Fund - Regular Plan - Growth
5 Years 7 YearsSince
InceptionDec 26, 2008
SIP Performance
Total Amount Invested (`)Total Value as on June 30, 2016 (`)Fund ReturnsTotal Value of S&P BSE 200S&P BSE 200 ReturnsTotal Value of NIFTY 50 IndexNIFTY 50 Index Returns
1,20,000 3,60,000 6,00,000 8,40,000 9,10,000 1,24,364 4,53,237 9,36,305 14,60,544 17,18,278 6.83% 15.56% 17.86% 15.53% 16.38%1,26,111 4,20,345 8,05,027 11,88,017 13,91,157 9.60% 10.34% 11.71% 9.74% 10.97%1,25,632 4,06,397 7,75,087 11,52,292 13,37,6208.84% 8.04% 10.19% 8.89% 9.96%
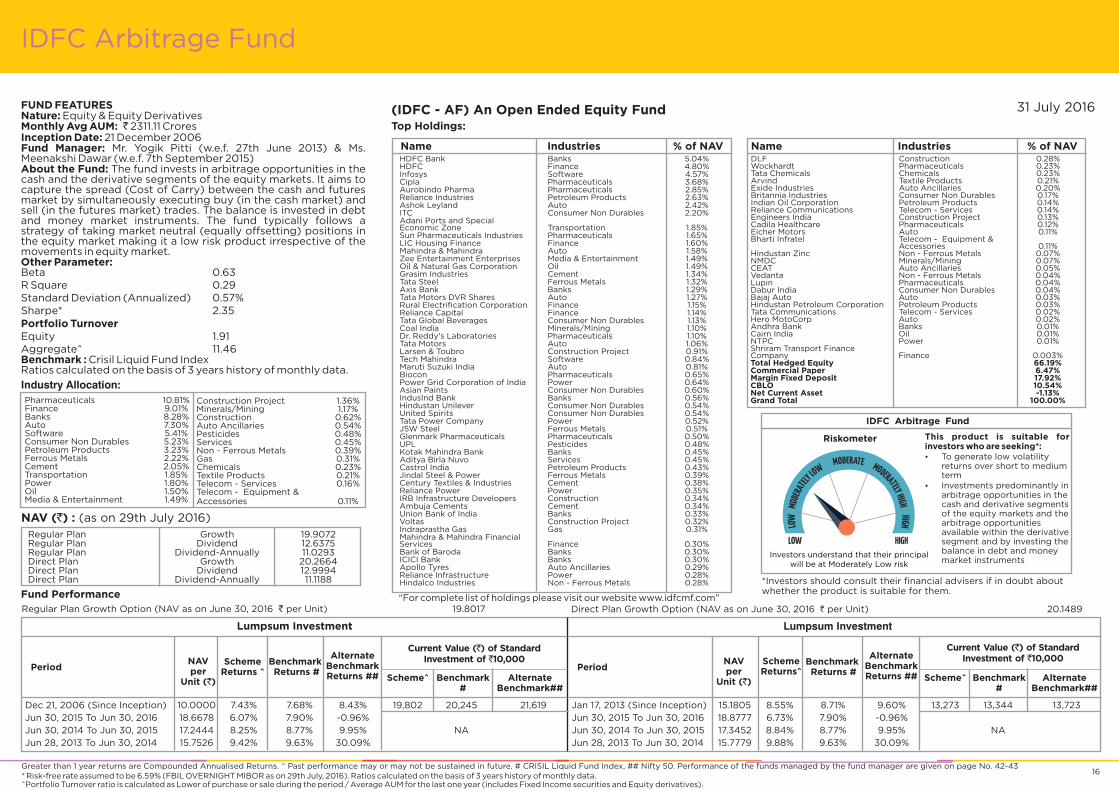
FUND FEATURESNature: Equity & Equity DerivativesMonthly Avg AUM: ̀ 2311.11 Crores Inception Date: 21 December 2006Fund Manager: Mr. Yogik Pitti Ms. Meenakshi Dawar (w.e.f. 7th September 2015)About the Fund: The fund invests in arbitrage opportunities in the cash and the derivative segments of the equity markets. It aims to capture the spread (Cost of Carry) between the cash and futures market by simultaneously executing buy (in the cash market) and sell (in the futures market) trades. The balance is invested in debt and money market instruments. The fund typically follows a strategy of taking market neutral (equally offsetting) positions in the equity market making it a low risk product irrespective of the movements in equity market.
Benchmark : Crisil Liquid Fund IndexRatios calculated on the basis of 3 years history of monthly data.
(w.e.f. 27th June 2013) &
Other Parameter:Beta 0.63R Square 0.29Standard Deviation (Annualized) 0.57%Sharpe* 2.35Portfolio TurnoverEquity 1.91Aggregate^ 11.46
(IDFC - AF) An Open Ended Equity Fund
IDFC Arbitrage Fund
NAV (`) : (as on 29th July 2016)
Top Holdings:
HDFC Bank Banks 5.04% HDFC Finance 4.80% Infosys Software 4.57% Cipla Pharmaceuticals 3.68% Aurobindo Pharma Pharmaceuticals 2.85% Reliance Industries Petroleum Products 2.63% Ashok Leyland Auto 2.42% ITC Consumer Non Durables 2.20% Adani Ports and Special Economic Zone Transportation 1.85% Sun Pharmaceuticals Industries Pharmaceuticals 1.65% LIC Housing Finance Finance 1.60% Mahindra & Mahindra Auto 1.58% Zee Entertainment Enterprises Media & Entertainment 1.49% Oil & Natural Gas Corporation Oil 1.49% Grasim Industries Cement 1.34% Tata Steel Ferrous Metals 1.32% Axis Bank Banks 1.29% Tata Motors DVR Shares Auto 1.27% Rural Electrification Corporation Finance 1.15% Reliance Capital Finance 1.14% Tata Global Beverages Consumer Non Durables 1.13% Coal India Minerals/Mining 1.10% Dr. Reddy's Laboratories Pharmaceuticals 1.10% Tata Motors Auto 1.06% Larsen & Toubro Construction Project 0.91% Tech Mahindra Software 0.84% Maruti Suzuki India Auto 0.81% Biocon Pharmaceuticals 0.65% Power Grid Corporation of India Power 0.64% Asian Paints Consumer Non Durables 0.60% IndusInd Bank Banks 0.56% Hindustan Unilever Consumer Non Durables 0.54% United Spirits Consumer Non Durables 0.54% Tata Power Company Power 0.52% JSW Steel Ferrous Metals 0.51% Glenmark Pharmaceuticals Pharmaceuticals 0.50% UPL Pesticides 0.48% Kotak Mahindra Bank Banks 0.45% Aditya Birla Nuvo Services 0.45% Castrol India Petroleum Products 0.43% Jindal Steel & Power Ferrous Metals 0.39% Century Textiles & Industries Cement 0.38% Reliance Power Power 0.35% IRB Infrastructure Developers Construction 0.34% Ambuja Cements Cement 0.34% Union Bank of India Banks 0.33% Voltas Construction Project 0.32% Indraprastha Gas Gas 0.31% Mahindra & Mahindra Financial Services Finance 0.30% Bank of Baroda Banks 0.30% ICICI Bank Banks 0.30% Apollo Tyres Auto Ancillaries 0.29% Reliance Infrastructure Power 0.28% Hindalco Industries Non - Ferrous Metals 0.28%
Greater than 1 year returns are Compounded Annualised Returns. ^ Past performance may or may not be sustained in future. # CRISIL Liquid Fund Index, ## Nifty 50. Performance of the funds managed by the fund manager are given on page No. 42-43
“For complete list of holdings please visit our website www.idfcmf.com”
DLF Construction 0.28% Wockhardt Pharmaceuticals 0.23% Tata Chemicals Chemicals 0.23% Arvind Textile Products 0.21% Exide Industries Auto Ancillaries 0.20% Britannia Industries Consumer Non Durables 0.17% Indian Oil Corporation Petroleum Products 0.14% Reliance Communications Telecom - Services 0.14% Engineers India Construction Project 0.13% Cadila Healthcare Pharmaceuticals 0.12% Eicher Motors Auto 0.11% Bharti Infratel Telecom - Equipment &
Accessories 0.11% Hindustan Zinc Non - Ferrous Metals 0.07% NMDC Minerals/Mining 0.07% CEAT Auto Ancillaries 0.05% Vedanta Non - Ferrous Metals 0.04% Lupin Pharmaceuticals 0.04% Dabur India Consumer Non Durables 0.04% Bajaj Auto Auto 0.03% Hindustan Petroleum Corporation Petroleum Products 0.03% Tata Communications Telecom - Services 0.02% Hero MotoCorp Auto 0.02% Andhra Bank Banks 0.01% Cairn India Oil 0.01% NTPC Power 0.01% Shriram Transport Finance Company Finance 0.003% Total Hedged Equity 66.19% Commercial Paper 6.47% Margin Fixed Deposit 17.92% CBLO 10.54% Net Current Asset -1.13%Grand Total 100.00%
Name Industries % of NAVName Industries % of NAV
31 July 2016
Industry Allocation:
Construction Project 1.36%Minerals/Mining 1.17%Construction 0.62%Auto Ancillaries 0.54%Pesticides 0.48%Services 0.45%Non - Ferrous Metals 0.39%Gas 0.31%Chemicals 0.23%Textile Products 0.21%Telecom - Services 0.16%Telecom - Equipment & Accessories 0.11%
Pharmaceuticals 10.81%Finance 9.01%Banks 8.28%Auto 7.30%Software 5.41%Consumer Non Durables 5.23%Petroleum Products 3.23%Ferrous Metals 2.22%Cement 2.05%Transportation 1.85%Power 1.80%Oil 1.50%Media & Entertainment 1.49%
Regular Plan NAV as on Growth Option ( ` per Unit)June 30, 2016 19.8017
Fund Performance
16
Direct Plan Growth Option (NAV as on ` per Unit)June 30, 2016 20.1489
Regular Plan Growth 19.9072Regular Plan Dividend 12.6375Regular Plan Dividend-Annually 11.0293Direct Plan Growth 20.2664Direct Plan Dividend 12.9994Direct Plan Dividend-Annually 11.1188
IDFC Arbitrage Fund
Riskometer
Investors understand that their principal will be at Moderately Low risk
This product is suitable for investors who are seeking*:
To generate low volatility returns over short to medium term Investments predominantly in arbitrage opportunities in the cash and derivative segments of the equity markets and the arbitrage opportunities available within the derivative segment and by investing the balance in debt and money market instruments
Ÿ
Ÿ
*Investors should consult their financial advisers if in doubt about whether the product is suitable for them.
Lumpsum InvestmentLumpsum Investment
PeriodScheme
Returns ^Benchmark Returns #
Alternate Benchmark Returns ##
Current Value (`) of Standard Investment of `10,000
Benchmark#
Alternate Benchmark##
Scheme^
NAV per
Unit (`)
Dec 21, 2006 (Since Inception) 10.0000 7.43% 7.68% 8.43% 19,802 20,245 21,619Jun 30, 2015 To Jun 30, 2016 18.6678 6.07% 7.90% -0.96%Jun 30, 2014 To Jun 30, 2015 17.2444 8.25% 8.77% 9.95% NAJun 28, 2013 To Jun 30, 2014 15.7526 9.42% 9.63% 30.09%
PeriodSchemeReturns^
Benchmark Returns #
Alternate Benchmark Returns ##
Current Value (`) of Standard Investment of `10,000
Benchmark#
Alternate Benchmark##
Scheme^
NAV per
Unit (`)
Jan 17, 2013 (Since Inception) 15.1805 8.55% 8.71% 9.60% 13,273 13,344 13,723Jun 30, 2015 To Jun 30, 2016 18.8777 6.73% 7.90% -0.96%Jun 30, 2014 To Jun 30, 2015 17.3452 8.84% 8.77% 9.95% NAJun 28, 2013 To Jun 30, 2014 15.7779 9.88% 9.63% 30.09%
* Risk-free rate assumed to be 6.59% (FBIL OVERNIGHT MIBOR as on 29th July, 2016). Portfolio Turnover ratio is calculated as Lower of purchase or sale during the period / Average AUM for the last one year (includes Fixed Income securities and Equity derivatives).
Ratios calculated on the basis of 3 years history of monthly data.^

FUND FEATURESNature: Equity DerivativesMonthly Avg AUM: ̀ 371.89 Crores Inception Date: 9 June 2008Fund Manager:
About the Fund: The fund invests in arbitrage opportunities in the cash and the derivative segments of the equity markets. It aims to capture the spread between the cash and futures market by simultaneously executing buy (in the cash market) and sell (in the futures market) trades. The fund can also tactically participate in a mix of strategies like pair trades, corporate events like buybacks, etc, (restricted upto 5% of the portfolio). The balance is invested in actively managed debt and money market instruments.
Benchmark : Crisil Liquid Fund Index
Mr. Yogik Pitti (w.e.f. 27th June 2013) & Ms. Meenakshi Dawar (w.e.f. 7th September 2015)
Other Parameter:Beta 0.60R Square 0.15Standard Deviation (Annualized) 0.76%Sharpe* 1.33Portfolio TurnoverEquity 1.42Aggregate^ 11.58
Ratios calculated on the basis of 3 years history of monthly data.
(IDFC - APF) An Open Ended Equity Fund
IDFC Arbitrage Plus Fund
Greater than 1 year returns are Compounded Annualised Returns. ̂ Past performance may or may not be sustained in future. # CRISIL Liquid Fund Index, ## Nifty 50. Performance of the funds managed by the fund manager are given on page No. 42-43
Top Holdings:
Sun Pharmaceuticals Industries Pharmaceuticals 4.74
Aurobindo Pharma Pharmaceuticals 4.31
ITC Consumer Non Durables 4.27
Grasim Industries Cement 4.19
Asian Paints Consumer Non Durables 4.07
Reliance Power Power 2.83
Infosys Software 2.80
HDFC Bank Banks 2.62
Cadila Healthcare Pharmaceuticals 2.39
Mahindra & Mahindra Auto 2.23
Cipla Pharmaceuticals 2.23
IRB Infrastructure Developers Construction 2.21
Britannia Industries Consumer Non Durables 2.05
Rural Electrification Corporation Finance 1.97
Eicher Motors Auto 1.75
Tata Chemicals Chemicals 1.71
Ashok Leyland Auto 1.70
Reliance Communications Telecom - Services 1.63
Wockhardt Pharmaceuticals 1.60
Hindustan Unilever Consumer Non Durables 1.59
Oil & Natural Gas Corporation Oil 1.56
HDFC Finance 1.44
UPL Pesticides 1.41
Zee Entertainment Enterprises Media & Entertainment 0.92
Axis Bank Banks 0.92
Jindal Steel & Power Ferrous Metals 0.79
Dr. Reddy's Laboratories Pharmaceuticals 0.76
Reliance Industries Petroleum Products 0.75
Biocon Pharmaceuticals 0.74
Tata Motors DVR Shares Auto 0.60
Larsen & Toubro Construction Project 0.57
Tata Global Beverages Consumer Non Durables 0.50
Name Industries/Rating % of NAV
Glenmark Pharmaceuticals Pharmaceuticals 0.45
Arvind Textile Products 0.39
LIC Housing Finance Finance 0.38
Hindustan Petroleum Corporation Petroleum Products 0.24
Divi's Laboratories Pharmaceuticals 0.17
Reliance Infrastructure Power 0.09
Coal India Minerals/Mining 0.08
Power Grid Corporation of India Power 0.06
Aditya Birla Nuvo Services 0.03
CESC Power 0.02
Total Hedged Equity 65.75
Margin Fixed Deposit 9.42
CBLO 8.02
Government Bond 19.48
7.72% - 2025 G -Sec SOV 16.67
8.13% - 2022 G -Sec SOV 2.82
Net Current Asset -2.68
Grand Total 100.00
Name Industries/Rating % of NAV
31 July 2016
Industry Allocation:
Pharmaceuticals 17.39%Consumer Non Durables 12.49%Auto 6.29%Cement 4.19%Finance 3.80%Banks 3.53%Power 2.99%Software 2.80%Construction 2.21%Chemicals 1.71%
Regular Plan NAV as on Growth Option ( ` per Unit)June 30, 2016 17.3822Fund Performance
NAV (`) : (as on 29th July 2016)
Regular Plan Growth 17.5462Regular Plan Dividend 12.0285Regular Plan Dividend-Annually 10.3219Direct Plan Growth 17.8373Direct Plan Dividend 12.2845Direct Plan Dividend-Annually 10.6820
17
“For complete list of holdings please visit our website www.idfcmf.com”
Direct Plan Growth Option (NAV as on ` per Unit)June 30, 2016 17.6618
Telecom - Services 1.63%Oil 1.56%Pesticides 1.41%Petroleum Products 0.99%Media & Entertainment 0.92%Ferrous Metals 0.79%Construction Project 0.57%Textile Products 0.39%Minerals/Mining 0.08%Services 0.03%
IDFC Arbitrage Plus Fund
Riskometer
Investors understand that their principal will be at Moderate risk
This product is suitable for investors who are seeking*:Ÿ To generate low volatility
returns over short to medium term
Ÿ Investments predominantly in arbitrage opportunities in the cash and derivative segments of the equity markets and the arbitrage opportunities available within the derivative segment and by investing the balance in debt and money market instruments.
*Investors should consult their financial advisers if in doubt about whether the product is suitable for them.
Lumpsum InvestmentLumpsum Investment
PeriodScheme
Returns ^Benchmark Returns #
Alternate Benchmark Returns ##
Current Value (`) of Standard Investment of `10,000
Benchmark#
Alternate Benchmark##
Scheme^
NAV per
Unit (`)
Jun 09, 2008 (Since Inception) 10.0000 7.10% 7.72% 7.87% 17,382 18,210 18,413Jun 30, 2015 To Jun 30, 2016 16.3591 6.25% 7.90% -0.96%Jun 30, 2014 To Jun 30, 2015 15.2342 7.38% 8.77% 9.95% NAJun 28, 2013 To Jun 30, 2014 14.0061 8.72% 9.63% 30.09%
PeriodSchemeReturns^
Benchmark Returns #
Alternate Benchmark Returns ##
Current Value (`) of Standard Investment of `10,000
Benchmark#
Alternate Benchmark##
Scheme^
NAV per
Unit (`)
Dec 31, 2013 (Since Inception) 14.6474 7.78% 8.57% 11.57% 12,058 12,282 13,147
Jun 30, 2015 To Jun 30, 2016 16.5224 6.90% 7.90% -0.96%
Jun 30, 2014 To Jun 30, 2015 15.2738 8.17% 8.77% 9.95% NA
* Risk-free rate assumed to be 6.59% (FBIL OVERNIGHT MIBOR as on 29th July, 2016). Portfolio Turnover ratio is calculated as Lower of purchase or sale during the period / Average AUM for the last one year (includes Fixed Income securities and Equity derivatives).
Ratios calculated on the basis of 3 years history of monthly data.^
NAV (`) : (as on 29th July 2016)
Regular Plan Growth 1.0036
Regular Plan Dividend 11.3498
Direct Plan Growth 1.0036
Direct Plan Dividend 11.6190
FUND FEATURES
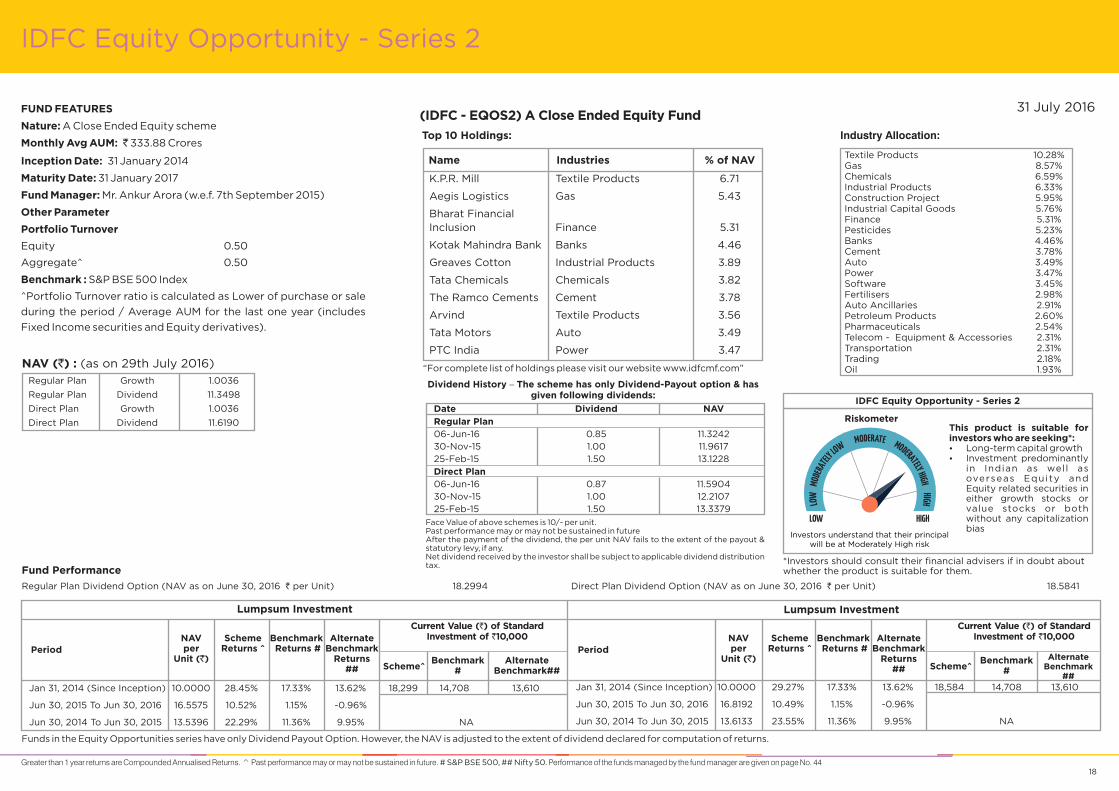
Nature: A Close Ended Equity scheme
Monthly Avg AUM: ̀ 333.88 Crores
Inception Date: 31 January 2014
Maturity Date: 31 January 2017
Fund Manager: Mr. Ankur Arora (w.e.f. 7th September 2015)
Other Parameter
Portfolio Turnover
Equity 0.50
Aggregate^ 0.50
Benchmark : S&P BSE 500 Index
^Portfolio Turnover ratio is calculated as Lower of purchase or sale
during the period / Average AUM for the last one year (includes
Fixed Income securities and Equity derivatives).
IDFC Equity Opportunity - Series 2
18
Industry Allocation:
Textile Products 10.28%Gas 8.57%Chemicals 6.59%Industrial Products 6.33%Construction Project 5.95%Industrial Capital Goods 5.76%Finance 5.31%Pesticides 5.23%Banks 4.46%Cement 3.78%Auto 3.49%Power 3.47%Software 3.45%Fertilisers 2.98%Auto Ancillaries 2.91%Petroleum Products 2.60%Pharmaceuticals 2.54%Telecom - Equipment & Accessories 2.31%Transportation 2.31%Trading 2.18%Oil 1.93%
31 July 2016(IDFC - EQOS2) A Close Ended Equity Fund
Top 10 Holdings:
Name Industries % of NAV
K.P.R. Mill Textile Products 6.71
Aegis Logistics Gas 5.43
Bharat Financial Inclusion Finance 5.31
Kotak Mahindra Bank Banks 4.46
Greaves Cotton Industrial Products 3.89
Tata Chemicals Chemicals 3.82
The Ramco Cements Cement 3.78
Arvind Textile Products 3.56
Tata Motors Auto 3.49
PTC India Power 3.47
“For complete list of holdings please visit our website www.idfcmf.com”
Face Value of above schemes is 10/- per unit.Past performance may or may not be sustained in futureAfter the payment of the dividend, the per unit NAV fails to the extent of the payout & statutory levy, if any.Net dividend received by the investor shall be subject to applicable dividend distribution tax.
Dividend History – The scheme has only Dividend-Payout option & has given following dividends:
Date Dividend NAVRegular Plan06-Jun-16 0.85 11.3242
Direct Plan
30-Nov-15 1.00 11.961725-Feb-15 1.50 13.1228
06-Jun-16 0.87 11.590430-Nov-15 1.00 12.210725-Feb-15 1.50 13.3379
Greater than 1 year returns are Compounded Annualised Returns. ̂ Past performance may or may not be sustained in future. # S&P BSE 500, ## Nifty 50. Performance of the funds managed by the fund manager are given on page No. 44
Regular Plan NAV as on Dividend Option ( ` per Unit)June 30, 2016 18.2994 Direct Plan Dividend Option (NAV as on ` per Unit)June 30, 2016 18.5841
Funds in the Equity Opportunities series have only Dividend Payout Option. However, the NAV is adjusted to the extent of dividend declared for computation of returns.
Fund Performance
IDFC Equity Opportunity - Series 2
Riskometer
Investors understand that their principal will be at Moderately High risk
This product is suitable for investors who are seeking*:Ÿ Long-term capital growthŸ Investment predominantly
in Indian as well as overseas Equity and Equity related securities in either growth stocks or value stocks or both without any capitalization bias
*Investors should consult their financial advisers if in doubt about whether the product is suitable for them.
Jan 31, 2014 (Since Inception) 10.0000 28.45% 17.33% 13.62% 18,299 14,708 13,610
Jun 30, 2015 To Jun 30, 2016 16.5575 10.52% 1.15% -0.96%
Jun 30, 2014 To Jun 30, 2015 13.5396 22.29% 11.36% 9.95% NA
Lumpsum Investment
PeriodScheme
Returns ^Benchmark Returns #
Alternate Benchmark
Returns ##
Current Value (`) of Standard Investment of `10,000
Benchmark#
Alternate Benchmark##Scheme^
NAV per
Unit (`)
Lumpsum Investment
PeriodScheme
Returns ^Benchmark Returns #
Alternate Benchmark
Returns ##
Current Value (`) of Standard Investment of `10,000
Benchmark#
Alternate Benchmark
##Scheme^
NAV per
Unit (`)
Jan 31, 2014 (Since Inception) 10.0000 29.27% 17.33% 13.62% 18,584 14,708 13,610
Jun 30, 2015 To Jun 30, 2016 16.8192 10.49% 1.15% -0.96%
Jun 30, 2014 To Jun 30, 2015 13.6133 23.55% 11.36% 9.95% NA

FUND FEATURES
Nature:
Inception Date:
Fund Manager:
Equity Portion:
Debt Portion:
About the fund:
Other Parameter:
Benchmark :
Debt
263.56 Crores
25 February 2010
Mr. Anoop Bhaskar (w.e.f. 15th July 2016)
Mr. Anurag Mittal (w.e.f. 09th November 2015)
MIP is a hybrid fund which offers up to 25%participation in the equity markets with the balance invested in fixedincome. The Equity portfolio of the fund is an all cap portfolio. TheFixed Income portfolio is a mix of high quality debt and moneymarket instruments.
`Monthly Avg AUM:
Modified Duration: 4.76 years *
Average Maturity: 6.64 years *
Yield to Maturity: 7.14%
*Of Debt Allocation Only
Equity 24.92%
Debt 75.08%
Crisil MIP Blended Index
Asset allocation:
(IDFC - MIP) An Open Ended Debt Fund
IDFC Monthly Income Plan
Portfolio :
Name Rating/Industry % of NAV Name Rating/Industry % of NAV
19
NAV ( ) :` (as on 29th July 2016)
Regular Plan - Dividend - 13.0149
Regular Plan - Growth - 18.3405
Regular Plan - Dividend Quarterly 13.2310
Direct Plan - Growth - 18.9212
Direct Plan - Dividend - 13.5570
Direct Plan - Dividend Quarterly 14.0123
CBLO 8.87
Government Bond 53.94
Corporate Bond 11.06
Top 10 Equity 9.68
7.72% - 2025 G-Sec SOV 52.36
8.08% - 2022 G-Sec SOV 1.58
Small Industries Dev Bank of India AAA 5.74
Blue Dart Express AA 2.61
HDFC Bank AAA 1.41
NHPC AAA 1.30
HDFC Bank Banks 1.34
Vardhman Textiles Textiles - Cotton 1.03
JM Financial Finance 1.01
SRF Textile Products 1.00
ICICI Bank Banks 0.96
Kotak Mahindra Bank Banks 0.92
State Bank of India Banks 0.89
Alkem Laboratories Pharmaceuticals 0.86
Asian Paints Consumer Non Durables 0.84
Maruti Suzuki India Auto 0.83
Other Equity 15.25
Net Current Asset 1.22
Grand Total 100.00
Monthly income is not assured and is subject to availability of distributable surplus
ASSET QUALITY:
AA 3.47%
AAA Equivalent 96.53%
Direct Plan Growth Option (NAV as on , 2016 per Unit)June 30 ` 18.2949Regular Plan NAV as on , 2016Growth Option ( per Unit)June 30 ` 17.7431
Fund Performance
PeriodScheme
Returns ^BenchmarkReturns #
AlternateBenchmarkReturns ##
Current Value ( ) of StandardInvestment of 10,000
`
`
Benchmark#
AlternateBenchmark
##
Scheme^
NAVper
Unit ( )`
Lumpsum Investment
Jan 01, 2013 (Since Inception) 12.9116 10.48% 9.27% 7.22% 14,169 13,634 12,759
Jun 30, 2015 To Jun 30, 2016 16.9959 7.64% 8.63% 10.03%
Jun 30, 2014 To Jun 30, 2015 14.9201 13.91% 11.05% 11.76% NA
Jun 28, 2013 To Jun 30, 2014 13.3264 11.89% 8.24% -2.46%
Feb 25, 2010 (Since Inception) 10.0000 9.45% 8.49% 6.57% 17,743 16,772 14,974
Jun 30, 2015 To Jun 30, 2016 16.6077 6.84% 8.63% 10.03%
Jun 30, 2014 To Jun 30, 2015 14.7562 12.55% 11.05% 11.76% NA
Jun 28, 2013 To Jun 30, 2014 13.2787 11.06% 8.24% -2.46%
PeriodScheme
Returns ^BenchmarkReturns #
AlternateBenchmarkReturns ##
Current Value ( ) of StandardInvestment of 10,000
`
`
Benchmark#
AlternateBenchmark##Scheme^
NAVper
Unit ( )`
Lumpsum Investment
^ Past performance may or may not be sustained in future. # Crisil MIP Blended Index, ## 10 Year GOI.Crisil Performance of the funds managed by the fund manager are given on page No. 40
31 July 2016
IDFC - Monthly Income Plan
Riskometer
Investors understand that theirprincipal will be at Moderately High risk
This product is suitable for investorswho are seeking*:=
=
Capital appreciation and provideregular income over a long periodof time.Investment primarily in debtsecurities to generate regularreturns and investment of aportion of the Scheme's assets inequity securities to generate long-term capital appreciation.
*Investors should consult their financial advisers if in doubt about whetherthe product is suitable for them.
Plan Freq NAV
FUND FEATURES
Nature:
Inception Date:
Fund Manager:
:
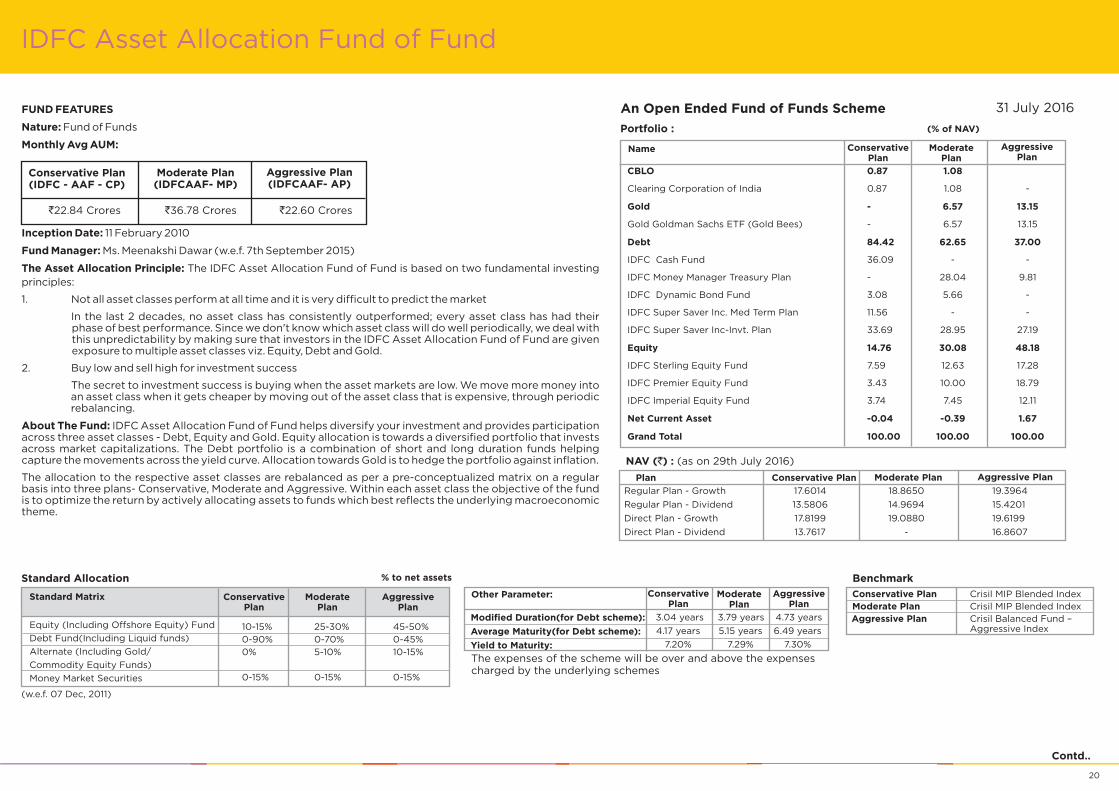
Fund of Funds
11 February 2010
Ms. Meenakshi Dawar (w.e.f. 7th September 2015)
Monthly Avg AUM:
About The Fund:
The IDFC Asset Allocation Fund of Fund is based on two fundamental investing
principles:
1. Not all asset classes perform at all time and it is very difficult to predict the market
In the last 2 decades, no asset class has consistently outperformed; every asset class has had theirphase of best performance. Since we don't know which asset class will do well periodically, we deal withthis unpredictability by making sure that investors in the IDFC Asset Allocation Fund of Fund are givenexposure to multiple asset classes viz. Equity, Debt and Gold.
2. Buy low and sell high for investment success
The secret to investment success is buying when the asset markets are low. We move more money intoan asset class when it gets cheaper by moving out of the asset class that is expensive, through periodicrebalancing.
IDFC Asset Allocation Fund of Fund helps diversify your investment and provides participationacross three asset classes - Debt, Equity and Gold. Equity allocation is towards a diversified portfolio that investsacross market capitalizations. The Debt portfolio is a combination of short and long duration funds helpingcapture the movements across the yield curve. Allocation towards Gold is to hedge the portfolio against inflation.
The allocation to the respective asset classes are rebalanced as per a pre-conceptualized matrix on a regularbasis into three plans- Conservative, Moderate and Aggressive. Within each asset class the objective of the fundis to optimize the return by actively allocating assets to funds which best reflects the underlying macroeconomictheme.
The Asset Allocation Principle
IDFC Asset Allocation Fund of Fund
Moderate Plan(IDFCAAF- MP)
Aggressive Plan(IDFCAAF- AP)
Conservative Plan(IDFC - AAF - CP)
22.84 Crores 36.78 Crores 22.60 Crores` ` `
Contd..
20
An Open Ended Fund of Funds Scheme
NAV ( ) :` (as on 2016)29th July
Conservative Plan Moderate Plan Aggressive Plan
Portfolio :
Name ModeratePlan
AggressivePlan
(% of NAV)
ConservativePlan
CBLO
Gold
Debt
Equity
Net Current Asset
Grand Total
Clearing Corporation of India
Gold Goldman Sachs ETF (Gold Bees)
IDFC Cash Fund
IDFC Money Manager Treasury Plan
IDFC Dynamic Bond Fund
IDFC Super Saver Inc. Med Term Plan
IDFC Super Saver Inc-Invt. Plan
IDFC Sterling Equity Fund
IDFC Premier Equity Fund
IDFC Imperial Equity Fund
0.87 1.08
- 6.57 13.15
84.42 62.65 37.00
14.76 30.08 48.18
-0.04 -0.39 1.67
100.00 100.00 100.00
0.87 1.08 -
- 6.57 13.15
36.09 - -
- 28.04 9.81
3.08 5.66 -
11.56 - -
33.69 28.95 27.19
7.59 12.63 17.28
3.43 10.00 18.79
3.74 7.45 12.11
Plan
Regular Plan - Growth 17.6014 18.8650 19.3964
Regular Plan - Dividend 13.5806 14.9694 15.4201
Direct Plan - Growth 17.8199 19.0880 19.6199
Direct Plan - Dividend 13.7617 - 16.8607
31 July 2016
ModeratePlan
Equity (Including Offshore Equity) Fund
Debt Fund(Including Liquid funds)
Alternate (Including Gold/
Commodity Equity Funds)
Money Market Securities
AggressivePlan
Standard Allocation
ConservativePlan
Standard Matrix
% to net assets
(w.e.f. 07 Dec, 2011)
Benchmark
Conservative Plan
Moderate Plan
Aggressive Plan
Crisil MIP Blended Index
Crisil MIP Blended Index
Balanced Fund –Aggressive IndexCrisil
Other Parameter: ModeratePlan
AggressivePlan
ConservativePlan
The expenses of the scheme will be over and above the expensescharged by the underlying schemes
Modified Duration(for Debt scheme):
Average Maturity(for Debt scheme):
Yield to Maturity:
3.04 years 3.79 years 4.73 years
4.17 years 5.15 years 6.49 years
7.20% 7.29% 7.30%
10-15% 25-30% 45-50%
0-90% 0-70% 0-45%
0% 5-10% 10-15%
0-15% 0-15% 0-15%

IDFC Asset Allocation Fund of Fund
21
Direct Plan Growth Option (NAV as on per Unit)June 30, 2016 18.9088`Regular Plan NAV as onGrowth Option ( per Unit)June 30, 2016 18.7013`
Aggressive Plan
^ Past performance may or may not be sustained in future. Crisil# CRISIL MIP Blended Index, ## 10 Year GOI
Direct Plan Growth Option (NAV as on per Unit)June 30, 2016 18.5301`Regular Plan NAV as onGrowth Option ( per Unit)June 30, 2016 18.3207`
Moderate Plan
^ Past performance may or may not be sustained in future. CrisilPerformance of the funds managed by the fund manager are given on page No. 41-42
# CRISIL Balanced Fund – Aggressive Index, ## 10 Year GOI
^ Past performance may or may not be sustained in future. # CRISIL MIP Blended Index, ## 10 Year GOICrisil
Regular Plan NAV as on , 2016Growth Option ( per Unit)June 30 17.2201`
Conservative PlanDirect Plan Growth Option (NAV as on per Unit)June 30, 2016 17.4270`
31 July 2016
IDFC AAF - Aggressive Plan
Riskometer
Investors understand that theirprincipal will be at Moderately High risk
This product is suitable for investorswho are seeking*:=
=
Capital appreciation and provide regularincome over a long period of time.Investment in different mutual fundschemes primarily local funds based ona defined asset allocation model.
*Investors should consult their financial advisers if in doubt about whetherthe product is suitable for them.
*Investors should consult their financial advisers if in doubt about whetherthe product is suitable for them.
*Investors should consult their financial advisers if in doubt about whetherthe product is suitable for them.
IDFC AAF - Conservative Plan
Riskometer
Investors understand that theirprincipal will be at Moderate risk
This product is suitable for investorswho are seeking*:=
=
Capital appreciation and provide regularincome over a long period of time.Investment in different mutual fundschemes primarily local funds based ona defined asset allocation model.
IDFC AAF - Moderate Plan
Riskometer
Investors understand that theirprincipal will be at Moderately High risk
This product is suitable for investorswho are seeking*:=
=
Capital appreciation and provide regularincome over a long period of time.
Investment in different mutual fundschemes primarily local funds based ona defined asset allocation model.
PeriodScheme
Returns ^BenchmarkReturns #
AlternateBenchmarkReturns ##
Current Value ( ) of StandardInvestment of 10,000
`
`
Benchmark#
AlternateBenchmark
##
Scheme^
NAVper
Unit ( )`
Lumpsum Investment
Feb 11, 2010 (Since Inception) 10.0000 8.88% 8.48% 6.62% 17,220 16,821 15,056Jun 30, 2015 To Jun 30, 2016 16.1488 6.63% 8.63% 10.03%Jun 30, 2014 To Jun 30, 2015 14.3748 12.34% 11.05% 11.76% NAJun 28, 2013 To Jun 30, 2014 12.8196 12.06% 8.24% -2.46%
PeriodScheme
Returns ^BenchmarkReturns #
AlternateBenchmarkReturns ##
Current Value ( ) of StandardInvestment of 10,000
`
`
Benchmark#
AlternateBenchmark##Scheme^
NAVper
Unit ( )`
Lumpsum Investment
PeriodScheme
Returns ^BenchmarkReturns #
AlternateBenchmarkReturns ##
Current Value ( ) of StandardInvestment of 10,000
`
`
Benchmark#
AlternateBenchmark
##
Scheme^
NAVper
Unit ( )`
Lumpsum Investment
Feb 26, 2013 (Since Inception) 12.9866 11.22% 9.50% 6.81% 14,269 13,543 12,465Jun 30, 2015 To Jun 30, 2016 17.3273 6.94% 8.63% 10.03%Jun 30, 2014 To Jun 30, 2015 15.1965 14.02% 11.05% 11.76% NAJun 28, 2013 To Jun 30, 2014 13.0542 16.31% 8.24% -2.46%
Feb 11, 2010 (Since Inception) 10.0000 9.94% 8.48% 6.62% 18,321 16,821 15,056Jun 30, 2015 To Jun 30, 2016 17.2224 6.38% 8.63% 10.03%Jun 30, 2014 To Jun 30, 2015 15.1784 13.47% 11.05% 11.76% NAJun 28, 2013 To Jun 30, 2014 13.0504 16.21% 8.24% -2.46%
PeriodScheme
Returns ^BenchmarkReturns #
AlternateBenchmarkReturns ##
Current Value ( ) of StandardInvestment of 10,000
`
`
Benchmark#
AlternateBenchmark##Scheme^
NAVper
Unit ( )`
Lumpsum Investment
PeriodScheme
Returns ^BenchmarkReturns #
AlternateBenchmarkReturns ##
Current Value ( ) of StandardInvestment of 10,000
`
`
Benchmark#
AlternateBenchmark
##
Scheme^
NAVper
Unit ( )`
Lumpsum Investment
Jan 01, 2013 (Since Inception) 13.2627 10.68% 9.89% 7.22% 14,257 13,904 12,759Jun 30, 2015 To Jun 30, 2016 17.9115 5.57% 4.82% 10.03%Jun 30, 2014 To Jun 30, 2015 15.5890 14.90% 8.78% 11.76% NAJun 28, 2013 To Jun 30, 2014 12.6105 23.48% 20.88% -2.46%
Feb 11, 2010 (Since Inception) 10.0000 10.30% 8.94% 6.62% 18,701 17,281 15,056Jun 30, 2015 To Jun 30, 2016 17.8093 5.01% 4.82% 10.03%Jun 30, 2014 To Jun 30, 2015 15.5760 14.34% 8.78% 11.76% NAJun 28, 2013 To Jun 30, 2014 12.6111 23.37% 20.88% -2.46%
PeriodScheme
Returns ^BenchmarkReturns #
AlternateBenchmarkReturns ##
Current Value ( ) of StandardInvestment of 10,000
`
`
Benchmark#
AlternateBenchmark##Scheme^
NAVper
Unit ( )`
Lumpsum Investment
Apr 02, 2013 (Since Inception) 12.6036 10.50% 9.64% 7.14% 13,827 13,484 12,508Jun 30, 2015 To Jun 30, 2016 16.2527 7.23% 8.63% 10.03%Jun 30, 2014 To Jun 30, 2015 14.3969 12.89% 11.05% 11.76% NAJun 28, 2013 To Jun 30, 2014 12.8275 12.16% 8.24% -2.46%

FUND FEATURES
Nature:
:
Inception Date:
Fund Manager:
About the fund:
Benchmark :
Fund of Funds
109.48 Crores
13 September 2004
Mr. Harshal Joshi (w.e.f 15th July 2016)
All Seasons Bond Fund is a Fund of Fund (FOF)structure which can invest in one or more funds within our basket ofshort term offerings. The portfolio gives the fund manager theflexibility to play between debt and money market, benefiting fromthe accrual available in its space and optimizing the portfolio yields.
`Monthly Avg AUM
Other Parameter:
Modified duration: 2.31 years
Average Maturity: 2.84 years
Yield to Maturity: 7.60%
Crisil Short Term Bond Fund Index(w.e.f. 30th November 2015)
The expenses of the scheme will be over and above the expensescharged by the underlying schemes.
(IDFC – ASBF) An Open Ended Fund of Funds Scheme
IDFC All Seasons Bond Fund
NAV ( ) :` (as on 2016)29th JulyPortfolio :
Greater than 1 year returns are Compounded Annualised Returns. ^ Past performance may or may not be sustained in future
# CRISIL Short-Term Bond Fund Index ## 1 Year T-BillCrisil
## 1 Year T-Bill
Performance of the funds managed by the fund manager are given on page No. 54-55
Top Holdings % of NAV
Mutual Fund Units 99.86
Net Current Asset 0.14
Grand Total 100.00
IDFC Corporate Bond Fund 64.35
IDFC Ultra Short Term Fund 35.51
22
ASSET QUALITY:
AAA 93.35%
AA+
Equivalent
4.94%
AA 1.71%
Plan Option Freq NAV
Direct Plan Growth Option (NAV as on per Unit)June 30, 2016 24.1816`Regular Plan NAV as onGrowth Option ( per Unit)June 30, 2016 23.8115`
Fund Performance
Regular Plan Growth - 24.1369
Regular Plan Dividend Quarterly 12.4248
Regular Plan Dividend Half Yearly 12.0028
Regular Plan Dividend Annual 11.8817
Regular Plan Dividend Fortnightly 11.0515
Regular Plan Dividend Daily 11.0212
Regular Plan Dividend Weekly 11.0392
Direct Plan Growth - 24.5206
Direct Plan Dividend Daily 11.0026
Direct Plan Dividend Quarterly 12.5705
Direct Plan Dividend Fortnightly 11.0521
Direct Plan Dividend Periodic 11.9180
31 July 2016
IDFC All Seasons Bond Fund
Riskometer
Investors understand that their principalwill be at Moderately Low Risk
This product is suitable forinvestors who are seeking*:
=
=
To generate short term optimal returnswith high liquidity.
Investment predominantly in debtoriented mutual fund schemes andmoney market instruments
*Investors should consult their financial advisers if in doubt about whetherthe product is suitable for them.
PeriodScheme
Returns ^BenchmarkReturns #
AlternateBenchmarkReturns ##
Current Value ( ) of StandardInvestment of 10,000
`
`
Benchmark#
AlternateBenchmark
##
Scheme^
NAVper
Unit ( )`
Lumpsum Investment
Feb 22, 2013 (Since Inception) 17.9002 9.38% 9.21% 7.45% 13,509 13,438 12,725
Jun 30, 2015 To Jun 30, 2016 22.1931 8.96% 8.94% 7.67%
Jun 30, 2014 To Jun 30, 2015 20.2121 9.80% 9.56% 8.54% NA
Jun 28, 2013 To Jun 30, 2014 18.4252 9.64% 8.76% 5.89%
Sep 13, 2004 (Since Inception) 10.0000 7.63% 7.52% 6.04% 23,812 23,526 19,985
Jun 30, 2015 To Jun 30, 2016 21.9499 8.48% 8.94% 7.67%
Jun 30, 2014 To Jun 30, 2015 20.0772 9.33% 9.56% 8.54% NA
Jun 28, 2013 To Jun 30, 2014 18.3965 9.08% 8.76% 5.89%
PeriodScheme
Returns ^BenchmarkReturns #
AlternateBenchmarkReturns ##
Current Value ( ) of StandardInvestment of 10,000
`
`
Benchmark#
AlternateBenchmark##Scheme^
NAVper
Unit ( )`
Lumpsum Investment

IDFC Cash Fund
Investors understand that their principalwill be at Low Risk
This product is suitable forinvestors who are seeking*:
=
=
To generate short term optimal returnswith high liquidity.
Investments in high quality moneymarket and debt instruments.
*Investors should consult their financial advisers if in doubt about whetherthe product is suitable for them.
Riskometer
FUND FEATURES
Nature:
Inception Date:
Fund Manager:
About the fund:
Other Parameter:
Benchmark :
Liquid Fund
10,386.68 Crores
2 July 2001
Mr. Harshal Joshi &Mr. Anurag Mittal (w.e.f. 09th November 2015)
The Fund aims to invest in high quality debt andmoney market instruments with high liquidity and seeks togenerate accrual income with low volatility.
Modified Duration: 30
Average Maturity: 30
Crisil Liquid Fund Index
Monthly Avg AUM: `
(w.e.f. 15th September 2015)
days
days
Yield to Maturity: 7.05%
(IDFC - CF) An Open Ended Liquid Fund
IDFC Cash Fund
NAV ( ) :` (as on 2016)31st July
23
Portfolio :
Name Rating % of NAVName Rating % of NAV
ASSET QUALITY:
AAA Equivalent 98.88%
AA+ 1.12%
Name Rating % of NAV
Certificate of Deposit 16.75
Corporate Bond 1.26
Zero Coupon Bonds 1.12
Net Current Asset 0.48
Grand Total 100.00
Axis Bank A1+ 3.33
IndusInd Bank A1+ 2.57
Kotak Mahindra Bank A1+ 2.56
Canara Bank A1+ 2.55
Corporation Bank A1+ 2.55
Punjab & Sind Bank A1+ 1.03
Bank of Maharashtra A1+ 0.77
ICICI Bank A1+ 0.71
Vijaya Bank A1+ 0.67
Power Finance Corporation AAA 0.85
UltraTech Cement AAA 0.41
Bajaj Finance AA+ 1.12
Commercial Paper 54.61
Treasury Bills 25.78
Indiabulls Housing Finance A1+ 6.15
NABARD A1+ 5.11
Reliance Retail A1+ 4.11
Reliance Jio Infocomm A1+ 4.10
India Infoline Finance A1+ 4.09
Steel Authority of India A1+ 3.08
Sun Pharma Laboratories A1+ 2.55
Piramal Enterprises A1+ 2.30
Coromandel International A1+ 2.06
Vodafone India A1+ 2.05
Tata Housing Development Co A1+ 2.05
IL&FS Financial Services A1+ 1.53
M&M Financial Services A1+ 1.53
Tata Motors Finance A1+ 1.53
Trapti Trading & Invest Pvt A1+ 1.28
Axis Finance A1+ 1.13
JM Financial Services A1+ 1.07
Hero Fincorp A1+ 1.02
GIC Housing Finance A1+ 1.02
JM Financial Credit Solution A1+ 1.02
Turquoise Invest & Finance Pvt A1+ 0.77
Birla TMT Holdings Pvt A1+ 0.77
TGS Investment & Trade Pvt A1+ 0.77
JM Financial Products A1+ 0.77
Godrej Agrovet A1+ 0.51
Sundaram BNP Paribas Home Finance A1+ 0.51
Bajaj Finance A1+ 0.51
Kotak Mahindra Investments A1+ 0.46
Rural Electrification Corporation A1+ 0.26
Afcons Infrastructure A1+ 0.26
ICICI Securities A1+ 0.25
91 Days Tbill (MD 25/08/2016) SOV 6.54
91 Days Tbill (MD 11/08/2016) SOV 6.21
91 Days Tbill (MD 15/09/2016) SOV 4.69
91 Days Tbill (MD 13/10/2016) SOV 3.67
91 Days Tbill (MD 29/09/2016) SOV 3.03
91 Days Tbill (MD 22/09/2016) SOV 1.62
91 Days Tbill (MD 08/09/2016) SOV 0.02
91 Days Tbill (MD 20/10/2016) SOV 0.001
Fund PerformanceUnder The IDFC-CF-Regular Plan Growth
Past performance may or may not be sustained in future.
Fund PerformanceUnder The IDFC-CF-Direct Plan Growth
Past performance may or may not be sustained in future.
Performance of the funds managed by the fund manager are given on page No. 55
IDFC-CF Regular Growth Crisil Liquid Fund Index Crisil Index1 Year T-BillIDFC-CF Direct Growth Crisil Liquid Fund Index Crisil Index1 Year T-Bill
Plan Option Freq NAV
Regular Plan Growth - 1886.0271
Regular Plan Dividend Daily 1001.0846
Regular Plan Dividend Weekly 1001.4738
Regular Plan Dividend Periodic 1243.7227
Regular Plan Dividend Monthly 1000.9148
Direct Plan Growth - 1889.6033
Direct Plan Dividend Daily 1001.6663
Direct Plan Dividend Monthly 1007.6399
Direct Plan Dividend Weekly 1007.3527
Direct Plan Dividend Periodic 1167.8680
31 July 2016
(Annualised) 7 Days (Annualised) 15 Days (Annualised) 1 Month
IND A1+
mfs
by FITCH
(Annualised) 7 Days (Annualised) 15 Days (Annualised) 1 Month
A1+ mfs
by ICRA
7.14% 7.21% 7.33%
6.55% 6.94%
7.42%7.53% 6.96%7.90%
7.06% 7.13% 7.25%
6.55% 6.94%
7.42%7.53% 6.96%7.90%
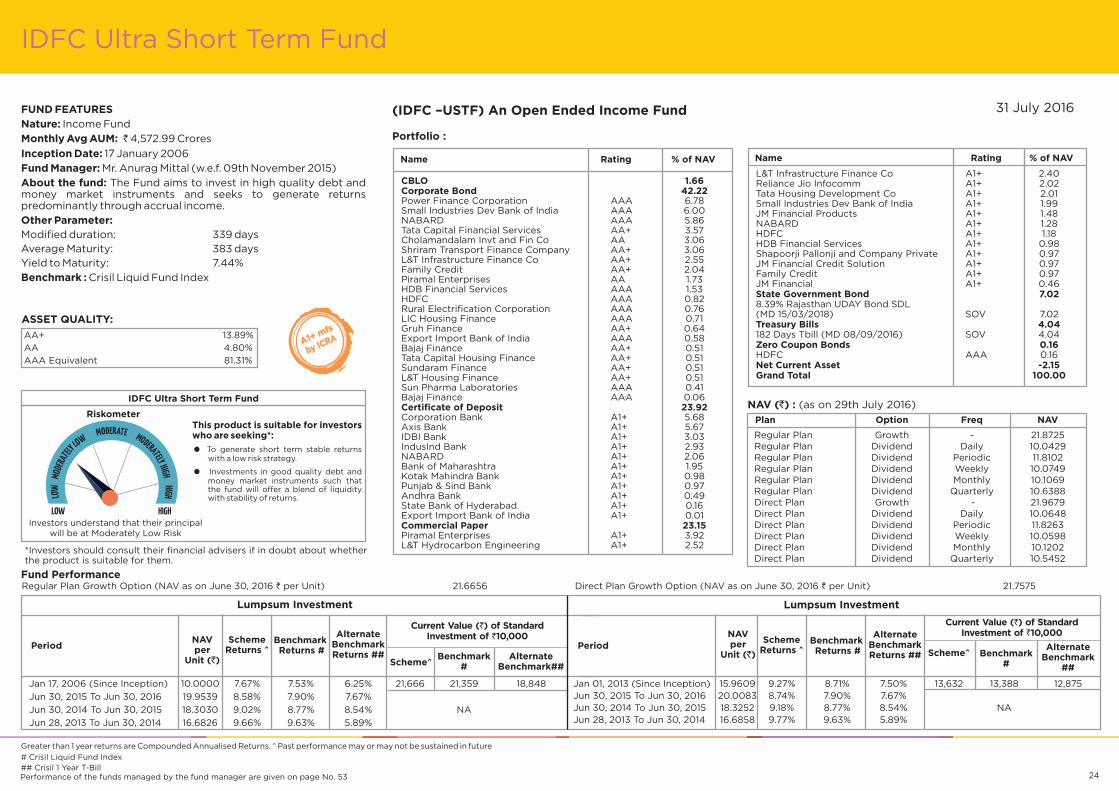
FUND FEATURES
Nature:
Inception Date:
Fund Manager:
About the fund:
Benchmark :
4,572.99 Crores
17 January 2006
The Fund aims to invest in high quality debt andmoney market instruments and seeks to generate returnspredominantly through accrual income.
Income Fund
Modified duration: 339 days
Average Maturity: 383 days
Yield to Maturity: 7.44%
Crisil Liquid Fund Index
Monthly Avg AUM: `
Mr. Anurag Mittal (w.e.f. 09th November 2015)
Other Parameter:
(IDFC –USTF) An Open Ended Income Fund
IDFC Ultra Short Term Fund
NAV ( ) :` (as on 2016)29th July
Greater than 1 year returns are Compounded Annualised Returns. ^ Past performance may or may not be sustained in future
# Crisil Liquid Fund Index
## 1 Year T-BillCrisilPerformance of the funds managed by the fund manager are given on page No. 53 24
Portfolio :
Name Rating % of NAV Name Rating % of NAV
L&T Infrastructure Finance Co A1+ 2.40Reliance Jio Infocomm A1+ 2.02Tata Housing Development Co A1+ 2.01Small Industries Dev Bank of India A1+ 1.99JM Financial Products A1+ 1.48NABARD A1+ 1.28HDFC A1+ 1.18HDB Financial Services A1+ 0.98Shapoorji Pallonji and Company Private A1+ 0.97JM Financial Credit Solution A1+ 0.97Family Credit A1+ 0.97JM Financial A1+ 0.46
8.39% Rajasthan UDAY Bond SDL(MD 15/03/2018) SOV 7.02
182 Days Tbill (MD 08/09/2016) SOV 4.04
HDFC AAA 0.16
State Government Bond 7.02
Treasury Bills 4.04
Zero Coupon Bonds 0.16
Net Current Asset -2.15Grand Total 100.00
ASSET QUALITY:
AA+ 13.89%
AA 4.80%
AAA Equivalent 81.31%
CBLO 1.66Corporate Bond 42.22
Certificate of Deposit 23.92
Commercial Paper 23.15
Power Finance Corporation AAA 6.78Small Industries Dev Bank of India AAA 6.00NABARD AAA 5.86Tata Capital Financial Services AA+ 3.57Cholamandalam Invt and Fin Co AA 3.06Shriram Transport Finance Company AA+ 3.06L&T Infrastructure Finance Co AA+ 2.55Family Credit AA+ 2.04Piramal Enterprises AA 1.73HDB Financial Services AAA 1.53HDFC AAA 0.82Rural Electrification Corporation AAA 0.76LIC Housing Finance AAA 0.71Gruh Finance AA+ 0.64Export Import Bank of India AAA 0.58Bajaj Finance AA+ 0.51Tata Capital Housing Finance AA+ 0.51Sundaram Finance AA+ 0.51L&T Housing Finance AA+ 0.51Sun Pharma Laboratories AAA 0.41Bajaj Finance AAA 0.06
Corporation Bank A1+ 5.68Axis Bank A1+ 5.67IDBI Bank A1+ 3.03IndusInd Bank A1+ 2.93NABARD A1+ 2.06Bank of Maharashtra A1+ 1.95Kotak Mahindra Bank A1+ 0.98Punjab & Sind Bank A1+ 0.97Andhra Bank A1+ 0.49State Bank of Hyderabad A1+ 0.16Export Import Bank of India A1+ 0.01
Piramal Enterprises A1+ 3.92L&T Hydrocarbon Engineering A1+ 2.52
Direct Plan Growth Option (NAV as on per Unit)June 30, 2016 21.7575`Regular Plan NAV as onGrowth Option ( per Unit)June 30, 2016 21.6656`
Fund Performance
Plan Option Freq NAV
Regular Plan Growth - 21.8725
Regular Plan Dividend Daily 10.0429
Regular Plan Dividend Periodic 11.8102
Regular Plan Dividend Weekly 10.0749
Regular Plan Dividend Monthly 10.1069
Regular Plan Dividend Quarterly 10.6388
Direct Plan Growth - 21.9679
Direct Plan Dividend Daily 10.0648
Direct Plan Dividend Periodic 11.8263
Direct Plan Dividend Weekly 10.0598
Direct Plan Dividend Monthly 10.1202
Direct Plan Dividend Quarterly 10.5452
31 July 2016
IDFC Ultra Short Term Fund
Riskometer
Investors understand that their principalwill be at Moderately Low Risk
This product is suitable for investorswho are seeking*:
=
=
To generate short term stable returnswith a low risk strategy.
Investments in good quality debt andmoney market instruments such thatthe fund will offer a blend of liquiditywith stability of returns.
*Investors should consult their financial advisers if in doubt about whetherthe product is suitable for them.
PeriodScheme
Returns ^BenchmarkReturns #
AlternateBenchmarkReturns ##
Current Value ( ) of StandardInvestment of 10,000
`
`
Benchmark#
AlternateBenchmark
##
Scheme^
NAVper
Unit ( )`
Lumpsum Investment
Jan 01, 2013 (Since Inception) 15.9609 9.27% 8.71% 7.50% 13,632 13,388 12,875
Jun 30, 2015 To Jun 30, 2016 20.0083 8.74% 7.90% 7.67%
Jun 30, 2014 To Jun 30, 2015 18.3252 9.18% 8.77% 8.54% NA
Jun 28, 2013 To Jun 30, 2014 16.6858 9.77% 9.63% 5.89%
Jan 17, 2006 (Since Inception) 10.0000 7.67% 7.53% 6.25% 21,666 21,359 18,848
Jun 30, 2015 To Jun 30, 2016 19.9539 8.58% 7.90% 7.67%
Jun 30, 2014 To Jun 30, 2015 18.3030 9.02% 8.77% 8.54% NA
Jun 28, 2013 To Jun 30, 2014 16.6826 9.66% 9.63% 5.89%
PeriodScheme
Returns ^BenchmarkReturns #
AlternateBenchmarkReturns ##
Current Value ( ) of StandardInvestment of 10,000
`
`
Benchmark#
AlternateBenchmark##Scheme^
NAVper
Unit ( )`
Lumpsum Investment
A1+ mfs
by ICRA
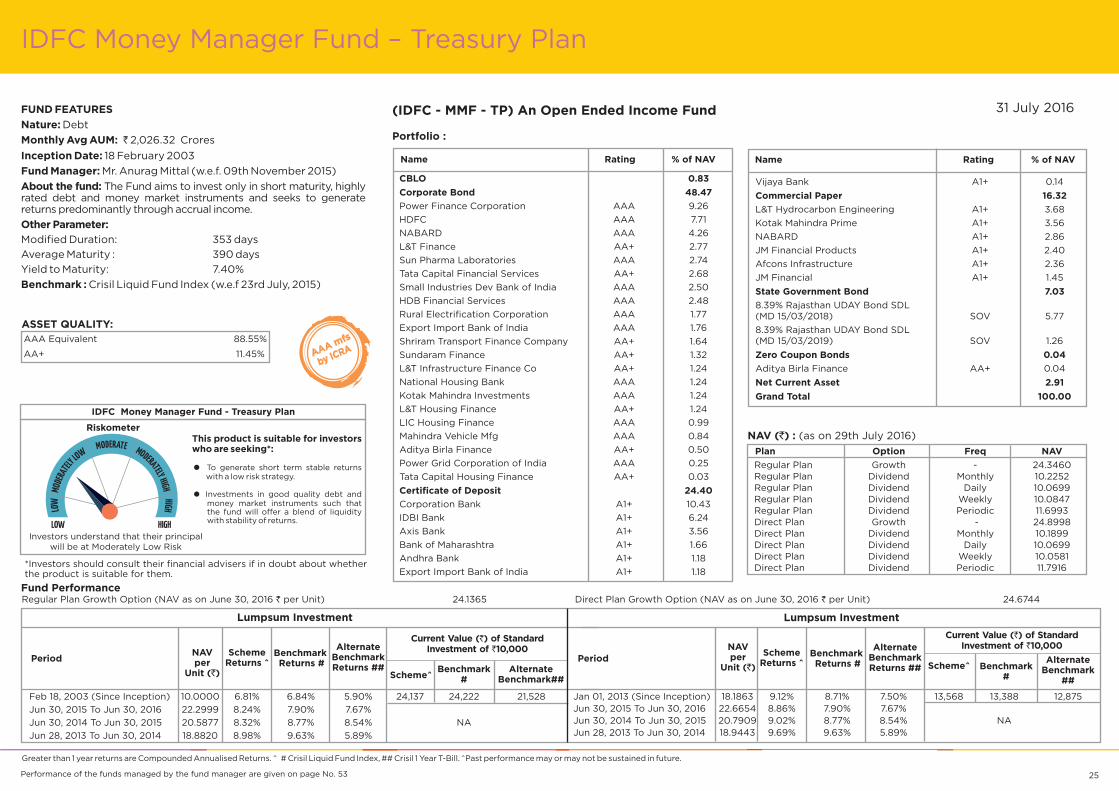
(IDFC - MMF - TP) An Open Ended Income Fund
IDFC Money Manager Fund – Treasury Plan
Greater than 1 year returns are Compounded Annualised Returns. ^ # Crisil Liquid Fund Index, ## 1 Year T-Bill. ^Past performance may or may not be sustained in future.Crisil
25Performance of the funds managed by the fund manager are given on page No. 53
Plan Option Freq NAV
Portfolio :
Name Rating % of NAV Name Rating % of NAV
Vijaya Bank A1+ 0.14
L&T Hydrocarbon Engineering A1+ 3.68
Kotak Mahindra Prime A1+ 3.56
NABARD A1+ 2.86
JM Financial Products A1+ 2.40
Afcons Infrastructure A1+ 2.36
JM Financial A1+ 1.45
8.39% Rajasthan UDAY Bond SDL(MD 15/03/2018) SOV 5.77
8.39% Rajasthan UDAY Bond SDL(MD 15/03/2019) SOV 1.26
Aditya Birla Finance AA+ 0.04
Commercial Paper 16.32
State Government Bond 7.03
Zero Coupon Bonds 0.04
Net Current Asset 2.91
Grand Total 100.00
CBLO 0.83
Corporate Bond 48.47
Certificate of Deposit 24.40
Power Finance Corporation AAA 9.26
HDFC AAA 7.71
NABARD AAA 4.26
L&T Finance AA+ 2.77
Sun Pharma Laboratories AAA 2.74
Tata Capital Financial Services AA+ 2.68
Small Industries Dev Bank of India AAA 2.50
HDB Financial Services AAA 2.48
Rural Electrification Corporation AAA 1.77
Export Import Bank of India AAA 1.76
Shriram Transport Finance Company AA+ 1.64
Sundaram Finance AA+ 1.32
L&T Infrastructure Finance Co AA+ 1.24
National Housing Bank AAA 1.24
Kotak Mahindra Investments AAA 1.24
L&T Housing Finance AA+ 1.24
LIC Housing Finance AAA 0.99
Mahindra Vehicle Mfg AAA 0.84
Aditya Birla Finance AA+ 0.50
Power Grid Corporation of India AAA 0.25
Tata Capital Housing Finance AA+ 0.03
Corporation Bank A1+ 10.43
IDBI Bank A1+ 6.24
Axis Bank A1+ 3.56
Bank of Maharashtra A1+ 1.66
Andhra Bank A1+ 1.18
Export Import Bank of India A1+ 1.18
NAV ( ) :` (as on 2016)29th July
ASSET QUALITY:
AAA Equivalent 88.55%
AA+ 11.45%
Direct Plan Growth Option (NAV as on per Unit)June 30, 2016 24.6744`Regular Plan NAV as onGrowth Option ( per Unit)June 30, 2016 24.1365`
Fund Performance
FUND FEATURES
Nature:
Inception Date:
Fund Manager:
About the fund:
Other Parameter:
Benchmark :
Debt
2,026.32 Crores
18 February 2003
The Fund aims to invest only in short maturity, highlyrated debt and money market instruments and seeks to generatereturns predominantly through accrual income.
Modified Duration: 353 days
Average Maturity : 390 days
Crisil Liquid Fund Index (w.e.f 23rd July, 2015)
Monthly Avg AUM: `
Mr. Anurag Mittal (w.e.f. 09th November 2015)
Yield to Maturity: 7.40%
Regular Plan Growth - 24.3460
Regular Plan Dividend Monthly 10.2252
Regular Plan Dividend Daily 10.0699
Regular Plan Dividend Weekly 10.0847
Regular Plan Dividend Periodic 11.6993
Direct Plan Growth - 24.8998
Direct Plan Dividend Monthly 10.1899
Direct Plan Dividend Daily 10.0699
Direct Plan Dividend Weekly 10.0581
Direct Plan Dividend Periodic 11.7916
31 July 2016
IDFC Money Manager Fund - Treasury Plan
Riskometer
Investors understand that their principalwill be at Moderately Low Risk
This product is suitable for investorswho are seeking*:
=
=
To generate short term stable returnswith a low risk strategy.
Investments in good quality debt andmoney market instruments such thatthe fund will offer a blend of liquiditywith stability of returns.
*Investors should consult their financial advisers if in doubt about whetherthe product is suitable for them.
PeriodScheme
Returns ^BenchmarkReturns #
AlternateBenchmarkReturns ##
Current Value ( ) of StandardInvestment of 10,000
`
`
Benchmark#
AlternateBenchmark
##
Scheme^
NAVper
Unit ( )`
Lumpsum Investment
Jan 01, 2013 (Since Inception) 18.1863 9.12% 8.71% 7.50% 13,568 13,388 12,875
Jun 30, 2015 To Jun 30, 2016 22.6654 8.86% 7.90% 7.67%
Jun 30, 2014 To Jun 30, 2015 20.7909 9.02% 8.77% 8.54% NA
Jun 28, 2013 To Jun 30, 2014 18.9443 9.69% 9.63% 5.89%
Feb 18, 2003 (Since Inception) 10.0000 6.81% 6.84% 5.90% 24,137 24,222 21,528
Jun 30, 2015 To Jun 30, 2016 22.2999 8.24% 7.90% 7.67%
Jun 30, 2014 To Jun 30, 2015 20.5877 8.32% 8.77% 8.54% NA
Jun 28, 2013 To Jun 30, 2014 18.8820 8.98% 9.63% 5.89%
PeriodScheme
Returns ^BenchmarkReturns #
AlternateBenchmarkReturns ##
Current Value ( ) of StandardInvestment of 10,000
`
`
Benchmark#
AlternateBenchmark##Scheme^
NAVper
Unit ( )`
Lumpsum Investment
AAA mfs
by ICRA

FUND FEATURES
Nature:
Inception Date:
Fund Manager:
About the fund:
Benchmark :
1,513.78 Crores
7 March 2013
Mr. Harshal Joshi August 2014)
A dedicated Bank CD fund which seeks to benefit
from the seasonality of money market rates.
Debt
Modified duration: 220 days
Average Maturity: 220 days
Yield to Maturity: 6.91%
Crisil Liquid Fund Index
Monthly Avg AUM: `
(Since 1st
(w.e.f. 30th November 2015)
Other Parameter:
(IDFC –BDF) An Open Ended Income Fund
IDFC Banking Debt Fund
NAV ( ) :` (as on 2016)29th July
26
Portfolio :
Name Rating % of NAV
ASSET QUALITY:
A1+ Equivalent 100.00%
CBLO 0.34
Certificate of Deposit 99.68
Net Current Asset -0.02
Grand Total 100.00
ICICI Bank A1+ 11.26
Punjab & Sind Bank A1+ 11.16
Vijaya Bank A1+ 10.84
Small Industries Dev Bank of India A1+ 9.63
Bank of Maharashtra A1+ 9.31
Dena Bank A1+ 8.99
Corporation Bank A1+ 8.07
Canara Bank A1+ 7.14
Andhra Bank A1+ 6.55
IndusInd Bank A1+ 4.82
NABARD A1+ 3.87
Yes Bank A1+ 2.57
IDBI Bank A1+ 2.07
Export Import Bank of India A1+ 1.61
Axis Bank A1+ 1.61
HDFC Bank A1+ 0.19
Plan Option Freq NAV
Direct Plan Growth Option (NAV as on per Unit)June 30, 2016 13.2979`Regular Plan NAV as onGrowth Option ( per Unit)June 30, 2016 13.2491`
Fund Performance
Greater than 1 year returns are Compounded Annualised Returns. # CRISIL Liquid Fund Index, ## 1 Year T-Bill.Crisil ^ Past performance may or may not be sustained in future.
Performance of the funds managed by the fund manager are given on page No. 43-52
Regular Plan Growth - 13.3419
Regular Plan Dividend - 10.4157
Regular Plan Dividend Fortnightly 10.1916
Regular Plan Dividend Daily 10.0973
Regular Plan Dividend Monthly 10.1555
Regular Plan Dividend Quarterly 10.5145
Regular Plan Dividend Annual 10.4285
Direct Plan Growth - 13.3920
Direct Plan Dividend - 10.4207
Direct Plan Dividend Fortnightly 10.0711
Direct Plan Dividend Daily 10.0523
Direct Plan Dividend Monthly 10.1052
Direct Plan Dividend Quarterly 10.5715
31 July 2016
IDFC Banking Debt Fund
Riskometer
Investors understand that their principalwill be at Moderately Low Risk
This product is suitable for investorswho are seeking*:
=
=
To generate short term stable returnswith a low risk strategy.
Investments in good quality fixedincome & Money Market securitiesissued by scheduled Commercial banks.
*Investors should consult their financial advisers if in doubt about whetherthe product is suitable for them.
PeriodScheme
Returns ^BenchmarkReturns #
AlternateBenchmarkReturns ##
Current Value ( ) of StandardInvestment of 10,000
`
`
Benchmark#
AlternateBenchmark
##
Scheme^
NAVper
Unit ( )`
Lumpsum Investment
Mar 07, 2013 (Since Inception) 10.0000 8.97% 8.74% 7.45% 13,298 13,203 12,694
Jun 30, 2015 To Jun 30, 2016 12.2576 8.49% 7.90% 7.67%
Jun 30, 2014 To Jun 30, 2015 11.2431 9.02% 8.77% 8.54% NA
Jun 28, 2013 To Jun 30, 2014 10.3328 8.76% 9.63% 5.89%
Mar 07, 2013 (Since Inception) 10.0000 8.85% 8.74% 7.45% 13,249 13,203 12,694
Jun 30, 2015 To Jun 30, 2016 12.2257 8.37% 7.90% 7.67%
Jun 30, 2014 To Jun 30, 2015 11.2265 8.90% 8.77% 8.54% NA
Jun 28, 2013 To Jun 30, 2014 10.3298 8.63% 9.63% 5.89%
PeriodScheme
Returns ^BenchmarkReturns #
AlternateBenchmarkReturns ##
Current Value ( ) of StandardInvestment of 10,000
`
`
Benchmark#
AlternateBenchmark##Scheme^
NAVper
Unit ( )`
Lumpsum Investment
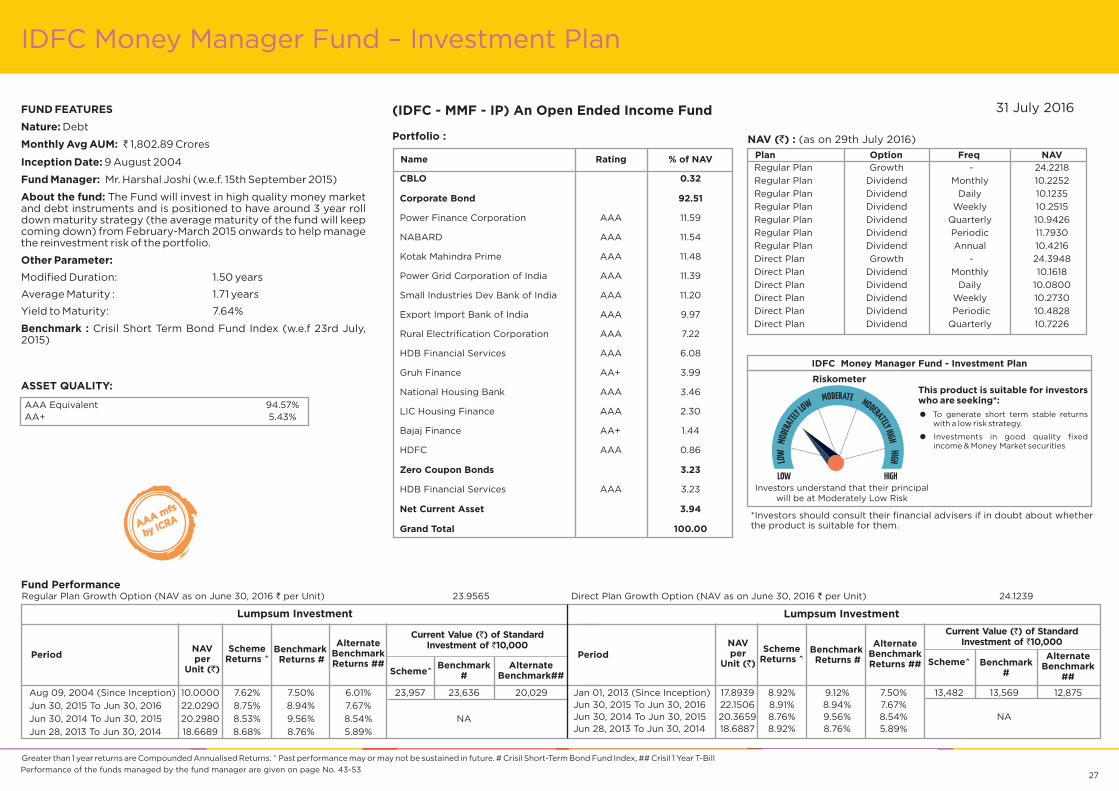
FUND FEATURES
Nature:
Inception Date:
Fund Manager:
About the fund:
Other Parameter:
Benchmark :
Debt
1,802.89 Crores
9 August 2004
The Fund will invest in high quality money marketand debt instruments and is positioned to have around 3 year rolldown maturity strategy (the average maturity of the fund will keepcoming down) from February-March 2015 onwards to help managethe reinvestment risk of the portfolio.
Modified Duration: 1.50 years
Average Maturity : 1.71 years
Crisil Short Term Bond Fund Index (w.e.f 23rd July,2015)
Monthly Avg AUM: `
Mr. Harshal Joshi (w.e.f. 15th September 2015)
Yield to Maturity: 7.64%
(IDFC - MMF - IP) An Open Ended Income Fund
IDFC Money Manager Fund – Investment Plan
27Performance of the funds managed by the fund manager are given on page No. 43-53
Portfolio :
Name Rating % of NAV
CBLO 0.32
Corporate Bond 92.51
Zero Coupon Bonds 3.23
Net Current Asset 3.94
Grand Total 100.00
Power Finance Corporation AAA 11.59
NABARD AAA 11.54
Kotak Mahindra Prime AAA 11.48
Power Grid Corporation of India AAA 11.39
Small Industries Dev Bank of India AAA 11.20
Export Import Bank of India AAA 9.97
Rural Electrification Corporation AAA 7.22
HDB Financial Services AAA 6.08
Gruh Finance AA+ 3.99
National Housing Bank AAA 3.46
LIC Housing Finance AAA 2.30
Bajaj Finance AA+ 1.44
HDFC AAA 0.86
HDB Financial Services AAA 3.23
NAV ( ) :` (as on 2016)29th July
ASSET QUALITY:
AAA Equivalent 94.57%
AA+ 5.43%
Plan Option Freq NAV
Direct Plan Growth Option (NAV as on per Unit)June 30, 2016 24.1239`Regular Plan NAV as onGrowth Option ( per Unit)June 30, 2016 23.9565`
Fund Performance
Greater than 1 year returns are Compounded Annualised Returns. ^ Past performance may or may not be sustained in future. # Crisil Short-Term Bond Fund Index, ## 1 Year T-BillCrisil
Regular Plan Growth - 24.2218
Regular Plan Dividend Monthly 10.2252
Regular Plan Dividend Daily 10.1235
Regular Plan Dividend Weekly 10.2515
Regular Plan Dividend Quarterly 10.9426
Regular Plan Dividend Periodic 11.7930
Regular Plan Dividend Annual 10.4216
Direct Plan Growth - 24.3948
Direct Plan Dividend Monthly 10.1618
Direct Plan Dividend Daily 10.0800
Direct Plan Dividend Weekly 10.2730
Direct Plan Dividend Periodic 10.4828
Direct Plan Dividend Quarterly 10.7226
31 July 2016
IDFC Money Manager Fund - Investment Plan
Riskometer
Investors understand that their principalwill be at Moderately Low Risk
This product is suitable for investorswho are seeking*:
=
=
To generate short term stable returnswith a low risk strategy.
Investments in good quality fixedincome & Money Market securities
*Investors should consult their financial advisers if in doubt about whetherthe product is suitable for them.
PeriodScheme
Returns ^BenchmarkReturns #
AlternateBenchmarkReturns ##
Current Value ( ) of StandardInvestment of 10,000
`
`
Benchmark#
AlternateBenchmark
##
Scheme^
NAVper
Unit ( )`
Lumpsum Investment
Jan 01, 2013 (Since Inception) 17.8939 8.92% 9.12% 7.50% 13,482 13,569 12,875
Jun 30, 2015 To Jun 30, 2016 22.1506 8.91% 8.94% 7.67%
Jun 30, 2014 To Jun 30, 2015 20.3659 8.76% 9.56% 8.54% NA
Jun 28, 2013 To Jun 30, 2014 18.6887 8.92% 8.76% 5.89%
Aug 09, 2004 (Since Inception) 10.0000 7.62% 7.50% 6.01% 23,957 23,636 20,029
Jun 30, 2015 To Jun 30, 2016 22.0290 8.75% 8.94% 7.67%
Jun 30, 2014 To Jun 30, 2015 20.2980 8.53% 9.56% 8.54% NA
Jun 28, 2013 To Jun 30, 2014 18.6689 8.68% 8.76% 5.89%
PeriodScheme
Returns ^BenchmarkReturns #
AlternateBenchmarkReturns ##
Current Value ( ) of StandardInvestment of 10,000
`
`
Benchmark#
AlternateBenchmark##Scheme^
NAVper
Unit ( )`
Lumpsum Investment
AAA mfs
by ICRA

FUND FEATURES
Nature:
Inception Date:
Fund Manager:
About the fund:
Other Parameter:
Benchmark :
Open Ended Income Fund
The fund focuses on delivering returns throughinvestment in the corporate bond segment. The fund will not haveweighted average portfolio maturity of more than 5 years and shallnot invest in G Secs.
Monthly Avg AUM: ` 2,786.94
12 January 2016
Mr. Anurag Mittal
Crores
Modified Duration: 3.07 yearsAverage Maturity: 3.83 yearsYield to Maturity: 7.75%
CRISIL Short Term Bond Fund Index
(IDFC - CBF) An Open Ended Income Fund
IDFC Corporate Bond Fund
Portfolio :
Name Rating % of NAV
28
CBLO 0.31
Corporate Bond 95.57
Zero Coupon Bonds 0.84
Net Current Asset 3.28
Grand Total 100.00
Power Finance Corporation AAA 9.81
Power Grid Corporation of India AAA 9.35
Rural Electrification Corporation AAA 9.18
Larsen & Toubro AAA 8.51
NABARD AAA 7.63
Export Import Bank of India AAA 7.58
M&M Financial Services AAA 6.45
HDB Financial Services AAA 6.31
LIC Housing Finance AAA 6.01
Bajaj Finance AAA 5.52
NHPC AAA 3.48
NTPC AAA 3.39
Mahindra Vehicle Mfg AAA 3.35
Reliance Jio Infocomm AAA 3.33
HDFC AAA 3.10
Indian Railway Finance Corp AAA 2.40
Reliance Industries AAA 0.17
Kotak Mahindra Prime AAA 0.84
NAV ( ) :` (as on 2016)29th July
31 July 2016
IDFC Corporate Bond Fund
Riskometer
Investors understand that theirprincipal will be at Moderately High risk
This product is suitable for investorswho are seeking*:=
=
To generate long term optimalreturns by active management.
Investment in corporate bonds &money market instruments.
*Investors should consult their financial advisers if in doubt about whetherthe product is suitable for them.
ASSET QUALITY:
AAA Equivalent 100.00% AAA mfs
by ICRA
Regular Plan Growth - 10.5930
Regular Plan Dividend - 10.5409
Regular Plan Dividend Monthly 10.1661
Regular Plan Dividend Half Yearly 10.3507
Regular Plan Dividend Quarterly 10.3306
Direct Plan Growth - 10.6108
Direct Plan Dividend - 10.5533
Direct Plan Dividend Monthly 10.2077
Direct Plan Dividend Quarterly 10.3398
Direct Plan Dividend Annual 10.1149
Plan Option Freq NAV

FUND FEATURES
Nature:
Inception Date:
Fund Manager:
About the fund:
Other Parameter:
Benchmark :
Debt
4,758.96 Crores
14 December 2000
Mr. Suyash Choudhary (Since 11th March 2011)
A Short Term Income Fund, the portfolio is mostlya mix of short duration debt and money market instruments. Theaverage portfolio maturity will not ordinarily exceed around 2years.
Modified Duration: 1.61 years
Average Maturity: 1.91 years
CRISIL Short-Term Bond Fund Index
Monthly Avg AUM: `
Yield to Maturity: 7.48%
(IDFC - SSIF - ST) An Open Ended Income Fund
IDFC Super Saver Income Fund – Short Term
NAV ( ) :` (as on 2016)29th July
29Performance of the funds managed by the fund manager are given on page No. 54-55
Greater than 1 year returns are Compounded Annualised Returns. ^ Past performance may or may not be sustained in future.# CRISIL Short-Term Bond Fund Index, ## 1 Year T-BillCrisil
Portfolio :
Name Rating % of NAV
ASSET QUALITY:
AAA Equivalent 91.66%
AA+ 8.34%
CBLO 1.40
Corporate Bond 75.13
Certificate of Deposit 12.18
Commercial Paper 7.78
Zero Coupon Bonds 0.47
Net Current Asset 3.05
Grand Total 100.00
Clearing Corporation of India 1.40
NABARD AAA 10.73Power Grid Corporation of India AAA 9.91Small Industries Dev Bank of India AAA 8.24Bajaj Finance AA+ 7.72Power Finance Corporation AAA 6.49Rural Electrification Corporation AAA 5.68Kotak Mahindra Prime AAA 5.33Export Import Bank of India AAA 4.33LIC Housing Finance AAA 3.60HDFC AAA 2.93Indian Railway Finance Corp AAA 2.31Reliance Jio Infocomm AAA 2.07Sun Pharma Laboratories AAA 2.06National Housing Bank AAA 2.05NTPC AAA 1.03M&M Financial Services AA+ 0.62HDFC Bank AAA 0.03
Canara Bank A1+ 3.04Corporation Bank A1+ 2.98IndusInd Bank A1+ 2.45Export Import Bank of India A1+ 1.67Axis Bank A1+ 1.17Andhra Bank A1+ 0.88
HDFC A1+ 6.09L&T Infrastructure Finance Co A1+ 0.90HDB Financial Services A1+ 0.78
HDFC AAA 0.47
Direct Plan Growth Option (NAV as on per Unit)June 30, 2016 32.1998`Regular Plan NAV as onGrowth Option ( per Unit)June 30, 2016 31.4414`
Fund Performance
Plan Option Freq NAV
Regular Plan Growth - 31.8123
Regular Plan Dividend Monthly 10.1699
Regular Plan Dividend Fortnightly 10.3480
Regular Plan Dividend Periodic 11.8035
Direct Plan Growth - 32.5940
Direct Plan Dividend Monthly 10.3756
Direct Plan Dividend Fortnightly 10.2736
Direct Plan Dividend Periodic 10.8940
31 July 2016
IDFC Super Saver Income Fund-Short Term
Riskometer
Investors understand that their principalwill be at Moderately Low Risk
This product is suitable for investorswho are seeking*:
=
=
To generate optimal returns over short tomedium term.
Investments in good quality fixedincome & Money Market securities.
*Investors should consult their financial advisers if in doubt about whetherthe product is suitable for them.
PeriodScheme
Returns ^BenchmarkReturns #
AlternateBenchmarkReturns ##
Current Value ( ) of StandardInvestment of 10,000
`
`
Benchmark#
AlternateBenchmark
##
Scheme^
NAVper
Unit ( )`
Lumpsum Investment
Jan 01, 2013 (Since Inception) 23.5713 9.33% 9.12% 7.50% 13,661 13,569 12,875
Jun 30, 2015 To Jun 30, 2016 29.5284 9.05% 8.94% 7.67%
Jun 30, 2014 To Jun 30, 2015 26.9055 9.75% 9.56% 8.54% NA
Jun 28, 2013 To Jun 30, 2014 24.6363 9.16% 8.76% 5.89%
Dec 14, 2000 (Since Inception) 10.0000 7.64% NA 6.30% 31,441 NA 25,876
Jun 30, 2015 To Jun 30, 2016 28.9876 8.46% 8.94% 7.67%
Jun 30, 2014 To Jun 30, 2015 26.5989 8.98% 9.56% 8.54% NA
Jun 28, 2013 To Jun 30, 2014 24.5444 8.32% 8.76% 5.89%
PeriodScheme
Returns ^BenchmarkReturns #
AlternateBenchmarkReturns ##
Current Value ( ) of StandardInvestment of 10,000
`
`
Benchmark#
AlternateBenchmark##Scheme^
NAVper
Unit ( )`
Lumpsum Investment
AAA mfs
by ICRA

FUND FEATURES
Nature:
Inception Date:
Fund Manager:
About the fund:
Other Parameter:
Benchmark :
3,805.45 Crores
8 July 2003
Mr. Suyash Choudhary
The fund is positioned in the short term fundcategory and invests in a mix of debt and money marketinstruments. The overall average maturity of the fund will ordinarilynot exceed around 4 years. MT is best suited for investors who wantmoderate participation. The around 4 year average maturity capmakes the fund well suited to offer lower volatility yet benefit frompotential fall in interest rates.
Modified Duration: 2.56 years
Average Maturity : 3.28 years
Crisil Short Term Bond Fund Index
Debt
Yield to Maturity: 7.46%
Monthly Avg AUM: `
(w.e.f. 15th September 2015)
(IDFC - SSIF-MT) An Open Ended Income Fund
IDFC Super Saver Income Fund – Medium Term
Performance of the funds managed by the fund manager are given on page No. 54-55
Greater than 1 year returns are Compounded Annualised Returns. ^ Past performance may or may not be sustained in future # CRISIL Short-Term Bond Fund Index, ## Crisil 1 Year T-Bill
Portfolio :
Name Rating % of NAV Name Rating % of NAV
HDB Financial Services A1+ 0.12
Export Import Bank of India A1+ 4.05
Canara Bank A1+ 1.20
Axis Bank A1+ 0.49
Corporation Bank A1+ 0.25
Punjab & Sind Bank A1+ 0.07
Bajaj Finance AA+ 0.73
Certificate of Deposit 6.07
Zero Coupon Bonds 0.73
Net Current Asset 2.76
Grand Total 100.00
CBLO 2.24
Corporate Bond 49.40
Government Bond 17.90
State Government Bond 12.06
Commercial Paper 8.86
Small Industries Dev Bank of India AAA 9.70
Rural Electrification Corporation AAA 7.24
Power Grid Corporation of India AAA 6.51
LIC Housing Finance AAA 6.50
IDFC Bank AAA 4.77
Power Finance Corporation AAA 4.47
HDFC AAA 2.72
Kotak Mahindra Investments AAA 2.57
Bajaj Finance AA+ 1.49
NABARD AAA 1.17
Export Import Bank of India AAA 0.87
ICICI Bank AAA 0.65
Indian Railway Finance Corp AAA 0.42
HDFC Bank AAA 0.27
HDB Financial Services AAA 0.04
7.72% - 2025 G-Sec SOV 10.31
7.68% - 2023 G-Sec SOV 4.43
7.8% - 2021 G-Sec SOV 3.16
8.39% Rajasthan UDAY Bond SDL(MD 15/03/2019) SOV 6.29
8.62% Maharashtra SDL(MD 06/03/2023) SOV 5.36
8.39% Rajasthan UDAY Bond SDL(MD 15/03/2018) SOV 0.41
HDFC A1+ 5.56
L&T Infrastructure Finance Co A1+ 3.18
Direct Plan Growth Option (NAV as on per Unit)June 30, 2016 26.4889`Regular Plan NAV as onGrowth Option ( per Unit)June 30, 2016 25.8429`
Fund Performance
NAV ( ) :` (as on 2016)29th July
AAA Equivalent 97.79%
AA+ 2.21%
ASSET QUALITY:
Regular Plan Growth - 26.2382
Regular Plan Dividend BiMonthly 11.3630
Regular Plan Dividend Fortnightly 10.1752
Regular Plan Dividend Monthly 10.1625
Regular Plan Dividend Daily 10.1076
Regular Plan Dividend Quarterly 10.8134
Regular Plan Dividend Periodic 11.9813
Direct Plan Growth - 26.9070
Direct Plan Dividend BiMonthly 11.6248
Direct Plan Dividend Monthly 10.4339
Direct Plan Dividend Quarterly 10.9203
Direct Plan Dividend Daily 10.2752
Direct Plan Dividend Periodic 12.0038
Plan Option Freq NAV
30
31 July 2016
IDFC Super Saver Income Fund - Medium Term
Riskometer
Investors understand that their principalwill be at Moderate Risk
This product is suitable for investors whoare seeking*:
=
=
To generate optimal returns over shortto medium term.
Investments in high quality moneymarket & debt instruments including G-Sec securities.
*Investors should consult their financial advisers if in doubt about whetherthe product is suitable for them.
PeriodScheme
Returns ^BenchmarkReturns #
AlternateBenchmarkReturns ##
Current Value ( ) of StandardInvestment of 10,000
`
`
Benchmark#
AlternateBenchmark
##
Scheme^
NAVper
Unit ( )`
Lumpsum Investment
Jan 01, 2013 (Since Inception) 19.6695 8.89% 9.12% 7.50% 13,467 13,569 12,875
Jun 30, 2015 To Jun 30, 2016 24.2791 9.10% 8.94% 7.67%
Jun 30, 2014 To Jun 30, 2015 22.0305 10.21% 9.56% 8.54% NA
Jun 28, 2013 To Jun 30, 2014 20.6251 6.78% 8.76% 5.89%
Jul 08, 2003 (Since Inception) 10.0000 7.58% 7.17% 5.89% 25,843 24,588 21,026
Jun 30, 2015 To Jun 30, 2016 23.8316 8.44% 8.94% 7.67%
Jun 30, 2014 To Jun 30, 2015 21.7628 9.51% 9.56% 8.54% NA
Jun 28, 2013 To Jun 30, 2014 20.5383 5.93% 8.76% 5.89%
PeriodScheme
Returns ^BenchmarkReturns #
AlternateBenchmarkReturns ##
Current Value ( ) of StandardInvestment of 10,000
`
`
Benchmark#
AlternateBenchmark##Scheme^
NAVper
Unit ( )`
Lumpsum Investment
AAA mfs
by ICRA
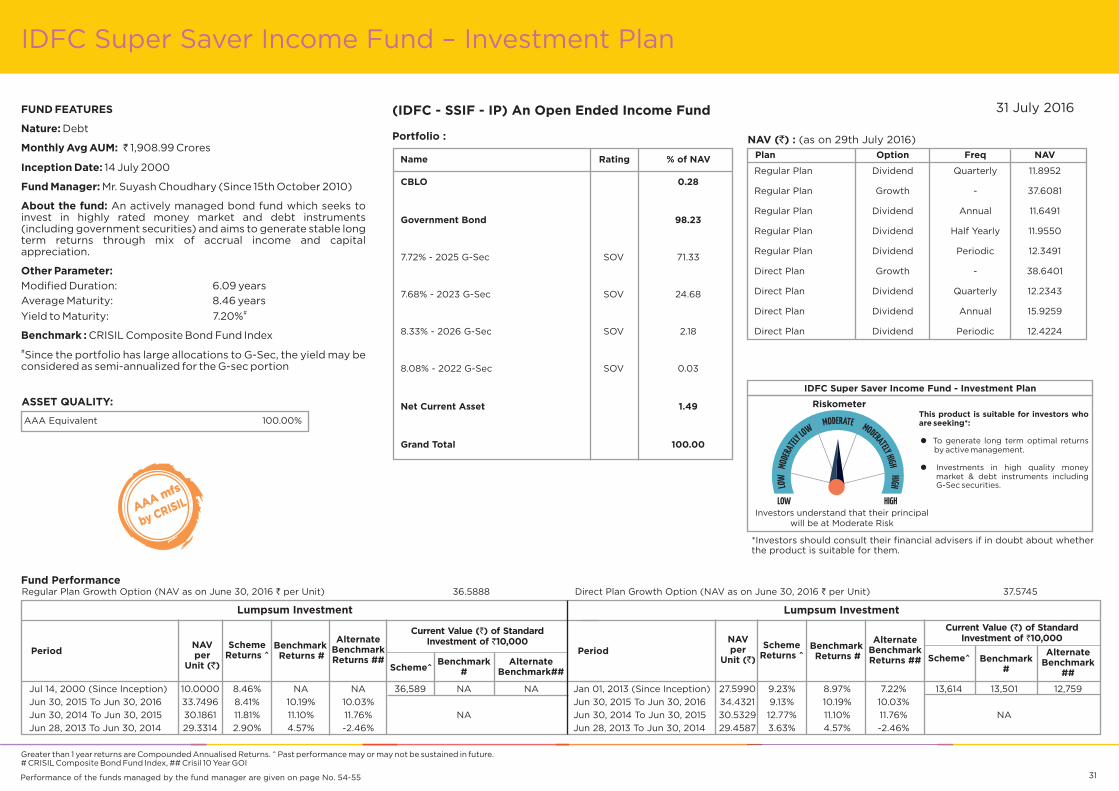
FUND FEATURES
Nature:
Inception Date:
Fund Manager:
About the fund:
Other Parameter:
Benchmark :
1,908.99 Crores
14 July 2000
Mr. Suyash Choudhary (Since 15th October 2010)
An actively managed bond fund which seeks toinvest in highly rated money market and debt instruments(including government securities) and aims to generate stable longterm returns through mix of accrual income and capitalappreciation.
Modified Duration: 6.09 years
Average Maturity: 8.46 years
CRISIL Composite Bond Fund Index
Debt
Yield to Maturity: 7.20%
Monthly Avg AUM: `
#
#Since the portfolio has large allocations to G-Sec, the yield may be
considered as semi-annualized for the G-sec portion
(IDFC - SSIF - IP) An Open Ended Income Fund
IDFC Super Saver Income Fund – Investment Plan
NAV ( ) :` (as on 2016)29th July
Performance of the funds managed by the fund manager are given on page No. 54-55
Greater than 1 year returns are Compounded Annualised Returns. ^ Past performance may or may not be sustained in future.# CRISIL Composite Bond Fund Index, ## 10 Year GOICrisil
31
Portfolio :
Name Rating % of NAV
ASSET QUALITY:
AAA Equivalent 100.00%
CBLO 0.28
Government Bond 98.23
Net Current Asset 1.49
Grand Total 100.00
7.72% - 2025 G-Sec SOV 71.33
7.68% - 2023 G-Sec SOV 24.68
8.33% - 2026 G-Sec SOV 2.18
8.08% - 2022 G-Sec SOV 0.03
Direct Plan Growth Option (NAV as on per Unit)June 30, 2016 37.5745`Regular Plan NAV as onGrowth Option ( per Unit)June 30, 2016 36.5888`
Fund Performance
Plan Option Freq NAV
Regular Plan Dividend Quarterly 11.8952
Regular Plan Growth - 37.6081
Regular Plan Dividend Annual 11.6491
Regular Plan Dividend Half Yearly 11.9550
Regular Plan Dividend Periodic 12.3491
Direct Plan Growth - 38.6401
Direct Plan Dividend Quarterly 12.2343
Direct Plan Dividend Annual 15.9259
Direct Plan Dividend Periodic 12.4224
31 July 2016
IDFC Super Saver Income Fund - Investment Plan
Riskometer
Investors understand that their principalwill be at Moderate Risk
This product is suitable for investors whoare seeking*:
=
=
To generate long term optimal returnsby active management.
Investments in high quality moneymarket & debt instruments includingG-Sec securities.
*Investors should consult their financial advisers if in doubt about whetherthe product is suitable for them.
PeriodScheme
Returns ^BenchmarkReturns #
AlternateBenchmarkReturns ##
Current Value ( ) of StandardInvestment of 10,000
`
`
Benchmark#
AlternateBenchmark
##
Scheme^
NAVper
Unit ( )`
Lumpsum Investment
Jan 01, 2013 (Since Inception) 27.5990 9.23% 8.97% 7.22% 13,614 13,501 12,759
Jun 30, 2015 To Jun 30, 2016 34.4321 9.13% 10.19% 10.03%
Jun 30, 2014 To Jun 30, 2015 30.5329 12.77% 11.10% 11.76% NA
Jun 28, 2013 To Jun 30, 2014 29.4587 3.63% 4.57% -2.46%
Jul 14, 2000 (Since Inception) 10.0000 8.46% NA NA 36,589 NA NA
Jun 30, 2015 To Jun 30, 2016 33.7496 8.41% 10.19% 10.03%
Jun 30, 2014 To Jun 30, 2015 30.1861 11.81% 11.10% 11.76% NA
Jun 28, 2013 To Jun 30, 2014 29.3314 2.90% 4.57% -2.46%
PeriodScheme
Returns ^BenchmarkReturns #
AlternateBenchmarkReturns ##
Current Value ( ) of StandardInvestment of 10,000
`
`
Benchmark#
AlternateBenchmark##Scheme^
NAVper
Unit ( )`
Lumpsum Investment
AAA mfs
by CRISIL

FUND FEATURES
Nature:
Inception Date:
Fund Manager:
About the fund:
Other Parameter:
Benchmark :
4,961.72 Crores
25 June 2002
Mr. Suyash Choudhary (Since 15th October 2010)
The fund is positioned in the income fund categoryto take exposure across the curve depending upon the fundmanager’s underlying interest rate view where we employ themajority of the portfolio. It is a wide structure and conceptually cango anywhere on the curve. The fund plays the trade of the seasonwhich we think will sustain for a longer period of time.
Modified Duration: 6.05 years
Average Maturity : 8.42 years
CRISIL Composite Bond Fund Index
Debt
Yield to Maturity: 7.21%
Monthly Avg AUM: `
#
#Since the portfolio has large allocations to G-Sec, the yield may
be considered as semi-annualized for the G-sec portion.
(IDFC - DBF) An Open Ended Income Fund
IDFC Dynamic Bond Fund
32Performance of the funds managed by the fund manager are given on page No. 54-55
Greater than 1 year returns are Compounded Annualised Returns. ^ Past performance may or may not be sustained in future.# CRISIL Composite Bond Fund Index, ## 10 Year GOICrisil
Portfolio :
Name Rating % of NAV
ASSET QUALITY:
AAA Equivalent 100.00%
CBLO 0.18
Government Bond 97.40
Commercial Paper 0.84
Net Current Asset 1.58
Grand Total 100.00
7.72% - 2025 G-Sec SOV 71.91
7.68% - 2023 G-Sec SOV 23.26
8.33% - 2026 G-Sec SOV 2.17
8.08% - 2022 G-Sec SOV 0.05
L&T Infrastructure Finance Co A1+ 0.84
Direct Plan Growth Option (NAV as on per Unit)June 30, 2016 18.7906`Regular Plan NAV as onGrowth Option ( per Unit)June 30, 2016 18.2045`
Fund Performance
NAV ( ) :` (as on 2016)29th July
Plan Option Freq NAV
Regular Plan Growth - 18.7101
Regular Plan Dividend - 10.7007
Regular Plan Dividend Quarterly 11.0632
Regular Plan Dividend Annual 11.1165
Regular Plan Dividend Half Yearly 10.7812
Regular Plan Dividend Periodic 12.1935
Direct Plan Growth - 19.3264
Direct Plan Dividend - 12.9095
Direct Plan Dividend Quarterly 12.8527
Direct Plan Dividend Annual 11.5953
Direct Plan Dividend Half Yearly 10.9123
Direct Plan Dividend Periodic 12.4967
31 July 2016
IDFC Dynamic Bond Fund
Riskometer
Investors understand that their principalwill be at Moderate Risk
This product is suitable for investors whoare seeking*:
=
=
To generate long term optimal returnsby active management.
Investments in high quality moneymarket & debt instruments including G-Sec securities.
*Investors should consult their financial advisers if in doubt about whetherthe product is suitable for them.
PeriodScheme
Returns ^BenchmarkReturns #
AlternateBenchmarkReturns ##
Current Value ( ) of StandardInvestment of 10,000
`
`
Benchmark#
AlternateBenchmark
##
Scheme^
NAVper
Unit ( )`
Lumpsum Investment
Jan 01, 2013 (Since Inception) 13.6545 9.56% 8.97% 7.22% 13,761 13,501 12,759
Jun 30, 2015 To Jun 30, 2016 17.1415 9.62% 10.19% 10.03%
Jun 30, 2014 To Jun 30, 2015 15.1536 13.12% 11.10% 11.76% NA
Jun 28, 2013 To Jun 30, 2014 14.5880 3.86% 4.57% -2.46%
Dec 03, 2008 (Since Inception) 10.0000 8.23% 8.13% 5.61% 18,205 18,077 15,124
Jun 30, 2015 To Jun 30, 2016 16.7588 8.63% 10.19% 10.03%
Jun 30, 2014 To Jun 30, 2015 14.9523 12.08% 11.10% 11.76% NA
Jun 28, 2013 To Jun 30, 2014 14.5269 2.91% 4.57% -2.46%
PeriodScheme
Returns ^BenchmarkReturns #
AlternateBenchmarkReturns ##
Current Value ( ) of StandardInvestment of 10,000
`
`
Benchmark#
AlternateBenchmark##Scheme^
NAVper
Unit ( )`
Lumpsum Investment
AAA mfs
by CRISIL

FUND FEATURES
Nature:
Inception Date:
Fund Manager:
About the fund:
Benchmark :
Debt
661.20 Crores
9 March 2002
Mr. Suyash Choudhary ( 15th October 2010)
Monthly Avg AUM: `
Since
A dedicated gilt fund with an objective to generateoptimal returns with high liquidity by investing in GovernmentSecurities.
Modified duration: 7.00 years
Average Maturity: 10
Yield to Maturity: 7.22%
I-Sec Composite Index
Other Parameter:
.52 years
Since the portfolio has large allocations to G-Sec, the yield may beconsidered as semi-annualized for the G-sec portion.
#
#
(IDFC –GSF-IP) An Open Ended Dedicated Gilt Fund
IDFC Government Securities Fund – Investment Plan
NAV ( ) :` (as on 2016)29th July
Performance of the funds managed by the fund manager are given on page No. 54-55
Greater than 1 year returns are Compounded Annualised Returns. ^ Past performance may or may not be sustained in future. # I-Sec Composite Index, ## 10 Year GOICrisil
33
Portfolio :
ASSET QUALITY:
Sovereign 100.00%
Plan Option Freq NAV
Direct Plan Growth Option (NAV as on per Unit)June 30, 2016 18.3311`Regular Plan NAV as onGrowth Option ( per Unit)June 30, 2016 17.9000`
Fund Performance
Name Rating % of NAV
CBLO 0.15
Government Bond 98.51
Net Current Asset 1.34
Grand Total 100.00
7.72% - 2025 G-Sec SOV 60.82
7.61% - 2030 G-Sec SOV 34.82
7.68% - 2023 G-Sec SOV 2.85
8.08% - 2022 G-Sec SOV 0.02
Regular Plan Dividend - 10.7752
Regular Plan Growth - 18.4434
Regular Plan Dividend Quarterly 11.4561
Regular Plan Dividend Annual 11.0232
Regular Plan Dividend Half Yearly 11.1778
Direct Plan Growth - 18.8979
Direct Plan Dividend - 11.6352
Direct Plan Dividend Quarterly 11.1128
Direct Plan Dividend Annual 12.0792
Direct Plan Dividend Periodic 12.4460
31 July 2016
IDFC Government Securities Fund - Investment Plan
Riskometer
Investors understand that their principalwill be at Moderate Risk
This product is suitable for investors whoare seeking*:
=
=
To generate long term optimal returns.
Investments in Government Securitiesand Treasury Bills.
*Investors should consult their financial advisers if in doubt about whetherthe product is suitable for them.
PeriodScheme
Returns ^BenchmarkReturns #
AlternateBenchmarkReturns ##
Current Value ( ) of StandardInvestment of 10,000
`
`
Benchmark#
AlternateBenchmark
##
Scheme^
NAVper
Unit ( )`
Lumpsum Investment
Jan 01, 2013 (Since Inception) 13.1410 9.99% 9.34% 7.22% 13,950 13,664 12,759
Jun 30, 2015 To Jun 30, 2016 16.7132 9.68% 10.81% 10.03%
Jun 30, 2014 To Jun 30, 2015 14.7552 13.27% 11.70% 11.76% NA
Jun 28, 2013 To Jun 30, 2014 14.1668 4.13% 4.09% -2.46%
Dec 03, 2008 (Since Inception) 10.0000 7.99% 8.13% 5.61% 17,900 18,083 15,124
Jun 30, 2015 To Jun 30, 2016 16.4376 8.90% 10.81% 10.03%
Jun 30, 2014 To Jun 30, 2015 14.6372 12.30% 11.70% 11.76% NA
Jun 28, 2013 To Jun 30, 2014 14.1313 3.56% 4.09% -2.46%
PeriodScheme
Returns ^BenchmarkReturns #
AlternateBenchmarkReturns ##
Current Value ( ) of StandardInvestment of 10,000
`
`
Benchmark#
AlternateBenchmark##Scheme^
NAVper
Unit ( )`
Lumpsum Investment

IDFC Government Securities Fund - PF
Riskometer
Investors understand that their principalwill be at Moderate Risk
This product is suitable for investors whoare seeking*:
=
=
To generate optimal returns over shortto medium term.
Investments in Government Securitiesand Treasury Bills.
*Investors should consult their financial advisers if in doubt about whetherthe product is suitable for them.
FUND FEATURES
Nature:
Inception Date:
Fund Manager:
About the fund:
Benchmark :
Debt
29 March 2004
Mr. Suyash Choudhary (Since October 2010)
I-SEC Composite Index
Monthly Avg AUM `:
Other Parameter:
187.09 Crores
A dedicated gilt fund with an objective to generateoptimal returns with high liquidity by investing in GovernmentSecurities.
Modified duration: 7.01 years
Average Maturity: 10.52 years
Yield to Maturity: 7.22%
15th
Since the portfolio has large allocations to G-Sec, the yield may beconsidered as semi-annualized for the G-sec portion.
#
#
(IDFC –GSF-PF) An Open Ended Dedicated Gilt Fund
IDFC Government Securities Fund – Provident Fund Plan
NAV ( ) :` (as on 2016)29th July
Performance of the funds managed by the fund manager are given on page No. 54-55
Greater than 1 year returns are Compounded Annualised Returns. ^ Past performance may or may not be sustained in future.# I-Sec Composite Index, ## 10 Year GOICrisil
34
Portfolio :
Name Rating % of NAV
CBLO 0.16
Government Bond 98.49
Net Current Asset 1.35
Grand Total 100.00
7.72% - 2025 G-Sec SOV 64.23
7.61% - 2030 G-Sec SOV 34.12
7.68% - 2023 G-Sec SOV 0.11
8.08% - 2022 G-Sec SOV 0.04
ASSET QUALITY:
Sovereign 100.00%
Direct Plan Growth Option (NAV as on per Unit)June 30, 2016 26.6574`Regular Plan NAV as onGrowth Option ( per Unit)June 30, 2016 26.1303`
Fund Performance
Plan Option NAVFreq
Regular Plan Growth - 26.9429
Regular Plan Dividend Quarterly 12.6112
Regular Plan Dividend Annual 11.7412
Regular Plan Dividend Periodic 12.5892
Direct Plan Growth - 27.4971
Direct Plan Dividend Quarterly 13.0246
Direct Plan Dividend Annual 13.0193
Direct Plan Dividend Periodic 12.2485
31 July 2016
PeriodScheme
Returns ^BenchmarkReturns #
AlternateBenchmarkReturns ##
Current Value ( ) of StandardInvestment of 10,000
`
`
Benchmark#
AlternateBenchmark
##
Scheme^
NAVper
Unit ( )`
Lumpsum Investment
Jan 01, 2013 (Since Inception) 18.8884 10.36% 9.34% 7.22% 14,113 13,664 12,759
Jun 30, 2015 To Jun 30, 2016 24.1414 10.42% 10.81% 10.03%
Jun 30, 2014 To Jun 30, 2015 21.2500 13.61% 11.70% 11.76%
Jun 28, 2013 To Jun 30, 2014 20.3773 4.26% 4.09% -2.46%
Mar 29, 2004 (Since Inception) 10.0000 8.15% 7.40% 5.33% 26,130 23,996 18,914
Jun 30, 2015 To Jun 30, 2016 23.7952 9.81% 10.81% 10.03%
Jun 30, 2014 To Jun 30, 2015 21.0556 13.01% 11.70% 11.76% NA
Jun 28, 2013 To Jun 30, 2014 20.3407 3.50% 4.09% -2.46%
PeriodScheme
Returns ^BenchmarkReturns #
AlternateBenchmarkReturns ##
Current Value ( ) of StandardInvestment of 10,000
`
`
Benchmark#
AlternateBenchmark##Scheme^
NAVper
Unit ( )`
Lumpsum Investment

FUND FEATURES
Nature:
Inception Date:
Fund Manager:
About the fund:
Other Parameter:
Benchmark :
Debt
76.39 Crores
9 March 2002
Mr. Suyash Choudhary ( October 2010)
The fund is a mix of government bonds, state
development loans (SDLs), treasury bills and/or cash management
bills. The fund will predominantly invest at the shorter end of the
sovereign yield curve.
I - Sec Si Bex
Monthly Avg AUM: `
Since
Modified duration: 2.51 years
Average Maturity: 2.98 years
Yield to Maturity: 6.90%
15th
(w.e.f. 30th November 2015)
Since the portfolio has large allocations to G-Sec, the yield may be
considered as semi-annualized for the G-sec portion.
#
#
(IDFC –GSF-ST) An Open Ended Dedicated Gilt Fund
IDFC Government Securities Fund – Short Term Plan
NAV ( ) :` (as on 2016)29th July
Performance of the funds managed by the fund manager are given on page No. 54-55
Greater than 1 year returns are Compounded Annualised Returns. # I-Sec Si-BEX, ## 1 Year T-Bill. ^ Past performance may or may not be sustained in future.Crisil
35
Portfolio :
Name Rating % of NAV Plan Option NAVFreq
ASSET QUALITY:
Sovereign 100.00%
CBLO 5.38
Government Bond 92.92
Net Current Asset 1.71
Grand Total 100.00
8.27% - 2020 G-Sec SOV 35.90
7.83% - 2018 G-Sec SOV 34.97
7.28% - 2019 G-Sec SOV 13.91
8.08% - 2022 G-Sec SOV 3.89
7.68% - 2023 G-Sec SOV 3.55
7.72% - 2025 G-Sec SOV 0.71
Direct Plan Growth Option (NAV as on per Unit)June 30, 2016 22.3637`Regular Plan NAV as onGrowth Option ( per Unit)June 30, 2016 22.2835`
Fund Performance
Regular Plan Growth - 22.5521
Regular Plan Dividend Monthly 10.4087
Regular Plan Dividend Quarterly 10.7295
Regular Plan Dividend Weekly 14.1309
Regular Plan Dividend Periodic 12.0764
Direct Plan Growth - 22.6368
Direct Plan Dividend Periodic 12.0812
Direct Plan Dividend Quarterly 10.9903
Direct Plan Dividend Weekly 14.1559
Direct Plan Dividend Monthly 10.4916
31 July 2016
IDFC Government Securities Fund - Short Term
Riskometer
Investors understand that their principalwill be at Moderate Risk
This product is suitable for investors whoare seeking*:
=
=
To generate short to medium termoptimal returns.
Investments in Government Securitiesand Treasury Bills.
*Investors should consult their financial advisers if in doubt about whetherthe product is suitable for them.
PeriodScheme
Returns ^BenchmarkReturns #
AlternateBenchmarkReturns ##
Current Value ( ) of StandardInvestment of 10,000
`
`
Benchmark#
AlternateBenchmark
##
Scheme^
NAVper
Unit ( )`
Lumpsum Investment
Jan 01, 2013 (Since Inception) 15.7257 10.60% 8.56% 7.50% 14,221 13,327 12,875
Jun 30, 2015 To Jun 30, 2016 20.2710 10.32% 9.13% 7.67%
Jun 30, 2014 To Jun 30, 2015 18.3582 10.42% 9.16% 8.54%
Jun 28, 2013 To Jun 30, 2014 16.4583 11.48% 6.80% 5.89%
Mar 09, 2002 (Since Inception) 10.0000 5.75% NA 5.92% 22,284 NA 22,803
Jun 30, 2015 To Jun 30, 2016 20.2356 10.12% 9.13% 7.67%
Jun 30, 2014 To Jun 30, 2015 18.3447 10.31% 9.16% 8.54% NA
Jun 28, 2013 To Jun 30, 2014 16.4547 11.42% 6.80% 5.89%
PeriodScheme
Returns ^BenchmarkReturns #
AlternateBenchmarkReturns ##
Current Value ( ) of StandardInvestment of 10,000
`
`
Benchmark#
AlternateBenchmark##Scheme^
NAVper
Unit ( )`
Lumpsum Investment

Fund Snapshot
Nature of the Scheme
Inception Date
Investment Objective
Fund Manager
Month end AUM
Ideal InvestmentHorizon
Minimum InvestmentAmount
Entry Load
Exit Load
Dividend Re-investment
SIP (Minimum Amount)
SIP Frequency
Benchmark
NAV Frequency
Face Value ( /Unit)`
Lock in Period
SIP Dates (Monthly)
IDFC Classic EquityFund (IDFC - CEF)
Open - Ended EquityFund
9 August 2005
T h e i n v e s t m e n to b j e c t i v e o f t h eScheme is to seek togenerate long termcapital growth from adiversified portfolio ofpredominantly equityand equity relatedinstruments. However,there is no assurance orguarantee that theo b j e c t i ve s o f t h escheme will be realized.
Mr. Anoop Bhaskar(w.e.f. 30th April 2016)
3 Years or more
`
`
5 , 0 0 0 / - a n d i nmultiples of 1/-thereafter.
Nil
1 .00% if redeemedbefore 365 days fromthe date of allotment.(w.e.f. 10 May 2016)
At Ex-Dividend NAV
`1,000/-
Monthly
S&P BSE 200
All Business Days
`10/-
Nil
Any day of month
IDFC Sterling Equity Fund(IDFC - SEF)
IDFC Infrastructure Fund(IDFC - IF)
Open - Ended EquityFund
8 March 2011
The investment objective of thescheme is to seek to generatelong-term capital growththrough an active diversifiedportfolio of predominantlyequity related instruments ofc o m p a n i e s t h a t a r eparticipating in and benefitingfrom growth in IndianInfrastructure and infrastructural related activities,However, there can be noassurance that the investmentObjective of the scheme will berealized.
Mr. Rajendra Mishra
3 Years or more
`
`
5,000/- and in multiples of1/- thereafter.
Nil
1.00% if redeemed before 365days from the date of
.allotment
At Ex-Dividend NAV
`1,000/-
Monthly
Nifty Infrastructure
All Business Days
`10/-
Nil
Any day of month
IDFC Equity Fund(IDFC - EF)
Open - Ended EquityFund
9 June 2006
T h e i n v e s t m e n to b j e c t i ve o f t h escheme is to seek tog e n e ra t e c a p i t a lg r o w t h f r o m ap o r t f o l i o o fpredominantly equityand equity relatedi n s t r u m e n t s( inc lud ing EquityDer ivat ives) . Thescheme may alsoinvest in debt & moneymarket instruments togenerate reasonableincome. Howeverthere is no assuranceor guarantee that theobjectives of thes c h e m e w i l l b erealized.
Ms. Meenakshi DawarMr. Ankur Arora
(w.e.f. 7th September2015)
&
3 Years or more
`
`
5,000/- and inmultiples of 1/-thereafter.
Nil
1.00% if redeemedbefore 365 days fromthe date of allotment.(w.e.f. 1 Sept 2009)
At Ex-Dividend NAV
`1,000/-
Monthly
Nifty 50
All Business Days
`10/-
Nil
Any day of month
The Scheme shall seek to generate long-term capitalgrowth from an actively managed portfolio ofpredominantly equity and equity related instruments.The Scheme portfolio would acquire, inter alia, smalland medium size businesses with good long termpotential, which are available at cheap valuations.Such securities would be identified throughdisciplined fundamental research keeping in viewmedium to long-term trends in the businessenvironment.The Scheme shall endeavor to accumulate long-terminvestor wealth by opening subscriptions to unitsduring periods when stocks are available atreasonable valuations. By doing so, the Fundmanagers would endeavor to prevent short-termmoney from flowing into the fund which can provedetrimental to the interests of long-term investors. Asthe scheme would be sold to investors with a long-term investment horizon, it is also expected that theportfolio would remain relatively more insulated today to day redemption pressures. The fund will closesubscription, once it has collected a predetermined“manageable” corpus (approximate amount), whichwill be decided by the fund manager of the schemedepending on the available investment opportunitiesin the stock market / if the fund manager is of theopinion that investment opportunities havediminished. Thus the fund manager will endeavour toensure that there are sufficient assets available tomeet the long-term objectives of the fund.
Open - Ended Equity Fund
7 March 2008
The investment objective of the Scheme isto seek to generate capital appreciationfrom a diversified portfolio of equity andequity related instruments.The Scheme will predominantly invest insmall and midcap equity and equity relatedinstruments. Small and Midcap equity andequity related instruments will be the stocksincluded in the Nifty Free Float Midcap 100or equity and equity related instruments ofsuch companies which have a marketcapitalization lower than the highestcomponents of Nifty Free Float Midcap 100.The Scheme may also invest in stocks otherthan mid cap stocks (i.e. in stocks, whichhave a market capitalisation of above themarket capitalisation range of the definedsmall - midcap stocks) and derivatives. Ondefensive consideration, the Scheme mayalso invest in debt and money marketinstruments. In case of discontinuation /suspension of Nifty Free Float Midcap 100,the AMC reserves the right to modify thedefinition of Mid cap and Small capcompanies. In case of such a modification,the interest of investors will be of paramountimportance. There can be no assurance thatthe investment objective of the scheme willbe realized.
IDFC Imperial Equity Fund(IDFC - IEF)
Open - Ended EquityFund
16 March 2006
The investment objective ofthe scheme is to seek togenerate capital appreciationand/or prov ide incomedistribution from a portfolio ofpredominantly equity andequity related instruments.There is no assurance orguarantee that the objectivesof the scheme will be realized.
3 Years or more
`
`
5 , 0 0 0 / - a n d i nm u l t i p l e s o f 1 / -thereafter.
Nil
1.00% if redeemed before365 days from the date of
. (w.e.f. 1 Sept2009)allotment
At Ex-Dividend NAV
`1,000/-
Monthly
Nifty 50
All Business Days
`10/-
Nil
Any day of month
Mr. Ankur Arora Ms.M e e n a k s h i D awa r(w.e.f. 7th September2015)
&
IDFC Nifty Fund (IDFC-NF)
Open - Ended Index Linked EquityScheme
30 April 2010
The investment objective of the scheme isto replicate the Nifty 50 by investing insecurities of the Nifty 50 in the sameproportion / wightage. However, there isno assurance or guarantee that theobjectives of the scheme will be realizedand the scheme does not assure orguarantee any returns .
Ms. Meenakshi Dawar (w.e.f. 7thSeptember 2015)
3 Years or more
` `500/- and in multiples of 1/-thereafter.
Nil
All subscriptions Including SIP/STP ifredeemed/switched out (to any nonequity scheme of IDFC Mutual Fund)within seven days (7days) from the date ofallotment, exit load of 1% shall be charged.(w.e.f. 07 Nov, 2011)
At Ex-Dividend NAV
`500/-
Monthly
Any day of month
Nil
`10/-
All Business Days
Nifty 50
Mr. Anoop Bhaskar (w.e.f. 30th April 2016)
3 Years or more
` `10,000/- and in multiples of 1/- thereafter.(During the period when the fund is openfor lump sum subscription)
Nil
1.00% if redeemed before 365 days from thedate of .allotment (w.e.f. 1 Sept, 2009)
At Ex-Dividend NAV
`2,000/-
Monthly
S&P BSE 500
All Business Days
`10/-
Nil
Any day of month
IDFC Premier Equity Fund (IDFC - PEF)
Open - Ended Equity Fund
28 September 2005
IDFCDynamicEquityFund(IDFC-DEF)
An Open - Ended EquityFund
10 October 2014
The primary objective ofthe scheme is to seek togenerate long termcapital appreciation withrelatively lower volatilitythrough systemat icallocation of funds intoequity and equity relatedinstruments; and fordefensive purposes inequity derivatives.The secondary objectiveof the scheme will be togenerate in come andcapital appreciationthrough investment inDebt & Money Marketinstruments. There is noassurance or guaranteethat the objectives of thescheme will be realised.
E q u i t y P o r t i o n : M s .Meenakshi Dawar (w.e.f.7/9/15) Debt Portion: Mr.Arvind Subramanian(w.e.f. 09/11/2015)
` 598.41 Crs(as on 31 July, 2016)
` 263.86 Crs(as on 31 July, 2016)
` 112.28 Crs(as on 31 July, 2016)
` 139.24 Crs(as on 31 July, 2016)
` 80.92 Crs(as on 31 July, 2016)
` 6,508.79 Crs(as on 31 July, 2016)
3 Years or more
`
`
5 , 0 0 0 / - a n d i nm u l t i p l e s o f 1 / -t h e r e a f t e r . 1 . 5 % i fredeemed /switched outwithin 18 months fromthe date of allotment
Nil
If redeemed/switchedout within 18 monthsfrom the date ofallotment:
For 10% of investment: Nil
For remaininginvestment : 1.50%If redeemed/switchedout after 18 monthsfrom the date ofallotment: Nil
�
�
Options Available Growth, Dividend -(Payout, Reinvestmenta n d Swe e p ( f ro mEquity Schemes toDebt Schemes only))
Growth, Dividend - (Payout,Reinvestment and Sweep(from Equity Schemes to DebtSchemes only))
Growth , D iv idend(Payout, Reinvestmentand Sweep (fromEquity Schemes toDebt Schemes only))
Mr. Anoop Bhaskar (w.e.f. 30th April2016)
3 Years or more
`
`
5,000/- and in multiples of1/- thereafter.
Nil
1% if redeemed on or before365 days from the date ofallotment. (w.e.f. 7 Sept, 2015)
At Ex-Dividend NAV
`1,000/-
Monthly
Nifty Free Float Midcap 100
All Business Days
`10/-
Nil
Any day of month
` 1,350.26 Crs(as on 31 July, 2016)
Growth, Dividend (Payout,Reinvestment and Sweep (fromEquity Schemes to DebtSchemes only))
Growth, Dividend - (Payout,Reinvestment and Sweep(from Equity Schemes toDebt Schemes only))
Growth , D iv idend - (Payout ,Reinvestment and Sweep (from EquitySchemes to Debt Schemes only))
Growth, Dividend - (Payout, Reinvestmentand Sweep (from Equity Schemes to DebtSchemes only))
Growth, Dividend(Payout, Reinvestmentand Sweep (from EquitySchemes to DebtSchemes only))
At Ex-Dividend NAV
` 1,000/-
Monthly( Any dayof month)
Any day of month
Nil
Nifty 50 and CRISILBalanced Fund –Aggressive Index
All Business Days
`10/-
36
` 245.44 Crs(as on 31 July, 2016)

37
Nature of the Scheme
Inception Date
Investment Objective
Fund Manager
Ideal Investment Horizon
Minimum InvestmentAmount
Entry Load
Exit Load
Options Available
Dividend Re-investment
SIP (Minimum Amount)
SIP Frequency
Benchmark
NAV Frequency
Face Value ( /Unit)`
Lock in Period
SIP Dates (Monthly)
IDFC Tax Advantage (ELSS) Fund(IDFC-TA(ELSS)
Open ended Equity Linked SavingScheme with lock in period of 3years26 December 2008
The investment objective of theScheme is to seek to generatelong term capital growth from ad i v e r s i f i e d p o r t f o l i o o fpredominantly equity and equityrelated securities. There can be noassurance that the investmentobjective of the scheme will berealised.
Mr. Ankur Arora (w.e.f. 7thSeptember 2015)
3 Years or more
`
`
500/- and in multiples of500/- thereafter.
Nil
Nil
Growth, Dividend (Payout,Reinvestment and Sweep (fromEqui ty Schemes to DebtSchemes only))
At Ex-Dividend NAV
`500/-
Monthly
Any day of month
3 Years
`10/-
All Business Days
S&P BSE 200 Crisil MIP Blended Index
IDFC Asset Allocation Fund ofFund - Conservative Plan (IDFC -
AAF - CP)
Open - Ended Fund of FundsScheme
11 February 2010
The primary objective ofScheme is to generate capitala p p r e c i a t i o n t h r o u g hinvestment in different MutualFunds schemes primarily localfunds based on a defined assetallocation model. However,there can be no assurance thatthe investment objective ofthe scheme will be realized.
Ms. Meenakshi Dawar (w.e.f.7th September 2015)
2 Years or more
`
`
5,000/- and inmultiples of 1/-thereafter.
Nil
1.50% if redeemedbefore 18 months fromthe date of .allotment
Growth, Dividend -(Payout, Reinvestmentand Sweep)
At Ex-Dividend NAV
`1,000/-
Monthly
Any day of month
Nil
`10/-
All Business Days
IDFC Asset Allocation Fund ofFund - Moderate Plan (IDFC-
AAF-MP)
Open - Ended Fund of FundsScheme
11 February 2010
The primary objective of Schemeis to generate capital appreciationthrough investment in differentMutual Funds schemes primarilylocal funds based on a definedasset allocation model. However,there can be no assurance that theinvestment objective of thescheme will be realized.
Ms. Meenakshi Dawar (w.e.f. 7thSeptember 2015)
2 Years or more
` `5,000/- and in multiples of 1/-thereafter.
Nil
1.50% if redeemed before 18months from the date of
.allotment
Growth, Dividend - (Payout,Reinvestment and Sweep)
At Ex-Dividend NAV
`1,000/-
Monthly
Any day of month
Nil
`10/-
All Business Days
Crisil MIP Blended Index CRISIL Balanced Fund –Aggressive Index
IDFC Asset Allocation Fund ofFund - Aggressive Plan (IDFC-
AAF-AP)
Open - Ended Fund of FundsScheme
11 February 2010
The primary objective of Schemei s t o g e n e r a t e c a p i t a lappreciation through investmentin different Mutual Fundsschemes primarily local fundsbased on a defined assetallocation model. However, therecan be no assurance that theinvestment objective of thescheme will be realized.
Ms. Meenakshi Dawar (w.e.f.7th September 2015)
2 Years or more
`
`
5,000/- and in multiples of1/- thereafter.
Nil
1.50% if redeemed before 18months from the date of
.allotment
At Ex-Dividend NAV
`1,000/-
Monthly
Any day of month
Nil
`10/-
All Business Days
Growth, Dividend - (Payout,Reinvestment and Sweep)
IDFC Tax Saver (ELSS) Fund(IDFC-TS(ELSS)
S&P BSE 200
10 year closed ended EquityLinked Saving Scheme
15 March 2007
The investment objective of theScheme is to seek to generatelong term capital growth from ad ive rs i f i ed por t fo l io o fpredominantly equity andequity related instruments.There can be no assurance thatthe investment objective of thescheme will be realised.
Mr. Ankur Arora (w.e.f. 7thSeptember 2015)
-
`
`
500/- and in multiples of500/- thereafter.
Nil
Nil (w.e.f. 4 Sep,2009)
At Ex-Dividend NAV
NA
NA
NA
3 Years
`10/-
All Business Days
Growth, Dividend
IDFC Arbitrage Plus Fund(IDFC - APF)
Open - Ended Equity Fund
9 June 2008
The investment objective ofthe Scheme is to generateincome (absolute to lowvolatility returns) by takingadvantage of opportunitiesin the cash and the derivativesegments of the equitymarkets inc lud ing thearbitrage opportunit iesa v a i l a b l e w i t h i n t h ederivative segment, by usingother derivative basedstrategies and by investingthe balance in debtandmoney market instruments.H oweve r t h e r e i s n oa s s u r a n c e t h a t t h einvestment objective of thescheme will be realized.
Mr. Yogik Pitti Ms. MeenakshiDawar (w.e.f. 7th September2015)
&
1 Year or more
`
`
5,000/- and in multiples of1/- thereafter.
Nil
0 . 2 5 % i f re d e e m e d /switched-out on or before 3month from the date ofa l lo tment (w.e . f . 24thDecember 2014)
At Ex-Dividend NAV
`1,000/-
Monthly
Crisil Liquid Fund Index
All Business Days
`10/-
Nil
Any day of month
Growth, Dividend - (Payout,Reinvestment and Sweep(from Equity Schemes toDebt Schemes only)) -Annual & Regular
IDFC Arbitrage Fund(IDFC-AF)
Open - Ended Equity Fund
21 December 2006
Mr. Yogik Pitt i Ms.Meenakshi Dawar (w.e.f. 7thSeptember 2015)
&
1 Year or more
`
`
5,000/- and in multiplesof 1/- thereafter.
Nil
0.25% i f redeemed /switched-out within 1 monthfrom the date of allotment(w.e.f 01st July 2016)
At Ex-Dividend NAV
`1,000/-
Monthly
Any day of month
Nil
`10/-
All Business Days
Crisil Liquid Fund Index
Growth, Dividend - (Payout,Reinvestment and Sweep(from Equity Schemes toDebt Schemes only)) -Annual & Regular
The investment objective ofthe Scheme is to generatecapital appreciation andincome by predominantlyinvest ing in arbitrageopportunity in the cash andthe derivative segments of theequity markets and thearb i t rage opportun i tyavailable within the derivativesegments and by investingthe balance in debt andmoney market instruments.However there is no assurancethat the investment objectiveof the scheme will be realized.
IDFC Equity Opportunity - Series 2(IDFC - EQOS2)
Close Ended Equity scheme
31 January 2014
Mr. Ankur Arora (w.e.f. 7thSeptember 2015)
3 Years
` `5,000/- and multiples of 10/-
Not applicable
Nil
-
-
NA
NA
3 Years
` 10/- each
Daily
S&P BSE 500 Index
Dividend
The primary investment objective ofthe Scheme is to seek to generatecapital appreciation from a portfoliothat is invested in equity and equityrelated securities of Indian and foreigncompanies.
The Fund will invest in either growthstocks or value stocks or both withoutany capitalization bias. As and whenthe fund manager is of the view thatthe investment has met its desiredobjective, the same shall be liquidatedand distributed by way of dividend.
However, there can be no assurancethat the investment objective of theScheme will be realized
Fund Snapshot
Month end AUM ` 342.06 Crs(as on 31 July, 2016)
` 465.23 Crs(as on 31 July, 2016)
` 32.79 Crs(as on 31 July, 2016)
` 2,315.35 Crs(as on 31 July, 2016)
` 371.54 Crs(as on 31 July, 2016)
` 22.94 Crs(as on 31 July, 2016)
` 37.02 Crs(as on 31 July, 2016)
` 22.70 Crs(as on 31 July, 2016)

Nature of the Scheme
Inception Date
Investment Objective
Fund Manager
Ideal Investment Horizon
Minimum Investment Amount
Entry Load
Exit Load
Options Available
Dividend Re-investment
SIP (Minimum Amount)
SIP Frequency
SIP Dates (Monthly)
Lock in Period
Benchmark
NAV Frequency
Face Value ( /Unit)`
An Open Ended DebtScheme
25 February 2010
The primary objective of
Scheme is to generate
regular returns through
investment primarily in
debt secur i t ies . The
secondary objective of the
Scheme is to generate
l o n g - t e r m c a p i t a l
appreciation by investing a
portion of the Scheme's
assets in equity securities.
Monthly Income is not
assumed and the same is
subject to availability of
distributable surplus.
Equity Portion: Mr. Anoop
Bhaskar (w.e.f. 15th July
2016) & Debt Portion: Mr.
Anurag Mittal (w.e.f.
09/11/2015)
1 Year or more
`
` thereafter.5,000/- and in multiples
of 1/-
Nil
1% of the NAV shall beapplicable to investorswho redeem/switch out ofsuch investments withinone year (365 Days) fromthe date of subscriptionapplying First in First Outbasis, (includingthrough SIP/STP).
allotment
G row t h , D i v i d e n d -Quarterly, Regular
At Ex-Dividend NAV
`1,000/-
Monthly
Any day of month
Nil
`10/-
All Business Days
Crisil MIP Blended Index
IDFC Monthly Income Plan(IDFC-MIP)
IDFC Cash Fund(IDFC - CF)
Open - Ended Liquid Fund
2 July 2001
IDFC - CF is an open-ended liquid fund with anobjective to generateoptimal returns with highliquidity by investing inhigh qual i ty moneym a r k e t a n d d e b tinstruments. However,there can be no assurancethat the investmentobjectives of the schemewill be realized.
Mr. Harshal Joshi(w.e.f.
15th September 2015) &
Mr. Anurag Mittal (w.e.f.
09th November 2015)
1 Week or more
`
`
5,000/- and in multiplesof 1/-thereafter.
Nil
Nil
Growth, Dividend - Daily,We e k l y, M o n t h l y &Periodic
At Ex-Dividend NAV
Plan A: 1,000/-`
Monthly
Any day of month
Nil
Crisil Liquid Fund Index
Daily
` (w.e.f. 05 Nov,2011)1000/-
IDFC Money Manager Fund -Treasury Plan
(IDFC - MMF - TP)
Open - Ended Income Fund
18 February 2003
Seek to generate stablereturns with a low riskstrategy by creating ap o r t f o l i o t h a t i ssubstantially invested ingood quality floating ratedebt or money marketinstruments, fixed ratedebt or money marketinstruments swapped forfloating returns and fixedrate debt and moneym a r ke t i n s t r u m e n t s .However, there can be noa s s u r a n c e t h a t t h einvestment objectives oft h e s c h e m e w i l l b erealized.
Mr. Anurag Mittal (w.e.f.
09th November 2015)
15 Days or more
`
`
5,000/- and in multiplesof 1/-thereafter.
Nil
Nil
Growth, Dividend - Daily,Weekly, Monthly & Periodic
At Ex-Dividend NAV
`1,000/-
Monthly
Any day of month
Nil
Crisil Liquid Fund Index(w.e.f 23rd July, 2015)
All Business Days
`10/-
IDFC Money Manager Fund- Investment Plan(IDFC - MMF - IP)
Open - Ended Income Fund
9 August 2004
Seek to generate stablereturns with a low riskstrategy by creating ap o r t f o l i o t h a t i ssubstantially invested ingood quality floating ratedebt or money marketinstruments, fixed rate debto r m o n e y m a r k e tinstruments swapped forfloating returns and fixedrate debt and money marketinstruments. However thereis no assurance that theinvestment objective of thescheme will be realized.
Mr. Harshal Joshi(w.e.f. 15th
September 2015)
12 Months or more
`
`
5,000/- and in multiplesof 1/-thereafter.
Nil Nil
For all investment includingSIP/Micro SIP/STP shall be0.25% of the applicable NAVif redeemed / switched outwithin One Month from thedate of allotment. (w.e.fMarch 01, 2011)
Growth, Dividend - Daily,Weekly, Monthly, Quarterly,Annual & Periodic
At Ex-Dividend NAV
Plan A: 1,000/-`
Monthly
Any day of month
Nil
Crisil Short Term Bond FundIndex (w.e.f 23rd July, 2015)
All Business Days
`10/-
IDFC Super Saver Income Fund -Short Term Plan (IDFC - SSIF - ST)
IDFC Super Saver Income Fund -Medium Term Plan (IDFC - SSIF-MT)
Open - Ended Income Fund
8 July 2003
The primary investment objectiveof the scheme is to seek to generatestable returns with a low-riskstrategy by creating a portfolio thatis invested in good quality fixedincome & Money Market securities.However, there can be no assurancethat the investment objectives ofthe scheme will be realized.
Mr. Suyash Choudhary (w.e.f. 15th
September 2015)
3 Years or more
` `5,000/- and in multiples of 1/-thereafter.
Nil
0.50% if redeemed on or before 6months from the date of allotment.(w.e.f. 8 March 2016)
Growth, Dividend - Daily, Fortnightly(Payout & Reinvestment), Monthly, Bi -Monthly (once in two months),Quarterly & Periodic
At Ex-Dividend NAV
Plan A: 1,000/-`
Monthly
Any day of month
Nil
CRISIL Short Term Bond FundIndex
All Business Days
Open - Ended Income Fund
14 December 2000
The primary investment objectiveof the scheme is to seek to generatestable returns with a low-riskstrategy by creating a portfolio thatis invested in good quality fixedincome & Money Market securities.However, there can be no assurancethat the investment objectives ofthe scheme will be realized.
Mr. Suyash Choudhary
9 Months or more
` `5,000/- and in multiples of 1/-thereafter.
Nil
Nil (w.e.f. 23 May 2016)
Growth, Dividend - Fortnightly(Payout & Reinvestment), Monthly& Periodic
At Ex-Dividend NAV
Plan A: 1,000/-`
Monthly
Any day of month
Nil
CRISIL Short Term Bond Fund Index
All Business Days
`10/- `10/-
IDFC Super Saver Income Fund -Investment Plan (IDFC - SSIF - IP)
Open - Ended Income Fund
14 July 2000
The primary investment objectiveof the scheme is to seek to generatestable returns with a low-riskstrategy by creating a portfolio thatis invested in good quality fixedincome & Money Market securities.However, there can be no assurancethat the investment objectives ofthe scheme will be realized.
Mr. Suyash Choudhary
3 Years or more
` `15,000/- and in multiples of /-thereafter.
Nil
If redeemed/switched out within365 days from the date of allotment:
For 10% of investment : NilFor remaining investment : 1%
If redeemed/switched out after 365days from the date of allotment: Nil
�
�
Growth, Dividend - Quarterly, HalfYearly, Annual & Periodic
At Ex-Dividend NAV
`1,000/-
Monthly
Any day of month
Nil
CRISIL Bond Fund IndexComposite
All Business Days
`10/-
Fund Snapshot
38
Month end AUM ` 265.11 Crs(as on 31 July, 2016)
` 9,721.47 Crs(as on 31 July, 2016)
` 2,026.13 Crs(as on 31 July, 2016)
` 1,753.70 Crs(as on 31 July, 2016)
` 4,902.54 Crs(as on 31 July, 2016)
` 3,904.99 Crs(as on 31 July, 2016)
` 1,909.82 Crs(as on 31 July, 2016)
IDFC CorporateBond Fund (IDFC - CBF)
An Open Ended Income Fund
12 January 2016
The Fund seeks to provide steadyincome and capital appreciation byinvesting primarily in corporatedebt securities across maturitiesand ratings. However, there is noassurance or guarantee that theobjectives of the scheme will berealised.
Mr. Anurag Mittal
12 Months or more
` `5,000/- and in multiples of 1/-thereafter.
0.25% if redeemed/switched outwithin 30 days from the date ofallotment. (w.e.f. 18th July 2016)
Dividend-Monthly, Quarterly, HalfYearly, Annual & Periodic
CRISIL Short Term Bond Fund Index
All Business Days
` 1,000/-
`10/-
Nil
Any day of month
Monthly
At Ex-Dividend NAV
` 3,037.70 Crs(as on , 2016)31 July

Nature of the Scheme
Inception Date
Investment Objective
Fund Manager
Ideal Investment Horizon
Minimum Investment Amount
Entry Load
Exit Load
Options Available
Dividend Re-investment
SIP (Minimum Amount)
SIP Frequency
SIP Dates (Monthly)
Lock in Period
Benchmark
NAV Frequency
Face Value ( /Unit)`
IDFC Dynamic Bond Fund(IDFC - DBF)
Open - Ended Income Fund
25 June 2002
Seek to generate optimal returnswith high liquidity by activemanagement of the portfolio; byinvesting in high quality moneymarket & debt instruments.However there can be no assurancethat the investment objectives ofthe Scheme will be realized.
Mr. Suyash Choudhary
3 Years or more
` `5,000/- and in multiples of 1/-thereafter.
Nil
0.50% of the applicable NAV ifredeemed / switched out within 3months from the date of allotment(w.e.f. 01 July 2012)
Growth, Dividend - Quarterly(March, June, September &December), Half Yearly, Annual,Regular & Periodic
At Ex-Dividend NAV
`1,000/-
Monthly
Any day of month
Nil
CRISIL Composite Bond FundIndex
All Business Days
`10/-
IDFC Government Securities Fund -Provident Fund Plan
(IDFC –GSF-PF)
Open Ended - Dedicated Gilt Fund
29 March 2004
Seek to generate optimal returnswith high liquidity by investing inGovernment Securities. Howeverthere is no assurance that theinvestment objective of the schemewill be realized.
Mr. (Since 15thSuyash ChoudharyOctober 2010)
3 Years or more
` `5,000/- and in multiples of 1/-thereafter.
Nil (w.e.f. 11th December 2014)
Nil (w.e.f. 11-Dec-2014)
Growth, Dividend - Quarterly,Annual & Periodic
At Ex-Dividend NAV
`1,000/-
Monthly
Any day of month
Nil
ISEC Composite Index
All Business Days
`10/-
IDFC Government Securities Fund -Short Term Plan (IDFC –GSF-ST)
Open - Ended Dedicated Gilt Fund
9 March 2002
IDFC – GSF -ST is an open endeddedicated gilt scheme with anobjective to generate optimalreturns with high liquidity byinvesting Government Securities.However there is no assurance thatthe investment objective of thescheme will be realized.
Mr. (Since 15thSuyash ChoudharyOctober 2010)
3 Years or more
` `5,000/- and in multiples of 1/-thereafter.
Nil
Nil
Growth, Dividend - Weekly,Monthly, Quarterly & Periodic
At Ex-Dividend NAV
`1,000/-
Monthly
Any day of month
Nil
I - Sec Si Bex(w.e.f 30th November, 2015)
All Business Days
`10/-
IDFC Ultra short Term Fund(IDFC –USTF)
Open - Ended Income Fund
17 January 2006
To offer an investment avenue forshort term savings by looking togenerate stable returns with a lowrisk strategy. The scheme will have aportfolio that is invested in goodquality debt and money marketinstruments such that the fund willoffer a blend of liquidity withstability of returns. There can be noassurance that the investmentobjective of the scheme will berealized.
Mr. Anurag Mittal (w.e.f. 09th
November 2015)
15 Days or more
` `5,000/- and in multiples of 1/-thereafter.
Nil
Nil (w.e.f. 29-Jun-2012)
Growth, Dividend - Daily, Weekly,Monthly, Quarterly & Periodic
-
`1,000/-
Monthly
Any day of month
Nil
Crisil Liquid Fund Index
All Business Days
`10/-
IDFC Banking Debt Fund(IDFC –BDF)
Open - Ended Income Fund
7 March 2013
The primary objective of thescheme is to seek to generate stablereturns with a low risk strategy bycreating a portfolio that is investedin debt & money market instrumentissued by schedule commercialbanks. However, there can be noassurance or guarantee that theobjective of the scheme realized
Mr. (Since 1stHarshal Joshi August2014)
3 Years or more
` `5,000 /- and in multiple of 1/-thereafter
Nil
All Investment including SIP/MicroS IP/STP/FOF i f redeemed/switched out within 7 days from thedate of allotment – 0.15%. No ExitLoads / CDSC will be chargeable incase of switches made betweendifferent options of the Scheme.
Growth, Dividend - Daily,Fortnightly, Monthly(Reinvestment), Quarterly(Payout), Annual (Payout)Periodic
&
At ex-dividend NAV
`1000/-
Monthly
Any day of month
Nil
Crisil Liquid Fund Index(w.e.f 30th November, 2015)
All Business Days
`10/-
IDFC Government Securities Fund -Investment Plan (IDFC –GSF-IP)
Open - Ended Dedicated Gilt Fund
9 March 2002
IDFC – GSF -IP is an open endeddedicated gilt scheme with anobjective to generate optimalreturns with high liquidity byinvesting Government Securities.However there is no assurance thatthe investment objective of thescheme will be realized.
Mr. (Since 15thSuyash ChoudharyOctober 2010)
3 Years or more
` `5,000/- and in multiples of 1/-thereafter.
Nil
Nil (w.e.f. 15 Jul 2011)
Growth, Dividend - Quarterly, HalfYearly, Annual, Regular & Periodic
At Ex-Dividend NAV
`1,000/-
Monthly
Any day of month
Nil
ISEC Composite Index
All Business Days
`10/-
IDFC All Seasons Bond Fund(IDFC – ASBF)
Open - Ended Fund of FundsScheme
13 September 2004
Seek to generate optimal returnswith high liquidity by activemanagement of the portfolio byinvesting predominantly in debto r i e n t e d m u t u a l f u n dschemesand money marketinstruments. However, there canbe no assurance that theinvestment objectives of theScheme will be realized
Mr. Harshal Joshi(w.e.f 15th July 2016)
12 Months or more
` `5,000/- and in multiples of 1/-thereafter.
Nil
0.50% if redeemed or switchedbefore 3 months(w.e.f. 09 Oct 2013)
At Ex-Dividend NAV
`1,000/-
Monthly
Any day of month
Nil
Crisil Short Term Bond Fund Index(w.e.f 30th November, 2015)
All Business Days
`10/-
Growth, Dividend - Daily, Weekly,Fortnightly, Quarterly, Half Yearly,Annual & Periodic
Fund Snapshot
39
Month end AUM ` 4,970.26 Crs(as on 31 July, 2016)
` 189.61 Crs(as on 31 July, 2016)
` 72.58 Crs(as on 31 July, 2016)
` 4,920.50 Crs(as on 31 July, 2016)
` 111.93 Crs(as on 31 July, 2016)
` 1,494.34 Crs(as on 31 July, 2016)
` 660.12 Crs(as on 31 July, 2016)

Minimum Thresholds
40
Have listed a few examples for clarity.
1. Revise the minimum permissible Additional Purchase Amount to 1,000/- (in multiples of 1/-) with the exception of ELSS & Nifty schemes where the minimum amounts arefixed at 500/-E.g.: Additional purchase for 900/- in say IDFC Classic Equity Fund would be rejected. Additional purchase for 900/- in say IDFC TAF / IDFC Nifty Fund would beprocessed.
2. Revise the minimum permissible Redemption Amount to 500/- (in multiples of 0.01/-). For folios with balances lower than 500/- the redemption would be processed for“All Units”
E.g.: Balance in IDFC CEF is 499/-, a redemption request for 500/- would be processed for “All Units” i.e.: 499/- by default.
3. Revise the min permissible Switch Amount to 1,000/- (in multiples of 0.01 with the exception of ELSS and FMP / FTP's where the switches are in multiples of 500/- and10/- respectively)
E.g.: Balance in IDFC CEF is 999/-, a switch request for 500/- into IDFC Cash Fund would be rejected (trxn for amount less than 1,000/- and does not meet the mininvestment threshold for Cash Fund).
4. Revise the min transaction amount for STP to 1,000/- (as it is mentioned as 500/- in the SID) for all funds, with the exception of STP's into TAF and Nifty where the minimumpermissible STP amount would remain at 500/-.
5. For PEF the minimum STP amount to be changed to 2,000/- in line with the SIP minimum amount.
` `
`
` `
` ` `
` ` `
` ` `
`
` ` `
` `
`
`
Additional Purchase 1 IDFC Tax Advantage (ELSS) Fund - 500 and in multiples of 500 thereafter; IDFCNifty Fund - 500 and any amount thereafter; Other schemes – 1,000 and anyamount thereafter.
Switches 1 IDFC Tax Advantage (ELSS) Fund (being the switch-in scheme) - 500 and inmultiples of 500 thereafter; IDFC Nifty Fund (being the switch-in scheme) - 500and any amount thereafter; Other schemes (being the switch-in scheme) – 1,000 andany amount thereafter
IDFC Premier Equity Fund (being the destination scheme) - 2,000 and any amountthereafter; IDFC Tax Advantage (ELSS) Fund (being the destination scheme) - 500and any amount in multiples of 500 thereafter; IDFC Nifty Fund (being thedestination scheme) - 500 and any amount thereafter; Other schemes (being thedestination scheme) - 1,000 and any amount thereafter.
Redemption 1 500.00 and any amount thereafter. If the balance in the Folio / Account available forredemption is less than the minimum amount prescribed above, the entire balanceavailable for redemption will be redeemed.
` ` `
` `
` `
` `
`
`
`
`
`
`
` `
The Board of Directors of IDFC AMC Trustee Company Ltd. (Trustee of IDFC Mutual Fund) has approved the revision of the minimuminvestment / redemption amount for the open-ended schemes of IDFC Mutual Fund as under effective January 13, 2014 (Monday):
All the other terms & conditions of the Scheme Information Document of the respective Scheme remain unchanged.
Transaction Type Current Amount Revised Amount
Systematic TransactionPlan (amount per instalment)
IDFC PremierEquity Fund -1,000; Other
schemes - 500`
`

Scheme Managed: IDFC Sterling Equity FundRegular Plan 35.9325June 30, 2016Growth Option (NAV as on per Unit):`
Greater than 1 year returns are Compounded Annualised Returns. ^ Past performance may or may not be sustained in future # Nifty Free Float ##Nifty 50Midcap 100
Greater than 1 year returns are Compounded Annualised Returns. ^ Past performance may or may not be sustained in future # Nifty Free Float ##Nifty 50Midcap 100
Scheme Managed: IDFC Sterling Equity FundOption: Direct Plan Growth (NAV as on per Unit):`June 30, 2016 36.9497
PeriodScheme
Returns ^BenchmarkReturns #
AlternateBenchmarkReturns ##
Current Value ( ) of Standard Investment of 10,000` `
Benchmark#Alternate
Benchmark##Scheme^
NAV perUnit ( )`
Mar 07, 2008 (Since Inception) 10.0000 16.62% 9.48% 6.86% 35,933 21,252 17,369
Jun 30, 2015 To Jun 30, 2016 36.1433 -0.58% 6.20% -0.96%
Jun 30, 2014 To Jun 30, 2015 28.9452 24.87% 17.24% 9.95% NA
Jun 28, 2013 To Jun 30, 2014 19.4061 48.83% 50.79% 30.09%
PeriodScheme
Returns ^BenchmarkReturns #
AlternateBenchmarkReturns ##
Current Value ( ) of Standard Investment of 10,000` `
Benchmark#Alternate
Benchmark##Scheme^
NAV perUnit ( )`
Jan 01, 2013 (Since Inception) 21.8912 16.15% 14.51% 9.94% 16,879 16,061 13,927
Jun 30, 2015 To Jun 30, 2016 36.8921 0.16% 6.20% -0.96%
Jun 30, 2014 To Jun 30, 2015 29.3017 25.90% 17.24% 9.95%
Jun 28, 2013 To Jun 30, 2014 19.4722 50.14% 50.79% 30.09%
NA
Fund Manager Details
41
Regular Plan Growth Option (NAV as on per Unit): 32.8225`June 30, 2016
Fund Manager Name:Scheme Managed:
Mr. Anoop Bhaskar (w.e.f. 30/4/16)
IDFC Classic Equity Fund
Scheme Managed: IDFC Classic Equity FundOption: Direct Plan Growth (NAV as on per Unit):`June 30, 2016 34.0448
PeriodScheme
Returns ^BenchmarkReturns #
AlternateBenchmarkReturns ##
Current Value ( ) of Standard Investment of 10,000` `
Benchmark#Alternate
Benchmark##Scheme^
NAV perUnit ( )`
Aug 09, 2005 (Since Inception) 10.0000 11.52% 12.35% 12.40% 32,823 35,582 35,743
Jun 30, 2015 To Jun 30, 2016 31.7022 3.53% 0.41% -0.96%
Jun 30, 2014 To Jun 30, 2015 27.2731 16.24% 12.01% 9.95% NA
Jun 28, 2013 To Jun 30, 2014 20.8720 30.48% 34.23% 30.09%
PeriodScheme
Returns ^BenchmarkReturns #
AlternateBenchmarkReturns ##
Current Value ( ) of Standard Investment of 10,000` `
Benchmark#Alternate
Benchmark##Scheme^
NAV perUnit ( )`
Jan 01, 2013 (Since Inception) 22.8039 12.15% 10.91% 9.94% 14,929 14,364 13,927
Jun 30, 2015 To Jun 30, 2016 32.2554 5.55% 0.41% -0.96%
Jun 30, 2014 To Jun 30, 2015 27.5037 17.28% 12.01% 9.95%
Jun 28, 2013 To Jun 30, 2014 20.9376 31.17% 34.23% 30.09%
NA
Regular Plan
74.2434
Growth Option(NAV as on perUnit):
June 30, 2016 `Option: Direct Plan Growth(NAV as on per Unit): 76.0689June 30, 2016 `Scheme Managed: IDFC Premier Equity Fund
Greater than 1 year returns are Compounded Annualised Returns. ^ Past performance may or may not be sustained in future # S&P BSE 500 ##Nifty 50
PeriodScheme
Returns ^BenchmarkReturns #
AlternateBenchmarkReturns ##
Current Value ( ) of Standard Investment of 10,000` `
Benchmark#Alternate
Benchmark##Scheme^
NAV perUnit ( )`
Sep 28, 2005 (Since Inception) 10.0000 20.48% 11.18% 11.38% 74,243 31,296 31,900
Jun 30, 2015 To Jun 30, 2016 71.9153 3.24% 1.15% -0.96%
Jun 30, 2014 To Jun 30, 2015 55.9823 28.46% 11.36% 9.95% NA
Jun 28, 2013 To Jun 30, 2014 36.8950 51.39% 36.44% 30.09%
Scheme Managed: IDFC Premier Equity Fund
Greater than 1 year returns are Compounded Annualised Returns. ^ Past performance may or may not be sustained in future # S&P BSE 500 ##Nifty 50
PeriodScheme
Returns ^BenchmarkReturns #
AlternateBenchmarkReturns ##
Current Value ( ) of Standard Investment of 10,000` `
Benchmark#Alternate
Benchmark##Scheme^
NAV perUnit ( )`
Jan 01, 2013 (Since Inception) 40.4406 19.81% 11.03% 9.94% 18,810 14,416 13,927
Jun 30, 2015 To Jun 30, 2016 73.1692 3.96% 1.15% -0.96%
Jun 30, 2014 To Jun 30, 2015 56.5168 29.46% 11.36% 9.95%
Jun 28, 2013 To Jun 30, 2014 37.0116 52.35% 36.44% 30.09%
NA
Greater than 1 year returns are Compounded Annualised Returns. ^ Past performance may or may not be sustained in future #S&P BSE 200 ##Nifty 50 Greater than 1 year returns are Compounded Annualised Returns. ^ Past performance may or may not be sustained in future #S&P BSE 200 ##Nifty 50
Fund Manager Name: Equity Portion: Mr. Anoop BhaskarDebt Portion: Mr. Anurag Mittal
(w.e.f. 15/07/16) &(w.e.f. 09/11/2015)
IDFC Monthly Income PlanScheme Managed:
Regular Plan
17.7431
GrowthOption (NAV as on
per Unit):June
30, 2016 `
Greater than 1 year returns are Compounded Annualised Returns. # CRISIL MIP Blended Index ##10 Year GOI^ Past performance may or may not be sustained in future
Scheme Managed: IDFC Monthly Income PlanOption: Direct Plan Growth (NAV as on per Unit):`June 30, 2016 18.2949
PeriodScheme
Returns ^BenchmarkReturns #
AlternateBenchmarkReturns ##
Current Value ( ) of Standard Investment of 10,000` `
Benchmark#Alternate
Benchmark##Scheme^
NAV perUnit ( )`
Feb 25, 2010 (Since Inception) 10.0000 9.45% 8.49% 6.57% 17,743 16,772 14,974
Jun 30, 2015 To Jun 30, 2016 16.6077 6.84% 8.63% 10.03%
Jun 30, 2014 To Jun 30, 2015 14.7562 12.55% 11.05% 11.76% NA
Jun 28, 2013 To Jun 30, 2014 13.2787 11.06% 8.24% -2.46%
PeriodScheme
Returns ^BenchmarkReturns #
AlternateBenchmarkReturns ##
Current Value ( ) of Standard Investment of 10,000` `
Benchmark#Alternate
Benchmark##Scheme^
NAV perUnit ( )`
Jan 01, 2013 (Since Inception) 12.9116 10.48% 9.27% 7.22% 14,169 13,634 12,759
Jun 30, 2015 To Jun 30, 2016 16.9959 7.64% 8.63% 10.03%
Jun 30, 2014 To Jun 30, 2015 14.9201 13.91% 11.05% 11.76%
Jun 28, 2013 To Jun 30, 2014 13.3264 11.89% 8.24% -2.46%
NA
Greater than 1 year returns are Compounded Annualised Returns. # CRISIL MIP Blended Index ##10 Year GOI^ Past performance may or may not be sustained in future
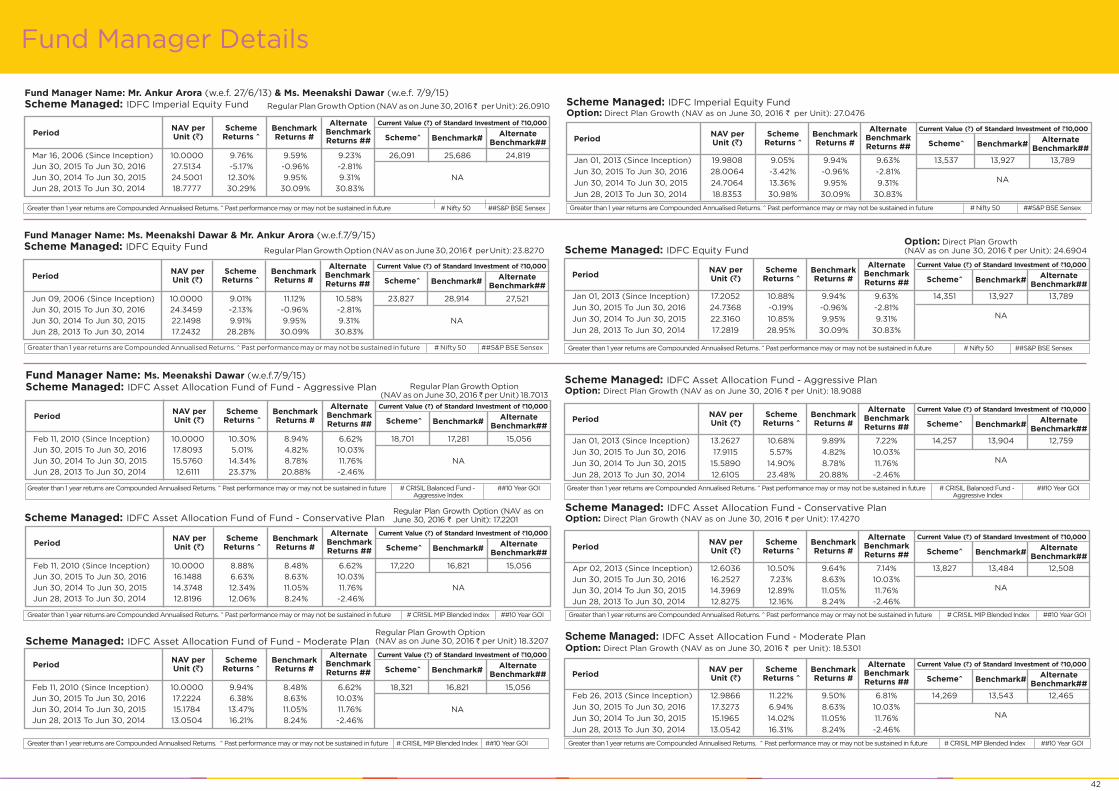
Fund Manager Details
42
Fund Manager Name: Ms. Meenakshi Dawar (w.e.f.7/9/15)
Scheme Managed: IDFC Asset Allocation Fund of Fund - Aggressive Plan Regular Plan Growth Option( per Unit)NAV as on June 30, 2016 18.7013`
PeriodScheme
Returns ^BenchmarkReturns #
AlternateBenchmarkReturns ##
Current Value ( ) of Standard Investment of 10,000` `
Benchmark#Alternate
Benchmark##Scheme^
NAV perUnit ( )`
Feb 11, 2010 (Since Inception) 10.0000 10.30% 8.94% 6.62% 18,701 17,281 15,056
Jun 30, 2015 To Jun 30, 2016 17.8093 5.01% 4.82% 10.03%
Jun 30, 2014 To Jun 30, 2015 15.5760 14.34% 8.78% 11.76% NA
Jun 28, 2013 To Jun 30, 2014 12.6111 23.37% 20.88% -2.46%
Scheme Managed: IDFC Asset Allocation Fund - Aggressive PlanOption: Direct Plan Growth (NAV as on per Unit):`June 30, 2016 18.9088
PeriodScheme
Returns ^BenchmarkReturns #
AlternateBenchmarkReturns ##
Current Value ( ) of Standard Investment of 10,000` `
Benchmark#Alternate
Benchmark##Scheme^
NAV perUnit ( )`
Jan 01, 2013 (Since Inception) 13.2627 10.68% 9.89% 7.22% 14,257 13,904 12,759
Jun 30, 2015 To Jun 30, 2016 17.9115 5.57% 4.82% 10.03%
Jun 30, 2014 To Jun 30, 2015 15.5890 14.90% 8.78% 11.76%
Jun 28, 2013 To Jun 30, 2014 12.6105 23.48% 20.88% -2.46%
NA
Scheme Managed: IDFC Asset Allocation Fund of Fund - Conservative PlanRegular Plan Growth Option (NAV as on
per Unit):June 30, 2016 17.2201`
Greater than 1 year returns are Compounded Annualised Returns. # CRISIL MIP Blended Index ##10 Year GOI^ Past performance may or may not be sustained in future
PeriodScheme
Returns ^BenchmarkReturns #
AlternateBenchmarkReturns ##
Current Value ( ) of Standard Investment of 10,000` `
Benchmark#Alternate
Benchmark##Scheme^
NAV perUnit ( )`
Feb 11, 2010 (Since Inception) 10.0000 8.88% 8.48% 6.62% 17,220 16,821 15,056
Jun 30, 2015 To Jun 30, 2016 16.1488 6.63% 8.63% 10.03%
Jun 30, 2014 To Jun 30, 2015 14.3748 12.34% 11.05% 11.76% NA
Jun 28, 2013 To Jun 30, 2014 12.8196 12.06% 8.24% -2.46%
Greater than 1 year returns are Compounded Annualised Returns. # CRISIL MIP Blended Index ##10 Year GOI^ Past performance may or may not be sustained in future
Scheme Managed: IDFC Asset Allocation Fund - Conservative PlanOption: Direct Plan Growth (NAV as on per Unit):June 30, 2016 ` 17.4270
PeriodScheme
Returns ^BenchmarkReturns #
AlternateBenchmarkReturns ##
Current Value ( ) of Standard Investment of 10,000` `
Benchmark#Alternate
Benchmark##Scheme^
NAV perUnit ( )`
Apr 02, 2013 (Since Inception) 12.6036 10.50% 9.64% 7.14% 13,827 13,484 12,508
Jun 30, 2015 To Jun 30, 2016 16.2527 7.23% 8.63% 10.03%
Jun 30, 2014 To Jun 30, 2015 14.3969 12.89% 11.05% 11.76%
Jun 28, 2013 To Jun 30, 2014 12.8275 12.16% 8.24% -2.46%
NA
Option: Direct Plan Growth(NAV as on per Unit): 24.6904June 30, 2016 `
Greater than 1 year returns are Compounded Annualised Returns. ^ Past performance may or may not be sustained in future # Nifty 50 ##S&P BSE Sensex
Fund Manager Name: Ms. Meenakshi Dawar & Mr. Ankur Arora (w.e.f.7/9/15)
Scheme Managed: IDFC Equity Fund RegularPlan 23.8270June30,2016GrowthOption(NAVason perUnit):` Scheme Managed: IDFC Equity Fund
Greater than 1 year returns are Compounded Annualised Returns. ^ Past performance may or may not be sustained in future # Nifty 50 ##S&P BSE Sensex
PeriodScheme
Returns ^BenchmarkReturns #
AlternateBenchmarkReturns ##
Current Value ( ) of Standard Investment of 10,000` `
Benchmark#Alternate
Benchmark##Scheme^
NAV perUnit ( )`
Jun 09, 2006 (Since Inception) 10.0000 9.01% 11.12% 10.58% 23,827 28,914 27,521
Jun 30, 2015 To Jun 30, 2016 24.3459 -2.13% -0.96% -2.81%
Jun 30, 2014 To Jun 30, 2015 22.1498 9.91% 9.95% 9.31% NA
Jun 28, 2013 To Jun 30, 2014 17.2432 28.28% 30.09% 30.83%
PeriodScheme
Returns ^BenchmarkReturns #
AlternateBenchmarkReturns ##
Current Value ( ) of Standard Investment of 10,000` `
Benchmark#Alternate
Benchmark##Scheme^
NAV perUnit ( )`
Jan 01, 2013 (Since Inception) 17.2052 10.88% 9.94% 9.63% 14,351 13,927 13,789
Jun 30, 2015 To Jun 30, 2016 24.7368 -0.19% -0.96% -2.81%
Jun 30, 2014 To Jun 30, 2015 22.3160 10.85% 9.95% 9.31%
Jun 28, 2013 To Jun 30, 2014 17.2819 28.95% 30.09% 30.83%
NA
Fund Manager Name: Mr. Ankur Arora & Ms. Meenakshi Dawar(w.e.f. 27/6/13) (w.e.f. 7/9/15)
Scheme Managed: IDFC Imperial Equity Fund
Greater than 1 year returns are Compounded Annualised Returns. ^ Past performance may or may not be sustained in future # Nifty 50 ##S&P BSE Sensex
Scheme Managed: IDFC Imperial Equity FundOption: Direct Plan Growth (NAV as on per Unit):`June 30, 2016 27.0476
Greater than 1 year returns are Compounded Annualised Returns. ^ Past performance may or may not be sustained in future # Nifty 50 ##S&P BSE Sensex
PeriodScheme
Returns ^BenchmarkReturns #
AlternateBenchmarkReturns ##
Current Value ( ) of Standard Investment of 10,000` `
Benchmark#Alternate
Benchmark##Scheme^
NAV perUnit ( )`
Mar 16, 2006 (Since Inception) 10.0000 9.76% 9.59% 9.23% 26,091 25,686 24,819
Jun 30, 2015 To Jun 30, 2016 27.5134 -5.17% -0.96% -2.81%
Jun 30, 2014 To Jun 30, 2015 24.5001 12.30% 9.95% 9.31% NA
Jun 28, 2013 To Jun 30, 2014 18.7777 30.29% 30.09% 30.83%
PeriodScheme
Returns ^BenchmarkReturns #
AlternateBenchmarkReturns ##
Current Value ( ) of Standard Investment of 10,000` `
Benchmark#Alternate
Benchmark##Scheme^
NAV perUnit ( )`
Jan 01, 2013 (Since Inception) 19.9808 9.05% 9.94% 9.63% 13,537 13,927 13,789
Jun 30, 2015 To Jun 30, 2016 28.0064 -3.42% -0.96% -2.81%
Jun 30, 2014 To Jun 30, 2015 24.7064 13.36% 9.95% 9.31%
Jun 28, 2013 To Jun 30, 2014 18.8353 30.98% 30.09% 30.83%
NA
Regular Plan 26.0910June 30, 2016Growth Option (NAV as on per Unit):`
Scheme Managed: IDFC Asset Allocation Fund of Fund - Moderate PlanRegular Plan Growth Option( per Unit)NAV as on June 30, 2016 18.3207`
Greater than 1 year returns are Compounded Annualised Returns. # CRISIL MIP Blended Index ##10 Year GOI^ Past performance may or may not be sustained in future
PeriodScheme
Returns ^BenchmarkReturns #
AlternateBenchmarkReturns ##
Current Value ( ) of Standard Investment of 10,000` `
Benchmark#Alternate
Benchmark##Scheme^
NAV perUnit ( )`
Feb 11, 2010 (Since Inception) 10.0000 9.94% 8.48% 6.62% 18,321 16,821 15,056
Jun 30, 2015 To Jun 30, 2016 17.2224 6.38% 8.63% 10.03%
Jun 30, 2014 To Jun 30, 2015 15.1784 13.47% 11.05% 11.76% NA
Jun 28, 2013 To Jun 30, 2014 13.0504 16.21% 8.24% -2.46%
Greater than 1 year returns are Compounded Annualised Returns. # CRISIL MIP Blended Index ##10 Year GOI^ Past performance may or may not be sustained in future
Scheme Managed: IDFC Asset Allocation Fund - Moderate Plan
Option: Direct Plan Growth (NAV as on per Unit):`June 30, 2016 18.5301
PeriodScheme
Returns ^BenchmarkReturns #
AlternateBenchmarkReturns ##
Current Value ( ) of Standard Investment of 10,000` `
Benchmark#Alternate
Benchmark##Scheme^
NAV perUnit ( )`
Feb 26, 2013 (Since Inception) 12.9866 11.22% 9.50% 6.81% 14,269 13,543 12,465
Jun 30, 2015 To Jun 30, 2016 17.3273 6.94% 8.63% 10.03%
Jun 30, 2014 To Jun 30, 2015 15.1965 14.02% 11.05% 11.76%
Jun 28, 2013 To Jun 30, 2014 13.0542 16.31% 8.24% -2.46%
NA
Greater than 1 year returns are Compounded Annualised Returns. # CRISIL Balanced Fund - ##10 Year GOI^ Past performance may or may not be sustained in futureAggressive Index
Greater than 1 year returns are Compounded Annualised Returns. # CRISIL Balanced Fund - ##10 Year GOI^ Past performance may or may not be sustained in futureAggressive Index

Fund Manager Details
43
Fund Manager Name: Mr. Ankur Arora (w.e.f. 7/9/15)
Scheme Managed: IDFC Tax Advantage (ELSS) Fund
Greater than 1 year returns are Compounded Annualised Returns. #S&P BSE 200 ##Nifty 50^ Past performance may or may not be sustained in future
Scheme Managed: IDFC Tax Advantage (ELSS) FundOption: Direct Plan Growth (NAV as on per Unit):`June 30, 2016 40.5842
PeriodScheme
Returns ^BenchmarkReturns #
AlternateBenchmarkReturns ##
Current Value ( ) of Standard Investment of 10,000` `
Benchmark#Alternate
Benchmark##Scheme^
NAV perUnit ( )`
Dec 26, 2008 (Since Inception) 10.0000 19.94% 16.49% 15.22% 39,208 31,490 29,006
Jun 30, 2015 To Jun 30, 2016 40.4563 -3.09% 0.41% -0.96%
Jun 30, 2014 To Jun 30, 2015 30.9328 30.79% 12.01% 9.95% NA
Jun 28, 2013 To Jun 30, 2014 21.0124 46.90% 34.23% 30.09%
Greater than 1 year returns are Compounded Annualised Returns.^ Past performance may or may not be sustained in future #S&P BSE 200 ##Nifty 50
PeriodScheme
Returns ^BenchmarkReturns #
AlternateBenchmarkReturns ##
Current Value ( ) of Standard Investment of 10,000` `
Benchmark#Alternate
Benchmark##Scheme^
NAV perUnit ( )`
Jan 01, 2013 (Since Inception) 22.3115 18.67% 10.91% 9.94% 18,190 14,364 13,927
Jun 30, 2015 To Jun 30, 2016 41.4138 -2.00% 0.41% -0.96%
Jun 30, 2014 To Jun 30, 2015 31.1558 32.92% 12.01% 9.95%
Jun 28, 2013 To Jun 30, 2014 21.0087 47.98% 34.23% 30.09%
NA
Greater than 1 year returns are Compounded Annualised Returns. ^ Past performance may or may not be sustained in future # S&P BSE 200 ##Nifty 50
Scheme Managed: IDFC Tax Saver Fund - ELSS
PeriodScheme
Returns ^BenchmarkReturns #
AlternateBenchmarkReturns ##
Current Value ( ) of Standard Investment of` `22.8374
Benchmark#Alternate
Benchmark##Scheme^
NAV perUnit ( )`
Mar 15, 2007 (Since Inception) 10.0000 9.97% 9.61% 9.24% 24,206 23,478 22,746
Jun 30, 2015 To Jun 30, 2016 25.0244 -3.27% 0.41% -0.96%
Jun 30, 2014 To Jun 30, 2015 21.4291 16.78% 12.01% 9.95% NA
Jun 28, 2013 To Jun 30, 2014 15.9642 34.02% 34.23% 30.09%
Regular Plan Growth Option (NAV as on June 30, 2016 per Unit):` 24.2057
RegularPlan 11.0671June30,2016GrowthOption(NAVason perUnit):`
Fund Manager Name:Scheme Managed:
Mr. Rajendra Kumar Mishra (w.e.f. 27/6/13)
IDFC Infrastructure Fund Scheme Managed: IDFC Infrastructure Fund
Option: Direct Plan Growth (NAV as on per Unit):`June 30, 2016 11.5153
Greater than 1 year returns are Compounded Annualised Returns. ^ Past performance may or may not be sustained in future # ##Nifty 50Nifty Infra Greater than 1 year returns are Compounded Annualised Returns. ^ Past performance may or may not be sustained in future ##Nifty 50#Nifty Infra
PeriodScheme
Returns ^BenchmarkReturns #
AlternateBenchmarkReturns ##
Current Value ( ) of Standard Investment of 10,000` `
Benchmark#Alternate
Benchmark##Scheme^
NAV perUnit ( )`
Mar 08, 2011 (Since Inception) 10.0000 1.92% -0.31% 7.94% 11,067 9,834 15,012
Jun 30, 2015 To Jun 30, 2016 11.9075 -7.06% -12.56% -0.96%
Jun 30, 2014 To Jun 30, 2015 10.3758 14.76% -3.51% 9.95% NA
Jun 28, 2013 To Jun 30, 2014 7.5287 37.58% 49.23% 30.09%
PeriodScheme
Returns ^BenchmarkReturns #
AlternateBenchmarkReturns ##
Current Value ( ) of Standard Investment of 10,000` `
Benchmark#Alternate
Benchmark##Scheme^
NAV perUnit ( )`
Jan 01, 2013 (Since Inception) 8.8847 7.70% 2.44% 9.94% 12,961 10,880 13,927
Jun 30, 2015 To Jun 30, 2016 12.2407 -5.93% -12.56% -0.96%
Jun 30, 2014 To Jun 30, 2015 10.4686 16.93% -3.51% 9.95%
Jun 28, 2013 To Jun 30, 2014 7.5471 38.46% 49.23% 30.09%
NA
RegularPlan 19.8017June30,2016GrowthOption(NAVason perUnit):`
Fund Manager Name:Scheme Managed:
Mr. Yogik Pitti & Ms. Meenakshi Dawar(w.e.f. 27/6/13) (w.e.f. 7/9/15)
IDFC Arbitrage Fund
Greater than 1 year returns are Compounded Annualised Returns. ^ Past performance may or may not be sustained in future # CRISIL Liquid Fund Index ##Nifty 50
Scheme Managed: IDFC Arbitrage FundOption: Direct Plan Growth (NAV as on per Unit): 20.1489`June 30, 2016
Greater than 1 year returns are Compounded Annualised Returns. ^ Past performance may or may not be sustained in future # CRISIL Liquid Fund Index ##Nifty 50
PeriodScheme
Returns ^BenchmarkReturns #
AlternateBenchmarkReturns ##
Current Value ( ) of Standard Investment of 10,000` `
Benchmark#Alternate
Benchmark##Scheme^
NAV perUnit ( )`
Dec 21, 2006 (Since Inception) 10.0000 7.43% 7.68% 8.43% 19,802 20,245 21,619
Jun 30, 2015 To Jun 30, 2016 18.6678 6.07% 7.90% -0.96%
Jun 30, 2014 To Jun 30, 2015 17.2444 8.25% 8.77% 9.95% NA
Jun 28, 2013 To Jun 30, 2014 15.7526 9.42% 9.63% 30.09%
PeriodScheme
Returns ^BenchmarkReturns #
AlternateBenchmarkReturns ##
Current Value ( ) of Standard Investment of 10,000` `
Benchmark#Alternate
Benchmark##Scheme^
NAV perUnit ( )`
Jan 17, 2013 (Since Inception) 15.1805 8.55% 8.71% 9.60% 13,273 13,344 13,723
Jun 30, 2015 To Jun 30, 2016 18.8777 6.73% 7.90% -0.96%
Jun 30, 2014 To Jun 30, 2015 17.3452 8.84% 8.77% 9.95%
Jun 28, 2013 To Jun 30, 2014 15.7779 9.88% 9.63% 30.09%
NA
Scheme Managed: IDFC Nifty Fund
Option: Direct Plan Growth (NAV as on per Unit):`June 30, 2016 16.7638Scheme Managed: IDFC Nifty Fund Regular Plan 16.7234June 30, 2016Growth Option (NAV as on per Unit):`
Greater than 1 year returns are Compounded Annualised Returns. ## S&P BSE Sensex^ Past performance may or may not be sustained in future # Nifty 50 Greater than 1 year returns are Compounded Annualised Returns. ## S&P BSE Sensex^ Past performance may or may not be sustained in future # Nifty 50
PeriodScheme
Returns ^BenchmarkReturns #
AlternateBenchmarkReturns ##
Current Value ( ) of Standard Investment of 10,000` `
Benchmark#Alternate
Benchmark##Scheme^
NAV perUnit ( )`
Apr 30, 2010 (Since Inception) 10.0000 8.69% 7.58% 7.22% 16,723 15,702 15,377
Jun 30, 2015 To Jun 30, 2016 16.7096 0.08% -0.96% -2.81%
Jun 30, 2014 To Jun 30, 2015 15.0824 10.79% 9.95% 9.31% NA
Jun 28, 2013 To Jun 30, 2014 11.5075 30.87% 30.09% 30.83%
PeriodScheme
Returns ^BenchmarkReturns #
AlternateBenchmarkReturns ##
Current Value ( ) of Standard Investment of 10,000` `
Benchmark#Alternate
Benchmark##Scheme^
NAV perUnit ( )`
Jan 01, 2013 (Since Inception) 11.6597 10.94% 9.94% 9.63% 14,378 13,927 13,789
Jun 30, 2015 To Jun 30, 2016 16.7327 0.19% -0.96% -2.81%
Jun 30, 2014 To Jun 30, 2015 15.0932 10.86% 9.95% 9.31%
Jun 28, 2013 To Jun 30, 2014 11.5105 30.93% 30.09% 30.83%NA
RegularPlan June30,2016 39.2077GrowthOption(NAVason perUnit):`5

Fund Manager Details
44
Scheme Managed: IDFC Arbitrage Plus Fund
Greater than 1 year returns are Compounded Annualised Returns. ^ Past performance may or may not be sustained in future # CRISIL Liquid Fund Index ##Nifty 50
RegularPlan 17.3822June30,2016GrowthOption(NAVason perUnit):` Scheme Managed:Option:
IDFC Arbitrage Plus FundDirect Plan Growth (NAV as on per Unit):`June 30, 2016 17.6618
Greater than 1 year returns are Compounded Annualised Returns. ^ Past performance may or may not be sustained in future # CRISIL Liquid Fund Index ##Nifty 50
PeriodScheme
Returns ^BenchmarkReturns #
AlternateBenchmarkReturns ##
Current Value ( ) of Standard Investment of 10,000` `
Benchmark#Alternate
Benchmark##Scheme^
NAV perUnit ( )`
Jun 09, 2008 (Since Inception) 10.0000 7.10% 7.72% 7.87% 17,382 18,210 18,413
Jun 30, 2015 To Jun 30, 2016 16.3591 6.25% 7.90% -0.96%
Jun 30, 2014 To Jun 30, 2015 15.2342 7.38% 8.77% 9.95%
Jun 28, 2013 To Jun 30, 2014 14.0061 8.72% 9.63% 30.09%
NA
PeriodScheme
Returns ^BenchmarkReturns #
AlternateBenchmarkReturns ##
Current Value ( ) of Standard Investment of 10,000` `
Benchmark#Alternate
Benchmark##Scheme^
NAV perUnit ( )`
Dec 31, 2013 (Since Inception) 14.6474 7.78% 8.57% 11.57% 12,058 12,282 13,147
Jun 30, 2015 To Jun 30, 2016 16.5224 6.90% 7.90% -0.96% NA
Jun 30, 2014 To Jun 30, 2015 15.2738 8.17% 8.77% 9.95%
Funds in the Equity Opportunities series have only Dividend Payout Option. However, the NAV is adjusted to the extent of dividend declared for computation of returns.
Fund Manager Name: Mr. Ankur Arora (w.e.f. 7/9/15)Scheme Managed: IDFC Equity Opportunity - Series 2 RegularPlanDividendOption(NAVason perUnit): 18.2994`June30,2016
Scheme Managed: IDFC Equity Opportunity - Series 2 Direct Plan Dividend Option (NAV as on per Unit):`June 30, 2016 18.5841
Greater than 1 year returns are Compounded Annualised Returns. ^ Past performance may or may not be sustained in future # S&P BSE 500 ##Nifty 50 Greater than 1 year returns are Compounded Annualised Returns. ^ Past performance may or may not be sustained in future # S&P BSE 500 ##Nifty 50
Scheme
Returns ^Period
BenchmarkReturns #
AlternateBenchmarkReturns ##
Current Value ( ) of Standard Investment of 10,000` `
Benchmark#Alternate
Benchmark##Scheme^
NAV perUnit ( )`
Jan 31, 2014 (Since Inception) 10.0000 28.45% 17.33% 13.62% 18,299 14,708 13,610
Jun 30, 2015 To Jun 30, 2016 16.5575 10.52% 1.15% -0.96%
Jun 30, 2014 To Jun 30, 2015 13.5396 22.29% 11.36% 9.95%NA
Scheme
Returns ^Period
BenchmarkReturns #
AlternateBenchmarkReturns ##
Current Value ( ) of Standard Investment of 10,000` `
Benchmark#Alternate
Benchmark##Scheme^
NAV perUnit ( )`
Jan 31, 2014 (Since Inception) 10.0000 29.27% 17.33% 13.62% 18,584 14,708 13,610
Jun 30, 2015 To Jun 30, 2016 16.8192 10.49% 1.15% -0.96%
Jun 30, 2014 To Jun 30, 2015 13.6133 23.55% 11.36% 9.95%NA
Greater than 1year returnsareCompoundedAnnualisedReturns. ^ Pastperformancemayormaynotbe sustained in future # Crisil ShortTermBondFund Index ##1 year T-Bill
RegularPlan13.3971
GrowthOption(NAVason perUnit):June30,2016 `Scheme Managed: IDFC Yearly Series Interval Fund II (366 days)
Greater than 1 year returns are Compounded Annualised Returns. ^ Past performance may or may not be sustained in future # Crisil Short Term Bond Fund Index ##1 year T-Bill
Option: Direct Plan Growth Option (NAV as on per Unit):`June 30, 2016 13.4767
PeriodScheme
Returns ^BenchmarkReturns #
AlternateBenchmarkReturns ##
Current Value ( ) of Standard Investment of 10,000` `
Benchmark#Alternate
Benchmark##Scheme^
NAV perUnit ( )`
Feb 12, 2013 (Since Inception) 10.0000 9.04% 9.17% 7.44% 13,397 13,455 12,747
Jun 30, 2015 To Jun 30, 2016 12.3418 8.55% 8.94% 7.67%
Jun 30, 2014 To Jun 30, 2015 11.3242 8.99% 9.56% 8.54%
Jun 28, 2013 To Jun 30, 2014 10.4000 8.84% 8.76% 5.89%
PeriodScheme
Returns ^BenchmarkReturns #
AlternateBenchmarkReturns ##
Current Value ( ) of Standard Investment of 10,000` `
Benchmark#Alternate
Benchmark##Scheme^
NAV perUnit ( )`
Feb 12, 2013 (Since Inception) 10.0000 9.23% 9.17% 7.44% 13,477 13,455 12,747
Jun 30, 2015 To Jun 30, 2016 12.4020 8.67% 8.94% 7.67%
Jun 30, 2014 To Jun 30, 2015 11.3463 9.30% 9.56% 8.54%
Jun 28, 2013 To Jun 30, 2014 10.4019 8.99% 8.75% 5.85%
NA NA
Regular Plan13.3401
Growth Option(NAV as on per Unit):June 30, 2016 `Scheme Managed: IDFC Yearly Series Interval Fund I (366 days)
Greater than 1year returnsareCompoundedAnnualisedReturns. ^ Pastperformancemayormaynotbe sustained in future # Crisil ShortTermBondFund Index ##1 year T-Bill
Scheme Managed:Option:
IDFC Yearly Series Interval Fund I (366 days)Direct Plan Growth Option (NAV as on per Unit):June 30, 2016 13.4094`
Greater than 1 year returns are Compounded Annualised Returns. ^ Past performance may or may not be sustained in future # Crisil Short Term Bond Fund Index ##1 year T-Bill
PeriodScheme
Returns ^BenchmarkReturns #
AlternateBenchmarkReturns ##
Current Value ( ) of Standard Investment of 10,000` `
Benchmark#Alternate
Benchmark##Scheme^
NAV perUnit ( )`
Jan 22, 2013 (Since Inception) 10.0000 8.74% 9.12% 7.41% 13,340 13,500 12,786
Jun 30, 2015 To Jun 30, 2016 12.3000 8.46% 8.94% 7.67%
Jun 30, 2014 To Jun 30, 2015 11.3039 8.81% 9.56% 8.54%
Jun 28, 2013 To Jun 30, 2014 10.3907 8.74% 8.76% 5.89%
PeriodScheme
Returns ^BenchmarkReturns #
AlternateBenchmarkReturns ##
Current Value ( ) of Standard Investment of 10,000` `
Benchmark#Alternate
Benchmark##Scheme^
NAV perUnit ( )`
Jan 22, 2013 (Since Inception) 10.0000 8.91% 9.12% 7.41% 13,409 13,500 12,786
Jun 30, 2015 To Jun 30, 2016 12.3508 8.57% 8.94% 7.67%
Jun 27, 2014 To Jun 30, 2015 11.3133 9.17% 9.65% 8.65%
Jun 28, 2013 To Jun 30, 2014 10.3929 8.88% 8.75% 5.85%
NANA
Fund Manager Name: Mr. Harshal Joshi
Regular Plan10.8762
Growth Option(NAV as on per Unit):June 30, 2016 `Scheme Managed: IDFC Dynamic Equity Fund
Greater than 1year returnsareCompoundedAnnualisedReturns. ^ Pastperformancemayormaynotbe sustained in future # CRISIL BalancedFund – Aggressive Index ##Nifty 50 Greater than 1year returnsareCompoundedAnnualisedReturns. ^ Pastperformancemayormaynotbe sustained in future # CRISIL BalancedFund –Aggressive Index ##Nifty 50
Scheme Managed:Option:
IDFC Dynamic Equity FundDirect Plan Growth Option (NAV as on per Unit):June 30, 2016 11.1370`
PeriodScheme
Returns ^BenchmarkReturns #
AlternateBenchmarkReturns ##
Current Value ( ) of Standard Investment of 10,000` `
Benchmark#Alternate
Benchmark##Scheme^
NAV perUnit ( )`
Oct 10, 2014 (Since Inception) 10.0000 6.45% 5.97% 3.12% 11,137 11,051 10,544
Jun 30, 2015 To Jun 30, 2016 10.8462 2.68% 4.82% -0.96% NA
PeriodScheme
Returns ^BenchmarkReturns #
AlternateBenchmarkReturns ##
Current Value ( ) of Standard Investment of 10,000` `
Benchmark#Alternate
Benchmark##Scheme^
NAV perUnit ( )`
Oct 10, 2014 (Since Inception) 10.0000 4.99% 5.97% 3.12% 10,876 11,051 10,544
Jun 30, 2015 To Jun 30, 2016 10.7410 1.26% 4.82% -0.96% NA
Fund Manager Name: Equity Portion: Ms. Meenakshi DawarDebt Portion: Mr. Arvind Subramanian
(w.e.f. 7th September 2015)(w.e.f. 09th November 2015)

Fund Manager Details
45
RegularPlan 12.8376June30,2016GrowthOption(NAVason perUnit):`Scheme Managed: IDFC Fixed Term Plan Series 26
Greater than 1 year returns are Compounded Annualised Returns. ^ Past performance may or may not be sustained in future # Crisil Short Term Bond Fund Index ##1 year T-Bill
Option: Direct Plan Growth Option (NAV as on per Unit):`June 30 12.9167, 2016
Greater than 1 year returns are Compounded Annualised Returns. ^ Past performance may or may not be sustained in future # Crisil Short Term Bond Fund Index ##1 year T-Bill
PeriodScheme
Returns ^BenchmarkReturns #
AlternateBenchmarkReturns ##
Current Value ( ) of Standard Investment of 10,000` `
Benchmark#Alternate
Benchmark##Scheme^
NAV perUnit ( )`
Aug 14, 2013 (Since Inception) 10.0000 9.06% 9.80% 8.33% 12,838 13,091 12,593
Jun 30, 2015 To Jun 30, 2016 11.8397 8.43% 8.94% 7.67% NA
Jun 30, 2014 To Jun 30, 2015 10.9762 7.87% 9.56% 8.54%
RegularPlanGrowthOption(NAVason perUnit):June30,2016 13.4247`
Scheme Managed: IDFC Yearly Series Interval Fund III (366 days)
Greater than 1 year returns are Compounded Annualised Returns. ^ Past performance may or may not be sustained in future # Crisil Short Term Bond Fund Index ##1 year T-Bill
Option: Direct Plan Growth Option (NAV as on per Unit):`June 30 13.4640, 2016
Greater than 1 year returns are Compounded Annualised Returns. ^ Past performance may or may not be sustained in future # Crisil Short Term Bond Fund Index ##1 year T-Bill
PeriodScheme
Returns ^BenchmarkReturns #
AlternateBenchmarkReturns ##
Current Value ( ) of Standard Investment of 10,000` `
Benchmark#Alternate
Benchmark##Scheme^
NAV perUnit ( )`
Feb 21, 2013 (Since Inception) 10.0000 9.17% 9.20% 7.45% 13,425 13,435 12,726
Jun 30, 2015 To Jun 30, 2016 12.3771 8.46% 8.94% 7.67%
Jun 30, 2014 To Jun 30, 2015 11.3483 9.07% 9.56% 8.54%
Jun 28, 2013 To Jun 30, 2014 10.3859 9.21% 8.76% 5.89%
NA
PeriodScheme
Returns ^BenchmarkReturns #
AlternateBenchmarkReturns ##
Current Value ( ) of Standard Investment of 10,000` `
Benchmark#Alternate
Benchmark##Scheme^
NAV perUnit ( )`
Feb 21, 2013 (Since Inception) 10.0000 9.27% 9.20% 7.45% 13,464 13,435 12,726
Jun 30, 2015 To Jun 30, 2016 12.4001 8.58% 8.94% 7.67%
Jun 30, 2014 To Jun 30, 2015 11.3581 9.17% 9.56% 8.54%
Jun 28, 2013 To Jun 30, 2014 10.3877 9.29% 8.76% 5.89%
NA
RegularPlan 12.8370June30,2016GrowthOption(NAVason perUnit):`Scheme Managed: IDFC Fixed Term Plan Series 23
Greater than 1 year returns are Compounded Annualised Returns. ^ Past performance may or may not be sustained in future # Crisil Short Term Bond Fund Index ##1 year T-Bill
Option: Direct Plan Growth Option (NAV as on per Unit):`June 30 12.9141, 2016
Greater than 1 year returns are Compounded Annualised Returns. ^ Past performance may or may not be sustained in future # Crisil Short Term Bond Fund Index ##1 year T-Bill
PeriodScheme
Returns ^BenchmarkReturns #
AlternateBenchmarkReturns ##
Current Value ( ) of Standard Investment of 10,000` `
Benchmark#Alternate
Benchmark##Scheme^
NAV perUnit ( )`
Jul 26, 2013 (Since Inception) 10.0000 8.89% 9.70% 8.22% 12,837 13,119 12,607
Jun 30, 2015 To Jun 30, 2016 11.9281 7.62% 8.94% 7.67% NA
Jun 30, 2014 To Jun 30, 2015 10.9962 8.47% 9.56% 8.54%
PeriodScheme
Returns ^BenchmarkReturns #
AlternateBenchmarkReturns ##
Current Value ( ) of Standard Investment of 10,000` `
Benchmark#Alternate
Benchmark##Scheme^
NAV perUnit ( )`
Jul 26, 2013 (Since Inception) 10.0000 9.12% 9.70% 8.22% 12,914 13,119 12,607
Jun 30, 2015 To Jun 30, 2016 11.9861 7.74% 8.94% 7.67% NA
Jun 30, 2014 To Jun 30, 2015 11.0218 8.75% 9.56% 8.54%
RegularPlan 12.9278June30,2016GrowthOption(NAVason perUnit):`Scheme Managed: IDFC Fixed Term Plan Series 24
Greater than 1 year returns are Compounded Annualised Returns. ^ Past performance may or may not be sustained in future # Crisil Short Term Bond Fund Index ##1 year T-Bill
Option: Direct Plan Growth Option (NAV as on per Unit):` 12.9650June 30, 2016
Greater than 1 year returns are Compounded Annualised Returns. ^ Past performance may or may not be sustained in future # Crisil Short Term Bond Fund Index ##1 year T-Bill
PeriodScheme
Returns ^BenchmarkReturns #
AlternateBenchmarkReturns ##
Current Value ( ) of Standard Investment of 10,000` `
Benchmark#Alternate
Benchmark##Scheme^
NAV perUnit ( )`
Aug 01, 2013 (Since Inception) 10.0000 9.21% 9.69% 8.18% 12,928 13,096 12,576
Jun 30, 2015 To Jun 30, 2016 11.9362 8.31% 8.94% 7.67% NA
Jun 30, 2014 To Jun 30, 2015 10.9079 9.43% 9.56% 8.54%
PeriodScheme
Returns ^BenchmarkReturns #
AlternateBenchmarkReturns ##
Current Value ( ) of Standard Investment of 10,000` `
Benchmark#Alternate
Benchmark##Scheme^
NAV perUnit ( )`
Aug 01, 2013 (Since Inception) 10.0000 9.32% 9.69% 8.18% 12,965 13,096 12,576
Jun 30, 2015 To Jun 30, 2016 11.9556 8.44% 8.94% 7.67% NA
Jun 30, 2014 To Jun 30, 2015 10.9129 9.55% 9.56% 8.54%
RegularPlan 12.9371June30,2016GrowthOption(NAVason perUnit):`Scheme Managed: IDFC Fixed Term Plan Series 25
Greater than 1 year returns are Compounded Annualised Returns. ^ Past performance may or may not be sustained in future # Crisil Short Term Bond Fund Index ##1 year T-Bill
Option: Direct Plan Growth Option (NAV as on per Unit):`June 30 12.9741, 2016
Greater than 1 year returns are Compounded Annualised Returns. ^ Past performance may or may not be sustained in future # Crisil Short Term Bond Fund Index ##1 year T-Bill
PeriodScheme
Returns ^BenchmarkReturns #
AlternateBenchmarkReturns ##
Current Value ( ) of Standard Investment of 10,000` `
Benchmark#Alternate
Benchmark##Scheme^
NAV perUnit ( )`
Aug 08, 2013 (Since Inception) 10.0000 9.30% 9.66% 8.19% 12,937 13,063 12,560
Jun 30, 2015 To Jun 30, 2016 11.9485 8.27% 8.94% 7.67% NA
Jun 30, 2014 To Jun 30, 2015 10.8904 9.72% 9.56% 8.54%
PeriodScheme
Returns ^BenchmarkReturns #
AlternateBenchmarkReturns ##
Current Value ( ) of Standard Investment of 10,000` `
Benchmark#Alternate
Benchmark##Scheme^
NAV perUnit ( )`
Aug 08, 2013 (Since Inception) 10.0000 9.41% 9.66% 8.19% 12,974 13,063 12,560
Jun 30, 2015 To Jun 30, 2016 11.9678 8.41% 8.94% 7.67% NA
Jun 30, 2014 To Jun 30, 2015 10.8953 9.84% 9.56% 8.54%
PeriodScheme
Returns ^BenchmarkReturns #
AlternateBenchmarkReturns ##
Current Value ( ) of Standard Investment of 10,000` `
Benchmark#Alternate
Benchmark##Scheme^
NAV perUnit ( )`
Aug 14, 2013 (Since Inception) 10.0000 9.30% 9.80% 8.33% 12,917 13,091 12,593
Jun 30, 2015 To Jun 30, 2016 11.9006 8.54% 8.94% 7.67% NA
Jun 30, 2014 To Jun 30, 2015 11.0032 8.16% 9.56% 8.54%
RegularPlan 12.6946June30,2016GrowthOption(NAVason perUnit):`Scheme Managed: IDFC Fixed Term Plan Series 21
Greater than 1 year returns are Compounded Annualised Returns. ^ Past performance may or may not be sustained in future # Crisil Short Term Bond Fund Index ##1 year T-Bill
Option: Direct Plan Growth Option (NAV as on per Unit):`June 30 12.7581, 2016
Greater than 1 year returns are Compounded Annualised Returns. ^ Past performance may or may not be sustained in future # Crisil Short Term Bond Fund Index ##1 year T-Bill
PeriodScheme
Returns ^BenchmarkReturns #
AlternateBenchmarkReturns ##
Current Value ( ) of Standard Investment of 10,000` `
Benchmark#Alternate
Benchmark##Scheme^
NAV perUnit ( )`
Jul 12, 2013 (Since Inception) 10.0000 8.37% 9.10% 7.39% 12,695 12,952 12,359
Jun 30, 2015 To Jun 30, 2016 11.7516 8.02% 8.94% 7.67% NA
Jun 30, 2014 To Jun 30, 2015 10.8241 8.57% 9.56% 8.54%
PeriodScheme
Returns ^BenchmarkReturns #
AlternateBenchmarkReturns ##
Current Value ( ) of Standard Investment of 10,000` `
Benchmark#Alternate
Benchmark##Scheme^
NAV perUnit ( )`
Jul 12, 2013 (Since Inception) 10.0000 8.55% 9.10% 7.39% 12,758 12,952 12,359
Jun 30, 2015 To Jun 30, 2016 11.7982 8.14% 8.94% 7.67% NA
Jun 30, 2014 To Jun 30, 2015 10.8451 8.79% 9.56% 8.54%

Fund Manager Details
RegularPlan 13.1091June30,2016GrowthOption(NAVason perUnit):`Scheme Managed: IDFC Fixed Term Plan Series 28
Greater than 1 year returns are Compounded Annualised Returns. ^ Past performance may or may not be sustained in future # Crisil Short Term Bond Fund Index ##1 year T-Bill
Option: Direct Plan Growth Option (NAV as on per Unit):`June 30, 2016 13.2320
RegularPlan 12.8314June30,2016GrowthOption(NAVason perUnit):`Scheme Managed: IDFC Fixed Term Plan Series 29
Greater than 1 year returns are Compounded Annualised Returns. ^ Past performance may or may not be sustained in future # Crisil Short Term Bond Fund Index ##1 year T-Bill
Option: Direct Plan Growth Option (NAV as on per Unit):`June 30, 2016 12.9132
Greater than 1 year returns are Compounded Annualised Returns. ^ Past performance may or may not be sustained in future # Crisil Short Term Bond Fund Index ##1 year T-Bill
RegularPlan 12.9489June30,2016GrowthOption(NAVason perUnit):`Scheme Managed: IDFC Fixed Term Plan Series 31
Greater than 1 year returns are Compounded Annualised Returns. ^ Past performance may or may not be sustained in future # Crisil Short Term Bond Fund Index ##1 year T-Bill
Option: Direct Plan Growth Option (NAV as on per Unit):`June 30, 2016 12.9789
RegularPlan 12.8350June30,2016GrowthOption(NAVason perUnit):`Scheme Managed: IDFC Fixed Term Plan Series 32
Greater than 1 year returns are Compounded Annualised Returns. ^ Past performance may or may not be sustained in future # Crisil Short Term Bond Fund Index ##1 year T-Bill
Option: Direct Plan Growth Option (NAV as on per Unit):` 12.8908June 30, 2016
RegularPlan 12.8548June30,2016GrowthOption(NAVason perUnit):`Scheme Managed: IDFC Fixed Term Plan Series 33
Greater than 1 year returns are Compounded Annualised Returns. ^ Past performance may or may not be sustained in future # Crisil Short Term Bond Fund Index ##1 year T-Bill
Option: Direct Plan Growth Option (NAV as on per Unit):`June 30, 2016 12.9107
RegularPlan 12.8364June30,2016GrowthOption(NAVason perUnit):`Scheme Managed: IDFC Fixed Term Plan Series 34
Greater than 1 year returns are Compounded Annualised Returns. ^ Past performance may or may not be sustained in future # Crisil Short Term Bond Fund Index ##1 year T-Bill
Option: Direct Plan Growth Option (NAV as on per Unit):`June 30, 2016 12.8918
46
Greater than 1 year returns are Compounded Annualised Returns. ^ Past performance may or may not be sustained in future # Crisil Short Term Bond Fund Index ##1 year T-Bill
Greater than 1 year returns are Compounded Annualised Returns. ^ Past performance may or may not be sustained in future # Crisil Short Term Bond Fund Index ##1 year T-Bill
Greater than 1 year returns are Compounded Annualised Returns. ^ Past performance may or may not be sustained in future # Crisil Short Term Bond Fund Index ##1 year T-Bill
Greater than 1 year returns are Compounded Annualised Returns. ^ Past performance may or may not be sustained in future # Crisil Short Term Bond Fund Index ##1 year T-Bill
Greater than 1 year returns are Compounded Annualised Returns. ^ Past performance may or may not be sustained in future # Crisil Short Term Bond Fund Index ##1 year T-Bill
RegularPlan 12.9089June30,2016GrowthOption(NAVason perUnit):`Scheme Managed: IDFC Fixed Term Plan Series 27
Greater than 1 year returns are Compounded Annualised Returns. ^ Past performance may or may not be sustained in future # Crisil Short Term Bond Fund Index ##1 year T-Bill
Option: Direct Plan Growth Option (NAV as on per Unit):`June 30, 2016 12.9655
Greater than 1 year returns are Compounded Annualised Returns. ^ Past performance may or may not be sustained in future # Crisil Short Term Bond Fund Index ##1 year T-Bill
PeriodScheme
Returns ^BenchmarkReturns #
AlternateBenchmarkReturns ##
Current Value ( ) of Standard Investment of 10,000` `
Benchmark#Alternate
Benchmark##Scheme^
NAV perUnit ( )`
Aug 21, 2013 (Since Inception) 10.0000 9.34% 9.84% 8.24% 12,909 13,080 12,542
Jun 30, 2015 To Jun 30, 2016 11.9199 8.30% 8.94% 7.67%
Jun 30, 2014 To Jun 30, 2015 10.8848 9.51% 9.56% 8.54%
PeriodScheme
Returns ^BenchmarkReturns #
AlternateBenchmarkReturns ##
Current Value ( ) of Standard Investment of 10,000` `
Benchmark#Alternate
Benchmark##Scheme^
NAV perUnit ( )`
Aug 29, 2013 (Since Inception) 10.0000 9.18% 10.01% 8.32% 12,831 13,111 12,545
Jun 30, 2015 To Jun 30, 2016 11.8398 8.38% 8.94% 7.67% NA
Jun 30, 2014 To Jun 30, 2015 10.9810 7.82% 9.56% 8.54%
PeriodScheme
Returns ^BenchmarkReturns #
AlternateBenchmarkReturns ##
Current Value ( ) of Standard Investment of 10,000` `
Benchmark#Alternate
Benchmark##Scheme^
NAV perUnit ( )`
Aug 30, 2013 (Since Inception) 10.0000 10.02% 9.96% 8.20% 13,109 13,088 12,503
Jun 30, 2015 To Jun 30, 2016 12.1305 8.07% 8.94% 7.67%
Jun 30, 2014 To Jun 30, 2015 11.0860 9.42% 9.56% 8.54% NA
NA
PeriodScheme
Returns ^BenchmarkReturns #
AlternateBenchmarkReturns ##
Current Value ( ) of Standard Investment of 10,000` `
Benchmark#Alternate
Benchmark##Scheme^
NAV perUnit ( )`
Aug 29, 2013 (Since Inception) 10.0000 9.53% 10.01% 8.32% 12,949 13,111 12,545
Jun 30, 2015 To Jun 30, 2016 11.9518 8.34% 8.94% 7.67% NA
Jun 30, 2014 To Jun 30, 2015 10.9128 9.52% 9.56% 8.54%
PeriodScheme
Returns ^BenchmarkReturns #
AlternateBenchmarkReturns ##
Current Value ( ) of Standard Investment of 10,000` `
Benchmark#Alternate
Benchmark##Scheme^
NAV perUnit ( )`
Sep 05, 2013 (Since Inception) 10.0000 9.26% 9.67% 8.20% 12,835 12,974 12,487
Jun 30, 2015 To Jun 30, 2016 11.8336 8.46% 8.94% 7.67% NA
Jun 30, 2014 To Jun 30, 2015 10.8097 9.47% 9.56% 8.54%
PeriodScheme
Returns ^BenchmarkReturns #
AlternateBenchmarkReturns ##
Current Value ( ) of Standard Investment of 10,000` `
Benchmark#Alternate
Benchmark##Scheme^
NAV perUnit ( )`
Sep 13, 2013 (Since Inception) 10.0000 9.39% 9.68% 8.20% 12,855 12,950 12,465
Jun 30, 2015 To Jun 30, 2016 11.8505 8.47% 8.94% 7.67% NA
Jun 30, 2014 To Jun 30, 2015 10.8162 9.56% 9.56% 8.54%
PeriodScheme
Returns ^BenchmarkReturns #
AlternateBenchmarkReturns ##
Current Value ( ) of Standard Investment of 10,000` `
Benchmark#Alternate
Benchmark##Scheme^
NAV perUnit ( )`
Sep 17, 2013 (Since Inception) 10.0000 9.38% 9.68% 8.19% 12,836 12,936 12,452
Jun 30, 2015 To Jun 30, 2016 11.8362 8.45% 8.94% 7.67%
Jun 30, 2014 To Jun 30, 2015 10.8109 9.48% 9.56% 8.54%
NA
PeriodScheme
Returns ^BenchmarkReturns #
AlternateBenchmarkReturns ##
Current Value ( ) of Standard Investment of 10,000` `
Benchmark#Alternate
Benchmark##Scheme^
NAV perUnit ( )`
Aug 21, 2013 (Since Inception) 10.0000 9.50% 9.84% 8.24% 12,966 13,080 12,542Jun 30, 2015 To Jun 30, 2016 11.9602 8.41% 8.94% 7.67%Jun 30, 2014 To Jun 30, 2015 10.9082 9.64% 9.56% 8.54% NA
PeriodScheme
Returns ^BenchmarkReturns #
AlternateBenchmarkReturns ##
Current Value ( ) of Standard Investment of 10,000` `
Benchmark#Alternate
Benchmark##Scheme^
NAV perUnit ( )`
Aug 30, 2013 (Since Inception) 10.0000 10.38% 9.96% 8.20% 13,232 13,088 12,503
Jun 30, 2015 To Jun 30, 2016 12.2041 8.42% 8.94% 7.67%
Jun 30, 2014 To Jun 30, 2015 11.1166 9.78% 9.56% 8.54% NA
PeriodScheme
Returns ^BenchmarkReturns #
AlternateBenchmarkReturns ##
Current Value ( ) of Standard Investment of 10,000` `
Benchmark#Alternate
Benchmark##Scheme^
NAV perUnit ( )`
Aug 29, 2013 (Since Inception) 10.0000 9.62% 10.01% 8.32% 12,979 13,111 12,545
Jun 30, 2015 To Jun 30, 2016 11.9675 8.45% 8.94% 7.67% NA
Jun 30, 2014 To Jun 30, 2015 10.9173 9.62% 9.56% 8.54%
PeriodScheme
Returns ^BenchmarkReturns #
AlternateBenchmarkReturns ##
Current Value ( ) of Standard Investment of 10,000` `
Benchmark#Alternate
Benchmark##Scheme^
NAV perUnit ( )`
Sep 05, 2013 (Since Inception) 10.0000 9.43% 9.67% 8.20% 12,891 12,974 12,487
Jun 30, 2015 To Jun 30, 2016 11.8732 8.57% 8.94% 7.67% NA
Jun 30, 2014 To Jun 30, 2015 10.8318 9.61% 9.56% 8.54%
PeriodScheme
Returns ^BenchmarkReturns #
AlternateBenchmarkReturns ##
Current Value ( ) of Standard Investment of 10,000` `
Benchmark#Alternate
Benchmark##Scheme^
NAV perUnit ( )`
Sep 13, 2013 (Since Inception) 10.0000 9.56% 9.68% 8.20% 12,911 12,950 12,465
Jun 30, 2015 To Jun 30, 2016 11.8901 8.58% 8.94% 7.67% NA
Jun 30, 2014 To Jun 30, 2015 10.8378 9.71% 9.56% 8.54%
PeriodScheme
Returns ^BenchmarkReturns #
AlternateBenchmarkReturns ##
Current Value ( ) of Standard Investment of 10,000` `
Benchmark#Alternate
Benchmark##Scheme^
NAV perUnit ( )`
Sep 17, 2013 (Since Inception) 10.0000 9.54% 9.68% 8.19% 12,892 12,936 12,452
Jun 30, 2015 To Jun 30, 2016 11.8754 8.56% 8.94% 7.67%
Jun 30, 2014 To Jun 30, 2015 10.8321 9.63% 9.56% 8.54%
NA
PeriodScheme
Returns ^BenchmarkReturns #
AlternateBenchmarkReturns ##
Current Value ( ) of Standard Investment of 10,000` `
Benchmark#Alternate
Benchmark##Scheme^
NAV perUnit ( )`
Aug 29, 2013 (Since Inception) 10.0000 9.43% 10.01% 8.32% 12,913 13,111 12,545
Jun 30, 2015 To Jun 30, 2016 11.9034 8.48% 8.94% 7.67% NA
Jun 30, 2014 To Jun 30, 2015 11.0086 8.13% 9.56% 8.54%NA

Fund Manager Details
47
RegularPlan 12.5956June30,2016GrowthOption(NAVason perUnit):`Scheme Managed: IDFC Fixed Term Plan Series 39
Greater than 1 year returns are Compounded Annualised Returns. ^ Past performance may or may not be sustained in future # Crisil Short Term Bond Fund Index ##1 year T-Bill
Option: Direct Plan Growth Option (NAV as on per Unit):`June 30, 2016 12.6924
RegularPlan June30,2016GrowthOption(NAVason perUnit):` 12.6662Scheme Managed: IDFC Fixed Term Plan Series 40
Greater than 1 year returns are Compounded Annualised Returns. ^ Past performance may or may not be sustained in future # Crisil Short Term Bond Fund Index ##1 year T-Bill
Option: Direct Plan Growth Option (NAV as on per Unit):`June 30, 2016 12.7569
RegularPlan 12.4892June30,2016GrowthOption(NAVason perUnit):`Scheme Managed: IDFC Fixed Term Plan Series 41
Greater than 1 year returns are Compounded Annualised Returns. ^ Past performance may or may not be sustained in future # Crisil Short Term Bond Fund Index ##1 year T-Bill
Option: Direct Plan Growth Option (NAV as on per Unit):`June 30, 2016 12.5652
RegularPlan 12.5735June30,2016GrowthOption(NAVason perUnit):`Scheme Managed: IDFC Fixed Term Plan Series 42
Greater than 1 year returns are Compounded Annualised Returns. ^ Past performance may or may not be sustained in future # Crisil Short Term Bond Fund Index ##1 year T-Bill
Option: Direct Plan Growth Option (NAV as on per Unit):`June 30, 2016 12.6635
RegularPlan 12.5081June30,2016GrowthOption(NAVason perUnit):`Scheme Managed: IDFC Fixed Term Plan Series 44
Greater than 1 year returns are Compounded Annualised Returns. ^ Past performance may or may not be sustained in future # Crisil Short Term Bond Fund Index ##1 year T-Bill
Option: Direct Plan Growth Option (NAV as on per Unit):`June 30, 2016 12.5407
RegularPlan 12.4219June30,2016GrowthOption(NAVason perUnit):`Scheme Managed: IDFC Fixed Term Plan Series 49
Greater than 1 year returns are Compounded Annualised Returns. ^ Past performance may or may not be sustained in future # Crisil Short Term Bond Fund Index ##1 year T-Bill
Option: Direct Plan Growth Option (NAV as on per Unit):`June 30, 2016 12.4680
Greater than 1 year returns are Compounded Annualised Returns. ^ Past performance may or may not be sustained in future # Crisil Short Term Bond Fund Index ##1 year T-Bill
Greater than 1 year returns are Compounded Annualised Returns. ^ Past performance may or may not be sustained in future # Crisil Short Term Bond Fund Index ##1 year T-Bill
Greater than 1 year returns are Compounded Annualised Returns. ^ Past performance may or may not be sustained in future # Crisil Short Term Bond Fund Index ##1 year T-Bill
Greater than 1 year returns are Compounded Annualised Returns. ^ Past performance may or may not be sustained in future # Crisil Short Term Bond Fund Index ##1 year T-Bill
Greater than 1 year returns are Compounded Annualised Returns. ^ Past performance may or may not be sustained in future # Crisil Short Term Bond Fund Index ##1 year T-Bill
Greater than 1 year returns are Compounded Annualised Returns. ^ Past performance may or may not be sustained in future # Crisil Short Term Bond Fund Index ##1 year T-Bill
RegularPlan 12.7075June30,2016GrowthOption(NAVason perUnit):`Scheme Managed: IDFC Fixed Term Plan Series 35
Greater than 1 year returns are Compounded Annualised Returns. ^ Past performance may or may not be sustained in future # Crisil Short Term Bond Fund Index ##1 year T-Bill
Option: Direct Plan Growth Option (NAV as on per Unit):`June 30, 2016 12.8191
Greater than 1 year returns are Compounded Annualised Returns. ^ Past performance may or may not be sustained in future # Crisil Short Term Bond Fund Index ##1 year T-Bill
PeriodScheme
Returns ^BenchmarkReturns #
AlternateBenchmarkReturns ##
Current Value ( ) of Standard Investment of 10,000` `
Benchmark#Alternate
Benchmark##Scheme^
NAV perUnit ( )`
Sep 24, 2013 (Since Inception) 10.0000 9.05% 9.61% 8.23% 12,708 12,892 12,448
Jun 30, 2015 To Jun 30, 2016 11.7301 8.33% 8.94% 7.67%
Jun 30, 2014 To Jun 30, 2015 10.7140 9.48% 9.56% 8.54%
NA
PeriodScheme
Returns ^BenchmarkReturns #
AlternateBenchmarkReturns ##
Current Value ( ) of Standard Investment of 10,000` `
Benchmark#Alternate
Benchmark##Scheme^
NAV perUnit ( )`
Oct 04, 2013 (Since Inception) 10.0000 9.01% 9.46% 8.10% 12,666 12,811 12,380
Jun 30, 2015 To Jun 30, 2016 11.6887 8.36% 8.94% 7.67%
Jun 30, 2014 To Jun 30, 2015 10.6808 9.44% 9.56% 8.54%
NA
PeriodScheme
Returns ^BenchmarkReturns #
AlternateBenchmarkReturns ##
Current Value ( ) of Standard Investment of 10,000` `
Benchmark#Alternate
Benchmark##Scheme^
NAV perUnit ( )`
Sep 27, 2013 (Since Inception) 10.0000 8.72% 9.55% 8.22% 12,596 12,861 12,434
Jun 30, 2015 To Jun 30, 2016 11.6268 8.33% 8.94% 7.67%
Jun 30, 2014 To Jun 30, 2015 10.7504 8.15% 9.56% 8.54%NA
PeriodScheme
Returns ^BenchmarkReturns #
AlternateBenchmarkReturns ##
Current Value ( ) of Standard Investment of 10,000` `
Benchmark#Alternate
Benchmark##Scheme^
NAV perUnit ( )`
Oct 11, 2013 (Since Inception) 10.0000 8.51% 9.36% 8.02% 12,489 12,755 12,337
Jun 30, 2015 To Jun 30, 2016 11.5262 8.35% 8.94% 7.67%
Jun 30, 2014 To Jun 30, 2015 10.6618 8.11% 9.56% 8.54%
NA
PeriodScheme
Returns ^BenchmarkReturns #
AlternateBenchmarkReturns ##
Current Value ( ) of Standard Investment of 10,000` `
Benchmark#Alternate
Benchmark##Scheme^
NAV perUnit ( )`
Oct 09, 2013 (Since Inception) 10.0000 8.76% 9.35% 8.01% 12,574 12,758 12,338
Jun 30, 2015 To Jun 30, 2016 11.6037 8.36% 8.94% 7.67%
Jun 30, 2014 To Jun 30, 2015 10.6213 9.25% 9.56% 8.54%
NA
PeriodScheme
Returns ^BenchmarkReturns #
AlternateBenchmarkReturns ##
Current Value ( ) of Standard Investment of 10,000` `
Benchmark#Alternate
Benchmark##Scheme^
NAV perUnit ( )`
Sep 24, 2013 (Since Inception) 10.0000 9.39% 9.61% 8.23% 12,819 12,892 12,448
Jun 30, 2015 To Jun 30, 2016 11.8082 8.56% 8.94% 7.67%
Jun 30, 2014 To Jun 30, 2015 10.7552 9.79% 9.56% 8.54%
NA
PeriodScheme
Returns ^BenchmarkReturns #
AlternateBenchmarkReturns ##
Current Value ( ) of Standard Investment of 10,000` `
Benchmark#Alternate
Benchmark##Scheme^
NAV perUnit ( )`
Oct 04, 2013 (Since Inception) 10.0000 9.29% 9.46% 8.10% 12,757 12,811 12,380
Jun 30, 2015 To Jun 30, 2016 11.7582 8.49% 8.94% 7.67%
Jun 30, 2014 To Jun 30, 2015 10.7203 9.68% 9.56% 8.54%
NA
PeriodScheme
Returns ^BenchmarkReturns #
AlternateBenchmarkReturns ##
Current Value ( ) of Standard Investment of 10,000` `
Benchmark#Alternate
Benchmark##Scheme^
NAV perUnit ( )`
Sep 27, 2013 (Since Inception) 10.0000 9.03% 9.55% 8.22% 12,692 12,861 12,434
Jun 30, 2015 To Jun 30, 2016 11.7045 8.44% 8.94% 7.67%
Jun 30, 2014 To Jun 30, 2015 10.7830 8.55% 9.56% 8.54%NA
PeriodScheme
Returns ^BenchmarkReturns #
AlternateBenchmarkReturns ##
Current Value ( ) of Standard Investment of 10,000` `
Benchmark#Alternate
Benchmark##Scheme^
NAV perUnit ( )`
Oct 11, 2013 (Since Inception) 10.0000 8.76% 9.36% 8.02% 12,565 12,755 12,337
Jun 30, 2015 To Jun 30, 2016 11.5847 8.46% 8.94% 7.67%
Jun 30, 2014 To Jun 30, 2015 10.6849 8.42% 9.56% 8.54%
NA
PeriodScheme
Returns ^BenchmarkReturns #
AlternateBenchmarkReturns ##
Current Value ( ) of Standard Investment of 10,000` `
Benchmark#Alternate
Benchmark##Scheme^
NAV perUnit ( )`
Oct 09, 2013 (Since Inception) 10.0000 9.05% 9.35% 8.01% 12,664 12,758 12,338
Jun 30, 2015 To Jun 30, 2016 11.6726 8.49% 8.94% 7.67%
Jun 30, 2014 To Jun 30, 2015 10.6599 9.50% 9.56% 8.54%
NA
PeriodScheme
Returns ^BenchmarkReturns #
AlternateBenchmarkReturns ##
Current Value ( ) of Standard Investment of 10,000` `
Benchmark#Alternate
Benchmark##Scheme^
NAV perUnit ( )`
Oct 23, 2013 (Since Inception) 10.0000 8.68% 9.40% 8.06% 12,508 12,730 12,317
Jun 30, 2015 To Jun 30, 2016 11.5527 8.27% 8.94% 7.67%
Jun 30, 2014 To Jun 30, 2015 10.6202 8.78% 9.56% 8.54%
NA
PeriodScheme
Returns ^BenchmarkReturns #
AlternateBenchmarkReturns ##
Current Value ( ) of Standard Investment of 10,000` `
Benchmark#Alternate
Benchmark##Scheme^
NAV perUnit ( )`
Oct 23, 2013 (Since Inception) 10.0000 8.79% 9.40% 8.06% 12,541 12,730 12,317
Jun 30, 2015 To Jun 30, 2016 11.5683 8.41% 8.94% 7.67%
Jun 30, 2014 To Jun 30, 2015 10.6238 8.89% 9.56% 8.54%
NA
PeriodScheme
Returns ^BenchmarkReturns #
AlternateBenchmarkReturns ##
Current Value ( ) of Standard Investment of 10,000` `
Benchmark#Alternate
Benchmark##Scheme^
NAV perUnit ( )`
Nov 28, 2013 (Since Inception) 10.0000 8.74% 9.47% 8.15% 12,422 12,639 12,247
Jun 30, 2015 To Jun 30, 2016 11.4407 8.58% 8.94% 7.67%
Jun 30, 2014 To Jun 30, 2015 10.5472 8.47% 9.56% 8.54%
NA
PeriodScheme
Returns ^BenchmarkReturns #
AlternateBenchmarkReturns ##
Current Value ( ) of Standard Investment of 10,000` `
Benchmark#Alternate
Benchmark##Scheme^
NAV perUnit ( )`
Nov 28, 2013 (Since Inception) 10.0000 8.89% 9.47% 8.15% 12,468 12,639 12,247
Jun 30, 2015 To Jun 30, 2016 11.4711 8.69% 8.94% 7.67%
Jun 30, 2014 To Jun 30, 2015 10.5596 8.63% 9.56% 8.54%
NA
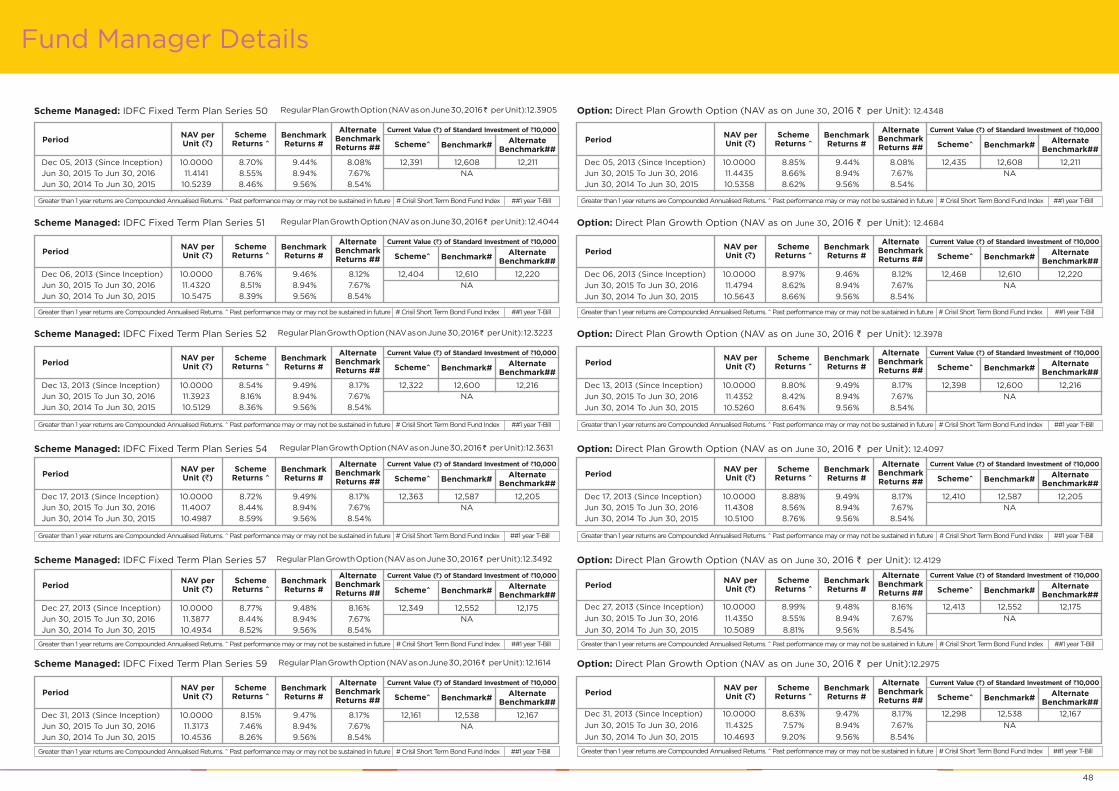
Fund Manager Details
RegularPlan ,2016June30GrowthOption(NAVason perUnit):12.3905`Scheme Managed: IDFC Fixed Term Plan Series 50 Option: Direct Plan Growth Option (NAV as on per Unit):`June 30, 2016 12.4348
Greater than 1 year returns are Compounded Annualised Returns. ^ Past performance may or may not be sustained in future # Crisil Short Term Bond Fund Index ##1 year T-Bill Greater than 1 year returns are Compounded Annualised Returns. ^ Past performance may or may not be sustained in future # Crisil Short Term Bond Fund Index ##1 year T-Bill
RegularPlan ,2016 12.4044June30GrowthOption(NAVason perUnit):`Scheme Managed: IDFC Fixed Term Plan Series 51 Option: Direct Plan Growth Option (NAV as on per Unit):`June 30, 2016 12.4684
RegularPlan ,2016 12.3223June30GrowthOption(NAVason perUnit):`Scheme Managed: IDFC Fixed Term Plan Series 52 Option: Direct Plan Growth Option (NAV as on per Unit):`June 30, 2016 12.3978
RegularPlan ,2016June30GrowthOption(NAVason perUnit):12.3631`Scheme Managed: IDFC Fixed Term Plan Series 54 Option: Direct Plan Growth Option (NAV as on per Unit):`June 30, 2016 12.4097
RegularPlan ,2016June30GrowthOption(NAVason perUnit):12.3492`Scheme Managed: IDFC Fixed Term Plan Series 57 Option: Direct Plan Growth Option (NAV as on per Unit):`June 30, 2016 12.4129
RegularPlan ,2016 12.1614June30GrowthOption(NAVason perUnit):`Scheme Managed: IDFC Fixed Term Plan Series 59
Greater than 1 year returns are Compounded Annualised Returns. ^ Past performance may or may not be sustained in future # Crisil Short Term Bond Fund Index ##1 year T-Bill
Option: Direct Plan Growth Option (NAV as on per Unit):` 12.2975June 30, 2016
48
Greater than 1 year returns are Compounded Annualised Returns. ^ Past performance may or may not be sustained in future # Crisil Short Term Bond Fund Index ##1 year T-Bill Greater than 1 year returns are Compounded Annualised Returns. ^ Past performance may or may not be sustained in future # Crisil Short Term Bond Fund Index ##1 year T-Bill
Greater than 1 year returns are Compounded Annualised Returns. ^ Past performance may or may not be sustained in future # Crisil Short Term Bond Fund Index ##1 year T-BillGreater than 1 year returns are Compounded Annualised Returns. ^ Past performance may or may not be sustained in future # Crisil Short Term Bond Fund Index ##1 year T-Bill
Greater than 1 year returns are Compounded Annualised Returns. ^ Past performance may or may not be sustained in future # Crisil Short Term Bond Fund Index ##1 year T-Bill Greater than 1 year returns are Compounded Annualised Returns. ^ Past performance may or may not be sustained in future # Crisil Short Term Bond Fund Index ##1 year T-Bill
Greater than 1 year returns are Compounded Annualised Returns. ^ Past performance may or may not be sustained in future # Crisil Short Term Bond Fund Index ##1 year T-Bill Greater than 1 year returns are Compounded Annualised Returns. ^ Past performance may or may not be sustained in future # Crisil Short Term Bond Fund Index ##1 year T-Bill
Greater than 1 year returns are Compounded Annualised Returns. ^ Past performance may or may not be sustained in future # Crisil Short Term Bond Fund Index ##1 year T-Bill
PeriodScheme
Returns ^BenchmarkReturns #
AlternateBenchmarkReturns ##
Current Value ( ) of Standard Investment of 10,000` `
Benchmark#Alternate
Benchmark##Scheme^
NAV perUnit ( )`
Dec 06, 2013 (Since Inception) 10.0000 8.76% 9.46% 8.12% 12,404 12,610 12,220
Jun 30, 2015 To Jun 30, 2016 11.4320 8.51% 8.94% 7.67%
Jun 30, 2014 To Jun 30, 2015 10.5475 8.39% 9.56% 8.54%
NA
PeriodScheme
Returns ^BenchmarkReturns #
AlternateBenchmarkReturns ##
Current Value ( ) of Standard Investment of 10,000` `
Benchmark#Alternate
Benchmark##Scheme^
NAV perUnit ( )`
Dec 06, 2013 (Since Inception) 10.0000 8.97% 9.46% 8.12% 12,468 12,610 12,220
Jun 30, 2015 To Jun 30, 2016 11.4794 8.62% 8.94% 7.67%
Jun 30, 2014 To Jun 30, 2015 10.5643 8.66% 9.56% 8.54%
NA
PeriodScheme
Returns ^BenchmarkReturns #
AlternateBenchmarkReturns ##
Current Value ( ) of Standard Investment of 10,000` `
Benchmark#Alternate
Benchmark##Scheme^
NAV perUnit ( )`
Dec 13, 2013 (Since Inception) 10.0000 8.54% 9.49% 8.17% 12,322 12,600 12,216
Jun 30, 2015 To Jun 30, 2016 11.3923 8.16% 8.94% 7.67%
Jun 30, 2014 To Jun 30, 2015 10.5129 8.36% 9.56% 8.54%
NA
PeriodScheme
Returns ^BenchmarkReturns #
AlternateBenchmarkReturns ##
Current Value ( ) of Standard Investment of 10,000` `
Benchmark#Alternate
Benchmark##Scheme^
NAV perUnit ( )`
Dec 13, 2013 (Since Inception) 10.0000 8.80% 9.49% 8.17% 12,398 12,600 12,216
Jun 30, 2015 To Jun 30, 2016 11.4352 8.42% 8.94% 7.67%
Jun 30, 2014 To Jun 30, 2015 10.5260 8.64% 9.56% 8.54%
NA
PeriodScheme
Returns ^BenchmarkReturns #
AlternateBenchmarkReturns ##
Current Value ( ) of Standard Investment of 10,000` `
Benchmark#Alternate
Benchmark##Scheme^
NAV perUnit ( )`
Dec 17, 2013 (Since Inception) 10.0000 8.72% 9.49% 8.17% 12,363 12,587 12,205
Jun 30, 2015 To Jun 30, 2016 11.4007 8.44% 8.94% 7.67%
Jun 30, 2014 To Jun 30, 2015 10.4987 8.59% 9.56% 8.54%
NA
PeriodScheme
Returns ^BenchmarkReturns #
AlternateBenchmarkReturns ##
Current Value ( ) of Standard Investment of 10,000` `
Benchmark#Alternate
Benchmark##Scheme^
NAV perUnit ( )`
Dec 17, 2013 (Since Inception) 10.0000 8.88% 9.49% 8.17% 12,410 12,587 12,205
Jun 30, 2015 To Jun 30, 2016 11.4308 8.56% 8.94% 7.67%
Jun 30, 2014 To Jun 30, 2015 10.5100 8.76% 9.56% 8.54%
NA
PeriodScheme
Returns ^BenchmarkReturns #
AlternateBenchmarkReturns ##
Current Value ( ) of Standard Investment of 10,000` `
Benchmark#Alternate
Benchmark##Scheme^
NAV perUnit ( )`
Dec 27, 2013 (Since Inception) 10.0000 8.77% 9.48% 8.16% 12,349 12,552 12,175
Jun 30, 2015 To Jun 30, 2016 11.3877 8.44% 8.94% 7.67%
Jun 30, 2014 To Jun 30, 2015 10.4934 8.52% 9.56% 8.54%
NA
PeriodScheme
Returns ^BenchmarkReturns #
AlternateBenchmarkReturns ##
Current Value ( ) of Standard Investment of 10,000` `
Benchmark#Alternate
Benchmark##Scheme^
NAV perUnit ( )`
Dec 27, 2013 (Since Inception) 10.0000 8.99% 9.48% 8.16% 12,413 12,552 12,175
Jun 30, 2015 To Jun 30, 2016 11.4350 8.55% 8.94% 7.67%
Jun 30, 2014 To Jun 30, 2015 10.5089 8.81% 9.56% 8.54%
NA
PeriodScheme
Returns ^BenchmarkReturns #
AlternateBenchmarkReturns ##
Current Value ( ) of Standard Investment of 10,000` `
Benchmark#Alternate
Benchmark##Scheme^
NAV perUnit ( )`
Dec 31, 2013 (Since Inception) 10.0000 8.15% 9.47% 8.17% 12,161 12,538 12,167
Jun 30, 2015 To Jun 30, 2016 11.3173 7.46% 8.94% 7.67%
Jun 30, 2014 To Jun 30, 2015 10.4536 8.26% 9.56% 8.54%
NA
PeriodScheme
Returns ^BenchmarkReturns #
AlternateBenchmarkReturns ##
Current Value ( ) of Standard Investment of 10,000` `
Benchmark#Alternate
Benchmark##Scheme^
NAV perUnit ( )`
Dec 31, 2013 (Since Inception) 10.0000 8.63% 9.47% 8.17% 12,298 12,538 12,167
Jun 30, 2015 To Jun 30, 2016 11.4325 7.57% 8.94% 7.67%
Jun 30, 2014 To Jun 30, 2015 10.4693 9.20% 9.56% 8.54%
NA
PeriodScheme
Returns ^BenchmarkReturns #
AlternateBenchmarkReturns ##
Current Value ( ) of Standard Investment of 10,000` `
Benchmark#Alternate
Benchmark##Scheme^
NAV perUnit ( )`
Dec 05, 2013 (Since Inception) 10.0000 8.70% 9.44% 8.08% 12,391 12,608 12,211
Jun 30, 2015 To Jun 30, 2016 11.4141 8.55% 8.94% 7.67%
Jun 30, 2014 To Jun 30, 2015 10.5239 8.46% 9.56% 8.54%
NA
PeriodScheme
Returns ^BenchmarkReturns #
AlternateBenchmarkReturns ##
Current Value ( ) of Standard Investment of 10,000` `
Benchmark#Alternate
Benchmark##Scheme^
NAV perUnit ( )`
Dec 05, 2013 (Since Inception) 10.0000 8.85% 9.44% 8.08% 12,435 12,608 12,211
Jun 30, 2015 To Jun 30, 2016 11.4435 8.66% 8.94% 7.67%
Jun 30, 2014 To Jun 30, 2015 10.5358 8.62% 9.56% 8.54%
NA

Fund Manager Details
RegularPlanGrowthOption(NAVason perUnit):12.3237June30,2016`
Scheme Managed: IDFC Fixed Term Plan - Series 60 Option: Direct Plan Growth Option (NAV as on , 2016 per Unit):`June 30 12.3866
RegularPlanGrowthOption(NAVason perUnit): 12.2602June30,2016`
Scheme Managed: IDFC Fixed Term Plan - Series 62 Option: Direct Plan Growth Option (NAV as on , 2016 per Unit):June 30 ` 12.3478
RegularPlanGrowthOption(NAVason perUnit):12.2202June30,2016`
Scheme Managed: IDFC Fixed Term Plan - Series 65 Option: Direct Plan Growth Option (NAV as on , 2016 per Unit):June 30 ` 12.2682
RegularPlanGrowthOption(NAVason perUnit): 12.2158June30,2016`
Scheme Managed: IDFC Fixed Term Plan - Series 66 Option: Direct Plan Growth Option (NAV as on , 2016 per Unit):June 30 ` 12.3351
RegularPlanGrowthOption(NAVason perUnit):12.1819June30,2016`
Scheme Managed: IDFC Fixed Term Plan - Series 67 Option: Direct Plan Growth Option (NAV as on , 2016 per Unit):June 30 ` 12.2544
49
RegularPlanGrowthOption(NAVason perUnit):12.2323June30,2016`
Scheme Managed: IDFC Fixed Term Plan - Series 69 Option: Direct Plan Growth Option (NAV as on , 2016 per Unit):June 30 ` 12.2724
Greater than 1 year returns are Compounded Annualised Returns. ^ Past performance may or may not be sustained in future # Crisil Short Term Bond Fund Index ##1 year T-Bill Greater than 1 year returns are Compounded Annualised Returns. ^ Past performance may or may not be sustained in future # Crisil Short Term Bond Fund Index ##1 year T-Bill
Greater than 1 year returns are Compounded Annualised Returns. ^ Past performance may or may not be sustained in future # Crisil Short Term Bond Fund Index ##1 year T-Bill Greater than 1 year returns are Compounded Annualised Returns. ^ Past performance may or may not be sustained in future # Crisil Short Term Bond Fund Index ##1 year T-Bill
Greater than 1 year returns are Compounded Annualised Returns. ^ Past performance may or may not be sustained in future # Crisil Short Term Bond Fund Index ##1 year T-Bill Greater than 1 year returns are Compounded Annualised Returns. ^ Past performance may or may not be sustained in future # Crisil Short Term Bond Fund Index ##1 year T-Bill
Greater than 1 year returns are Compounded Annualised Returns. ^ Past performance may or may not be sustained in future # Crisil Short Term Bond Fund Index ##1 year T-Bill Greater than 1 year returns are Compounded Annualised Returns. ^ Past performance may or may not be sustained in future # Crisil Short Term Bond Fund Index ##1 year T-Bill
Greater than 1 year returns are Compounded Annualised Returns. ^ Past performance may or may not be sustained in future # Crisil Short Term Bond Fund Index ##1 year T-Bill Greater than 1 year returns are Compounded Annualised Returns. ^ Past performance may or may not be sustained in future # Crisil Short Term Bond Fund Index ##1 year T-Bill
Greater than 1 year returns are Compounded Annualised Returns. ^ Past performance may or may not be sustained in future # Crisil Composite Bond Fund Index ##10Year GOI Greater than 1 year returns are Compounded Annualised Returns. ^ Past performance may or may not be sustained in future # Crisil Composite Bond Fund Index ##10Year GOI
Current Index performance adjusted for the period from since inception to April 08, 2015 with the performance of Crisil Short TermBond fund index (Benchmark)&1 year T Bill Index (Alternate Benchmark)
Current Index performance adjusted for the period from since inception to April 08, 2015 with the performance of Crisil Short Term Bond fund index
(Benchmark)&1 year T Bill Index (Alternate Benchmark)
PeriodScheme
Returns ^BenchmarkReturns #
AlternateBenchmarkReturns ##
Current Value ( ) of Standard Investment of 10,000` `
Benchmark#Alternate
Benchmark##Scheme^
NAV perUnit ( )`
Jan 10, 2014 (Since Inception) 10.0000 8.60% 9.46% 8.11% 12,260 12,502 12,124
Jun 30, 2015 To Jun 30, 2016 11.3150 8.35% 8.94% 7.67%
Jun 30, 2014 To Jun 30, 2015 10.4454 8.33% 9.56% 8.54%
NA
PeriodScheme
Returns ^BenchmarkReturns #
AlternateBenchmarkReturns ##
Current Value ( ) of Standard Investment of 10,000` `
Benchmark#Alternate
Benchmark##Scheme^
NAV perUnit ( )`
Jan 29, 2014 (Since Inception) 10.0000 8.64% 9.49% 8.20% 12,220 12,453 12,099
Jun 30, 2015 To Jun 30, 2016 11.2742 8.39% 8.94% 7.67%
Jun 30, 2014 To Jun 30, 2015 10.4096 8.31% 9.56% 8.54%
NA
PeriodScheme
Returns ^BenchmarkReturns #
AlternateBenchmarkReturns ##
Current Value ( ) of Standard Investment of 10,000` `
Benchmark#Alternate
Benchmark##Scheme^
NAV perUnit ( )`
Jan 23, 2014 (Since Inception) 10.0000 8.56% 9.52% 8.32% 12,216 12,479 12,150
Jun 30, 2015 To Jun 30, 2016 11.2170 8.90% 10.19% 10.03% NA
Jun 30, 2014 To Jun 30, 2015 10.4164 7.69% 8.54% 6.75%
PeriodScheme
Returns ^BenchmarkReturns #
AlternateBenchmarkReturns ##
Current Value ( ) of Standard Investment of 10,000` `
Benchmark#Alternate
Benchmark##Scheme^
NAV perUnit ( )`
Feb 06, 2014 (Since Inception) 10.0000 8.58% 9.49% 8.23% 12,182 12,427 12,088
Jun 30, 2015 To Jun 30, 2016 11.2632 8.16% 8.94% 7.67%
Jun 30, 2014 To Jun 30, 2015 10.3829 8.48% 9.56% 8.54%
NA
PeriodScheme
Returns ^BenchmarkReturns #
AlternateBenchmarkReturns ##
Current Value ( ) of Standard Investment of 10,000` `
Benchmark#Alternate
Benchmark##Scheme^
NAV perUnit ( )`
Feb 18, 2014 (Since Inception) 10.0000 8.90% 9.54% 8.24% 12,232 12,403 12,060
Jun 30, 2015 To Jun 30, 2016 11.2818 8.43% 8.94% 7.67%
Jun 30, 2014 To Jun 30, 2015 10.3836 8.65% 9.56% 8.54%
NA
PeriodScheme
Returns ^BenchmarkReturns #
AlternateBenchmarkReturns ##
Current Value ( ) of Standard Investment of 10,000` `
Benchmark#Alternate
Benchmark##Scheme^
NAV perUnit ( )`
Jan 03, 2014 (Since Inception) 10.0000 8.75% 9.46% 8.13% 12,324 12,525 12,150
Jun 30, 2015 To Jun 30, 2016 11.3565 8.52% 8.94% 7.67%
Jun 30, 2014 To Jun 30, 2015 10.4698 8.47% 9.56% 8.54%
NA
PeriodScheme
Returns ^BenchmarkReturns #
AlternateBenchmarkReturns ##
Current Value ( ) of Standard Investment of 10,000` `
Benchmark#Alternate
Benchmark##Scheme^
NAV perUnit ( )`
Jan 10, 2014 (Since Inception) 10.0000 8.91% 9.46% 8.11% 12,348 12,502 12,124
Jun 30, 2015 To Jun 30, 2016 11.3845 8.46% 8.94% 7.67%
Jun 30, 2014 To Jun 30, 2015 10.4669 8.77% 9.56% 8.54%
NA
PeriodScheme
Returns ^BenchmarkReturns #
AlternateBenchmarkReturns ##
Current Value ( ) of Standard Investment of 10,000` `
Benchmark#Alternate
Benchmark##Scheme^
NAV perUnit ( )`
Jan 29, 2014 (Since Inception) 10.0000 8.82% 9.49% 8.20% 12,268 12,453 12,099
Jun 30, 2015 To Jun 30, 2016 11.3071 8.50% 8.94% 7.67%
Jun 30, 2014 To Jun 30, 2015 10.4227 8.49% 9.56% 8.54%
NA
PeriodScheme
Returns ^BenchmarkReturns #
AlternateBenchmarkReturns ##
Current Value ( ) of Standard Investment of 10,000` `
Benchmark#Alternate
Benchmark##Scheme^
NAV perUnit ( )`
Jan 23, 2014 (Since Inception) 10.0000 9.00% 9.52% 8.32% 12,335 12,479 12,150
Jun 30, 2015 To Jun 30, 2016 11.2856 9.30% 10.19% 10.03% NA
Jun 30, 2014 To Jun 30, 2015 10.4353 8.15% 8.54% 6.75%
PeriodScheme
Returns ^BenchmarkReturns #
AlternateBenchmarkReturns ##
Current Value ( ) of Standard Investment of 10,000` `
Benchmark#Alternate
Benchmark##Scheme^
NAV perUnit ( )`
Feb 06, 2014 (Since Inception) 10.0000 8.85% 9.49% 8.23% 12,254 12,427 12,088
Jun 30, 2015 To Jun 30, 2016 11.3188 8.27% 8.94% 7.67%
Jun 30, 2014 To Jun 30, 2015 10.4035 8.80% 9.56% 8.54%
NA
PeriodScheme
Returns ^BenchmarkReturns #
AlternateBenchmarkReturns ##
Current Value ( ) of Standard Investment of 10,000` `
Benchmark#Alternate
Benchmark##Scheme^
NAV perUnit ( )`
Feb 18, 2014 (Since Inception) 10.0000 9.05% 9.54% 8.24% 12,272 12,403 12,060
Jun 30, 2015 To Jun 30, 2016 11.3075 8.53% 8.94% 7.67%
Jun 30, 2014 To Jun 30, 2015 10.3911 8.82% 9.56% 8.54%
NA
PeriodScheme
Returns ^BenchmarkReturns #
AlternateBenchmarkReturns ##
Current Value ( ) of Standard Investment of 10,000` `
Benchmark#Alternate
Benchmark##Scheme^
NAV perUnit ( )`
Jan 03, 2014 (Since Inception) 10.0000 8.97% 9.46% 8.13% 12,387 12,525 12,150
Jun 30, 2015 To Jun 30, 2016 11.4031 8.62% 8.94% 7.67%
Jun 30, 2014 To Jun 30, 2015 10.4845 8.76% 9.56% 8.54%
NA

PeriodScheme
Returns ^BenchmarkReturns #
AlternateBenchmarkReturns ##
Current Value ( ) of Standard Investment of 10,000` `
Benchmark#Alternate
Benchmark##Scheme^
NAV perUnit ( )`
Feb 06, 2014 (Since Inception) 10.0000 8.74% 9.49% 8.23% 12,224 12,427 12,088
Jun 30, 2015 To Jun 30, 2016 11.3488 7.71% 8.94% 7.67%
Jun 30, 2014 To Jun 30, 2015 10.4316 8.79% 9.56% 8.54%
NA
PeriodScheme
Returns ^BenchmarkReturns #
AlternateBenchmarkReturns ##
Current Value ( ) of Standard Investment of 10,000` `
Benchmark#Alternate
Benchmark##Scheme^
NAV perUnit ( )`
Feb 07, 2014 (Since Inception) 10.0000 8.51% 9.59% 8.45% 12,159 12,453 12,144
Jun 30, 2015 To Jun 30, 2016 11.1768 8.79% 10.19% 10.03%
Jun 30, 2014 To Jun 30, 2015 10.3817 7.66% 8.54% 6.75%
NA
Fund Manager Details
RegularPlanJune30 12.1590
GrowthOption(NAVason perUnit):,2016`
Scheme Managed: IDFC Fixed Term Plan - Series 70 Option: Direct Plan Growth Option (NAV as on , 2016 per Unit):`June 30 12.2925
RegularPlanGrowthOption(NAVasonJune30 2016 perUnit): 12.2235, `Scheme Managed: IDFC Fixed Term Plan - Series 71 Option: Direct Plan Growth Option (NAV as on , 2016 per Unit):June 30 ` 12.3484
RegularPlanGrowthOption(NAVasonJune30 2016 perUnit): 12.1784, `
Scheme Managed: IDFC Fixed Term Plan - Series 74 Option: Direct Plan Growth Option (NAV as on , 2016 per Unit):June 30 ` 12.2954
RegularPlanGrowthOption(NAVasonJune30 2016 perUnit): 12.1818, `
Scheme Managed: IDFC Fixed Term Plan - Series 77 Option: Direct Plan Growth Option (NAV as on , 2016 per Unit):June 30 ` 12.2536
50
RegularPlanGrowthOption(NAVasonJune30 2016 perUnit): 12.1757, `
Scheme Managed: IDFC Fixed Term Plan - Series 78 Option: Direct Plan Growth Option (NAV as on , 2016 per Unit):June 30 ` 12.2322
Greater than 1 year returns are Compounded Annualised Returns. ^ Past performance may or may not be sustained in future # Crisil Short Term Bond Fund Index ##1 year T-Bill Greater than 1 year returns are Compounded Annualised Returns. ^ Past performance may or may not be sustained in future # Crisil Short Term Bond Fund Index ##1 year T-Bill
Greater than 1 year returns are Compounded Annualised Returns. ^ Past performance may or may not be sustained in future # Crisil Short Term Bond Fund Index ##1 year T-Bill
Greater than 1 year returns are Compounded Annualised Returns. ^ Past performance may or may not be sustained in future # Crisil Composite Bond Fund Index ##10Year GOI Greater than 1 year returns are Compounded Annualised Returns. ^ Past performance may or may not be sustained in future # Crisil Composite Bond Fund Index ##10Year GOI
Current Index performance adjusted for the period from since inception to April 08, 2015 with the performance of Crisil Short TermBond fund index (Benchmark)&1 year T Bill Index (Alternate Benchmark)
Current Index performance adjusted for the period from since inception to April 08, 2015 with the performance of Crisil Short TermBond fund index (Benchmark)&1 year T Bill Index (Alternate Benchmark)
RegularPlanGrowthOption(NAVasonJune30 2016 perUnit):12.1597, `
Scheme Managed: IDFC Fixed Term Plan - Series 75
Greater than 1 year returns are Compounded Annualised Returns. ^ Past performance may or may not be sustained in future # Crisil Composite Bond Fund Index ##10Year GOI
Option: Direct Plan Growth Option (NAV as on , 2016 per Unit):June 30 ` 12.2739
Greater than 1 year returns are Compounded Annualised Returns. ^ Past performance may or may not be sustained in future # Crisil Composite Bond Fund Index ##10Year GOI
Current Index performance adjusted for the period from since inception to April 08, 2015 with the performance of Crisil Short TermBond fund index (Benchmark)&1 year T Bill Index (Alternate Benchmark)
Current Index performance adjusted for the period from since inception to April 08, 2015 with the performance of Crisil Short Term Bond fund index
(Benchmark)&1 year T Bill Index (Alternate Benchmark)
Greater than 1 year returns are Compounded Annualised Returns. ^ Past performance may or may not be sustained in future # Crisil Composite Bond Fund Index ##10Year GOI Greater than 1 year returns are Compounded Annualised Returns. ^ Past performance may or may not be sustained in future # Crisil Composite Bond Fund Index ##10Year GOI
Current Index performance adjusted for the period from since inception to April 08, 2015 with the performance of Crisil Short TermBond fund index (Benchmark)&1 year T Bill Index (Alternate Benchmark)
Current Index performance adjusted for the period from since inception to April 08, 2015 with the performance of Crisil Short TermBond fund index (Benchmark)&1 year T Bill Index (Alternate Benchmark)
Greater than 1 year returns are Compounded Annualised Returns. ^ Past performance may or may not be sustained in future # Crisil Composite Bond Fund Index ##10Year GOI Greater than 1 year returns are Compounded Annualised Returns. ^ Past performance may or may not be sustained in future # Crisil Composite Bond Fund Index ##10Year GOI
Current Index performance adjusted for the period from since inception to April 08, 2015 with the performance of Crisil Short TermBond fund index (Benchmark)&1 year T Bill Index (Alternate Benchmark)
Current Index performance adjusted for the period from since inception to April 08, 2015 with the performance of Crisil Short Term Bond fund index
(Benchmark)&1 year T Bill Index (Alternate Benchmark)
PeriodScheme
Returns ^BenchmarkReturns #
AlternateBenchmarkReturns ##
Current Value ( ) of Standard Investment of 10,000` `
Benchmark#Alternate
Benchmark##Scheme^
NAV perUnit ( )`
Feb 07, 2014 (Since Inception) 10.0000 9.00% 9.59% 8.45% 12,293 12,453 12,144
Jun 30, 2015 To Jun 30, 2016 11.2635 9.14% 10.19% 10.03%
Jun 30, 2014 To Jun 30, 2015 10.4062 8.24% 8.54% 6.75%
NA
PeriodScheme
Returns ^BenchmarkReturns #
AlternateBenchmarkReturns ##
Current Value ( ) of Standard Investment of 10,000` `
Benchmark#Alternate
Benchmark##Scheme^
NAV perUnit ( )`
Feb 06, 2014 (Since Inception) 10.0000 9.20% 9.49% 8.23% 12,348 12,427 12,088
Jun 30, 2015 To Jun 30, 2016 11.4219 8.11% 8.94% 7.67%
Jun 30, 2014 To Jun 30, 2015 10.4507 9.29% 9.56% 8.54%
NA
PeriodScheme
Returns ^BenchmarkReturns #
AlternateBenchmarkReturns ##
Current Value ( ) of Standard Investment of 10,000` `
Benchmark#Alternate
Benchmark##Scheme^
NAV perUnit ( )`
Feb 21, 2014 (Since Inception) 10.0000 8.72% 9.64% 8.43% 12,178 12,423 12,101
Jun 30, 2015 To Jun 30, 2016 11.1729 9.00% 10.19% 10.03%
Jun 30, 2014 To Jun 30, 2015 10.3664 7.78% 8.54% 6.75%
NA
PeriodScheme
Returns ^BenchmarkReturns #
AlternateBenchmarkReturns ##
Current Value ( ) of Standard Investment of 10,000` `
Benchmark#Alternate
Benchmark##Scheme^
NAV perUnit ( )`
Feb 21, 2014 (Since Inception) 10.0000 9.17% 9.64% 8.43% 12,295 12,423 12,101
Jun 30, 2015 To Jun 30, 2016 11.2432 9.36% 10.19% 10.03%
Jun 30, 2014 To Jun 30, 2015 10.3841 8.27% 8.54% 6.75%
NA
PeriodScheme
Returns ^BenchmarkReturns #
AlternateBenchmarkReturns ##
Current Value ( ) of Standard Investment of 10,000` `
Benchmark#Alternate
Benchmark##Scheme^
NAV perUnit ( )`
Feb 26, 2014 (Since Inception) 10.0000 8.71% 9.66% 8.46% 12,160 12,411 12,094
Jun 30, 2015 To Jun 30, 2016 11.1654 8.91% 10.19% 10.03%
Jun 30, 2014 To Jun 30, 2015 10.3547 7.83% 8.54% 6.75%
NA
PeriodScheme
Returns ^BenchmarkReturns #
AlternateBenchmarkReturns ##
Current Value ( ) of Standard Investment of 10,000` `
Benchmark#Alternate
Benchmark##Scheme^
NAV perUnit ( )`
Feb 26, 2014 (Since Inception) 10.0000 9.14% 9.66% 8.46% 12,274 12,411 12,094
Jun 30, 2015 To Jun 30, 2016 11.2343 9.25% 10.19% 10.03%
Jun 30, 2014 To Jun 30, 2015 10.3719 8.31% 8.54% 6.75%
NA
PeriodScheme
Returns ^BenchmarkReturns #
AlternateBenchmarkReturns ##
Current Value ( ) of Standard Investment of 10,000` `
Benchmark#Alternate
Benchmark##Scheme^
NAV perUnit ( )`
Mar 05, 2014 (Since Inception) 10.0000 8.87% 9.64% 8.47% 12,182 12,384 12,080
Jun 30, 2015 To Jun 30, 2016 11.1793 8.97% 10.19% 10.03%
Jun 30, 2014 To Jun 30, 2015 10.3459 8.06% 8.54% 6.75%
NA
PeriodScheme
Returns ^BenchmarkReturns #
AlternateBenchmarkReturns ##
Current Value ( ) of Standard Investment of 10,000` `
Benchmark#Alternate
Benchmark##Scheme^
NAV perUnit ( )`
Mar 05, 2014 (Since Inception) 10.0000 9.14% 9.64% 8.47% 12,254 12,384 12,080
Jun 30, 2015 To Jun 30, 2016 11.2094 9.32% 10.19% 10.03%
Jun 30, 2014 To Jun 30, 2015 10.3519 8.28% 8.54% 6.75%
NA
PeriodScheme
Returns ^BenchmarkReturns #
AlternateBenchmarkReturns ##
Current Value ( ) of Standard Investment of 10,000` `
Benchmark#Alternate
Benchmark##Scheme^
NAV perUnit ( )`
Mar 11, 2014 (Since Inception) 10.0000 8.91% 9.47% 8.23% 12,176 12,321 12,000
Jun 30, 2015 To Jun 30, 2016 11.1704 9.00% 8.94% 7.67%
Jun 30, 2014 To Jun 30, 2015 10.3133 8.31% 9.56% 8.54%
NA
Greater than 1 year returns are Compounded Annualised Returns. ^ Past performance may or may not be sustained in future # Crisil Short Term Bond Fund Index ##1 year T-Bill
PeriodScheme
Returns ^BenchmarkReturns #
AlternateBenchmarkReturns ##
Current Value ( ) of Standard Investment of 10,000` `
Benchmark#Alternate
Benchmark##Scheme^
NAV perUnit ( )`
Mar 11, 2014 (Since Inception) 10.0000 9.13% 9.47% 8.23% 12,232 12,321 12,000
Jun 30, 2015 To Jun 30, 2016 11.2084 9.13% 8.94% 7.67%
Jun 30, 2014 To Jun 30, 2015 10.3229 8.58% 9.56% 8.54%
NA

Fund Manager Details
RegularPlan12.0905
GrowthOption(NAVason perUnit):June30,2016`Scheme Managed: IDFC Fixed Term Plan - Series 79 Option: Direct Plan Growth Option (NAV as on , 2016 per Unit):`June 30 12.2046
RegularPlanGrowthOption(NAVason perUnit): 12.1525June30,2016`
Scheme Managed: IDFC Fixed Term Plan - Series 83 Option: Direct Plan Growth Option (NAV as on , 2016 per Unit):June 30 ` 12.1805
RegularPlanGrowthOption(NAVason perUnit): 12.1144June30,2016`
Scheme Managed: IDFC Fixed Term Plan - Series 84
RegularPlanGrowthOption(NAVason perUnit): 12.1433June30,2016`
Scheme Managed: IDFC Fixed Term Plan - Series 85
RegularPlanGrowthOption(NAVason perUnit):12.0514June30,2016`
Scheme Managed: IDFC Fixed Term Plan - Series 86
51
RegularPlanGrowthOption(NAVason perUnit): 12.0749June30,2016`
Scheme Managed: IDFC Fixed Term Plan - Series 88
Greater than 1 year returns are Compounded Annualised Returns. ^ Past performance may or may not be sustained in future # Crisil Short Term Bond Fund Index ##1 year T-Bill
Greater than 1 year returns are Compounded Annualised Returns. ^ Past performance may or may not be sustained in future # Crisil Short Term Bond Fund Index ##1 year T-Bill
Greater than 1 year returns are Compounded Annualised Returns. ^ Past performance may or may not be sustained in future # Crisil Composite Bond Fund Index ##10Year GOI
Current Index performance adjusted for the period from since inception to April 06, 2015 with the performance of Crisil Short TermBond fund index (Benchmark)&1 year T Bill Index (Alternate Benchmark)
Greater than 1 year returns are Compounded Annualised Returns. ^ Past performance may or may not be sustained in future # Crisil Composite Bond Fund Index ##10Year GOI Greater than 1 year returns are Compounded Annualised Returns. ^ Past performance may or may not be sustained in future # Crisil Composite Bond Fund Index ##10Year GOI
Current Index performance adjusted for the period from since inception to April 08, 2015 with the performance of Crisil Short TermBond fund index (Benchmark)&1 year T Bill Index (Alternate Benchmark)
Current Index performance adjusted for the period from since inception to April 08, 2015 with the performance of Crisil Short TermBond fund index (Benchmark)&1 year T Bill Index (Alternate Benchmark)
Option: Direct Plan Growth Option (NAV as on , 2016 per Unit):June 30 ` 12.1866
Option: Direct Plan Growth Option (NAV as on , 2016 per Unit):June 30 ` 12.1771
Option: Direct Plan Growth Option (NAV as on , 2016 per Unit):June 30 ` 12.1483
Option: Direct Plan Growth Option (NAV as on , 2016 per Unit):June 30 ` 12.1348
Greater than 1 year returns are Compounded Annualised Returns. ^ Past performance may or may not be sustained in future # Crisil Short Term Bond Fund Index ##1 year T-Bill
Greater than 1 year returns are Compounded Annualised Returns. ^ Past performance may or may not be sustained in future # Crisil Short Term Bond Fund Index ##1 year T-Bill
Greater than 1 year returns are Compounded Annualised Returns. ^ Past performance may or may not be sustained in future # Crisil Composite Bond Fund Index ##10Year GOI
Current Index performance adjusted for the period from since inception to April 06, 2015 with the performance of Crisil Short TermBond fund index (Benchmark)&1 year T Bill Index (Alternate Benchmark)
PeriodScheme
Returns ^BenchmarkReturns #
AlternateBenchmarkReturns ##
Current Value ( ) of Standard Investment of 10,000` `
Benchmark#Alternate
Benchmark##Scheme^
NAV perUnit ( )`
Mar 13, 2014 (Since Inception) 10.0000 8.95% 9.46% 8.21% 12,181 12,313 11,992
Jun 30, 2015 To Jun 30, 2016 11.2161 8.60% 8.94% 7.67% NA
Jun 30, 2014 To Jun 30, 2015 10.3133 8.75% 9.56% 8.54%
PeriodScheme
Returns ^BenchmarkReturns #
AlternateBenchmarkReturns ##
Current Value ( ) of Standard Investment of 10,000` `
Benchmark#Alternate
Benchmark##Scheme^
NAV perUnit ( )`
Mar 12, 2014 (Since Inception) 10.0000 8.96% 9.47% 8.29% 12,187 12,318 12,014
Jun 30, 2015 To Jun 30, 2016 11.1580 9.22% 10.19% 10.03% NA
Jun 30, 2014 To Jun 30, 2015 10.3152 8.17% 8.32% 6.35%
PeriodScheme
Returns ^BenchmarkReturns #
AlternateBenchmarkReturns ##
Current Value ( ) of Standard Investment of 10,000` `
Benchmark#Alternate
Benchmark##Scheme^
NAV perUnit ( )`
Mar 19, 2014 (Since Inception) 10.0000 9.00% 9.44% 8.18% 12,177 12,289 11,967
Jun 30, 2015 To Jun 30, 2016 11.1913 8.81% 8.94% 7.67% NA
Jun 30, 2014 To Jun 30, 2015 10.2918 8.74% 9.56% 8.54%
PeriodScheme
Returns ^BenchmarkReturns #
AlternateBenchmarkReturns ##
Current Value ( ) of Standard Investment of 10,000` `
Benchmark#Alternate
Benchmark##Scheme^
NAV perUnit ( )`
Mar 19, 2014 (Since Inception) 10.0000 8.89% 9.44% 8.24% 12,148 12,290 11,983
Jun 30, 2015 To Jun 30, 2016 11.1309 9.14% 10.19% 10.03% NA
Jun 30, 2014 To Jun 30, 2015 10.2877 8.20% 8.32% 6.35%
PeriodScheme
Returns ^BenchmarkReturns #
AlternateBenchmarkReturns ##
Current Value ( ) of Standard Investment of 10,000` `
Benchmark#Alternate
Benchmark##Scheme^
NAV perUnit ( )`
Mar 26, 2014 (Since Inception) 10.0000 8.92% 9.40% 8.22% 12,135 12,257 11,961Jun 30, 2015 To Jun 30, 2016 11.0958 9.36% 10.19% 10.03% NAJun 30, 2014 To Jun 30, 2015 10.2560 8.19% 8.32% 6.35%
PeriodScheme
Returns ^BenchmarkReturns #
AlternateBenchmarkReturns ##
Current Value ( ) of Standard Investment of 10,000` `
Benchmark#Alternate
Benchmark##Scheme^
NAV perUnit ( )`
Mar 14, 2014 (Since Inception) 10.0000 9.05% 9.56% 8.44% 12,205 12,336 12,046
Jun 30, 2015 To Jun 30, 2016 11.1647 9.31% 10.19% 10.03% NA
Jun 30, 2014 To Jun 30, 2015 10.3064 8.33% 8.54% 6.75%
PeriodScheme
Returns ^BenchmarkReturns #
AlternateBenchmarkReturns ##
Current Value ( ) of Standard Investment of 10,000` `
Benchmark#Alternate
Benchmark##Scheme^
NAV perUnit ( )`
Mar 13, 2014 (Since Inception) 10.0000 8.84% 9.46% 8.21% 12,153 12,313 11,992
Jun 30, 2015 To Jun 30, 2016 11.2016 8.49% 8.94% 7.67% NA
Jun 30, 2014 To Jun 30, 2015 10.3103 8.64% 9.56% 8.54%
PeriodScheme
Returns ^BenchmarkReturns #
AlternateBenchmarkReturns ##
Current Value ( ) of Standard Investment of 10,000` `
Benchmark#Alternate
Benchmark##Scheme^
NAV perUnit ( )`
Mar 12, 2014 (Since Inception) 10.0000 8.68% 9.47% 8.29% 12,114 12,318 12,014
Jun 30, 2015 To Jun 30, 2016 11.1273 8.87% 10.19% 10.03% NA
Jun 30, 2014 To Jun 30, 2015 10.3093 7.93% 8.32% 6.35%
PeriodScheme
Returns ^BenchmarkReturns #
AlternateBenchmarkReturns ##
Current Value ( ) of Standard Investment of 10,000` `
Benchmark#Alternate
Benchmark##Scheme^
NAV perUnit ( )`
Mar 19, 2014 (Since Inception) 10.0000 8.87% 9.44% 8.18% 12,143 12,289 11,967
Jun 30, 2015 To Jun 30, 2016 11.1713 8.70% 8.94% 7.67% NA
Jun 30, 2014 To Jun 30, 2015 10.2874 8.59% 9.56% 8.54%
PeriodScheme
Returns ^BenchmarkReturns #
AlternateBenchmarkReturns ##
Current Value ( ) of Standard Investment of 10,000` `
Benchmark#Alternate
Benchmark##Scheme^
NAV perUnit ( )`
Mar 19, 2014 (Since Inception) 10.0000 8.51% 9.44% 8.24% 12,051 12,290 11,983
Jun 30, 2015 To Jun 30, 2016 11.0774 8.79% 10.19% 10.03% NA
Jun 30, 2014 To Jun 30, 2015 10.2765 7.79% 8.32% 6.35%
PeriodScheme
Returns ^BenchmarkReturns #
AlternateBenchmarkReturns ##
Current Value ( ) of Standard Investment of 10,000` `
Benchmark#Alternate
Benchmark##Scheme^
NAV perUnit ( )`
Mar 26, 2014 (Since Inception) 10.0000 8.68% 9.40% 8.22% 12,075 12,257 11,961Jun 30, 2015 To Jun 30, 2016 11.0762 9.02% 10.19% 10.03% NAJun 30, 2014 To Jun 30, 2015 10.2532 8.03% 8.32% 6.35%
PeriodScheme
Returns ^BenchmarkReturns #
AlternateBenchmarkReturns ##
Current Value ( ) of Standard Investment of 10,000` `
Benchmark#Alternate
Benchmark##Scheme^
NAV perUnit ( )`
Mar 14, 2014 (Since Inception) 10.0000 8.61% 9.56% 8.44% 12,091 12,336 12,046
Jun 30, 2015 To Jun 30, 2016 11.0956 8.97% 10.19% 10.03% NA
Jun 30, 2014 To Jun 30, 2015 10.2908 7.82% 8.54% 6.75%

Fund Manager Details
RegularPlanGrowthOption(NAVason perUnit):12.0660June30,2016`
Scheme Managed: IDFC Fixed Term Plan - Series 89 Option: Direct Plan Growth Option (NAV as on , 2016 per Unit):`June 30 12.1889
RegularPlanGrowthOption(NAVason perUnit): 12.0996June30,2016`
Scheme Managed: IDFC Fixed Term Plan - Series 90 Option: Direct Plan Growth Option (NAV as on , 2016 per Unit):June 30 ` 12.1624
RegularPlanGrowthOption(NAVason perUnit): 12.0182June30,2016`
Scheme Managed: IDFC Fixed Term Plan - Series 91 Option: Direct Plan Growth Option (NAV as on , 2016 per Unit):June 30 ` 12.0570
RegularPlanGrowthOption(NAVason perUnit): 11.9737June30,2016`
Scheme Managed: IDFC Fixed Term Plan - Series 92 Option: Direct Plan Growth Option (NAV as on , 2016 per Unit):June 30 ` 11.9994
RegularPlanGrowthOption(NAVason perUnit):11.9667June30,2016`
Scheme Managed: IDFC Fixed Term Plan - Series 93 Option: Direct Plan Growth Option (NAV as on , 2016 per Unit):June 30 ` 11.9922
52
Greater than 1 year returns are Compounded Annualised Returns. ^ Past performance may or may not be sustained in future # Crisil Short Term Bond Fund Index ##1 year T-Bill Greater than 1 year returns are Compounded Annualised Returns. ^ Past performance may or may not be sustained in future # Crisil Short Term Bond Fund Index ##1 year T-Bill
Greater than 1 year returns are Compounded Annualised Returns. ^ Past performance may or may not be sustained in future # Crisil Short Term Bond Fund Index ##1 year T-Bill Greater than 1 year returns are Compounded Annualised Returns. ^ Past performance may or may not be sustained in future # Crisil Short Term Bond Fund Index ##1 year T-Bill
Greater than 1 year returns are Compounded Annualised Returns. ^ Past performance may or may not be sustained in future # Crisil Short Term Bond Fund Index ##1 year T-Bill Greater than 1 year returns are Compounded Annualised Returns. ^ Past performance may or may not be sustained in future # Crisil Short Term Bond Fund Index ##1 year T-Bill
Greater than 1 year returns are Compounded Annualised Returns. ^ Past performance may or may not be sustained in future # Crisil Short Term Bond Fund Index ##1 year T-Bill Greater than 1 year returns are Compounded Annualised Returns. ^ Past performance may or may not be sustained in future # Crisil Short Term Bond Fund Index ##1 year T-Bill
Greater than 1 year returns are Compounded Annualised Returns. ^ Past performance may or may not be sustained in future # Crisil Composite Bond Fund Index ##10Year GOI Greater than 1 year returns are Compounded Annualised Returns. ^ Past performance may or may not be sustained in future # Crisil Composite Bond Fund Index ##10Year GOI
Current Index performance adjusted for the period from since inception to April 20, 2015 with the performance of Crisil Short TermBond fund index (Benchmark)&1 year T Bill Index (Alternate Benchmark)
Current Index performance adjusted for the period from since inception to April 20, 2015 with the performance of Crisil Short TermBond fund index (Benchmark)&1 year T Bill Index (Alternate Benchmark)
PeriodScheme
Returns ^BenchmarkReturns #
AlternateBenchmarkReturns ##
Current Value ( ) of Standard Investment of 10,000` `
Benchmark#Alternate
Benchmark##Scheme^
NAV perUnit ( )`
Apr 10, 2014 (Since Inception) 10.0000 8.94% 9.42% 8.21% 12,100 12,217 11,919
Jun 30, 2015 To Jun 30, 2016 11.2147 7.89% 8.94% 7.67% NA
Jun 30, 2014 To Jun 30, 2015 10.2731 9.17% 9.56% 8.54%
PeriodScheme
Returns ^BenchmarkReturns #
AlternateBenchmarkReturns ##
Current Value ( ) of Standard Investment of 10,000` `
Benchmark#Alternate
Benchmark##Scheme^
NAV perUnit ( )`
Apr 10, 2014 (Since Inception) 10.0000 9.20% 9.42% 8.21% 12,162 12,217 11,919
Jun 30, 2015 To Jun 30, 2016 11.2489 8.12% 8.94% 7.67% NA
Jun 30, 2014 To Jun 30, 2015 10.2787 9.44% 9.56% 8.54%
PeriodScheme
Returns ^BenchmarkReturns #
AlternateBenchmarkReturns ##
Current Value ( ) of Standard Investment of 10,000` `
Benchmark#Alternate
Benchmark##Scheme^
NAV perUnit ( )`
Apr 16, 2014 (Since Inception) 10.0000 8.68% 9.51% 8.48% 12,018 12,222 11,968
Jun 30, 2015 To Jun 30, 2016 11.0128 9.13% 10.19% 10.03% NA
PeriodScheme
Returns ^BenchmarkReturns #
AlternateBenchmarkReturns ##
Current Value ( ) of Standard Investment of 10,000` `
Benchmark#Alternate
Benchmark##Scheme^
NAV perUnit ( )`
Apr 16, 2014 (Since Inception) 10.0000 8.84% 9.51% 8.48% 12,057 12,222 11,968
Jun 30, 2015 To Jun 30, 2016 11.0373 9.24% 10.19% 10.03% NA
PeriodScheme
Returns ^BenchmarkReturns #
AlternateBenchmarkReturns ##
Current Value ( ) of Standard Investment of 10,000` `
Benchmark#Alternate
Benchmark##Scheme^
NAV perUnit ( )`
May 07, 2014 (Since Inception) 10.0000 8.74% 9.34% 8.17% 11,974 12,118 11,840
Jun 30, 2015 To Jun 30, 2016 11.0461 8.40% 8.94% 7.67% NA
Jun 30, 2014 To Jun 30, 2015 10.1467 8.86% 9.56% 8.54%
PeriodScheme
Returns ^BenchmarkReturns #
AlternateBenchmarkReturns ##
Current Value ( ) of Standard Investment of 10,000` `
Benchmark#Alternate
Benchmark##Scheme^
NAV perUnit ( )`
May 07, 2014 (Since Inception) 10.0000 8.84% 9.34% 8.17% 11,999 12,118 11,840
Jun 30, 2015 To Jun 30, 2016 11.0587 8.51% 8.94% 7.67% NA
Jun 30, 2014 To Jun 30, 2015 10.1482 8.97% 9.56% 8.54%
PeriodScheme
Returns ^BenchmarkReturns #
AlternateBenchmarkReturns ##
Current Value ( ) of Standard Investment of 10,000` `
Benchmark#Alternate
Benchmark##Scheme^
NAV perUnit ( )`
May 13, 2014 (Since Inception) 10.0000 8.78% 9.29% 8.16% 11,967 12,088 11,823
Jun 30, 2015 To Jun 30, 2016 11.0297 8.50% 8.94% 7.67% NA
Jun 30, 2014 To Jun 30, 2015 10.1279 8.90% 9.56% 8.54%
PeriodScheme
Returns ^BenchmarkReturns #
AlternateBenchmarkReturns ##
Current Value ( ) of Standard Investment of 10,000` `
Benchmark#Alternate
Benchmark##Scheme^
NAV perUnit ( )`
May 13, 2014 (Since Inception) 10.0000 8.88% 9.29% 8.16% 11,992 12,088 11,823
Jun 30, 2015 To Jun 30, 2016 11.0421 8.60% 8.94% 7.67% NA
Jun 30, 2014 To Jun 30, 2015 10.1292 9.01% 9.56% 8.54%
PeriodScheme
Returns ^BenchmarkReturns #
AlternateBenchmarkReturns ##
Current Value ( ) of Standard Investment of 10,000` `
Benchmark#Alternate
Benchmark##Scheme^
NAV perUnit ( )`
Mar 27, 2014 (Since Inception) 10.0000 8.65% 9.40% 8.16% 12,066 12,254 11,943
Jun 30, 2015 To Jun 30, 2016 11.2012 7.72% 8.94% 7.67% NA
Jun 30, 2014 To Jun 30, 2015 10.2825 8.93% 9.56% 8.54%
PeriodScheme
Returns ^BenchmarkReturns #
AlternateBenchmarkReturns ##
Current Value ( ) of Standard Investment of 10,000` `
Benchmark#Alternate
Benchmark##Scheme^
NAV perUnit ( )`
Mar 27, 2014 (Since Inception) 10.0000 9.14% 9.40% 8.16% 12,189 12,254 11,943
Jun 30, 2015 To Jun 30, 2016 11.2706 8.15% 8.94% 7.67% NA
Jun 30, 2014 To Jun 30, 2015 10.2956 9.47% 9.56% 8.54%

Fund Manager Details
RegularPlanGrowthOption(NAVason perUnit):11.8742June30,2016`
Scheme Managed: IDFC Fixed Term Plan - Series 97 Option: Direct Plan Growth Option (NAV as on , 2016 per Unit):`June 30 11.9195
RegularPlanGrowthOption(NAVason perUnit): 11.8269June30,2016`
Scheme Managed: IDFC Fixed Term Plan - Series 99 Option: Direct Plan Growth Option (NAV as on , 2016 per Unit):June 30 ` 11.8631
53
Greater than 1 year returns are Compounded Annualised Returns. ^ Past performance may or may not be sustained in future # Crisil Short Term Bond Fund Index ##1 year T-Bill Greater than 1 year returns are Compounded Annualised Returns. ^ Past performance may or may not be sustained in future # Crisil Short Term Bond Fund Index ##1 year T-Bill
Greater than 1 year returns are Compounded Annualised Returns. ^ Past performance may or may not be sustained in future # Crisil Short Term Bond Fund Index ##1 year T-Bill Greater than 1 year returns are Compounded Annualised Returns. ^ Past performance may or may not be sustained in future # Crisil Short Term Bond Fund Index ##1 year T-Bill
PeriodScheme
Returns ^BenchmarkReturns #
AlternateBenchmarkReturns ##
Current Value ( ) of Standard Investment of 10,000` `
Benchmark#Alternate
Benchmark##Scheme^
NAV perUnit ( )`
Jun 12, 2014 (Since Inception) 10.0000 8.52% 9.15% 8.05% 11,827 11,967 11,722
Jun 30, 2015 To Jun 30, 2016 10.8995 8.51% 8.94% 7.67% NA
Jun 30, 2014 To Jun 30, 2015 10.0383 8.58% 9.56% 8.54%
PeriodScheme
Returns ^BenchmarkReturns #
AlternateBenchmarkReturns ##
Current Value ( ) of Standard Investment of 10,000` `
Benchmark#Alternate
Benchmark##Scheme^
NAV perUnit ( )`
Jun 12, 2014 (Since Inception) 10.0000 8.68% 9.15% 8.05% 11,863 11,967 11,722
Jun 30, 2015 To Jun 30, 2016 10.9219 8.62% 8.94% 7.67% NA
Jun 30, 2014 To Jun 30, 2015 10.0393 8.79% 9.56% 8.54%
PeriodScheme
Returns ^BenchmarkReturns #
AlternateBenchmarkReturns ##
Current Value ( ) of Standard Investment of 10,000` `
Benchmark#Alternate
Benchmark##Scheme^
NAV perUnit ( )`
Jun 03, 2014 (Since Inception) 10.0000 8.62% 9.19% 8.05% 11,874 12,003 11,743
Jun 30, 2015 To Jun 30, 2016 10.9447 8.49% 8.94% 7.67% NA
Jun 30, 2014 To Jun 30, 2015 10.0653 8.74% 9.56% 8.54%
PeriodScheme
Returns ^BenchmarkReturns #
AlternateBenchmarkReturns ##
Current Value ( ) of Standard Investment of 10,000` `
Benchmark#Alternate
Benchmark##Scheme^
NAV perUnit ( )`
Jun 03, 2014 (Since Inception) 10.0000 8.82% 9.19% 8.05% 11,920 12,003 11,743
Jun 30, 2015 To Jun 30, 2016 10.9635 8.72% 8.94% 7.67% NA
Jun 30, 2014 To Jun 30, 2015 10.0665 8.91% 9.56% 8.54%
RegularPlanGrowthOption(NAVason perUnit): 12.5387June30,2016`
Scheme Managed: IDFC Fixed Term Plan Series 48 Option: Direct Plan Growth Option (NAV as on , 2016 per Unit):June 30 ` 12.5662
Greater than 1 year returns are Compounded Annualised Returns. ^ Past performance may or may not be sustained in future # Crisil Short Term Bond Fund Index ##1 year T-Bill Greater than 1 year returns are Compounded Annualised Returns. ^ Past performance may or may not be sustained in future # Crisil Short Term Bond Fund Index ##1 year T-Bill
PeriodScheme
Returns ^BenchmarkReturns #
AlternateBenchmarkReturns ##
Current Value ( ) of Standard Investment of 10,000` `
Benchmark#Alternate
Benchmark##Scheme^
NAV perUnit ( )`
Nov 13, 2013 (Since Inception) 10.0000 8.98% 9.51% 8.17% 12,539 12,700 12,294
Jun 30, 2015 To Jun 30, 2016 11.5615 8.45% 8.94% 7.67% NA
Jun 30, 2014 To Jun 30, 2015 10.6479 8.58% 9.56% 8.54%
PeriodScheme
Returns ^BenchmarkReturns #
AlternateBenchmarkReturns ##
Current Value ( ) of Standard Investment of 10,000` `
Benchmark#Alternate
Benchmark##Scheme^
NAV perUnit ( )`
Nov 13, 2013 (Since Inception) 10.0000 9.07% 9.51% 8.17% 12,566 12,700 12,294
Jun 30, 2015 To Jun 30, 2016 11.5752 8.56% 8.94% 7.67% NA
Jun 30, 2014 To Jun 30, 2015 10.6526 8.66% 9.56% 8.54%
Scheme Managed: IDFC Banking Debt FundRegularPlanGrowthOption(NAVason perUnit): 13.2491June30,2016`
Greater than 1 year returns are Compounded Annualised Returns. ^ Past performance may or may not be sustained in future ##Crisil Liquid Fund Index ##Crisil 1 Year T-Bill Index
Scheme Managed: IDFC Banking Debt Fund
Option: Direct Plan Growth (NAV as on , per Unit):2016 `June 30 13.2979
Greater than 1 year returns are Compounded Annualised Returns. ^ Past performance may or may not be sustained in future ##Crisil Liquid Fund Index ##Crisil 1 Year T-Bill Index
PeriodScheme
Returns ^BenchmarkReturns #
AlternateBenchmarkReturns ##
Current Value ( ) of Standard Investment of 10,000` `
Benchmark#Alternate
Benchmark##Scheme^
NAV perUnit ( )`
Mar 07, 2013 (Since Inception) 10.0000 8.85% 8.74% 7.45% 13,249 13,203 12,694
Jun 30, 2015 To Jun 30, 2016 12.2257 8.37% 7.90% 7.67%
Jun 30, 2014 To Jun 30, 2015 11.2265 8.90% 8.77% 8.54%
Jun 28, 2013 To Jun 30, 2014 10.3298 8.63% 9.63% 5.89%
NA
PeriodScheme
Returns ^BenchmarkReturns #
AlternateBenchmarkReturns ##
Current Value ( ) of Standard Investment of 10,000` `
Benchmark#Alternate
Benchmark##Scheme^
NAV perUnit ( )`
Mar 07, 2013 (Since Inception) 10.0000 8.97% 8.74% 7.45% 13,298 13,203 12,694
Jun 30, 2015 To Jun 30, 2016 12.2576 8.49% 7.90% 7.67%
Jun 30, 2014 To Jun 30, 2015 11.2431 9.02% 8.77% 8.54%
Jun 28, 2013 To Jun 30, 2014 10.3328 8.76% 9.63% 5.89%
NA
RegularPlanGrowthOption(NAVason perUnit): 10.9109June30,2016`
Scheme Managed: IDFC Fixed Term Plan - Series 108 Option: Direct Plan Growth Option (NAV as on , 2016 per Unit):June 30 ` 11.0373
Greater than 1 year returns are Compounded Annualised Returns. ^ Past performance may or may not be sustained in future # Crisil Composite Bond Fund Index ##CRISIL 10 Year Gilt Index
PeriodScheme
Returns ^BenchmarkReturns #
AlternateBenchmarkReturns ##
Current Value ( ) of Standard Investment of 10,000` `
Benchmark#Alternate
Benchmark##Scheme^
NAV perUnit ( )`
May 08, 2015 (Since Inception) 10.00 9.11% 11.10% 10.81% 11,053 11,284 11,251
Jun 30, 2015 To Jun 30, 2016 10.08 8.17% 10.16% 10.01% NA
Greater than 1 year returns are Compounded Annualised Returns. ^ Past performance may or may not be sustained in future # Crisil Composite Bond Fund Index ##CRISIL 10 Year Gilt Index
PeriodScheme
Returns ^BenchmarkReturns #
AlternateBenchmarkReturns ##
Current Value ( ) of Standard Investment of 10,000` `
Benchmark#Alternate
Benchmark##Scheme^
NAV perUnit ( )`
May 08, 2015 (Since Inception) 10.00 10.37% 11.10% 10.81% 11,200 11,284 11,251
Jun 30, 2015 To Mar 31, 2016 10.10 9.26% 10.16% 10.01% NA

Fund Manager Details
54
Scheme Managed: IDFC Money Manager Fund – Investment PlanRegularPlan
23.9565GrowthOption
(NAVason perUnit):June30,2016`
Greater than 1 year returns are Compounded Annualised Returns. ^ Past performance may or may not be sustained in future # ##1 Year T-BillCRISIL Short-Term Bond Fund Index
PeriodScheme
Returns ^BenchmarkReturns #
AlternateBenchmarkReturns ##
Current Value ( ) of Standard Investment of 10,000` `
Benchmark#Alternate
Benchmark##Scheme^
NAV perUnit ( )`
Aug 09, 2004 (Since Inception) 10.0000 7.62% 7.50% 6.01% 23,957 23,636 20,029
Jun 30, 2015 To Jun 30, 2016 22.0290 8.75% 8.94% 7.67%
Jun 30, 2014 To Jun 30, 2015 20.2980 8.53% 9.56% 8.54% NA
Jun 28, 2013 To Jun 30, 2014 18.6689 8.68% 8.76% 5.89%
Scheme Managed: IDFC Money Manager Fund – Investment PlanOption: Direct Plan Growth (NAV as on , per Unit):2016 `June 30 24.1239
Greater than 1 year returns are Compounded Annualised Returns. ^ Past performance may or may not be sustained in future # ##1 Year T-BillCRISIL Short-Term Bond Fund Index
PeriodScheme
Returns ^BenchmarkReturns #
AlternateBenchmarkReturns ##
Current Value ( ) of Standard Investment of 10,000` `
Benchmark#Alternate
Benchmark##Scheme^
NAV perUnit ( )`
Jan 01, 2013 (Since Inception) 17.8939 8.92% 9.12% 7.50% 13,482 13,569 12,875
Jun 30, 2015 To Jun 30, 2016 22.1506 8.91% 8.94% 7.67%
Jun 30, 2014 To Jun 30, 2015 20.3659 8.76% 9.56% 8.54%
Jun 28, 2013 To Jun 30, 2014 18.6887 8.92% 8.76% 5.89%
NA
Greaterthan1yearreturnsareCompoundedAnnualisedReturns.^Pastperformancemayormaynotbesustainedinfuture #CRISILShort-TermBondFundIndex
##1YearT-Bill
Scheme Managed: IDFC Super Saver Income Fund – Medium TermRegularPlanGrowthOption(NAVason perUnit):25.8429June30,2016`
Greater than 1year returns areCompounded AnnualisedReturns. ^ Pastperformancemay or may not besustained in future # ##1Year T-BillCRISIL Short-Term BondFund Index
Scheme Managed: IDFC Super Saver Income Fund – Medium TermOption: Direct Plan Growth (NAV as on , per Unit): 26.4889June 30 2016 `
PeriodScheme
Returns ^BenchmarkReturns #
AlternateBenchmarkReturns ##
Current Value ( ) of Standard Investment of 10,000` `
Benchmark#Alternate
Benchmark##Scheme^
NAV perUnit ( )`
Jul 08, 2003 (Since Inception) 10.0000 7.58% 7.17% 5.89% 25,843 24,588 21,026
Jun 30, 2015 To Jun 30, 2016 23.8316 8.44% 8.94% 7.67%
Jun 30, 2014 To Jun 30, 2015 21.7628 9.51% 9.56% 8.54% NA
Jun 28, 2013 To Jun 30, 2014 20.5383 5.93% 8.76% 5.89%
PeriodScheme
Returns ^BenchmarkReturns #
AlternateBenchmarkReturns ##
Current Value ( ) of Standard Investment of 10,000` `
Benchmark#Alternate
Benchmark##Scheme^
NAV perUnit ( )`
Jan 01, 2013 (Since Inception) 19.6695 8.89% 9.12% 7.50% 13,467 13,569 12,875
Jun 30, 2015 To Jun 30, 2016 24.2791 9.10% 8.94% 7.67%
Jun 30, 2014 To Jun 30, 2015 22.0305 10.21% 9.56% 8.54%
Jun 28, 2013 To Jun 30, 2014 20.6251 6.78% 8.76% 5.89%
NA
Scheme Managed: IDFC Money Manager Fund – Treasury Plan RegularPlanGrowthOption(NAVason perUnit):24.1365June30,2016`
Greater than 1 year returns are Compounded Annualised Returns. ^ Past performance may or may not be sustained in future # ##1 Year T-BillCRISIL Liquid Fund Index
PeriodScheme
Returns ^BenchmarkReturns #
AlternateBenchmarkReturns ##
Current Value ( ) of Standard Investment of 10,000` `
Benchmark#Alternate
Benchmark##Scheme^
NAV perUnit ( )`
Feb 18, 2003 (Since Inception) 10.0000 6.81% 6.84% 5.90% 24,137 24,222 21,528
Jun 30, 2015 To Jun 30, 2016 22.2999 8.24% 7.90% 7.67%
Jun 30, 2014 To Jun 30, 2015 20.5877 8.32% 8.77% 8.54% NA
Jun 28, 2013 To Jun 30, 2014 18.8820 8.98% 9.63% 5.89%
Greater than 1 year returns areCompounded Annualised Returns. ^Pastperformancemay or may notbesustained in future #Crisil LiquidFund Index ##1 Year T-Bill
Fund Manager Name: Mr. Anurag Mittal (w.e.f. 09/11/15)
Scheme Managed: IDFC Ultra Short Term Fund Regular Plan 21.6656Growth Option (NAV as on per Unit):`Dec 31, 2015
PeriodScheme
Returns ^BenchmarkReturns #
AlternateBenchmarkReturns ##
Current Value ( ) of Standard Investment of 10,000` `
Benchmark#Alternate
Benchmark##Scheme^
NAV perUnit ( )`
Jan 17, 2006 (Since Inception) 10.0000 7.67% 7.53% 6.25% 21,666 21,359 18,848
Jun 30, 2015 To Jun 30, 2016 19.9539 8.58% 7.90% 7.67%
Jun 30, 2014 To Jun 30, 2015 18.3030 9.02% 8.77% 8.54% NA
Jun 28, 2013 To Jun 30, 2014 16.6826 9.66% 9.63% 5.89%
Scheme Managed: IDFC Ultra Short Term FundOption: Direct Plan Growth (NAV as on , per Unit): 21.7575June 30 2016 `
PeriodScheme
Returns ^BenchmarkReturns #
AlternateBenchmarkReturns ##
Current Value ( ) of Standard Investment of 10,000` `
Benchmark#Alternate
Benchmark##Scheme^
NAV perUnit ( )`
Jan 01, 2013 (Since Inception) 15.9609 9.27% 8.71% 7.50% 13,632 13,388 12,875
Jun 30, 2015 To Jun 30, 2016 20.0083 8.74% 7.90% 7.67%
Jun 30, 2014 To Jun 30, 2015 18.3252 9.18% 8.77% 8.54% NA
Jun 28, 2013 To Jun 30, 2014 16.6858 9.77% 9.63% 5.89%
Greater than 1year returnsareCompounded AnnualisedReturns. ^ Past performancemay ormaynot besustained in future #Crisil LiquidFund Index ##1YearT-Bill
Greater than 1 year returns are Compounded Annualised Returns. ^ Past performance may or may not be sustained in future # ##1 Year T-BillCRISIL Liquid Fund Index
Scheme Managed: IDFC Money Manager Fund – Treasury PlanOption: Direct Plan Growth (NAV as on , per Unit): 24.6744June 30 2016 `
PeriodScheme
Returns ^BenchmarkReturns #
AlternateBenchmarkReturns ##
Current Value ( ) of Standard Investment of 10,000` `
Benchmark#Alternate
Benchmark##Scheme^
NAV perUnit ( )`
NA
Jan 01, 2013 (Since Inception) 18.1863 9.12% 8.71% 7.50% 13,568 13,388 12,875
Jun 30, 2015 To Jun 30, 2016 22.6654 8.86% 7.90% 7.67%
Jun 30, 2014 To Jun 30, 2015 20.7909 9.02% 8.77% 8.54%
Jun 28, 2013 To Jun 30, 2014 18.9443 9.69% 9.63% 5.89%
Scheme Managed: IDFC All Seasons Bond Fund (w.e.f. 15/07/16)Regular Plan
23.8115June 30Growth Option (NAV as on
per Unit):`, 2016
Greater than 1 year returns are Compounded Annualised Returns. ^ Past performance may or may not be sustained in future # Crisil Short Term Bond Fund Index ##Crisil 1 Year T-Bill Index Greater than 1 year returns are Compounded Annualised Returns. ^ Past performance may or may not be sustained in future #Crisil Short Term Bond Fund Index ##Crisil 1 Year T-Bill Index
Scheme Managed: IDFC All Seasons Bond Fund (w.e.f. 15/07/16)
Option: Direct Plan Growth (NAV as on , per Unit):2016 `June 30 24.1816
PeriodScheme
Returns ^BenchmarkReturns #
AlternateBenchmarkReturns ##
Current Value ( ) of Standard Investment of 10,000` `
Benchmark#Alternate
Benchmark##Scheme^
NAV perUnit ( )`
Sep 13, 2004 (Since Inception) 10.0000 7.63% 7.52% 6.04% 23,812 23,526 19,985
Jun 30, 2015 To Jun 30, 2016 21.9499 8.48% 8.94% 7.67%
Jun 30, 2014 To Jun 30, 2015 20.0772 9.33% 9.56% 8.54% NA
Jun 28, 2013 To Jun 30, 2014 18.3965 9.08% 8.76% 5.89%
PeriodScheme
Returns ^BenchmarkReturns #
AlternateBenchmarkReturns ##
Current Value ( ) of Standard Investment of 10,000` `
Benchmark#Alternate
Benchmark##Scheme^
NAV perUnit ( )`
Feb 22, 2013 (Since Inception) 17.9002 9.38% 9.21% 7.45% 13,509 13,438 12,725
Jun 30, 2015 To Jun 30, 2016 22.1931 8.96% 8.94% 7.67%
Jun 30, 2014 To Jun 30, 2015 20.2121 9.80% 9.56% 8.54%
Jun 28, 2013 To Jun 30, 2014 18.4252 9.64% 8.76% 5.89%
NA

Fund Manager Details
55
Scheme Managed: IDFC Dynamic Bond Fund
Option: Direct Plan Growth (NAV as on , per Unit): 18.7906June 30 2016 `
Scheme Managed: IDFC Dynamic Bond Fund RegularPlan 18.2045June30GrowthOption(NAVason perUnit):`,2016
Greater than 1 year returns are Compounded Annualised Returns. ^ Past performance may or may not be sustained in future # CRISIL Composite Bond Fund Index ##10 Year GOIGreater than 1 year returns are Compounded Annualised Returns. ^ Past performance may or may not be sustained in future # CRISIL Composite Bond Fund Index ##10 Year GOI
Scheme Managed: IDFC Super Saver Income Fund – Investment Plan
Option: Direct Plan Growth (NAV as on , per Unit): 37.5745June 30 2016 `
Greater than 1 year returns are Compounded Annualised Returns. ^ Past performance may or may not be sustained in future # CRISIL Composite Bond Fund Index ##10 Year GOI
RegularPlan Growth Option(NAV as on perUnit): 36.5888June30,2016 `Scheme Managed: IDFC Super Saver Income Fund – Investment Plan
Greater than 1 year returns are Compounded Annualised Returns. ^ Past performance may or may not be sustained in future # CRISIL Composite Bond Fund Index ##10 Year GOI
Fund Manager Name:
Scheme Managed:
Mr. Suyash Choudhary
IDFC Super Saver Income Fund – Short TermRegular Plan
31.4414Growth Option
(NAV as on per Unit):June 30, 2016 `
Greater than 1 year returns are Compounded Annualised Returns. ^ Past performance may or may not be sustained in future # CRISIL Short-Term Bond Fund Index ##1 Year T-Bill
Scheme Managed: IDFC Super Saver Income Fund – Short Term
Option: Direct Plan Growth (NAV as on , per Unit):2016 `June 30 32.1998
Greater than 1 year returns are Compounded Annualised Returns. ^ Past performance may or may not be sustained in future # CRISIL Short-Term Bond Fund Index ##1 Year T-Bill
PeriodScheme
Returns ^BenchmarkReturns #
AlternateBenchmarkReturns ##
Current Value ( ) of Standard Investment of 10,000` `
Benchmark#Alternate
Benchmark##Scheme^
NAV perUnit ( )`
Jan 01, 2013 (Since Inception) 23.5713 9.33% 9.12% 7.50% 13,661 13,569 12,875
Jun 30, 2015 To Jun 30, 2016 29.5284 9.05% 8.94% 7.67%
Jun 30, 2014 To Jun 30, 2015 26.9055 9.75% 9.56% 8.54%
Jun 28, 2013 To Jun 30, 2014 24.6363 9.16% 8.76% 5.89%
NA
PeriodScheme
Returns ^BenchmarkReturns #
AlternateBenchmarkReturns ##
Current Value ( ) of Standard Investment of 10,000` `
Benchmark#Alternate
Benchmark##Scheme^
NAV perUnit ( )`
Dec 14, 2000 (Since Inception) 10.0000 7.64% NA 6.30% 31,441 NA 25,876
Jun 30, 2015 To Jun 30, 2016 28.9876 8.46% 8.94% 7.67%
Jun 30, 2014 To Jun 30, 2015 26.5989 8.98% 9.56% 8.54% NA
Jun 28, 2013 To Jun 30, 2014 24.5444 8.32% 8.76% 5.89%
PeriodScheme
Returns ^BenchmarkReturns #
AlternateBenchmarkReturns ##
Current Value ( ) of Standard Investment of 10,000` `
Benchmark#Alternate
Benchmark##Scheme^
NAV perUnit ( )`
Dec 03, 2008 (Since Inception) 10.0000 8.23% 8.13% 5.61% 18,205 18,077 15,124
Jun 30, 2015 To Jun 30, 2016 16.7588 8.63% 10.19% 10.03%
Jun 30, 2014 To Jun 30, 2015 14.9523 12.08% 11.10% 11.76% NA
Jun 28, 2013 To Jun 30, 2014 14.5269 2.91% 4.57% -2.46%
PeriodScheme
Returns ^BenchmarkReturns #
AlternateBenchmarkReturns ##
Current Value ( ) of Standard Investment of 10,000` `
Benchmark#Alternate
Benchmark##Scheme^
NAV perUnit ( )`
Jul 14, 2000 (Since Inception) 10.0000 8.46% NA NA 36,589 NA NA
Jun 30, 2015 To Jun 30, 2016 33.7496 8.41% 10.19% 10.03%
Jun 30, 2014 To Jun 30, 2015 30.1861 11.81% 11.10% 11.76% NA
Jun 28, 2013 To Jun 30, 2014 29.3314 2.90% 4.57% -2.46%
PeriodScheme
Returns ^BenchmarkReturns #
AlternateBenchmarkReturns ##
Current Value ( ) of Standard Investment of 10,000` `
Benchmark#Alternate
Benchmark##Scheme^
NAV perUnit ( )`
Jan 01, 2013 (Since Inception) 13.6545 9.56% 8.97% 7.22% 13,761 13,501 12,759
Jun 30, 2015 To Jun 30, 2016 17.1415 9.62% 10.19% 10.03%
Jun 30, 2014 To Jun 30, 2015 15.1536 13.12% 11.10% 11.76%
Jun 28, 2013 To Jun 30, 2014 14.5880 3.86% 4.57% -2.46%
NA
PeriodScheme
Returns ^BenchmarkReturns #
AlternateBenchmarkReturns ##
Current Value ( ) of Standard Investment of 10,000` `
Benchmark#Alternate
Benchmark##Scheme^
NAV perUnit ( )`
Jan 01, 2013 (Since Inception) 27.5990 9.23% 8.97% 7.22% 13,614 13,501 12,759
Jun 30, 2015 To Jun 30, 2016 34.4321 9.13% 10.19% 10.03%
Jun 30, 2014 To Jun 30, 2015 30.5329 12.77% 11.10% 11.76%
Jun 28, 2013 To Jun 30, 2014 29.4587 3.63% 4.57% -2.46%
NA
RegularPlanGrowthOption(NAVason perUnit):22.2835June30,2016`Scheme Managed: IDFC Government Securities Fund - Short Term Plan
Greater than 1 year returns are Compounded Annualised Returns. ^ Past performance may or may not be sustained in future # I - Sec Si Bex ## 1 Year T-Bill
PeriodScheme
Returns ^BenchmarkReturns #
AlternateBenchmarkReturns ##
Current Value ( ) of Standard Investment of 10,000` `
Benchmark#Alternate
Benchmark##Scheme^
NAV perUnit ( )`
Mar 09, 2002 (Since Inception) 10.0000 5.75% NA 5.92% 22,284 NA 22,803
Jun 30, 2015 To Jun 30, 2016 20.2356 10.12% -100.00% 7.67%
Jun 30, 2014 To Jun 30, 2015 18.3447 10.31% 9.16% 8.54% NA
Jun 28, 2013 To Jun 30, 2014 16.4547 11.42% 6.80% 5.89%
Scheme Managed: IDFC Government Securities Fund - Short Term Plan
Option: Direct Plan Growth (NAV as on , per Unit): 22.3637June 30 2016 `
Greater than 1 year returns are Compounded Annualised Returns. ^ Past performance may or may not be sustained in future # I - Sec Si Bex ## 1 Year T-Bill
PeriodScheme
Returns ^BenchmarkReturns #
AlternateBenchmarkReturns ##
Current Value ( ) of Standard Investment of 10,000` `
Benchmark#Alternate
Benchmark##Scheme^
NAV perUnit ( )`
Jan 01, 2013 (Since Inception) 15.7257 10.60% -100.00% 7.50% 14,221 13,327 12,875
Jun 30, 2015 To Jun 30, 2016 20.2710 10.32% -100.00% 7.67%
Jun 30, 2014 To Jun 30, 2015 18.3582 10.42% 9.16% 8.54%
Jun 28, 2013 To Jun 30, 2014 16.4583 11.48% 6.80% 5.89%
NA
Greater than 1 year returns areCompounded AnnualisedReturns. ^Pastperformance may or may not besustained in future # Crisil LiquidFund Index ##1 Year T-Bill
Fund Manager Name: Mr. Harshal Joshi and Mr. Anurag Mittal(w.e.f. 15/09/2015) (w.e.f. 09/11/15)
Scheme Managed: IDFC Cash Fund Regular Plan June 30Growth Option (NAV as on per Unit): 1874.4793`, 2016
PeriodScheme
Returns ^BenchmarkReturns #
AlternateBenchmarkReturns ##
Current Value ( ) of Standard Investment of 10,000` `
Benchmark#Alternate
Benchmark##Scheme^
NAV perUnit ( )`
Jun 04, 2008 (Since Inception) 1000.0000 8.09% 7.71% 6.47% 18,745 18,218 16,594
Jun 30, 2015 To Jun 30, 2016 1734.6971 8.06% 7.90% 7.67%
Jun 30, 2014 To Jun 30, 2015 1593.6246 8.85% 8.77% 8.54% NA
Jun 28, 2013 To Jun 30, 2014 1455.7807 9.41% 9.63% 5.89%
Scheme Managed: IDFC Cash FundOption: Direct Plan Growth (NAV as on , per Unit): 1877.905June 30 2016 `
Greater than 1year returnsareCompounded AnnualisedReturns. ^ Past performancemay ormaynot besustained in future #Crisil LiquidFund Index ##1YearT-Bill
PeriodScheme
Returns ^BenchmarkReturns #
AlternateBenchmarkReturns ##
Current Value ( ) of Standard Investment of 10,000` `
Benchmark#Alternate
Benchmark##Scheme^
NAV perUnit ( )`
NA
Jan 01, 2013 (Since Inception) 1396.8380 8.83% 8.71% 7.50% 13,444 13,388 12,875
Jun 30, 2015 To Jun 30, 2016 1736.5358 8.14% 7.90% 7.67%
Jun 30, 2014 To Jun 30, 2015 1594.4988 8.91% 8.77% 8.54%
Jun 28, 2013 To Jun 30, 2014 1455.8620 9.47% 9.63% 5.89%
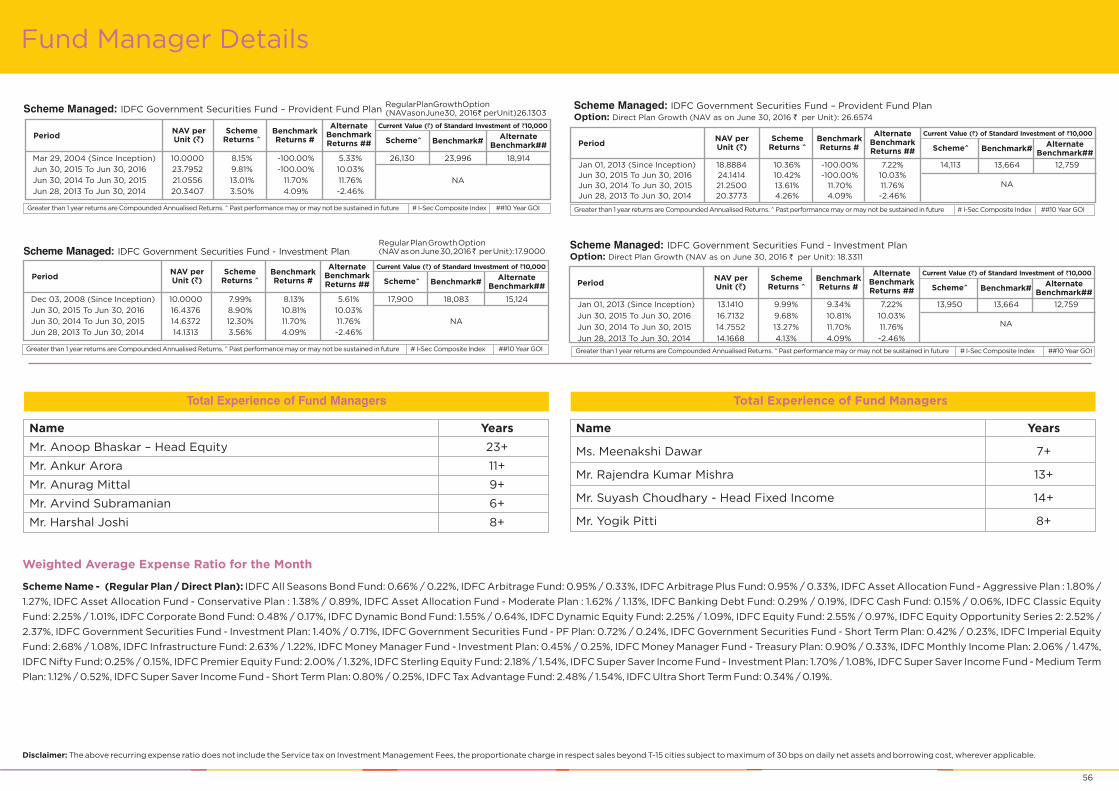
Fund Manager Details
56
Scheme Managed: IDFC Government Securities Fund - Investment Plan
Option: Direct Plan Growth (NAV as on , per Unit):2016 `June 30 18.3311
Greater than 1 year returns are Compounded Annualised Returns. ^ Past performance may or may not be sustained in future # I-Sec Composite Index ##10 Year GOIGreater than 1 year returns are Compounded Annualised Returns. ^ Past performance may or may not be sustained in future # I-Sec Composite Index ##10 Year GOI
Scheme Managed: IDFC Government Securities Fund - Investment PlanRegularPlan
17.9000GrowthOption
(NAVason perUnit):June30,2016`
PeriodScheme
Returns ^BenchmarkReturns #
AlternateBenchmarkReturns ##
Current Value ( ) of Standard Investment of 10,000` `
Benchmark#Alternate
Benchmark##Scheme^
NAV perUnit ( )`
Dec 03, 2008 (Since Inception) 10.0000 7.99% 8.13% 5.61% 17,900 18,083 15,124
Jun 30, 2015 To Jun 30, 2016 16.4376 8.90% 10.81% 10.03%
Jun 30, 2014 To Jun 30, 2015 14.6372 12.30% 11.70% 11.76% NA
Jun 28, 2013 To Jun 30, 2014 14.1313 3.56% 4.09% -2.46%
PeriodScheme
Returns ^BenchmarkReturns #
AlternateBenchmarkReturns ##
Current Value ( ) of Standard Investment of 10,000` `
Benchmark#Alternate
Benchmark##Scheme^
NAV perUnit ( )`
Jan 01, 2013 (Since Inception) 13.1410 9.99% 9.34% 7.22% 13,950 13,664 12,759
Jun 30, 2015 To Jun 30, 2016 16.7132 9.68% 10.81% 10.03%
Jun 30, 2014 To Jun 30, 2015 14.7552 13.27% 11.70% 11.76%
Jun 28, 2013 To Jun 30, 2014 14.1668 4.13% 4.09% -2.46%
NA
Total Experience of Fund Managers
Name Years
Mr. Anoop Bhaskar – Head Equity 23+
Mr. Ankur Arora 11+
Mr. Anurag Mittal 9+
Mr. Arvind Subramanian 6+
Mr. Harshal Joshi 8+
Total Experience of Fund Managers
Name Years
Mr. Suyash Choudhary - Head Fixed Income 14+
Ms. Meenakshi Dawar 7+
Mr. Rajendra Kumar Mishra 13+
Mr. Yogik Pitti 8+
Disclaimer: The above recurring expense ratio does not include the Service tax on Investment Management Fees, the proportionate charge in respect sales beyond T-15 cities subject to maximum of 30 bps on daily net assets and borrowing cost, wherever applicable.
Weighted Average Expense Ratio for the Month
Scheme Name - (Regular Plan / Direct Plan): IDFC All Seasons Bond Fund: 0.66% / 0.22%, IDFC Arbitrage Fund: 0.95% / 0.33%, IDFC Arbitrage Plus Fund: 0.95% / 0.33%,
IDFC Banking Debt Fund: 0.29% / 0.19%, IDFC Cash Fund: 0.15% / 0.06%, IDFC Classic Equity
Fund: 2.25% / 1.01%, IDFC Corporate Bond Fund: 0.48% / 0.17%, IDFC Dynamic Bond Fund: 1.55% / 0.64%, IDFC Dynamic Equity Fund: 2.25% / 1.09%, IDFC Equity Fund: 2.55% / 0.97%, IDFC Equity Opportunity Series 2: 2.52% /
2.37%, IDFC Government Securities Fund - Investment Plan: 1.40% / 0.71%, IDFC Government Securities Fund - PF Plan: 0.72% / 0.24%, IDFC Government Securities Fund - Short Term Plan: 0.42% / 0.23%, IDFC Imperial Equity
Fund: 2.68% / 1.08%, IDFC Infrastructure Fund: 2.63% / 1.22%, IDFC Money Manager Fund - Investment Plan: 0.45% / 0.25%, IDFC Money Manager Fund - Treasury Plan: 0.90% / 0.33%, IDFC Monthly Income Plan: 2.06% / 1.47%,
IDFC Nifty Fund: 0.25% / 0.15%, IDFC Premier Equity Fund: 2.00% / 1.32%, IDFC Sterling Equity Fund: 2.18% / 1.54%, IDFC Super Saver Income Fund - Investment Plan: 1.70% / 1.08%, IDFC Super Saver Income Fund - Medium Term
Plan: 1.12% / 0.52%, IDFC Super Saver Income Fund - Short Term Plan: 0.80% / 0.25%, IDFC Tax Advantage Fund: 2.48% / 1.54%, IDFC Ultra Short Term Fund: 0.34% / 0.19%.
IDFC Asset Allocation Fund - Aggressive Plan : 1.80% /
1.27%, IDFC Asset Allocation Fund - Conservative Plan : 1.38% / 0.89%, IDFC Asset Allocation Fund - Moderate Plan : 1.62% / 1.13%,
RegularPlanGrowthOption(NAVason perUnit)26.1303June30, 2016`
Greater than 1 year returns are Compounded Annualised Returns. ^ Past performance may or may not be sustained in future # I-Sec Composite Index ##10 Year GOI
Scheme Managed: IDFC Government Securities Fund – Provident Fund Plan
PeriodScheme
Returns ^BenchmarkReturns #
AlternateBenchmarkReturns ##
Current Value ( ) of Standard Investment of 10,000` `
Benchmark#Alternate
Benchmark##Scheme^
NAV perUnit ( )`
Mar 29, 2004 (Since Inception) 10.0000 8.15% -100.00% 5.33% 26,130 23,996 18,914
Jun 30, 2015 To Jun 30, 2016 23.7952 9.81% -100.00% 10.03%
Jun 30, 2014 To Jun 30, 2015 21.0556 13.01% 11.70% 11.76% NA
Jun 28, 2013 To Jun 30, 2014 20.3407 3.50% 4.09% -2.46%
Scheme Managed: IDFC Government Securities Fund – Provident Fund Plan
Option: Direct Plan Growth (NAV as on , per Unit): 26.6574June 30 2016 `
Greater than 1 year returns are Compounded Annualised Returns. ^ Past performance may or may not be sustained in future # I-Sec Composite Index ##10 Year GOI
PeriodScheme
Returns ^BenchmarkReturns #
AlternateBenchmarkReturns ##
Current Value ( ) of Standard Investment of 10,000` `
Benchmark#Alternate
Benchmark##Scheme^
NAV perUnit ( )`
Jan 01, 2013 (Since Inception) 18.8884 10.36% -100.00% 7.22% 14,113 13,664 12,759
Jun 30, 2015 To Jun 30, 2016 24.1414 10.42% -100.00% 10.03%
Jun 30, 2014 To Jun 30, 2015 21.2500 13.61% 11.70% 11.76%
Jun 28, 2013 To Jun 30, 2014 20.3773 4.26% 4.09% -2.46%
NA
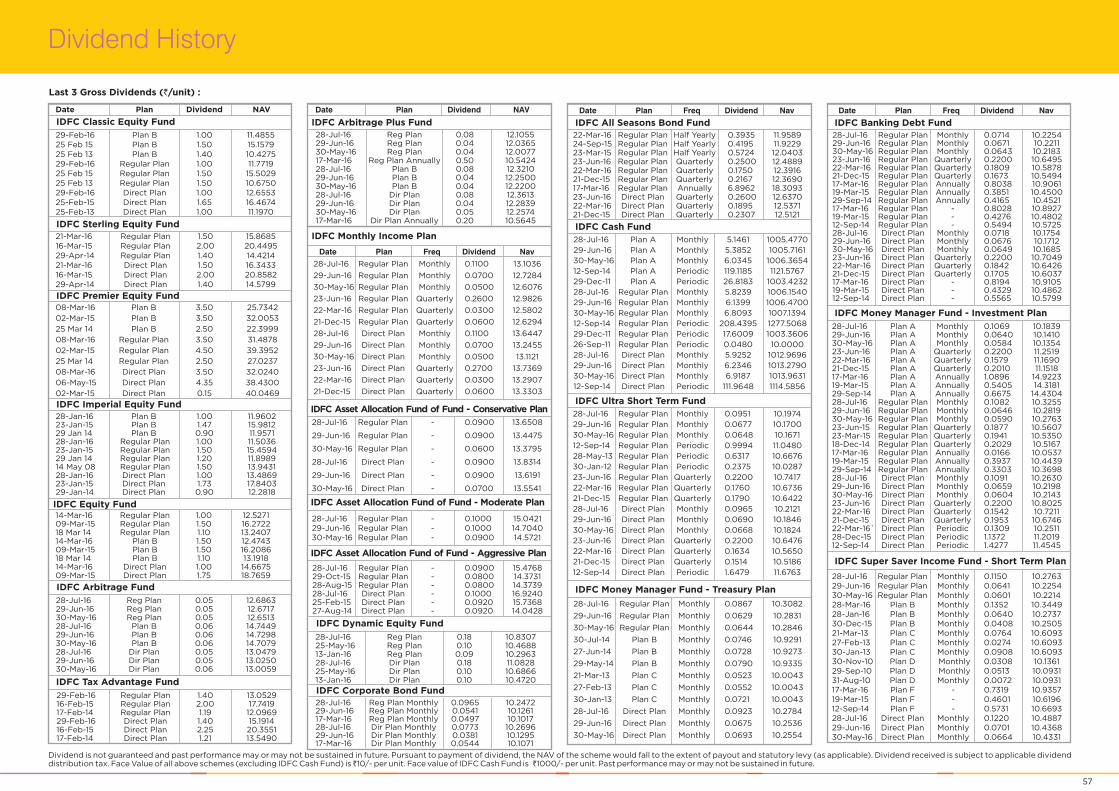
IDFC Tax Advantage Fund
Dividend History
Last 3 Gross Dividends ( /unit) :`
28-Jul-16 Reg Plan 0.08 12.105529-Jun-16 Reg Plan 0.04 12.036530-May-16 Reg Plan 0.04 12.007717-Mar-16 Reg Plan 0.50 10.542428-Jul-16 Plan B 0.08 12.321029-Jun-16 Plan B 0.04 12.250030-May-16 Plan B 0.04 12.220028-Jul-16 Dir Plan 0.08 12.361329-Jun-16 Dir Plan 0.04 12.283930-May-16 Dir Plan 0.05 12.257417-Mar-16 Dir Plan 0.20 10.5645
Annually
AnnuallyIDFC Sterling Equity Fund
IDFC Premier Equity Fund
IDFC Imperial Equity Fund
28-Jan-16 Plan B 1.00 11.960223-Jan-15 Plan B 1.47 15.981229 Jan 14 Plan B 0.90 11.957128-Jan-16 Regular Plan 1.00 11.503623-Jan-15 Regular Plan 1.50 15.459429 Jan 14 Regular Plan 1.20 11.898914 May 08 Regular Plan 1.50 13.943128-Jan-16 Direct Plan 1.00 13.486923-Jan-15 Direct Plan 1.73 17.840329-Jan-14 Direct Plan 0.90 12.2818
21-Mar-16 Regular Plan 1.50 15.8685
16-Mar-15 Regular Plan 2.00 20.4495
29-Apr-14 Regular Plan 1.40 14.4214
21-Mar-16 Direct Plan 1.50 16.3433
16-Mar-15 Direct Plan 2.00 20.8582
29-Apr-14 Direct Plan 1.40 14.5799
29-Feb-16 Plan B 1.00 11.4855
25 Feb 15 Plan B 1.50 15.1579
25 Feb 13 Plan B 1.40 10.4275
29-Feb-16 Plan 1.00 11.7719
25 Feb 15 Plan 1.50 15.5029
25 Feb 13 Regular Plan 1.50 10.6750
29-Feb-16 Plan 1.00 12.6553
25-Feb-15 Direct Plan 1.65 16.4674
25-Feb-13 Direct Plan 1.00 11.1970
Regular
Regular
Direct
08-Mar-16 Plan B 3.50 25.7342
02-Mar-15 Plan B 3.50 32.0053
25 Mar 14 Plan B 2.50 22.3999
08-Mar-16 Regular Plan 3.50 31.4878
02-Mar-15 Regular Plan 4.50 39.3952
25 Mar 14 Regular Plan 2.50 27.0237
08-Mar-16 Direct Plan 3.50 32.0240
06-May-15 Direct Plan 4.35 38.4300
02-Mar-15 Direct Plan 0.15 40.0469
14-Mar-16 Regular Plan 1.00 12.527109-Mar-15 Regular Plan 1.50 16.272218 Mar 14 Regular Plan 1.10 13.240714-Mar-16 Plan B 1.50 12.474309-Mar-15 Plan B 1.50 16.208618 Mar 14 Plan B 1.10 13.191814-Mar-16 Direct Plan 1.00 14.667509-Mar-15 Direct Plan 1.75 18.7659
IDFC Equity Fund
IDFC Arbitrage Plus Fund
Date Plan Freq Dividend Nav
IDFC Monthly Income Plan
IDFC Asset Allocation Fund of Fund - Conservative Plan
IDFC Asset Allocation Fund of Fund - Aggressive Plan
IDFC Asset Allocation Fund of Fund - Moderate Plan
28-Jul-16 Regular Plan Monthly 0.1100 13.1036
29-Jun-16 Regular Plan Monthly 0.0700 12.7284
30-May-16 Regular Plan Monthly 0.0500 12.6076
23-Jun-16 Regular Plan Quarterly 0.2600 12.9826
22-Mar-16 Regular Plan Quarterly 0.0300 12.5802
21-Dec-15 Regular Plan Quarterly 0.0600 12.6294
28-Jul-16 Direct Plan Monthly 0.1100 13.6447
29-Jun-16 Direct Plan Monthly 0.0700 13.2455
30-May-16 Direct Plan Monthly 0.0500 13.1121
23-Jun-16 Direct Plan Quarterly 0.2700 13.7369
22-Mar-16 Direct Plan Quarterly 0.0300 13.2907
21-Dec-15 Direct Plan Quarterly 0.0600 13.3303
28-Jul-16 Regular Plan - 0.0900 13.6508
29-Jun-16 Regular Plan - 0.0900 13.4475
30-May-16 Regular Plan - 0.0600 13.3795
28-Jul-16 Direct Plan - 0.0900 13.8314
29-Jun-16 Direct Plan - 0.0900 13.6191
30-May-16 Direct Plan - 0.0700 13.5541
28-Jul-16 Regular Plan - 0.0900 15.476829-Oct-15 Regular Plan - 0.0800 14.373128-Aug-15 Regular Plan - 0.0800 14.373928-Jul-16 Direct Plan - 0.1000 16.924025-Feb-15 Direct Plan - 0.0920 15.736827-Aug-14 Direct Plan - 0.0920 14.0428
28-Jul-16 Regular Plan - 0.1000 15.042129-Jun-16 Regular Plan - 0.1000 14.704030-May-16 Regular Plan - 0.0900 14.5721
28-Jul-16 Reg Plan 0.05 12.686329-Jun-16 Reg Plan 0.05 12.671730-May-16 Reg Plan 0.05 12.651328-Jul-16 Plan B 0.06 14.744929-Jun-16 Plan B 0.06 14.729830-May-16 Plan B 0.06 14.707928-Jul-16 Dir Plan 0.05 13.047929-Jun-16 Dir Plan 0.05 13.025030-May-16 Dir Plan 0.06 13.0059
IDFC Arbitrage Fund
Date Plan Dividend NAV Date Plan Dividend NAV Date Plan Freq NavDividend
22-Mar-16 Regular Plan Half Yearly 0.3935 11.958924-Sep-15 Regular Plan Half Yearly 0.4195 11.922923-Mar-15 Regular Plan Half Yearly 0.5724 12.040323-Jun-16 Regular Plan Quarterly 0.2500 12.488922-Mar-16 Regular Plan Quarterly 0.1750 12.391621-Dec-15 Regular Plan Quarterly 0.2167 12.369017-Mar-16 Regular Plan Annually 6.8962 18.309323-Jun-16 Direct Plan Quarterly 0.2600 12.637022-Mar-16 Direct Plan Quarterly 0.1895 12.537121-Dec-15 Direct Plan Quarterly 0.2307 12.5121
IDFC Classic Equity Fund IDFC All Seasons Bond Fund
IDFC Cash Fund
IDFC Ultra Short Term Fund
IDFC Money Manager Fund - Treasury Plan
28-Jul-16 Plan A Monthly 5.1461 1005.4770
29-Jun-16 Plan A Monthly 5.3852 1005.7161
30-May-16 Plan A Monthly 6.0345 1006.3654
12-Sep-14 Plan A Periodic 119.1185 1121.5767
29-Dec-11 Plan A Periodic 26.8183 1003.4232
28-Jul-16 Regular Plan Monthly 5.8239 1006.1540
29-Jun-16 Regular Plan Monthly 6.1399 1006.4700
30-May-16 Regular Plan Monthly 6.8093 1007.1394
12-Sep-14 Regular Plan Periodic 208.4395 1277.5068
29-Dec-11 Regular Plan Periodic 17.6009 1003.3606
26-Sep-11 Regular Plan Periodic 0.0480 10.0000
28-Jul-16 Direct Plan Monthly 5.9252 1012.9696
29-Jun-16 Direct Plan Monthly 6.2346 1013.2790
30-May-16 Direct Plan Monthly 6.9187 1013.9631
12-Sep-14 Direct Plan Periodic 111.9648 1114.5856
28-Jul-16 Regular Plan Monthly 0.0951 10.1974
29-Jun-16 Regular Plan Monthly 0.0677 10.1700
30-May-16 Regular Plan Monthly 0.0648 10.1671
12-Sep-14 Regular Plan Periodic 0.9994 11.0480
28-May-13 Regular Plan Periodic 0.6317 10.6676
30-Jan-12 Regular Plan Periodic 0.2375 10.0287
23-Jun-16 Regular Plan Quarterly 0.2200 10.7417
22-Mar-16 Regular Plan Quarterly 0.1760 10.6736
21-Dec-15 Regular Plan Quarterly 0.1790 10.6422
28-Jul-16 Direct Plan Monthly 0.0965 10.2121
29-Jun-16 Direct Plan Monthly 0.0690 10.1846
30-May-16 Direct Plan Monthly 0.0668 10.1824
23-Jun-16 Direct Plan Quarterly 0.2200 10.6476
22-Mar-16 Direct Plan Quarterly 0.1634 10.5650
21-Dec-15 Direct Plan Quarterly 0.1514 10.5186
12-Sep-14 Direct Plan Periodic 1.6479 11.6763
28-Jul-16 Regular Plan Monthly 0.0867 10.3082
29-Jun-16 Regular Plan Monthly 0.0629 10.2831
30-May-16 Regular Plan Monthly 0.0644 10.2846
30-Jul-14 Plan B Monthly 0.0746 10.9291
27-Jun-14 Plan B Monthly 0.0728 10.9273
29-May-14 Plan B Monthly 0.0790 10.9335
21-Mar-13 Plan C Monthly 0.0523 10.0043
27-Feb-13 Plan C Monthly 0.0552 10.0043
30-Jan-13 Plan C Monthly 0.0721 10.0043
28-Jul-16 Direct Plan Monthly 0.0923 10.2784
29-Jun-16 Direct Plan Monthly 0.0675 10.2536
30-May-16 Direct Plan Monthly 0.0693 10.2554
Date Plan Freq NavDividend
IDFC Banking Debt Fund
IDFC Money Manager Fund - Investment Plan
IDFC Super Saver Income Fund - Short Term Plan
28-Jul-16 Regular Plan Monthly 0.0714 10.225429-Jun-16 Regular Plan Monthly 0.0671 10.221130-May-16 Regular Plan Monthly 0.0643 10.218323-Jun-16 Regular Plan Quarterly 0.2200 10.649522-Mar-16 Regular Plan Quarterly 0.1809 10.587821-Dec-15 Regular Plan Quarterly 0.1673 10.549417-Mar-16 Regular Plan Annually 0.8038 10.906119-Mar-15 Regular Plan Annually 0.3851 10.450029-Sep-14 Regular Plan Annually 0.4165 10.452117-Mar-16 Regular Plan - 0.8028 10.892719-Mar-15 Regular Plan - 0.4276 10.480212-Sep-14 Regular Plan - 0.5494 10.572528-Jul-16 Direct Plan Monthly 0.0718 10.175429-Jun-16 Direct Plan Monthly 0.0676 10.171230-May-16 Direct Plan Monthly 0.0649 10.168523-Jun-16 Direct Plan Quarterly 0.2200 10.704922-Mar-16 Direct Plan Quarterly 0.1842 10.642621-Dec-15 Direct Plan Quarterly 0.1705 10.603717-Mar-16 Direct Plan - 0.8194 10.910519-Mar-15 Direct Plan - 0.4329 10.486212-Sep-14 Direct Plan - 0.5565 10.5799
28-Jul-16 Plan A Monthly 0.1069 10.183929-Jun-16 Plan A Monthly 0.0640 10.141030-May-16 Plan A Monthly 0.0584 10.135423-Jun-16 Plan A Quarterly 0.2200 11.251922-Mar-16 Plan A Quarterly 0.1579 11.169021-Dec-15 Plan A Quarterly 0.2010 11.151817-Mar-16 Plan A Annually 1.0896 14.922319-Mar-15 Plan A Annually 0.5405 14.318129-Sep-14 Plan A Annually 0.6675 14.430428-Jul-16 Regular Plan Monthly 0.1082 10.325529-Jun-16 Regular Plan Monthly 0.0646 10.281930-May-16 Regular Plan Monthly 0.0590 10.276323-Jun-15 Regular Plan Quarterly 0.1877 10.560723-Mar-15 Regular Plan Quarterly 0.1941 10.535018-Dec-14 Regular Plan Quarterly 0.2029 10.516717-Mar-16 Regular Plan Annually 0.0166 10.053719-Mar-15 Regular Plan Annually 0.3937 10.443929-Sep-14 Regular Plan Annually 0.3303 10.369828-Jul-16 Direct Plan Monthly 0.1091 10.263029-Jun-16 Direct Plan Monthly 0.0659 10.219830-May-16 Direct Plan Monthly 0.0604 10.214323-Jun-16 Direct Plan Quarterly 0.2200 10.802522-Mar-16 Direct Plan Quarterly 0.1542 10.721121-Dec-15 Direct Plan Quarterly 0.1953 10.674622-Mar-16` Direct Plan Periodic 0.1309 10.251128-Dec-15 Direct Plan Periodic 1.1372 11.201912-Sep-14 Direct Plan Periodic 1.4277 11.4545
28-Jul-16 Regular Plan Monthly 0.1150 10.276329-Jun-16 Regular Plan Monthly 0.0641 10.225430-May-16 Regular Plan Monthly 0.0601 10.221428-Mar-16 Plan B Monthly 0.1352 10.344928-Jan-16 Plan B Monthly 0.0640 10.273730-Dec-15 Plan B Monthly 0.0408 10.250521-Mar-13 Plan C Monthly 0.0764 10.609327-Feb-13 Plan C Monthly 0.0274 10.609330-Jan-13 Plan C Monthly 0.0908 10.609330-Nov-10 Plan D Monthly 0.0308 10.136129-Sep-10 Plan D Monthly 0.0513 10.093131-Aug-10 Plan D Monthly 0.0072 10.093117-Mar-16 Plan F - 0.7319 10.935719-Mar-15 Plan F - 0.4601 10.619612-Sep-14 Plan F - 0.5731 10.669328-Jul-16 Direct Plan Monthly 0.1220 10.488729-Jun-16 Direct Plan Monthly 0.0701 10.436830-May-16 Direct Plan Monthly 0.0664 10.4331
Dividend is not guaranteed and past performance may or may not be sustained in future. Pursuant to payment of dividend, the NAV of the scheme would fall to the extent of payout and statutory levy (as applicable). Dividend received is subject to applicable dividenddistribution tax. Face Value of all above schemes (excluding IDFC Cash Fund) is 10/- per unit. Face value of IDFC Cash Fund is 1000/- per unit. Past performance may or may not be sustained in future.` `
57
28-Jul-16 Reg Plan 0.18 10.830725-May-16 Reg Plan 0.10 10.468813-Jan-16 Reg Plan 0.09 10.296328-Jul-16 Dir Plan 0.18 11.082825-May-16 Dir Plan 0.10 10.686613-Jan-16 Dir Plan 0.10 10.4720
28-Jul-16 Reg Plan Monthly 0.0965 10.247229-Jun-16 Reg Plan Monthly 0.0541 10.126117-Mar-16 Reg Plan Monthly 0.0497 10.101728-Jul-16 Dir Plan Monthly 0.0773 10.269629-Jun-16 Dir Plan Monthly 0.0381 10.129517-Mar-16 Dir Plan Monthly 0.0544 10.1071
IDFC Dynamic Equity Fund
IDFC Corporate Bond Fund29-Feb-16 Regular Plan 1.40 13.052916-Feb-15 Regular Plan 2.00 17.741917-Feb-14 Regular Plan 1.19 12.096929-Feb-16 Direct Plan 1.40 15.191416-Feb-15 Direct Plan 2.25 20.355117-Feb-14 Direct Plan 1.21 13.5490

Dividend History
7258
ICRA Credit Risk Rating
CRISIL Credit Quality Rating
CRISIL Credit Quality Rating Methodology
FITCH Credit Quality Rating
IDFC MMF-TP, IDFC MMF-IP, IDFC SSIF-ST, SSIF-MT, IDFC CBF : “Credit Risk Rating
AAAmfs”
IDFC CASH FUND, IDFC USTF: “Credit Risk Rating A1+mfs” -
Source: ICRA Ltd.
IDFC SSIF-IP, IDFC DBF: “CRISIL AAA mfs”
- The Fund carries the lowest credit risk, similar to that associated with long-
term debt obligations rated in the highest credit- quality category.
The highest-credit-
quality short-term rating assigned by ICRA to debt funds. Debt funds rated in this
category carry the lowest credit risk in the short term and are similar to that of fixed
income obligations of highest credit- quality category with maturity of upto one year.
This rating should however, not be construed as an indication of the performance of the
Mutual Fund scheme or of volatility in its returns.
- Schemes with this rating are considered to
have the highest degree of safety regarding timely receipt of payments from the
investments that they have made. The rating of CRISIL is not an opinion on the Asset
Management Company's willingness or ability to make timely payments to the investor.
The rating is also not an opinion on the stability of the NAV of the Fund, which could vary
with market developments.
CRISIL's credit quality ratings are based on the analysis of the credit risk of securities
held by the fund. CRISIL has developed a Credit Quality Matrix to evaluate fund's overall
level of protection against losses associated with credit default. The matrix is a set of
credit factors and credit scores derived scientifically from CRISIL's rating default and
transition rates. For details on closed ended funds, please refer the website
www.idfcmf.com
IDFC Cash fund: “IND A1+ mfs” - Schemes with this rating are considered to have very
strong degree of safety regarding timely receipt of payments from the investments that
they have made.
Date Plan Freq Dividend Nav Date Plan Freq NavDividend
IDFC Super Saver Income Fund - Medium Term Plan IDFC Dynamic Bond Fund
IDFC Super Saver Income Fund - Investment Plan
IDFC Government Securities Fund - Provident Fund Plan
IDFC Government Securities Fund – Investment Plan
28-Jul-16 Regular Plan Monthly 0.1499 10.3043
29-Jun-16 Regular Plan Monthly 0.0692 10.2236
30-May-16 Regular Plan Monthly 0.0575 10.2119
28-Jul-16 Regular Plan BiMonthly 0.1800 11.5339
30-May-16 Regular Plan BiMonthly 0.1500 11.4392
28-Mar-16 Regular Plan BiMonthly 0.1037 11.3636
23-Jun-16 Regular Plan Quarterly 0.2100 10.8396
22-Mar-16 Regular Plan Quarterly 0.1517 10.7599
21-Dec-15 Regular Plan Quarterly 0.1665 10.7166
30-May-13 Plan B Monthly 0.0801 10.1112
29-Apr-13 Plan B Monthly 0.1313 10.0719
21-Mar-13 Plan B Monthly 0.0678 10.0547
30-Mar-11 Plan B Annually 0.1464 11.4327
17-Mar-16 Plan B - 0.4962 10.7933
19-Mar-15 Plan B - 0.6050 10.6657
12-Sep-14 Plan B - 1.6497 12.1533
29-Sep-11 Plan B - 0.5472 11.4526
17-Mar-16 Plan F - 0.7034 10.8100
19-Mar-15 Plan F - 0.6020 10.6626
12-Sep-14 Plan F - 0.7087 10.7411
28-Jul-16 Direct Plan Monthly 0.1589 10.5843
29-Jun-16 Direct Plan Monthly 0.0762 10.5016
30-May-16 Direct Plan Monthly 0.0646 10.4900
23-Jun-16 Direct Plan Quarterly 0.2200 10.9483
22-Mar-16 Direct Plan Quarterly 0.1678 10.8661
21-Dec-15 Direct Plan Quarterly 0.1816 10.8197
28-Jul-16 Direct Plan BiMonthly 0.1900 11.8053
30-May-16 Direct Plan BiMonthly 0.1700 11.7135
28-Mar-16 Direct Plan BiMonthly 0.1156 11.6335
23-Jun-16 Plan A Quarterly 0.2400 12.402322-Mar-16 Plan A Quarterly 0.1429 12.271821-Dec-15 Plan A Quarterly 0.0655 12.142317-Mar-16 Plan A Annually 7.7627 18.995730-Mar-09 Plan A Annually 1.0440 11.146217-Mar-16 Regular Plan - 0.4301 10.554309-Mar-15 Regular Plan - 1.0833 11.158312-Sep-14 Regular Plan - 1.0442 11.091923-Jun-16 Regular Plan Quarterly 0.2200 10.951322-Mar-16 Regular Plan Quarterly 0.1345 10.835021-Dec-15 Regular Plan Quarterly 0.0655 10.719217-Mar-16 Regular Plan Annually 0.4466 10.964219-Mar-15 Regular Plan Annually 0.7439 11.210629-Sep-14 Regular Plan Annually 0.5331 10.678122-Mar-16 Regular Plan Half Yearly 0.1925 10.410724-Sep-15 Regular Plan Half Yearly 0.1695 10.342823-Mar-15 Regular Plan Half Yearly 1.0483 11.146617-Mar-16 Direct Plan - 0.6250 12.800119-Mar-15 Direct Plan - 0.5345 12.647528-May-13 Direct Plan - 0.4721 11.273523-Jun-16 Direct Plan Quarterly 0.2800 12.736422-Mar-16 Direct Plan Quarterly 0.1811 12.598121-Dec-15 Direct Plan Quarterly 0.0991 12.459317-Mar-16 Direct Plan Annually 1.8150 12.750729-Sep-14 Direct Plan Annually 0.5000 11.373719-Mar-13 Direct Plan Annually 0.1379 10.303822-Mar-16 Direct Plan Half Yearly 0.2370 10.547624-Sep-15 Direct Plan Half Yearly 0.2143 10.477423-Mar-15 Direct Plan Half Yearly 1.0224 11.2063
23-Jun-16 Regular Plan Quarterly 0.2300 11.766922-Mar-16 Regular Plan Quarterly 0.1348 11.640621-Dec-15 Regular Plan Quarterly 0.0666 11.520722-Mar-16 Regular Plan Half Yearly 0.2008 11.538324-Sep-15 Regular Plan Half Yearly 0.1803 11.466423-Mar-15 Regular Plan Half Yearly 1.1453 12.348817-Mar-16 Regular Plan Annually 7.5057 18.532130-Mar-09 Regular Plan Annually 0.9347 10.941328-May-13 Plan B - 0.3128 10.714019-Mar-13 Plan B - 1.5078 10.559829-Dec-11 Plan B - 0.3181 10.525712-Sep-14 Plan C - 0.7452 13.049028-May-13 Plan C - 0.2606 12.588719-Mar-13 Plan C - 1.0118 12.301223-Jun-16 Direct Plan Quarterly 0.2500 12.108722-Mar-16 Direct Plan Quarterly 0.1546 11.976821-Dec-15 Direct Plan Quarterly 0.0833 11.850717-Mar-16 Direct Plan Annually 0.6437 15.685919-Mar-15 Direct Plan Annually 1.6648 16.632629-Sep-14 Direct Plan Annually 0.8160 15.8272
23-Jun-16 Regular Plan Quarterly 0.2900 12.475822-Mar-16 Regular Plan Quarterly 0.1551 12.294121-Dec-15 Regular Plan Quarterly 0.0960 12.171217-Mar-16 Regular Plan Annually 0.4930 11.510719-Mar-15 Regular Plan Annually 1.2994 12.248529-Sep-14 Regular Plan Annually 0.6237 11.606523-Jun-16 Plan B Quarterly 0.2700 11.707322-Mar-16 Plan B Quarterly 0.1386 11.537621-Dec-15 Plan B Quarterly 0.0836 11.423517-Mar-16 Direct Plan Annually 0.6007 12.791519-Mar-15 Direct Plan Annually 1.4679 13.580329-Sep-14 Direct Plan Annually 0.7114 12.891223-Jun-16 Direct Plan Quarterly 0.3200 12.899222-Mar-16 Direct Plan Quarterly 0.1805 12.711721-Dec-15 Direct Plan Quarterly 0.1130 12.576322-Mar-16 Direct Plan Periodic 0.4000 11.8919
22-Mar-16 Plan A Half Yearly 0.1911 11.649124-Sep-15 Plan A Half Yearly 0.1679 11.568023-Mar-15 Plan A Half Yearly 1.2500 12.563323-Jun-16 Plan A Quarterly 0.3200 14.726622-Mar-16 Plan A Quarterly 0.1648 14.525621-Dec-15 Plan A Quarterly 0.0826 14.371117-Mar-16 Plan A Annually 7.4862 19.422623-Jun-16 Regular Plan Quarterly 0.2400 11.320122-Mar-16 Regular Plan Quarterly 0.1267 11.165621-Dec-15 Regular Plan Quarterly 0.0635 11.046817-Mar-16 Regular Plan Annually 0.3913 10.767919-Mar-15 Regular Plan Annually 0.9708 11.287529-Sep-14 Regular Plan Annually 0.5447 10.702517-Mar-16 Regular Plan - 0.3826 10.525719-Mar-15 Regular Plan - 0.7667 11.223412-Sep-14 Regular Plan - 0.7194 10.765622-Mar-16 Regular Plan Half Yearly 0.1758 10.718124-Sep-15 Regular Plan Half Yearly 0.1551 10.644023-Mar-15 Regular Plan Half Yearly 0.3397 10.749019-Sep-14 Direct Plan Half Yearly 0.5519 10.690407-Mar-14 Direct Plan Half Yearly 0.3463 10.405625-Sep-13 Direct Plan Half Yearly 0.0787 10.093523-Jun-16 Direct Plan Quarterly 0.2500 10.990822-Mar-16 Direct Plan Quarterly 0.1400 10.838621-Dec-15 Direct Plan Quarterly 0.0775 10.720517-Mar-16 Direct Plan - 0.4972 11.421919-Mar-15 Direct Plan - 1.3677 12.226912-Sep-14 Direct Plan - 1.9068 12.800517-Mar-16 Direct Plan Annually 0.2866 11.628207-Mar-14 Direct Plan Annually 0.1788 10.5354
28-Jul-16 Regular Plan Monthly 0.1236 10.527929-Jun-16 Regular Plan Monthly 0.0786 10.482930-May-16 Regular Plan Monthly 0.0726 10.476923-Jun-16 Regular Plan Quarterly 0.2300 10.810222-Mar-16 Regular Plan Quarterly 0.1898 10.745521-Dec-15 Regular Plan Quarterly 0.2107 10.731228-Jul-16 Direct Plan Monthly 0.1261 10.613229-Jun-16 Direct Plan Monthly 0.0808 10.567930-May-16 Direct Plan Monthly 0.0749 10.562023-Jun-16 Direct Plan Quarterly 0.2400 11.075322-Mar-16 Direct Plan Quarterly 0.1994 11.008521-Dec-15 Direct Plan Quarterly 0.2204 10.9929
IDFC Government Securities Fund - Short Term Plan
Date Plan Freq NavDividend
30-Nov-15 1.00 11.9617Regular PlanRegular PlanRegular PlanDirectDirectDirect
25-Feb-15 1.50 13.122805-Nov-14 1.50 13.998530-Nov-15 Plan 1.00 12.210725-Feb-15 Plan 1.50 13.337905-Nov-14 Plan 1.50 14.1521
IDFC Equity Opportunity Series-2

How to read Factsheet
Fund Manager
Application Amount for Fresh Subscription
Minimum Additional Amount
Yield to Maturity
SIP
NAV
Benchmark
Entry Load
An employee of the asset management company such as a mutual fund or life insurer,
who manages investments of the scheme. He is usually part of a larger team of fund
managers and research analysts.
This is the minimum investment amount for a new investor in a mutual fund scheme,
This is the minimum investment amount for an existing investor in a mutual fund scheme.
The Yield to Maturity or the YTM is the rate of return anticipated on a bond if held until
maturity. YTM is expressed as an annual rate. The YTM factors in the bond's current
market price, par value, coupon interest rate and time to maturity.
SIP or systematic investment plan works on the principle of making periodic investments
of a fixed sum. It works similar to a recurring bank deposit. For instance, an investor may
opt for an SIP that invests Rs 500 every 15th of the month in an equity fund for a period of
three years.
The NAV or the net asset value is the total asset value per unit of the mutual fund after
deducting all related and permissible expenses. The NAV is calculated at the end of every
business day. It is the value at which the investor enters or exits the mutual fund.
A group of securities, usually a market index, whose performance is used as a standard or
benchmark to measure investment performance of mutual funds, among other
investments. Some typical benchmarks include the Nifty, Sensex, BSE200, BSE500, 10-
Year Gsec.
A mutual fund may have a sales charge or load at the time of entry and/or exit to
compensate the distributor/agent. Entry load is charged at the time an investor
purchases the units of a mutual fund. The entry load is added to the prevailing NAV at the
time of investment. For instance, if the NAV is Rs. 100 and the entry load is 1%, the investor
will enter the fund at Rs 101.
Note: SEBI, vide circular dated June 30, 2009 has abolished entry loan and mandated
that the upfront commission to distributors will be paid by the investor directly to the
distributor, based on his assessment of various factors including the services rendered by
the distributor.
Exit Load
Modified Duration
Standard Deviation
Sharpe Ratio
Beta
AUM
Holdings
Nature of Scheme
Rating Profile
Exit load is charged at the time an investor redeems the units of a mutual fund. The exit
load is deducted from the prevailing NAV at the time of redemption. For instance, if the
NAV is Rs 100 and the exit load is 1%, the redemption price would be Rs.99 per unit.
Modified duration is the price sensitivity and the percentage change in price for a unit
change in yield
Standard deviation is a statistical measure of the range of an investment's performance.
When a mutual fund has a high standard deviation, its means its range of performance is
wide, implying greater volatility.
The Sharpe Ratio, named after its founder, the Nobel Laureate William Sharpe, is a
measure of risk-adjusted returns. It is calculated using standard deviation and excess
return to determine reward per unit of risk.
Beta is a measure of an investment's volatility vis-a-vis the market. Beta of less than 1
means that the security will be less volatile than the market. A beta of greater than 1
implies that the security's price will be more volatile than the market.
AUM or assets under management refers to the recent / updated cumulative market
value of investments managed by a mutual fund or any investment firm.
The holdings or the portfolio is a mutual fund's latest or updated reported statement of
investments/securities. These are usually displayed in terms of percentage to net assets
or the rupee value or both. The objective is to give investors an idea of where their money
is being invested by the fund manager.
The investment objective and underlying investments determine the nature of the
mutual fund scheme. For instance, a mutual fund that aims at generating capital
appreciation by investing in stock markets is an equity fund or growth fund. Likewise, a
mutual fund that aims at capital preservation by investing in debt markets is a debt fund
or income fund. Each of these categories may have sub-categories.
Mutual funds invest in securities after evaluating their creditworthiness as disclosed by
the ratings. A depiction of the mutual fund in various investments based on their ratings
becomes the rating profile of the fund. Typically, this is a feature of debt funds.

To invest, SMSINV space <amount>space <schemecode> to 56767267
To redeem SMSRED space <amount>space <schemecode> to 56767267
To Register for SIP,SMS*SIP space <amount>space <schemecode> to 56767267
*Applicable only after successful registration for purchases under SMS transact.
Now, invest on thego with m-transact.
The SMS facility, withwhich you can invest in justtwo simple steps in all theOpen-ended schemes.
A confirmation SMS and letter will be sent tothe investor confirming activation of theservices. Post which you can start using theservices under the facility through SMS. addendums

www.idfcmf.com
IDFC AMC Offices
WEST
Ahmedabad : B Wing, 3rd Floor, Chandan House Opp Gruh Finance, Mithakhali Six Roads, Law Garden, Ahmedabad
380006.
Bhopal : Plot No. 49, First Floor, Above Tata Capital Limited, M P Nagar, Zone II, Bhopal [M.P.] - 462011.
Goa : F -27 & F -28, 1st Floor, Alfran Plaza, M.G Road, Opp. Don Bosco High School, Panjim - Goa. 403001, Tel.: +91-0832-6631022.
Indore : 405, 4th Floor, 21/ 1, D. M. Tower, Race Course Road, Indore - 452 001. Tel.: +91-731-4206927/ 4208048. Fax: +91-731-4206923.
Mumbai : ‘One IndiaBulls Centre’ 6th Floor, Jupiter Mills Compound, 841, Senapati Bapat Marg, Elphinstone (W) Mumbai – 400013. Tel No.
6628 9999
Nagpur : Fortune Business Centre, First Floor, 6, VasantVihar, W. H. C. Rd., Shankar Nagar, Nagpur - 440 010. Tel.: +91-712-6451428/ 2525657.
Nasik : Shop No - 6, Rajvee Enclave, New Pandit Colony, Off Sharanpur Road, Nasik - 422002. 0253-2314611. 9823456183.
Pune : 1st Floor, Dr. Herekar Park Building, Next to Kamala Nehru Park, Off. Bhandarkar Road, Pune - 411 004. Tel.: +91-20-66020965/ 4.
Raipur : T-19,III Floor, Raheja Tower, Near Hotel Celebration, Jail Road, Raipur (C G) - 492001. Tel: 0771-6900699.
Rajkot : “Star Plaza”, 2nd Floor, Office No. 201, Phulchab Chowk, Rajkot - 360 001. Tel.: +91-281-6626012.
Surat : U 15/16, Jolly Plaza, Athvagate, Surat - 395 001. Tel.: +91-261-2475060, 2475070.
Vadodara : 301, 2nd Floor, Earth Complex, Opposite Vaccine Ground, Above Indian Overseas Bank, Old Padra Road, Vadodara - 380015. Tel No.:
0265 - 2339623/2339624/2339325.
NORTH
Agra : Office No. 307A, 3rd Floor, Block #38/4A, Sumriddhi Business Suites, Sanjay Place, Agra - 282 002. Tel.:+91- 562-4064889
Amritsar : 6-FUF, 4th Floor Central Mall, Mall Road, Amritsar - 143001. Tel.:+911835030393.
Chandigarh : SCO 2475 - 76, 1st Floor, Sector 22, Chandigarh - 160 022. Tel.: +91 17 2507 1918 /5071919, Fax: +91-172-5071918.
Dehradun : G-12 B NCR Plaza, Ground Floor, 24 A, 112/28, Ravindranath Tagore Marg, New Cantt Road, Dehradun-248001. Mobile: 9897934555,
8171872220
Jaipur : 301-A, 3rd Floor, Ambition Tower, Agersen Circle, Malan Ka Chaurah, Subash Marg, C-Scheme, Jaipur - 302 001. Tel. No. : +91-0141-
2360945, 2360947, 2360948
Jalandhar : 1st floor, Satnam Complex, BMC Chowk, G.T.Road, Jalandhar-144001. Punjab-India. Tel.: 01815018264.
Kanpur : Office No. 214-215, IInd Floor, KAN Chambers, 14/113, Civil Lines, Kanpur - 208 001. Tel.: +91-512-2331071, 2331119.
Lucknow : 1st floor, Aryan Business Park, Exchange Cottage, 90.M.G. Marg, Park Road, Lucknow-226001, Mob: 9792999940, 0522-4928100
- 106, 0522-6888012
Ludhiana : SCO 122, 2nd Floor, Feroze Gandhi Market, Ludhiana - 140 001. Tel.: +911615022155.
New Delhi : 4th Floor, NarainManzil, 23, Barakhamba Road, New Delhi - 110 001. Tel.: +91-11-47311301/ 02/ 03/ 04/ 05.
Varanasi : 3rd Floor, Kuber Complex, Rathyatra Varanasi - 221010. Tel.:0542-2226527,6540214.
SOUTH
Bangalore : 6th Floor, East Wing, Raheja Towers, #26 & 27, M. G. Road, Bangalore - 560 001. Tel.: +91-80-43079000/ 01/ 02/ 03, Fax - +91-80-
43079009.
Chennai : KRM Tower, 8th floor, No. 1, Harrington Road, Chetpet, Chennai - 600 031. Tel.: +91-44-45644201/ 202.
Cochin : 39/3993 B2, Gr. Floor, Vantage Point, VRM Rd, Ravipuram, Cochin - 682 016. Tel: +91-484-3012639/ 4029291, Fax: +91-484-2358639.
Coimbatore : Red Rose Plaza, 509 H, II Floor, D. B. Road, R. S. Puram, Coimbatore - 641 002. Tel.: +91-422-2542645, 2542678.
Hyderabad : 6-3-885/7/C/2/S2, 2nd Floor, Amit Plaza, Somajiguda, Hyderabad - 500 082. Tel. No. : +91-40-42014646/47 Fax: +91-40-40037521.
Madurai : No.278, 1st Floor, Nadar Lane, North Perumal Maistry Street, Madurai - 625 001. 0452-6455530.
Mangalore : Shop No 4, Ground Floor, Raj Towers, Balmatta Road, Mangalore – 575001. Tel. : +91 9845287279.
Trivandrum : T.C.2/3262(6), 1st Floor, RS Complex, Opposite LIC Building, Pattom P O, Trivandrum - 695 004. 9809053381.
EAST
Bhubaneswar : Shop No. 208, 2nd Floor, Janpath Tower, Ashok Nagar, Bhubaneswar - 751 009.
Guwahati : 4E, 4th Floor, Ganapati Enclave, G. S. Road, Ulubari, Opp. Bora Service Station, Guwahati - 781 007. Mobile: 9207410763, 9207410764,
9207410765, 9207410766.
Jamshedpur : IDFC Mutual Fund, Room No.111, 1st Floor, Yashkamal Complex, Main Road, Bistupur, Jamshedpur-831001, Ph No. 0657-
2230112/111/222, Mobile No. : 9431102883.
Kolkata : Oswal Chambers, 1st Floor, 2 Church Lane, Kolkata - 700 001. Tel.: +91-33-40171000/ 1005.
Patna : 406, Ashiana Hariniwas, New Dakbanglow Road, Patna - 800 001. Tel.: +91-612-6510353. Ranchi: 306, Shrilok Complex, 4 H B Road,
Ranchi-834001 Phone : 0651-2212592/9931156362.
Tel.:079-26460923/925
Mumbai (Churchgate) : 2nd Floor,Ramon House , H.T Parekh Marg, 169,Backbay reclamation, Opp.Aakash wani, Churchgate 400020.
Tel.:+912266289999.
Tel.: Mobile:
Tel. : 0674 644252, Mobile No. : 9937945676.
Bhilai : 26, Commercial Complex, Nehru Nagar (East), Bhilai, Chhattisgarh, Pin - 490020. Mobile No. 8871144134.
Tel.:
Tel.:
Mysore : CH 26, Shop No 1, 2nd Floor, 7th Main, 5th Cross ( Veta Building ) Saraswathipuram, Mysore - 570009.
Tel. :
Related Documents