WHY ARE ROAD TRAFFIC INJURIES A PUBLIC HEALTH ISSUE? Road traffic injuries and deaths have a terrible impact on individuals, communities and countries. They involve massive costs to often overburdened health care systems, occupy scarce hospital beds, consume resources and result in significant losses of productivity and prosperity, with deep social and economic repercussions. The numbers speak for themselves: this is a public health and development crisis that is expected to worsen unless action is taken. For more on: road traffic injuries FACT SHEET #1 ROAD SAFETY: BASIC FACTS 1.25 million road traffic deaths occur every year. #1 cause of death among those aged 15-29 years ROAD SAFETY AND MEDIA REPORTING Road traffic crashes are often covered in the media simply as events—not as a leading killer of people and an enormous drain on a country’s human, health and financial resources. By framing road safety as a health and development story, with data and in-depth information, journalists have the opportunity to affect the way these stories are told and potentially to help shift public behaviour and attitudes, influence policy and therefore contribute towards saving lives. Global death figures drive home the extent of this public health crisis, especially among young people. FACT SHEET #1 Road safety: Basic facts – page 1 © Panos / Jacob Silberberg

Welcome message from author
This document is posted to help you gain knowledge. Please leave a comment to let me know what you think about it! Share it to your friends and learn new things together.
Transcript
WHY ARE ROAD TRAFFIC INJURIES A PUBLIC HEALTH ISSUE?
Road traffic injuries and deaths have a terrible impact on individuals, communities and countries. They involve massive costs to often overburdened health care systems, occupy scarce hospital beds, consume resources and result in significant losses of productivity and prosperity, with deep social and economic repercussions. The numbers speak for themselves: this is a public health and development crisis that is expected to worsen unless action is taken.
For more on: road traffic injuries
FACT SHEET #1
ROAD SAFETY: BASIC FACTS
1.25 millionroad traffic deathsoccur every year.
#1cause of death amongthose aged 15-29 years
ROAD SAFETY AND MEDIA REPORTING Road traffic crashes are often covered in the media simply as events—not as a leading killer of people and an enormous drain on a country’s human, health and financial resources. By framing road safety as a health and development story, with data and in-depth information, journalists have the opportunity to affect the way these stories are told and potentially to help shift public behaviour and attitudes, influence policy and therefore contribute towards saving lives.
Global death figures drive home the extent of this public health crisis, especially among young people.
FACT SHEET #1 Road safety: Basic facts – page 1
© P
anos
/ Ja
cob
Silb
erbe
rg
INTERPRETING THE NUMBERS
• Tallying the total number of deaths can, however, be useful for conveying the magnitude
of the problem, the prevention effort required and the health care resources potentially needed.
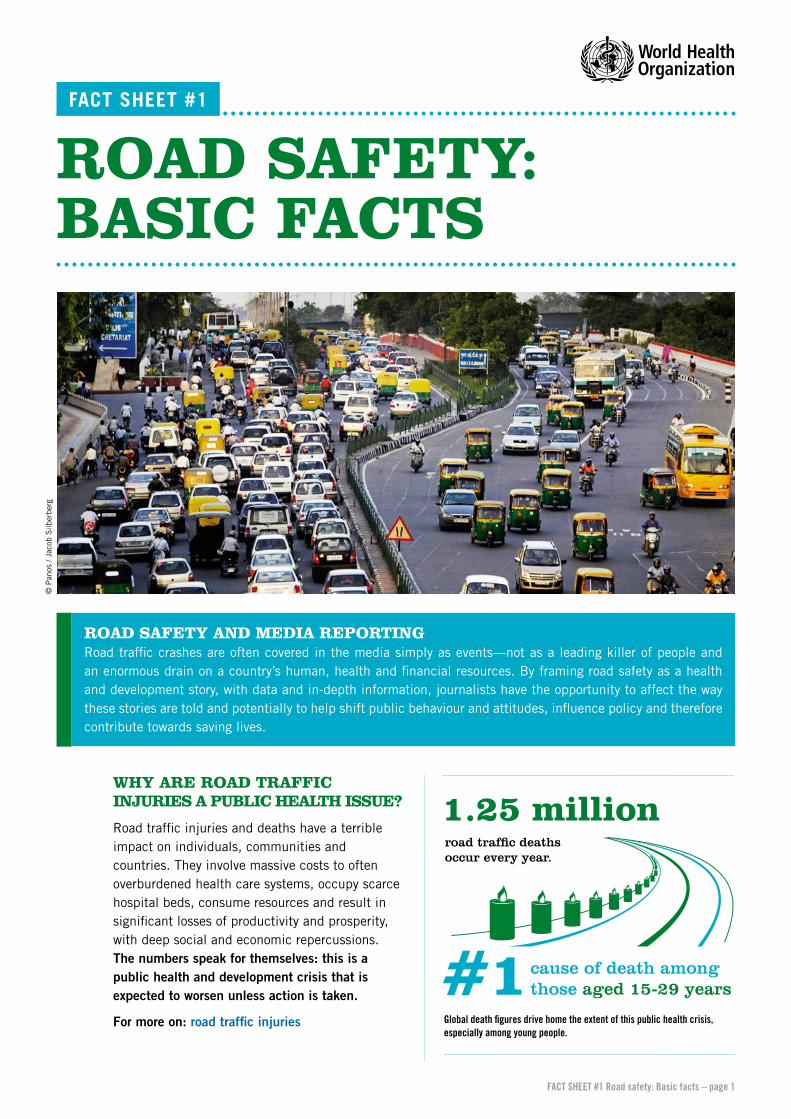
• For comparisons between regions or countries (or within a country over time), the use of death rates per 100 000 population more accurately reflects the size of the problem than absolute numbers. Use of the total number of deaths alone can be misleading, because it leads to comparisons of populations of unequal size.
MAGNITUDE
• About 1.25 million people globally die each year as a result of road traffic crashes—that’s over 3400 deaths a day.
• Nearly half of those who die on the world’s roads are vulnerable road users: pedestrians, cyclists and motorcyclists.
• Road traffic injuries are the leading cause of death globally among people aged 15–29 years.
• Around the world, almost three times more men than women die from road traffic injuries.
• Five key risk factors in road traffic deaths and injuries are: drinking and driving, speeding and failing to use motorcycle helmets, seat-belts and child restraints.
• Over 90% of the world’s road traffic fatalities occur in low- and middle-income countries, even though these countries have only about half the world’s vehicles.
• Without action, annual road traffic deaths are predicted to become the seventh leading cause of death, by 2030.
out of3 4road deaths are among men
The chanceof dying in a road traffic crashdepends on where you live
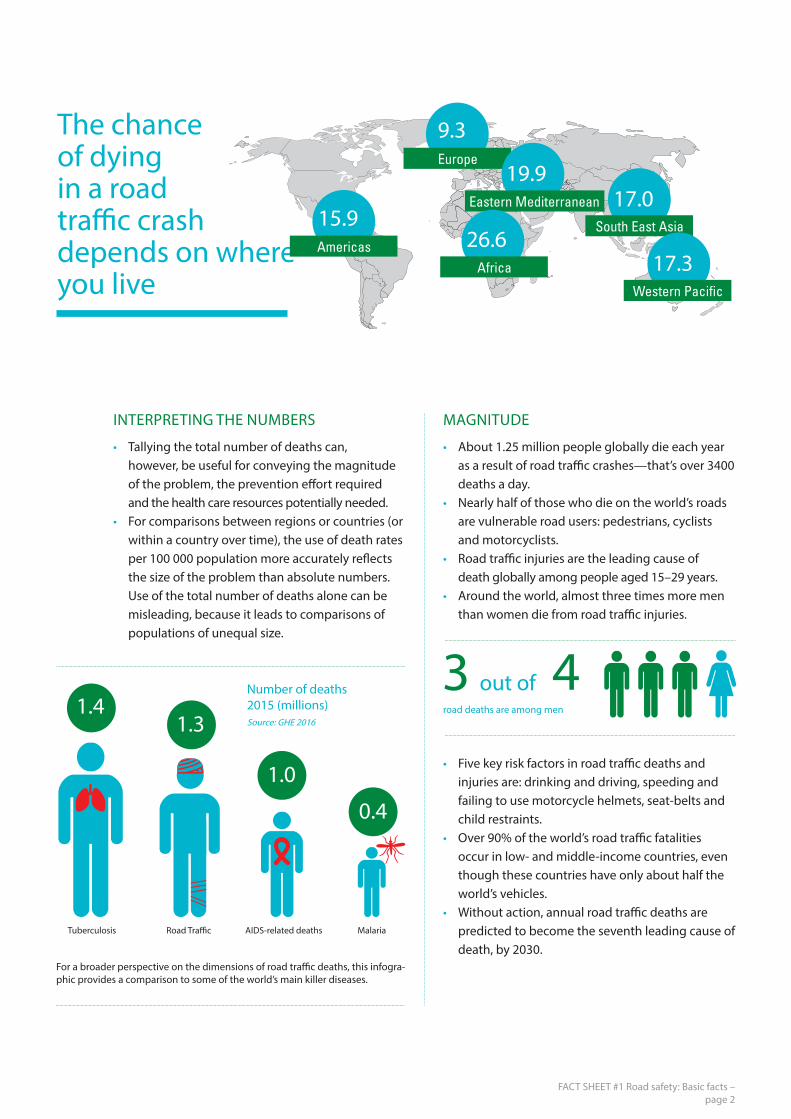
AIDS-related deaths Tuberculosis Road Traffic Malaria
For a broader perspective on the dimensions of road traffic deaths, this infogra-phic provides a comparison to some of the world’s main killer diseases.
Number of deaths 2015 (millions) Source: GHE 2016
FACT SHEET #1 Road safety: Basic facts – page 2
1.41.3
1.0
0.4
Europe
AmericasSouth East Asia
Eastern Mediterranean
Africa
15.9
9.3
19.9
26.6
17.0
17.3
ECONOMIC COSTS
Road traffic crashes cause not only grief and suffering but also economic losses to victims, their families, communities and nations as a whole, cos-ting countries on average 3% of their gross national product, and up to 5% in low- and middle-income countries. Indirect costs, such as loss of producti-vity, damage to vehicles and property, reduced qua-lity of life and other factors, must also be included in calculating the true cost to society.
Note: A variety of methods are used in costing studies at country level; they therefore don’t necessarily provide a solid basis for global compa-risons. Nevertheless, at country level, they serve to highlight the impact of road traffic crashes on different sectors and help to convince policy- makers to invest in prevention.
Approximately every 2 years, WHO produces a new Global status report on road safety (GSRRS). The 2015 report:
• presents information from 180 countries and includes country profiles and a statistical annex;
• uses a standardized method, so that comparisons can be made between countries and in the same country over time;
• analyses how effectively countries are imple-menting road safety measures and whether they have a national strategy with targets to reduce road traffic deaths and injuries;
• analyses legislation on the five main behavioural risk factors against specific criteria considered essential for best practice;
• concludes that, as legislative change and enforcement are key to reducing fatalities, the pace of legislation change must accelerate;
• highlights that 17 countries have changed laws to bring their legislation on one or more of these five risk factors into line with best practice since 2011.
Full report: Global status report on road safety 2015 Press release
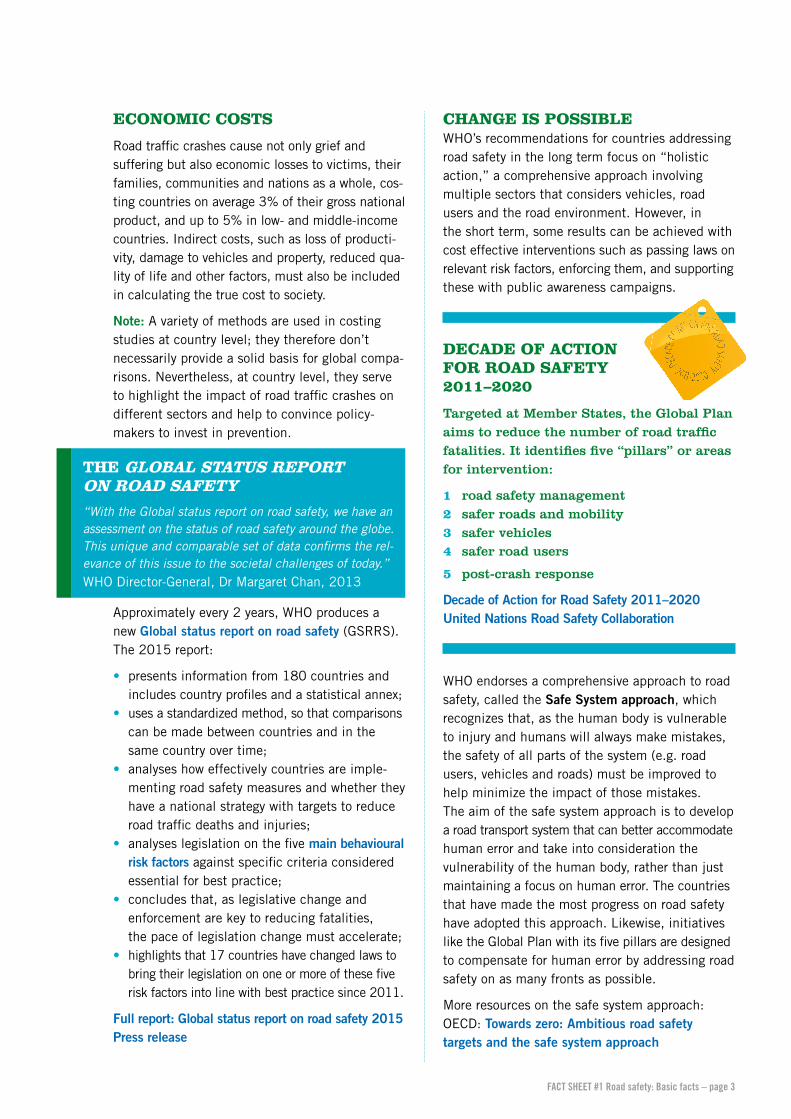
CHANGE IS POSSIBLEWHO’s recommendations for countries addressing road safety in the long term focus on “holistic action,” a comprehensive approach involving multiple sectors that considers vehicles, road users and the road environment. However, in the short term, some results can be achieved with cost effective interventions such as passing laws on relevant risk factors, enforcing them, and supporting these with public awareness campaigns.
DECADE OF ACTION FOR ROAD SAFETY 2011–2020
Targeted at Member States, the Global Plan aims to reduce the number of road traffic fatalities. It identifies five “pillars” or areas for intervention:
1 road safety management 2 safer roads and mobility3 safer vehicles 4 safer road users
5 post-crash response
Decade of Action for Road Safety 2011–2020United Nations Road Safety Collaboration
WHO endorses a comprehensive approach to road safety, called the Safe System approach, which recognizes that, as the human body is vulnerable to injury and humans will always make mistakes, the safety of all parts of the system (e.g. road users, vehicles and roads) must be improved to help minimize the impact of those mistakes. The aim of the safe system approach is to develop a road transport system that can better accommodate human error and take into consideration the vulnerability of the human body, rather than just maintaining a focus on human error. The countries that have made the most progress on road safety have adopted this approach. Likewise, initiatives like the Global Plan with its five pillars are designed to compensate for human error by addressing road safety on as many fronts as possible.
More resources on the safe system approach: OECD: Towards zero: Ambitious road safety targets and the safe system approach
THE GLOBAL STATUS REPORT ON ROAD SAFETY
“With the Global status report on road safety, we have an assessment on the status of road safety around the globe. This unique and comparable set of data confirms the rel-evance of this issue to the societal challenges of today.” WHO Director-General, Dr Margaret Chan, 2013
FACT SHEET #1 Road safety: Basic facts – page 3
VULNERABLE ROAD USERS
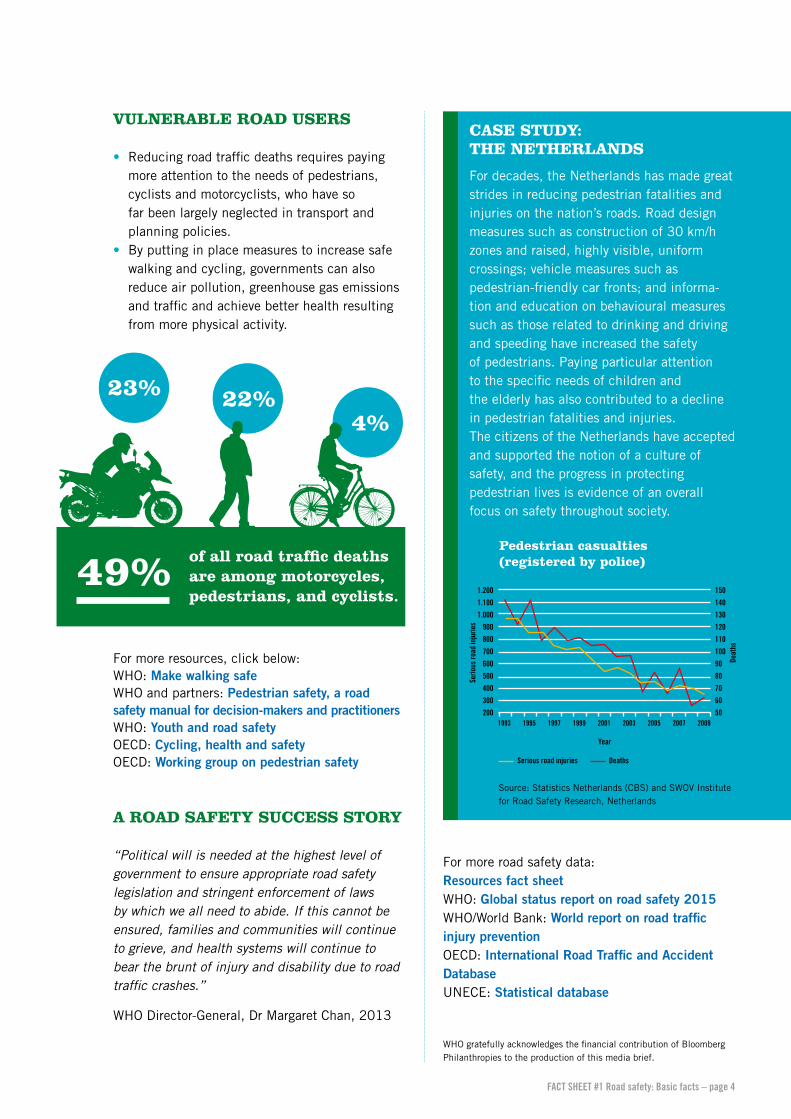
• Reducing road traffic deaths requires paying more attention to the needs of pedestrians, cyclists and motorcyclists, who have so far been largely neglected in transport and planning policies.
• By putting in place measures to increase safe walking and cycling, governments can also reduce air pollution, greenhouse gas emissions and traffic and achieve better health resulting from more physical activity.
For more resources, click below:WHO: Make walking safeWHO and partners: Pedestrian safety, a road safety manual for decision-makers and practitionersWHO: Youth and road safetyOECD: Cycling, health and safetyOECD: Working group on pedestrian safety
A ROAD SAFETY SUCCESS STORY
“Political will is needed at the highest level of government to ensure appropriate road safety legislation and stringent enforcement of laws by which we all need to abide. If this cannot be ensured, families and communities will continue to grieve, and health systems will continue to bear the brunt of injury and disability due to road traffic crashes.”
WHO Director-General, Dr Margaret Chan, 2013
For more road safety data:Resources fact sheetWHO: Global status report on road safety 2015WHO/World Bank: World report on road traffic injury prevention OECD: International Road Traffic and Accident Database UNECE: Statistical database
WHO gratefully acknowledges the financial contribution of Bloomberg Philanthropies to the production of this media brief.
CASE STUDY: THE NETHERLANDS
For decades, the Netherlands has made great strides in reducing pedestrian fatalities and injuries on the nation’s roads. Road design measures such as construction of 30 km/h zones and raised, highly visible, uniform crossings; vehicle measures such as pedestrian-friendly car fronts; and informa-tion and education on behavioural measures such as those related to drinking and driving and speeding have increased the safety of pedestrians. Paying particular attention to the specific needs of children and the elderly has also contributed to a decline in pedestrian fatalities and injuries. The citizens of the Netherlands have accepted and supported the notion of a culture of safety, and the progress in protecting pedestrian lives is evidence of an overall focus on safety throughout society.
of all road traffic deaths are among motorcycles, pedestrians, and cyclists. 1.200
1.100
1.000
900
800
700
600
500
400
300
200
150
140
130
120
110
100
90
80
70
60
50
Serio
us ro
ad in
jurie
s
Deat
hs
Pedestrian casualties (registered by police)
1993 1995 1997 1999 2001 2003 2005 2007 2009
Serious road injuries Deaths
FACT SHEET #1 Road safety: Basic facts – page 4
Year
Source: Statistics Netherlands (CBS) and SWOV Institute for Road Safety Research, Netherlands
49%
23% 22%4%
IMPROVING THE QUALITY OF ROAD SAFETY DATA
Decision-making on road traffic policies in countries depends partly on data. Governments not only need to know who dies on their roads, where and how, but they also require data on severe injuries and qualitative information about risk factors. So, for example, knowing the percentage of motorcyclists who wear helmets and the percentage of crashes linked to alcohol use will help a government to target and monitor its efforts better. Data must be accurate, which means that data collection must follow best practices and be harmonized across sectors (e.g. police, health).
Good data collection systems help to paint a realistic picture of the magnitude of a problem and provide a basis for better policies. Good data also allow assessment of the effectiveness of policies and programmes. A key problem, particularly in low- and middle-income countries, is that road traffic deaths are underreported. WHO works with countries to improve data collection on road traffic fatalities by police and ministries of health and continues to promote the adoption of a standard definition of road traffic death (see below).
WHO and partners: Data systems: a road safety manual for decision-makers and practitioners.
MONITORING AND EVALUATION
As countries make road safety a priority and adopt policies and measures to improve road safety, accurate monitoring and evaluation are needed to provide information for the next steps. In addition to collecting data on fatalities, WHO regularly collects and analyses information in other road safety areas: institutional frameworks, safer roads and mobility, safer vehicles, safer road users (with a focus on legislation) and post-crash care. This work culminates in the Global status report on road safety, a major global monitoring and evaluation tool first published in 2009 that WHO produces approximately every 2 years. The report gives a full description of the road safety situation in almost every country of the world. As the same method is used for each country, the information can be compared.
KEEPING ROAD SAFETY ON THE AGENDA
To reduce global road traffic deaths and injuries, road safety should be a priority for policy-makers around the world, particularly in low- and middle-income countries, where the death rates are the highest. Political will and commitment are key, as is ensuring that road safety decision-making is based on solid evidence. For example, making
FACT SHEET #2
ROAD SAFETY: THE ROLE OF WHO“WHO has taken this road safety challenge seriously.” WHO Director-General, Dr Margaret Chan, 2013
DEFINITION OF ROAD TRAFFIC DEATH
In some countries, road traffic death data include only deaths at the scene of a crash. WHO promotes a definition that includes people who die up to 30 days after a crash, as reported in official fatality figures gathered by police. Currently, 92 countries use the definition promoted by WHO.
FACT SHEET #2 Road safety: The role of WHO – page 1
helmet-wearing mandatory for all passengers, reducing speed around schools and setting a lower blood alcohol concentration (BAC) limit for young drivers are interventions based on strong evidence. To ensure that road safety remains on governments’ agendas, WHO promotes and coordinates initiatives such as the Decade of Action for Road Safety 2011-2020 and invites global road safety actors in a range of sectors to exchange knowledge and data on injury prevention. WHO is also coordinator of the United Nations Road Safety Collaboration, an informal consultative mechanism which facilitates cooperation and coordination among United Nations agencies and other international partners to implement United Nations General Assembly resolutions and the recommendations in WHO’s reports.
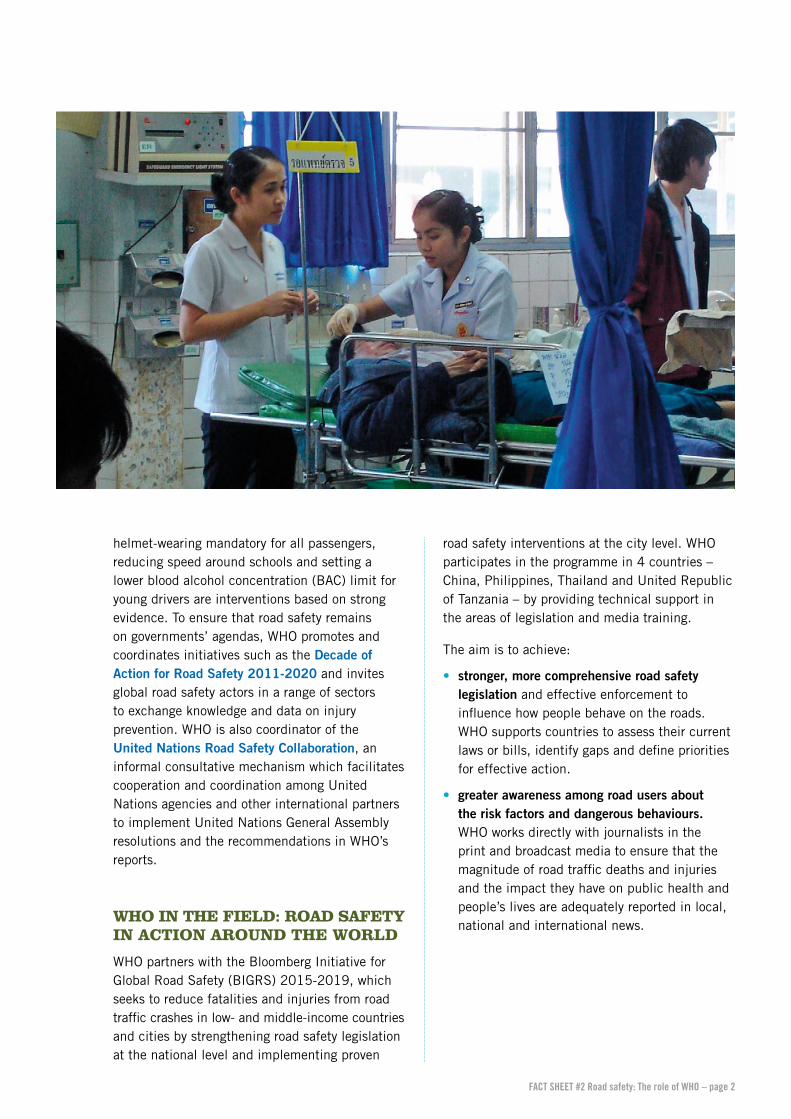
WHO IN THE FIELD: ROAD SAFETY IN ACTION AROUND THE WORLD
WHO partners with the Bloomberg Initiative for Global Road Safety (BIGRS) 2015-2019, which seeks to reduce fatalities and injuries from road traffic crashes in low- and middle-income countries and cities by strengthening road safety legislation at the national level and implementing proven
road safety interventions at the city level. WHO participates in the programme in 4 countries – China, Philippines, Thailand and United Republic of Tanzania – by providing technical support in the areas of legislation and media training.
The aim is to achieve:
• stronger, more comprehensive road safety legislation and effective enforcement to influence how people behave on the roads. WHO supports countries to assess their current laws or bills, identify gaps and define priorities for effective action.
• greater awareness among road users about the risk factors and dangerous behaviours. WHO works directly with journalists in the print and broadcast media to ensure that the magnitude of road traffic deaths and injuries and the impact they have on public health and people’s lives are adequately reported in local, national and international news.
FACT SHEET #2 Road safety: The role of WHO – page 2
HIGHLIGHTS FROM COUNTRIES
Mass media campaigns: Social marketing campaigns that are based on extensive research and testing have a better chance of changing people’s perceptions. Studies have demonstrated that hard-hitting and/or realistic road safety campaigns are more effective because they are remembered better by target audiences. With WHO’s support, campaigns for behavioural change, in countries such as Brazil, Cambodia, Kenya and Mexico shifted from “feel good campaigns” to hard-hitting advertisements focused mainly on the consequences of wrong behaviour and on law enforcement.
Russian Federation: Thanks to enhanced enforcement and mass media campaigns, the rate of seat-belt wearing in Lipetsk Oblast increased between 2010 and 2013 from around 50% to nearly 80% and that in Ivanovo Oblast from
below 50% to above 90%. In addition, use of child restraints has quadrupled in both oblasts, jumping from 20% to above 80% in Ivanovo Oblast, for example.
Viet Nam: Since 2007, with the technical support of WHO and its partners, the Government of Viet Nam has continuously improved its laws and regulations to promote helmet-wearing by motorcyclists. The improvements included a provision that holds parents responsible for ensuring that their children wear appropriate helmets when they are passengers on motorcycles, a progressive increase in fines and a regulatory framework to ensure that motorcycle drivers and passengers wear standard motorcycle helmets. Helmet-wearing rates increased from 40% in 2007 to more than 95% in 2008 and have remained above 90% since the introduction of the motorcycle helmet law in 2007.
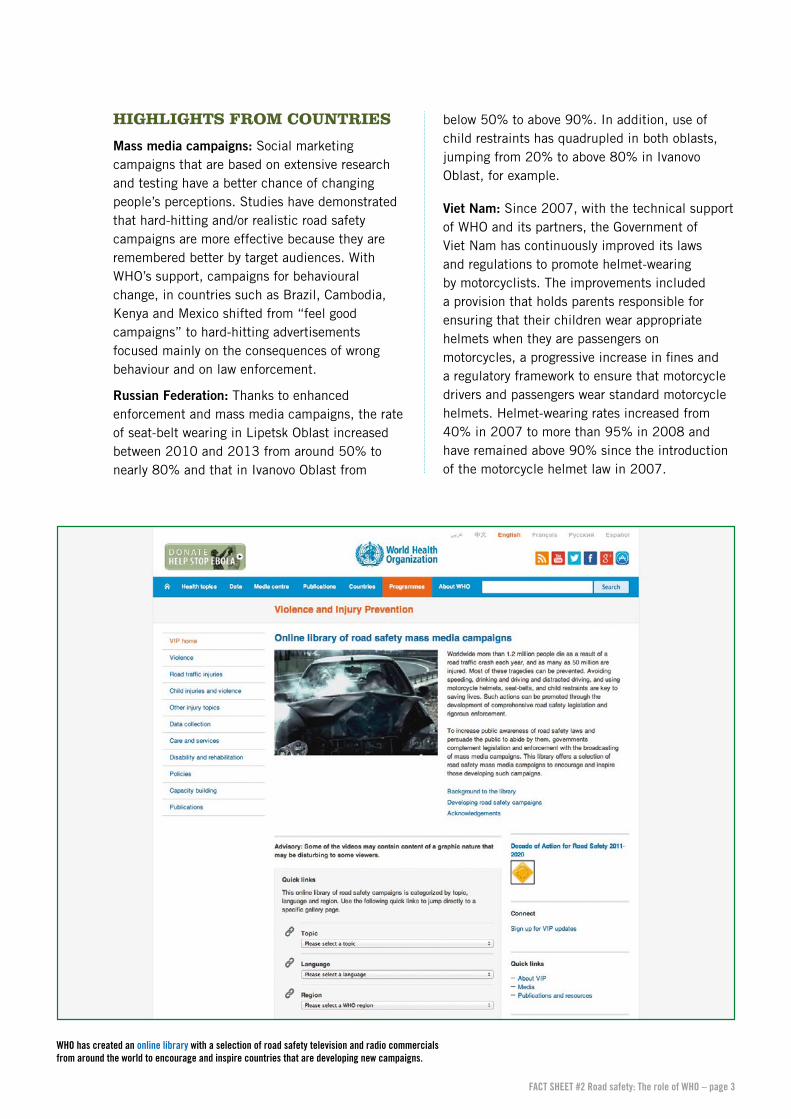
WHO has created an online library with a selection of road safety television and radio commercials from around the world to encourage and inspire countries that are developing new campaigns.
FACT SHEET #2 Road safety: The role of WHO – page 3
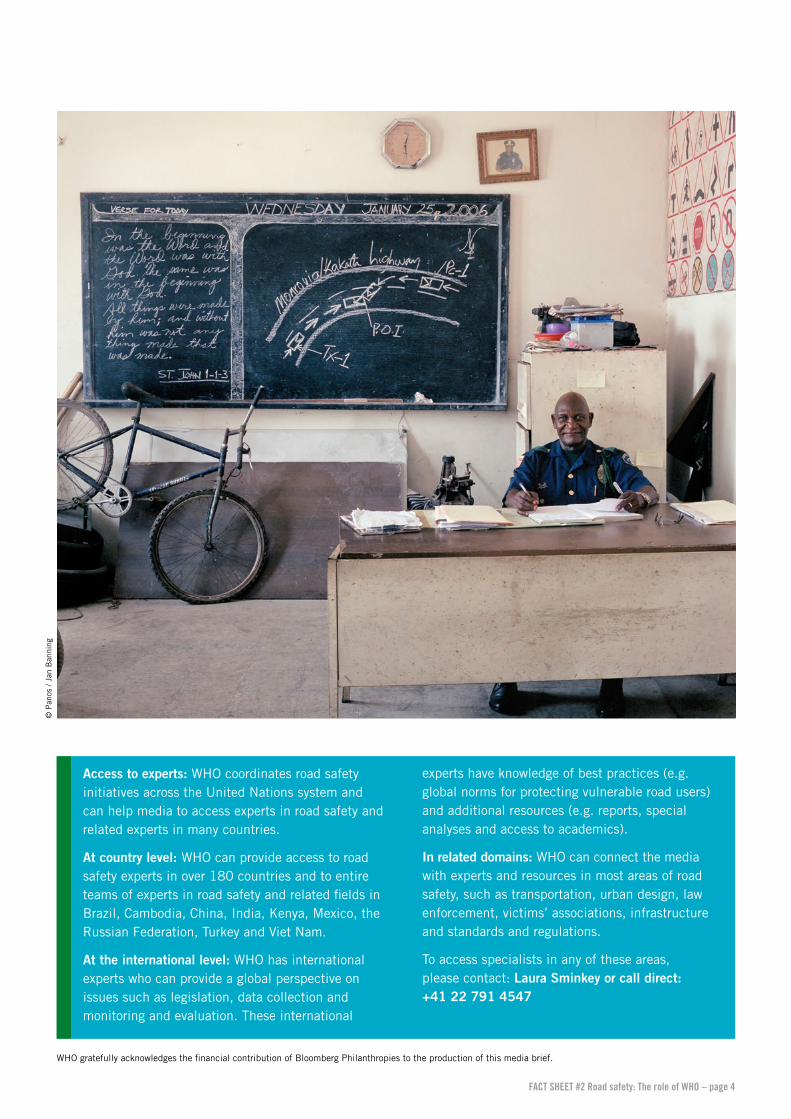
Access to experts: WHO coordinates road safety initiatives across the United Nations system and can help media to access experts in road safety and related experts in many countries.
At country level: WHO can provide access to road safety experts in over 180 countries and to entire teams of experts in road safety and related fields in Brazil, Cambodia, China, India, Kenya, Mexico, the Russian Federation, Turkey and Viet Nam.
At the international level: WHO has international experts who can provide a global perspective on issues such as legislation, data collection and monitoring and evaluation. These international
experts have knowledge of best practices (e.g. global norms for protecting vulnerable road users) and additional resources (e.g. reports, special analyses and access to academics).
In related domains: WHO can connect the media with experts and resources in most areas of road safety, such as transportation, urban design, law enforcement, victims’ associations, infrastructure and standards and regulations.
To access specialists in any of these areas, please contact: Laura Sminkey or call direct: +41 22 791 4547
WHO gratefully acknowledges the financial contribution of Bloomberg Philanthropies to the production of this media brief.
FACT SHEET #2 Road safety: The role of WHO – page 4
© P
anos
/ Ja
n B
anni
ng
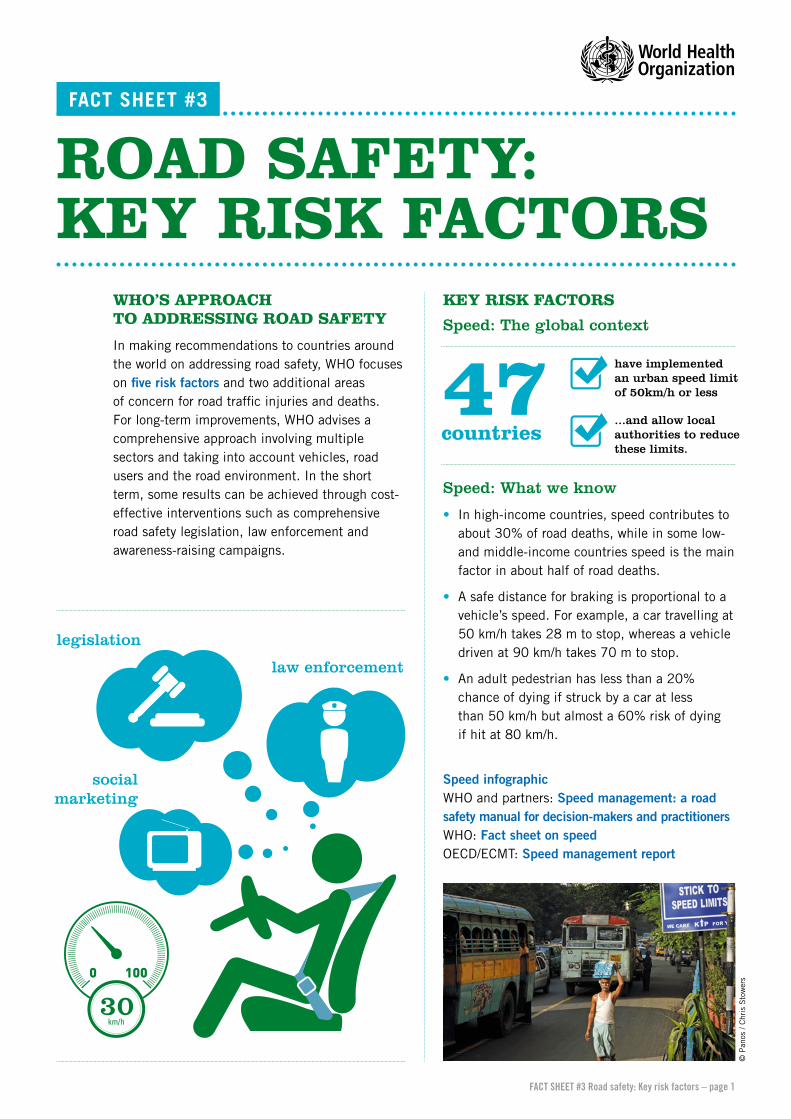
WHO’S APPROACH TO ADDRESSING ROAD SAFETY
In making recommendations to countries around the world on addressing road safety, WHO focuses on five risk factors and two additional areas of concern for road traffic injuries and deaths. For long-term improvements, WHO advises a comprehensive approach involving multiple sectors and taking into account vehicles, road users and the road environment. In the short term, some results can be achieved through cost-effective interventions such as comprehensive road safety legislation, law enforcement and awareness-raising campaigns.
KEY RISK FACTORS
Speed: The global context
Speed: What we know
• In high-income countries, speed contributes to about 30% of road deaths, while in some low- and middle-income countries speed is the main factor in about half of road deaths.
• A safe distance for braking is proportional to a vehicle’s speed. For example, a car travelling at 50 km/h takes 28 m to stop, whereas a vehicle driven at 90 km/h takes 70 m to stop.
• An adult pedestrian has less than a 20% chance of dying if struck by a car at less than 50 km/h but almost a 60% risk of dying if hit at 80 km/h.
Speed infographicWHO and partners: Speed management: a road safety manual for decision-makers and practitioners WHO: Fact sheet on speedOECD/ECMT: Speed management report
FACT SHEET #3
ROAD SAFETY: KEY RISK FACTORS
47countries
have implementedan urban speed limit of 50km/h or less
...and allow local authorities to reducethese limits.
30
legislation
law enforcement
social marketing
FACT SHEET #3 Road safety: Key risk factors – page 1
© P
anos
/ C
hris
Sto
wer
s
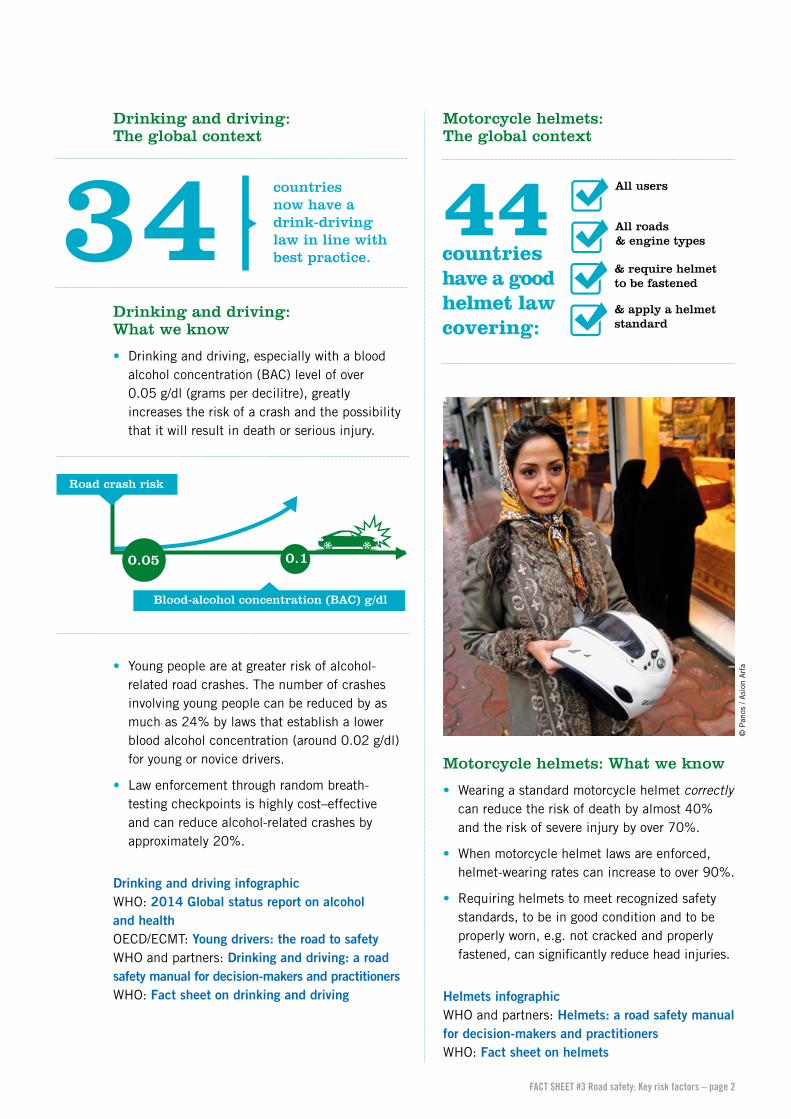
Drinking and driving: The global context
Drinking and driving: What we know
• Drinking and driving, especially with a blood alcohol concentration (BAC) level of over 0.05 g/dl (grams per decilitre), greatly increases the risk of a crash and the possibility that it will result in death or serious injury.
• Young people are at greater risk of alcohol-related road crashes. The number of crashes involving young people can be reduced by as much as 24% by laws that establish a lower blood alcohol concentration (around 0.02 g/dl) for young or novice drivers.
• Law enforcement through random breath-testing checkpoints is highly cost–effective and can reduce alcohol-related crashes by approximately 20%.
Drinking and driving infographicWHO: 2014 Global status report on alcohol and healthOECD/ECMT: Young drivers: the road to safetyWHO and partners: Drinking and driving: a road safety manual for decision-makers and practitionersWHO: Fact sheet on drinking and driving
Motorcycle helmets: The global context
Motorcycle helmets: What we know
• Wearing a standard motorcycle helmet correctly can reduce the risk of death by almost 40% and the risk of severe injury by over 70%.
• When motorcycle helmet laws are enforced, helmet-wearing rates can increase to over 90%.
• Requiring helmets to meet recognized safety standards, to be in good condition and to be properly worn, e.g. not cracked and properly fastened, can significantly reduce head injuries.
Helmets infographicWHO and partners: Helmets: a road safety manual for decision-makers and practitioners WHO: Fact sheet on helmets
countries now have a drink-driving law in line with best practice.34
d
Road crash risk
0.05 0.1
Blood-alcohol concentration (BAC) g/dl
FACT SHEET #3 Road safety: Key risk factors – page 2
© P
anos
/ A
slon
Arf
a
44countries have a good helmet law covering:
All users
All roads & engine types
& require helmet to be fastened
& apply a helmet standard
Seat-belts: The global context
Seat-belts: What we know
• Wearing a seat-belt can reduce fatalities among front-seat passengers by up to 50% and among rear-seat car passengers by up to 75%.
• Public awareness campaigns, mandatory seat-belt laws and their enforcement have been highly effective in increasing the rates of seat-belt wearing.
Seat-belts infographicWHO and partners: Seat-belts and child restraints: a road safety manual for decision-makers and practitioners WHO: Fact sheet on safety restraints
Child restraints: The global context
Child restraints: What we know
• Child restraint systems, such as child seats for infants and booster seats for older children, decrease the risk of death in a crash by about 70% for infants and up to 80% for small children.
• Mandatory child restraint laws and enforcement are effective in increasing the use of child restraints.
• In order to be effective, child restraint systems must meet standards, be appropriate to the age and size of the child and installed correctly.
Child restraints infographicWHO: Child restraints fact sheet
HELMET-WEARING IN VIET NAM
Motorcycle helmet-wearing rates have remained above 90% since the introduction of Viet Nam’s motorcycle helmet law in 2007. In May 2012, however, 8% of riders were still not wearing their helmets correctly, and 24% were using non-standard helmets. Non-standard helmets offer much less protection from head injuries in the event of a crash than standard helmets. They are sometimes so inadequate that they can be shattered by the hands alone.
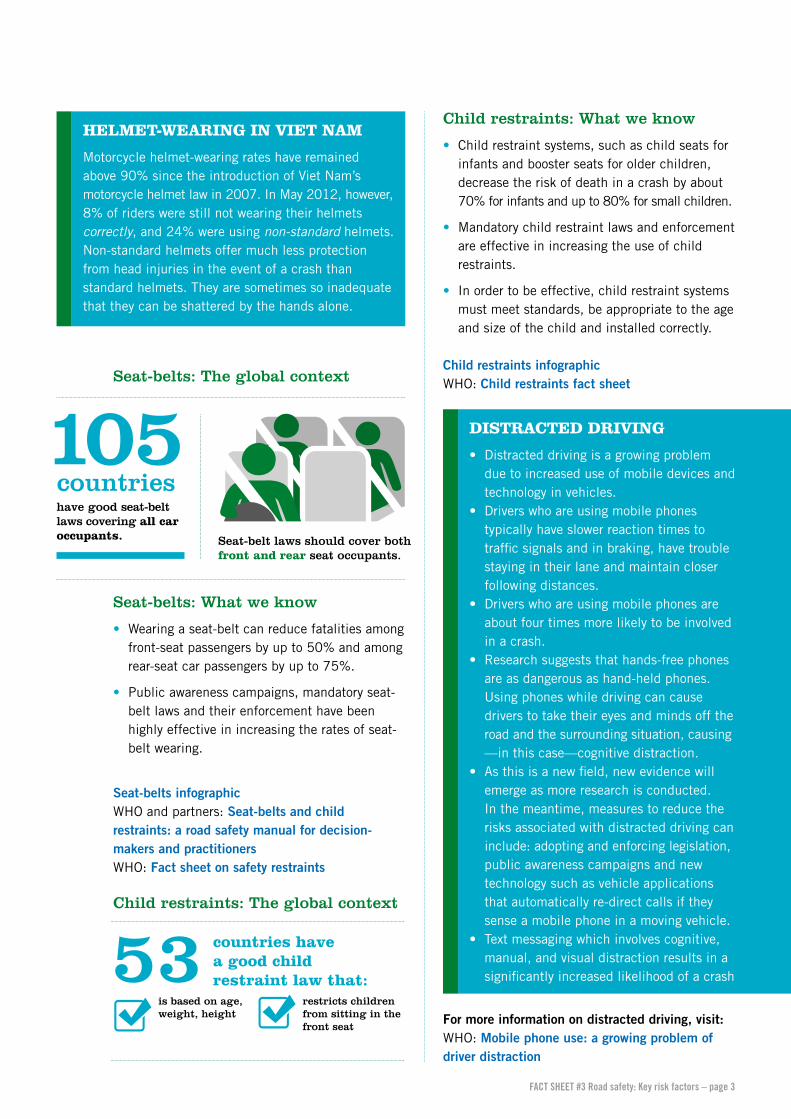
Seat-belt laws should cover both front and rear seat occupants.
105 countries
have good seat-belt laws covering all car occupants.
53 countries have a good child restraint law that:
DISTRACTED DRIVING
• Distracted driving is a growing problem due to increased use of mobile devices and technology in vehicles.
• Drivers who are using mobile phones typically have slower reaction times to traffic signals and in braking, have trouble staying in their lane and maintain closer following distances.
• Drivers who are using mobile phones are about four times more likely to be involved in a crash.
• Research suggests that hands-free phones are as dangerous as hand-held phones. Using phones while driving can cause drivers to take their eyes and minds off the road and the surrounding situation, causing —in this case—cognitive distraction.
• As this is a new field, new evidence will emerge as more research is conducted. In the meantime, measures to reduce the risks associated with distracted driving can include: adopting and enforcing legislation, public awareness campaigns and new technology such as vehicle applications that automatically re-direct calls if they sense a mobile phone in a moving vehicle.
• Text messaging which involves cognitive, manual, and visual distraction results in a significantly increased likelihood of a crash
FACT SHEET #3 Road safety: Key risk factors – page 3
For more information on distracted driving, visit:WHO: Mobile phone use: a growing problem of driver distraction
is based on age, weight, height
restricts children from sitting in the front seat
FACT SHEET #3 Road safety: Key risk factors – page 4
DRUG-DRIVING
• Drug–driving is an emerging road safety issue.
• Compared to drink–driving, much less is known about driving when impaired by psychoactive substances and the effectiveness of related countermeasures.
• There are a wide variety of psychoactive substances that have the potential to adversely affect driver behaviour.
• Addressing drug–driving is difficult because:
1. The term “drugs” encompasses a wide variety of substances.
2. Detecting and measuring levels of psychoactive substances is complicated.
3. Different types of drugs stay in the bloodstream for different lengths of time which complicates the ability to link a positive drug presence with crash risk.
4. It difficult to set threshold limits for each substance because of lack of scientific evidence on the links between drug levels, impairment and crash risk for many drugs.
For more on key risk factors:Risk factor infographicsOECD: International Transport Forum WHO and partners: Risk factor manuals OECD: International Road Traffic and Accident Database (32 countries) UNECE: Statistical database for transportRisk factor fact sheets
WHO gratefully acknowledges the financial contribution of Bloomberg Philanthropies to the production of this media brief.
© P
anos
/ G
.M.B
. A
kash
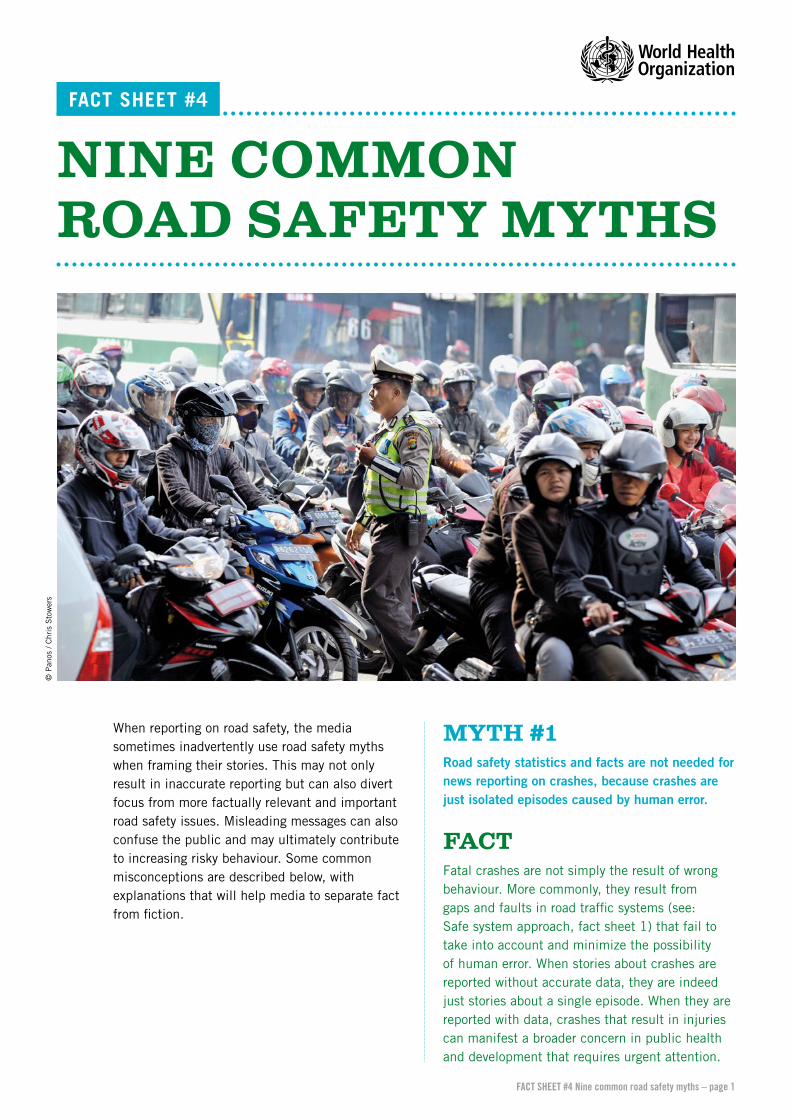
When reporting on road safety, the media sometimes inadvertently use road safety myths when framing their stories. This may not only result in inaccurate reporting but can also divert focus from more factually relevant and important road safety issues. Misleading messages can also confuse the public and may ultimately contribute to increasing risky behaviour. Some common misconceptions are described below, with explanations that will help media to separate fact from fiction.
MYTH #1Road safety statistics and facts are not needed for news reporting on crashes, because crashes are just isolated episodes caused by human error.
FACTFatal crashes are not simply the result of wrong behaviour. More commonly, they result from gaps and faults in road traffic systems (see: Safe system approach, fact sheet 1) that fail to take into account and minimize the possibility of human error. When stories about crashes are reported without accurate data, they are indeed just stories about a single episode. When they are reported with data, crashes that result in injuries can manifest a broader concern in public health and development that requires urgent attention.
FACT SHEET #4
NINE COMMON ROAD SAFETY MYTHS
FACT SHEET #4 Nine common road safety myths – page 1
© P
anos
/ C
hris
Sto
wer
s
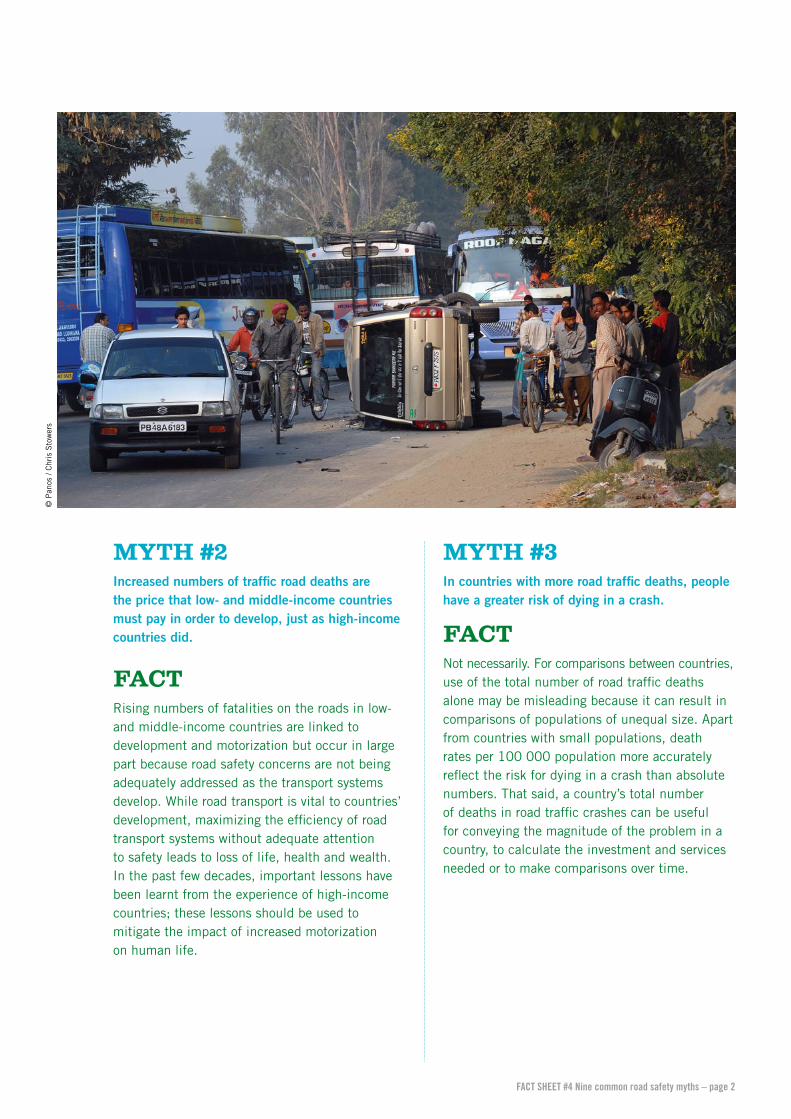
MYTH #2Increased numbers of traffic road deaths are the price that low- and middle-income countries must pay in order to develop, just as high-income countries did.
FACTRising numbers of fatalities on the roads in low- and middle-income countries are linked to development and motorization but occur in large part because road safety concerns are not being adequately addressed as the transport systems develop. While road transport is vital to countries’ development, maximizing the efficiency of road transport systems without adequate attention to safety leads to loss of life, health and wealth. In the past few decades, important lessons have been learnt from the experience of high-income countries; these lessons should be used to mitigate the impact of increased motorization on human life.
MYTH #3In countries with more road traffic deaths, people have a greater risk of dying in a crash.
FACTNot necessarily. For comparisons between countries, use of the total number of road traffic deaths alone may be misleading because it can result in comparisons of populations of unequal size. Apart from countries with small populations, death rates per 100 000 population more accurately reflect the risk for dying in a crash than absolute numbers. That said, a country’s total number of deaths in road traffic crashes can be useful for conveying the magnitude of the problem in a country, to calculate the investment and services needed or to make comparisons over time.
FACT SHEET #4 Nine common road safety myths – page 2
© P
anos
/ C
hris
Sto
wer
s
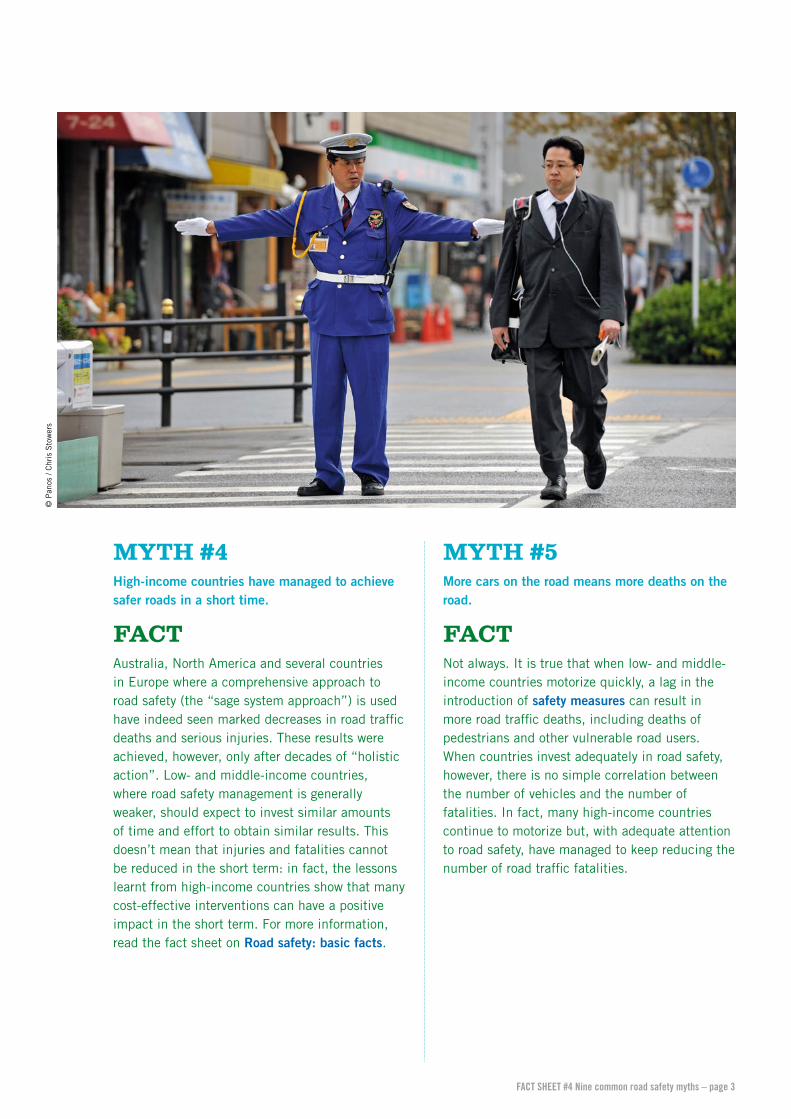
MYTH #4High-income countries have managed to achieve safer roads in a short time.
FACTAustralia, North America and several countries in Europe where a comprehensive approach to road safety (the “sage system approach”) is used have indeed seen marked decreases in road traffic deaths and serious injuries. These results were achieved, however, only after decades of “holistic action”. Low- and middle-income countries, where road safety management is generally weaker, should expect to invest similar amounts of time and effort to obtain similar results. This doesn’t mean that injuries and fatalities cannot be reduced in the short term: in fact, the lessons learnt from high-income countries show that many cost-effective interventions can have a positive impact in the short term. For more information, read the fact sheet on Road safety: basic facts.
MYTH #5More cars on the road means more deaths on the road.
FACTNot always. It is true that when low- and middle-income countries motorize quickly, a lag in the introduction of safety measures can result in more road traffic deaths, including deaths of pedestrians and other vulnerable road users. When countries invest adequately in road safety, however, there is no simple correlation between the number of vehicles and the number of fatalities. In fact, many high-income countries continue to motorize but, with adequate attention to road safety, have managed to keep reducing the number of road traffic fatalities.
FACT SHEET #4 Nine common road safety myths – page 3
© P
anos
/ C
hris
Sto
wer
s
MYTH #6One country, one set of road traffic data.
FACTUnfortunately not. In any given country, road traffic data can come from a number of sources (e.g. the health sector, police, nongovernmental organizations, academia). Ideally, data systems should be linked and provide the same numbers; in practice, good coordination is difficult to achieve. In addition to data available from the different national sources, WHO’s Global status report on road safety also provides estimates of traffic fatalities. The report includes data from each country’s official sources – which can be underreported – as well as WHO’s estimates for each country. These two sets of figures are often different.
MYTH #7Dangerous drivers are the main problem; educating them is the main solution.
FACTThere are multiple, often complex reasons for crashes. Countries that do best in terms of road safety have recognized this and focus on improving the safety of all parts of the system (the road environment, vehicles and road users) to minimize the impact of human error, as opposed to focusing predominantly on educating drivers.
MYTH #8There’s no need to clutter a story on creative road safety measures with a lot of facts.
FACTWHO urges reporters to check all road safety stories against known facts and evidence by researching studies or interviewing experts. While we support innovative approaches to road safety, solutions must be based on evidence. Fortunately, in road safety, there is a lot of scientific evidence about what works and what doesn’t. For example, while initiatives to offer yoga classes to bus drivers might make for a fun story, no studies are available to indicate that this measure is effective in reducing the number of road fatalities and injuries.
MYTH #9Speed cameras are just money-making machines for the police and the state.
FACTActually, speed cameras are an efficient, cost–effective speed management tool. They can make enforcement consistent, help to deter offenders and reduce the need for individual police intervention. As they don’t require the collection of penalties at physical interception points, they can also help to reduce potential corruption in enforcement. In addition, countries where speed cameras are used most effectively, the proceeds are earmarked and reinvested into making the country’s roads safer.
WHO gratefully acknowledges the financial contribution of Bloomberg Philanthropies to the production of this media brief.
FACT SHEET #4 Nine common road safety myths – page 4
FREQUENTLY ASKED QUESTIONS
1. Where can I find updated data on road safety?2. What is the Global status report on road
safety (GSRRS) ? 3. How is the information in the GSRRS collected?4. What types of road safety data are available?5. Why does the GSRRS have two sets of data
on road traffic fatalities for some countries?6. What’s the difference between the
calculations of road deaths of some countries and WHO’s estimates?
7. Why doesn’t the GSRRS have more recent information?
8. Where can I find regional data?9. Can I use nationally reported data to compare
countries?
10. When should I report numbers of deaths rather than death rates per 100 000 population?
11. Where can I find the number of deaths per number of vehicles?
12. How many people die annually in road traffic crashes?
13. Do more vehicles mean more road traffic deaths?14. Where can I find maps on road safety issues?15. Why should I use data in my story?16. How can road safety statistics enhance the
human side of my story?17. How do the numbers of deaths from road
traffic crashes compare with those from various diseases?
FACT SHEET #5
ROAD SAFETYDATA: FAQ
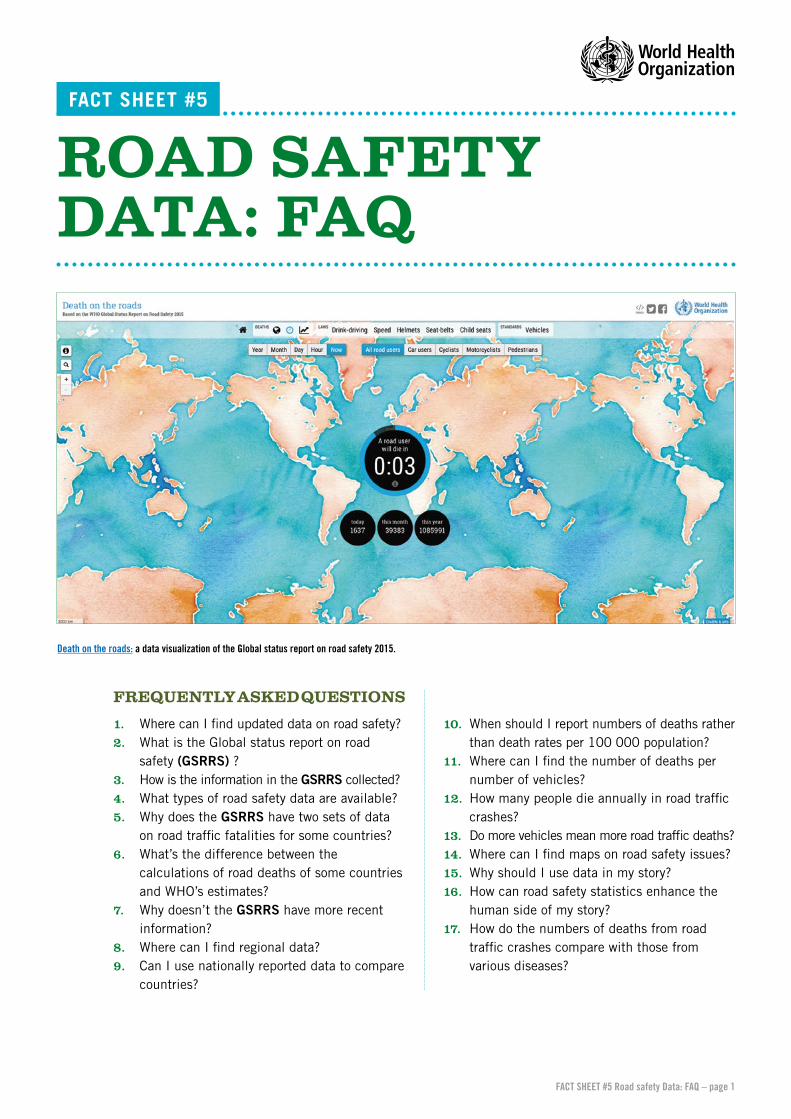
Death on the roads: a data visualization of the Global status report on road safety 2015.
FACT SHEET #5 Road safety Data: FAQ – page 1
1. WherecanIfindupdateddataonroadsafety?
Depending on the country, annual data on crashes and fatalities can be obtained from the ministry of the interior (police), the ministry of transport, the ministry of health (the lead agency), the national bureau of statistics or vehicle insurance companies. These data are not, however, always comparable among countries. In order to make accurate comparisons between countries, the same method must be used. WHO publishes the Global status report on road safety with data on the number of road traffic deaths in most countries, expressed as both numbers and rates of road traffic deaths (per 100 000 population) in its statistical annex.
2. WhatistheGlobalstatusreportonroadsafety(GSRRS)?
The WHO Global status report on road safety (GSRRS) includes analyses of the status of road safety around the world. Published
approximately every 2 years, the report makes recommendations on how to increase road safety. It contains a one-page country profile for each country, with information on road traffic fatalities, road safety legislation, vehicles and lead agencies. In addition, it points out gaps in road safety at country level. The 2015 report can be downloaded free of charge. Note: The report provides the official numbers of road traffic deaths submitted by each country as well as the WHO-estimated number for certain countries. For further information, please contact the report coordinator at WHO headquarters in Geneva, Dr Tamitza Toroyan.
3. HowistheinformationintheGSRRScollected?
WHO collects information and data from road safety experts in various sectors in each country (e.g. ministries of health, transport and the interior). The WHO data are therefore from a multisectoral group of road safety experts in each country.
4. WhattypesofroadsafetydataareavailableintheGSRRS?
WHO’s estimated data on road traffic deaths are analysed and presented by region, type of road user, age of road user and country income. These sets of data are available in section 1 of the report and also online, and in the Global Health Observatory.
5. WhydoestheGSRRShavetwosetsofdataonroadtrafficfatalitiesforsomecountries?
For those countries in which there is significant underreporting, the report includes one set of figures that represents the official road traffic death data reported by the Member State and a second estimate by WHO. Countries use different methods and definitions, some of which may not include adjustment for known biases in data, such as incomplete death records. In order to compensate for these factors and for underreporting, WHO uses estimates to provide internationally comparable statistics that adhere to a common definition, method and criteria for inclusion of data.
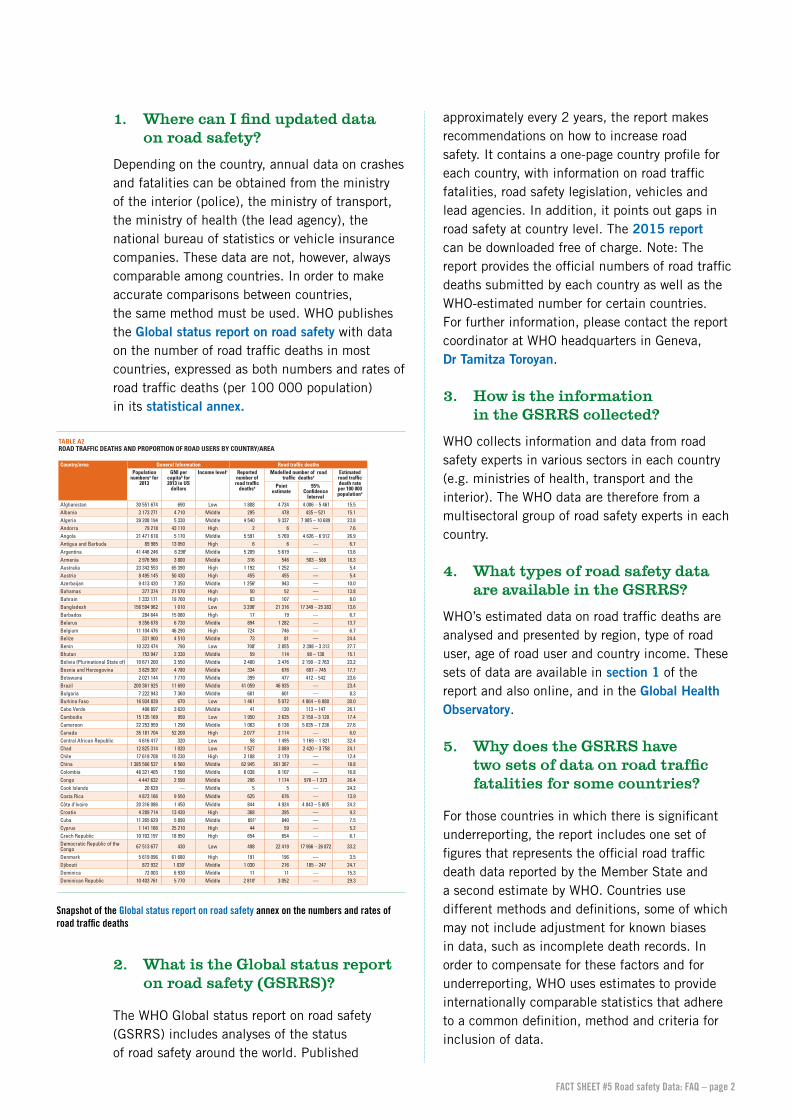
TABLE A2ROAD TRAFFIC DEATHS AND PROPORTION OF ROAD USERS BY COUNTRY/AREA
Country/area General Information Road traffic deathsPopulation
numbersa for 2013
GNI per capitab for 2013 in US
dollars
Income levelc Reported number of road traffic
deathsd
Modelled number of road traffic deathse
Estimated road traffic death rate per 100 000 populatione
Point estimate
95% Confidence
IntervalAfghanistan 30 551 674 690 Low 1 808 4 734 4 006 – 5 461 15.5Albania 3 173 271 4 710 Middle 295 478 435 – 521 15.1Algeria 39 208 194 5 330 Middle 4 540 9 337 7 985 – 10 689 23.8Andorra 79 218 43 110 High 2 6 — 7.6Angola 21 471 618 5 170 Middle 5 591 5 769 4 626 – 6 912 26.9Antigua and Barbuda 89 985 13 050 High 6 6 — 6.7Argentina 41 446 246 6 290f Middle 5 209 5 619 — 13.6Armenia 2 976 566 3 800 Middle 316 546 503 – 588 18.3Australia 23 342 553 65 390 High 1 192 1 252 — 5.4Austria 8 495 145 50 430 High 455 455 — 5.4Azerbaijan 9 413 420 7 350 Middle 1 256f 943 — 10.0Bahamas 377 374 21 570 High 50 52 — 13.8Bahrain 1 332 171 19 700 High 83 107 — 8.0Bangladesh 156 594 962 1 010 Low 3 296f 21 316 17 349 – 25 283 13.6Barbados 284 644 15 080 High 17 19 — 6.7Belarus 9 356 678 6 730 Middle 894 1 282 — 13.7Belgium 11 104 476 46 290 High 724 746 — 6.7Belize 331 900 4 510 Middle 73 81 — 24.4Benin 10 323 474 790 Low 708f 2 855 2 398 – 3 312 27.7Bhutan 753 947 2 330 Middle 59 114 98 – 130 15.1Bolivia (Plurinational State of) 10 671 200 2 550 Middle 2 400 2 476 2 190 – 2 763 23.2Bosnia and Herzegovina 3 829 307 4 780 Middle 334 676 607 – 745 17.7Botswana 2 021 144 7 770 Middle 399 477 412 – 542 23.6Brazil 200 361 925 11 690 Middle 41 059 46 935 — 23.4Bulgaria 7 222 943 7 360 Middle 601 601 — 8.3Burkina Faso 16 934 839 670 Low 1 461 5 072 4 064 – 6 080 30.0Cabo Verde 498 897 3 620 Middle 41 130 113 – 147 26.1Cambodia 15 135 169 950 Low 1 950 2 635 2 150 – 3 120 17.4Cameroon 22 253 959 1 290 Middle 1 063 6 136 5 035 – 7 236 27.6Canada 35 181 704 52 200 High 2 077f 2 114 — 6.0Central African Republic 4 616 417 320 Low 58 1 495 1 169 – 1 821 32.4Chad 12 825 314 1 020 Low 1 527 3 089 2 420 – 3 758 24.1Chile 17 619 708 15 230 High 2 108 2 179 — 12.4China 1 385 566 537 6 560 Middle 62 945 261 367 — 18.8Colombia 48 321 405 7 590 Middle 6 038 8 107 — 16.8Congo 4 447 632 2 590 Middle 206 1 174 976 – 1 373 26.4Cook Islands 20 629 — Middle 5 5 — 24.2Costa Rica 4 872 166 9 550 Middle 625 676 — 13.9Côte d’Ivoire 20 316 086 1 450 Middle 844 4 924 4 043 – 5 805 24.2Croatia 4 289 714 13 430 High 368 395 — 9.2Cuba 11 265 629 5 890 Middle 891f 840 — 7.5Cyprus 1 141 166 25 210 High 44 59 — 5.2Czech Republic 10 702 197 18 950 High 654 654 — 6.1Democratic Republic of the Congo 67 513 677 430 Low 498 22 419 17 966 – 26 872 33.2
Denmark 5 619 096 61 680 High 191 196 — 3.5Djibouti 872 932 1 030f Middle 1 030 216 185 – 247 24.7Dominica 72 003 6 930 Middle 11 11 — 15.3Dominican Republic 10 403 761 5 770 Middle 2 810f 3 052 — 29.3
Snapshot of the Global status report on road safety annex on the numbers and rates of road traffic deaths
FACT SHEET #5 Road safety Data: FAQ – page 2
TABLE A2ROAD TRAFFIC DEATHS AND PROPORTION OF ROAD USERS BY COUNTRY/AREA
Country/area General Information Road traffic deathsPopulation
numbersa for 2013
GNI per capitab for 2013 in US
dollars
Income levelc Reported number of road traffic
deathsd
Modelled number of road traffic deathse
Estimated road traffic death rate per 100 000 populatione
Point estimate
95% Confidence
IntervalAfghanistan 30 551 674 690 Low 1 808 4 734 4 006 – 5 461 15.5Albania 3 173 271 4 710 Middle 295 478 435 – 521 15.1Algeria 39 208 194 5 330 Middle 4 540 9 337 7 985 – 10 689 23.8Andorra 79 218 43 110 High 2 6 — 7.6Angola 21 471 618 5 170 Middle 5 591 5 769 4 626 – 6 912 26.9Antigua and Barbuda 89 985 13 050 High 6 6 — 6.7Argentina 41 446 246 6 290f Middle 5 209 5 619 — 13.6Armenia 2 976 566 3 800 Middle 316 546 503 – 588 18.3Australia 23 342 553 65 390 High 1 192 1 252 — 5.4Austria 8 495 145 50 430 High 455 455 — 5.4Azerbaijan 9 413 420 7 350 Middle 1 256f 943 — 10.0Bahamas 377 374 21 570 High 50 52 — 13.8Bahrain 1 332 171 19 700 High 83 107 — 8.0Bangladesh 156 594 962 1 010 Low 3 296f 21 316 17 349 – 25 283 13.6Barbados 284 644 15 080 High 17 19 — 6.7Belarus 9 356 678 6 730 Middle 894 1 282 — 13.7Belgium 11 104 476 46 290 High 724 746 — 6.7Belize 331 900 4 510 Middle 73 81 — 24.4Benin 10 323 474 790 Low 708f 2 855 2 398 – 3 312 27.7Bhutan 753 947 2 330 Middle 59 114 98 – 130 15.1Bolivia (Plurinational State of) 10 671 200 2 550 Middle 2 400 2 476 2 190 – 2 763 23.2Bosnia and Herzegovina 3 829 307 4 780 Middle 334 676 607 – 745 17.7Botswana 2 021 144 7 770 Middle 399 477 412 – 542 23.6Brazil 200 361 925 11 690 Middle 41 059 46 935 — 23.4Bulgaria 7 222 943 7 360 Middle 601 601 — 8.3Burkina Faso 16 934 839 670 Low 1 461 5 072 4 064 – 6 080 30.0Cabo Verde 498 897 3 620 Middle 41 130 113 – 147 26.1Cambodia 15 135 169 950 Low 1 950 2 635 2 150 – 3 120 17.4Cameroon 22 253 959 1 290 Middle 1 063 6 136 5 035 – 7 236 27.6Canada 35 181 704 52 200 High 2 077f 2 114 — 6.0Central African Republic 4 616 417 320 Low 58 1 495 1 169 – 1 821 32.4Chad 12 825 314 1 020 Low 1 527 3 089 2 420 – 3 758 24.1Chile 17 619 708 15 230 High 2 108 2 179 — 12.4China 1 385 566 537 6 560 Middle 62 945 261 367 — 18.8Colombia 48 321 405 7 590 Middle 6 038 8 107 — 16.8Congo 4 447 632 2 590 Middle 206 1 174 976 – 1 373 26.4Cook Islands 20 629 — Middle 5 5 — 24.2Costa Rica 4 872 166 9 550 Middle 625 676 — 13.9Côte d’Ivoire 20 316 086 1 450 Middle 844 4 924 4 043 – 5 805 24.2Croatia 4 289 714 13 430 High 368 395 — 9.2Cuba 11 265 629 5 890 Middle 891f 840 — 7.5Cyprus 1 141 166 25 210 High 44 59 — 5.2Czech Republic 10 702 197 18 950 High 654 654 — 6.1Democratic Republic of the Congo 67 513 677 430 Low 498 22 419 17 966 – 26 872 33.2
Denmark 5 619 096 61 680 High 191 196 — 3.5Djibouti 872 932 1 030f Middle 1 030 216 185 – 247 24.7Dominica 72 003 6 930 Middle 11 11 — 15.3Dominican Republic 10 403 761 5 770 Middle 2 810f 3 052 — 29.3
6. What’sthedifferencebetweenthecalculationsofroadtrafficdeathsofsomecountriesandWHO’sestimates?
Many countries do not have accurate information on road traffic deaths. In some, only deaths in urban areas are registered, as there are no reliable data from rural areas. In others, data may be gathered throughout the country, but not every death is recorded. Additionally, definitions are not standardized. For example, in some countries, road traffic deaths include only deaths at the scene of a crash, while in others they include anyone who dies within a year following a crash. WHO always uses the best country data available, but, if these data are unavailable or incomplete, WHO must make estimates. The estimates are based on the situation in comparable countries and include consideration of other known factors that affect the number of road traffic deaths.
7. Whydoesn’ttheGSRRShavemorerecentinformation?
Although in most countries data on fatalities are available annually, collecting and checking them, calculating estimates and having them approved by the government can take about 1 year. After WHO has collected the data, they must be analysed. Because of this lengthy process, WHO produces a report every 2–3 years. This interval allows the inclusion of other indicators (e.g. road safety laws) that may not change very rapidly.
8. WherecanIfindregionaldata?
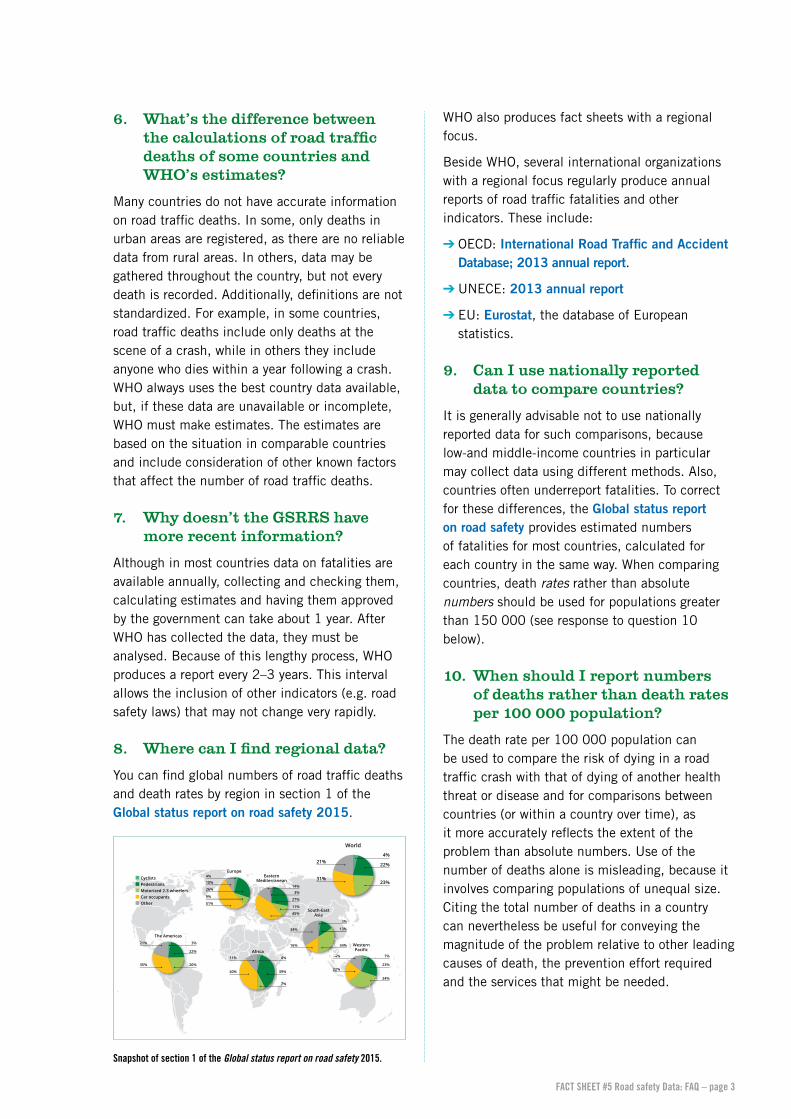
You can find global numbers of road traffic deaths and death rates by region in section 1 of the Global status report on road safety 2015.
WHO also produces fact sheets with a regional focus.
Beside WHO, several international organizations with a regional focus regularly produce annual reports of road traffic fatalities and other indicators. These include:
➔OECD: International Road Traffic and Accident Database; 2013 annual report.
➔UNECE: 2013 annual report
➔EU: Eurostat, the database of European statistics.
9. CanIusenationallyreporteddatatocomparecountries?
It is generally advisable not to use nationally reported data for such comparisons, because low-and middle-income countries in particular may collect data using different methods. Also, countries often underreport fatalities. To correct for these differences, the Global status report on road safety provides estimated numbers of fatalities for most countries, calculated for each country in the same way. When comparing countries, death rates rather than absolute numbers should be used for populations greater than 150 000 (see response to question 10 below).
10. WhenshouldIreportnumbersofdeathsratherthandeathratesper100000population?
The death rate per 100 000 population can be used to compare the risk of dying in a road traffic crash with that of dying of another health threat or disease and for comparisons between countries (or within a country over time), as it more accurately reflects the extent of the problem than absolute numbers. Use of the number of deaths alone is misleading, because it involves comparing populations of unequal size. Citing the total number of deaths in a country can nevertheless be useful for conveying the magnitude of the problem relative to other leading causes of death, the prevention effort required and the services that might be needed.
Western
23%
7%
34%
14%
22%
14%44%
South-EastAsia
13%
3%
34%
34%
16%
Africa
39%
7%
40%
11%
Eastern Mediterranean
Europe
10%
51%
4%
26%
9%
The Americas3%
20%
21%
35%
22%
4%
Cyclists Pedestrians Motorized 2-3 wheelers Car occupants Other
World
22%
4%
23%
21%
31%
3%
45%
14%
27%
11%
Snapshot of section 1 of the Global status report on road safety 2015.
FACT SHEET #5 Road safety Data: FAQ – page 3
11. WherecanIfindthenumberofdeathspernumberofvehicles?
The statistical annex of the WHO Global status report on road safety 2015 provides the number of registered vehicles in countries. WHO does not publish deaths per number of vehicles, as this is not a public health indicator. Other organizations, such as OECD and the International Road Federation, provide data on additional road safety indicators. For example, the annual reports of the International Road Traffic and Accident Database (IRTAD) includes fatalities per billion vehicle–kilometres (or fatalities per billon person–kilometres, taking vehicle occupancy into account) and fatalities per 10 000 registered (motorized) vehicles.
12. Howmanypeopledieannuallyinroadtrafficcrashes?
According to the Global status report on road safety 2015, there were 1.24 million deaths on the world’s roads in 2010. This figure has not changed significantly since the 2009 report, despite a 15% global increase in the number of registered motorized vehicles. This suggests that improved road safety may have helped to prevent deaths.
13. Domorevehiclesmeanmoreroadtrafficdeaths?
Not always. It’s true that when low- and middle-income countries motorize quickly, a lag in the introduction of safety measures and gaps in the safe system approach can result in more road traffic deaths, including deaths of pedestrians and other vulnerable road users. However, when countries invest adequately in road safety, the number of deaths can plateau or decrease, despite an increasing number of vehicles.
14. WherecanIfindmapsonroadsafetyissues?
For maps, graphics and other material, see the road safety resources fact sheet.
15. WhyshouldIusedatainmystory?
Using data and statistics will help your audience understand the magnitude of the problem and the urgency of the actions needed. Whether you compare the death rate of your country with that of a neighbouring country or indicate the number of crashes that occurred during a given period on a given road, use of accurate data from official sources will allow you and your audience to do analyses and draw more informed conclusions. 16. Howcanroadsafetystatistics
enhancethehumansideofmystory?
Using verified data does not detract from the human side of road traffic stories. On the contrary, use of data and statistics when narrating devastating personal stories will help your audience to better contextualize the road safety issues involved and understand that crashes are not isolated events but rather the result of gaps in safety that must be addressed urgently.
17. Howdothenumbersofdeathsduetoroadtrafficcrashescomparewiththosefromvariousdiseases?
Road traffic crashes are estimated to be the ninth leading cause of death globally, on a par with diseases such as malaria and tuberculosis and with a higher global death toll than HIV/AIDS. They are the number one cause of death for people aged 15–29 years. For comparisons with other diseases, the WHO Global Health Observatory data repository offers over 50 datasets on priority health topics, as well as the Observatory map gallery.
WHO gratefully acknowledges the financial contribution of Bloomberg Philanthropies to the production of this media brief.
FACT SHEET #5 Road safety Data: FAQ – page 4
Good sources and resources are critical to undertsanding and reporting on road safety. Facts and data can add depth and credibility to stories. The following list of resources includes reports, technical publications and the websites of road safety organizations. It is not a comprehensive list, but it might help reporters to find the right resources and sources for a variety of angles.
BYPUBLICATION
• Global status report on road safety (GSRRS), 2015 (WHO)• World report on road traffic injury prevention,
2004 (WHO) • World Health Statistics, 2014 (Global Health Observatory, WHO) • Annual report of the International Road
Traffic and Accident Database (IRTAD), 2013 (OECD)
• Annual report of the United Nation Economic Commission for Europe, 2013
• World road statistic report, 2014 (International Road Federation)
BYTOPIC
Cost of road crashes and road safety measures
• Cost–benefit analysis of road safety measures (SWOV)
• Crash costing (International Road Assessment Programme)
• Road crash cost (fact sheet, SWOV)• Road safety annual report (International
Road Traffic and Accident Database)
Data on fatalities and injuries due to road traffic crashes
➔Global data• Comparison of road traffic deaths
with those from others diseases (Global Health Observatory, WHO)
• Injury accidents per 100 million vehicle–km (International Road Federation)
• International Road Traffic and Accident Database (OECD)
• Methodology for data collection, Global status report on road safety, 2015 (WHO)
• Road traffic fatalities per 100 000 population (WHO)
• Road traffic fatalities per 10 000 vehicles (OECD)
• Statistical annexes, World report on road traffic injury prevention, 2004 (WHO)
• Underreporting (OECD)
➔Regional data• Mortality in Africa: The Share of Road Traffic
Fatalities (African Development Bank) • Eurostat, database of European statistics
(EU)• Inter-American Development Bank
➔National data• Country profiles (Global status report on road
safety, 2013, WHO)
FACT SHEET #6
ROADSAFETY:RESOURCES
FACT SHEET #6 Road safety: Resources – page 1
International organizations working in the field of road safety
• Amend• Bloomberg Philanthropies • Centers for Disease Control and Prevention:
motor vehicle safety• Embarq• European Federation of Road Traffic Victims• FIA Foundation • Global Alliance of Nongovernmental
Organizations for Road Safety • Global Road Safety Partnership• International Road Federation• Road Traffic Injuries Research Network• Safe Kids• SWOV Institute for Road Safety Research • Transport Research Board of the National
Academies, Transport Research International Documentation database
• United Nations Road Safety Collaboration • WHO • World Bank• YOURS: Youth for Road Safety
Maps, visuals and audiovisuals
• Infographics (WHO) • Global Health Observatory (WHO)• Online library of road safety mass media
campaigns (WHO)• Mr Pedestrian, poster series (WHO)• Death on the roads (WHO) • Road marks, poster series (WHO)• Too late, poster series (WHO)
Projects and initiatives
• Bloomberg Philanthropies global road safety programme in nine countries
• Decade of Action for Road Safety 2011–2020• Global plan for the Decade of Action for Road
Safety 2011–2020• Make roads safe: the campaign for global
road safety• More on: Brazil, Cambodia, China, India,
Kenya, Mexico, Russian Federation, Turkey, Viet Nam
• Third United Nations global road safety week: children and road safety (May 2015)
• World day of remembrance for road traffic victims (third Sunday of November)
FACT SHEET #6 Road safety: Resources – page 2
© P
anos
/ Fr
edri
k N
aum
ann
Related topics
• Alcohol • Environment and air quality• Spinal cord injuries• Youth
Road safety facts and good practice manuals
• 10 facts on global road safety (WHO)• Crash types (International Road
Assessment Programme) • Distracted driving (report, WHO)• Drinking and driving (manual, WHO and
partners)• Fact sheets on a wide range of road safety-
related topics (SWOV)• Helmets (manual, WHO and partners)• Road safety fact sheet (WHO)• Risk factors: fact sheets with main scientific
evidence on five key risk factors (WHO)• Risk factors: infographics (WHO)• Seat-belts and child restraints (manual, WHO and partners)• Seat belts, airbags and child protection devices
(fact sheet, Netherlands Institute for Road Safety Research, SWOV)
• Speed management (manual, WHO and partners)
• Strengthening road safety legislation (manual, WHO)
• The vision zero initiative (Sweden) • The safe system approach (OECD) • Use of the mobile phone while driving
(fact sheet, SWOV)• Visibility (fact sheet, WHO)
Road users
• Bycyclists (International Road Assessment Programme) and Bicycle helmets
(fact sheet, SWOV)• Children going to school (Amend, Africa) • Children safety (Safe Kids)• Child protection devices (fact sheet, SWOV)• Enforcement (toolkit, International Road
Assessment Programme)• Fact sheets on other road users, such as
seniors (fact sheets, SWOV)• First United Nations global road safety week:
youth and road safety (April 2007)
• Heavy vehicles (International Road Assessment Programme)
• Make walking safe (overview, WHO)• Motorbike users (International Road
Assessment Programme)• Online library of road safety mass media
campaigns (WHO)• Pedestrians (International Road
Assessment Programme)• Pedestrian safety (manual, WHO and partners)• Pedestrian safety (SWOV)• Public transport vehicles (International Road
Assessment Programme) • Second United Nations global road safety week:
pedestrian safety (May 2013)• Strengthening road safety legislation
(manual, WHO)• Third United Nations global road safety week:
children and road safety (May 2015)• Youth (fact sheet, WHO)• Youth and road safety (report, WHO)
Safer roads • International Road Federation • Mobility (SWOV)• Safer Roads (International Road
Assessment Programme) • Safer Roads (Global Road Safety Partnership)• Sustainable transport (Embarq)• Trauma care (WHO)
Safer vehicles
• Asean New Car Assessment Programme • Euro New Car Assessment Programme• Latin New Car Assessment Programme• Safer vehicles (Global New Car Assessment
Programme)• Safer vehicles and roads ( GSRRS 2015, WHO)• World road statistics report, 2014
(International Road Federation, see table of contents)
FACT SHEET #6 Road safety: Resources – page 3

WHO gratefully acknowledges the financial contribution of Bloomberg Philanthropies to the production of this media brief.
Related Documents